Chapter 1
INTRODUCTION
1.1 Raman Spectroscopy
1.2 Infrared Spectra
1.3 Selection Rules for Raman and IR Spectra
1.3.1 Selection rule for IR
1.3.2 Selection rule for Raman spectra
1.4 Group Frequencies
1.5 Normal Modes of Vibration
1.5.1 Internal and external vibrations
1.6 Solid State Effects
1.6.1 Site symmetry effects (static fieldsplitting)
1.6.2 Correlation field splitting
1.7 Hydrogen Bonding
1.8 Structural Features of Hydrated Crystals
1.9 Combinations and Overtones
1.10 Fermi Resonance
1.11 Theoretical Methods of Vibrational Analysis
1.11.1 Unit cell approach
1.11.2 Site group analysis
1.12 Polarization of Raman Lines
1.13 Effect of Temperature on Raman Spectra
1.14 Sulphates, Phosphates and Molybdates A Short Review
1.14.1 Sulphates
1.14.2 'Phosphates
1.14.2a PyrophosphateS
1.14.2b Cyclohexaphosphates
1.14.3 Molybdates
ReferencesFigures
L

2
Raman spectroscopy is concerned with vibrational and
rotational transitions and in this respect, it is similar to infrared
spectroscopy. Since the selection rules for the two are dif ferent,
the information obtained from Raman spectrum often complements that
obtained from an infrared study and provides valuable structural
information. To get a complete knowledge of the energy levels of a
system, a simultaneous study of both IR and Raman spectra is
required. Thus, infrared and Raman spectroscopy together serves as a
powerful tool for investigating the structure of molecules, nature of
hydrogen bonding and rotational and vibrational levels of molecules.
They are to be regarded as complementary rather than alternative
methods.
1.1 Raman Spectroscopy
When light passes through a transparent medium, a small
fraction of it is scattered by the molecules. This scattering is
composed of two parts namely, Rayleigh scattering and Raman
scattering. In Rayleigh scattering, light is elastically scattered in
all directions. Raman scattering is the weaker of the two effects.
The light is inelastically scattered and when examined with a
spectrometer, a series of emission lines are seen on either side of
the parent line. The strongest line which appears at the frequency of

3
the exciting monochromatic line is due to Rayleigh scattering. The
weaker lines seen symmetrically on either side of the Rayleigh line
are the Raman lines (Fig.l.l). The Raman lines on the low frequency
side are called Stokes lines and are of higher intensity compared to
that of the anti-Stokes lines, which are on the higher frequency side
of the Rayleigh line. The shift of these lines from Rayleigh line is
found to be corresponding to the frequencies of the molecular
vibratiens and independent of the exciting radiation. For, a
molecular vibration to be Raman active, there must be a change in the
polarizability of the molecule during this vibration. This change can
be considered as being a change in the shape of the electron cloud
surrounding the molecule. The theory of Raman scattering shows that
the amount of Raman scattering from a molecule is directly
proportional to the intensity of the incident light and also to the
fourth power of the frequency of the excitation radiation. In a
molecule without any symmetry elements, all the normal vibrations are
accompanied
frequencies
by polarizability
appear in the Raman
changes and
spectrum.
the
But in
corresponding
a symmetric
molecule, some of these vibrations may not produce any change in
polarizability and the corresponding normal frequencies are not
observed. Such vibrations are Raman inactive [1-17].
Raman spectrum gives information about molecular symmetry
which can then be used to determine the molecular configuration.

4
Studies of vibration-rotation Raman bands yield the value of the
rotation constant. Structural deductions based on symmetry properties
are. of particular importance in the study of compounds which exist in
several molecular forms or conformations, which are of closely
similar energies and cannot be separated. A good example is the study
of rotational isomers of a flexible molecule. The first experimental
evidence for the existence of such isomers has been from the Raman
studies of the alkali halides [18]. Thus, the Raman scattering method
of investigation afford an extraordinarily easy and convenient way of
mapping the vibration and rotation spectra of chemical compounds and
open up a wholly new field of the study of molecular structure.
The various chemical problems which have been successfully
solved with the help of Raman spectra are the composition and
structure of molecules, molecular interaction, the nature of the
chemical bonds constitution, tautomerism, isomerism, electrolytic
dissociation, association, polymerization, solvent effects exchange
interactions, hydrogen bonding, spectra-structure correlation,
kinetics of fast reduction etc. [1].
Both Rayleigh and Raman scattering
inefficient processes. Only about 10-3 of the
are relatively
intensity of the
incident exciting frequency will appear as Rayleigh scattering and
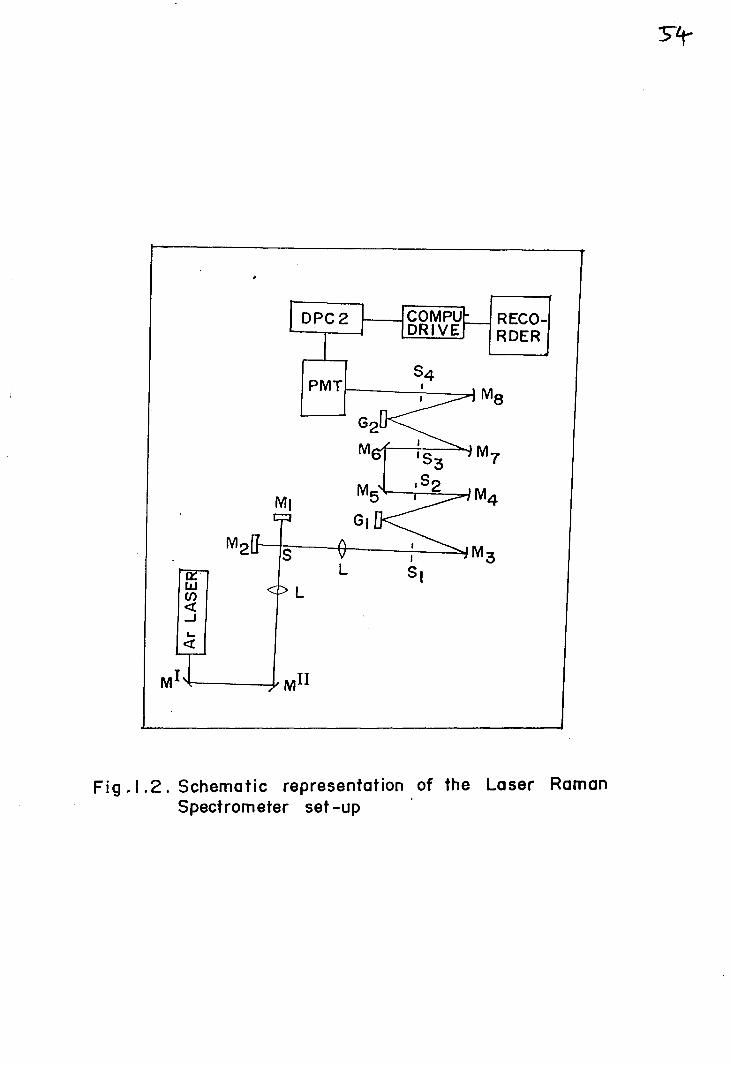
only 10-6 as Raman scattering. Hence, very intense sources are
required for Raman measurements. Laser beams provide the required

5
intensity and produce very good spectra even with very small amount
of samples. A schematic representation of a modern Laser
Spectrometer is given in Fig. 1.2.
1.2 Infrared Spectra
According to classical electrodynamics, a system
radiation by virtue of periodic changes in its electric dipole
moment, the frequency of the emitted radiation being the same as that
of the dipole oscillations. Absorption is the inverse of emission,
and the system is able to absorb radiation as it is able to emit. The
absorption or emission spectra originating from the vibrational and
rotational motion of a molecule which is not electronically excited
are mostly in the infrared region. A change in the dipole moment may
only be a change in the direction with respect to a coordinate system
fixed in space.
Infrared spectroscopy is generally concerned with the
absorption of radiation incident upon a sample. It finds widespread
applications to qualitative and quantitative analysis.
The infrared region encompasses radiation with wavenumbers
ranging from about 12800 to -110 cm , or wavelengths from 0.78 to
1000 ~m. For the sake of convenience, this region can be further
divided into three namely; near-IR, middle-IR and far-IR. Near IR
region covers 12800 to 4000 cm-1 (0.78 to 2.5 J.1m), middle IR region
-1 1covers 4000 to 200 cm (2.5-50 J.1m) and far-IR covers 200 to 10 cm-
(50 to 1000 J.1m).
6
For the absorption of infrared radiation, a molecule must
undergo a net change in its dipole moment as a result of its
vibrational or rotational motions .. According to the selection rules
of harmonic oscillator, any transition corresponding to A V = +1 in
vibrational levels is allowed. At room temperature, majority of the
molecules are at ground state. Therefore, under ordinary conditions,
only transitions from V = 0 to V = 1 in the electronic ground state
can be observed. However, the number of allowed transitions in a
polyatomic molecule will be greatly reduced due to the symmetry of
the molecule. The intensity of an infrared band is proportional to
the square of the rate of change of dipole moment with respect to the
displacement of the atom [4,6,19-30].
1.3 Selection Rules for Raman and IR Spectra
Selection rules for Raman scattering characteristics such as
intensity of band contours, directional properties and state of
polarization are different from those for IR spectroscopy. All the
transitions may not be active in both IR and Raman spectra. Some may
be active in IR while inactive in Raman or vice versa. Some of the
transitions may be inactive in both IR and Raman spectra. In a
molecule having a centre of symmetry, Raman active transitions are IR
inactive and IR active modes are inactive in Raman.
1.3.1 Selection rule for IR
According to quantum mechanics, the selection rules for the

7
infrared spectrum is determined by the integral
[/-1] I .. = 1$ I (Qa) fl$ .. (Qa) dQv v v v a
Here, J.l is the dipole moment in the electronic ground state. ¢ is
the vibrational eigen function and VI and v.. are the vibrational
quantum numbers before and after the transition respectively.
By resolving the dipole moment into three components in the
x, y and z directions, one gets
[11 ] I .. =! $ I (Qa) }l $ .. (Qa) dQa)'x v v v x v
[r ] I .. = r¢ I (Qa)}l ¢ .. (Qa) dQayvv v y v
If one of these integrals is different from zero, the normal
vibration associated with Qa is infrared active. If all the integrals
are zero, the vibration is infrared inactive [22].
1.3.2 Se1ection rule for Raman Spectra
The molecule interacts with electromagnetic radiation
through the oscillating molecular polarizability. The intensity, I,
L exij ijs
I =
of a scattered radiation, Vs is a function of the polarizability,
a ij' of the molecule
27
'lt5
I o
where Io is the intensity of the incident radiation and ex
ij is an
element of the molecular polarizability tensor ex [29] .
8
When a molecule is placed in an electric field E, the
induced dipole moment is given by
~ -.p = ex E
The electric polarizability <l being a function of all
normal vibrational coordinates, it can be expanded as a Taylor
series.
Here, higher powers are neglected. <l is the polarizabilityo
at the equilibrium configuration and ( 6 ex) is the derived6Qk 0
polarizability for the kth normal mode at the equilibrium position.
The transition moment associated with a transition between
the levels nand m is given by
where *n and *m are the independent wave functions. On substitution
of P
pnm
Because of the mutual orthogonality of the eigen functions,
the integral in the first term vanishes unless * = * , and when theyn m
are equal, it is unity. Thus, this term stands for Rayleigh

9
scattering for which there is no frequency change. The second term
accounts for the Raman scattering. The kth summand represents the
thcontribution of the k normal mode to Raman spectrum. Hence, it
follows that a particular normal vibration shall be permitted or
forbidden in the Raman effect depending on the factor (-.6..S!) in theSQk 0
second term of the above equation.
If (%Q:) 0 is different from zero during a certain vibration,
it will be active in the Raman spectrum. If (6 ex) = 0 for a(;Qk 0
particular vibration, it ,nil be forbidden in the Raman spectrum.
Also, it can be shown that for the integral of the second
term to be non-vanishing, the following conditions must be satisfied:
(1) For all modes except
identical, i.e., n = m.
the the two states should be
(2) thFor the k mode, the vibrational quantum number must change
only by unity [20].
1.4 Group Frequencies
Characteristic frequencies exhibited by a group of common
atoms in different molecules, regardless of the rest of the molecules
are called group frequencies. The concept of group frequency rests on
the assumption that the vibrations of a particular group are
relatively independent of those of the rest of the molecules. The
relative constancy of band positions of group frequencies depends on

10
the masses of the atoms, symmetry and force constants of bonds
between atoms and the interaction of vibrations. The internal factors
like change in atomic mass, vibrational coupling, resonance, crystal
field effects, hydrogen bonding, coordinations, bond angle strain
etc. can affect these frequencies appreciably. Also, they are
sensitive to external parameters, like temperature and physical state
(gas, liquid, solid, solution, solvent and concentration) of the
system. These group frequencies are very helpful in chemical
analysis. The changes of these frequencies from the standard values
give an insight into the internal structure of the molecules [19,22].
1.5 Normal Modes of Vibration
For any molecule containing N nuclei, three relations
between the 3N nuclear displacement coordinates are required to
account for the translational motion. For a non-linear molecule, i.e.
for one with non-vanishing moment of inertia about each of its three
principal axis, a further three relationships are required to account
for rotational motions. For a linear molecule, the line of the
nuclei is a principal axis and the moment of inertia of the molecule
with respect to it is zero. The rotation about this axis cannot
contribute anything to the kinetic energy and therefore, such
rotations can be excluded. It follows that the number of independent
coordinates for the description of the internal motions of the linear
molecule is now 3N-S, as compared to 3N-6 for a non-linear molecule.
Each of these (3N-S) or (3N-6) vibrations is called normal modes
[20] .

11
The normal vibrations or normal modes are independent,
self-repeating displacements of the atoms that preserve the centre
of mass. In a normal vibration all the atoms vibrate in phase and
with the same frequency. The motion of the atoms of a molecule in
different normal modes can be represented by a set of normal
coordinates.
The number of observed bands in the spectra may be less than
the number of normal modes, due to various reasons:
1. The symmetry of the molecule is such that no change in dipole
moment results from a particular vibration.
2. The energies of two vibrations may be identical or nearly
identical.
3. The intensity may be so low as to be detected by ordinary means.
4. The vibrational energy may be in a frequency range beyond the
range of the instrument.
The characteristic of a vibration changes as a result of the
coupling with another vibration. These couplings are influenced by
many factors:
1. Strong coupling between two stretching vibrations occurs only
when there is a common atom to the two vibrations.
2. Interaction between two bending vibrations requires a common bond
between the vibrating groups.
12
3. Coupling between stretching and bending vibrations is possible if
the stretching bond forms one side of the angle that varies in
the bending vibration.
4. If the individual groups have identical energy, the· interaction
will be large.
5. Little or no interaction is possible between groups which are
separated by two or more bonds.
6. Coupling occurs between vibrations of same symmetry species [6].
1.5.1 Internal and external vibrations
Normal modes are generally classified as internal modes and
external modes. Stretching and bending vibrations come under internal
modes, while translational and librational modes of the molecule come
under external modes. External modes appear in the low frequency
region. The stretching vibrations involve a continuous change in the
interatomic distances along the axis of the bond between two atoms
and bending vibrations, a change in the angle between two bonds.
Bending vibrations are of four types viz., scissoring, rocking,
wagging and twisting vibrations.
A crystal containing N unit cells and each unit cell
containing n. atoms can be treated as a system of Nn particles. On
solving the vibrational problem for such a system, one obtains 3n
frequencies as a function of the wave vector k = 2n/A ; k can take N

13
values. Of these, three frequencies tend to zero as k tends to zero
and form the acoustic branch and the rest belong to the optic branch.
Since the wavelength of the exciting radiation in Raman and infrared
spectra is large compared to that of phonons at the Brillouin zone
boundaries, the wave vector conservation allows only the phonons near
the centre of the Brillouin zone (k =0) to be observed in the first
order spectra. At the centre of the Brillouin zone, the vibration of
the corresponding atoms in all the unit cells will be in phase and it
is sufficient to consider only 3n-3 optic modes.
1.6 Solid State Effects
The molecules in crystalline solids have a relatively fixed
orientation with respect to the crystal axes. Due to this fixed
orientation, the spectra of a solid differ much from the gas-phase or
liquid-phase spectra:
1. Gas-phase fundamental vibration can be split into a number of
bands depending on the degeneracies of the vibrational modes.
2. There can be changes in the shape and intensity of the bands.
3. In the low frequency region, a number of new bands can appear due
to the translational and rotational motions. These are known as
external vibrations. This is a characteristic property of the
solid state spectra.
4. Due to anharmonic coupling between the external and internal
modes, combination bands can appear.

14
5. Hydrogen bonds may be formed in solids leading to large changes
in frequencies of fundamental vibrations.
6. The size, nature and orientation of the crystal can have an
important effect on the observed spectra. The single crystal
spectra provide more information than those of powdered samples.
7. The defects and disorders in crystal may give a large number of
additional frequencies.
8. Application of stress to a crystal can cause changes in the
spectra [6].
1.6.1 Site symmetry effects (static fie1d sp1itting)
In a crystal, all molecular groups occupy a site of lower
symmetry than the free ion symmetry. The point group for the site
will be a subgroup of the ionic point group. Then the surrounding
lattice in its equilibrium configuration will exert a field on the
molecule leading to static field splitting of fundamental modes. In a
site of lower symmetry, a vibration which is inactive for a free ion
may become acti,ve. Also, the nondegenerate internal vibrations can be
shifted in frequency and the degeneracies of the degenerate internal
vibrations can be lifted.
1.6.2 Corre1ation fie1d sp1itting
Correlation field splitting known also as Davydov or
dynamical field splitting is due to the interactions with internal
15
vibrations of other molecules in the unit cell. They are also known
as factor group splitting. Due to this effect, additional splitting
can occur in both degenerate and non-degenerate modes. If there are n
molecules in the unit cell, due to correlation field splitting, each
fundamental vibration can give n bands. However, all these n bands
may not be observed, because some of them may even be degenerate.
In most ionic compounds, site symmetry splitting seems to be
greater than the correlation field splitting. In covalent bonded
substances, the two have the same order of splitting. In strongly
hydrogen bonded systems, large correlation field splitting can be
observed due to strong interaction through hydrogen bonding between
internal modes [7].
1.7 Hydrogen Bonding
Hydrogen bonding is an important form of molecular
association. It can be intermolecular or intramolecular and in both
cases, there will be marked effects on group frequencies involved.
Hydrogen bond is much weaker than a covalent bond and their energies
are of the order of 3 to 5 Kcal per mole. Therefore, it can cause a
-1frequency shift of the order of 100 cm [19].
A hydrogen bond exists when a hydrogen atom H is bonded to
more atoms. The hydrogen bond is directed through a hydrogen atom,
and it has some characteristic angular properties. If the H atom is

16
formed between two atoms, X and Y, the two bonds of H to X and to Y
may have different strengths. The stronger bond is usually termed as
normal X-H bond. The strength of the weak bond H•.• Y is identical
with the dissociation energy of X-H .•• Y complex. H-bonds can be
either symmetrical or asymmetrical, depending on the symmetry of the
energy surface for the proton between X and Y. When an H-bond is
formed, a dimer is created. One of the translational degrees of
freedom of the monomer becomes the hydrogen bond stretching mode.
Similarly, the other modes are also affected.
R-OH + OR' -) R - OH ..• OR'
The ROH deformation mode becomes ~ (OH •••0) in the plane and ROH
torsion becomes out-of-plane ¥(O-H •.. O). Because of these
fundamental changes in the nature of the vibrations, their frequency
will also be changed. The range of vibrational frequencies is
correlated with the H-bond geometries such as 0 •..0 distance [R(OO)]
and the O-H distance [r(OH)]. The R(OO) value decreases from a
maximum value abouto 0
2.8 A to a minimum of about 2.4 A and r (OH)ci
increases from 1.0 to 1.2 A. The possible hydrogen vibrational
potentials for different H-bond strengths are given in fig.1.3 [31].
Vibrational analysis of different crystals at different
temperatures reveals that strength of hydrogen bonding increases at
low temperature, possibly due to the overall contrac·tion of the
crystal structure on cooling [32].

17
The atoms usually invovled in the formation of H-bond have
very high electronegativities. The higher the acidity of the X-H
group, the stronger will be X-H ....Y hydrogen bond. If Y atom has
higher electron donor ability, the hydrogen bond formed will be very
strong. Hydrogen bonds have a key role in the ferroelectric phase
transition in crystals [33,34).
The marked effects on the infrared and Raman spectra of
crystals due to hydrogen bonds are:
1. X-H stretching bands shift to lower wavenumbers. The amount of
shifting depends on the strength of hydrogen bonds formed.
Formation of hydrogen bonds weakens the force constant for this
mode.
2. X-H stretching bands gains intensity and becomes broader.
However, the corresponding overtones decrease slightly in
intensity.
3. X-H bending bands will be shfited to higher wavenumbers. This is
because, the force constants for this modes are increased as a
result of hydrogen bond formation.
4. New vibrational modes corresponding to X-Y stretching and
deformation, are observed at low frequencies.
In strongly hydrogen bonded sytems with xC:O) .OH grouping
(X P, As, S, Se and C), ABC triplets are observed in the region

2800-2400, -12350-1900 and 1720-1600 cm
18
The observation of these
bands indicates strong hydrogen bonding in the compounds. These bands
are formed due to the Fermi resonance of the OH stretching mode with
overtones of ~(OH) and Y(OH) modes [31-37].
1.8 Structural Features of Hydrated Crystals
There is considerable interest to understand the nature and
role of water of crystallisation in hydrated crystals. The
anion-~ater interaction involving hydrogen bonds affords stability to
the structure of these compounds. Crystallographic non-equivalence of
the water molecules may be successfully investigated by vibrational
spectroscopy. Stoichiometric hydrates may be either true hydrates or
pseudo hydrates. In true hydrates, water is present as recognizable
water molecules ego water of crystallisation. In pseudo hydrates -OH
or -H groups are present. Water of crystallisation are of two types:
(1) Water of coordination and (2) lattice water. Water of
coordination forms part of coordination sphere of a cation. Compared
with water of aqueous solution, the water molecule in crystalline
hydrates is considerably more constrained both by the rigidity of the
crystal structure and by the restriction imposed by crystallographic
-1symmetry. Lattice water absorbs at 3550-3200 cm (OH stretching
modes) and at 1630-1600 cm-1 (HOH bending mode). In the low frequency
region, librational modes due to the rotational oscillations of water
molecules, restricted by the interaction with neighbouring atoms

19
appear. They are observed in the 600-300 cm-1
region in the hydrates
of alkali and alkaline earth halides. Coordinated water is expected
to give rocking, wagging and metal-oxygen stretching modes. The
hydroxo group can be distinguished easily from the aqua group,
because the former lacks HOH bending modes near-11600 cm • The
metal-aqua complex [M(H 0) ]2+ occupies lattice positions2 6 as a
single molecular unit in many crystal hydrates and in many cases, is
regarded as a quasi-molecule [22,37,38].
1.9 Combinations and Overtones
Under harmonic oscillator approximation, only fundamentals
contribute to infrared and Raman bands. The deviations of the
potential function from the harmonic potential may result in
mechanical anharmonicity, while the higher order terms of the dipole
moment or polarizability leads to electrical anharmonicity. These
anharmonicities lead to the appearance of combinations or overtones
arising from simultaneous changes of state by two or more quanta of
vibrational energy. The overtones are far weaker than the
fundamentals and successive overtones are progressively still weaker.
Due to mechanical anharmonicity, overtones of active fundamentals and
combinations of at least one active fundamental may appear.
Electrical anharmonicity of the molecule can generate overtones·· and
combinations of inactive fundamentals [4,19]. The combination bands
are obtained as sum or difference of two fundamentals or as sum or

20
difference of an overtone and a fundamental frequency. These
combination bands and overtones are observed in both the infrared and
Raman spectra of molecules. However, the effect of anharmonicity is
found to be more in IR than in Raman. Combinations and overtone bands
sometimes gain intensity due to Fermi resonance.
1.10 Fermi Resonance
In certain molecules, it may be possible that an overtone
2 V2
(or combination of two vibrations) and a fundamental vibration
LJ1
may occur almost at the same frequency. The two vibrations
interact as explained in a quantum mechanical resonance and the
frequency of one (with higher energy) is raised while the frequency
of the other (with lower energy) is lowered. The wave functions
describing these levels correspond to a mixing of the wave functions
of the two vibrational excited states (.v1 and 2 b 2) that arise from
the harmonic oscillator approximation. Such a phenomenon was first
observed in CO2
by Fermi and known as Fermi resonance [39]. For the
Fermi resonance to occur, the two vibrations should be of the same
symmetry type. If there is resonance, energy sharing may also take
place. The combinations and overtones borrow energy from the
fundamentals and their intensity may become equal to that of the
fundamental$. In any case, it is no longer proper to speak of the one
level as being an overtone or combination level and the other a
fundamental level, for both the displaced levels will be partly of

21
the one kind and partly of the other. Since the Fermi resonance
interaction requires that the vibrations involved have nearly the
same frequency, the interaction will be affected if one mode
undergoes a frequency shift due to deuteration or solvent effect
while the other mode does not. Thus, the presence of Fermi resonance
in compounds can be tested by deuterating the sample or by taking the
spectrum in various solvents [4,19,29].
1.11 Theoretical Methods of Vibrational Analysis
Group theoretical methods for analysing molecular vibrations
are well-known. Hornig [40] has shown that the nature of vibrational
potential energy of a crystal can be expressed in the form:
E V + En
n nv i Vnk + Vl + Vln
nfkwhere the four terms represent the potential energies due to internal
vibrations, interactions between internal vibrations, lattice modes
and interactions between lattice modes and internal modes
respectively. The two commonly used methods for analysing the
vibrational spectra are the site group approximation (or site
symmetry approach) and factor group approximation (or the unit cell
approach). The site symmetry approach uses effectively the first term
of the potential energy expression whereas the unit cell approach
consider the first and second terms.
22
1.11.1 Unit ce11 approach
This method first developed by Bhagavantam and Venkatarayudu
[41], elaborated by Hornig [40] and again by Winston and Halford
[42], does recognize coupling between symmetry equivalent molecules
or complexes within a primitive unit cell, whereupon different
selection rules come into play. This method has over the years proven
very useful in the analysis of the vibrational spectra of the
crystals.
In Bhagavantam and Venkatarayudu method, a primitive cell of
a crystal is treated as if it were a single polyatomic molecule. For
a crystal consisting of N unit cells, each containing n atoms there
are 3nN modes of vibrations. Only those modes for which the
equivalent atoms are in phase are active as fundamentals in the
infrared and Raman spectra. The remaining modes may appear as
combinations. Thus, one has to determine only the modes of one unit
cell. This can be achieved by taking the factor group, which may be
taken as a subgroup of the space group. The distribution of the
vibrations among the irreducible representations of the factor group
can be determined by the method of Winston and Halford.
This method is quite difficult for large molecules, as one
has to identify the symmetry qperations to which each atom is
invariant and also the unit cell content. In most of the cases, these
information are not completely available.

23
1.11.2 Site group analysis
In site group analysis, developed by Halford [43], the atoms
and molecules, other than one considered are kept in their
equilibrium positions. The molecule under consideration is then
considered to vibrate in an environment of fixed symmetry given by
its site group. The site symmetry will always be lower than the
symmetry of the molecular point group. In general, site group will
be a subgroup of the molecular point group. Here the types of modes
which will lead to the infrared and Raman active modes must be
obtained, on the basis of the site groups. The method has been widely
used and found to be satisfying when weak to moderate intermolecular
forces prevail and when coupling between different vibrators in the
crystal is negligible. However, when this is not so, the site group
analysis generally breaks down [44].
The correlation method developed by Fateley et al. [46] is a
generalisation of both the methods. The irreducible representation
can be obtained by correlating the site symmetry species of
individual atoms in the crystal to its factor group species or by
correlating the molecular free ion symmetry to the factor group
symmetry of the crystal through the molecular site symmetry.
1.12 Polarization of Raman I~nes
Valuable information can be obtained by studying the
polarized components of a Raman line. If a polarized radiation

24
interacts with a molecule that has an isotropic polarizability
tensor, the oscillation induced in the molecule will be in the same
plane as the electric field. Again, in the case of .molecules with
isotropic polarizability a; , the scattered radiation will be
polarized, even though the incident light is non-polarized. However,
the polarizability tensor is usually anisotropic. Hence, the induced
dipole moment will not be coincident with the plane of the electric
field but 'vi11 tend to be oriented in the direction of greatest
po1arizabi1ity. The scattered light vibrates in the same plane as the
induced dipole. Even if the incident radiation is polarized, an
anisotropic polarizability tensor will give rise to scattered
radiation that is depolarized. A totally symmetric vibration mode
gives rise to a polarized scattered line and that a vibration with
lower symmetry is depolarized. This property can be used to confirm
whether or not a vibration has A1
symmetry [29].
The degree of depolarization f is defined as the ratio of
the intensity of the scattered light polarized perpendicular to the
XYplane (1..1. ) to that polarized parallel to this plane (II/ ).
f = I.lIn
Here z axis is taken in the direction of propagation of the incident
light, and the direction of observation is perpendicular to z axis.
The value of f depends on the isotropic part a' and anisotropic part
Y' of the polarizability.

25
For Raman scattering,
The corresponding total intensity (the sum of the intensities of the
2 2two plane polarized components) is proportional to 45(a') + 13(Y;') •
ex' may vanish even without y' vanishing. Therefore, the value of
/ may reach 6/7. When f = 6/7, the Raman line is said to be
depolarized. Any line for which ! < 6/7 is said to be polarized. In
particular, when ! = 0, the line is said to be completely polarized
[4] •
1.13 Effect of Temperature on Raman Spectra
The increase in temperature affects the width and intensity
of the Raman lines. Also, the frequency of the bands will be shifted.
When the temperature is increased, Raman lines shift
towards the exciting line. The low frequency or the lattice lines
show a proportionately greater shift than the high frequency lines or
line arising from the internal oscillation of the group of atoms.
For a line of frequency J.J, ):. is given by
x.=_(l) bLl
<..I ~t
}. is greater for low frequency lines than for the high frequency
ones.
).: - Value for any line varies with temperature, its value
increases rapidly at high temperature and approaches zero as absolute

26
zero is approached. X-value for different lines in the same crystal
are, in general, different. This value does not depend on the
symmetry class to which the vibration belongs. An increase in
temperature causes an increase in the width due to anharmonicity of
vibration. The width versus temperature curve runs parallel to the
frequency shift versus temperature curve. The width of the line is
roughly proportional to the square root of the temperature.
The peak intensity of the Stokes lines decreases as the
temperature increases, though an increase is to be expected by
Placzek's theory. The anti-Stokes lines increase in intensity with
increase in temperature, but not to the same extent as required by
Placzek's theory [47-48].
1.14 Sulphates, Phosphates and Molybdates- A Short Review
1.14.1 Sulphates
The doubly charged tetrahedral molecular anion S04 has been
the subject of study by many investigators. In the solid state alkali
metal sulphates, M2S0
4eM = K, Rb and Cs), it has been observed that
the symmetric stretching frequency decreases linearly with the
increasing cation radius [49]. Later Dean et ale [50] have confirmed
this observation from the Raman spectra of the sulphates M2
S04
eM = Li, Na, K, Rb, Cs). Berenblut et al. [51] have noted the effect
of water of crystallisation in CaSO4 and Ca2
SO4. 2H20. The
polarization behaviour of the Raman lines under different crystal
27
orientations of Cs2so
4has also been investigated [52]. Ishigame [53]
has studied the temperature dependence of the Raman spectra of K2S0 4
in the temperature range 300 K to 117 K. In the IR study of the
mixed crystal system of Na 2S0 4 and (NH4)2S04 [54], it is observed
that the transition point of the phase transition of sodium sulphate
decreases with increase in concentration of the ammonium ions. Carter
[55] has recorded the polarized Raman spectra of (NH4) 2S0 4 and has
discussed the results in comparison with those of the isomorphous
sulphates [49], External modes have been identified in the single
crystal Raman spectroscopic investigation of MS04
(M = Ba, Sr, Pb,
Ca) [56]. Baran has examined the nature of hydrogen bonding in KHS04
and KDS04
[57] and CsHS04
[58] and has explained the ABC structure of
the IR and Raman bands arising from the .u (OH) stretching vibration
on the basis of Fermi resonance, He has carried out a detailed
analysis of the polarized infrared and Raman spectra of these
crystals. The polarization features of the HSO; ion vibrations are
predicted, assuming that the longest S-OH bond vibrates independently
of the S04 group vibrations,
Ananthanarayanan [59] has recorded the Raman spectra of
K2M(S04)2,6H20 (M = Mg, Zn, Ni and Co), known as Tutton's salts and
has assigned six fundamental frequencies of metal aqua complex in
K2Co(S04)2,6H20. Brown and Ross [60] have carried out the infrared
spectral studies of 64 Tutton's· salts and have interpreted them on
the basis of the site group and factor group approximations. Campbell

28
et al." have found that MI cations has more influence than MIl cations
I IIin the infrared spectra of 18 Tutton's salts ~M (S04)2.6H20 [61].
Gupta et al. have correlated
T_II )sulphates viz., MtM (S042· 6H 20
the infrared bands of ten double
[ MI NH K MIl = Ni C F C= 4" , 0, e, u,
Zn and Mn) with the known s-o bond lengths in these salts [62].
Infrared and polarized Raman spectra of K2Mg(S04) 2' 6H
20 [63] and
(NH4)2Mg(S04)2.6H20 [64] are also reported and the different modes of
metal aqua complex are identified in these compounds. Mathew et al.
have identified strong hydrogen bonds in KMgC1S04
.3H2
0 [65] in a
polarized Raman study.
Infrared spectra of a number of double sulphates of ammonium
and rare-earth sulphates have been reported [65-68] and the existence
of different types of water molecules in these compounds are
established. Mathew et al. [69] have established from the vibrational--
crystallographically distinct water molecules exist in the unit cell.
Two erystallographically distinct sulphate ions are identified in
et al. [72] have investigated the infrared spectra of a number of
rare earth sulphates, containing potassium, KLn(S04)2(Ln = Pr, Nd,
Sm, Tb, Dy, Er, Tm and Yb). Baran et al. have reported the
vibrational spectra of another type of double sulphate,

29
Infrared and Raman spectra of M3H(S04)2 with M = Na, K and
NH4
(74] reveal the structural disorders in the crystals. Kamoun
et ale (75] have investigated the polarized Raman spectra of
(NH4 ) 3H(SO 4) 2 and (ND4) 3 D(SO 4) 2. and have found that the crystal
3-contains the non-centrosymmetric dimer (S04HS04) and strong
asymmetric O.-H •..o hydrogen bonds. A temperature dependent vibrational
reported. A detailed study of the polarized IR and Raman spectra of
Na3H(S04)2 has been reported by Videnova Adrabinska (78]. Kasahara
et al. (79] have observed an anomalous broadening of the 2)2 line
above Tc
in K3D(S04)2 and have explained it with the motional
narrowing theory developed in NMR. Kalevitch et al.(80] have given a
new interpretation to the IR and Raman spectra of RbHS04
and RbDS04
•
2-Distortion of SO 4 ion is examined from a vibrational spec~roscopic
investigation of Te(OH)6.K2S04 [81] and Te(OH)6.X2S04 (X = Tl, Na)
(82].
2Vanderpool et al. (83] have observed two types of S04 anions
in La2(S04)3.8H20 crystal from its Raman spectra. The role of two
types of lattice water molecules has been determined by the polarized
Raman investigations on Ce2(S04)3.9(H,D)20 single crystals (84].
Raman spectra of compounds LiMS04
with M = Rb, Cs, NH4
, N2H
5and Na
are also reported [85-91]. Infrared and polarized Raman spectra of
LiNH2
S03
have been investigated in the temperature range 300-90 K
(92], while Vijay Varma and Rao have investigated the phase

30
transitions in NZH
6so4 crystal [93]. Botto [94] has described the
vibrational and thermal analysis of an ordered mixed-oxo salt
(NH4)ZHZAs04S04. Liu et ale [95] have recorded the Raman spectrum of
CUS04
.5HZO at 90K and have assigned the internal modes of CU(HZO f:complex and differently bonded water molecules.
A high temperature phase transition is followed by the
temperature dependent IR and Raman spectra in CSZH3(S04)4.HZO [96].
Structural phase transitions and lattice vibrations in K4LiH3(SO 4) 4
and Rb4LiH3 (SO 4) 4 crystals [97] are also investigated by the Raman
scattering technique.
1.14.2 Phosphates
Phosphates are broadly classified into two groups namely
orthophosphates and condensed phosphates. Orthophosphates can exist
as tribasic, dibasic or monobasic forms. In tribasic orthophosphates,
there are independent P04
groups with Td
symmetry. In dibasic
orthophosphates, HPa~ ion is formed by attaching one hydrogen atom to
z-one of the oxygen atoms of the P0 4 tetrahedron. HP0 4 ion has a C3v
symmetry. In the monobasic form, two hydrogen atoms are attached to
the oxygen atoms of the P0 4 group to form HZP0 4 ion. It may have free
ion symmetries Cz or C [98].v s
Chapman et ale have investigated the infrared spectra of a
series of compounds containing Poi: HPO~- and H2PO~ and have
31
determind their vibrational modes [98,99]. Schultze et al. [100] have
confirmed these values. Petrov et al.[101] have studied the infrared
spectra of dicalcium phosphate, dicalcium phosphate dihydrate and
octacalcium phosphate and have investigated the nature of hydrogen2-
bonding in HP04
ions. Also, they have investigated the expected
regions of (P)O-H stretching, inplane and out-of-plane P-O-H bending
modes. Two dis tinct water molecules are identified in NaHP04
• 2H2
0
crystals by the vibrational analysis of the compound [102,103].
Casciani et a~.[104,105] have carried out a detailed vibrational
analysis of CaHP04
and CaHP04
.2H2
0 and have established the existe~ce
of two crystallographically distinct water molecules in CaHP04
• 2H2
0
[ 105] .
Single crystal Raman study of SnHP04
proposes a layer
structure for this compound and the intra-layer forces are found to
be stronger than interlayer forces [106]. The different modes of
orthophosphate ions are identified in PbHP04
[107]. Magane Aoki
et al. [l08] have recorded the Raman spectra of CsH2
P04
at various
temperatures and have suggested that the phase transition in the
crystal is of an order-disorder type. At the same time, Fillaux
et al. [109] have identified two types of hydrogen bonds in CsH2
P04
.
Stretching modes originating from the short and long hydrogen bonds
have also been identified from a study of CsH2
P04
and CsD2
P04
[110,111]. Raman spectra of paraelectric and antiferroelectric phases

32
room temperature and at 20 K of (NH4)2HP04 and (ND4)2 DP04 [113] have
also been investigated.
The vibrational investigation of Te(OH) 6· Cs 2HPO 4 crystals
[114] reveals that the H atom is loosely bonded to the oxygen atom of
the phosphate ion. Hence, phosphate ion exists as a distorted PO 42-
tetrahedron rather than a HP04
ion. The multiplicity of bands
observed in the Raman spectrum of KHS0 4 .KH2PO 4 crystal indicates a
distorted structure for the (P,S)04 groups [115,116]. Mathew et al.
have investigated the infrared and Raman spectra of the ion exchanger
a-Zr(HP04)2.H20 and its half and fully exchanged phases ZrKH(P0 4)2
and Zr(NH4P04)2H20 [117]. Two types of water molecules are identified
in the study of vibrational spectra of Y-TiCHP04)2.2H20 and its
deuterated analogue at room temperature and at 453 K [118].
Choi et al. [119] have observed the ABC triplets in the OR
stretching region, by the polarized Raman study of NaH2P04
at 300 K
and 10 K. Also, they have not observed any phase transition down to
10 K in the crystal.
Infrared spectra of three simple organic phosphates viz.,
trimethyl phosphate, triethyl phosphate and triphenyl phosphate have
been recorded in both liquid and solid samples by Mortimer [120].
Rotational isomerism in them is discussed. Keijiro Taga et al. [121]
have reported the vibrational spectra and normal coordinate analysis
of barium dimethyl, diethyl and ethylmethyl phosphates. Normal

33
coordinate analysis indicates that the phosphate back bone, CO-P02
-OC
takes part in the gauche-gauche conformation in the solid state.
Infrared spectra of three rare earth dimethyl phosphate have also
been reported [122]. In a study of the polarized Raman spectra of
crystals, different ethylenediammonium groups in
them are identified [123,124]. Infrared and Raman spectra of alanine
and glycine phosphates are also reported [125,126].
Tarte et al. [127] have investigated the IR and Raman
spectra of Nasicon type MIM~V(P04)3 phosphates (MI= Li, Na, K, Rb,
IVCs and Tl and M = Ge, Sn, Ti, Zr, Hg). They have observed that the
3- IP0
4stretching frequencies are modified by the nature of both M and
MIV cations. Husson et al. have investigated the vibrational spectra
of a few antimony phosphates [128,129]. The number of bridging and
unshared oxygen a toms in the PO 4 groups are related to the highes t
1) p-o stretching frequencies in the spectra. The vibrationalas
spectra of [NiCH20) 4 ][VOPO4] 2 have been reported by Baran and Lii
[ 130] • Jayakumar et al. [131] have identified two
crystallographically distinct
crystals by a study of the infrared and polarized Raman spectra of
the compound. They have also observed that NHt ions rotate freely in
the crys tal.
IR and Raman
show that both[132],
studies on M(Mo02
)(P04
)2 with M = Pb and Ba
3-PO 4 and MoO6 groups are distorted in both
compounds. Bismayer and Romer [133] have investigated the hard mode

34
Raman spectroscopy and renormalisation phenomenon in diluted lead
phosphate (Pb1_
xMx )/P04 )Z. They have explained the renormalisation
phenomena as a consequence of order parameter coupling with direct
induced conjugated fields. IR and ,Raman spectra of NaCdInZ(P04 )3 and
NaCaCdMgZ(P04)3 are also reported along with their X-ray structural
data [134,135].
Raman spectra of five hypophosphite compounds La(HZP04 )3'
pr(HZP04)3' La(HZP04 )3· HZO, Mg(HZP04)Z.6HZO and VO(HZP04 )Z.HZO [136]
show that the unit cell group coupling between hypophosphite anions
become quenched with increasing water of crystallization content in
the solid.
The phase transitions in MTiOP04
with M = K, Rb and Tl due
to temperature and pressure changes are investigated by Serhime
et ale [137]. In both KTP and RTP, low frequency lines corresponding
to the soft modes in TTP are observed but their softening does not
extrapolate to zero at T , in contrast to the case of TTP. IR andc
Raman spectra of Li3MZ(P04 )3(M = Sc, Fe) in the temperature range
77-670 K [138] reveal that the bands corresponding to the vibrations
of Li+ ion are quenched in the vicinity of a phase transition due to
the disorder of the Li+ ion. Shasikala et a1. [139] have made a
comparative vibrational spectroscopic study of ferroelectric TMP,
its deuterated analogue (DTAAD) and non-ferroelectric TADP. The
temperature variation of the Raman spectra suggests an order-disorder
model for the phase transition.

35
1.14.2a Pyrophosphates
Depending upon the nature and degree of condensation, . the
symmetry of the P04
tetrahedra changes from one compound to another.
The PZ07 group is considered as a result of the decrease in the
positional symmetry of the PO 4 tetrahedra during condensation and
this causes an additional splitting of P04
valence vibrations [140].
4-Studies on pyrophosphates have revealed that PZ07 ion exists as a
discrete unit consisting of two P04
tetrahedra sharing a common
oxygen atom [141]. Stegar et al. [14Z] have been the first to report
the IR and Raman spectra of pyrophosphates.
Hezel and Ross have shown that the pyrophosphate anion can
have six possible symmetries, viz., D3d
, D3h
, D3
, CZv
' Cs
and Czdepending on the linearity of the P-O-P bridge, free rotation of P0
3
group and the nature of the terminal bond length [143]. For a linear
P-O-P bridge, the symmetry can be D3
, D3d
or D3h
• When the bridge is
bent, the symmetry can be CZv
' Cs
and CZ
. For a bent P-O-P bridge
with staggered structure, the possible symmetry is C • When it is ins
an eclipsed configuration, the possible symmetry is CZv
• A study of
n-the Raman and FTIR spectra of X
Z0
7anion with X = P and Cr has been
carried out by Abbas and Davison [144].
From the Raman spectroscopic investigation of a -ZnlZ07, it
4-is established that PZ07 ion has an eclipsed configuration in the
compound [145]. On the basis of the Raman spectra of a-MgzPZ
07
and

36
4-~ -Mg2P207' Cornilsen and Condrate have predicted that the P20
7ion
has a linear bridge in f3-Mg2P207 and a bent bridge in a-Mg2
P20
74-
[146]. They have also observed that the P20
7anion has a bent P-O-P
bridge in a-Sr 2p207 , a-Ba 2P207
and a-Ca2P207 [147]. Raman and mid-IR
spectra of these compounds reveal that the Barium and the strontium
compounds are isostructural.
Infrared and Raman spectra of M3HP207
.H20 (M = Na, Cs;
n = 0, 1, 9) have been studied by Sarr and Diop. Brown's correlation
1J P-O-P - J.J P-O-P as a function of P-O-P bridge angle establishedas s
for neutral pyrophosphates has been extended by them to
hydrogenophosphate. A linear relationship between J P-O-P and P-O-P
angle is also established. Further, they have investigated the
vibrational spectra of K3HP2°7. 3H20 and K3HP207 [148]. Vibrational
spectra of a-CaNaP20
7.4H
20, CaNH
4NaP
20
7.3H
20 and CdNH
4NaP20
7.3H20 are
+also reported [149]. It is observed that NH
4ion is rotating freely
in the compounds. Vibrational spectra of Ni 3Pb(P207)2 and
P20;-anions are more distorted in
the cobalt compound. Non-coincidence of Raman and IR bands suggests a
centrosymmetric structure in both the compounds. Baran et al. [151]
have investigated the vibrational spectra of Fe2
P20
7and have shown
that the compound has a bent P-O-P bridge.
37
1.14.2b Cyclohexaphosphates
The cyclohexaphosphates' belonging to condensed phosphates,
are built up by six corner-sharing P04
tetrahedra. The basic
structural unit in these compounds are the P-O-P bridges and the POZ
terminal groups. The structured studies of different
6-cyclohexaphosphates reveal that P6018 anion in different compounds
possesses different internal symmetries. In CU2Li2P6018 and6-
(C2H5NH3)6P6018.4H20, P60 18 ring has no internal symmetry [152],
while P60~; ring anion has a 1 internal symmetry in M6P6018.6H20
(M = Cs, Rb) and in some telluric acid adducts [153,154]. Lazarevski
et al. have studied the thermal conversion of Cu, Co, Ni, Mn, Ba, Cd
and Ga cyclohexaphosphates using thermogravimetry, X-ray phase
analysis, paper chromatography and IR spectroscopy [155]. Only a few
investigations have been reported on the vibrational analysis of
cyclohexaphosphates. The IR and Raman spectra of Cs 6P6°18. 6H20 and
Rb6
P6°18. 6H2
0 are reported by Sunila Abraham et al. [156]. They have
6-observed that P6018 anion has a Ci symmetry and it is distorted
considerably. They have also investigated the infrared and Raman
spectra of Ag6P6018·H20, (NH4)6P6018.H20 and Ag3(NH4)3P6018oH20
[157] .
1.14.3 Molybdates
Molybdates are structurally interesting compounds, since
some of them form octahedral anionic groups. Normal molybdates of
38
type AMo04
and A2
Mo06
crystallize with different structures like
Scheelite, Wolframite, Spinel etc. The Scheelite type structure is
the common among AMo04
type compounds.
Many investigators have studied the vibrational spectra of
Mo04
with tetrahedral symmetries. But there is considerable
disagreement in the early assignments of V2
and ~4 modes. Busey and
Keller [158] have assigned 1)Z mode at a higher frequency than JJ 4
from their study of the Raman spectra of aqueous solutions and the IR
spectra of Nujol mulled samples of several molybdates. From the IR
spectral studies of molybdates having tetrahedral structures Clark
and Doyle [159] and Brown et al. [160] have also favoured the
assignment ilZ
> V4 for the ion. Kaneska et al. [161] have assigned
bands of the IR and polarized Raman spectra of a -MnMo04
. On the
basis of a normal coordinate analysis using valence force field,
lattice vibrations are explained mainly in terms of Mn-O stretching
force constants. By the calculation of the relative intensities of
Raman bands from approximate force fields using Long matrix method
based on Wollkenstein theory, Weinstock et al. [162] have shown that
in Raman spectrum the intensity of lJ1 >V 3 and that of .lJ2
>.u 4.
Muller et al. [163] have convincingly established from a study of
single crystals of molybdates that lJZ
has a higher intensity than
lJ4
in Raman spectrum while 1J4
has a higher intensity in the IR
spectrum.

39
Raman spectra of CaW04
, SrW04
, CaMo04
and SrMo04
are
investigated by Porto and Scott [164]. Infrared and Raman spectra of
gel grown NiMo04
show that this compound is isomorphous to CoMo04
[165]. Vibrational spectra of NaLa(Mo04
)2 and NaLa(Mo04
)2 with
0.5 mole %.3+
Nd doped crystals do not reveal any change in the
vibrational frequencies due to doping [166,167]. The infrared and
Raman spectra of GdTb(Mo04 )3 and Tb1.8EuO.2(Mo04)3 are also reported
[168,169]. Ratheesh et al. [170] have investigated the IR and Raman
spectra of NaNi2
0H(H20) (Mo0
4)2 and NaZn
20H(H
20)(Mo0
4)2 and their
2-partially deuterated analogues. Mo0
4ions are found to be more
distorted in the Ni compound than in the Zn compound. Hanuza et al.
[171.] have investigated the IR and Raman spectra of Ky(Mo04
) 2
crystals down to liquid helium temperatures. The polarized
spectroscopic studies of KDy (MoO4) 2 [ 172] indicate additional
intermolecular interaction due to pair coupling of the molybdate
tetrahedra. This effect, combined with the multilayer crystal
structure is found to restrict the vibrational degrees of freedom,
distributing the selection rules for vibrational transitions.
Recently, infrared and Raman spectra of a-Th(Mo04 )2 and a-Th(W04 )2
are analysed and new assignments are proposed for the internal modes
2- 2-of Mo0
4and W0
4ions [173]. Hanuza et al. have reported the polarized
IR and Raman spectra of scheelite crystals of NaBi(Mo04
)2 and
LiBi(Mo04
)2 [174]. Raman spectra of CsLiW04
and CsLiMo04
recorded at
different temperatures by Shefer et al. [175] reveal that the

40
internal motion of the ions do not play any role in the dynamics of
the phase transitions. The vibrational spectra of triple molybdates,
KMgSc(Mo0 4)3 and KMgLn(Mo0 4)3 with tetrahedral coordination to
molybdenum and octahedral coordination to the cation with high
oxidation states exhibiting super ionic properties have also been
studied [176].
Two phase transitions are observed in CaMo04 by the pressure
dependent Raman study [177]. Jayaraman et al. have carried out the
pressure induced Raman study of SrMo04! They have observed that
these Scheelite type crystals transform to monoclinic lattice near
13GPa [178]. Kourouklis et al. have observed two phase transitions in
Tb2(Mo04)3 crystals by a high pressure Raman study [179].
41
References
1. A. Anderson
"The Raman Effect", Vol. I & II, Marcel Dekker, Inc. New York
(971) .
2. S.K. Freeman
"Applications of Laser Raman Spectroscopy", John Wiley and Sons,
New York (974).
3. G. Herzberg
"Molecular Spectra and Molecular Structure - Infrared and Raman
Spectroscopy - Atomic Molecules", Van Nostrand, New York (1961).
4. N.B. Colthup, L.H. Daly and S.E. Wiberley
"Introduction to Infrared and Raman Spectroscopy", 2nd Edn.
Academic Press, London (1975).
5. G. Turrel
"Infrared and Raman Spectra of Crystals", Academic Press, London
(972).
6. D.A. Skoog
"Principles of Instrumental Analysis", 3rd Edn. Hoult-Saunders,
Japan (985).
7. P.M.A. Sherwood
"Vibrational Spectroscopy of Solids", University Press,
Cambridge (1972).
8. D.A. Lon~
"Raman Spectroscopy", Mc Graw-Hill, Great Britain (1977).
9. S.P. Parker
"Spectroscopy Source Book", Mc Graw-Hill, Newyork (987).
10. T.R. Gilson and P.J. Hendra
"Laser Raman Spectroscopy", Wiley Interscience, London (1970).
11. H.A. Szymansky
"Raman Spectroscopy - Theory and Practice", Plenum Press, New
York (967).
12. J.R. Durig
"Vibrational Spectra and Structure", Marcel Dekker Inc. New
York (1972).
42
13. R. Chang
"Basic· Principles of Spectroscopy:", Mc Graw-Hill, New York
(1971).
14. B.P. Straughan and S. Walker
"Spectroscopy", Vol. II, John Wiley and Sons, Inc. New York
(976).
15. J.A. Koningstein
"Introduction to the theory of Raman effect", D. Reidel
Publishing Co. Dordrecht-Holland.
16. J. Loader
"Basic Laser Spectroscopy", Heden & Son Ltd. (1970).
17. G.W. King
"Vibrational Spectra and Selection Rules - Spectroscopy and
Molecular Structure", Mc Mas ter University, Holt, Rinehart and
Winston Inc.
18. H.W.F. Kohlrausch
Raman Spektren, Hand - und Jahrbuch der Chemischen Physik",
Edwards Bros, Ann Arbor (1945).
19 • C•N•R. Rao
"Chemical Application of Infrared Spectroscopy", Academic Press,
New York (1963).
20. L.A. Woodward
"Introduction to the Theory of Molecular Vibrations and
Vibrational Spectroscopy", Clarendon Press, Oxford (1972).
21. G.H. Beaven, E.A. Johnson, H.A. Willis and R.G. Miller
"Molecular Spectroscopy Methods and Applications in
Chemistry", Heywood and Company Ltd. London (1961).
22. K. Nakamoto
"Infrared Spectra of Inorganic and Coordination Compounds",
Wiley-Interscience , New York, 2nd Edn. (1970).
23. F.A. Cotton
"Chemical Applications of Group Theory", Wiley-Interscience, New
York (963).

43
24. L.J. Bellamy
"The Infrared Spectra of Complex Molecules", Vo1.2, Advances in
Infrared Group Frequencies, Chapman and Hall, London (1980).
25. R.N. Jones and C. Sandorfy,
"Chemical Applications of Spectroscopy", Wiley-Interscience, New
York (1956).
26. E.G. Brame and I.G. Grasselli
"Infrared and Raman Spectroscopy", Marcel Dekker Inc. New York
(1976).
27. E.B. Wilson, J.C. Decius and P.C. Cross
"Molecular Vibrations", Mc Graw-Hill, New York (1955).
28. S.D. Ross
"Inorganic Infrared and Raman Spectra", Mc Graw-Hill, London
(1972).
29. R.S. Drago
"Physical Methods in Chemistry", W.B. Saunders Co. Philadelphia
(1977) •
30. Manseldavies
"Infrared Spectroscopy and Molecular Structure", Elsevier
Publishing Co. New York (1963).
31. J. Tomkinson
Spectrochim. Acta, 48A, 329 (1992).
32. I. A. Oxton, O. Knop and M. Falk
Can. J. Chem. 54, 892 (1976).
33. B.G. Degenneis
Solid State Commun. 1, 132 (1963).
34. P. Brout, K.A. Muller and H. Thomas
Solid State Commun. 4, 507 (1966).
35. S.N. Vinogradov and R.H. Linnel
"Hydrogen Bonding", Van Nostrand, New York (1971).
36. M. Falk
Spectrochim. Acta, 40A, 43 (1984).
37. J. Van der Elsken and D.W. Robinson
Spectrochim. Acta, 17, 1249 (1961).
38. S.S. Mitra
Solid State Phys. 13, 1 (1962).

44
39. E. Fermi
z. Physik, 71, 256 (1931).
40. D.F. Hornig
J. Chern. Phys. 16, 1063 (1948).
41- S. Bhagavantam and T. Venkatarayudu
Proc. Ind. Acad. Sci. 9A, 24 (1939).
42. H. Winston and R.S. Halford
J. Chern. Phys. 17, 607 (1949).
43. R.S. Halford
J. Chern. Phys. 14, 8 (1946).
44. L.J. Norrby
J. Cryst. Spectrosc. Res, 20, 595 (1990).
45. G. Burns and A.M. Glazer
"Space Groups for Solid State Scientists", Academic Press, New
York (1990).
46. W.G. Fate1ey, F.R. Dollish, N.T. Mc Devitt and F.F.Bent1ey
"Infrared and Raman Selection Rules for Molecules and Lattice
Vibrations - The Correlation Method", Wi1ey-Interscience, New
York (1972).
47. T.M.K. Nedugadi
Proc. Indian Acad. Sci. IIA, 86 (1940).
48. C. Shantakumar
Proc. Indian Acad. Sci. 31A, 348 (1950); 32A, 177 (1950).
49. S. Montero, R. Schmo1z and S. Haussuhi
J. Raman Spectrosc. 2, 101 (1974).
50 •. K.J. Dean and G.R. Wilkinson
J. Raman Spectrosc. 14, 130 (1983).
51. B.J. Berenb1ut, P. Dawson and G.R. Wilkinson
Spectrochim. Acta, 29A, 29 (1973).
52. P. Venkateswar1u and H.P. Broida
The Proc. of Indian Acad. Sci. LXXIV, Sect. A, 230 (1971).
53. M. Ishigame and S. Yamashita
Phys. Stat. Sol. (b) 116, 49 (1983).
54. F. EL. Kabbany
Phys. Stat. Sol. (a), 67, 729 (1981).

45
55. R.C. Carter
Spectrochim. Acta, 32A, 575 (1976).
56. P. Dawson, M.M. Hargreave and.G.R. Wilkinson
Spectrochim. Acta, 33A, 83 (1977).
57. J. Baran
J. Mol. Struct. 172, 1 (1988).
58. J. Baran
J. Mol. Struct. 162, 211 (1987).
59. V. Ananthanarayanan
Z. Physik. 163, 144 (1961).
60. R.G. Brown and S.D. Ross
Spectrochim. Acta, 26A, 945 (1970).
61. J. A. Campbell, D.P. Ryan and L.M. Simpson
Spectrochim. Acta, 26A, 2351 (1970).
62. S.P. Gupta, B. Singh and B.N. Khanna
J. Mol. Struct. 112, 41 (1984).
63. G. Sekar, V. Ramakrishnan and G. Aruldhas
J. Solid State Chern. 66, 235 (1987).
64. V.S. Jayakumar, G. Sekar, P. Rajagopal and G. Aruldhas
Phys. Stat. Sol. (a), 109, 635 (1988).
65. Xavier Mathew and V.D. Nayar
Spectrochim. Acta, 45A, 877 (1989).
66. V.M. Malhotra, H.A. Buckmaster and H.D. Bist
Can. J. Phys. 58, 1667 (1980).
67. B. Eriksson, L.O. larsson, L. Niinisto and D. Skoglund
lnorg. Chern. 13, 290 (1974).
68. V.S.II' Yasheki, A.I. Barabash, V.I. Volk, L.L. Nitseva,
M.l. Konarev, A.A. Kruglov and L.V.Lipis
Zh. Neorg. Chim., 14, 1197 (1969).
69. Xavier Mathew and V.D. Nayar
Spectrochim. Acta, 46A, 1291 (1990).
70. Xavier Mathew, G. Suresh, T. Pradeep and V.D. Nayar
J. Raman Spectrosc. 21, 279 (1990).
46
71. T. Pradeep, G. Suresh, V.P. Mahadevan Pillai and V.D. Nayar
J. Raman Spectrosc. 22, 287 (1991).
72. A.K. Vazllllov, P.A. \)egtyarev, A.N. Pokrovskii and V.V. Fomichev
Russ. J. Inorg. Chem. 25, 255 (1980).
73. E.J. Baran, I.L. Botto and A.C. Garcia
J. Mol. Struct. 143, 59 (1986).
74. M. Damak, M. Kamoun, A. Daoud, F. Romain, A. Lautie and A. Novak
J. Mol. Struct. 130, 245 (1985).
75. M. Kamoun, A. Lautie, F. Romain, M.H. Limage and A. Novak
Spectrochim. Acta, 44A, 471 (1988).
76. J.P. Srivastava, Asita Kulshreshta, W. Kullmann and H. Rauh
J. Phys. C. Solid State Phys. 21, 4669 (1988).
77. N. Fourati, M. Kamoun and A. Daoud
Phase Transit. 18, 87 (1989).
78. V. Videnova - Adrabinska
J. Mol. Struct. 237, 367 (1990).
79. M. Kasahara, Pho Kaung, and Y. Yagi
Ferroelectrics (UK), 152, 279 (1994).
80. N.I. Kalevitch, B. Arnscheidt, J. Pelzl and S.V. Rodin
J. Mol. Struct. 348, 361 (1995).
81.
82.
83.
K. Viswanathan, V.U. Nayar and G. Aruldhas
Infrared Phys. 26, 89 (1986).
G. Sekar, V. Ramakrishnan and G. Aruldhas
Infrared Phys. 27, 253 (1987).
R.A. Vanderpool, M.A. Khan and R. Frech
J. Mol. Struct. 245, 255 (1991).
84. A. Torres, F. Rull and J.A. De Saja
Spectrochim. Acta, 36A, 425 (1980).
85. V. Ramakrishnan, V.U. Nayar, G. Aruldhas
Infrared Phys. 25, 607 (1985).
86. G. Morell, ? Devanarayanan and R.S. Katiyar
J. Raman Spectrosc. 22, 529 (1991).
87. V. Lemos, P.A.P. Gomes, F.E.A. Melo, J.M. Filno and J.E. Moreira
J. Raman Spectrosc. 20, 155 (1989).

47
88. V. Lemos, R. Centoducatte, F.E.A. Melo, J.M. Filno, J.E. Moreira
and A.R.M. Martins
Phys. Rev. B, 37, 2262 (1988).
89. Scott H. Brown and Roger Frech
Spectrochim. Acta, 44A, 1, (1988).
90. A.R.M. Martins, F.A. Germano, J.M. Filno, F.E.A. Melo,
J.E. Moreira
Phys. Rev. B, 44, 6723 (1991).
91. G. Dharmasena and R. Frech
J. Chem. Phys. (USA), 102, 6941 (1995).
92. T. Muthu Subramaniyam, P.S. Santos and O. Sala
J. Mol. Struct. 112, 233 (1994).
93. Vijay Varma and C.N.R. Rao
J. Mol. Struct. 268, 1 (1992).
94. LL. Botto
Thermochim. Acta, 132, 279 (1988).
95. D. Liu and F.G. Ullman
J. Raman Spectrosc. 22, 525 (1991).
96. A.M. Fajdiga-Bulat, F. Romain, M.H. Limage and A. Lautie
J. Mol. Struct. 326, 93 (1994).
97. B. Mroz, M. Kaczmarski, H. Kiefte, M.J. Clouter
J. Phys. Condo Matter (UK), 4, 7515 (1992).
98. A.C. Chapman and L.E. Thirlwell
Spectrochim. Acta, 20, 937 (1964).
99. A.C. Chapman, D.A. Long and L.E. Ihirlwell
Spectrochim. Acta, 21, 633 (1965).
100. H. Schultze, N. Weinstock, A. Muler and G. Vandrish
Spectrochim. Acta, 29, 1705 (1973).
101. I. Petrov, B. Soptrajanov and Z. Fuson
Z. Anorg. Allg. Chern. 358, 178 (1967).
102. V. Ramakrishnan and G. Aruldhas
Curro Sci. 54, 627 (1985)
103. V. Ramakrishnan and G. Aruldhas
J. Raman Spectrosc. 18, 145 (1989).

104. F. Casciani and R.A. Condrate, Sr.
Spectrosc. Lett. 12, 699 (1979).
105. F. Casciani and R.A. Condrate, Sr.
J. Solid State Chern. 34, 385 (1980).
106. L.W. Schroeder, T.H. Jordan and W.E. Brown
Spectrochirn. Acta, 37A, 21 (1981).
107. B.B. Lavrencic and J. Petzelt
J. Chern. Phys. 67, 3890 (1977).
108. I~gane Aoki, M. Kasahara and I.T. Tatsuzaki
J. Raman Spectrosc. 15, 97 (1984).
109. F. Fillaux, B. Marchon and A. Novak
Chern. Phys. 86, 127 (1984).
110. V. Videnova-Adrabinska and J. Baran
J. Mol. Struct. 156, 1 (1987).
111. V. Videnova-Adrabinska, W. Wojciechowski and J. Baran
J. Mol. Struct. 156, 15 (1987).
112. M. I<asahara, M. Tokunaga and I. Tatsuzaki
J. Phys. Soc. Japan, 55, 367 (1986).
113. V. Videnova-Adrabinska and J. Baran
J. Mol. Struct. 175, 295 (1988).
114. K. Viswanathan, V.D. Nayar and G. Aruldhas
Infrared Phys. 26, 353 (1986).
115. K. Viswanathan, V. Rarnakrishnan, V.D. Nayar and G. Aruldhas
Indian J. Pure and Appl. Phys. 25, 185 (1987).
116. K. Viswanathan, V.D. Nayar and G. Aruldhas
Indian J. Pure and Appl. Phys. 24, 222 (1986).
117. Xavier Mathew and V.D. Nayar
Infrared Phys. 28, 189 (1988).
118. V.P. Titov, S.V. Yakubovskaya, N.A. Akulich and R. Ya
Mel'nikova.
Russ. J. Inorg. Chern. 32, 1711 (1987).
119. B.K. Choi, M.N. Lee and J.J. Kim
J. Raman Spectrosc. 20, 11 (1989).
120. F.S. Mortimer
Spectrochim. Acta 9, 270 (1957).
48

121. K. Taga, K. Miyagai, N. Ilirabayashi, T. Yoshida
and H. Okabayashi
J. Mol. Struct. 245, 1 (1991).
122. Guang-Fu Zeng, Xin Guo, Cui-Ying Wang, Shi-Quan Xi
J. Mol. Struct. 297, 87 (1993).
123. Daizy Philip and G. Aruldhas
J. Solid State Chem. 83, 198 (1989).
124. Daizy Philip and G. Aruldhas
J. Raman Spectrosc. 21, 211 (1990).
125. Daizy Philip and G. Aruldhas
Acta Chim. Hung. 127, 717 (1990).
126. I. Hubert Joe, Daizy Philip, G. Aruldhas and I.L. Botto
J. Raman Spectrosc. 22, 423 (1991).
127. P. Tarte, A. Rulmont and C. Merckaert-Ansay
Spectrochim. Acta, 42A, 100 (1986).
128. E. Husson, A. Lachgar and Y. Piffard
J. Solid State Chem. 74, 138 (1988).
129. E. Husson, F. Genet, A. Lachgar and Y. Piffard
J. Solid State Chem. 75, 305 (1988).
130. E.J. Baran, K.H. Lii and L.S. Wu
J. Mater. Sci. Lett. (UK), 14, 324 (1995).
131. V.S. Jayakumar, P. Rajagopal and G. Aruldhas
J. Raman Spectrosc. 22, 593 (1991).
132. Mary Isaac, V. Jayasree, G. Suresh and V.U. Nayar
Indian J. Phys. 66B, 65 (1992).
133. U. Bismayer and R.W. Rower
J. Mol. Struct. 349, 385 (1995).
134. D. Antenucci, G. Miehe, P. Tarte, W.W. Schmahl and
A.M. Fransolet
Eur. J. Mineral 5, 207 (1993).
135. D. Antenucci, A.M. Fransolet, G. Miehe and P. Tarte
Eur. J. Mineral, 7, 175 (1995).
49
136. P.A. Tanner, J. Sharnir, P. Starostin
J. Mol. Struct. 326, 267 (1994).
137. M. Serhirne, C. Dugutier, R. Fahri, P. Moch
Ferroelec. 124, 373 (1991).
138. V.V. Kravchenko, V.I. Michailov and S.E. Sigaryov
Solid State Ion. Diffus. React. 50, 19 (1992).
139. M.N. Shasikala, H.L. Bhatt and P.S. Narayanan
J. Phys. Chern. Solids (UK), 53, 621 (1992).
140. K. Byrappa, 1.1. Plyusnina and G.I. Dorokhova
J. Mater. Sci. 17, 1847 (1982).
141. B.D. Saxena
Trans. Faraday Soc. 57, 242 (1961).
142. E. Steger
Z. Anorg. Alig. Chern. 294, 146 (1958); 296, 405 (1958).
143. A. Hezel and S.D. Ross
Spectrochirn. Acta, 23A, 1583 (1967).
144. M.H. Abbas and G. Davidson
Spectrochirn. Acta, 50A, 1153 (1994).
145. G.T.Stranford, R.A.Condrate, Sr. and B.C.Cornilsen
J. Mol. Struct. 73, 231 (1981).
146. B.C. Cornilsen and R.A. Condrate Sr.
J. Phys. Chern. Solids 33, 1327 (1977).
147. B.C. Cornilsen and R.A. Condrate, Sr.
J. Solid State Chern. 23, 375 (1978).
148. O. Sarr and L. Diop
Spectrochirn. Acta, 40A, 1011 (1984); 43A, 999 (1987).
149. I. Hubert Joe, G. Aruldhas and G. Keresztury
J. Rarnan Spectrosc. 22, 537 (1991).
150. N. Santha, V.D. Nayar and G. Kereztury
Spectrochirn. Acta, 49A, 47 (1993).
151. E.J. Baran, I.L. Botto and A.G. Nord
J. Mol. Struct. 145, 161 (1986).
152. P.M. Laught and A. Durif
Acta Cryst. B30, 2118 (1974).
50

51
153. M.T. Averbuch-Pouchot and A. Durif
(a) Acta Cryst. C47, 1579 (1991);
(b) C.R. Acad. Sci. Paris, Sere 11, 1699 (1989);
(c) Acta Cryst. C46, 179 (1990).
154. A. Durif, M.T. Averbuch-Pouchot
Acta Cryst. C45, 1884 (1989).
155. E.V. Lazarevski, L.Y. Kobasova, N.N. Chudinova and I.V. Tananaev
Inorg. Mater. 16, 93 (980); 17, 327 (981); 18, 1322 (1982);
18, 1237 (1982).
156. Sunila Abraham and G. Aruldhas
J. Raman Spectrosc. 22, 245 (1991).
157. Sunila Abraham and G. Aruldhas
Indian J. Pure and Appl. Phys. 32, 254 (1994).
158. R.H. Busey and O.L. Keller Jr.
J. Chem. Phys. 41, 215 (1964).
159. G.M. Clark and W.P. Doyle
Spectrochim. Acta, 22, 1441 (1966).
160. R.G. Brown, J. Denning, A. Hallett and S.D. Ross
Spectrochim. Acta, 26A, 963 (1970).
161. 1. Kanesaka, H. Hashiba and 1. Matsuura
J. Raman Spectrosc. 19, 213 (1988).
162. N. Weinstock,H. Schulze and A. Muller
J. Chem. Phys. 59, 5063 (1973).
163. A. Muller, E.J. Baran and R.O. Carter
Struct. Bonding, 26, 81 (1976).
164. S.P.S. Porto and J.F. Scott
Phys. Rev. 157, 716 (1967).
165. S.S. Saleem and G. Aruldhas
Polyhedron, 1, 331 (1982).
166. V. Ramakrishnan and G. Aruldhas
Spectrochim. Acta, 4IA, 1301 (1985); 42A, 1341 (1986).
167. S.S. Saleem, G. Aruldhas and H.D. Bist
J. Solid State Chem. 48, 77 (1983).
168. S.s. Saleem, G. Aruldhas and H.D. Bist
Spectrochim. Acta, 40A, 149 (1984).
52
169. S.S. Saleem, G. Aruldhas and H.D. Bist
Infrared Phys. 23, 217 (1983).
170. R. Ratheesh, G. Suresh and V.U. Nayar
Pramana, J. Phys. 44, 461 (1995).
171. J.Hanuza, E.B.Burgina, G.A.Osipova and E.N.Yurchenko
J. Mol. Struct. 158, 141 (1987).
172. J. Hanuza and V.V. Fomitsev
J. Mol. Struct. 66, 1 (1980).
173. M.S. Augsburger and J.C. Pedregosa
J. Phys. Chem. Solids (UK), 56, 1081 (1995).
174. J. Hanuza, M. Maczka and J.B. van der Maas
J. Mol. Struct. 348, 449 (1995).
175. A.D. Shefer, V.F. Shabanov and V.N. Voronov
Fiz. Tverd. Tela (Leningrad) 27, 1487 (1985).
176. M.V. Mokhosoev, 1.1. Murzakhanova, N.M. Kozhevnikova and
V.V. Fomichev
Russ. J. Inorg. Chem. 36, 724 (1991).
177. D. Christofilos, G.A. Kourouklis and S. Ves
J. Phys. Chem. Solids (UK), 56, 1125 (1995).
178. A. Jayaraman, S.Y. Wang, S.R. Shieh, S.K. Sharma, L.C. Ming
J. Raman Spectrosc. 26, 451 (1995).
179. G.A. Kourouklis, S. Ves and D. Christofilos
High Press. Res. (Switzerland), 13, 127 (1994).

+ VI)
,?J .,.,,,-/6"'1 .... nTI Stoke~
(> ~J Ij\ -:.::-." , I' --I-
+'-' /
v~/ I iI
I~~
,
hv'Q
nvo h (Yo- ';,) h(Yo
\1/
hYI
,II
Ground state
Figure 1.1 Quantum representation of the energy interchangein the Raman effect.
V,\}'oJ
RECO-RDER
PMT54
I
MeI
M7
MI
M2 I MaJ
ILJ51
en«..J....«
MI MIl
Fig.1 .2. Schematic representation of the Laser RamanSpectrometer set -up

>
( a)
( c)
r
Fig .1.3, Diagrams of possible hydrogen vibrational potentialsin :(a) a weak H-bond;( b) a moderate H-bondand (c) a strong H- bond.
Recommended