Dm
SJa
b
c
d
e
G
a
ARRAA
KMRDIE
1
bowUfapt
1d
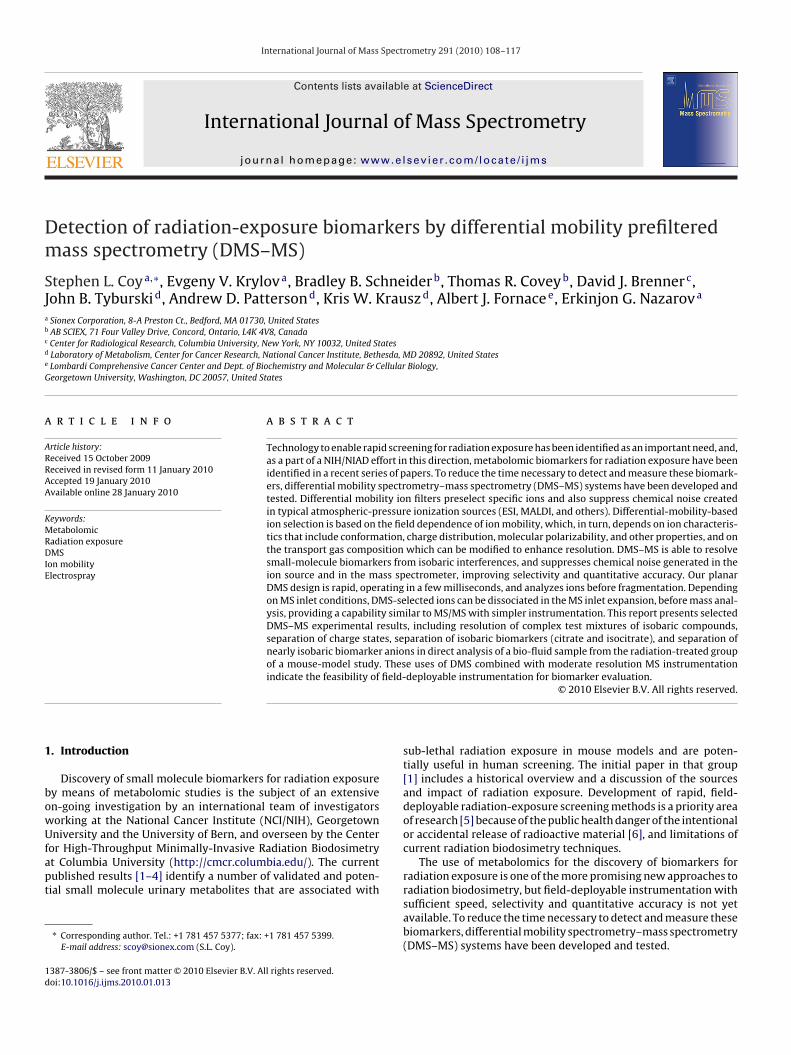
International Journal of Mass Spectrometry 291 (2010) 108–117
Contents lists available at ScienceDirect
International Journal of Mass Spectrometry
journa l homepage: www.e lsev ier .com/ locate / i jms
etection of radiation-exposure biomarkers by differential mobility prefilteredass spectrometry (DMS–MS)
tephen L. Coya,∗, Evgeny V. Krylova, Bradley B. Schneiderb, Thomas R. Coveyb, David J. Brennerc,ohn B. Tyburskid, Andrew D. Pattersond, Kris W. Krauszd, Albert J. Fornacee, Erkinjon G. Nazarova
Sionex Corporation, 8-A Preston Ct., Bedford, MA 01730, United StatesAB SCIEX, 71 Four Valley Drive, Concord, Ontario, L4K 4V8, CanadaCenter for Radiological Research, Columbia University, New York, NY 10032, United StatesLaboratory of Metabolism, Center for Cancer Research, National Cancer Institute, Bethesda, MD 20892, United StatesLombardi Comprehensive Cancer Center and Dept. of Biochemistry and Molecular & Cellular Biology,eorgetown University, Washington, DC 20057, United States
r t i c l e i n f o
rticle history:eceived 15 October 2009eceived in revised form 11 January 2010ccepted 19 January 2010vailable online 28 January 2010
eywords:etabolomic
adiation exposureMS
on mobilitylectrospray
a b s t r a c t
Technology to enable rapid screening for radiation exposure has been identified as an important need, and,as a part of a NIH/NIAD effort in this direction, metabolomic biomarkers for radiation exposure have beenidentified in a recent series of papers. To reduce the time necessary to detect and measure these biomark-ers, differential mobility spectrometry–mass spectrometry (DMS–MS) systems have been developed andtested. Differential mobility ion filters preselect specific ions and also suppress chemical noise createdin typical atmospheric-pressure ionization sources (ESI, MALDI, and others). Differential-mobility-basedion selection is based on the field dependence of ion mobility, which, in turn, depends on ion characteris-tics that include conformation, charge distribution, molecular polarizability, and other properties, and onthe transport gas composition which can be modified to enhance resolution. DMS–MS is able to resolvesmall-molecule biomarkers from isobaric interferences, and suppresses chemical noise generated in theion source and in the mass spectrometer, improving selectivity and quantitative accuracy. Our planarDMS design is rapid, operating in a few milliseconds, and analyzes ions before fragmentation. Dependingon MS inlet conditions, DMS-selected ions can be dissociated in the MS inlet expansion, before mass anal-
ysis, providing a capability similar to MS/MS with simpler instrumentation. This report presents selectedDMS–MS experimental results, including resolution of complex test mixtures of isobaric compounds,separation of charge states, separation of isobaric biomarkers (citrate and isocitrate), and separation ofnearly isobaric biomarker anions in direct analysis of a bio-fluid sample from the radiation-treated groupof a mouse-model study. These uses of DMS combined with moderate resolution MS instrumentationindicate the feasibility of field-deployable instrumentation for biomarker evaluation.. Introduction
Discovery of small molecule biomarkers for radiation exposurey means of metabolomic studies is the subject of an extensiven-going investigation by an international team of investigatorsorking at the National Cancer Institute (NCI/NIH), Georgetownniversity and the University of Bern, and overseen by the Center
or High-Throughput Minimally-Invasive Radiation Biodosimetryt Columbia University (http://cmcr.columbia.edu/). The currentublished results [1–4] identify a number of validated and poten-ial small molecule urinary metabolites that are associated with
∗ Corresponding author. Tel.: +1 781 457 5377; fax: +1 781 457 5399.E-mail address: [email protected] (S.L. Coy).
387-3806/$ – see front matter © 2010 Elsevier B.V. All rights reserved.oi:10.1016/j.ijms.2010.01.013
© 2010 Elsevier B.V. All rights reserved.
sub-lethal radiation exposure in mouse models and are poten-tially useful in human screening. The initial paper in that group[1] includes a historical overview and a discussion of the sourcesand impact of radiation exposure. Development of rapid, field-deployable radiation-exposure screening methods is a priority areaof research [5] because of the public health danger of the intentionalor accidental release of radioactive material [6], and limitations ofcurrent radiation biodosimetry techniques.
The use of metabolomics for the discovery of biomarkers forradiation exposure is one of the more promising new approaches to
radiation biodosimetry, but field-deployable instrumentation withsufficient speed, selectivity and quantitative accuracy is not yetavailable. To reduce the time necessary to detect and measure thesebiomarkers, differential mobility spectrometry–mass spectrometry(DMS–MS) systems have been developed and tested.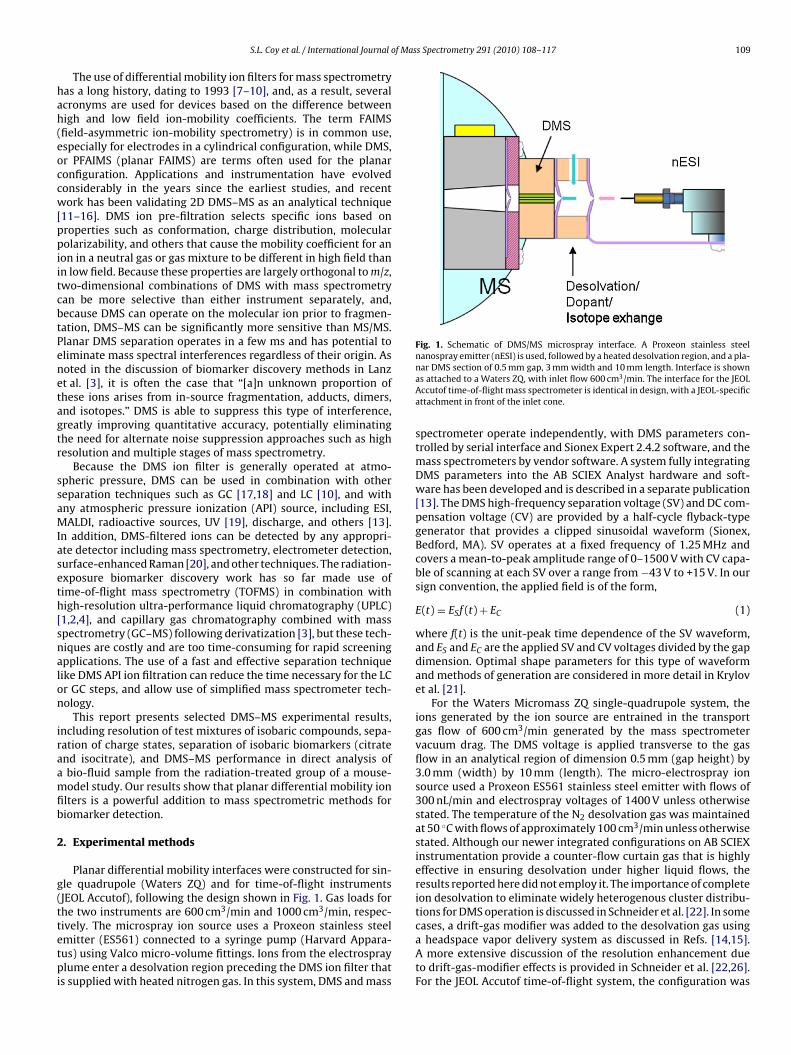
of Mass Spectrometry 291 (2010) 108–117 109
hah(eoccw[ppiitcbtPenetagtr
ssaMIaseth[snalon
iraamfib
2
g(ttetpi
Fig. 1. Schematic of DMS/MS microspray interface. A Proxeon stainless steelnanospray emitter (nESI) is used, followed by a heated desolvation region, and a pla-
S.L. Coy et al. / International Journal
The use of differential mobility ion filters for mass spectrometryas a long history, dating to 1993 [7–10], and, as a result, severalcronyms are used for devices based on the difference betweenigh and low field ion-mobility coefficients. The term FAIMSfield-asymmetric ion-mobility spectrometry) is in common use,specially for electrodes in a cylindrical configuration, while DMS,r PFAIMS (planar FAIMS) are terms often used for the planaronfiguration. Applications and instrumentation have evolvedonsiderably in the years since the earliest studies, and recentork has been validating 2D DMS–MS as an analytical technique
11–16]. DMS ion pre-filtration selects specific ions based onroperties such as conformation, charge distribution, molecularolarizability, and others that cause the mobility coefficient for an
on in a neutral gas or gas mixture to be different in high field thann low field. Because these properties are largely orthogonal to m/z,wo-dimensional combinations of DMS with mass spectrometryan be more selective than either instrument separately, and,ecause DMS can operate on the molecular ion prior to fragmen-ation, DMS–MS can be significantly more sensitive than MS/MS.lanar DMS separation operates in a few ms and has potential toliminate mass spectral interferences regardless of their origin. Asoted in the discussion of biomarker discovery methods in Lanzt al. [3], it is often the case that “[a]n unknown proportion ofhese ions arises from in-source fragmentation, adducts, dimers,nd isotopes.” DMS is able to suppress this type of interference,reatly improving quantitative accuracy, potentially eliminatinghe need for alternate noise suppression approaches such as highesolution and multiple stages of mass spectrometry.
Because the DMS ion filter is generally operated at atmo-pheric pressure, DMS can be used in combination with othereparation techniques such as GC [17,18] and LC [10], and withny atmospheric pressure ionization (API) source, including ESI,ALDI, radioactive sources, UV [19], discharge, and others [13].
n addition, DMS-filtered ions can be detected by any appropri-te detector including mass spectrometry, electrometer detection,urface-enhanced Raman [20], and other techniques. The radiation-xposure biomarker discovery work has so far made use ofime-of-flight mass spectrometry (TOFMS) in combination withigh-resolution ultra-performance liquid chromatography (UPLC)1,2,4], and capillary gas chromatography combined with masspectrometry (GC–MS) following derivatization [3], but these tech-iques are costly and are too time-consuming for rapid screeningpplications. The use of a fast and effective separation techniqueike DMS API ion filtration can reduce the time necessary for the LCr GC steps, and allow use of simplified mass spectrometer tech-ology.
This report presents selected DMS–MS experimental results,ncluding resolution of test mixtures of isobaric compounds, sepa-ation of charge states, separation of isobaric biomarkers (citratend isocitrate), and DMS–MS performance in direct analysis ofbio-fluid sample from the radiation-treated group of a mouse-odel study. Our results show that planar differential mobility ion
lters is a powerful addition to mass spectrometric methods foriomarker detection.
. Experimental methods
Planar differential mobility interfaces were constructed for sin-le quadrupole (Waters ZQ) and for time-of-flight instrumentsJEOL Accutof), following the design shown in Fig. 1. Gas loads forhe two instruments are 600 cm3/min and 1000 cm3/min, respec-
ively. The microspray ion source uses a Proxeon stainless steelmitter (ES561) connected to a syringe pump (Harvard Appara-us) using Valco micro-volume fittings. Ions from the electrospraylume enter a desolvation region preceding the DMS ion filter thats supplied with heated nitrogen gas. In this system, DMS and mass
nar DMS section of 0.5 mm gap, 3 mm width and 10 mm length. Interface is shownas attached to a Waters ZQ, with inlet flow 600 cm3/min. The interface for the JEOLAccutof time-of-flight mass spectrometer is identical in design, with a JEOL-specificattachment in front of the inlet cone.
spectrometer operate independently, with DMS parameters con-trolled by serial interface and Sionex Expert 2.4.2 software, and themass spectrometers by vendor software. A system fully integratingDMS parameters into the AB SCIEX Analyst hardware and soft-ware has been developed and is described in a separate publication[13]. The DMS high-frequency separation voltage (SV) and DC com-pensation voltage (CV) are provided by a half-cycle flyback-typegenerator that provides a clipped sinusoidal waveform (Sionex,Bedford, MA). SV operates at a fixed frequency of 1.25 MHz andcovers a mean-to-peak amplitude range of 0–1500 V with CV capa-ble of scanning at each SV over a range from −43 V to +15 V. In oursign convention, the applied field is of the form,
E(t) = ESf (t) + EC (1)
where f(t) is the unit-peak time dependence of the SV waveform,and ES and EC are the applied SV and CV voltages divided by the gapdimension. Optimal shape parameters for this type of waveformand methods of generation are considered in more detail in Krylovet al. [21].
For the Waters Micromass ZQ single-quadrupole system, theions generated by the ion source are entrained in the transportgas flow of 600 cm3/min generated by the mass spectrometervacuum drag. The DMS voltage is applied transverse to the gasflow in an analytical region of dimension 0.5 mm (gap height) by3.0 mm (width) by 10 mm (length). The micro-electrospray ionsource used a Proxeon ES561 stainless steel emitter with flows of300 nL/min and electrospray voltages of 1400 V unless otherwisestated. The temperature of the N2 desolvation gas was maintainedat 50 ◦C with flows of approximately 100 cm3/min unless otherwisestated. Although our newer integrated configurations on AB SCIEXinstrumentation provide a counter-flow curtain gas that is highlyeffective in ensuring desolvation under higher liquid flows, theresults reported here did not employ it. The importance of completeion desolvation to eliminate widely heterogenous cluster distribu-tions for DMS operation is discussed in Schneider et al. [22]. In some
cases, a drift-gas modifier was added to the desolvation gas usinga headspace vapor delivery system as discussed in Refs. [14,15].A more extensive discussion of the resolution enhancement dueto drift-gas-modifier effects is provided in Schneider et al. [22,26].For the JEOL Accutof time-of-flight system, the configuration was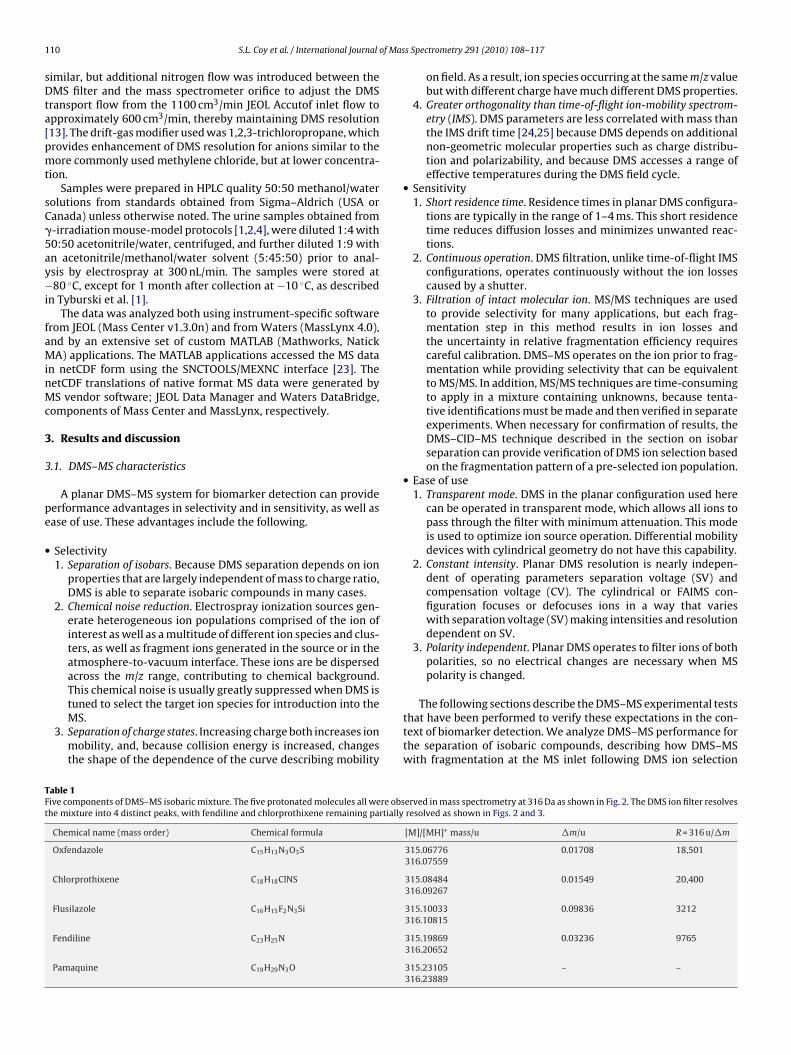
1 of Mas
sDta[pmt
sC�5ay−i
faMinMc
3
3
pe
•
TFt
10 S.L. Coy et al. / International Journal
imilar, but additional nitrogen flow was introduced between theMS filter and the mass spectrometer orifice to adjust the DMS
ransport flow from the 1100 cm3/min JEOL Accutof inlet flow topproximately 600 cm3/min, thereby maintaining DMS resolution13]. The drift-gas modifier used was 1,2,3-trichloropropane, whichrovides enhancement of DMS resolution for anions similar to theore commonly used methylene chloride, but at lower concentra-
ion.Samples were prepared in HPLC quality 50:50 methanol/water
olutions from standards obtained from Sigma–Aldrich (USA oranada) unless otherwise noted. The urine samples obtained from-irradiation mouse-model protocols [1,2,4], were diluted 1:4 with0:50 acetonitrile/water, centrifuged, and further diluted 1:9 withn acetonitrile/methanol/water solvent (5:45:50) prior to anal-sis by electrospray at 300 nL/min. The samples were stored at80 ◦C, except for 1 month after collection at −10 ◦C, as described
n Tyburski et al. [1].The data was analyzed both using instrument-specific software
rom JEOL (Mass Center v1.3.0n) and from Waters (MassLynx 4.0),nd by an extensive set of custom MATLAB (Mathworks, NatickA) applications. The MATLAB applications accessed the MS data
n netCDF form using the SNCTOOLS/MEXNC interface [23]. TheetCDF translations of native format MS data were generated byS vendor software; JEOL Data Manager and Waters DataBridge,
omponents of Mass Center and MassLynx, respectively.
. Results and discussion
.1. DMS–MS characteristics
A planar DMS–MS system for biomarker detection can provideerformance advantages in selectivity and in sensitivity, as well asase of use. These advantages include the following.
Selectivity1. Separation of isobars. Because DMS separation depends on ion
properties that are largely independent of mass to charge ratio,DMS is able to separate isobaric compounds in many cases.
2. Chemical noise reduction. Electrospray ionization sources gen-erate heterogeneous ion populations comprised of the ion ofinterest as well as a multitude of different ion species and clus-ters, as well as fragment ions generated in the source or in theatmosphere-to-vacuum interface. These ions are be dispersedacross the m/z range, contributing to chemical background.This chemical noise is usually greatly suppressed when DMS is
tuned to select the target ion species for introduction into theMS.3. Separation of charge states. Increasing charge both increases ionmobility, and, because collision energy is increased, changesthe shape of the dependence of the curve describing mobility
able 1ive components of DMS–MS isobaric mixture. The five protonated molecules all were obshe mixture into 4 distinct peaks, with fendiline and chlorprothixene remaining partially
Chemical name (mass order) Chemical formula
Oxfendazole C15H13N3O3S
Chlorprothixene C18H18ClNS
Flusilazole C16H15F2N3Si
Fendiline C23H25N
Pamaquine C19H29N3O
s Spectrometry 291 (2010) 108–117
on field. As a result, ion species occurring at the same m/z valuebut with different charge have much different DMS properties.
4. Greater orthogonality than time-of-flight ion-mobility spectrom-etry (IMS). DMS parameters are less correlated with mass thanthe IMS drift time [24,25] because DMS depends on additionalnon-geometric molecular properties such as charge distribu-tion and polarizability, and because DMS accesses a range ofeffective temperatures during the DMS field cycle.
• Sensitivity1. Short residence time. Residence times in planar DMS configura-
tions are typically in the range of 1–4 ms. This short residencetime reduces diffusion losses and minimizes unwanted reac-tions.
2. Continuous operation. DMS filtration, unlike time-of-flight IMSconfigurations, operates continuously without the ion lossescaused by a shutter.
3. Filtration of intact molecular ion. MS/MS techniques are usedto provide selectivity for many applications, but each frag-mentation step in this method results in ion losses andthe uncertainty in relative fragmentation efficiency requirescareful calibration. DMS–MS operates on the ion prior to frag-mentation while providing selectivity that can be equivalentto MS/MS. In addition, MS/MS techniques are time-consumingto apply in a mixture containing unknowns, because tenta-tive identifications must be made and then verified in separateexperiments. When necessary for confirmation of results, theDMS–CID–MS technique described in the section on isobarseparation can provide verification of DMS ion selection basedon the fragmentation pattern of a pre-selected ion population.
• Ease of use1. Transparent mode. DMS in the planar configuration used here
can be operated in transparent mode, which allows all ions topass through the filter with minimum attenuation. This modeis used to optimize ion source operation. Differential mobilitydevices with cylindrical geometry do not have this capability.
2. Constant intensity. Planar DMS resolution is nearly indepen-dent of operating parameters separation voltage (SV) andcompensation voltage (CV). The cylindrical or FAIMS con-figuration focuses or defocuses ions in a way that varieswith separation voltage (SV) making intensities and resolutiondependent on SV.
3. Polarity independent. Planar DMS operates to filter ions of bothpolarities, so no electrical changes are necessary when MSpolarity is changed.
The following sections describe the DMS–MS experimental teststhat have been performed to verify these expectations in the con-text of biomarker detection. We analyze DMS–MS performance forthe separation of isobaric compounds, describing how DMS–MSwith fragmentation at the MS inlet following DMS ion selection
erved in mass spectrometry at 316 Da as shown in Fig. 2. The DMS ion filter resolvesresolved as shown in Figs. 2 and 3.
[M]/[MH]+ mass/u �m/u R = 316 u/�m
315.06776 0.01708 18,501316.07559
315.08484 0.01549 20,400316.09267
315.10033 0.09836 3212316.10815
315.19869 0.03236 9765316.20652
315.23105 – –316.23889
S.L. Coy et al. / International Journal of Mas
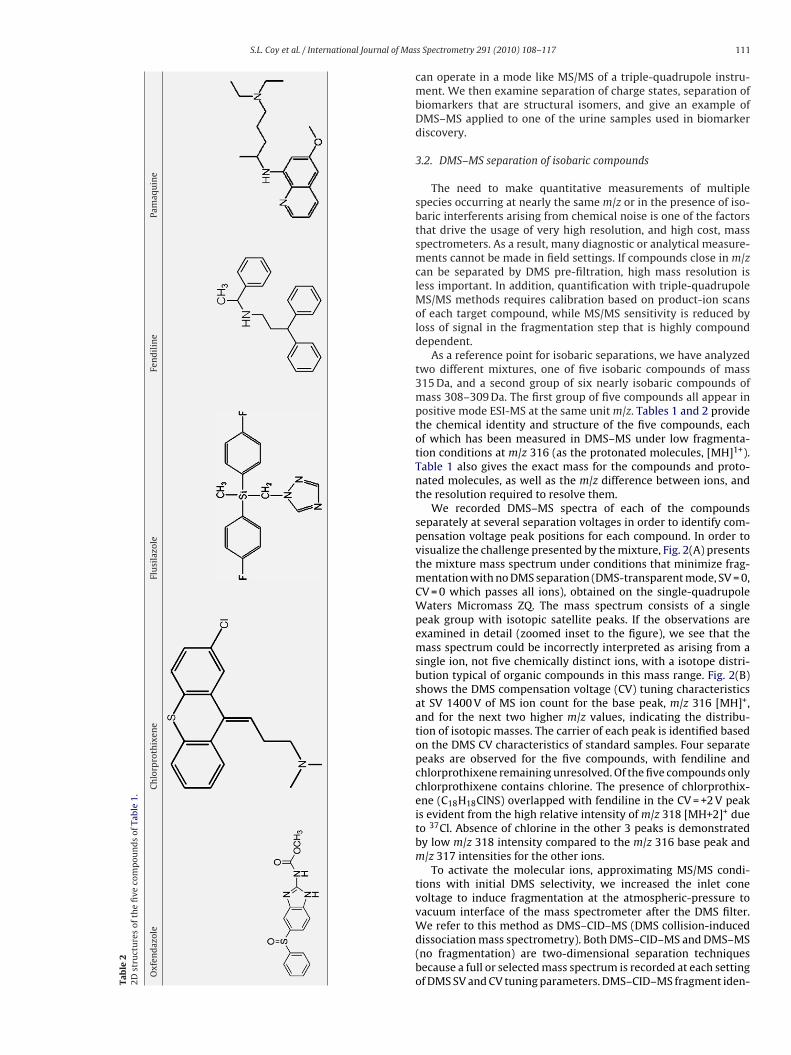
Tab
le2
2Dst
ruct
ure
sof
the
five
com
pou
nd
sof
Tabl
e1.
Oxf
end
azol
eC
hlo
rpro
thix
ene
Flu
sila
zole
Fen
dil
ine
Pam
aqu
ine
s Spectrometry 291 (2010) 108–117 111
can operate in a mode like MS/MS of a triple-quadrupole instru-ment. We then examine separation of charge states, separation ofbiomarkers that are structural isomers, and give an example ofDMS–MS applied to one of the urine samples used in biomarkerdiscovery.
3.2. DMS–MS separation of isobaric compounds
The need to make quantitative measurements of multiplespecies occurring at nearly the same m/z or in the presence of iso-baric interferents arising from chemical noise is one of the factorsthat drive the usage of very high resolution, and high cost, massspectrometers. As a result, many diagnostic or analytical measure-ments cannot be made in field settings. If compounds close in m/zcan be separated by DMS pre-filtration, high mass resolution isless important. In addition, quantification with triple-quadrupoleMS/MS methods requires calibration based on product-ion scansof each target compound, while MS/MS sensitivity is reduced byloss of signal in the fragmentation step that is highly compounddependent.
As a reference point for isobaric separations, we have analyzedtwo different mixtures, one of five isobaric compounds of mass315 Da, and a second group of six nearly isobaric compounds ofmass 308–309 Da. The first group of five compounds all appear inpositive mode ESI-MS at the same unit m/z. Tables 1 and 2 providethe chemical identity and structure of the five compounds, eachof which has been measured in DMS–MS under low fragmenta-tion conditions at m/z 316 (as the protonated molecules, [MH]1+).Table 1 also gives the exact mass for the compounds and proto-nated molecules, as well as the m/z difference between ions, andthe resolution required to resolve them.
We recorded DMS–MS spectra of each of the compoundsseparately at several separation voltages in order to identify com-pensation voltage peak positions for each compound. In order tovisualize the challenge presented by the mixture, Fig. 2(A) presentsthe mixture mass spectrum under conditions that minimize frag-mentation with no DMS separation (DMS-transparent mode, SV = 0,CV = 0 which passes all ions), obtained on the single-quadrupoleWaters Micromass ZQ. The mass spectrum consists of a singlepeak group with isotopic satellite peaks. If the observations areexamined in detail (zoomed inset to the figure), we see that themass spectrum could be incorrectly interpreted as arising from asingle ion, not five chemically distinct ions, with a isotope distri-bution typical of organic compounds in this mass range. Fig. 2(B)shows the DMS compensation voltage (CV) tuning characteristicsat SV 1400 V of MS ion count for the base peak, m/z 316 [MH]+,and for the next two higher m/z values, indicating the distribu-tion of isotopic masses. The carrier of each peak is identified basedon the DMS CV characteristics of standard samples. Four separatepeaks are observed for the five compounds, with fendiline andchlorprothixene remaining unresolved. Of the five compounds onlychlorprothixene contains chlorine. The presence of chlorprothix-ene (C18H18ClNS) overlapped with fendiline in the CV = +2 V peakis evident from the high relative intensity of m/z 318 [MH+2]+ dueto 37Cl. Absence of chlorine in the other 3 peaks is demonstratedby low m/z 318 intensity compared to the m/z 316 base peak andm/z 317 intensities for the other ions.
To activate the molecular ions, approximating MS/MS condi-tions with initial DMS selectivity, we increased the inlet conevoltage to induce fragmentation at the atmospheric-pressure tovacuum interface of the mass spectrometer after the DMS filter.
We refer to this method as DMS–CID–MS (DMS collision-induceddissociation mass spectrometry). Both DMS–CID–MS and DMS–MS(no fragmentation) are two-dimensional separation techniquesbecause a full or selected mass spectrum is recorded at each settingof DMS SV and CV tuning parameters. DMS–CID–MS fragment iden-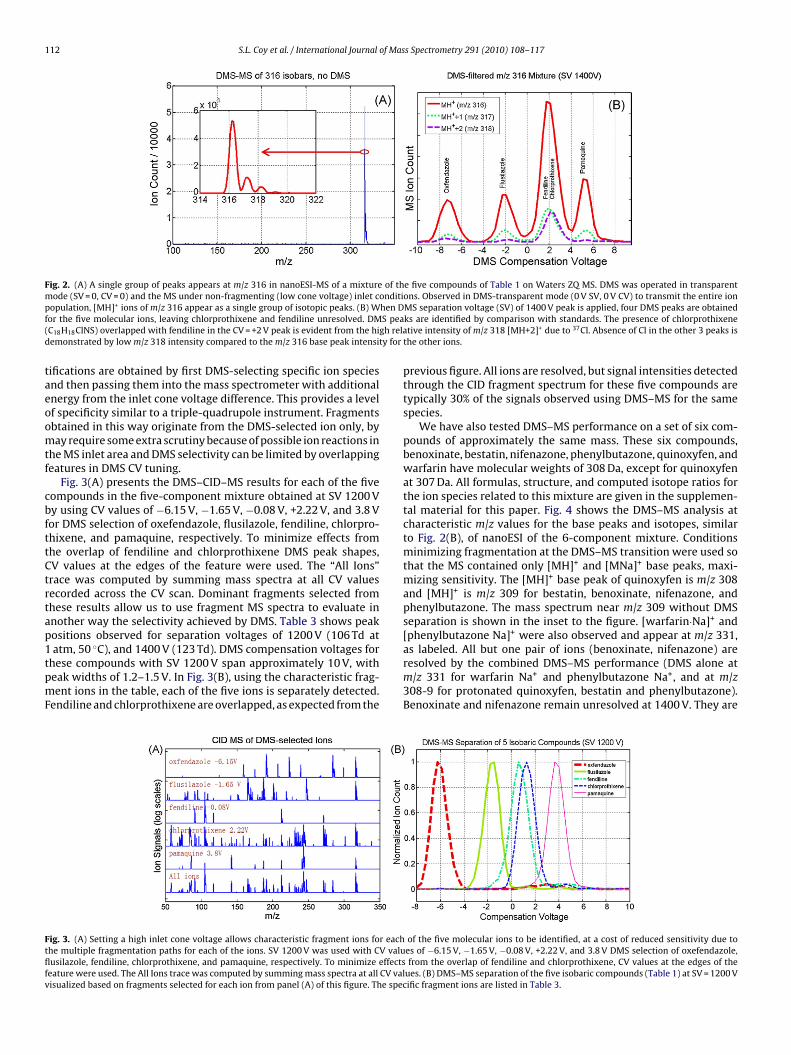
112 S.L. Coy et al. / International Journal of Mass Spectrometry 291 (2010) 108–117
Fig. 2. (A) A single group of peaks appears at m/z 316 in nanoESI-MS of a mixture of the five compounds of Table 1 on Waters ZQ MS. DMS was operated in transparentmode (SV = 0, CV = 0) and the MS under non-fragmenting (low cone voltage) inlet conditions. Observed in DMS-transparent mode (0 V SV, 0 V CV) to transmit the entire ionp hen Df S pea( gh relad ty for
taeoomtf
cbfttCtrtap1tpmF
Ftflfv
opulation, [MH]+ ions of m/z 316 appear as a single group of isotopic peaks. (B) Wor the five molecular ions, leaving chlorprothixene and fendiline unresolved. DMC18H18ClNS) overlapped with fendiline in the CV = +2 V peak is evident from the hiemonstrated by low m/z 318 intensity compared to the m/z 316 base peak intensi
ifications are obtained by first DMS-selecting specific ion speciesnd then passing them into the mass spectrometer with additionalnergy from the inlet cone voltage difference. This provides a levelf specificity similar to a triple-quadrupole instrument. Fragmentsbtained in this way originate from the DMS-selected ion only, byay require some extra scrutiny because of possible ion reactions in
he MS inlet area and DMS selectivity can be limited by overlappingeatures in DMS CV tuning.
Fig. 3(A) presents the DMS–CID–MS results for each of the fiveompounds in the five-component mixture obtained at SV 1200 Vy using CV values of −6.15 V, −1.65 V, −0.08 V, +2.22 V, and 3.8 Vor DMS selection of oxefendazole, flusilazole, fendiline, chlorpro-hixene, and pamaquine, respectively. To minimize effects fromhe overlap of fendiline and chlorprothixene DMS peak shapes,V values at the edges of the feature were used. The “All Ions”race was computed by summing mass spectra at all CV valuesecorded across the CV scan. Dominant fragments selected fromhese results allow us to use fragment MS spectra to evaluate innother way the selectivity achieved by DMS. Table 3 shows peakositions observed for separation voltages of 1200 V (106 Td at
◦
atm, 50 C), and 1400 V (123 Td). DMS compensation voltages forhese compounds with SV 1200 V span approximately 10 V, witheak widths of 1.2–1.5 V. In Fig. 3(B), using the characteristic frag-ent ions in the table, each of the five ions is separately detected.endiline and chlorprothixene are overlapped, as expected from the
ig. 3. (A) Setting a high inlet cone voltage allows characteristic fragment ions for eachhe multiple fragmentation paths for each of the ions. SV 1200 V was used with CV valuusilazole, fendiline, chlorprothixene, and pamaquine, respectively. To minimize effects
eature were used. The All Ions trace was computed by summing mass spectra at all CV valisualized based on fragments selected for each ion from panel (A) of this figure. The spec
MS separation voltage (SV) of 1400 V peak is applied, four DMS peaks are obtainedks are identified by comparison with standards. The presence of chlorprothixenetive intensity of m/z 318 [MH+2]+ due to 37Cl. Absence of Cl in the other 3 peaks is
the other ions.
previous figure. All ions are resolved, but signal intensities detectedthrough the CID fragment spectrum for these five compounds aretypically 30% of the signals observed using DMS–MS for the samespecies.
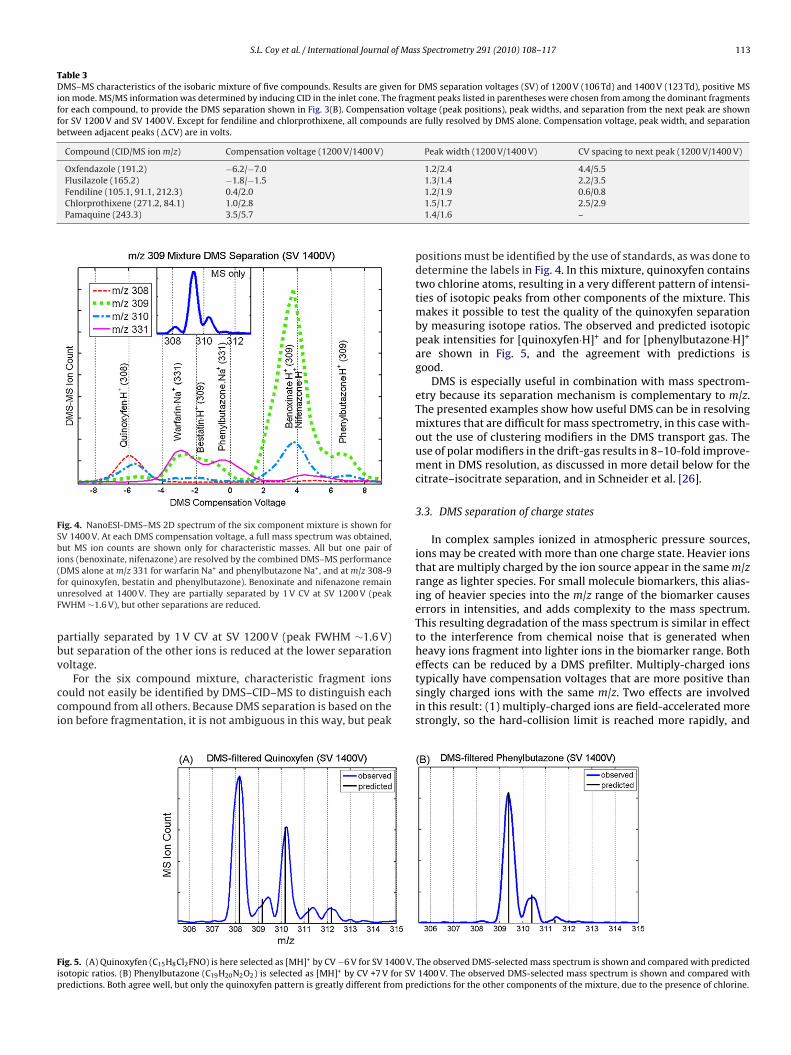
We have also tested DMS–MS performance on a set of six com-pounds of approximately the same mass. These six compounds,benoxinate, bestatin, nifenazone, phenylbutazone, quinoxyfen, andwarfarin have molecular weights of 308 Da, except for quinoxyfenat 307 Da. All formulas, structure, and computed isotope ratios forthe ion species related to this mixture are given in the supplemen-tal material for this paper. Fig. 4 shows the DMS–MS analysis atcharacteristic m/z values for the base peaks and isotopes, similarto Fig. 2(B), of nanoESI of the 6-component mixture. Conditionsminimizing fragmentation at the DMS–MS transition were used sothat the MS contained only [MH]+ and [MNa]+ base peaks, maxi-mizing sensitivity. The [MH]+ base peak of quinoxyfen is m/z 308and [MH]+ is m/z 309 for bestatin, benoxinate, nifenazone, andphenylbutazone. The mass spectrum near m/z 309 without DMSseparation is shown in the inset to the figure. [warfarin·Na]+ and[phenylbutazone Na]+ were also observed and appear at m/z 331,
as labeled. All but one pair of ions (benoxinate, nifenazone) areresolved by the combined DMS–MS performance (DMS alone atm/z 331 for warfarin Na+ and phenylbutazone Na+, and at m/z308-9 for protonated quinoxyfen, bestatin and phenylbutazone).Benoxinate and nifenazone remain unresolved at 1400 V. They areof the five molecular ions to be identified, at a cost of reduced sensitivity due toes of −6.15 V, −1.65 V, −0.08 V, +2.22 V, and 3.8 V DMS selection of oxefendazole,from the overlap of fendiline and chlorprothixene, CV values at the edges of the
ues. (B) DMS–MS separation of the five isobaric compounds (Table 1) at SV = 1200 Vific fragment ions are listed in Table 3.
S.L. Coy et al. / International Journal of Mass Spectrometry 291 (2010) 108–117 113
Table 3DMS–MS characteristics of the isobaric mixture of five compounds. Results are given for DMS separation voltages (SV) of 1200 V (106 Td) and 1400 V (123 Td), positive MSion mode. MS/MS information was determined by inducing CID in the inlet cone. The fragment peaks listed in parentheses were chosen from among the dominant fragmentsfor each compound, to provide the DMS separation shown in Fig. 3(B). Compensation voltage (peak positions), peak widths, and separation from the next peak are shownfor SV 1200 V and SV 1400 V. Except for fendiline and chlorprothixene, all compounds are fully resolved by DMS alone. Compensation voltage, peak width, and separationbetween adjacent peaks (�CV) are in volts.
Compound (CID/MS ion m/z) Compensation voltage (1200 V/1400 V) Peak width (1200 V/1400 V) CV spacing to next peak (1200 V/1400 V)
Oxfendazole (191.2) −6.2/−7.0 1.2/2.4 4.4/5.5Flusilazole (165.2) −1.8/−1.5 1.3/1.4 2.2/3.5Fendiline (105.1, 91.1, 212.3) 0.4/2.0Chlorprothixene (271.2, 84.1) 1.0/2.8Pamaquine (243.3) 3.5/5.7
Fig. 4. NanoESI-DMS–MS 2D spectrum of the six component mixture is shown forSV 1400 V. At each DMS compensation voltage, a full mass spectrum was obtained,but MS ion counts are shown only for characteristic masses. All but one pair ofions (benoxinate, nifenazone) are resolved by the combined DMS–MS performance(fuF
pbv
cci
Fip
DMS alone at m/z 331 for warfarin Na+ and phenylbutazone Na+, and at m/z 308-9or quinoxyfen, bestatin and phenylbutazone). Benoxinate and nifenazone remainnresolved at 1400 V. They are partially separated by 1 V CV at SV 1200 V (peakWHM ∼1.6 V), but other separations are reduced.
artially separated by 1 V CV at SV 1200 V (peak FWHM ∼1.6 V)ut separation of the other ions is reduced at the lower separation
oltage.For the six compound mixture, characteristic fragment ionsould not easily be identified by DMS–CID–MS to distinguish eachompound from all others. Because DMS separation is based on theon before fragmentation, it is not ambiguous in this way, but peak
ig. 5. (A) Quinoxyfen (C15H8Cl2FNO) is here selected as [MH]+ by CV −6 V for SV 1400 V.sotopic ratios. (B) Phenylbutazone (C19H20N2O2) is selected as [MH]+ by CV +7 V for SVredictions. Both agree well, but only the quinoxyfen pattern is greatly different from pre
1.2/1.9 0.6/0.81.5/1.7 2.5/2.91.4/1.6 –
positions must be identified by the use of standards, as was done todetermine the labels in Fig. 4. In this mixture, quinoxyfen containstwo chlorine atoms, resulting in a very different pattern of intensi-ties of isotopic peaks from other components of the mixture. Thismakes it possible to test the quality of the quinoxyfen separationby measuring isotope ratios. The observed and predicted isotopicpeak intensities for [quinoxyfen·H]+ and for [phenylbutazone·H]+
are shown in Fig. 5, and the agreement with predictions isgood.
DMS is especially useful in combination with mass spectrom-etry because its separation mechanism is complementary to m/z.The presented examples show how useful DMS can be in resolvingmixtures that are difficult for mass spectrometry, in this case with-out the use of clustering modifiers in the DMS transport gas. Theuse of polar modifiers in the drift-gas results in 8–10-fold improve-ment in DMS resolution, as discussed in more detail below for thecitrate–isocitrate separation, and in Schneider et al. [26].
3.3. DMS separation of charge states
In complex samples ionized in atmospheric pressure sources,ions may be created with more than one charge state. Heavier ionsthat are multiply charged by the ion source appear in the same m/zrange as lighter species. For small molecule biomarkers, this alias-ing of heavier species into the m/z range of the biomarker causeserrors in intensities, and adds complexity to the mass spectrum.This resulting degradation of the mass spectrum is similar in effectto the interference from chemical noise that is generated whenheavy ions fragment into lighter ions in the biomarker range. Both
effects can be reduced by a DMS prefilter. Multiply-charged ionstypically have compensation voltages that are more positive thansingly charged ions with the same m/z. Two effects are involvedin this result: (1) multiply-charged ions are field-accelerated morestrongly, so the hard-collision limit is reached more rapidly, andThe observed DMS-selected mass spectrum is shown and compared with predicted1400 V. The observed DMS-selected mass spectrum is shown and compared withdictions for the other components of the mixture, due to the presence of chlorine.
114 S.L. Coy et al. / International Journal of Mass Spectrometry 291 (2010) 108–117
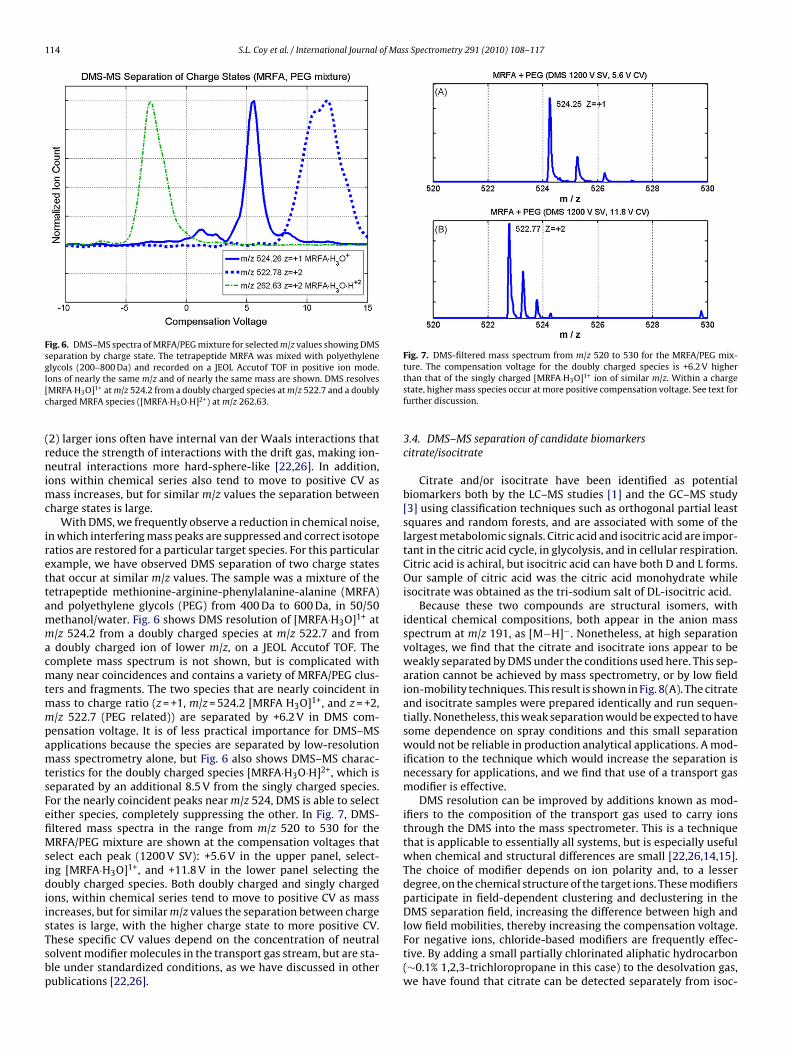
Fig. 6. DMS–MS spectra of MRFA/PEG mixture for selected m/z values showing DMSseparation by charge state. The tetrapeptide MRFA was mixed with polyethyleneglycols (200–800 Da) and recorded on a JEOL Accutof TOF in positive ion mode.I[c
(rnimc
irettammacmtmmpamtsFefiMsidiisTsbp
Fig. 7. DMS-filtered mass spectrum from m/z 520 to 530 for the MRFA/PEG mix-ture. The compensation voltage for the doubly charged species is +6.2 V higher
ons of nearly the same m/z and of nearly the same mass are shown. DMS resolvesMRFA·H3O]1+ at m/z 524.2 from a doubly charged species at m/z 522.7 and a doublyharged MRFA species ([MRFA·H3O·H]2+) at m/z 262.63.
2) larger ions often have internal van der Waals interactions thateduce the strength of interactions with the drift gas, making ion-eutral interactions more hard-sphere-like [22,26]. In addition,
ons within chemical series also tend to move to positive CV asass increases, but for similar m/z values the separation between
harge states is large.With DMS, we frequently observe a reduction in chemical noise,
n which interfering mass peaks are suppressed and correct isotopeatios are restored for a particular target species. For this particularxample, we have observed DMS separation of two charge stateshat occur at similar m/z values. The sample was a mixture of theetrapeptide methionine-arginine-phenylalanine-alanine (MRFA)nd polyethylene glycols (PEG) from 400 Da to 600 Da, in 50/50ethanol/water. Fig. 6 shows DMS resolution of [MRFA·H3O]1+ at/z 524.2 from a doubly charged species at m/z 522.7 and fromdoubly charged ion of lower m/z, on a JEOL Accutof TOF. The
omplete mass spectrum is not shown, but is complicated withany near coincidences and contains a variety of MRFA/PEG clus-
ers and fragments. The two species that are nearly coincident inass to charge ratio (z = +1, m/z = 524.2 [MRFA H3O]1+, and z = +2,/z 522.7 (PEG related)) are separated by +6.2 V in DMS com-ensation voltage. It is of less practical importance for DMS–MSpplications because the species are separated by low-resolutionass spectrometry alone, but Fig. 6 also shows DMS–MS charac-
eristics for the doubly charged species [MRFA·H3O·H]2+, which iseparated by an additional 8.5 V from the singly charged species.or the nearly coincident peaks near m/z 524, DMS is able to selectither species, completely suppressing the other. In Fig. 7, DMS-ltered mass spectra in the range from m/z 520 to 530 for theRFA/PEG mixture are shown at the compensation voltages that
elect each peak (1200 V SV): +5.6 V in the upper panel, select-ng [MRFA·H3O]1+, and +11.8 V in the lower panel selecting theoubly charged species. Both doubly charged and singly charged
ons, within chemical series tend to move to positive CV as massncreases, but for similar m/z values the separation between charge
tates is large, with the higher charge state to more positive CV.hese specific CV values depend on the concentration of neutralolvent modifier molecules in the transport gas stream, but are sta-le under standardized conditions, as we have discussed in otherublications [22,26].than that of the singly charged [MRFA·H3O]1+ ion of similar m/z. Within a chargestate, higher mass species occur at more positive compensation voltage. See text forfurther discussion.
3.4. DMS–MS separation of candidate biomarkerscitrate/isocitrate
Citrate and/or isocitrate have been identified as potentialbiomarkers both by the LC–MS studies [1] and the GC–MS study[3] using classification techniques such as orthogonal partial leastsquares and random forests, and are associated with some of thelargest metabolomic signals. Citric acid and isocitric acid are impor-tant in the citric acid cycle, in glycolysis, and in cellular respiration.Citric acid is achiral, but isocitric acid can have both D and L forms.Our sample of citric acid was the citric acid monohydrate whileisocitrate was obtained as the tri-sodium salt of DL-isocitric acid.
Because these two compounds are structural isomers, withidentical chemical compositions, both appear in the anion massspectrum at m/z 191, as [M−H]−. Nonetheless, at high separationvoltages, we find that the citrate and isocitrate ions appear to beweakly separated by DMS under the conditions used here. This sep-aration cannot be achieved by mass spectrometry, or by low fieldion-mobility techniques. This result is shown in Fig. 8(A). The citrateand isocitrate samples were prepared identically and run sequen-tially. Nonetheless, this weak separation would be expected to havesome dependence on spray conditions and this small separationwould not be reliable in production analytical applications. A mod-ification to the technique which would increase the separation isnecessary for applications, and we find that use of a transport gasmodifier is effective.
DMS resolution can be improved by additions known as mod-ifiers to the composition of the transport gas used to carry ionsthrough the DMS into the mass spectrometer. This is a techniquethat is applicable to essentially all systems, but is especially usefulwhen chemical and structural differences are small [22,26,14,15].The choice of modifier depends on ion polarity and, to a lesserdegree, on the chemical structure of the target ions. These modifiersparticipate in field-dependent clustering and declustering in theDMS separation field, increasing the difference between high andlow field mobilities, thereby increasing the compensation voltage.
For negative ions, chloride-based modifiers are frequently effec-tive. By adding a small partially chlorinated aliphatic hydrocarbon(∼0.1% 1,2,3-trichloropropane in this case) to the desolvation gas,we have found that citrate can be detected separately from isoc-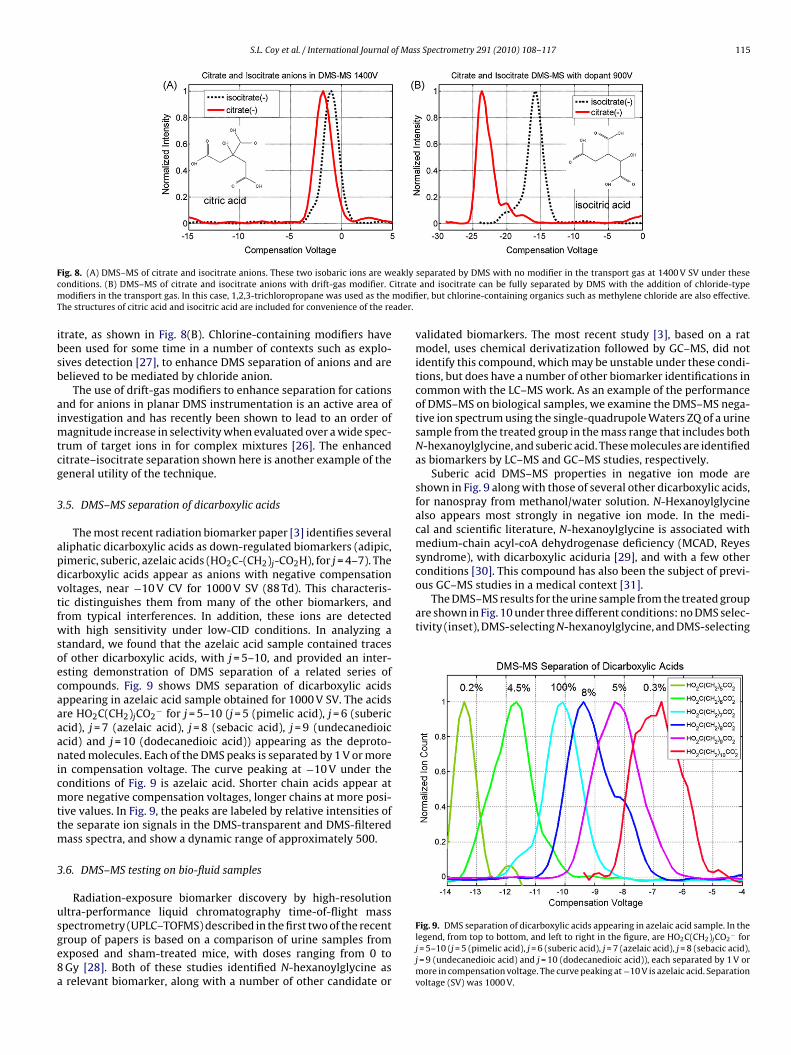
S.L. Coy et al. / International Journal of Mass Spectrometry 291 (2010) 108–117 115
F eaklyc itratem modifiT ader.
ibsb
aimtcg
3
apdvtfwsoecaaaanicmttm
3
usge8a
ous GC–MS studies in a medical context [31].The DMS–MS results for the urine sample from the treated group
are shown in Fig. 10 under three different conditions: no DMS selec-tivity (inset), DMS-selecting N-hexanoylglycine, and DMS-selecting
ig. 8. (A) DMS–MS of citrate and isocitrate anions. These two isobaric ions are wonditions. (B) DMS–MS of citrate and isocitrate anions with drift-gas modifier. Codifiers in the transport gas. In this case, 1,2,3-trichloropropane was used as the
he structures of citric acid and isocitric acid are included for convenience of the re
trate, as shown in Fig. 8(B). Chlorine-containing modifiers haveeen used for some time in a number of contexts such as explo-ives detection [27], to enhance DMS separation of anions and areelieved to be mediated by chloride anion.
The use of drift-gas modifiers to enhance separation for cationsnd for anions in planar DMS instrumentation is an active area ofnvestigation and has recently been shown to lead to an order of
agnitude increase in selectivity when evaluated over a wide spec-rum of target ions in for complex mixtures [26]. The enhanceditrate–isocitrate separation shown here is another example of theeneral utility of the technique.
.5. DMS–MS separation of dicarboxylic acids
The most recent radiation biomarker paper [3] identifies severalliphatic dicarboxylic acids as down-regulated biomarkers (adipic,imeric, suberic, azelaic acids (HO2C-(CH2)j-CO2H), for j = 4–7). Theicarboxylic acids appear as anions with negative compensationoltages, near −10 V CV for 1000 V SV (88 Td). This characteris-ic distinguishes them from many of the other biomarkers, androm typical interferences. In addition, these ions are detectedith high sensitivity under low-CID conditions. In analyzing a
tandard, we found that the azelaic acid sample contained tracesf other dicarboxylic acids, with j = 5–10, and provided an inter-sting demonstration of DMS separation of a related series ofompounds. Fig. 9 shows DMS separation of dicarboxylic acidsppearing in azelaic acid sample obtained for 1000 V SV. The acidsre HO2C(CH2)jCO2
− for j = 5–10 (j = 5 (pimelic acid), j = 6 (subericcid), j = 7 (azelaic acid), j = 8 (sebacic acid), j = 9 (undecanedioiccid) and j = 10 (dodecanedioic acid)) appearing as the deproto-ated molecules. Each of the DMS peaks is separated by 1 V or more
n compensation voltage. The curve peaking at −10 V under theonditions of Fig. 9 is azelaic acid. Shorter chain acids appear atore negative compensation voltages, longer chains at more posi-
ive values. In Fig. 9, the peaks are labeled by relative intensities ofhe separate ion signals in the DMS-transparent and DMS-filtered
ass spectra, and show a dynamic range of approximately 500.
.6. DMS–MS testing on bio-fluid samples
Radiation-exposure biomarker discovery by high-resolutionltra-performance liquid chromatography time-of-flight mass
pectrometry (UPLC–TOFMS) described in the first two of the recentroup of papers is based on a comparison of urine samples fromxposed and sham-treated mice, with doses ranging from 0 toGy [28]. Both of these studies identified N-hexanoylglycine asrelevant biomarker, along with a number of other candidate orseparated by DMS with no modifier in the transport gas at 1400 V SV under theseand isocitrate can be fully separated by DMS with the addition of chloride-typeer, but chlorine-containing organics such as methylene chloride are also effective.
validated biomarkers. The most recent study [3], based on a ratmodel, uses chemical derivatization followed by GC–MS, did notidentify this compound, which may be unstable under these condi-tions, but does have a number of other biomarker identifications incommon with the LC–MS work. As an example of the performanceof DMS–MS on biological samples, we examine the DMS–MS nega-tive ion spectrum using the single-quadrupole Waters ZQ of a urinesample from the treated group in the mass range that includes bothN-hexanoylglycine, and suberic acid. These molecules are identifiedas biomarkers by LC–MS and GC–MS studies, respectively.
Suberic acid DMS–MS properties in negative ion mode areshown in Fig. 9 along with those of several other dicarboxylic acids,for nanospray from methanol/water solution. N-Hexanoylglycinealso appears most strongly in negative ion mode. In the medi-cal and scientific literature, N-hexanoylglycine is associated withmedium-chain acyl-coA dehydrogenase deficiency (MCAD, Reyessyndrome), with dicarboxylic aciduria [29], and with a few otherconditions [30]. This compound has also been the subject of previ-
Fig. 9. DMS separation of dicarboxylic acids appearing in azelaic acid sample. In thelegend, from top to bottom, and left to right in the figure, are HO2C(CH2)jCO2
− forj = 5–10 (j = 5 (pimelic acid), j = 6 (suberic acid), j = 7 (azelaic acid), j = 8 (sebacic acid),j = 9 (undecanedioic acid) and j = 10 (dodecanedioic acid)), each separated by 1 V ormore in compensation voltage. The curve peaking at −10 V is azelaic acid. Separationvoltage (SV) was 1000 V.
116 S.L. Coy et al. / International Journal of Mas
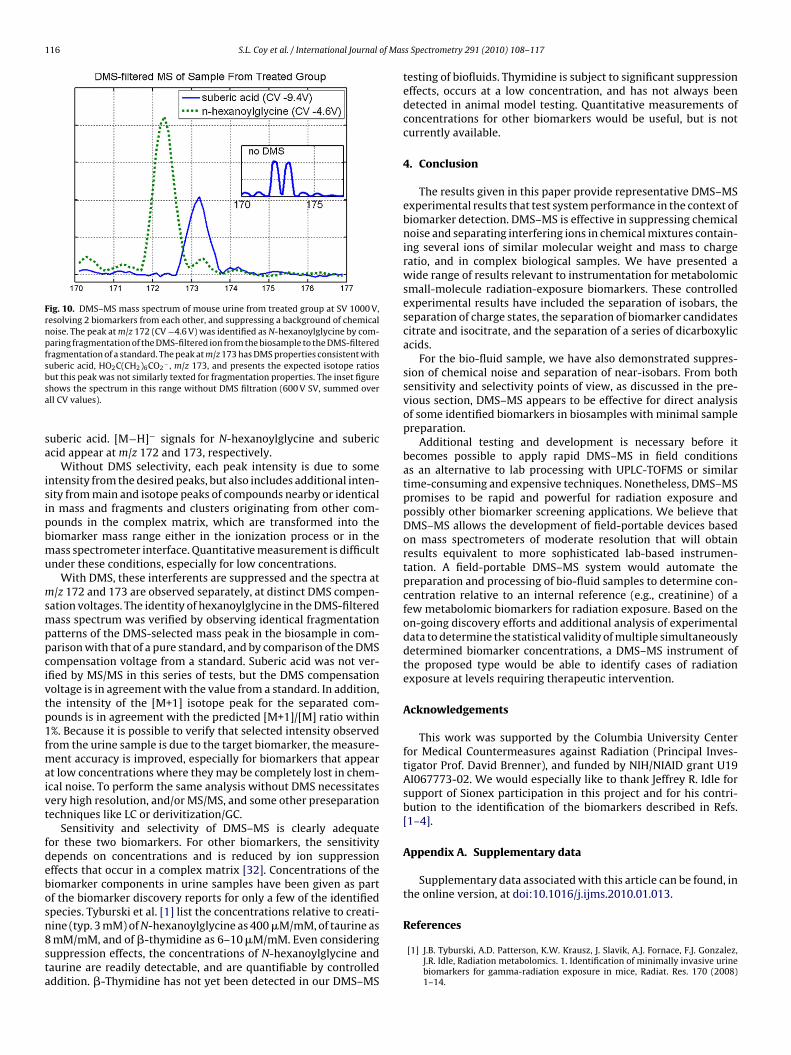
Fig. 10. DMS–MS mass spectrum of mouse urine from treated group at SV 1000 V,resolving 2 biomarkers from each other, and suppressing a background of chemicalnoise. The peak at m/z 172 (CV −4.6 V) was identified as N-hexanoylglycine by com-paring fragmentation of the DMS-filtered ion from the biosample to the DMS-filteredfragmentation of a standard. The peak at m/z 173 has DMS properties consistent withsuberic acid, HO2C(CH2)6CO2
− , m/z 173, and presents the expected isotope ratiosbsa
sa
isipbmu
msmppcivtp1fmaivt
fdebosn8sta
References
ut this peak was not similarly texted for fragmentation properties. The inset figurehows the spectrum in this range without DMS filtration (600 V SV, summed overll CV values).
uberic acid. [M−H]− signals for N-hexanoylglycine and subericcid appear at m/z 172 and 173, respectively.
Without DMS selectivity, each peak intensity is due to somentensity from the desired peaks, but also includes additional inten-ity from main and isotope peaks of compounds nearby or identicaln mass and fragments and clusters originating from other com-ounds in the complex matrix, which are transformed into theiomarker mass range either in the ionization process or in theass spectrometer interface. Quantitative measurement is difficult
nder these conditions, especially for low concentrations.With DMS, these interferents are suppressed and the spectra at
/z 172 and 173 are observed separately, at distinct DMS compen-ation voltages. The identity of hexanoylglycine in the DMS-filteredass spectrum was verified by observing identical fragmentation
atterns of the DMS-selected mass peak in the biosample in com-arison with that of a pure standard, and by comparison of the DMSompensation voltage from a standard. Suberic acid was not ver-fied by MS/MS in this series of tests, but the DMS compensationoltage is in agreement with the value from a standard. In addition,he intensity of the [M+1] isotope peak for the separated com-ounds is in agreement with the predicted [M+1]/[M] ratio within%. Because it is possible to verify that selected intensity observedrom the urine sample is due to the target biomarker, the measure-
ent accuracy is improved, especially for biomarkers that appeart low concentrations where they may be completely lost in chem-cal noise. To perform the same analysis without DMS necessitatesery high resolution, and/or MS/MS, and some other preseparationechniques like LC or derivitization/GC.
Sensitivity and selectivity of DMS–MS is clearly adequateor these two biomarkers. For other biomarkers, the sensitivityepends on concentrations and is reduced by ion suppressionffects that occur in a complex matrix [32]. Concentrations of theiomarker components in urine samples have been given as partf the biomarker discovery reports for only a few of the identifiedpecies. Tyburski et al. [1] list the concentrations relative to creati-ine (typ. 3 mM) of N-hexanoylglycine as 400 �M/mM, of taurine as
mM/mM, and of �-thymidine as 6–10 �M/mM. Even consideringuppression effects, the concentrations of N-hexanoylglycine andaurine are readily detectable, and are quantifiable by controlledddition. �-Thymidine has not yet been detected in our DMS–MS
s Spectrometry 291 (2010) 108–117
testing of biofluids. Thymidine is subject to significant suppressioneffects, occurs at a low concentration, and has not always beendetected in animal model testing. Quantitative measurements ofconcentrations for other biomarkers would be useful, but is notcurrently available.
4. Conclusion
The results given in this paper provide representative DMS–MSexperimental results that test system performance in the context ofbiomarker detection. DMS–MS is effective in suppressing chemicalnoise and separating interfering ions in chemical mixtures contain-ing several ions of similar molecular weight and mass to chargeratio, and in complex biological samples. We have presented awide range of results relevant to instrumentation for metabolomicsmall-molecule radiation-exposure biomarkers. These controlledexperimental results have included the separation of isobars, theseparation of charge states, the separation of biomarker candidatescitrate and isocitrate, and the separation of a series of dicarboxylicacids.
For the bio-fluid sample, we have also demonstrated suppres-sion of chemical noise and separation of near-isobars. From bothsensitivity and selectivity points of view, as discussed in the pre-vious section, DMS–MS appears to be effective for direct analysisof some identified biomarkers in biosamples with minimal samplepreparation.
Additional testing and development is necessary before itbecomes possible to apply rapid DMS–MS in field conditionsas an alternative to lab processing with UPLC-TOFMS or similartime-consuming and expensive techniques. Nonetheless, DMS–MSpromises to be rapid and powerful for radiation exposure andpossibly other biomarker screening applications. We believe thatDMS–MS allows the development of field-portable devices basedon mass spectrometers of moderate resolution that will obtainresults equivalent to more sophisticated lab-based instrumen-tation. A field-portable DMS–MS system would automate thepreparation and processing of bio-fluid samples to determine con-centration relative to an internal reference (e.g., creatinine) of afew metabolomic biomarkers for radiation exposure. Based on theon-going discovery efforts and additional analysis of experimentaldata to determine the statistical validity of multiple simultaneouslydetermined biomarker concentrations, a DMS–MS instrument ofthe proposed type would be able to identify cases of radiationexposure at levels requiring therapeutic intervention.
Acknowledgements
This work was supported by the Columbia University Centerfor Medical Countermeasures against Radiation (Principal Inves-tigator Prof. David Brenner), and funded by NIH/NIAID grant U19AI067773-02. We would especially like to thank Jeffrey R. Idle forsupport of Sionex participation in this project and for his contri-bution to the identification of the biomarkers described in Refs.[1–4].
Appendix A. Supplementary data
Supplementary data associated with this article can be found, inthe online version, at doi:10.1016/j.ijms.2010.01.013.
[1] J.B. Tyburski, A.D. Patterson, K.W. Krausz, J. Slavik, A.J. Fornace, F.J. Gonzalez,J.R. Idle, Radiation metabolomics. 1. Identification of minimally invasive urinebiomarkers for gamma-radiation exposure in mice, Radiat. Res. 170 (2008)1–14.
of Mas
[
[
[
[
[
[
[
[
[
[
[
[
[
[
[
[
[
[
[[
[
[
human urine using chemical ionization gas chromatography/mass spectrom-
S.L. Coy et al. / International Journal
[2] A.D. Patterson, H. Li, G.S. Eichler, K.W. Krausz, J.N. Weinstein, A.J. Fornace, F.J.Gonzalez, J.R. Idle, UPLC-ESI-TOFMS-based metabolomics and gene expressiondynamics inspector self-organizing metabolomic maps as tools for understand-ing the cellular response to ionizing radiation, Anal. Chem. 80 (2008) 665–674.
[3] C. Lanz, A.D. Patterson, J. Slavík, K.W. Krausz, M. Ledermann, F.J. Gonza-lez, J.R. Idle, Radiation metabolomics. 3. Biomarker discovery in the urineof gamma-irradiated rats using a simplified metabolomics protocol of gaschromatography-mass spectrometry combined with random forests machinelearning algorithm, Radiat. Res. 172 (2009) 198–212.
[4] J.B. Tyburski, A.D. Patterson, K.W. Krausz, J. Slavík, A.J. Fornace, F.J. Gonzalez,J.R. Idle, Radiation metabolomics. 2. Dose- and time-dependent urinary excre-tion of deaminated purines and pyrimidines after sublethal gamma-radiationexposure in mice, Radiat. Res. 172 (2009) 42–57.
[5] T.C. Pellmar, S. Rockwell, Priority list of research areas for radiological nuclearthreat countermeasures, Radiat. Res. 163 (2005) 115–123.
[6] “Every senior leader, when you’re asked what keeps you awake at night, it’s thethought of a terrorist ending up with a weapon of mass destruction, especiallynuclear.” U.S. Secretary of Defense R. Gates in B. Graham, et al., The Report of theCommission on the Prevention of WMD Proliferation and Terrorism, VintageBooks, New York, 2008.
[7] I.A. Buryakov, E.V. Krylov, A.L. Makas, E.G. Nazarov, V.V. Pervukhin, U.Kh.Rasulev, Drift spectrometer for the control of amine traces in the atmosphere,Zhurnal Analiticheskoi Khimii 48 (2) (1993) 114–121.
[8] G.A. Eiceman, Z. Karpas, Ion Mobility Spectrometry, second edition, CRC Press,2005, ISBN: 9780849322471.
[9] R. Guevremont, High-field asymmetric waveform ion mobility spectrometry:a new tool for mass spectrometry, J. Chromatogr. A 1058 (1–2) (2004) 3–19.
10] R. Guevremont, B. Makowski, Using FAIMS to increase selectivity for LC–MSanalyses, Am. Lab. 37 (13) (2005) 11.
11] M.A. McCooeye, Z. Mester, B. Ells, D.A. Barnett, R.W. Purves, R. Guevremont,Quantitation of amphetamine, methamphetamine, and their methylenedioxyderivatives in urine by solid-phase microextraction coupled with electrosprayionization-high-field asymmetric waveform ion mobility spectrometry-massspectrometry, Anal. Chem. 74 (13) (2002) 3071–3075.
12] A.A. Shvartsburg, Differential Ion Mobility: Non-Linear Ion Transport and Fun-damentals of FAIMS, CRC Press, Taylor and Francis LLC, Boca Raton, FL, 2008.
13] B.B. Schneider, T.R. Covey, S.L. Coy, E.V. Krylov, E.G. Nazarov, Planar differentialmobility spectrometer as a pre-filter for atmospheric pressure ionization massspectrometry, Int. J. Mass Spectrom., in press (and references therein).
14] D.S. Levin, R.A. Miller, E.G. Nazarov, P. Vouros, Rapid separation and quanti-tative analysis of peptides using a new nanoelectrospray-differential mobilityspectrometer-mass spectrometer system, Anal. Chem. 78 (2006) 5443.
15] D.S. Levin, P. Vouros, R.A. Miller, E.G. Nazarov, Using a nanoelectrospray-
differential mobility spectrometer-mass spectrometer system for the analysisof oligosaccharides with solvent selected control over ESI aggregate ion forma-tion, J. Am. Soc. Mass Spectrom. 18 (2007) 502.16] B.M. Lolakowski, Z. Mester, Review of applications of high-field asymmetricwaveform ion mobility spectrometry (FAIMS) and differential mobility spec-trometry (DMS), Analyst 132 (2007) 842–864.
[
s Spectrometry 291 (2010) 108–117 117
17] The Sionex microAnalyzer, for instance, is a self-contained trap/GC system withDMS detection that provides ppb/ppt sensitivity (http://www.sionex.com).
18] S. Kendler, G.R. Lambertus, B.D. Dunietz, S.L. Coy, E.G. Nazarov, R.A. Miller, R.D.Sacks, Fragmentation pathways and mechanisms of aromatic compounds inatmospheric pressure studied by GC–DMS and DMS–MS, Int. J. Mass Spectrom.263 (2007) 137.
19] E.G. Nazarov, R.A. Miller, G.A. Eiceman, J.A. Stone, Miniature differential mobil-ity spectrometry using atmospheric pressure photoionization, Anal. Chem. 78(2006) 4553–4563.
20] Patent application (WO/2008/085357), (PCT/US2007/025929), SurfaceEnhanced Raman Spectroscopy Detection With Ion Separation Pre-Filter.
21] E.V. Krylov, S.L. Coy, E.G. Nazarov, J. Vandermey, B.B. Schneider, T.R. Covey, Rev.Sci. Instrum. 81 (2010) 024101.
22] B.B. Schneider, T.R. Covey, S.L. Coy, E.V. Krylov, E.G. Nazarov, Control of chemicaleffects in the separation process of a differential mobility/mass spectrometersystem, Eur. J. Mass Spectrom. 16 (1) (2010) 57–71.
23] http://mexcdf.sourceforge.net/ provides access to the SNCTOOLS/MEXNC MAT-LAB interface to netCDF format files, The SNCTOOLS/MEXNC interface is beingsuperceded by native MATLAB support for netCDF files, beginning with MAT-LAB R2008b.
24] A.A. Shvartsburg, K. Tang, R.D. Smith, Two-dimensional ion mobility analysesof proteins and peptide, Methods Mol. Biol. 492 (2009), doi:10.1007/978-1-59745-493-3 26.
25] P. Dwivedi, P. Wu, S.J. Klopsch, G.J. Puzon, L. Xun, H.H. Hill, Metabolic profil-ing by ion mobility mass spectrometry (IMMS), Metabolomics 4 (2008) 63–80,doi:10.1007/s11306-007-0093-z.
26] B.B. Schneider, T.R. Covey, S.L. Coy, E.V. Krylov, E.G. Nazarov, Chemical effectsin the separation process of a differential mobility/mass spectrometer system,Anal. Chem., doi:10.1021/ac902571u, in press.
27] G.A. Eiceman, E.V. Krylov, N.S. Krylova, E.G. Nazarov, R.A. Miller, Separation ofions from explosives in differential mobility spectrometry by vapor-modifieddrift gas, Anal. Chem. 76 (2004) 4937–4944.
28] Gray, abbreviated Gy, 1 J of energy absorbed per kilogram of tissue.29] C.R. Roe, D.S. Millington, D.A. Maltby, T.P. Bohan, S.G. Kahler, R.A. Chalmers,
Diagnostic and therapeutic implications of medium-chain acylcarnitines in themedium-chain acyl-coA dehydrogenase deficiency, Pediatr. Res. 19 (5) (1985)459–466.
30] B.H. Baretz, H.S. Ramsdell, K. Tanaka, Identification of n-hexanoylglycine inurines from two patients with Jamaican vomiting sickness, Clin. Chim. Acta 73(1) (1976) 199–202.
31] P. Rinaldo, J.J. O’Shea, R.D. Welch, K. Tanaka, Stable isotope dilution anal-ysis of n-hexanoylglycine, 3-phenylpropionylglycine and suberylglycine in
etry selected ion monitoring, Biomed. Environ. Mass Spectrom. 18 (7) (1989)471–477.
32] R. King, R. Bonfiglio, C. Fernandez-Metzler, C. Miller-Stein, T. Olah, Mechanisticinvestigation of ionization suppression in electrospray ionization, J. Am. Chem.Soc. 11 (2000) 942–950.
Recommended