Interim Report Q1 2016
Teleconference presentation
May 4, 2016
Agenda
Group highlights Q1 2016
GN ReSound update
GN Netcom update
Financial outlook
2
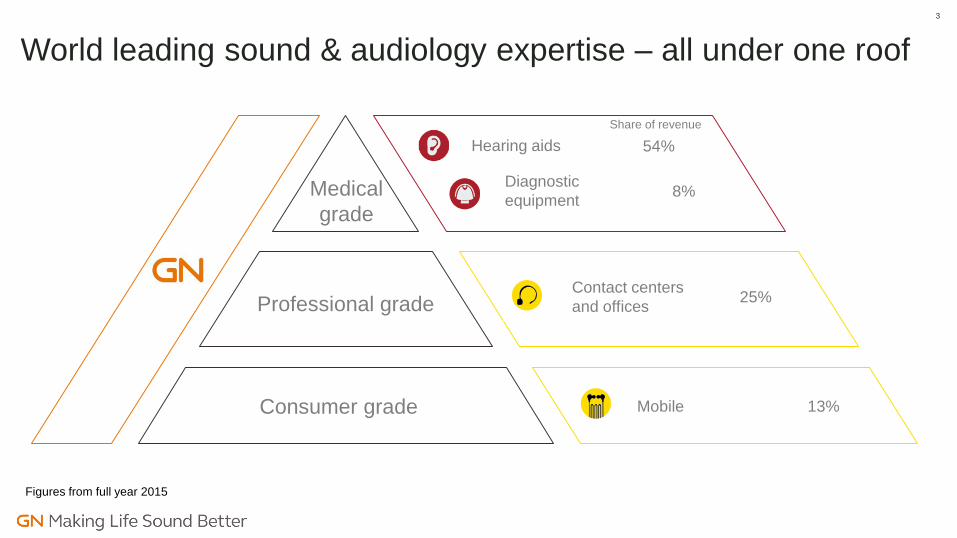
World leading sound & audiology expertise – all under one roof
3
Medical
grade
Professional grade
Consumer grade
Diagnostic
equipment
Contact centers
and offices
Mobile
Hearing aids 54%
Share of revenue
8%
25%
13%
Figures from full year 2015

Const. FX effect
DKK millioncurr.
growth
incl.
hedging
Gross profit 1,158 +8% +1% 1,267
Profit before tax 252 276
Net profit 185 208
EPS 1.17 1.38
ROIC* 17.7% 18.1%
(106) (8)
NIBD/EBITDA 1.6x 1.7x
EBITA
Organic growth
Gross margin
EBITA margin
Free cash flow excl. M&A
Revenue +9% +2%1,885
4%
61.4%
291
15.4%
(0.4)%-p (0.5)%-p
+0% +5%
(1.3)%-p +0.5%-p
60.5%
306
14.6%
Q1
2015
Q1
2016
2,093
8%
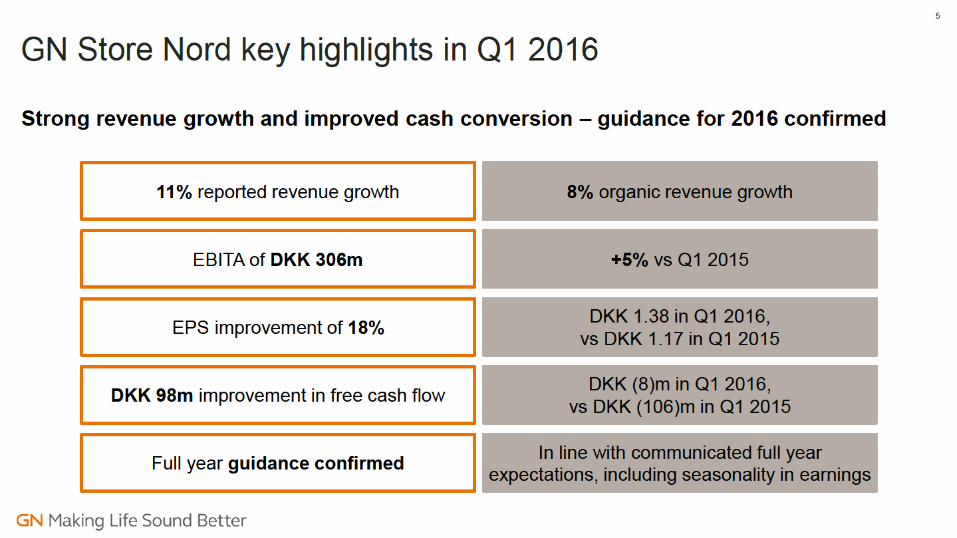
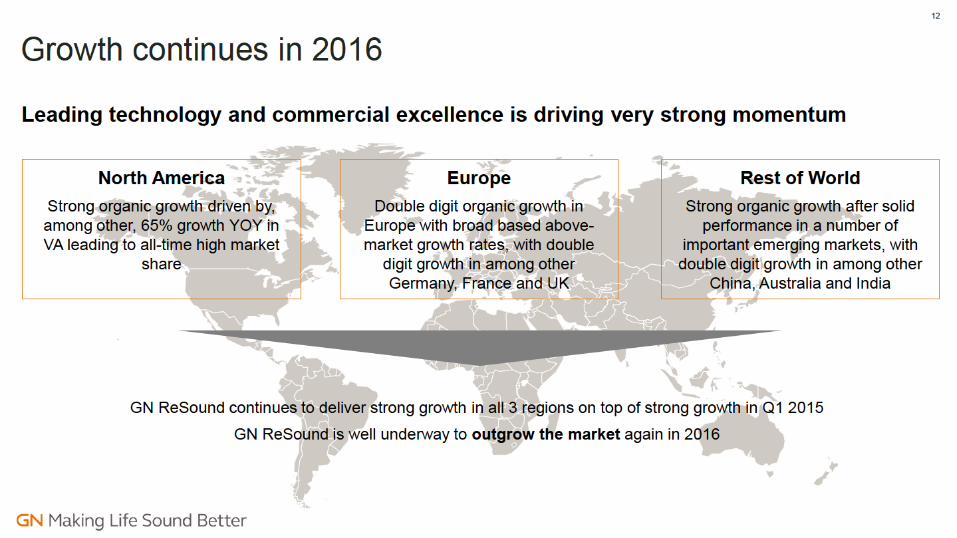
Strong organic growth and improved cash conversion
• Strong organic growth driven by Hearing instruments
and CC&O
• Gross profit increase due to strong revenue
development
• Gross margin development reflecting, e.g., timing of
product launches in GN ReSound and solid CC&O
revenue growth
• EBITA increased further
• Margin development reflecting timing of product
launches and investments to support strong current
momentum in businesses
• Positive impact from FX as previously communicated
• Free cash flow increased from DKK (106)m to (8)m in
Q1 2016 …
Group financial highlights
6
* Reported EBITA (rolling four quarters) / avg. invested capital
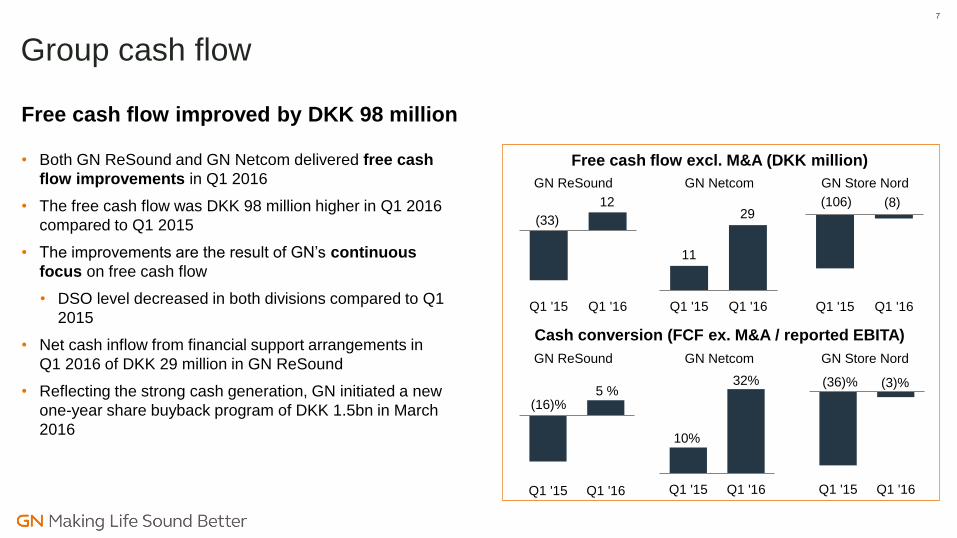
Free cash flow improved by DKK 98 million
• Both GN ReSound and GN Netcom delivered free cash
flow improvements in Q1 2016
• The free cash flow was DKK 98 million higher in Q1 2016
compared to Q1 2015
• The improvements are the result of GN’s continuous
focus on free cash flow
• DSO level decreased in both divisions compared to Q1
2015
• Net cash inflow from financial support arrangements in
Q1 2016 of DKK 29 million in GN ReSound
• Reflecting the strong cash generation, GN initiated a new
one-year share buyback program of DKK 1.5bn in March
2016
Group cash flow
7
Free cash flow excl. M&A (DKK million)
Cash conversion (FCF ex. M&A / reported EBITA)
GN ReSound GN Netcom GN Store Nord
GN ReSound GN Netcom GN Store Nord
(33)
12
Q1 '15 Q1 '16
11
29
Q1 '15 Q1 '16
(106) (8)
Q1 '15 Q1 '16
(16)%5 %
Q1 '15 Q1 '16
10%
32%
Q1 '15 Q1 '16
(36)% (3)%
Q1 '15 Q1 '16
Agenda
Group highlights Q1 2016
GN ReSound update
GN Netcom update
Financial outlook
8
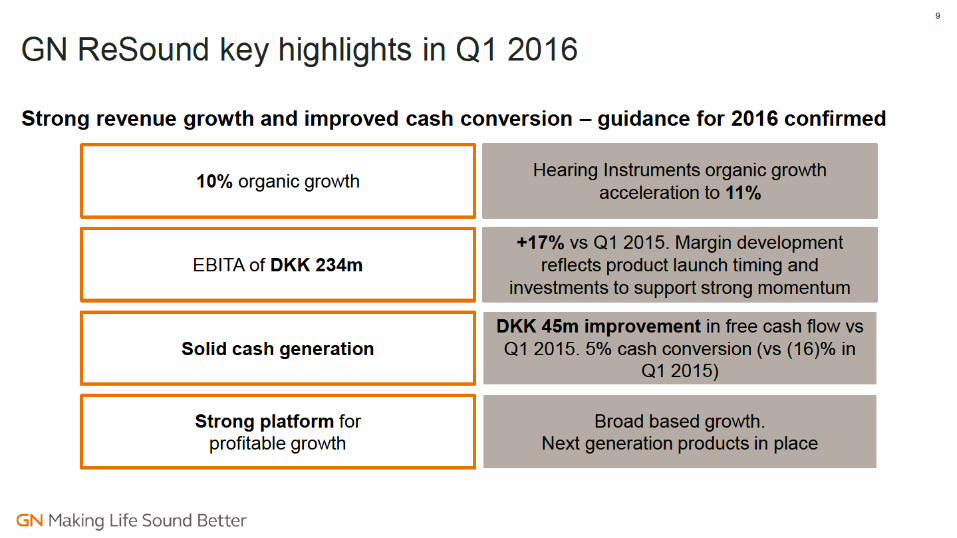
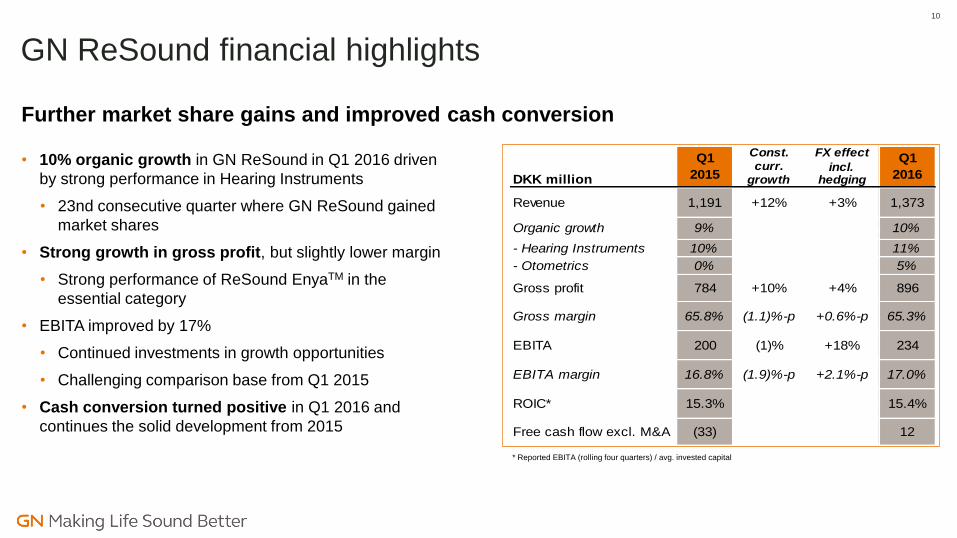
Further market share gains and improved cash conversion
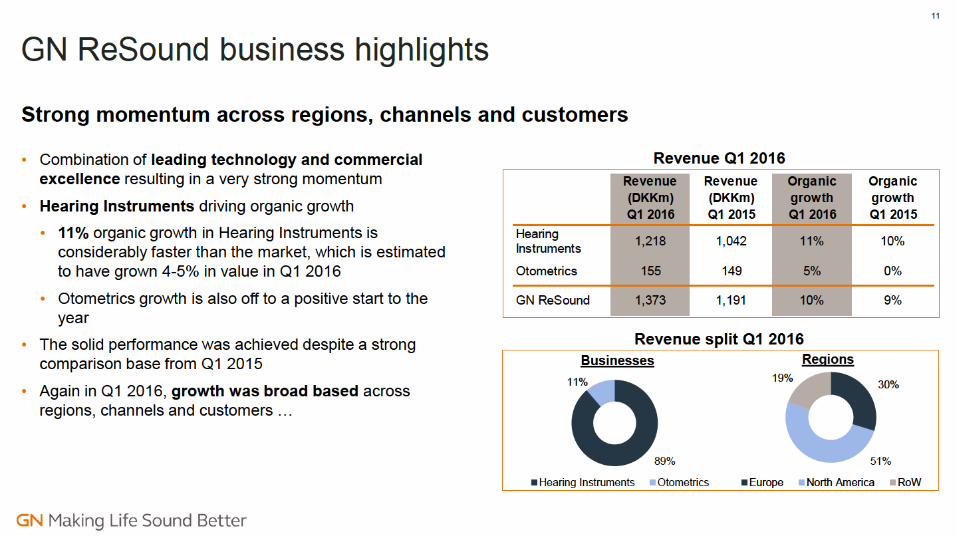
• 10% organic growth in GN ReSound in Q1 2016 driven
by strong performance in Hearing Instruments
• 23nd consecutive quarter where GN ReSound gained
market shares
• Strong growth in gross profit, but slightly lower margin
• Strong performance of ReSound EnyaTM in the
essential category
• EBITA improved by 17%
• Continued investments in growth opportunities
• Challenging comparison base from Q1 2015
• Cash conversion turned positive in Q1 2016 and
continues the solid development from 2015
GN ReSound financial highlights
10
* Reported EBITA (rolling four quarters) / avg. invested capital
Const. FX effectcurr. incl.
growth hedging
- Hearing Instruments 10% 11%
- Otometrics 0% 5%
Gross profit 784 +10% +4% 896
Free cash flow excl. M&A (33) 12
DKK million
Revenue
Organic growth
Gross margin
EBITA
ROIC*
EBITA margin
1,373
10%
65.3%
234
17.0%
15.4%
+12%
(1.1)%-p
(1)%
(1.9)%-p
1,191
9%
65.8%
200
16.8%
15.3%
Q1
2015
Q1
2016
+3%
+0.6%-p
+18%
+2.1%-p
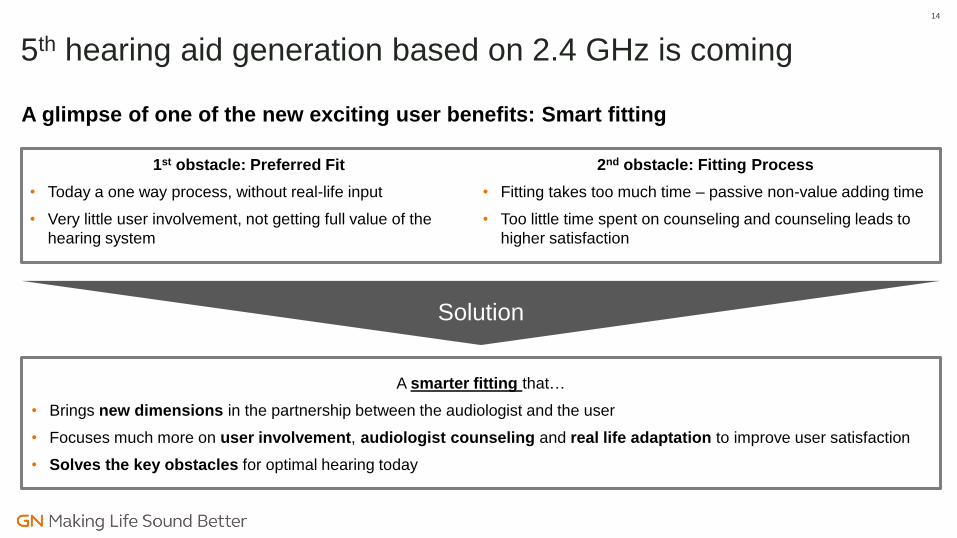
A glimpse of one of the new exciting user benefits: Smart fitting
5th hearing aid generation based on 2.4 GHz is coming
14
1st obstacle: Preferred Fit
• Today a one way process, without real-life input
• Very little user involvement, not getting full value of the
hearing system
2nd obstacle: Fitting Process
• Fitting takes too much time – passive non-value adding time
• Too little time spent on counseling and counseling leads to
higher satisfaction
Solution
A smarter fitting that…
• Brings new dimensions in the partnership between the audiologist and the user
• Focuses much more on user involvement, audiologist counseling and real life adaptation to improve user satisfaction
• Solves the key obstacles for optimal hearing today
Agenda
Group highlights Q1 2016
GN ReSound update
GN Netcom update
Financial outlook
15
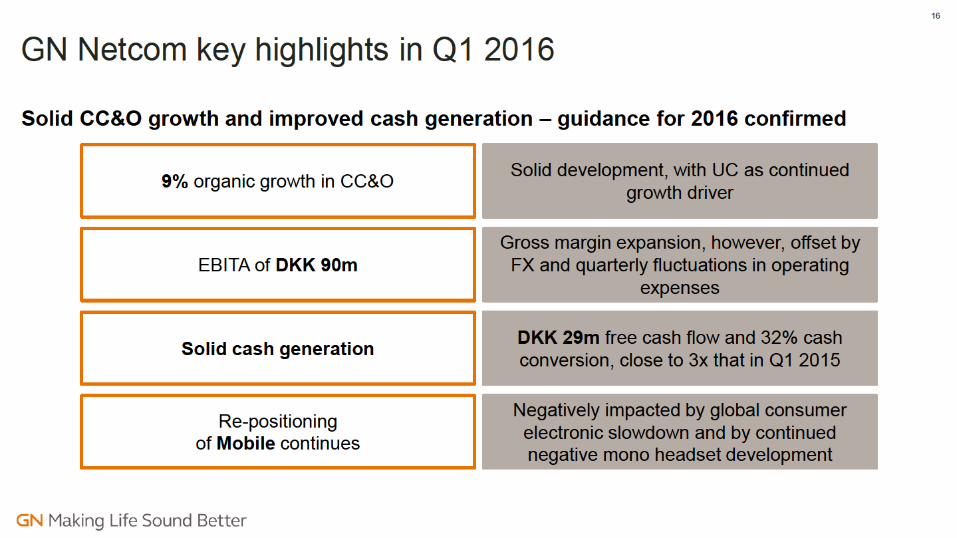
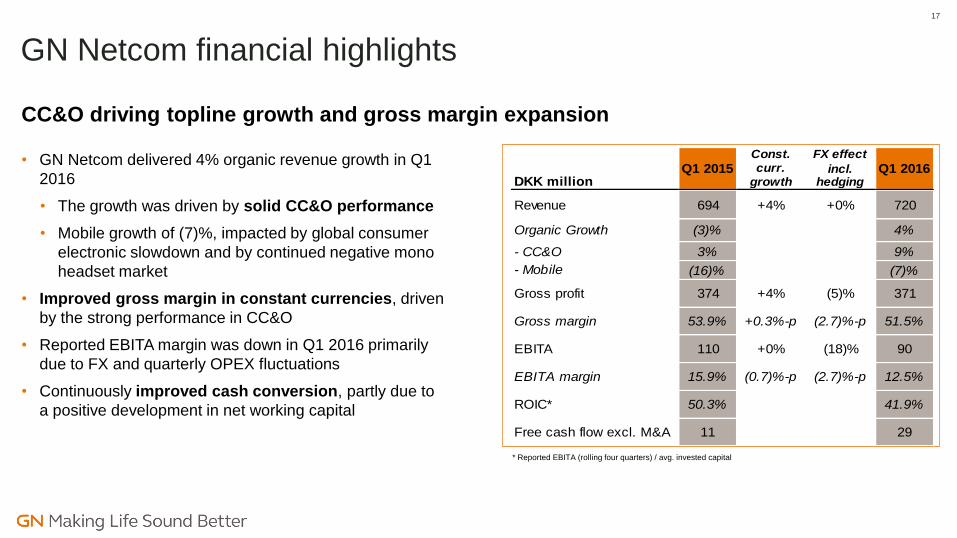
CC&O driving topline growth and gross margin expansion
• GN Netcom delivered 4% organic revenue growth in Q1
2016
• The growth was driven by solid CC&O performance
• Mobile growth of (7)%, impacted by global consumer
electronic slowdown and by continued negative mono
headset market
• Improved gross margin in constant currencies, driven
by the strong performance in CC&O
• Reported EBITA margin was down in Q1 2016 primarily
due to FX and quarterly OPEX fluctuations
• Continuously improved cash conversion, partly due to
a positive development in net working capital
GN Netcom financial highlights
17
* Reported EBITA (rolling four quarters) / avg. invested capital
Const. FX effectcurr. incl.
DKK million growth hedging
- CC&O 3% 9%
- Mobile (16)% (7)%
Gross profit 374 +4% (5)% 371
Free cash flow excl. M&A 11 29
694
(3)%
110 90
720
4%
51.5%
+4% +0%
ROIC*
EBITA margin
50.3%
15.9% 12.5%
41.9%
+0.3%-p (2.7)%-p
+0% (18)%EBITA
Gross margin 53.9%
Revenue
Organic Growth
Q1 2015 Q1 2016
(0.7)%-p (2.7)%-p
Agenda
Group highlights Q1 2016
GN ReSound update
GN Netcom update
Financial outlook
20
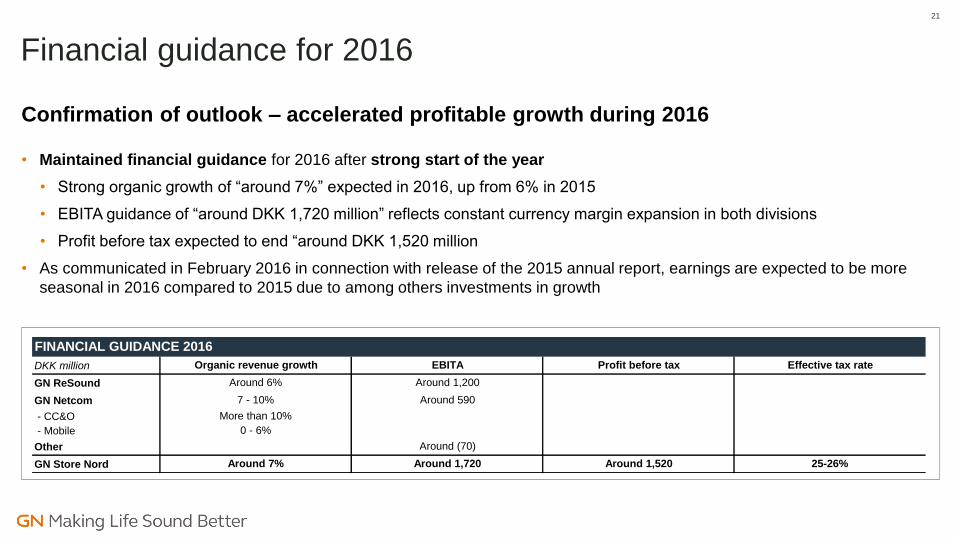
Confirmation of outlook – accelerated profitable growth during 2016
• Maintained financial guidance for 2016 after strong start of the year
• Strong organic growth of “around 7%” expected in 2016, up from 6% in 2015
• EBITA guidance of “around DKK 1,720 million” reflects constant currency margin expansion in both divisions
• Profit before tax expected to end “around DKK 1,520 million
• As communicated in February 2016 in connection with release of the 2015 annual report, earnings are expected to be more
seasonal in 2016 compared to 2015 due to among others investments in growth
Financial guidance for 2016
21
DKK million
GN ReSound
GN Netcom
- CC&O
- Mobile
Other
GN Store Nord
FINANCIAL GUIDANCE 2016
Organic revenue growth EBITA Profit before tax Effective tax rate
Around 1,520
More than 10%
0 - 6%
25-26%
Around 6%
7 - 10%
Around 7%
Around 1,200
Around 590
Around (70)
Around 1,720
Save the date:
September 26, 2016
Strategy update
GN headquarters
Ballerup, Denmark
Capital Markets Day 2016
22
Safe Harbor Statement
23
The forward-looking statements in this interim report reflect the management's current expectations of certain
future events and financial results. Statements regarding the future are, naturally, subject to risks and
uncertainties, which may result in considerable deviations from the outlook set forth. Furthermore, some of
these expectations are based on assumptions regarding future events, which may prove incorrect.
Factors that may cause actual results to deviate materially from expectations include – but are not limited to –
general economic developments and developments in the financial markets, technological developments,
changes and amendments to legislation and regulations governing GN’s markets, changes in the demand for
GN's products, competition, fluctuations in sub-contractor supplies and developments in ongoing litigation
(including but not limited to class action and patent infringement litigation in the United States).
This presentation should not be considered an offer to sell or buy securities in GN Store Nord.
Recommended