Date: November 24, 2005Company name (code number): Mitsubishi UFJ Financial Group, Inc. (8306)
(URL http://www.mufg.jp/)Stock exchange listings: Tokyo, Osaka, Nagoya, New York, LondonHeadquarters: TokyoRepresentative: Nobuo Kuroyanagi, President & CEOFor inquiry: Yoshihisa Harata, Chief Manager - Financial Planning Division
(Phone) +81-3-3240-8154Date of resolution of Board of Directors with respect to the interim consolidated financial statements: November 24, 2005Trading accounts: Established
1. Consolidated financial data for the six months ended September 30, 2005
(1) Operating results (in millions of yen except per share data and percentages)
For the year ended 2004 March 31, 2005
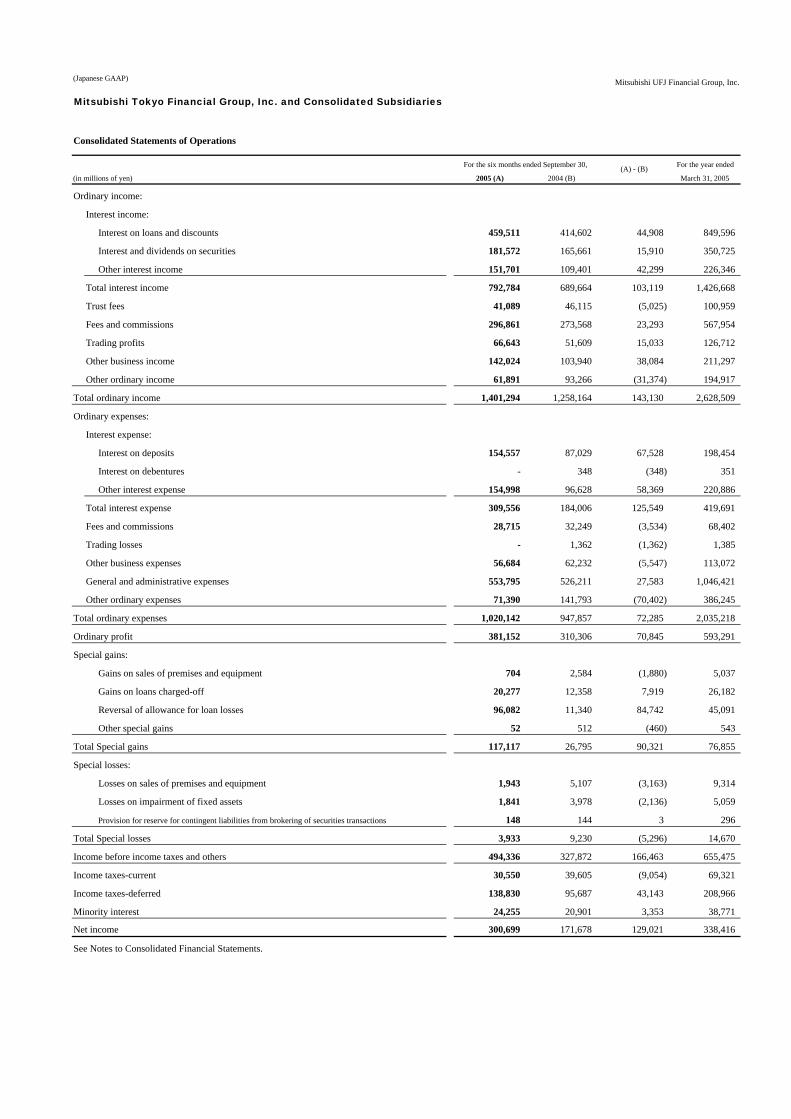
Ordinary income 1,401,294 1,258,164 2,628,509 Change from the previous year 11.4 % (7.6)% Ordinary profit 381,152 310,306 593,291 Change from the previous year 22.8 % 13.5 % Net income 300,699 171,678 338,416 Change from the previous year 75.2 % (43.1)%
Net income per common share 45,529.68 25,924.96 51,086.02
- - -
Notes: 1. Equity in earnings of affiliates: For the six months ended September 30, 2005: 7,196 million yen For the six months ended September 30, 2004: 7,573 million yen For the year ended March 31, 2005: 17,686 million yen
2. Average number of shares outstanding: For the six months ended September 30, 2005: (common stock) 6,538,585 shares
(preferred stock-class 3) 100,000 shares For the six months ended September 30, 2004: (common stock) 6,492,611 shares
(preferred stock-class 1) 81,022 shares(preferred stock-class 2) 8,196 shares
For the year ended March 31, 2005: (common stock) 6,510,652 shares(preferred stock-class 1) 60,779 shares(preferred stock-class 2) 4,109 shares(preferred stock-class 3) 11,780 shares
3. Changes in accounting policy: No
Net income per common and common equivalent share
2005For the six months ended September 30,
Interim Consolidated Summary Report<under Japanese GAAP>
for the Fiscal Year Ending March 31, 2006
(Former company name : Mitsubishi Tokyo Financial Group, Inc.)
(2) Financial condition (in millions of yen except per share data and percentages)
For the year ended 2005 March 31, 2005
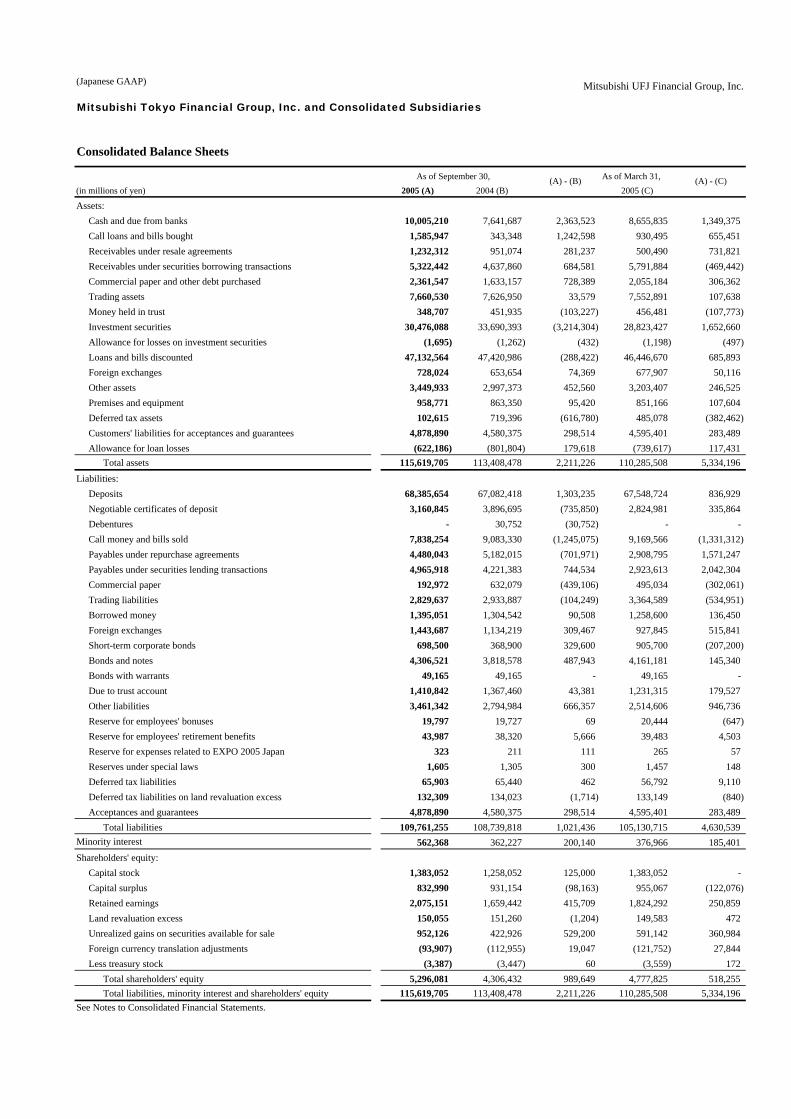
Total assets 115,619,705 110,285,508
Shareholders' equity 5,296,081 4,777,825
4.6 % 4.3 %
Shareholders' equity per common share 771,314.08 673,512.65
12.01 % 11.76 %
Note:Number of shares outstanding as of:
September 30, 2005: (common stock) 6,538,298 shares(preferred stock-class 3) 100,000 shares
September 30, 2004: (common stock) 6,516,155 shares(preferred stock-class 1) 81,022 shares
March 31, 2005: (common stock) 6,538,751 shares(preferred stock-class 1) 40,482 shares(preferred stock-class 3) 100,000 shares
(3) Cash flows (in millions of yen)For the year ended
2005 March 31, 2005
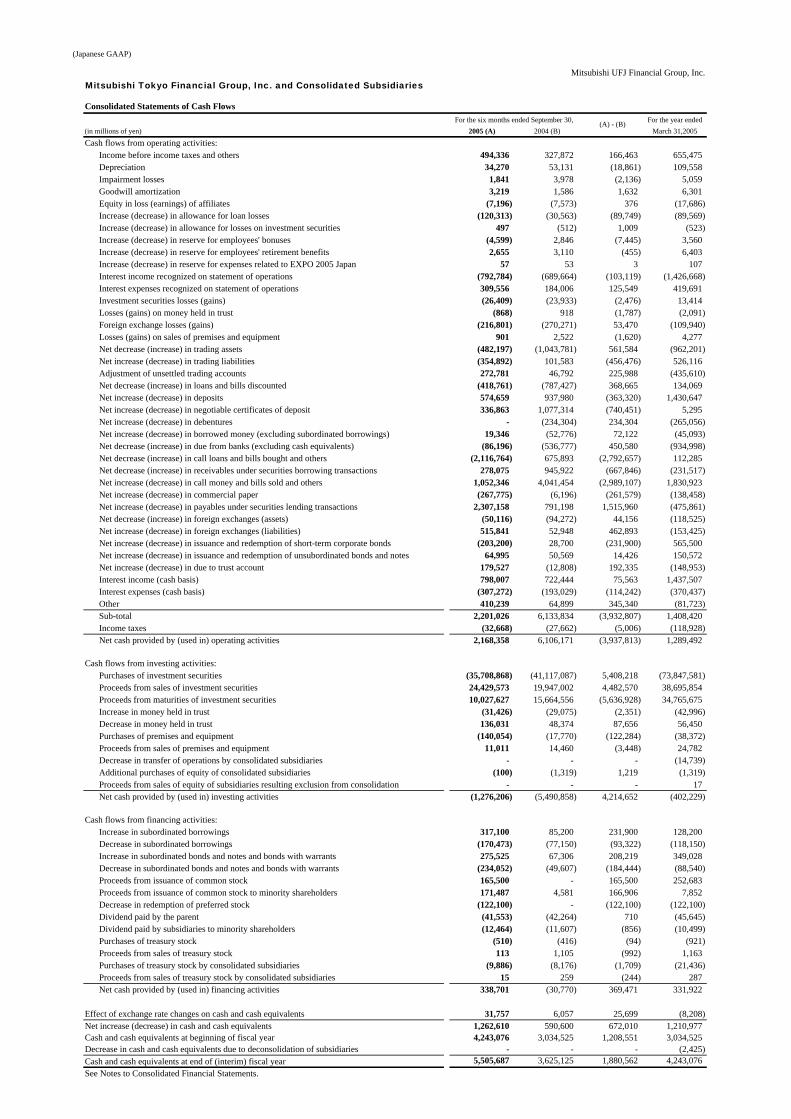
Net cash provided by operating activities 2,168,358 1,289,492
Net cash provided by (used in) investing activities (1,276,206) (402,229)
Net cash provided by (used in) financing activities 338,701 331,922
Cash and cash equivalents at end of (interim) fiscal year 5,505,687 4,243,076
(4) Scope of consolidation and application of the equity method
Consolidated subsidiaries: 152 Affiliated companies accounted for by the equity method: 23
(5) Change in the scope of consolidation and application of the equity method
Consolidated subsidiaries: Newly included: 6 Excluded: 0 Affiliated companies accounted for by the equity method: Newly included: 1 Excluded: 3
2. Earning projections for the fiscal year ending March 31, 2006 (in millions of yen)
Ordinary income Ordinary profit
4,085,000 990,000
Projected net income per common share for the year ending March 31, 2006 (yen): 62,178.35
2004
For the six months ended September 30,
For the six months ended September 30,
Shareholders' equity as a percentage of total liabilities,minority interest and shareholders' equity
Risk-adjusted capital ratio (based on the standards of the Bankfor International Settlements, the "BIS")
(5,490,858)
(30,770)
3,625,125
Net income
520,000
2004
113,408,478
4,306,432
3.8 %
623,070.24
10.92 %
6,106,171
(preliminarybasis)
(Reference)
Formulas for computing ratios for the six months ended September 30, 2005 are as follows.
Net income per common share
Net income per common and common equivalent share
Shareholders' equity per common share
Formula for computing projected earning ratio for the fiscal year ending March 31, 2006 is as follows.
Projected net income per common share
Projected net income - Projected total dividends on preferred stockProjected average number of common stock for the fiscal year *
* excluding treasury stock ** number of preferred stock at end of period × issue price + total dividends on preferred stock
This financial summary report and the accompanying financial highlights contain forward-looking statements and other forward-looking information relating to the company and/or the group as a whole (the “forward-looking statements”). The forward-looking statements are not historical facts and include, reflect or are otherwise based upon, among other things, the company’s current estimations, projections, views, policies, business strategies, targets, expectations, assumptions and evaluations with respect to general economic conditions, its results of operations, its financial condition, its management in general and other future events. Accordingly, they are inherently susceptible to uncertainties, risks and changes in circumstances and are not guarantees of future performance.Some forward-looking statements represent targets that the company’s management will strive to achieve through the successful implementation of the company’s business strategies. The company may not be successful in implementing its business strategy, and actual results may differ materially, for a wide range of possible reasons. In particular, the targets of the combined entity reflect assumptions about the successful implementation of the integration plan. Other forward-looking statements reflect the assumptions and estimations upon which the calculation of deferred tax assets has been based and are themselves subject to the full range of uncertainties, risks and changes in circumstances outlined above.In light of the many risks, uncertainties and possible changes, you are advised not to put undue reliance on the forward-looking statements. The company is under no obligation – and expressly disclaims any obligation – to update or alter the forward-looking statements, except as may be required by any applicable laws and regulations or stock exchange rules.For detailed information relating to uncertainties, risks and changes regarding the forward-looking statements, please see the company’s latest annual report and other disclosures.
Shareholders' equity at end of period - Deduction from shareholders' equity**Number of common stock at end of period *
Net income - Total dividends on preferred stockAverage number of common stock during the period *
Net income - Total dividends on preferred stock + Adjustments in net incomeAverage number of common stock during the period * + Common equivalent share
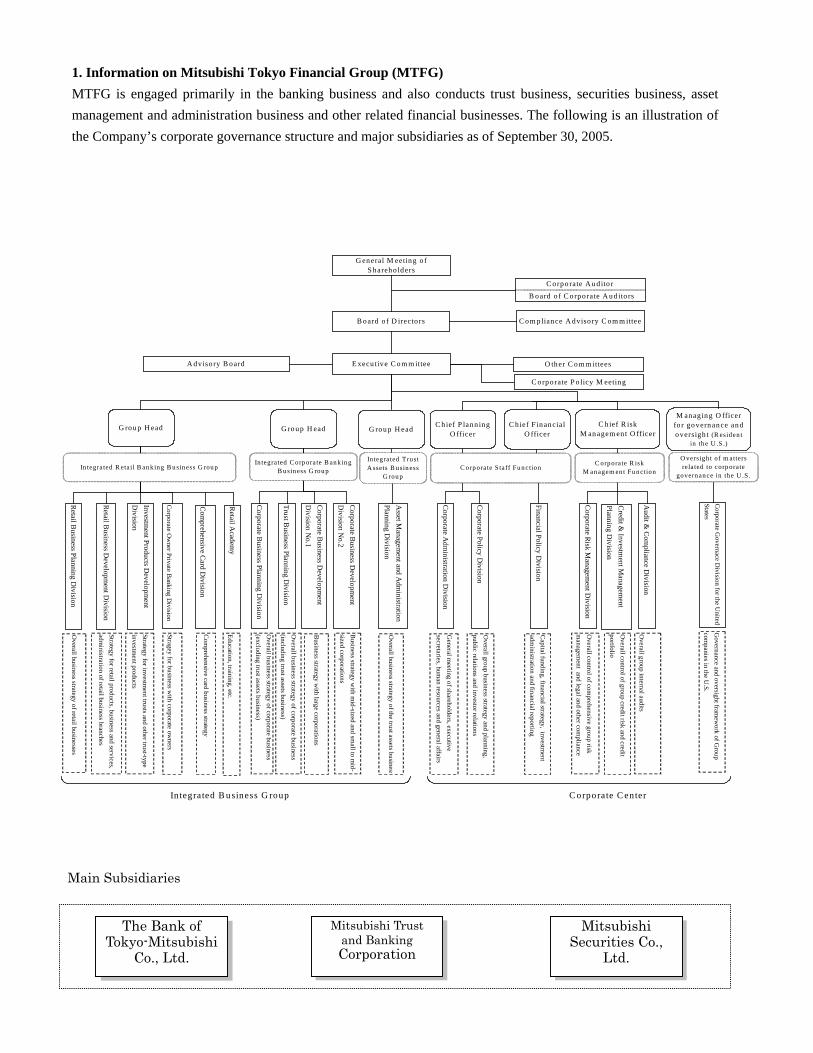
1. Information on Mitsubishi Tokyo Financial Group (MTFG) MTFG is engaged primarily in the banking business and also conducts trust business, securities business, asset management and administration business and other related financial businesses. The following is an illustration of the Company’s corporate governance structure and major subsidiaries as of September 30, 2005.
A ppend ix 1 : N ew organ iza tion chart
M itsub ish i T okyo F inancia l G roup O rganization C hart (as o f June 29 , 2005)
C orporate A ud ito r
B oard o f C orpo rate A ud ito rs
C om pliance A dviso ry C om m ittee
G eneral M eeting o fS hareho lders
B oard o f D irecto rs
E xecu tive C om m itteeA dviso ry B oard
C orpo rate P o licy M eeting
O ther C om m ittees
C orpora te S taff Function
In tegra ted B usiness G roup C orpora te C enter
Overall business strategy of retail businesses
Overall business strategy of the trust assets business
Strategy for retail products, business and services,adm
inistration of retail business branches
Strategy for investment trusts and other trust-type
investment products
Com
prehensive card business strategy
Education, training, etc.
Overall business strategy of corporate business
(excluding trust assets business)
Overall business strategy of corporate business
(including trust assets business)
Business strategy w
ith large corporations
Business strategy w
ith mid-sized and sm
all to mid-
sized corporations
Capital funding, financial strategy, investm
entadm
inistration and financial reporting
General m
eeting of shareholders, executivesecretaries, hum
an resources and general affairs
Overall group business strategy and planning,
public relations and investor relations
Overall group internal audits
Overall control of com
prehensive group riskm
anagement and legal and other com
pliance
Overall control of group credit risk and credit
portfolio
Retail B
usiness Planning Division
Retail B
usiness Developm
ent Division
Investment Products D
evelopment
Division
Asset M
anagement and A
dministration
Planning Division
Corporate B
usiness Planning Division
Trust Business Planning D
ivision
Corporate B
usiness Developm
entD
ivision No.2
Corporate B
usiness Developm
entD
ivision No.1
Com
prehensive Card D
ivision
Retail A
cademy
Financial Policy Division
Corporate A
dministration D
ivision
Corporate Policy D
ivision
Corporate R
isk Managem
ent Division
Credit &
Investment M
anagement
Planning Division
Audit &
Com
pliance Division
C orpora te R iskM anagem en t Function
G roup H ead C h ief F inancialO fficer
C h ief P lann ingO fficer
C h ief R iskM anagem en t O fficer
G roup H ead G roup H ead
In tegra ted T rustA ssets B usiness
G roupIn tegra ted R eta il B ank ing B usiness G roup
In tegrated C orpora te B ank ingB usiness G roup
Corporate O
wner Private B
anking Division
Stragey for business with corporate ow
ners
M anaging O fficerfo r governance andoversigh t (R esiden t
in the U .S .)
O versigh t of m attersrela ted to corporate
governance in the U .S .
Corporate G
overnace Division for the U
nitedStates
Governance and oversight fram
ework of G
roupcom
panies in the U.S.
Main Subsidiaries
Mitsubishi Securities Co.,
Ltd.
Mitsubishi Trust and Banking Corporation
The Bank of Tokyo-Mitsubishi
Co., Ltd.
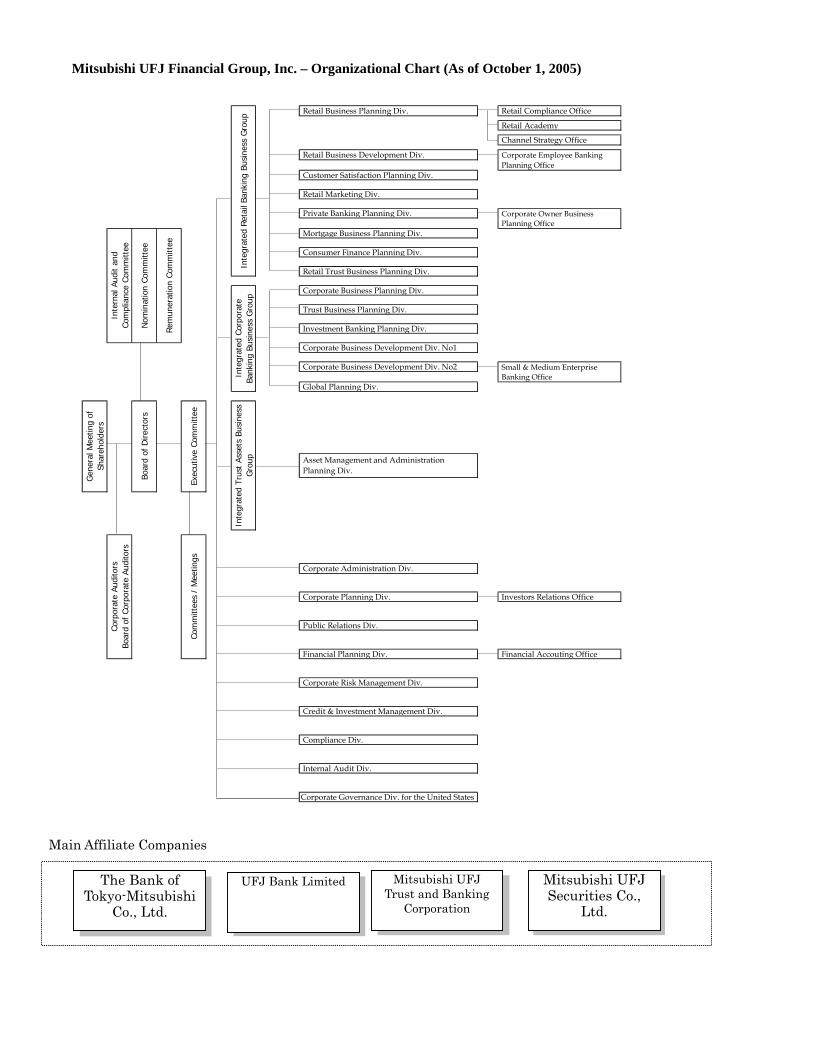
Mitsubishi UFJ Financial Group, Inc. – Organizational Chart (As of October 1, 2005)
Retail Business Planning Div. Retail Compliance Office
Retail Academy
Channel Strategy Office
Retail Business Development Div.
Customer Satisfaction Planning Div.
Retail Marketing Div.
Private Banking Planning Div.
Mortgage Business Planning Div.
Consumer Finance Planning Div.
Retail Trust Business Planning Div.
Corporate Business Planning Div.
Trust Business Planning Div.
Investment Banking Planning Div.
Corporate Business Development Div. No1
Corporate Business Development Div. No2
Global Planning Div.
Corporate Administration Div.
Corporate Planning Div. Investors Relations Office
Public Relations Div.
Financial Planning Div. Financial Accouting Office
Corporate Risk Management Div.
Credit & Investment Management Div.
Compliance Div.
Internal Audit Div.
Corporate Governance Div. for the United States
Com
mitt
ees
/ M
eetin
gs
Boar
d of
Dire
ctor
s
Inte
rnal
Aud
it an
dCo
mpl
ianc
e Co
mm
ittee
Gen
eral
Mee
ting
ofSh
areh
olde
rs
Corp
orat
e Au
dito
rsBo
ard
of C
orpo
rate
Aud
itors
Nom
inat
ion
Com
mitt
ee
Inte
grat
ed C
orpo
rate
Bank
ing
Busi
ness
Gro
upIn
tegr
ated
Tru
st A
sset
s Bu
sine
ssG
roup
Rem
uner
atio
n Co
mm
ittee
Exec
utiv
e Co
mm
ittee
Inte
grat
ed R
etai
l Ban
king
Bus
ines
s G
roup
Corporate Employee Banking Planning Office
Corporate Owner Business Planning Office
Small & Medium Enterprise Banking Office
Asset Management and Administration Planning Div.
The Bank of Tokyo-Mitsubishi
Co., Ltd.
Mitsubishi UFJ Securities Co.,
Ltd.
Mitsubishi UFJ Trust and Banking
Corporation
Main Affiliate Companies
UFJ Bank Limited
2. Management Policy (1) Principal management policy
The group’s management philosophy serves as the basic policy in conducting its business activities, and will provide guidelines for all group activities.
The group’s management philosophy will also be the foundation for management decisions, including the formulation of management strategies and management plans, and will serve as the core values for all employees.
The details of the group management philosophy are set forth below. The group’s holding company, commercial bank, trust bank and securities company will adopt the group’s management philosophy as their own respective management philosophy, and the entire group will strive to comply with this philosophy. Group’s Management Philosophy 1. We will respond promptly and accurately to the diverse needs of our customers around the world and seek to inspire
their trust and confidence. 2. We will offer innovative and high-quality financial services by actively pursuing the cultivation of new business
areas and developing new technologies. 3. We will comply strictly with all laws and regulations and conduct our business in a fair and transparent manner to
gain the public’s trust and confidence. 4. We will seek to inspire the trust of our shareholders by enhancing corporate value through continuous business
development and appropriate risk management, and by disclosing corporate information in a timely and appropriate manner.
5. We will contribute to progress toward a sustainable society by assisting with development in the areas in which we operate and conducting our business activities with consideration for the environment.
6. We will provide the opportunities and work environment necessary for all employees to enhance their expertise and make full use of their abilities.
(2) Basic policy regarding profit distribution Given the public nature of a bank holding company, it is the Company’s policy to endeavor to maintain stable dividends while improving the Company’s overall strength in order to bolster its financial health and continued sound management. With respect to interim dividends for the six months ended September 30, 2005, the Company has decided to pay ¥3,000 per share for common stock and ¥30,000 per share for class 3 preferred stock. With respect to fiscal year end dividends for the fiscal year ending March 31, 2006, the Company plans to pay ¥3,000 per share for common stock (which, together with the interim dividend, shall result in a total of ¥6,000 per share for the fiscal year ending March 31, 2006) and ¥30,000 per share for class 3 preferred stock (which, together with the interim dividend, shall result in a total of ¥60,000 per share for the fiscal year ending March 31, 2006).
(3) Basic policy relating to the possible lowering of the minimum investment amount With regard to the possible lowering of the minimum investment amount of the Company’s common stock, the Company does not believe that it needs to make any actions immediately, after taking into account such factors as the stock price, the number of shareholders, liquidity issues and the transaction costs and potential benefits. The Company, however, will continue to consider, as appropriate, the possibility of lowering the minimum purchase price while taking into account investor needs and the above-described factors. (4) Management targets
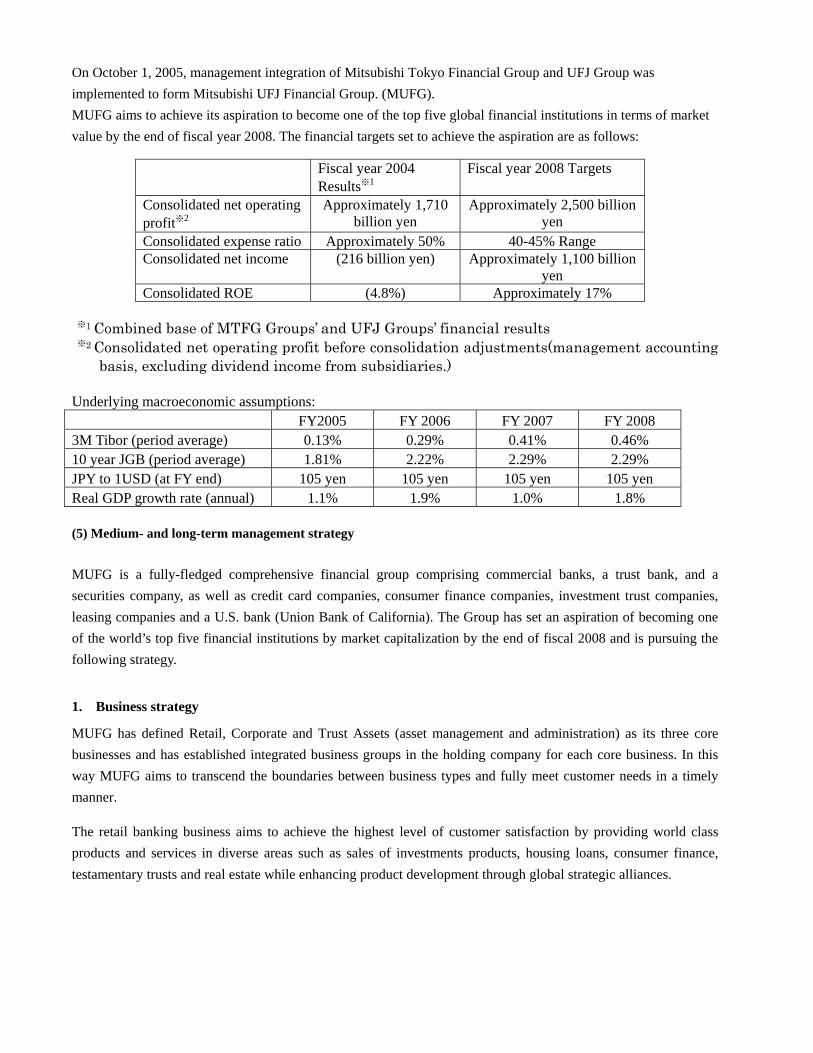
On October 1, 2005, management integration of Mitsubishi Tokyo Financial Group and UFJ Group was implemented to form Mitsubishi UFJ Financial Group. (MUFG). MUFG aims to achieve its aspiration to become one of the top five global financial institutions in terms of market value by the end of fiscal year 2008. The financial targets set to achieve the aspiration are as follows:
Fiscal year 2004 Results※1
Fiscal year 2008 Targets
Consolidated net operating profit※2
Approximately 1,710 billion yen
Approximately 2,500 billion yen
Consolidated expense ratio Approximately 50% 40-45% Range Consolidated net income (216 billion yen) Approximately 1,100 billion
yen Consolidated ROE (4.8%) Approximately 17%
※1 Combined base of MTFG Groups’ and UFJ Groups’ financial results ※2 Consolidated net operating profit before consolidation adjustments(management accounting
basis, excluding dividend income from subsidiaries.) Underlying macroeconomic assumptions: FY2005 FY 2006 FY 2007 FY 2008 3M Tibor (period average) 0.13% 0.29% 0.41% 0.46% 10 year JGB (period average) 1.81% 2.22% 2.29% 2.29% JPY to 1USD (at FY end) 105 yen 105 yen 105 yen 105 yen Real GDP growth rate (annual) 1.1% 1.9% 1.0% 1.8% (5) Medium- and long-term management strategy MUFG is a fully-fledged comprehensive financial group comprising commercial banks, a trust bank, and a securities company, as well as credit card companies, consumer finance companies, investment trust companies, leasing companies and a U.S. bank (Union Bank of California). The Group has set an aspiration of becoming one of the world’s top five financial institutions by market capitalization by the end of fiscal 2008 and is pursuing the following strategy. 1. Business strategy
MUFG has defined Retail, Corporate and Trust Assets (asset management and administration) as its three core businesses and has established integrated business groups in the holding company for each core business. In this way MUFG aims to transcend the boundaries between business types and fully meet customer needs in a timely manner.
The retail banking business aims to achieve the highest level of customer satisfaction by providing world class products and services in diverse areas such as sales of investments products, housing loans, consumer finance, testamentary trusts and real estate while enhancing product development through global strategic alliances.
The corporate banking business aims to provide top-quality services and innovative products through a broad-ranging and global operational network comprising banking, trust banking and securities business and aims to secure a clear lead as the No.1 financial services provider to Japanese companies in Japan and overseas.
The trust assets business will aim to enhance its product lineup in both asset management and asset administration, and provide full-line services to meet all types of customer needs based on an efficient system that leverages economies of scale.
2. Integration benefits (Pursuing efficiency)
By steadily pursuing the integration of its businesses and systems MUFG aims to rapidly realize efficiency benefits, including cost reductions, while also pursuing efficiency as a consolidated Group through allocation of resources within the Group and management and sourcing of funds in the most appropriate way.
3. Delivering value to customers and to society
In the first article of its Management Philosophy the Group states, 'We will respond promptly and accurately to the diverse needs of our customers around the world and seek to inspire their trust and confidence'. This customer-focused management approach forms the basis of all our activities.
In addition, we have identified the entrustment to the next generation of a better society and environment as the Group's social responsibility. Through responding to the trust placed in us by customers and shareholders, we will seek to continuously raise corporate value.
4. Strengthening of internal controls
As a leading comprehensive financial services group comprising diverse Group companies and as the world's largest by assets, MUFG is pursuing a significant strengthening of its internal control framework. Specifically, to prevent inaccurate financial reporting and to ensure thorough compliance with the law throughout the Group, we will create an internal control framework based on the COSO* framework. Furthermore, as a New York Stock Exchange listed company, the Group will comply with the U.S. Sarbanes-Oxley Act of 2002 and the standards of the SEC, and establish and maintain a sophisticated internal control and risk management framework that meets the criteria of the new BIS regulations. Furthermore the Balanced Score Card (BSC) will be introduced as a management administration tool in order to improve the monitoring of business strategy execution.
(*) “COSO” is the abbreviation for the Committee of Sponsoring Organizations of the Treadway Commission, which was established in 1985 sponsored by the American Institute of Certified Public Accountants and other organizations. COSO also refers to the internal control framework proposed by the Committee of Sponsoring Organizations of the Treadway Commission. As a standard framework, it has had significant influence on the financial inspection methods of government entities in various countries. In September 2004, COSO expanded the structural elements of internal control systems (first announced in 1992) and also released a more refined COSO ERM (COSO Enterprise Risk Management Framework).
By mobilizing the comprehensive strengths of the Group to execute the strategy described above, we will seek to realize our aspiration. We aim to create new value, and thus maximize corporate value, by delivering high quality and diverse comprehensive financial services to customers faster and in a more integrated way.
(6) Issues facing the company MUFG was formed on October 1, 2005 through the merger of MTFG and UFJ Holdings. The new Group will pursue a thoroughly customer-focused approach, and aim to win the strong support of customers as a comprehensive financial group, and realize its target of joining the global top five. Under the integrated business group system, through product development strengths backed by strategic global business alliances, the Retail business will aim to provide global standard products and services in Japan and meet customers diverse needs. Specifically, while focusing on investment products, loans, consumer finance, and inheritance and real estate business we will also develop integrated retail sales outlets that combine banking, trust and securities services in a single location. In the Corporate business, based on a full-line business base including banking, trust banking, securities, and global business we will provide the highest quality service and deliver innovative products. Specifically, for large corporate customers we will provide practical and timely solutions to their business issues, for medium-sized corporates we will aim to promote IPOs and business-matching services, etc., and for small- to medium-sized corporates we aim to further enhance our simple and rapid screening model in order to provide standardized and efficient small scale financing that is advantageous to them. In the Trust Assets business, in both asset management and asset administration, we will aim to strengthen our product line-up and provide a full-line service, leveraging scale merits to provide an efficient system that can meet all types of customer requirements. At the same time, the new group, as the world’s largest by assets and with its diverse array of subsidiaries, will establish a stable and effective system of corporate governance in order to achieve sound and appropriate management. Specifically, in order to improve transparency and fulfill its duty of accountability to shareholders more precisely and fully, based on a system of a Board of Directors and Board of Corporate Auditors, the new holding company has introduced a voluntary committee system and Advisory Board and strengthened oversight of the Group from an outside viewpoint. With respect to the governance of the entire group we will establish a Group-wide risk management and internal audit systems, strengthen the supervision of our main subsidiaries for example by the dispatch of board members, and create a governance system. The new Group aims to create a premier, comprehensive, global financial group that can grow corporate value while competing and succeeding on the global stage. (7) Corporate governance principles and status of implementation of corporate governance measures Corporate Governance Principles As described above, the Group’s management philosophy serves as the basic policy that provides the foundation for the formulation of management strategies and management decision making. In addition MUFG has formulated a Code of Ethics that embody the common values and ethical principles of the Group, and provide a set of conduct guidelines to be reflected in business activity.

In order to realize the precepts of MUFG’s Management Philosophy and Code of Ethics the Group is implementing strong corporate governance. MUFG Code of Ethics 1. Establishment of trust We will remain keenly aware of the Group’s social responsibilities and public mission and will exercise care and responsibility in the handling of customer and other information. By conducting sound and appropriate business operations and disclosing corporate information in a timely and appropriate manner we will seek to establish enduring public trust in the Group.
2. Putting customers first We will always consider our customers, and through close communication will endeavor to satisfy them and gain their support by providing financial services that best meet their needs. 3. Strict observance of laws, regulations, and internal rules We will strictly observe applicable laws, regulations and internal rules, and will conduct our business in a fair and trustworthy manner that conforms to societal norms. As a global comprehensive financial group we will also respect internationally accepted standards. 4. Respect for human rights and the environment We will respect the character and individuality of others, work to maintain harmony with society, and place due importance on the protection of the global environment that belongs to all mankind. 5. Disavowal of anti-social elements We will stand resolutely against any anti-social elements that threaten public order and safety.
Status of implementation of corporate governance measures
MUFG aims to create a system of corporate governance that is appropriate to a premier, comprehensive, global financial group. 1. Governance functions of the holding company Based on a system comprising corporate auditors and directors, the holding company (MUFG) has enhanced the role of external viewpoints in its governance and has introduced a voluntary committee system in order to establish stable and effective corporate governance. (1) Appointment of outside directors and establishment of voluntary committees
We have appointed several outside directors to the Board of Directors. Furthermore, as a measure to enhance supervision of management, we have introduced a voluntary system of board committees comprised mainly of outside members and chaired by an outside director, such as the Internal Audit and Compliance Committee, the Nomination Committee and the Compensation Committee.
(2) Appointment of a majority of outsiders to the Board of Corporate Auditors We have appointed three outside corporate auditors such that the Board of Corporate Auditors comprises a majority of outside corporate auditors.
(3) Establishment of an Advisory Board The Advisory Board is composed of external experts and, from an independent perspective, advises the Executive Committee on important management topics such as corporate strategy and business planning.
2. Governance functions of the commercial bank and trust bank Internal audit and compliance committees composed of a majority of outside members have also been set up in the Group's commercial bank* and trust bank. These committees deliberate on matters relating to internal audit and compliance, and report them to Internal Audit and Compliance Committee of the holding company.
* Bank of Tokyo-Mitsubishi UFJ”, which is scheduled to be established on January 1, 2006. 3. Governance system of the whole Group (see charts) The holding company also aims to develop its group-wide corporate governance structure by implementing group-wide risk management and internal audit systems, and by promoting strengthened supervision of management, for example by dispatching senior management to its major subsidiaries.

Appendix 1
Corporate Governance Structure of the New Holding Company and the New Bank
…Highlighted bodies include outside members
*
New Holding Company
New Bank
General Meeting of Shareholders
Board of Directors
Executive Committee
President & CEO
Corporate Auditors/Board of Corporate Auditors
Remuneration Committee
Nomination Committee
Internal Audit and Compliance Committee
Advisory Board
Senior Management
Senior Management
CAO
Integrated Business Group
InternalAudit Unit Audit
Corporate Auditors' Staff
Report
General Meeting of Shareholders
Board of Directors
Corporate Auditors/Board of Corporate Auditors
Internal Audit and Compliance Committee
Executive Committee
President
Operating Units
Senior Management
Senior Management
CAO
Corporate Staff Units
Internal Audit Unit
Audit
Report
Report
Corporate Auditors' Staff
Compliance Panel
Senior Management
Corporate Risk Management
Units
Corporate Staff Units
Senior Management
Corporate Risk Management
Units
Shareholders
Chairman of the Board
Chairman of the Board
Information Security Panel
Risk Management Committee, etc.
Corporate Risk Management Committee, etc.
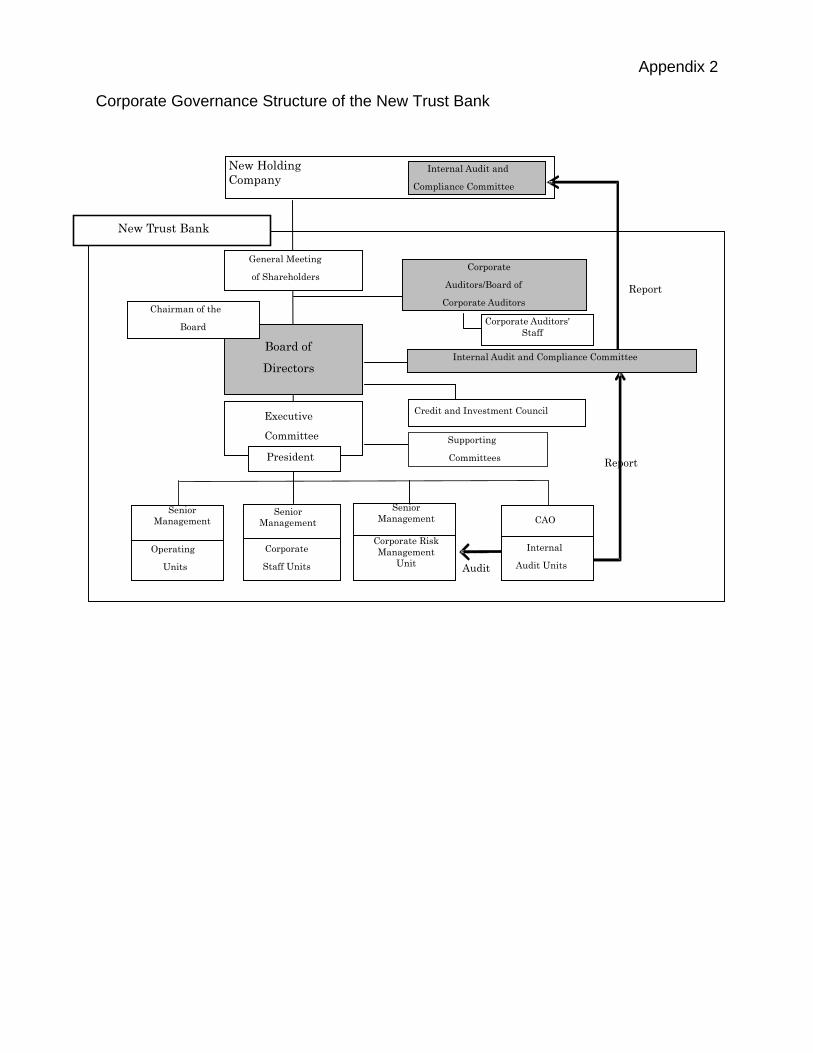
Appendix 2
Corporate Governance Structure of the New Trust Bank
New Trust Bank
General Meeting of Shareholders
Board of
Directors
Corporate Auditors/Board of
Corporate Auditors
Executive Committee
President
Operating Units
CAO
Internal
Audit Units Audit
Report
Report
Corporate Auditors' Staff
Corporate Staff Units
Senior Management
Corporate Risk Management
Unit
Chairman of the Board
Supporting Committees
Credit and Investment Council
New Holding Company
Internal Audit and Compliance Committee
Internal Audit and Compliance Committee
Senior Management
Senior Management
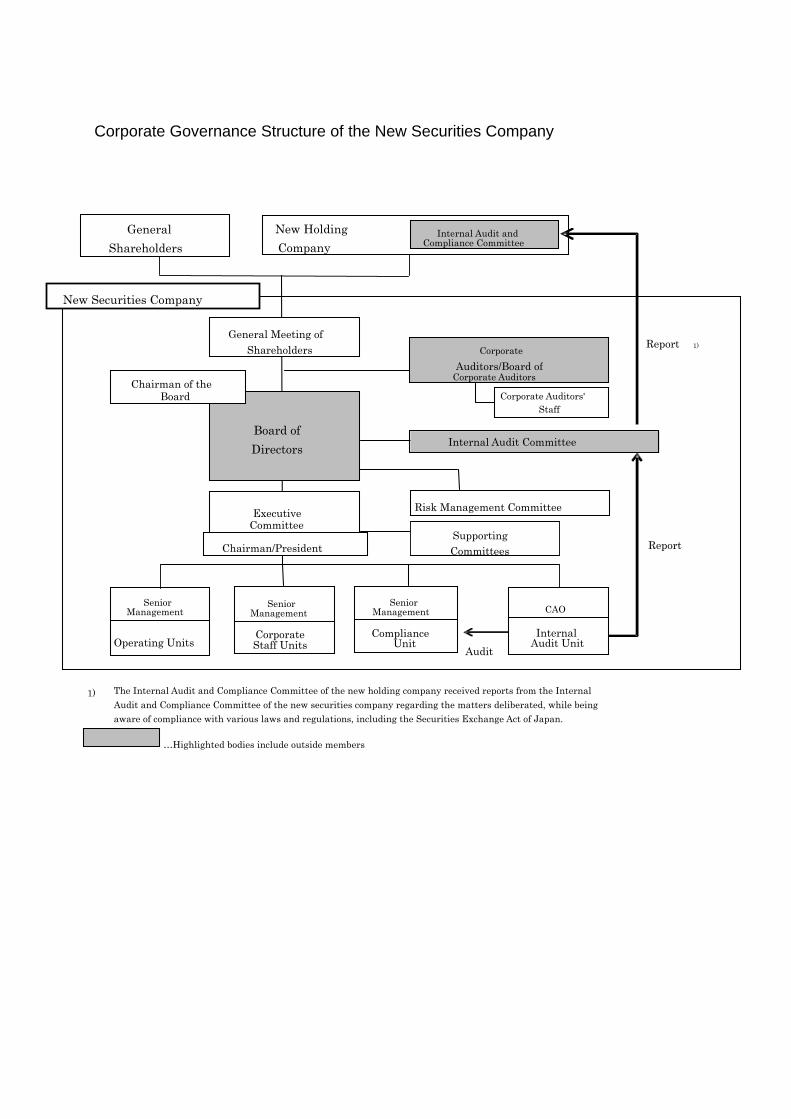
Corporate Governance Structure of the New Securities Company
1)
1)
…Highlighted bodies include outside members
The Internal Audit and Compliance Committee of the new holding company received reports from the Internal Audit and Compliance Committee of the new securities company regarding the matters deliberated, while being aware of compliance with various laws and regulations, including the Securities Exchange Act of Japan.
New Securities Company
General Meeting of Shareholders
Board of Directors
Corporate Auditors/Board of
Corporate Auditors
Internal Audit Committee
Executive Committee
Chairman/President
Operating Units
Senior Management CAO
Internal Audit Unit
Audit
Report
Corporate Auditors' Staff
General Shareholders
Risk Management Committee
Senior Management
Corporate Staff Units
Senior Management
Compliance Unit
Chairman of the Board
Supporting Committees
Report
New Holding Company
Internal Audit and Compliance Committee
3. Results of Operations and Financial Condition
(1) Results of operations
With respect to the financial and economic environment for the fiscal year ended September 30, 2005,
overseas economies generally remained strong. The US economy steadily expanded even though the rise in
crude oil prices and the onslaught of the hurricane had some negative effects on the economy. The Chinese
economy continued its high growth, mainly led by increases in investments and exports.
In Japan, our economy has taken steps towards recovery during the first part of the current fiscal year. This
can be seen in the increase in capital expenditures, the steady rise in private consumption due to
improvements in the job market and personal income, and the increase in exports due to worldwide
advancement in inventory adjustment. Meanwhile, the level of decline in consumer prices was much
smaller than previous periods.
Regarding the financial environment, in the EU, the European Central Bank's policy rate remained at 2%.
In the United States, the target for the federal funds rate was raised from 2.75% to 3.75%. In Japan, the
Bank of Japan continued its current easy monetary policy and kept short-term interest rates at near zero
percent. On the other hand, the long-term interest rate in Japan declined temporarily before rising to new
levels due to market expectations regarding an end to deflation and a change in the current easy monetary
policy. In the foreign exchange markets, the yen depreciated against the US dollar due to the rising US
interest rates environment during the fiscal year ended September 30, 2005.
Amidst this economic environment, net income for the six months ended September 30, 2005 was ¥300.6
billion, an increase of ¥129.0 billion from the six months ended September 30, 2004. This increase was
primarily due to the following factors. The first factor was a ¥116.3 billion decrease in total credit costs,
from ¥56.3 billion in total credit costs for the six months ended September 30, 2004 to ¥59.9 billion
reversal of total credit costs for the six months ended September 30, 2005. The second factor was a ¥36.4
billion increase in net business profits before credit costs for trust accounts and provision for formula
allowance for loan losses, from ¥388.9 billion for the six months ended September 30, 2004 to ¥425.3
billion for the six months ended September 30, 2005. The third factor was an increase in special gains of
¥95.6 billion due to the reversal of our allowance for credit losses, from ¥17.5 billion for the six months
ended September 30, 2004 to ¥113.1 billion for the six months ended September 30, 2005.
Ordinary profit by business segment was ¥293.0 billion for the banking segment, ¥63.4 billion for the trust
banking segment and ¥16.0 billion for the securities segment. Ordinary profit (loss) by geographic segment
was ¥304.1 billion in Japan, ¥66.4 billion in North America, ¥1.8 billion in Europe and the Middle East,
¥17.3 billion in Asia and Oceania excluding Japan, and an ordinary loss of ¥0.6 billion in Latin America.
The Company has the following earning projections for the fiscal year ending March 31, 2006. Consolidated ordinary income Consolidated ordinary profit Consolidated net income
¥4,085,000 million ¥990,000 million ¥520,000 million *The aggregate amount of Mitsubishi Tokyo Financial Group, inc.’s operating results (from April to September for the fiscal year ending March 31, 2006) and Mitsubishi UFJ Financial Group, inc.’s projected earnings (from October to March for the fiscal year ending March 31, 2006 )
(Reference) 1. Projected net income per common share (consolidated) ¥62,178.35 2. Projected net income per common share (non-consolidated) ¥121,223.30 3. Projected dividend per share (non-consolidated) Common stock ¥6,000
Preferred stock-class3 ¥60,000 Preferred stock-class8 ¥15,900 Preferred stock-class9 ¥18,600
Preferred stock-class10 ¥19,400 Preferred stock-class11 ¥5,300 Preferred stock-class12 ¥11,500
(2) Financial condition
Loans and bills discounted increased by ¥685.8 billion from ¥46,446.6 billion at March 31, 2005 to
¥47,132.5 billion at September 30, 2005. This change consisted mainly of a decrease of ¥397.9 billion in
domestic loans, an increase of ¥401.2 billion in loans made by overseas subsidiaries and an increase of
¥195.2 billion in domestic housing loans.
Investment securities increased by ¥1,652.6 billion, from ¥28,823.4 billion at March 31, 2005 to ¥30,476.0
billion at September 30, 2005.
Total shareholders’ equity increased by ¥518.2 billion, from ¥4,777.8 billion at March 31, 2005 to ¥5,296.0
billion at September 30, 2005.
For the six months ended September 30, 2005, net cash provided by operating activities was ¥2,168.3
billion, net cash used in investing activities was ¥1,276.2 billion and net cash used in financing activities
was ¥338.7 billion. As a result, the balance of cash and cash equivalents at September 30, 2005 was
¥5,505.6 billion.
The Company’s consolidated risk adjusted capital ratio (based on applicable regulatory standards) was
12.01% (preliminary basis) at September 30, 2005, an increase of 0.24% from March 31, 2005.
The following table shows the Company’s consolidated risk adjusted capital ratio at September 30, 2004,
March 31, 2005 and September 30, 2005.
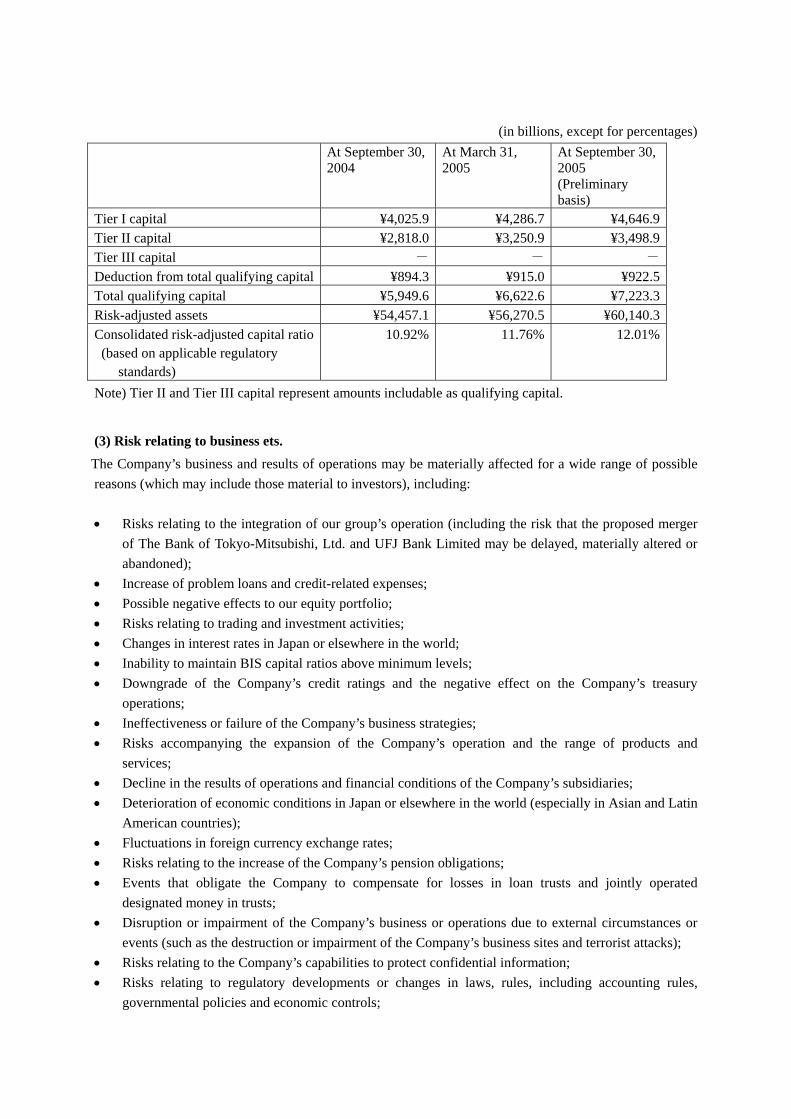
(in billions, except for percentages) At September 30,
2004 At March 31, 2005
At September 30, 2005 (Preliminary basis)
Tier I capital ¥4,025.9 ¥4,286.7 ¥4,646.9Tier II capital ¥2,818.0 ¥3,250.9 ¥3,498.9Tier III capital - - -
Deduction from total qualifying capital ¥894.3 ¥915.0 ¥922.5Total qualifying capital ¥5,949.6 ¥6,622.6 ¥7,223.3Risk-adjusted assets ¥54,457.1 ¥56,270.5 ¥60,140.3Consolidated risk-adjusted capital ratio (based on applicable regulatory
standards)
10.92% 11.76% 12.01%
Note) Tier II and Tier III capital represent amounts includable as qualifying capital.
(3) Risk relating to business ets. The Company’s business and results of operations may be materially affected for a wide range of possible reasons (which may include those material to investors), including: • Risks relating to the integration of our group’s operation (including the risk that the proposed merger
of The Bank of Tokyo-Mitsubishi, Ltd. and UFJ Bank Limited may be delayed, materially altered or abandoned);
• Increase of problem loans and credit-related expenses; • Possible negative effects to our equity portfolio; • Risks relating to trading and investment activities; • Changes in interest rates in Japan or elsewhere in the world; • Inability to maintain BIS capital ratios above minimum levels; • Downgrade of the Company’s credit ratings and the negative effect on the Company’s treasury
operations; • Ineffectiveness or failure of the Company’s business strategies; • Risks accompanying the expansion of the Company’s operation and the range of products and
services; • Decline in the results of operations and financial conditions of the Company’s subsidiaries; • Deterioration of economic conditions in Japan or elsewhere in the world (especially in Asian and Latin
American countries); • Fluctuations in foreign currency exchange rates; • Risks relating to the increase of the Company’s pension obligations; • Events that obligate the Company to compensate for losses in loan trusts and jointly operated
designated money in trusts; • Disruption or impairment of the Company’s business or operations due to external circumstances or
events (such as the destruction or impairment of the Company’s business sites and terrorist attacks); • Risks relating to the Company’s capabilities to protect confidential information; • Risks relating to regulatory developments or changes in laws, rules, including accounting rules,
governmental policies and economic controls;

• Increase in competitive pressures; • Risks inherent in the Company’s holding company structure; and • Possible negative effects related to owning our shares.
For a detailed discussion of these risks and other risks, uncertainties, possible changes and others, please see
the Company’s most recent public filings.
(Japanese GAAP) Mitsubishi UFJ Financial Group, Inc.
As of March 31,(in millions of yen) 2005 (A) 2004 (B) 2005 (C)
Assets:Cash and due from banks 10,005,210 7,641,687 2,363,523 8,655,835 1,349,375Call loans and bills bought 1,585,947 343,348 1,242,598 930,495 655,451Receivables under resale agreements 1,232,312 951,074 281,237 500,490 731,821Receivables under securities borrowing transactions 5,322,442 4,637,860 684,581 5,791,884 (469,442)Commercial paper and other debt purchased 2,361,547 1,633,157 728,389 2,055,184 306,362Trading assets 7,660,530 7,626,950 33,579 7,552,891 107,638Money held in trust 348,707 451,935 (103,227) 456,481 (107,773)Investment securities 30,476,088 33,690,393 (3,214,304) 28,823,427 1,652,660Allowance for losses on investment securities (1,695) (1,262) (432) (1,198) (497)Loans and bills discounted 47,132,564 47,420,986 (288,422) 46,446,670 685,893Foreign exchanges 728,024 653,654 74,369 677,907 50,116Other assets 3,449,933 2,997,373 452,560 3,203,407 246,525Premises and equipment 958,771 863,350 95,420 851,166 107,604Deferred tax assets 102,615 719,396 (616,780) 485,078 (382,462)Customers' liabilities for acceptances and guarantees 4,878,890 4,580,375 298,514 4,595,401 283,489Allowance for loan losses (622,186) (801,804) 179,618 (739,617) 117,431 Total assets 115,619,705 113,408,478 2,211,226 110,285,508 5,334,196
Liabilities:Deposits 68,385,654 67,082,418 1,303,235 67,548,724 836,929Negotiable certificates of deposit 3,160,845 3,896,695 (735,850) 2,824,981 335,864Debentures - 30,752 (30,752) - -Call money and bills sold 7,838,254 9,083,330 (1,245,075) 9,169,566 (1,331,312)Payables under repurchase agreements 4,480,043 5,182,015 (701,971) 2,908,795 1,571,247Payables under securities lending transactions 4,965,918 4,221,383 744,534 2,923,613 2,042,304Commercial paper 192,972 632,079 (439,106) 495,034 (302,061)Trading liabilities 2,829,637 2,933,887 (104,249) 3,364,589 (534,951)Borrowed money 1,395,051 1,304,542 90,508 1,258,600 136,450Foreign exchanges 1,443,687 1,134,219 309,467 927,845 515,841Short-term corporate bonds 698,500 368,900 329,600 905,700 (207,200)Bonds and notes 4,306,521 3,818,578 487,943 4,161,181 145,340Bonds with warrants 49,165 49,165 - 49,165 -Due to trust account 1,410,842 1,367,460 43,381 1,231,315 179,527Other liabilities 3,461,342 2,794,984 666,357 2,514,606 946,736Reserve for employees' bonuses 19,797 19,727 69 20,444 (647)Reserve for employees' retirement benefits 43,987 38,320 5,666 39,483 4,503Reserve for expenses related to EXPO 2005 Japan 323 211 111 265 57Reserves under special laws 1,605 1,305 300 1,457 148Deferred tax liabilities 65,903 65,440 462 56,792 9,110Deferred tax liabilities on land revaluation excess 132,309 134,023 (1,714) 133,149 (840)Acceptances and guarantees 4,878,890 4,580,375 298,514 4,595,401 283,489 Total liabilities 109,761,255 108,739,818 1,021,436 105,130,715 4,630,539
Minority interest 562,368 362,227 200,140 376,966 185,401Shareholders' equity:
Capital stock 1,383,052 1,258,052 125,000 1,383,052 -Capital surplus 832,990 931,154 (98,163) 955,067 (122,076)Retained earnings 2,075,151 1,659,442 415,709 1,824,292 250,859Land revaluation excess 150,055 151,260 (1,204) 149,583 472Unrealized gains on securities available for sale 952,126 422,926 529,200 591,142 360,984Foreign currency translation adjustments (93,907) (112,955) 19,047 (121,752) 27,844Less treasury stock (3,387) (3,447) 60 (3,559) 172 Total shareholders' equity 5,296,081 4,306,432 989,649 4,777,825 518,255 Total liabilities, minority interest and shareholders' equity 115,619,705 113,408,478 2,211,226 110,285,508 5,334,196
See Notes to Consolidated Financial Statements.
(A) - (C)As of September 30,
Consolidated Balance Sheets
Mitsubishi Tokyo Financial Group, Inc. and Consolidated Subsidiaries
(A) - (B)
(Japanese GAAP) Mitsubishi UFJ Financial Group, Inc.
For the year ended
(in millions of yen) 2005 (A) 2004 (B) March 31, 2005
Ordinary income:
Interest income:
Interest on loans and discounts 459,511 414,602 44,908 849,596
Interest and dividends on securities 181,572 165,661 15,910 350,725
Other interest income 151,701 109,401 42,299 226,346
Total interest income 792,784 689,664 103,119 1,426,668
Trust fees 41,089 46,115 (5,025) 100,959
Fees and commissions 296,861 273,568 23,293 567,954
Trading profits 66,643 51,609 15,033 126,712
Other business income 142,024 103,940 38,084 211,297
Other ordinary income 61,891 93,266 (31,374) 194,917
Total ordinary income 1,401,294 1,258,164 143,130 2,628,509
Ordinary expenses:
Interest expense:
Interest on deposits 154,557 87,029 67,528 198,454
Interest on debentures - 348 (348) 351
Other interest expense 154,998 96,628 58,369 220,886
Total interest expense 309,556 184,006 125,549 419,691
Fees and commissions 28,715 32,249 (3,534) 68,402
Trading losses - 1,362 (1,362) 1,385
Other business expenses 56,684 62,232 (5,547) 113,072
General and administrative expenses 553,795 526,211 27,583 1,046,421
Other ordinary expenses 71,390 141,793 (70,402) 386,245
Total ordinary expenses 1,020,142 947,857 72,285 2,035,218
Ordinary profit 381,152 310,306 70,845 593,291
Special gains:
Gains on sales of premises and equipment 704 2,584 (1,880) 5,037
Gains on loans charged-off 20,277 12,358 7,919 26,182
Reversal of allowance for loan losses 96,082 11,340 84,742 45,091
Other special gains 52 512 (460) 543
Total Special gains 117,117 26,795 90,321 76,855
Special losses:
Losses on sales of premises and equipment 1,943 5,107 (3,163) 9,314
Losses on impairment of fixed assets 1,841 3,978 (2,136) 5,059
Provision for reserve for contingent liabilities from brokering of securities transactions 148 144 3 296
Total Special losses 3,933 9,230 (5,296) 14,670
Income before income taxes and others 494,336 327,872 166,463 655,475
Income taxes-current 30,550 39,605 (9,054) 69,321
Income taxes-deferred 138,830 95,687 43,143 208,966
Minority interest 24,255 20,901 3,353 38,771
Net income 300,699 171,678 129,021 338,416
See Notes to Consolidated Financial Statements.
(A) - (B)For the six months ended September 30,
Mitsubishi Tokyo Financial Group, Inc. and Consolidated Subsidiaries
Consolidated Statements of Operations
(Japanese GAAP)Mitsubishi UFJ Financial Group, Inc.
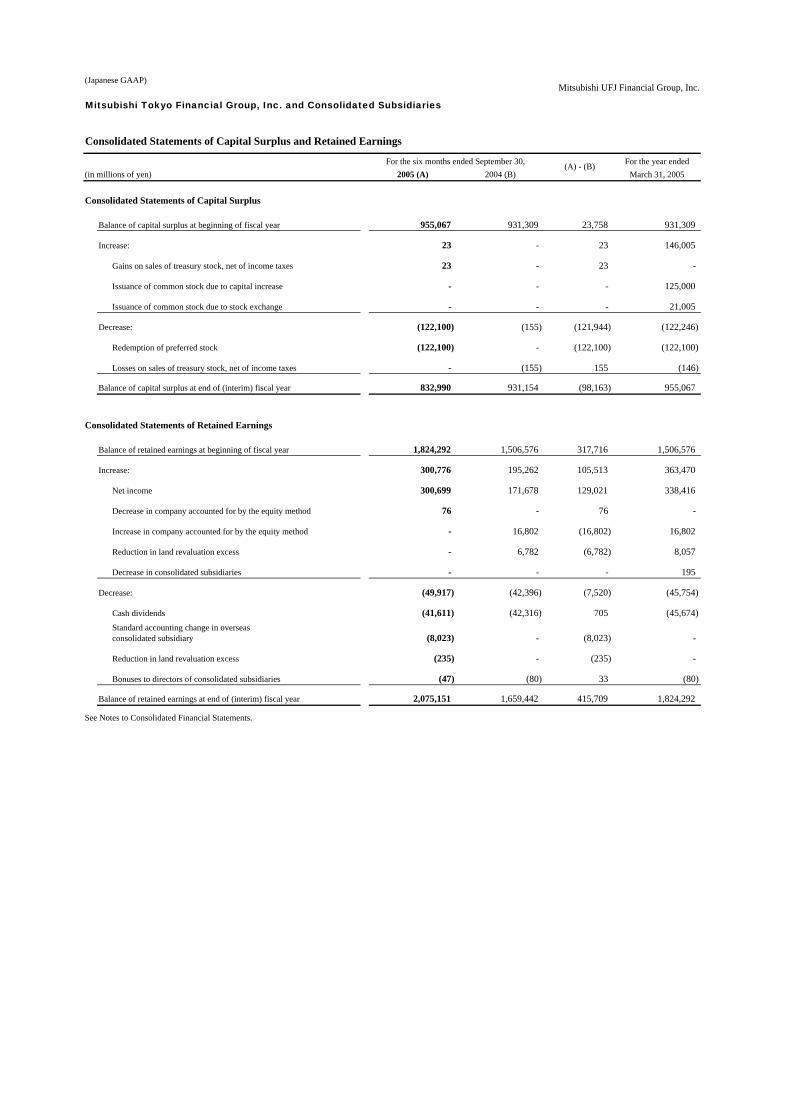
For the year ended(in millions of yen) 2005 (A) 2004 (B) March 31, 2005
Consolidated Statements of Capital Surplus
Balance of capital surplus at beginning of fiscal year 955,067 931,309 23,758 931,309
Increase: 23 - 23 146,005
Gains on sales of treasury stock, net of income taxes 23 - 23 -
Issuance of common stock due to capital increase - - - 125,000
Issuance of common stock due to stock exchange - - - 21,005
Decrease: (122,100) (155) (121,944) (122,246)
Redemption of preferred stock (122,100) - (122,100) (122,100)
Losses on sales of treasury stock, net of income taxes - (155) 155 (146)
Balance of capital surplus at end of (interim) fiscal year 832,990 931,154 (98,163) 955,067
Consolidated Statements of Retained Earnings
Balance of retained earnings at beginning of fiscal year 1,824,292 1,506,576 317,716 1,506,576
Increase: 300,776 195,262 105,513 363,470
Net income 300,699 171,678 129,021 338,416
Decrease in company accounted for by the equity method 76 - 76 -
Increase in company accounted for by the equity method - 16,802 (16,802) 16,802
Reduction in land revaluation excess - 6,782 (6,782) 8,057
Decrease in consolidated subsidiaries - - - 195
Decrease: (49,917) (42,396) (7,520) (45,754)
Cash dividends (41,611) (42,316) 705 (45,674)Standard accounting change in overseasconsolidated subsidiary (8,023) - (8,023) -
Reduction in land revaluation excess (235) - (235) -
Bonuses to directors of consolidated subsidiaries (47) (80) 33 (80)
Balance of retained earnings at end of (interim) fiscal year 2,075,151 1,659,442 415,709 1,824,292
See Notes to Consolidated Financial Statements.
Mitsubishi Tokyo Financial Group, Inc. and Consolidated Subsidiaries
(A) - (B)
Consolidated Statements of Capital Surplus and Retained Earnings
For the six months ended September 30,
(Japanese GAAP)
Mitsubishi UFJ Financial Group, Inc.Mitsubishi Tokyo Financial Group, Inc. and Consolidated Subsidiaries
Consolidated Statements of Cash FlowsFor the year ended
(in millions of yen) 2005 (A) 2004 (B) March 31,2005
Cash flows from operating activities:Income before income taxes and others 494,336 327,872 166,463 655,475Depreciation 34,270 53,131 (18,861) 109,558Impairment losses 1,841 3,978 (2,136) 5,059Goodwill amortization 3,219 1,586 1,632 6,301Equity in loss (earnings) of affiliates (7,196) (7,573) 376 (17,686)Increase (decrease) in allowance for loan losses (120,313) (30,563) (89,749) (89,569)Increase (decrease) in allowance for losses on investment securities 497 (512) 1,009 (523)Increase (decrease) in reserve for employees' bonuses (4,599) 2,846 (7,445) 3,560Increase (decrease) in reserve for employees' retirement benefits 2,655 3,110 (455) 6,403Increase (decrease) in reserve for expenses related to EXPO 2005 Japan 57 53 3 107Interest income recognized on statement of operations (792,784) (689,664) (103,119) (1,426,668)Interest expenses recognized on statement of operations 309,556 184,006 125,549 419,691Investment securities losses (gains) (26,409) (23,933) (2,476) 13,414Losses (gains) on money held in trust (868) 918 (1,787) (2,091)Foreign exchange losses (gains) (216,801) (270,271) 53,470 (109,940)Losses (gains) on sales of premises and equipment 901 2,522 (1,620) 4,277Net decrease (increase) in trading assets (482,197) (1,043,781) 561,584 (962,201)Net increase (decrease) in trading liabilities (354,892) 101,583 (456,476) 526,116Adjustment of unsettled trading accounts 272,781 46,792 225,988 (435,610)Net decrease (increase) in loans and bills discounted (418,761) (787,427) 368,665 134,069Net increase (decrease) in deposits 574,659 937,980 (363,320) 1,430,647Net increase (decrease) in negotiable certificates of deposit 336,863 1,077,314 (740,451) 5,295Net increase (decrease) in debentures - (234,304) 234,304 (265,056)Net increase (decrease) in borrowed money (excluding subordinated borrowings) 19,346 (52,776) 72,122 (45,093)Net decrease (increase) in due from banks (excluding cash equivalents) (86,196) (536,777) 450,580 (934,998)Net decrease (increase) in call loans and bills bought and others (2,116,764) 675,893 (2,792,657) 112,285Net decrease (increase) in receivables under securities borrowing transactions 278,075 945,922 (667,846) (231,517)Net increase (decrease) in call money and bills sold and others 1,052,346 4,041,454 (2,989,107) 1,830,923Net increase (decrease) in commercial paper (267,775) (6,196) (261,579) (138,458)Net increase (decrease) in payables under securities lending transactions 2,307,158 791,198 1,515,960 (475,861)Net decrease (increase) in foreign exchanges (assets) (50,116) (94,272) 44,156 (118,525)Net increase (decrease) in foreign exchanges (liabilities) 515,841 52,948 462,893 (153,425)Net increase (decrease) in issuance and redemption of short-term corporate bonds (203,200) 28,700 (231,900) 565,500Net increase (decrease) in issuance and redemption of unsubordinated bonds and notes 64,995 50,569 14,426 150,572Net increase (decrease) in due to trust account 179,527 (12,808) 192,335 (148,953)Interest income (cash basis) 798,007 722,444 75,563 1,437,507Interest expenses (cash basis) (307,272) (193,029) (114,242) (370,437)Other 410,239 64,899 345,340 (81,723)Sub-total 2,201,026 6,133,834 (3,932,807) 1,408,420Income taxes (32,668) (27,662) (5,006) (118,928)Net cash provided by (used in) operating activities 2,168,358 6,106,171 (3,937,813) 1,289,492
Cash flows from investing activities:Purchases of investment securities (35,708,868) (41,117,087) 5,408,218 (73,847,581)Proceeds from sales of investment securities 24,429,573 19,947,002 4,482,570 38,695,854Proceeds from maturities of investment securities 10,027,627 15,664,556 (5,636,928) 34,765,675Increase in money held in trust (31,426) (29,075) (2,351) (42,996)Decrease in money held in trust 136,031 48,374 87,656 56,450Purchases of premises and equipment (140,054) (17,770) (122,284) (38,372)Proceeds from sales of premises and equipment 11,011 14,460 (3,448) 24,782Decrease in transfer of operations by consolidated subsidiaries - - - (14,739)Additional purchases of equity of consolidated subsidiaries (100) (1,319) 1,219 (1,319)Proceeds from sales of equity of subsidiaries resulting exclusion from consolidation - - - 17Net cash provided by (used in) investing activities (1,276,206) (5,490,858) 4,214,652 (402,229)
Cash flows from financing activities:Increase in subordinated borrowings 317,100 85,200 231,900 128,200Decrease in subordinated borrowings (170,473) (77,150) (93,322) (118,150)Increase in subordinated bonds and notes and bonds with warrants 275,525 67,306 208,219 349,028Decrease in subordinated bonds and notes and bonds with warrants (234,052) (49,607) (184,444) (88,540)Proceeds from issuance of common stock 165,500 - 165,500 252,683Proceeds from issuance of common stock to minority shareholders 171,487 4,581 166,906 7,852Decrease in redemption of preferred stock (122,100) - (122,100) (122,100)Dividend paid by the parent (41,553) (42,264) 710 (45,645)Dividend paid by subsidiaries to minority shareholders (12,464) (11,607) (856) (10,499)Purchases of treasury stock (510) (416) (94) (921)Proceeds from sales of treasury stock 113 1,105 (992) 1,163Purchases of treasury stock by consolidated subsidiaries (9,886) (8,176) (1,709) (21,436)Proceeds from sales of treasury stock by consolidated subsidiaries 15 259 (244) 287Net cash provided by (used in) financing activities 338,701 (30,770) 369,471 331,922
Effect of exchange rate changes on cash and cash equivalents 31,757 6,057 25,699 (8,208)Net increase (decrease) in cash and cash equivalents 1,262,610 590,600 672,010 1,210,977Cash and cash equivalents at beginning of fiscal year 4,243,076 3,034,525 1,208,551 3,034,525Decrease in cash and cash equivalents due to deconsolidation of subsidiaries - - - (2,425)Cash and cash equivalents at end of (interim) fiscal year 5,505,687 3,625,125 1,880,562 4,243,076See Notes to Consolidated Financial Statements.
For the six months ended September 30, (A) - (B)
Notes to Consolidated Financial Statements
Notes related to the Consolidated Balance Sheet as of September 30, 2005 are as follows:
1. Basis of Presentation
The accompanying Consolidated Balance Sheet of Mitsubishi UFJ Financial Group, Inc. (“MUFG”). (The previous name was
Mitsubishi Tokyo Financial Group, Inc. (“MTFG”)) and its subsidiaries is compiled as required by the Banking Law and in
conformity with accounting principles generally accepted in Japan, which are different in certain respects as compared to the
application and disclosure requirements of International Accounting Standards. For the convenience of readers, the presentation is
modified in certain respects from the original Japanese report. The amounts are presented in millions of yen and are rounded down
to the nearest million.
2. Trading Assets and Liabilities
Transactions for trading purposes (for purposes of seeking to capture gains arising from short-term changes in interest rates,
currency exchange rates or market prices of securities and other market-related indices or from gaps among markets) are included
in Trading assets and Trading liabilities on a trade date basis.
Trading assets and Trading liabilities are stated at market value at interim fiscal year end.
3. Investment Securities
Debt securities being held to maturity are stated at amortized cost computed by the moving-average method (straight-line
amortization). Other securities (securities available for sale) whose current value can be estimated are stated at market value at
interim fiscal year end (sale cost is calculated by the moving-average method) and other non-marketable securities are stated at cost
or amortized cost computed by the moving-average method. Unrealized gains and losses on securities available for sale are
included in shareholders’ equity, net of income taxes, except in the case of securities with embedded derivatives, which are
measured at fair value in their entirety and with the change in fair value recognized in current earnings.
4. Securities in Money Held in Trust
Securities included in Money held in trust of sole investments mainly for the purpose of securities investments are stated at
the same method as described in notes 2. and 3. Unrealized gains and losses on Money held in trust other than for trading purpose
and being held to maturity are included in shareholders’ equity, net of income taxes.
5. Derivatives
Derivatives for purposes other than trading are stated at market value in principle.
6. Premises and Equipment
Depreciation for buildings and equipment of MTFG and its domestic banking subsidiary and trust banking subsidiary is
computed using the declining-balance method.
Principal estimated useful lives are as follows:
Buildings 15 years to 50 years
Equipment and furniture 4 years to 15 years
Depreciation for buildings and equipment of other consolidated subsidiaries is computed principally using the straight-line
method based on the estimated useful lives.
7. Software
Costs of computer software developed or obtained for internal use are deferred and amortized using the straight-line method
over the estimated useful lives of 5 to 10 years.
8. Bond Discounts, Bonds Issuance Costs
Bond discounts are amortized over the remaining life of the bond.
In addition, bond issuance costs are charged to expenses when incurred.
9. Translation of Foreign Currency Items
Foreign currency assets and liabilities and overseas branches’ accounts of MTFG’s domestic banking subsidiary and trust
banking subsidiary are principally translated into yen equivalents at the exchange rates prevailing at interim fiscal year end,
except for equity securities of affiliated companies which are translated into yen equivalents at exchange rates prevailing at the
acquisition date of those securities.
Foreign currency assets and liabilities of other consolidated subsidiaries are principally translated into yen equivalents at the
exchange rates prevailing at interim fiscal year end of each company.
10. Allowance for Loan Losses
An allowance for loan losses of MTFG’s primary domestic consolidated subsidiaries is provided as detailed below, pursuant
to the internal rules for the self-assessment of asset quality and the internal rules for providing allowances for credit losses:
For claims to debtors who are legally bankrupt (due to bankruptcy, special liquidation, the suspension of transactions with
banks by the rules of clearing houses, etc.) or virtually bankrupt, an allowance is provided based on the amount of claims, after
charge-offs as stated below, and net of amounts expected to be collected through the disposal of collateral or the execution of
guarantees.
For claims to debtors who are likely to become bankrupt and for which future cash flows could not be reasonably estimated,
an allowance is provided for the amount considered to be necessary based on an overall solvency assessment performed for the
amount of the claim, net of amounts expected to be collected through the disposal of collateral or execution of guarantees.
For claims to debtors who are likely to become bankrupt or are to be closely watched and for which future cash flows could
be reasonably estimated, an allowance is provided for the difference between the present value of the expected future cash flows
discounted at the contracted interest rate and the carrying value of the claim.
For other claims, an allowance is provided based on historical loan loss experience.
An allowance for loans to specific foreign borrowers is provided based on the amount of expected losses due to the political
and economic situation of their respective countries.
All claims are assessed by the branches and credit supervision divisions based on the internal rules for self-assessment of
asset quality. The credit examination divisions, which are independent from branches and credit supervision divisions,
subsequently conduct audits of their assessments, and an allowance is provided based on audit results.
For collateralized or guaranteed claims to debtors who are legally bankrupt or virtually bankrupt, the amount of claims
exceeding the estimated value of the collateral or guarantees, which is deemed uncollectible, has been charged-off. The amount
was ¥419,959 million.
An allowance for loan losses of other consolidated subsidiaries is provided based on historical loan loss experience or
estimated collectibility of specific claims.
11. Allowance for Losses on Investment Securities
An allowance for losses on investment securities is provided based on the estimated losses on non-marketable debt
securities.
12. Reserve for Employees’ Bonuses
A reserve for employees’ bonuses is provided for the payment of employees’ bonuses based on the estimated amounts of the
future payments attributed to the current interim fiscal year.
13. Reserve for Employees’ Retirement Benefits
A reserve for employees’ retirement benefits is provided for the payment of employees’ retirement benefits based on the
estimated amount of the actuarial retirement benefit obligation and the related pension assets. Prior service cost is amortized using
the straight-line method over 10 years. Net actuarial gain (loss) is amortized using the straight-line method over 10 years
commencing from the next fiscal year of incurrence.
14. Equipment Used under Finance Lease Agreements
Equipment used under finance lease agreements is accounted for as equipment leased under operating leases, except for
those leases which transfer ownership of leased equipment to the lessee, in which case the equipment is capitalized.
15. Hedge Accounting for Interest Rate Risks
With respect to hedge accounting for interest rate risks arising from financial assets and liabilities, MTFG’s domestic
banking subsidiary and trust banking subsidiary, have principally adopted portfolio hedges or individual hedges as prescribed in
Industry Audit Committee Report No. 24, “Treatment of Accounting and Auditing of Application of Accounting Standard for
Financial Instruments in the Banking Industry”, issued by the Japanese Institute of Certified Public Accountants (the “JICPA”) on
February 13, 2002 and Accounting Committee Report No. 14, “Practical Guidelines for Accounting for Financial Instruments”,
issued by the JICPA on January 31, 2000. The method of hedge accounting is the deferral method.
With respect to hedging activities to offset changes in the fair value of fixed rate deposits and loans etc., MTFG’s domestic
banking subsidiary and trust banking subsidiary distinguish hedged items by grouping the hedged items by their maturities and
designate interest rate swap transactions etc. as hedging instruments individually or in accordance with the Industry Audit
Committee Report No. 24. With respect to hedging activities offsetting changes in the fair value of fixed rate bonds, they
distinguish hedged items by the individual bond or identical types of bonds and designate interest rate swap transactions etc. as
hedging instruments. Since material terms related to the hedged items and hedging instruments are substantially identical, the
hedge relationship is deemed to be highly effective and hedge effectiveness testing is substituted by the identicalness.
With respect to hedging activities to fix forecasted cash flows on variable rate or short-term fixed rate deposits and loans
etc., MTFG’s domestic banking subsidiary and trust banking subsidiary distinguish hedged items by grouping the hedged items by
their index interest rates and repricing terms and designate interest rate swap transactions etc. as hedging instruments in
accordance with the Industry Audit Committee Report No. 24. Since material terms related to the hedged items and hedging
instruments are substantially identical, the hedge relationship is deemed to be highly effective and the hedge effectiveness testing
is substituted by the identicalness. Hedge effectiveness is also tested by correlation of fluctuation factors in interest rates.
Deferred hedge losses and deferred hedge gains recorded on the balance sheet as of March 31, 2003 as a result of the macro
hedge accounting are realized as expenses or income over the remaining lives of the hedging instruments (at most 15 years from
2003). Deferred hedge losses and deferred hedge gains attributable to the macro hedge accounting as of September 30, 2005 were
¥89,824 million and ¥120,254 million, respectively.
16. Hedge Accounting for Foreign Exchange Risks
With respect to hedge accounting for foreign exchange risks attributable to foreign currency denominated financial assets
and liabilities, MTFG’s domestic banking subsidiary and trust banking subsidiary have applied the deferral hedge accounting.
They have distinguished hedged items by grouping the foreign currency denominated financial assets and liabilities by currencies
and designating currency swap transactions and forward exchange contracts (funds swap transactions) as hedging instruments,
pursuant to Industry Audit Committee Report No. 25 , “Treatment of Accounting and Auditing concerning Accounting for
Foreign Currency Transactions in the Banking Industry”, issued by the JICPA on July 29, 2002.
They also engage in “portfolio hedge” to hedge foreign exchange risk attributable to foreign-currency-denominated
investments in affiliated companies and foreign-currency-denominated securities available for sale (other than bonds), using
foreign-currency-denominated liabilities and forward exchange contracts as hedging instruments. They apply the deferral hedge
method to foreign currency denominated investments in affiliated companies and the fair value hedge method to foreign-currency-
denominated securities available for sale (other than bonds).
17. Intercompany and Intracompany Swap Transactions
With respect to the intercompany and intracompany derivative transactions, realized gains (losses) or valuation gains
(losses) on interest rate swap transactions and currency swap transactions are reported in current earnings or deferred as assets or
liabilities without elimination, if mirror transactions with the third parties against these swap transactions are designated as
hedging instruments, and are appropriately conducted in conformity with the non-arbitrary and strict hedging policy in accordance
with the Industry Audit Committee Report No. 24 and No. 25.
18. Consumption Taxes
The National Consumption Tax and the Local Consumption Tax are excluded from transaction amounts. The portion of the
National Consumption Tax and the Local Consumption Tax, which were paid on the purchase of premises and equipment and
which are not deductible as a tax credit, are charged to expenses when incurred.
19. Reserve for Expenses Related to EXPO 2005 Japan
A reserve for expenses related to EXPO 2005 Japan is provided for the expenses related to the participation in the EXPO
2005 Japan based on the estimated contractual participation expenses allocated over the period. The reserve is provided pursuant
to Article 43 of the Commercial Code and includes the allowance provided pursuant to Article 57-2 of the Special Taxation
Measures Law.
20. Reserves under Special Laws
Pursuant to Article 81 of the Financial Futures Transactions Law, a reserve for contingent liabilities from brokering of
financial futures transactions of ¥31 million was provided.
Pursuant to Article 51 of the Securities and Exchange Law, a reserve of ¥1,574 million for contingent liabilities from
brokering of securities transactions was provided.
21. Amount Due from Directors of MTFG
The amount due from directors of MTFG was ¥84 million.
22. Accumulated Depreciation
Accumulated depreciation on premises and equipment was ¥628,092 million.
23. Accumulated Deferred Gains on Sales of Real Estate
Accumulated deferred gains on sales of real estate of ¥42,528 million were deducted from the acquisition cost of newly
acquired premises and equipment.
24. Nonaccrual Loans
Loans to customers in bankruptcy and past due loans are included in Loans and bills discounted, and the amounts were
¥21,763 million and ¥644,765 million, respectively. The amount of past due loans included loans of ¥547 million entrusted to the
Resolution and Collection Corporation, which facilitates the removal of problem loans from balance sheet.
Loans are generally placed on nonaccrual status when substantial doubt is judged to exist as to ultimate collectibility of
either principal or interest if they are past due for a certain period or for other reasons. Loans to customers in bankruptcy represent
nonaccrual loans, after the partial charge-off of claims deemed uncollectible, to debtors who are legally bankrupt, as defined in
Article 96, Paragraph 1, Subparagraphs 3 and 4 of Enforcement Ordinance for the Corporation Tax Law. Past due loans are
nonaccrual loans other than loans to customers in bankruptcy and loans for which interest payments are deferred in order to assist
the financial recovery of debtors in financial difficulties.
25. Accruing Loans Contractually Past Due 3 Months or More
Accruing loans contractually past due 3 months or more are included in Loans and bills discounted, and the amount was
¥13,286 million. Loans classified as loans to customers in bankruptcy or past due loans are excluded.
26. Restructured Loans
Restructured loans are included in Loans and bills discounted, and the amount was ¥375,290 million. Such restructured
loans are loans on which concessions (e.g. reduction of the stated interest rate, deferral of interest payment, extension of maturity
date, reduction of the face amount or maturity amount of the debt or accrued interest) have been granted to debtors in financial
difficulties to assist them in their financial recovery and in eventually to be able to repay to creditors. Loans classified as loans to
customers in bankruptcy, past due loans or accruing loans contractually past due 3 months or more are excluded.
27. Non accrual Loans, Accruing Loans Contractually Past Due 3 Months or More and Restructured Loans
The total amount of nonaccrual loans, accruing loans contractually past due 3 months or more and restructured loans was
¥1,055,106 million. The amount of past due loans included loans of ¥547 million entrusted to the Resolution and Collection
Corporation, which facilitates the removal of problem loans from balance sheet.
The amounts reflected in Notes 24. to 27. represent the gross receivable amounts, prior to reduction for the allowance for
loan losses.
28. Bills Discounted
Bills discounted are accounted for as secured lending transactions in conformity with the Industry Audit Committee Report
No.24. Bills accepted by other banks, commercial bills, bills of exchange, and foreign bills bought discounted by MTFG’s
domestic banking subsidiary and trust banking subsidiary are permitted to be sold or pledged, the total face value was ¥696,657
million.
29. Assets Pledged
Assets pledged as collateral were as follows:
Cash and due from banks ¥4,233 million
Monetary claims bought ¥4,083 million
Trading assets ¥239,331 million
Investment securities ¥3,516,715 million
Loans and bills discounted ¥3,672,265 million
Premises and equipment ¥5,237 million
Liabilities related to the pledged assets were as follows:
Deposits ¥198,526 million
Call money and bills sold ¥6,981,600 million
Borrowed money ¥3,052 million
Bonds ¥33,181 million
Other liabilities ¥9,692 million
Acceptances and guarantees ¥1,520 million
In addition, Cash and due from banks of ¥293,806 million, Monetary claims bought of ¥13 million, Trading assets of
¥10,719 million, Investment securities of ¥4,255,997 million, Loans and bills discounted of ¥1,059,618 million and Other assets
of ¥3,334 million were pledged as collateral for settlement of exchange or derivatives transactions or as valuation margin.
Commercial paper and other debt purchased of ¥96,912 million, Trading assets of ¥2,875,330 million and Investment
securities of ¥3,365,387 million were sold under repurchase agreements or lent under secured lending transactions. There ware
corresponding payables under repurchase agreements of ¥3,699,918 million and Payables under securities lending transactions of
¥2,593,132 million.
Bills rediscounted are accounted for secured borrowing transactions in conformity with the Industry Audit Committee
Report No.24. The total face value of bills accepted by other banks, commercial bills, and bills of exchange rediscounted by
MTFG’s domestic banking subsidiary and trust banking subsidiary was ¥12,074 million.
30. Land Revaluation Excess
Pursuant to the Law concerning Revaluation of Land, promulgated on March 31, 1998 , land used for business operations of
domestic subsidiaries has been revalued as of the following dates. The land revaluation excess is included in Shareholders’ equity,
net of income taxes. The land revaluation excess includes MTFG’s ownership percentage of affiliated companies’ land
revaluation excess.
Date of the revaluation:
Domestic banking subsidiary March 31, 1998
Domestic trust banking subsidiary March 31, 2002
Other domestic subsidiaries December 31, 2001
The method of the revaluation as set forth in Article 3, Paragraph 3 of the Law:
Pursuant to Article 2, Subparagraph 4 of the Enforcement Ordinance for the Law concerning Revaluation of Land, the
land price for the revaluation is determined based on the method established and published by the Director General of the
National Tax Agency in order to calculate the land value to determine the taxable amount subject to land value tax
prescribed by Article 16 of the Land Value Tax Law, reflecting appropriate adjustments for land shape and timing of the
assessment and based on real estate appraisal information defined by Article 5 of the Law.
Land used for business operations of a certain affiliated company has been revalued as of March 31, 2002.
31. Subordinated Borrowings
Subordinated borrowings of ¥817,300 million were included in Borrowed money.
32. Subordinated Bonds
Subordinated bonds of ¥1,842,291 million were included in Bonds and notes.
33. Guaranteed Trusts
The principal amounts of Jointly-operated designated money trusts and loan trusts of MTFG’s trust banking subsidiary, for
which repayment of the principal to the customers is guaranteed, were ¥960,789 million and ¥726,928 million, respectively.
34. Net Assets per Common Share
Net assets per common share were ¥771,314.08.
35. Write Down of Investment Securities
Marketable securities other than trading securities are written down when a decline in the market value below the cost of the
securities is substantial and the valuation differences are recognized as losses, based upon the judgment that the decline in market
value is other than temporary at the current interim fiscal year-end. A “substantial decline in the market value” is recognized
based on the classification of issuers as follows, pursuant to the internal rules for self-assessment of asset quality:
Issuers who are legally bankrupt, virtually bankrupt or likely to become bankrupt: Market value is below cost
Issuers who are to be closely watched: Market value is 30% or more below cost
Other issuers: Market value is 50% or more below cost
36. Market Value of Securities
Market value and valuation differences of securities are explained below. Securities below include trading securities, trading
commercial paper and trading short-term corporate bonds classified as Trading assets, negotiable certificates of deposits classified
as Cash and due from banks and investments in commodity investment trusts classified as Commercial paper and other debt
purchased. The same definition is applied in Notes 36. to 39.
Trading securities
Balance sheet amount ¥6,878,614 million
Valuation losses included in Income before income taxes and others ¥6,582 million
Marketable debt securities being held to maturity (in millions of yen) Balance sheet amount Market value Differences Gains Losses
Domestic bonds 2,117,645 2,128,955 11,309 11,764 454
Government bonds 1,999,500 2,006,657 7,157 7,611 454
Municipal bonds 88,762 91,691 2,928 2,928 -
Corporate bonds 29,382 30,605 1,223 1,223 -
Other securities 322,134 323,656 1,521 1,708 187
Foreign bonds 28,295 29,817 1,521 1,708 187
Other 293,839 293,839 - - -
Total 2,439,780 2,452,611 12,831 13,473 641
Marketable securities available for sale (in millions of yen)
Cost Balance sheet amount Valuation differences Gains Losses
Domestic equity securities 2,377,533 3,850,008 1,472,474 1,510,933 38,458
Domestic bonds 15,308,428 15,298,740 (9,687) 17,460 27,148
Government bonds 13,387,010 13,375,134 (11,875) 11,198 23,073
Municipal bonds 136,670 137,440 769 1,064 294
Corporate bonds 1,784,747 1,786,165 1,418 5,198 3,779
Other securities 8,444,255 8,569,307 125,052 182,682 57,630
Foreign equity securities 23,513 39,712 16,199 16,628 428
Foreign bonds 5,655,469 5,666,877 11,408 50,692 39,284
Other 2,765,272 2,862,717 97,444 115,361 17,917
Total 26,130,217 27,718,056 1,587,839 1,711,076 123,236
Among the valuation differences above, the amounts of shareholders’ equity, net of income taxes were ¥1,588,007 million
as a result of recognizing ¥168 million losses, which related to the securities embedded derivatives and measured in their entirety,
in current earnings. This amount, gross of ¥11,187 million of unrealized gains on securities as composition asset of unions and net
of ¥649,276 million of related deferred tax liabilities, was ¥949,918 million. Net valuation differences, excluding minority interest
of ¥2,962 million and adding MTFG’s ownership percentage of affiliates’ unrealized gains on securities available for sale of
¥5,170 million, were ¥952,126 million. These were recorded in Unrealized gains on securities available for sale.
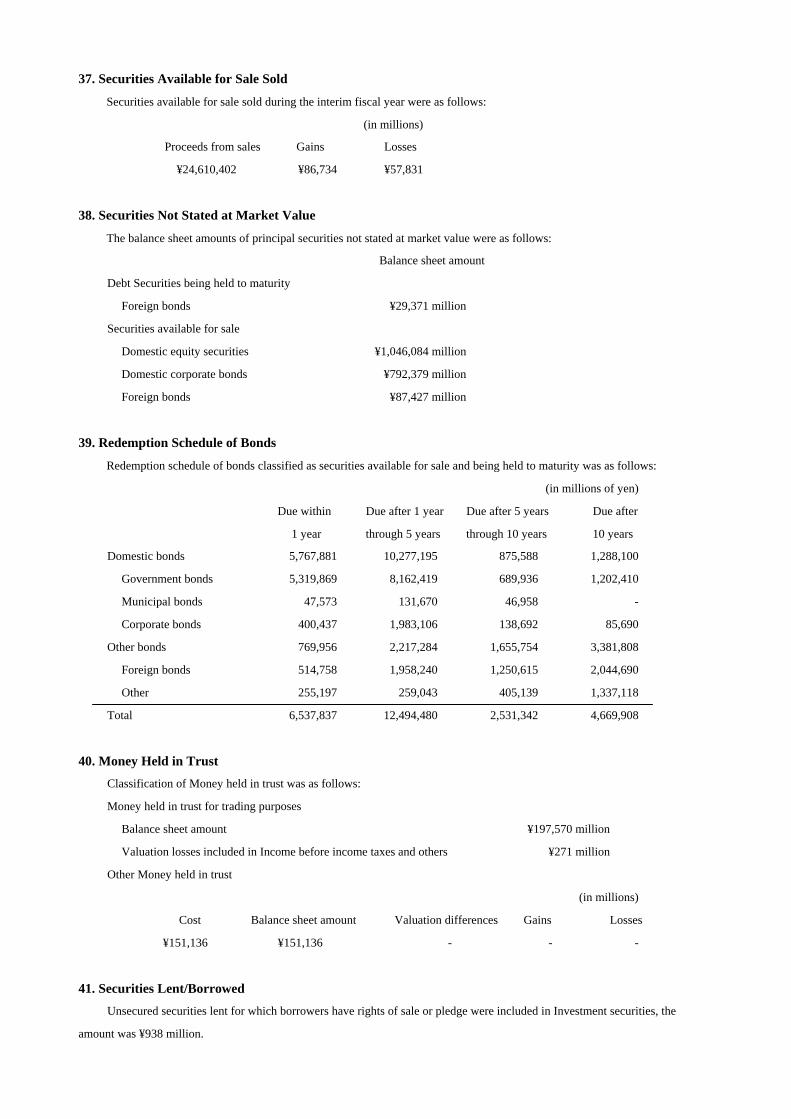
37. Securities Available for Sale Sold
Securities available for sale sold during the interim fiscal year were as follows:
(in millions)
Proceeds from sales Gains Losses
¥24,610,402 ¥86,734 ¥57,831
38. Securities Not Stated at Market Value
The balance sheet amounts of principal securities not stated at market value were as follows:
Balance sheet amount
Debt Securities being held to maturity
Foreign bonds ¥29,371 million
Securities available for sale
Domestic equity securities ¥1,046,084 million
Domestic corporate bonds ¥792,379 million
Foreign bonds ¥87,427 million
39. Redemption Schedule of Bonds
Redemption schedule of bonds classified as securities available for sale and being held to maturity was as follows:
(in millions of yen)
Due within Due after 1 year Due after 5 years Due after
1 year through 5 years through 10 years 10 years
Domestic bonds 5,767,881 10,277,195 875,588 1,288,100
Government bonds 5,319,869 8,162,419 689,936 1,202,410
Municipal bonds 47,573 131,670 46,958 -
Corporate bonds 400,437 1,983,106 138,692 85,690
Other bonds 769,956 2,217,284 1,655,754 3,381,808
Foreign bonds 514,758 1,958,240 1,250,615 2,044,690
Other 255,197 259,043 405,139 1,337,118
Total 6,537,837 12,494,480 2,531,342 4,669,908
40. Money Held in Trust
Classification of Money held in trust was as follows:
Money held in trust for trading purposes
Balance sheet amount ¥197,570 million
Valuation losses included in Income before income taxes and others ¥271 million
Other Money held in trust
(in millions)
Cost Balance sheet amount Valuation differences Gains Losses
¥151,136 ¥151,136 - - -
41. Securities Lent/Borrowed
Unsecured securities lent for which borrowers have rights of sale or pledge were included in Investment securities, the
amount was ¥938 million.
With respect to borrowed securities and purchased securities under resale agreements that are permitted to be sold or
pledged, ¥4,358,913 million were pledged, ¥595,813 million were lent and ¥4,122,814 million were held at hand at this fiscal year
end.
42. Loan Commitments
Contracts of overdraft facilities and loan commitment limits are contracts under which customers are lent to up to the
prescribed limits in response to the customers’ application for a loan as long as there is no violation of any condition in the
contracts. The unused amount within the limits relating to these contracts was ¥34,097,491 million.
Since many of these commitments expire without being drawn, the unused amount does not necessarily represent a future
cash requirement. Most of these contracts have conditions that allow MTFG and its consolidated subsidiaries to refuse the
customers’ application for a loan or decrease the contract limits with proper reasons (e.g. changes in financial situation,
deterioration in customers’ creditworthiness, etc.). At the inception of the contracts, MTFG and its consolidated subsidiaries
obtain real estate, securities, etc. as collateral if considered to be necessary. Subsequently, MTFG and its consolidated subsidiaries
perform periodic reviews of the customers’ business results based on internal rules, and take necessary measures to reconsider
conditions in contracts and/or require additional collateral and guarantees.
43. Consolidated Corporate-tax System
MTFG and certain domestic consolidated subsidiaries suspended the consolidated corporate-tax system from the fiscal year
ending March 31, 2006.
44. Establishment of Mitsubishi UFJ Financial Group
MTFG signed relevant merger agreements with UFJ Holdings, Inc. on April 20, 2005, and relevant merger agreements were
approved in shareholders' meeting that held on June 29, 2005. On October 1, 2005, MTFG and UFJ Holdings, Inc. merged and
began operations as MUFG. MTFG succeeded all of the asset, the debt, rights and obligation from UFJ Holdings, Inc.
Moreover, subsidiary company The Mitsubishi Trust and Banking Corporation merged UFJ Trust Bank Limited and began
operations as Mitsubishi UFJ Trust and Banking Corporation and subsidiary company Mitsubishi Securities Co., Ltd. merged UFJ
Tsubasa Securities Co., Ltd. and began operations as Mitsubishi UFJ Securities Co., Ltd..
Subsidiary company The Bank of Tokyo-Mitsubishi, Ltd. and the UFJ Bank Limited have decided to postpone the scheduled
date of merger on October 1, 2005 to the merger on January 1, 2006 by three months.
45. Repurchase of Own Shares
MUFG repurchased its own shares on October 5, 2005 pursuant to the resolution of the Board of Directors meeting held on
October 4, 2005 as follows:
(1) Types of shares that were repurchased: MUFG’s common share
(2) Aggregate number of shares that were repurchased: 256,159 shares
(3) Repurchase price: 1,400,000 yen per share
(4) Aggregate number of repurchase price : 358,622,600,000 yen
(5) Method of repurchase: Repurchase through ToSTNet-2 (closing price orders) of Tokyo Stock Exchange
Deposit Insurance Corporation of Japan announced that The Resolution and Collection Corporation (the “RCC”) sold
249,859.96 shares of MUFG’s common shares at 349,803,944,000 yen October 5, 2005 (the RCC converted 69,300 shares of
preferred shares-class 8 (aggregate amount of conversion 207,900 million yen) and 57,850 shares of preferred share-class 9
(aggregate amount of conversion 115,700 million yen) October 4, 2005.).
Notes related to the Consolidated Statement of Operations for the six months ended September 30, 2005 are as
follows:
1. Basis of Presentation
The accompanying Consolidated Statement of Operations is compiled as required by the Banking Law and in conformity
with accounting principles generally accepted in Japan, which are different in certain respects as compared to application and
disclosure requirements of International Accounting Standards. For the convenience of readers, the presentation is modified in
certain respects from the original Japanese report. The amounts are presented in millions of yen and are rounded down to the
nearest million.
2. Net Income per Common Share
Net income per common share was ¥45,529.68.
3. Trading Profits and Losses
Profits and losses on trading transactions (dividends and interest, gains or losses on sales, and valuation gains or losses) are
shown as Trading profits or Trading losses on a trade date basis.
4. Other Ordinary Income
Other ordinary income included gains on sales of equity securities of ¥22,334 million and gains on sales of loans and other
claims of ¥9,022 million
5. Other Ordinary Expenses
Other ordinary expenses included losses on loan charge-offs of ¥41,084 million and losses on sales of equity securities of
¥4,756 million.

Note related to the Consolidated Statement of Capital Surplus and Retained Earnings for the six months ended
September 30, 2005 is as follows:
1. Basis of Presentation
The accompanying Consolidated Statement of Capital Surplus and Retained Earnings is compiled as required by the
Banking Law and in conformity with accounting principles and practices generally accepted in Japan, which are different in
certain respects as compared to application and disclosure requirements of International Accounting Standards. For the
convenience of readers, the presentation is modified in certain respects from the original Japanese report. The amounts are
presented in millions of yen and are rounded down to the nearest million.
Notes related to the Consolidated Statement of Cash Flows for the six months ended September 30, 2005 are as
follows:
1. Basis of Presentation
The accompanying Consolidated Statement of Cash Flows is compiled as required by the Banking Law and in conformity
with accounting principles generally accepted in Japan, which are different in certain respects as compared to application and
disclosure requirements of International Accounting Standards. For the convenience of readers, the presentation is modified in
certain respects from the original Japanese report. The amounts are presented in millions of yen and are rounded down to the
nearest million.
2. Definition of Cash and Cash Equivalents
For the purpose of reporting cash flows, cash and cash equivalents are defined as those amounts included in Cash and due
from banks excluding time deposits and negotiable certificates of deposits in other banks.
3. Reconciliation to the Cash and Cash Equivalents
The reconciliation of the Cash and due from banks in the Consolidated Balance Sheet to the Cash and cash equivalents at
end of interim fiscal year is as follows:
(in millions)
Cash and due from banks ¥10,005,210
Time deposits and negotiable certificates of deposit in other banks (4,499,523)
Cash and cash equivalents at end of interim fiscal year ¥ 5,505,687
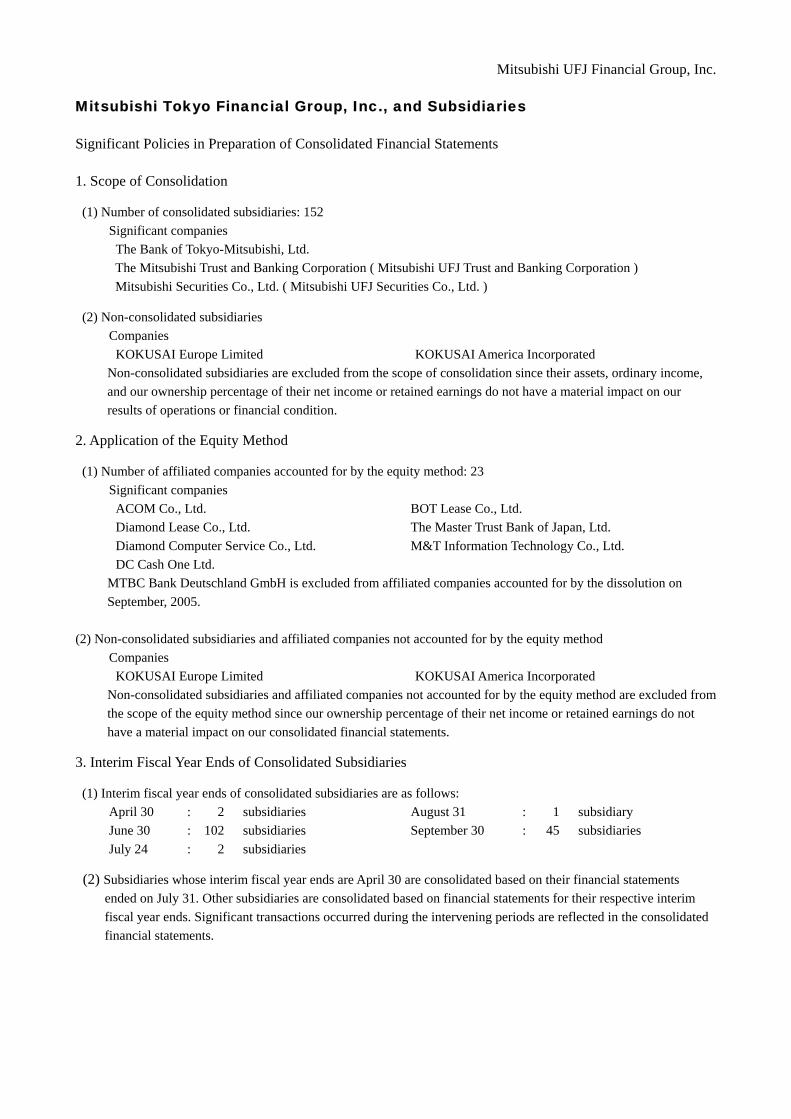
Mitsubishi UFJ Financial Group, Inc. Mitsubishi Tokyo Financial Group, Inc., and Subsidiaries Significant Policies in Preparation of Consolidated Financial Statements 1. Scope of Consolidation
(1) Number of consolidated subsidiaries: 152 Significant companies The Bank of Tokyo-Mitsubishi, Ltd.
The Mitsubishi Trust and Banking Corporation ( Mitsubishi UFJ Trust and Banking Corporation ) Mitsubishi Securities Co., Ltd. ( Mitsubishi UFJ Securities Co., Ltd. )
(2) Non-consolidated subsidiaries Companies KOKUSAI Europe Limited KOKUSAI America Incorporated
Non-consolidated subsidiaries are excluded from the scope of consolidation since their assets, ordinary income, and our ownership percentage of their net income or retained earnings do not have a material impact on our results of operations or financial condition.
2. Application of the Equity Method
(1) Number of affiliated companies accounted for by the equity method: 23 Significant companies ACOM Co., Ltd. BOT Lease Co., Ltd. Diamond Lease Co., Ltd. The Master Trust Bank of Japan, Ltd. Diamond Computer Service Co., Ltd. M&T Information Technology Co., Ltd. DC Cash One Ltd.
MTBC Bank Deutschland GmbH is excluded from affiliated companies accounted for by the dissolution on September, 2005.
(2) Non-consolidated subsidiaries and affiliated companies not accounted for by the equity method Companies KOKUSAI Europe Limited KOKUSAI America Incorporated
Non-consolidated subsidiaries and affiliated companies not accounted for by the equity method are excluded from the scope of the equity method since our ownership percentage of their net income or retained earnings do not have a material impact on our consolidated financial statements.
3. Interim Fiscal Year Ends of Consolidated Subsidiaries
(1) Interim fiscal year ends of consolidated subsidiaries are as follows: April 30 : 2 subsidiaries August 31 : 1 subsidiary June 30 : 102 subsidiaries September 30 : 45 subsidiaries July 24 : 2 subsidiaries
(2) Subsidiaries whose interim fiscal year ends are April 30 are consolidated based on their financial statements ended on July 31. Other subsidiaries are consolidated based on financial statements for their respective interim fiscal year ends. Significant transactions occurred during the intervening periods are reflected in the consolidated financial statements.
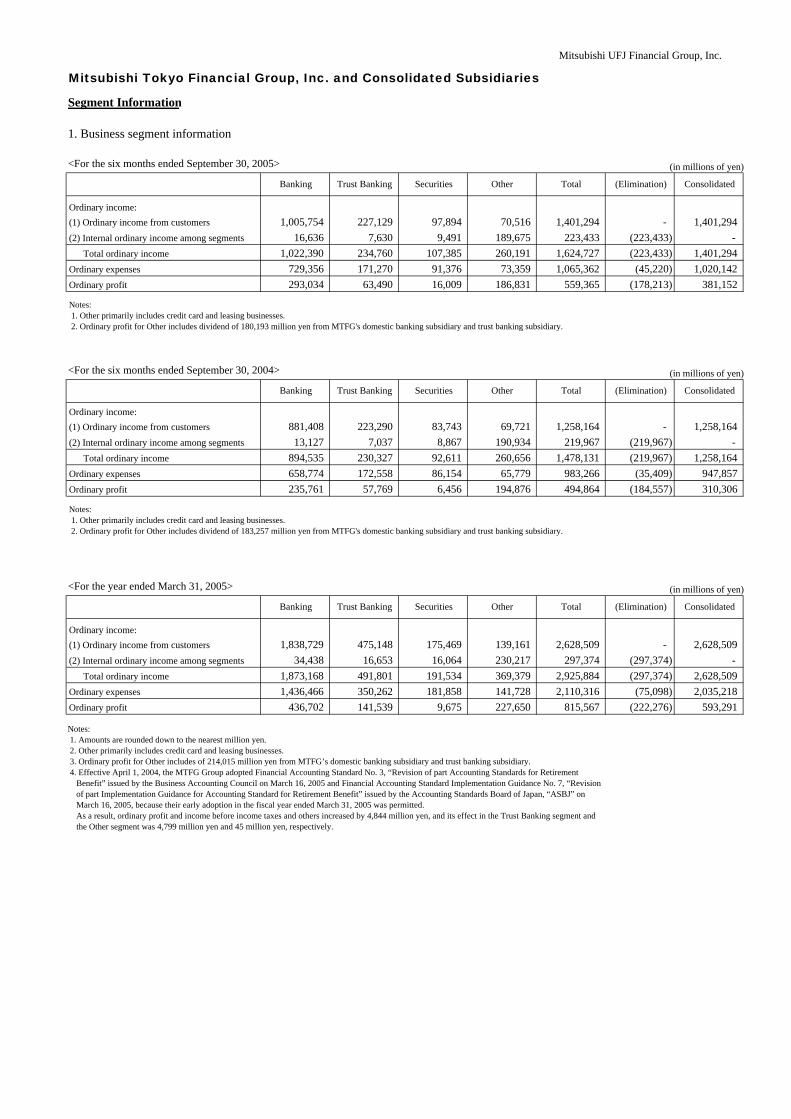
Mitsubishi UFJ Financial Group, Inc.
Segment Information
1. Business segment information
<For the six months ended September 30, 2005> (in millions of yen)
<For the six months ended September 30, 2004> (in millions of yen)
<For the year ended March 31, 2005> (in millions of yen)
Mitsubishi Tokyo Financial Group, Inc. and Consolidated Subsidiaries
(1) Ordinary income from customers(2) Internal ordinary income among segments
1,022,390
1,005,75416,636
Other Total (Elimination) ConsolidatedTrust Banking
Ordinary expenses
Ordinary income:
Total ordinary income
Banking
73,359186,831
227,1297,630
234,760
70,516189,675260,191
1,020,142
(223,433)(223,433)(45,220)
-
(178,213)
1,401,294223,433
1,624,727
381,152171,27063,490
1,401,294-
1,401,2941,065,362
559,365
194,876 494,864 (184,557) 310,306Ordinary profit 235,761 57,769 6,45665,779 983,266 (35,409) 947,857
107,38591,37616,009
Ordinary expenses 658,774 172,558 86,154
729,356293,034Ordinary profit
Securities
97,8949,491
260,656 1,478,131 (219,967) 1,258,164 Total ordinary income 894,535 230,327 92,611
1,258,164(2) Internal ordinary income among segments 13,127 7,037 8,867 190,934 219,967 (219,967) -
83,743 69,721 1,258,164 - Ordinary income:(1) Ordinary income from customers 881,408 223,290
Other Total (Elimination) ConsolidatedBanking Trust Banking Securities
Banking Trust Banking Securities Other Total (Elimination) Consolidated
Ordinary income:(1) Ordinary income from customers 1,838,729 475,148 175,469 139,161 2,628,509 - 2,628,509(2) Internal ordinary income among segments 34,438 16,653 16,064 230,217 297,374 (297,374) - Total ordinary income 1,873,168 491,801 191,534 369,379 2,925,884 (297,374) 2,628,509Ordinary expenses 1,436,466 350,262 181,858 141,728 2,110,316 (75,098) 2,035,218Ordinary profit 436,702 141,539 9,675 227,650 815,567 (222,276) 593,291
Notes: 1. Amounts are rounded down to the nearest million yen. 2. Other primarily includes credit card and leasing businesses. 3. Ordinary profit for Other includes of 214,015 million yen from MTFG’s domestic banking subsidiary and trust banking subsidiary. 4. Effective April 1, 2004, the MTFG Group adopted Financial Accounting Standard No. 3, “Revision of part Accounting Standards for Retirement Benefit” issued by the Business Accounting Council on March 16, 2005 and Financial Accounting Standard Implementation Guidance No. 7, “Revision of part Implementation Guidance for Accounting Standard for Retirement Benefit” issued by the Accounting Standards Board of Japan, “ASBJ” on March 16, 2005, because their early adoption in the fiscal year ended March 31, 2005 was permitted. As a result, ordinary profit and income before income taxes and others increased by 4,844 million yen, and its effect in the Trust Banking segment and the Other segment was 4,799 million yen and 45 million yen, respectively.
Notes: 1. Other primarily includes credit card and leasing businesses. 2. Ordinary profit for Other includes dividend of 180,193 million yen from MTFG's domestic banking subsidiary and trust banking subsidiary.
Notes: 1. Other primarily includes credit card and leasing businesses. 2. Ordinary profit for Other includes dividend of 183,257 million yen from MTFG's domestic banking subsidiary and trust banking subsidiary.
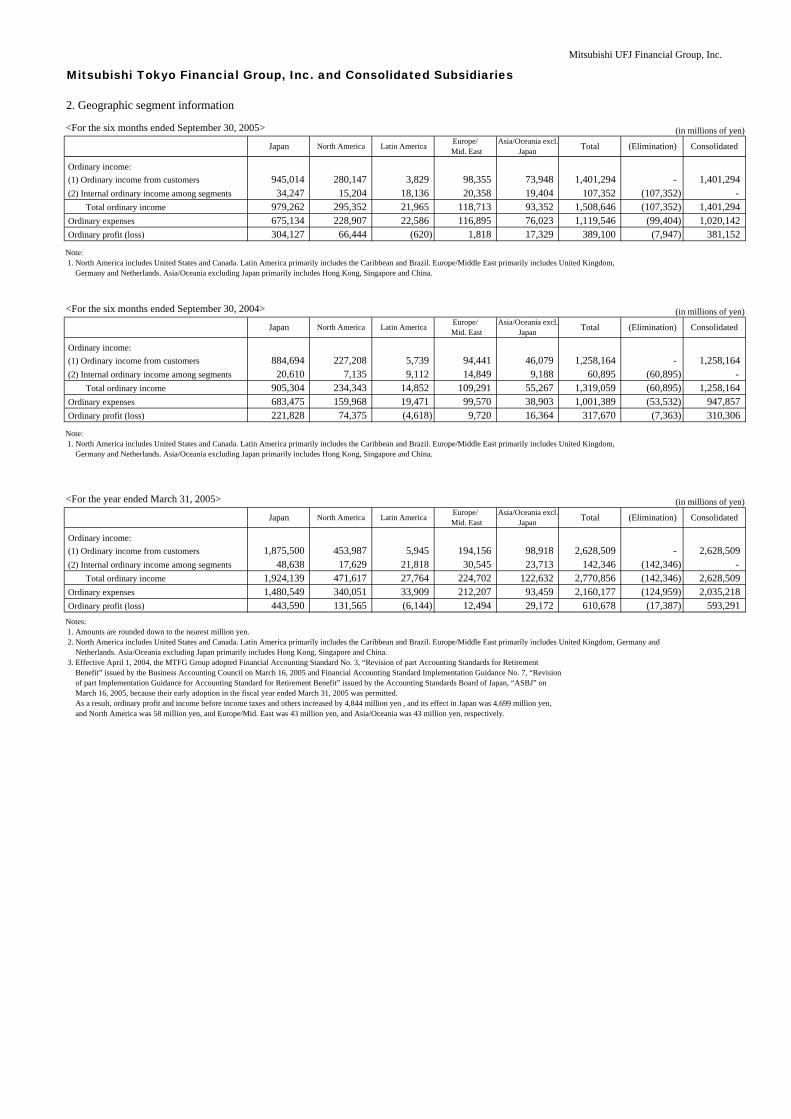
Mitsubishi UFJ Financial Group, Inc.
Mitsubishi Tokyo Financial Group, Inc. and Consolidated Subsidiaries
2. Geographic segment information
<For the six months ended September 30, 2005> (in millions of yen)
<For the six months ended September 30, 2004> (in millions of yen)
<For the year ended March 31, 2005> (in millions of yen)
(Elimination)
17,329
- 1,401,2941,020,142
381,152(7,947)
Asia/Oceania excl.Japan Total Consolidated
1,401,294(107,352)
1,119,546
1,401,294107,352(2) Internal ordinary income among segments
Total ordinary incomeOrdinary expensesOrdinary profit (loss) 304,127
118,713116,895
389,10076,023
1,81866,444
1,508,646675,134 22,586
Ordinary income:(1) Ordinary income from customers
(107,352)(99,404)
- 15,204
295,352228,907
18,13673,94819,40493,352
Japan North America Latin America
21,96534,247
979,262
945,014 280,147
Asia/Oceania excl.Japan Total Consolidated(Elimination)
North America Latin America Europe/ Mid. East
Europe/ Mid. East
(620)
3,829 98,35520,358
(Elimination)
Ordinary income:
Japan
(1) Ordinary income from customers 884,694 227,208 5,739 94,441 46,079 1,258,164 - 1,258,164(2) Internal ordinary income among segments 20,610 7,135 9,112 14,849 9,188 60,895 (60,895) - Total ordinary income 905,304 234,343 14,852 109,291 55,267 1,319,059 (60,895) 1,258,164Ordinary expenses 683,475 159,968 19,471
310,30699,570 38,903 1,001,389 (53,532)
Europe/ Mid. East
947,857Ordinary profit (loss) 221,828 74,375 (4,618) 9,720 16,364 317,670 (7,363)
2,628,509Ordinary income:
Asia/Oceania excl.Japan Total ConsolidatedJapan North America Latin America
194,156 98,918 2,628,509 - (1) Ordinary income from customers 1,875,500 453,987 5,945(2) Internal ordinary income among segments 48,638 17,629 21,818 30,545 23,713 142,346 (142,346) - Total ordinary income 1,924,139 471,617 27,764 224,702 122,632 2,770,856 (142,346) 2,628,509Ordinary expenses 1,480,549 340,051 33,909 212,207 93,459 2,160,177 (124,959) 2,035,218Ordinary profit (loss) 443,590 131,565 (6,144) 12,494 29,172 610,678 (17,387) 593,291
Notes: 1. Amounts are rounded down to the nearest million yen. 2. North America includes United States and Canada. Latin America primarily includes the Caribbean and Brazil. Europe/Middle East primarily includes United Kingdom, Germany and Netherlands. Asia/Oceania excluding Japan primarily includes Hong Kong, Singapore and China. 3. Effective April 1, 2004, the MTFG Group adopted Financial Accounting Standard No. 3, “Revision of part Accounting Standards for Retirement Benefit” issued by the Business Accounting Council on March 16, 2005 and Financial Accounting Standard Implementation Guidance No. 7, “Revision of part Implementation Guidance for Accounting Standard for Retirement Benefit” issued by the Accounting Standards Board of Japan, “ASBJ” on March 16, 2005, because their early adoption in the fiscal year ended March 31, 2005 was permitted. As a result, ordinary profit and income before income taxes and others increased by 4,844 million yen , and its effect in Japan was 4,699 million yen, and North America was 58 million yen, and Europe/Mid. East was 43 million yen, and Asia/Oceania was 43 million yen, respectively.
Note: 1. North America includes United States and Canada. Latin America primarily includes the Caribbean and Brazil. Europe/Middle East primarily includes United Kingdom, Germany and Netherlands. Asia/Oceania excluding Japan primarily includes Hong Kong, Singapore and China.
Note: 1. North America includes United States and Canada. Latin America primarily includes the Caribbean and Brazil. Europe/Middle East primarily includes United Kingdom, Germany and Netherlands. Asia/Oceania excluding Japan primarily includes Hong Kong, Singapore and China.
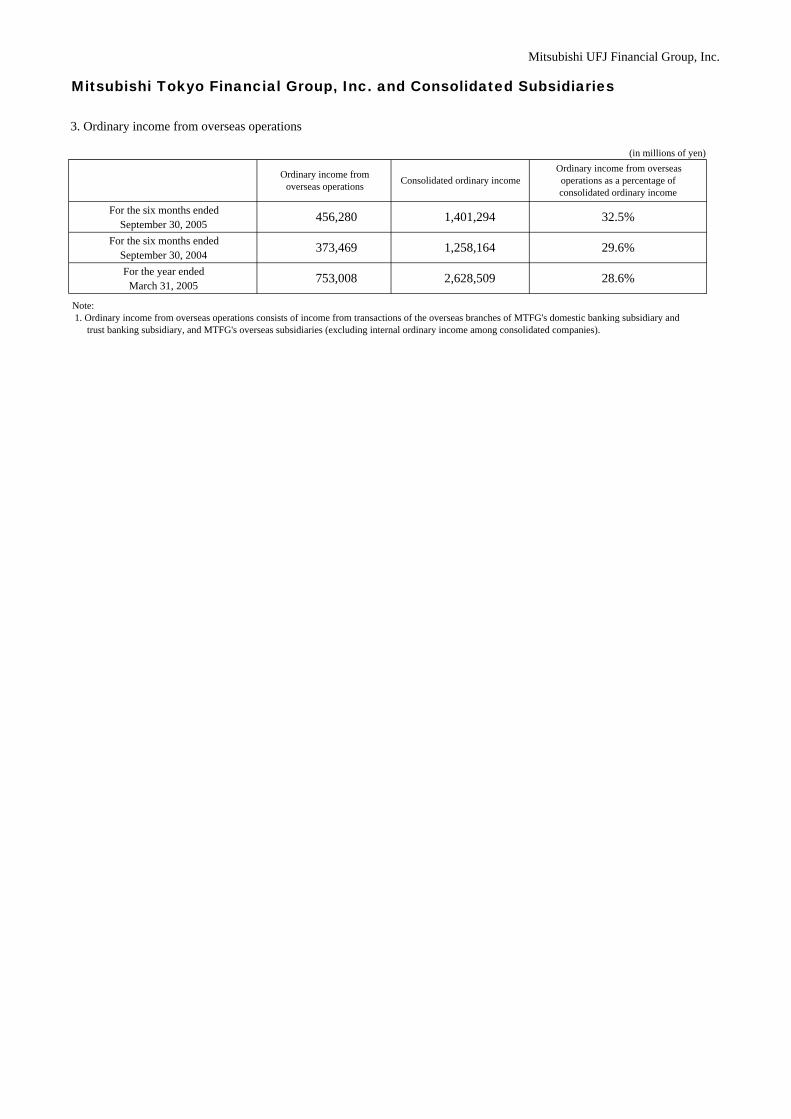
Mitsubishi UFJ Financial Group, Inc.
3. Ordinary income from overseas operations
(in millions of yen)
Mitsubishi Tokyo Financial Group, Inc. and Consolidated Subsidiaries
Consolidated ordinary income
456,280 1,401,294 32.5%
1,258,164 29.6%373,469
For the year endedMarch 31, 2005
Ordinary income from overseasoperations as a percentage ofconsolidated ordinary income
September 30, 2005For the six months ended
September 30, 2004
Ordinary income fromoverseas operations
2,628,509 28.6%753,008
For the six months ended
Note: 1. Ordinary income from overseas operations consists of income from transactions of the overseas branches of MTFG's domestic banking subsidiary and trust banking subsidiary, and MTFG's overseas subsidiaries (excluding internal ordinary income among consolidated companies).

Mitsubishi UFJ Financial Group, Inc.
Mitsubishi Tokyo Financial Group, Inc. and Consolidated Subsidiaries
Investment securitiesFollowing tables include:
Investment securitiesTrading securities, trading commercial paper and trading short-term corporate bonds in "Trading assets"Negotiable certificates of deposits in "Cash and due from banks"Beneficiary certificates of commodity investment trusts in "Commercial Paper and other debt purchased".
1. Marketable debt securities being held to maturity( in millions of yen)
Balance sheet Market value Differencesamount Gains Losses
Domestic bonds 1,792,718 1,806,309 13,590 13,590 - Government bonds 1,648,689 1,656,678 7,989 7,989 - Municipal bonds 100,005 103,744 3,738 3,738 - Corporate bonds 44,024 45,886 1,862 1,862 -
69,355 71,097 1,741 1,954 212299,259 299,259 - - -
Total 2,161,334 2,176,667 15,332 15,544 212
2. Marketable securities available for sale( in millions of yen)
Cost Balance sheet Valuation differencesamount Gains Losses
Domestic equity securities 2,508,010 3,142,643 634,632 744,276 109,644 Domestic bonds 20,192,100 20,216,217 24,116 45,435 21,318
Government bonds 18,272,652 18,288,827 16,175 35,779 19,604 Municipal bonds 210,303 211,565 1,262 2,137 874 Corporate bonds 1,709,145 1,715,823 6,678 7,518 839
20,434 34,436 14,001 14,520 5195,821,554 5,849,643 28,089 52,886 24,7971,800,783 1,805,646 4,862 32,637 27,775
Total 30,342,884 31,048,586 705,702 889,757 184,054
3. Principal securities not stated at market value( in millions of yen)
Debt securities being held to maturity Foreign bonds 13,574 Securities available for sale Domestic equity securities 1,015,921 Domestic corporate bonds 528,431 Foreign bonds 48,548
Money held in trust
Money held in trust other than trading purpose and being held to maturity( in millions of yen)
Balance sheet Valuation differencesamount Gains Losses
116,830 - - -
Unrealized gains (losses) on securities available for sale
The classification of unrealized gains (losses) on securities available for sale on the consolidated balance sheet is as follows:( in millions of yen)
Valuation differences Securities available for sale 705,558 Money held in trust other than trading purpose and being held to maturity
Deferred tax liabilities Net valuation differences Minority interest MTFG's ownership percentage of affiliates' unrealized gains on securities available for sale Unrealized gains on securities available for saleNote:Valuation differences exclude \ 143 million of profits reflected in current earnings which were related to the securities embedding derivatives and measured in their entirety.
Other Foreign bonds
116,830
Other Foreign bonds Foreign equity securities
As of September 30,2004Cost
422,926
419,968 700
2,257
As of September 30,2004705,558
(285,590)
-
As of September 30,2004
As of September 30,2004
As of September 30,2004Balance sheet amount
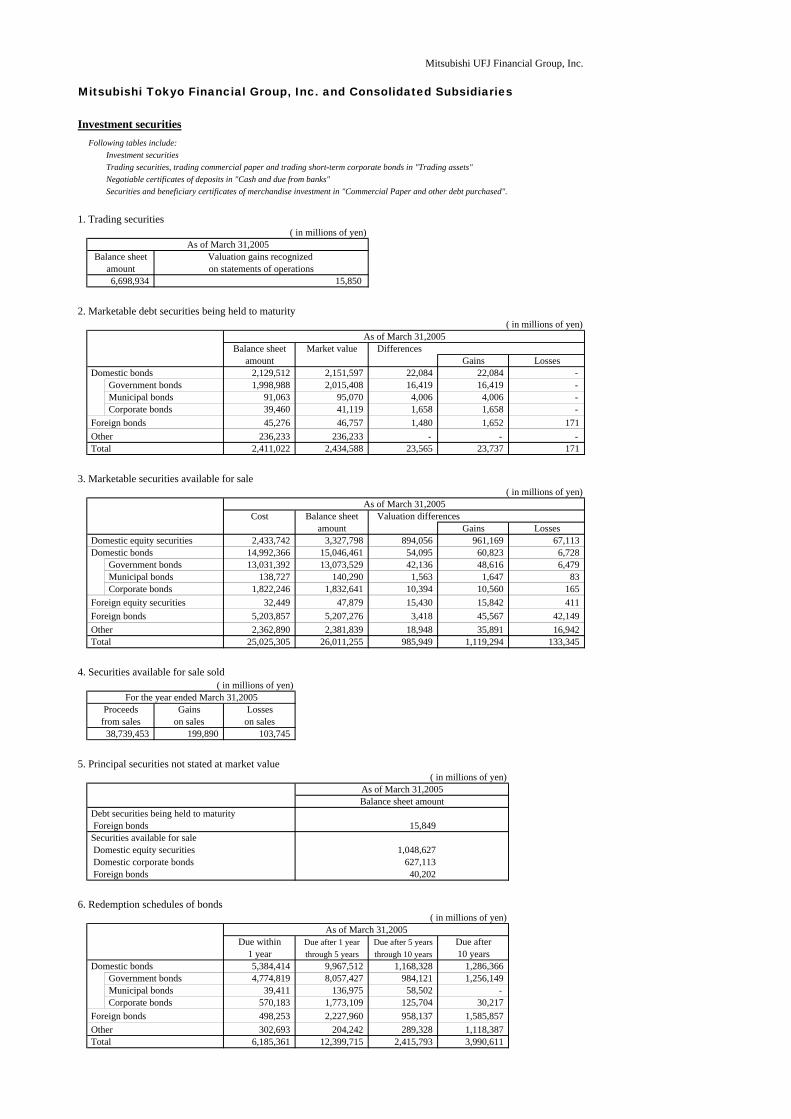
Mitsubishi UFJ Financial Group, Inc.
Mitsubishi Tokyo Financial Group, Inc. and Consolidated Subsidiaries
Investment securitiesFollowing tables include:
Investment securitiesTrading securities, trading commercial paper and trading short-term corporate bonds in "Trading assets"Negotiable certificates of deposits in "Cash and due from banks"Securities and beneficiary certificates of merchandise investment in "Commercial Paper and other debt purchased".
1. Trading securities( in millions of yen)
2. Marketable debt securities being held to maturity( in millions of yen)
Balance sheet Market value Differencesamount Gains Losses
Domestic bonds 2,129,512 2,151,597 22,084 22,084 - Government bonds 1,998,988 2,015,408 16,419 16,419 - Municipal bonds 91,063 95,070 4,006 4,006 - Corporate bonds 39,460 41,119 1,658 1,658 -
45,276 46,757 1,480 1,652 171236,233 236,233 - - -
Total 2,411,022 2,434,588 23,565 23,737 171
3. Marketable securities available for sale( in millions of yen)
Cost Balance sheet Valuation differencesamount Gains Losses
Domestic equity securities 2,433,742 3,327,798 894,056 961,169 67,113 Domestic bonds 14,992,366 15,046,461 54,095 60,823 6,728
Government bonds 13,031,392 13,073,529 42,136 48,616 6,479 Municipal bonds 138,727 140,290 1,563 1,647 83 Corporate bonds 1,822,246 1,832,641 10,394 10,560 165
32,449 47,879 15,430 15,842 4115,203,857 5,207,276 3,418 45,567 42,1492,362,890 2,381,839 18,948 35,891 16,942
Total 25,025,305 26,011,255 985,949 1,119,294 133,345
4. Securities available for sale sold( in millions of yen)
Gains Losseson sales on sales
199,890 103,745
5. Principal securities not stated at market value ( in millions of yen)
Debt securities being held to maturity Foreign bonds 15,849 Securities available for sale Domestic equity securities 1,048,627 Domestic corporate bonds 627,113 Foreign bonds 40,202
6. Redemption schedules of bonds( in millions of yen)
Due within Due after 1 year Due after 5 years Due after1 year through 5 years through 10 years 10 years
Domestic bonds 5,384,414 9,967,512 1,168,328 1,286,366 Government bonds 4,774,819 8,057,427 984,121 1,256,149 Municipal bonds 39,411 136,975 58,502 - Corporate bonds 570,183 1,773,109 125,704 30,217
498,253 2,227,960 958,137 1,585,857302,693 204,242 289,328 1,118,387
Total 6,185,361 12,399,715 2,415,793 3,990,611
Other
Foreign bonds Other
6,698,934
Foreign bonds Other
Foreign equity securities Foreign bonds
As of March 31,2005
Proceedsfrom sales
38,739,453
Balance sheet amount
As of March 31,2005
As of March 31,2005
As of March 31,2005
As of March 31,2005
Valuation gains recognized on statements of operations
15,850
For the year ended March 31,2005
Balance sheetamount
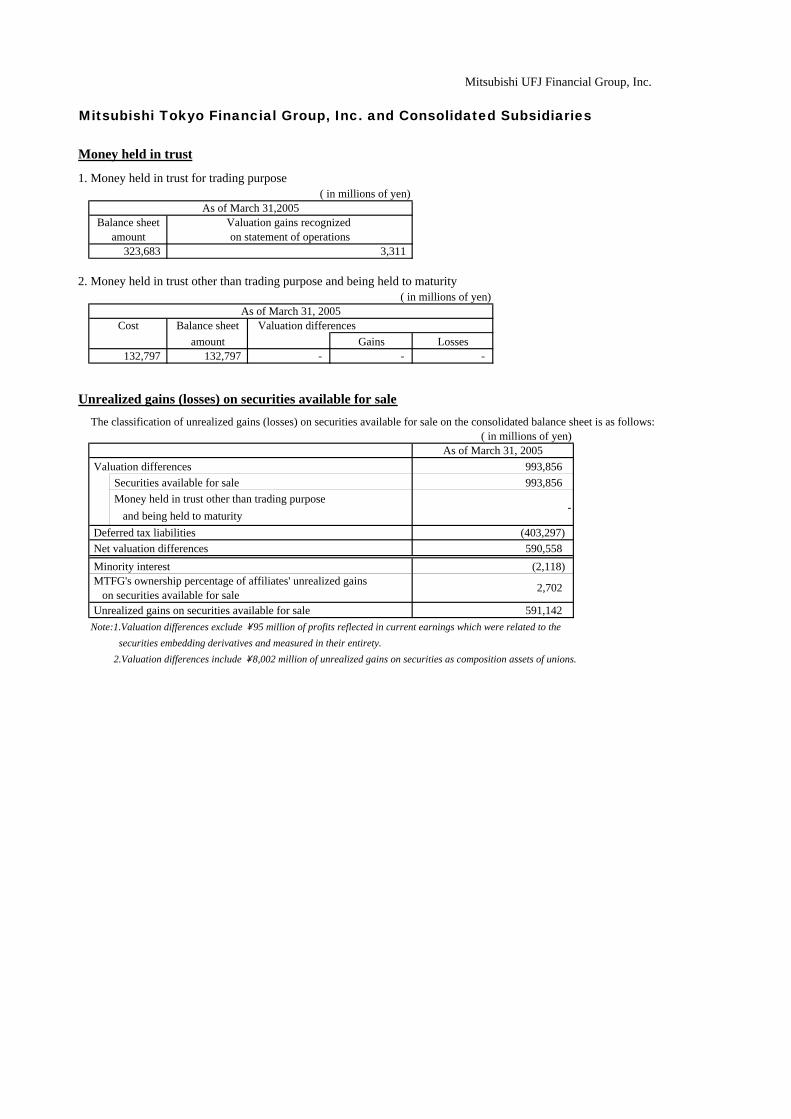
Mitsubishi UFJ Financial Group, Inc.
Mitsubishi Tokyo Financial Group, Inc. and Consolidated Subsidiaries
Money held in trust
1. Money held in trust for trading purpose( in millions of yen)
2. Money held in trust other than trading purpose and being held to maturity( in millions of yen)
Balance sheet Valuation differencesamount Gains Losses
132,797 - - -
Unrealized gains (losses) on securities available for saleThe classification of unrealized gains (losses) on securities available for sale on the consolidated balance sheet is as follows:
( in millions of yen)
Valuation differences Securities available for sale 993,856 Money held in trust other than trading purpose and being held to maturity
Deferred tax liabilities Net valuation differences Minority interest MTFG's ownership percentage of affiliates' unrealized gains on securities available for sale Unrealized gains on securities available for saleNote:1.Valuation differences exclude \ 95 million of profits reflected in current earnings which were related to the securities embedding derivatives and measured in their entirety. 2.Valuation differences include \ 8,002 million of unrealized gains on securities as composition assets of unions.
As of March 31,2005
3,311
As of March 31, 2005
Balance sheetamount
323,683
Valuation gains recognized
Cost
132,797
on statement of operations
As of March 31, 2005
591,142
(403,297) 590,558
(2,118)
2,702
993,856
-
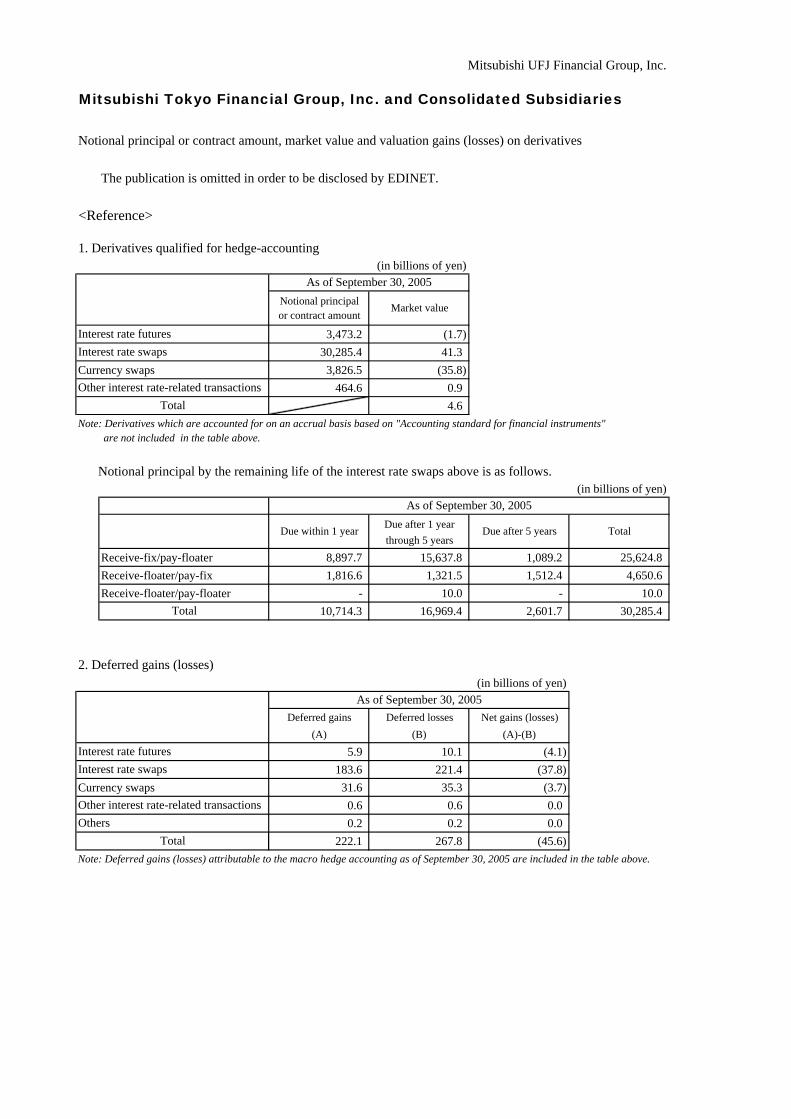
Mitsubishi UFJ Financial Group, Inc.
Mitsubishi Tokyo Financial Group, Inc. and Consolidated Subsidiaries
Notional principal or contract amount, market value and valuation gains (losses) on derivatives
The publication is omitted in order to be disclosed by EDINET.
<Reference>
1. Derivatives qualified for hedge-accounting(in billions of yen)
Notional principalor contract amount
3,473.2 (1.7)30,285.4 41.3
Currency swaps 3,826.5 (35.8)464.6 0.9
4.6Note: Derivatives which are accounted for on an accrual basis based on "Accounting standard for financial instruments"
are not included in the table above.
Notional principal by the remaining life of the interest rate swaps above is as follows.(in billions of yen)
Due after 1 yearthrough 5 years
Receive-fix/pay-floater 8,897.7 15,637.8 1,089.2 25,624.8Receive-floater/pay-fix 1,816.6 1,321.5 1,512.4 4,650.6Receive-floater/pay-floater - 10.0 - 10.0
10,714.3 16,969.4 2,601.7 30,285.4
2. Deferred gains (losses)(in billions of yen)
Deferred gains Deferred losses Net gains (losses)(A) (B) (A)-(B)
5.9 10.1 (4.1)183.6 221.4 (37.8)
Currency swaps 31.6 35.3 (3.7)0.6 0.6 0.00.2 0.2 0.0
222.1 267.8 (45.6)Note: Deferred gains (losses) attributable to the macro hedge accounting as of September 30, 2005 are included in the table above.
Total
As of September 30, 2005
Interest rate futuresInterest rate swaps
Other interest rate-related transactionsOthers
Due after 5 years Total
Total
As of September 30, 2005
Other interest rate-related transactionsTotal
Due within 1 year
As of September 30, 2005
Market value
Interest rate futuresInterest rate swaps
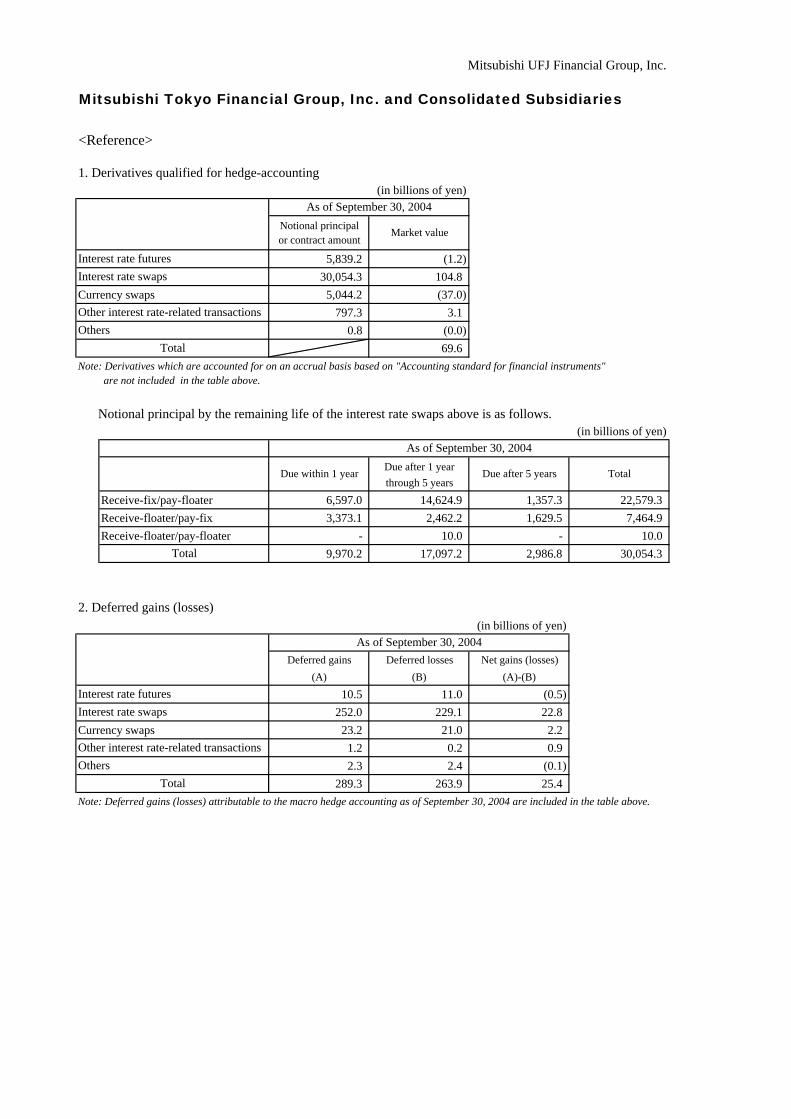
Mitsubishi UFJ Financial Group, Inc.
Mitsubishi Tokyo Financial Group, Inc. and Consolidated Subsidiaries
<Reference>
1. Derivatives qualified for hedge-accounting(in billions of yen)
Notional principalor contract amount
5,839.2 (1.2)30,054.3 104.8
Currency swaps 5,044.2 (37.0)797.3 3.1
0.8 (0.0)69.6
Note: Derivatives which are accounted for on an accrual basis based on "Accounting standard for financial instruments" are not included in the table above.
Notional principal by the remaining life of the interest rate swaps above is as follows.(in billions of yen)
Due after 1 yearthrough 5 years
Receive-fix/pay-floater 6,597.0 14,624.9 1,357.3 22,579.3Receive-floater/pay-fix 3,373.1 2,462.2 1,629.5 7,464.9Receive-floater/pay-floater - 10.0 - 10.0
9,970.2 17,097.2 2,986.8 30,054.3
2. Deferred gains (losses)(in billions of yen)
Deferred gains Deferred losses Net gains (losses)(A) (B) (A)-(B)
10.5 11.0 (0.5)252.0 229.1 22.8
Currency swaps 23.2 21.0 2.21.2 0.2 0.92.3 2.4 (0.1)
289.3 263.9 25.4Note: Deferred gains (losses) attributable to the macro hedge accounting as of September 30, 2004 are included in the table above.
As of September 30, 2004
Market value
Interest rate futuresInterest rate swaps
Other interest rate-related transactionsOthers
Total
Due within 1 year
Total
As of September 30, 2004
Interest rate futuresInterest rate swaps
Other interest rate-related transactionsOthers
Due after 5 years Total
Total
As of September 30, 2004
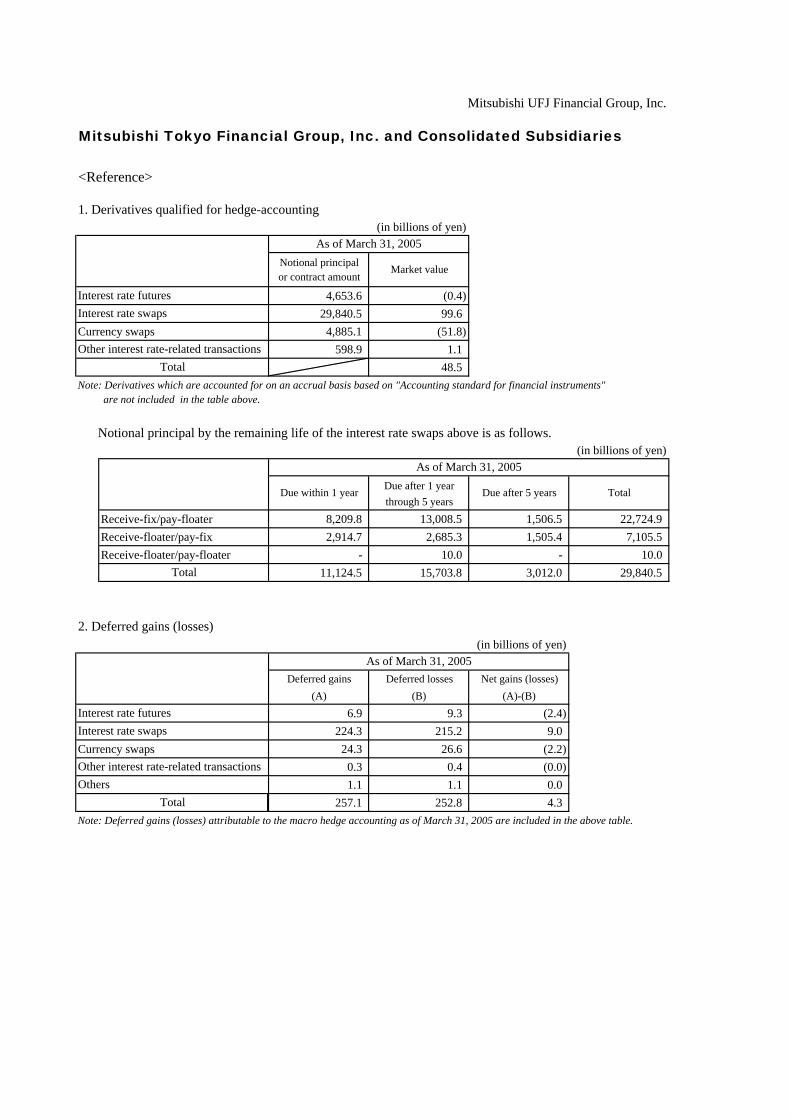
Mitsubishi UFJ Financial Group, Inc.
Mitsubishi Tokyo Financial Group, Inc. and Consolidated Subsidiaries
<Reference>
1. Derivatives qualified for hedge-accounting(in billions of yen)
Notional principalor contract amount
4,653.6 (0.4)29,840.5 99.6
Currency swaps 4,885.1 (51.8)598.9 1.1
48.5Note: Derivatives which are accounted for on an accrual basis based on "Accounting standard for financial instruments"
are not included in the table above.
Notional principal by the remaining life of the interest rate swaps above is as follows.(in billions of yen)
Due after 1 yearthrough 5 years
Receive-fix/pay-floater 8,209.8 13,008.5 1,506.5 22,724.9Receive-floater/pay-fix 2,914.7 2,685.3 1,505.4 7,105.5Receive-floater/pay-floater - 10.0 - 10.0
11,124.5 15,703.8 3,012.0 29,840.5
2. Deferred gains (losses)(in billions of yen)
Deferred gains Deferred losses Net gains (losses)(A) (B) (A)-(B)
6.9 9.3 (2.4)224.3 215.2 9.0
Currency swaps 24.3 26.6 (2.2)0.3 0.4 (0.0)1.1 1.1 0.0
257.1 252.8 4.3Note: Deferred gains (losses) attributable to the macro hedge accounting as of March 31, 2005 are included in the above table.
Other interest rate-related transactionsTotal
As of March 31, 2005
As of March 31, 2005
Market value
Interest rate futuresInterest rate swaps
Due within 1 year Due after 5 years Total
Total
OthersTotal
As of March 31, 2005
Interest rate futuresInterest rate swaps
Other interest rate-related transactions
Recommended


![[2012]Consolidated Interim Financial Statements](https://img.pdfslide.us/doc/110x75/55cf9a69550346d033a19aa5/2012consolidated-interim-financial-statements.jpg)