Slide 1

Slide 2
Important information
This presentation may contain forward looking statements, including such statements within the meaning of Section 27A of the US Securities Act of 1933 and Section 21E of the Securities Exchange Act of 1934. These statements concern or may affect future matters, such as the Group's economic results, business plans and strategies, and are based upon the current expectations of the directors. They are subject to a number of risks and uncertainties that might cause actual results and events to differ materially from the expectations expressed in or implied by such forward looking statements. Factors that could cause or contribute to differences in current expectations include, but are not limited to, regulatory developments, competitive conditions, technological developments and general economic conditions. These factors, risks and uncertainties are discussed in the Group's SEC filings. The Group assumes no responsibility to update any of the forwardlooking statements contained in this presentation.
The information, statements and opinions contained in this presentation do not constitute a public offer under any applicable legislation or an offer to sell or solicitation of an offer to buy any securities or financial instruments or any advice or recommendation with respect to such securities or other financial instruments.
The information contained in this presentation is subject to, and must be read in conjunction with, all other publicly available information, including, where relevant any fuller disclosure document published by the Group. Any person at any time acquiring the securities must do so only on the basis of such person’s own judgement as to the merits of the suitability of the securities for its purposes and only on such information as is contained in public information having taken all such professional or other advice as it considers necessary or appropriate in the circumstances and not in reliance on the information contained herein. The information is not tailored for any particular investor and does not constitute individual investment advice. Information in this presentation relating to the price at which investments have been bought or sold in the pastor the yield on investments cannot be relied upon as a guide to future performance.

Slide 3

Slide 4
The 3-5 Year Journey to Standalone Strength
Rebuild attractive shareholder value for all and enable UK Government to sell down its shareholding profitably
Be leaders in our markets – effective and disciplined in our management
Re-commit the entire organisation to delivering for our customers
Restructure as premier financial institution, anchored in the UK while serving individual and institutional customers here and globally
Our primary task is to rebuild standalone strength and value

Slide 5
Building Blocks Necessary for Recovery
What now – Execution!
Recapitalisation & Government funding support
Management and Board changes
Analysis and Presentation of ‘the problems’
TodayNew Strategy – roadmap to unite people and resources
Asset Protection Scheme – improve protection against extreme loss during strategy execution
Severity of downturn “manageable”
Today
Tbd
Slide 6
Today
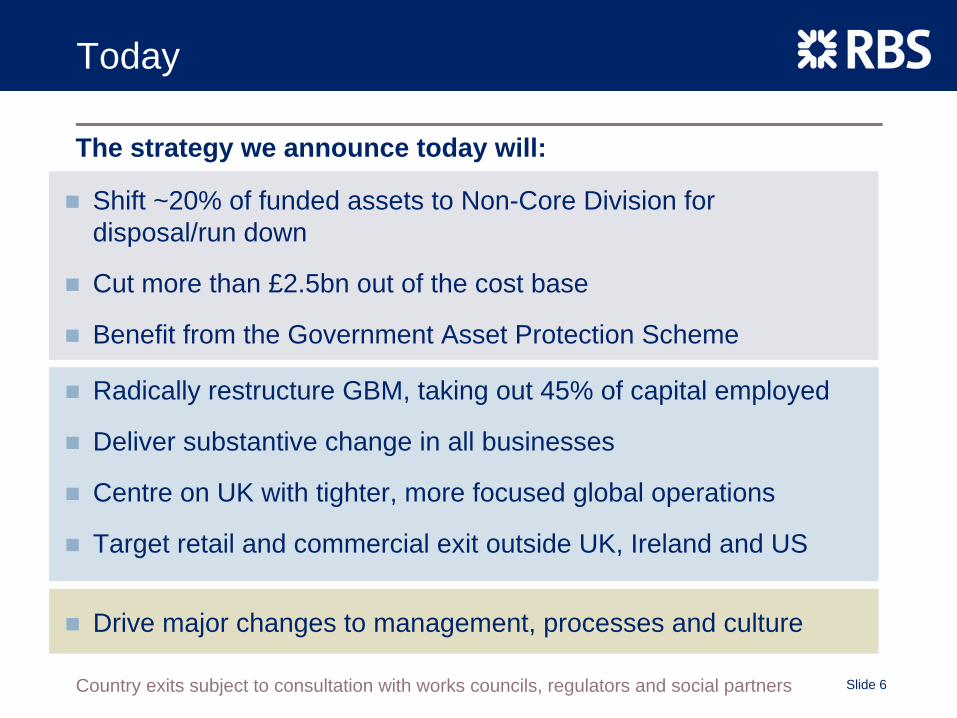
The strategy we announce today will:
Shift ~20% of funded assets to Non-Core Division for disposal/run down
Cut more than £2.5bn out of the cost base
Benefit from the Government Asset Protection Scheme
Drive major changes to management, processes and culture
Radically restructure GBM, taking out 45% of capital employed
Deliver substantive change in all businesses
Centre on UK with tighter, more focused global operations
Target retail and commercial exit outside UK, Ireland and US
Country exits subject to consultation with works councils, regulators and social partners

Slide 7
Major decisions on Strategy made
Deleveraging and reducing wholesale funding begun
New RWA and asset growth constrained
Comprehensive cost reduction underway
Restructured compensation
Fuller suite of management tools deployed
Introduced new disciplines on risk concentrations and processes
Restructured and simplified management
Action to Date

Slide 8
2008 Results
Our results for 2008 were bad:
Net attributable losses before goodwill of £7.9bn
£16.2bn write-down of goodwill paid on prior acquisitions
This masks the inherent strengths of RBS’ businesses and strong or resilient performances by most of the Bank
The global economic downturn will test us again in 2009
All our efforts are now focussed on the path to recovery

Slide 9
The Past – issues to address
Leverage ABN AMRO acquisition
Strategy
Profit focus Management & processes
Risk controls

Slide 10
Top Down Tests
Regain standalone AA ratings category – lower leverage, less reliance on unsecured wholesale funding, stronger businesses
15%+ return on tangible equity (ROE) – necessary to cover cost of capital
More stable business mix –cease proprietary activity, focus on customer flows, risk management & less leverage
Tests for each Business
Top tier competitive position in enduring customer franchise
15%+ ROE in normal markets
Proportionate use of balance sheet, risk & funding
Capable of organic growth –but “market limited”
Connected to the Group –customers, products, people
Strategic Plan

Slide 11
CoreUK Retail UK Corporate & CommercialWealthUlsterCitizensInsuranceGBMGTS
Strategic Plan
Non-Core Non-Core division to be separately managed and wound down within the existing legal structures of the Group
All other businesses have been through root and branch strategic review: no sacred cowsMany will be significantly restructuredAll subject to cost programmeAll have tight RWA targets
A ‘self help’ programme given weakness of disposal markets
Non-Core and Core split

Slide 12
Non-Core
Non-strategic assets
Stressed assets
Includes portfolios, assets and businesses
Vast majority from GBM
Retail and commercial businesses continental Europe and Asia
Other Retail & Commercial Non-Core
Separately managed, reporting line to CEO
Matrix support from donor Divisions
Run-off over 3-5 years as fast as is consistent with value and risk
2008 financials
~£240bn assets (+~£145bn derivative positions)
~£155bn RWA
~£3.9bn revenues
~£1.1bn direct expenses
~£3.2bn impairment losses
~£9.2bn credit market and other trading asset write-downs

Slide 13
Non-Core
145
145240
205GBM
UK R&C
Asia R&C
EME R&C
Total
Citizens
60
60
95
40
30
70
145240
Asia
US
UK
EME
Total
Non-Core Assets by Division, 2008 £bn Non-Core Assets by Region, 2008 £bn
350
385 385
5
14
15
1
525
Third Party Assets excluding derivatives MTM Derivatives MTMGBM geographic split based on client view
Slide 14
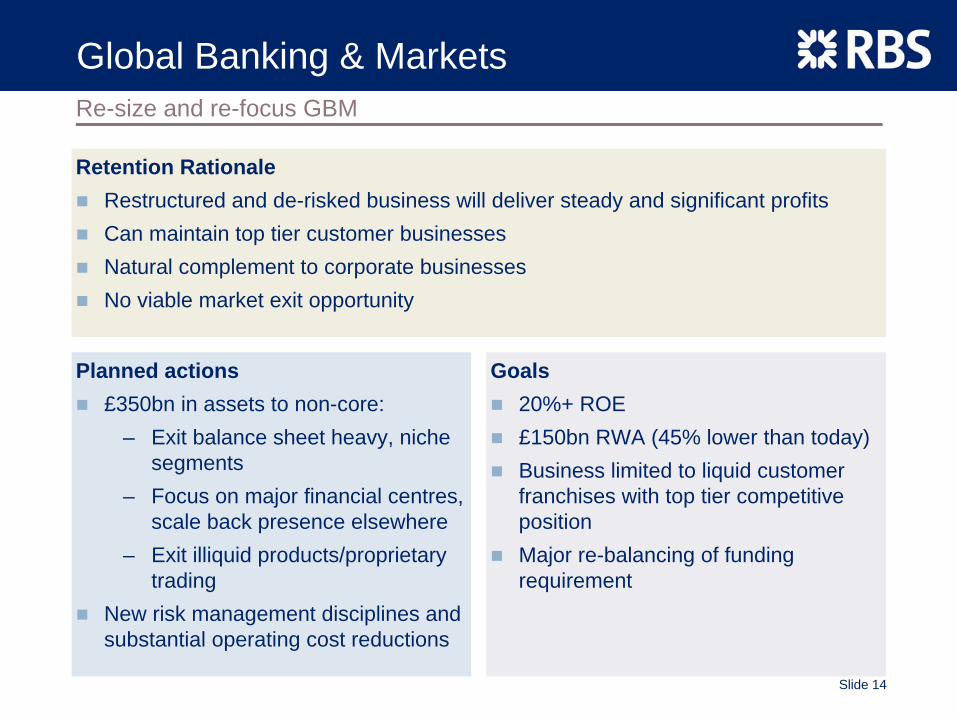
Global Banking & MarketsRe-size and re-focus GBM
Planned actions£350bn in assets to non-core:
– Exit balance sheet heavy, niche segments
– Focus on major financial centres, scale back presence elsewhere
– Exit illiquid products/proprietary trading
New risk management disciplines and substantial operating cost reductions
Retention RationaleRestructured and de-risked business will deliver steady and significant profitsCan maintain top tier customer businessesNatural complement to corporate businessesNo viable market exit opportunity
Goals20%+ ROE£150bn RWA (45% lower than today)Business limited to liquid customer franchises with top tier competitive positionMajor re-balancing of funding requirement
Slide 15
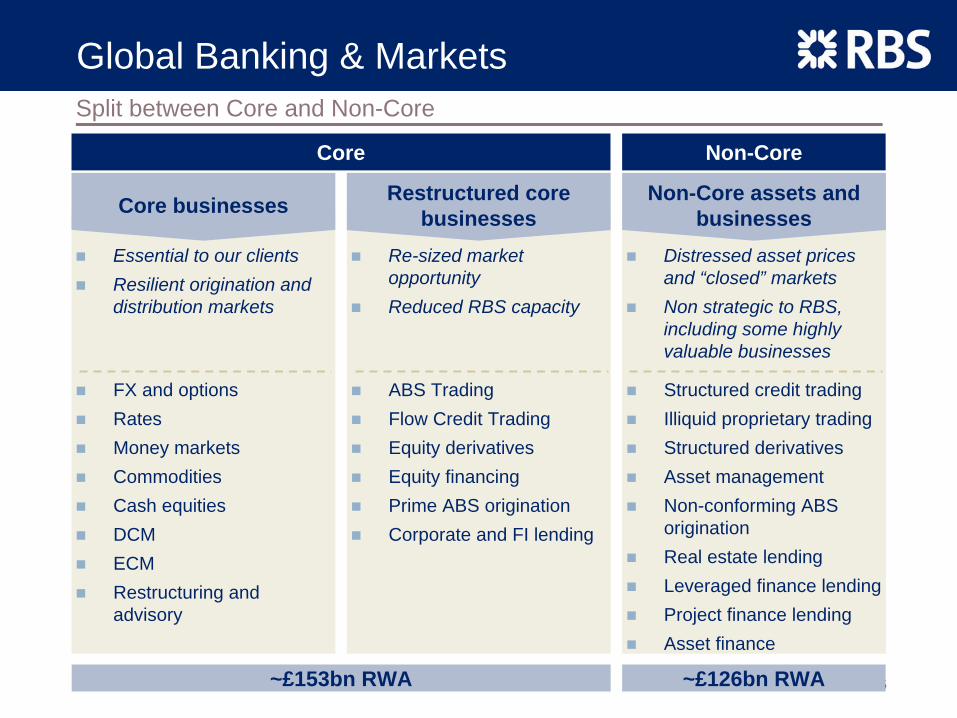
Essential to our clientsResilient origination and distribution markets
Re-sized market opportunityReduced RBS capacity
Distressed asset prices and “closed” marketsNon strategic to RBS, including some highly valuable businesses
Global Banking & MarketsSplit between Core and Non-Core
Core businesses Restructured core businesses
Non-Core assets and businesses
FX and optionsRatesMoney marketsCommoditiesCash equitiesDCMECMRestructuring and advisory
ABS TradingFlow Credit TradingEquity derivativesEquity financingPrime ABS originationCorporate and FI lending
Structured credit tradingIlliquid proprietary tradingStructured derivativesAsset managementNon-conforming ABS originationReal estate lendingLeveraged finance lendingProject finance lendingAsset finance
Core Non-Core
~£153bn RWA ~£126bn RWA

Slide 16
GBM & GTS International NetworkStreamlined footprint, while maintaining global proposition
Explore new ownership
Argentina, Bahrain, Chile, Colombia, Egypt, Kazakhstan, New Zealand, Pakistan, Philippines, Portugal, Romania, Slovakia, Uzbekistan, Venezuela, Vietnam
Refocused countries
Austria, Belgium, Brazil, Canada, Czech Republic, Denmark, Finland, Greece, Indonesia, Korea, Luxembourg, Malaysia, Mexico, Norway, Poland, Qatar, South Africa, Switzerland, Taiwan, Thailand, Turkey
Primary countries
Australia, China, France, Germany, Hong Kong, India, Ireland, Italy, Japan, Netherlands, Russia, Singapore, Spain, Sweden, UAE, UK, US
Subject to consultation with works councils, regulators and social partners

Slide 17
CitizensFocus on retail and commercial customer relationships in core footprint
Planned actionsExit most activities outside core “footprint”Cost restructuring in order to re-invest in the core franchise (incl technology and marketing spend)Improved cross-sell to in-footprint customersResize risk portfoliosRevitalise retail (sales, technology, deposits)
Retention RationaleStrong franchise and attractive portfolio in core markets Meets the Group strategic tests over cycleImproves Group funding ratiosImproves Group geographic balance and opportunitiesSale would be destructive of value and capital
GoalsTop 5 in the markets we serveDisciplined use of balance sheet:
– 1:1 ratio loans/deposits– Retain below average risk profile
15%+ ROE Greater organic growthIncrease connectivity with rest of Group

Slide 18
Reduce costs: Online, lean, automationSegment service by valueInvest in systems and sales
Manage portfolio stressReduce cost base, tailor cost to serve to valueInvest in systems and service
Consolidate UK and internationalGrow RM base, enhance productivityInvestment in platform
UK and Wealth
UK Retail UK Corporate & Commercial Wealth
ROE 15%+Funding growing faster than assetsCustomer service leadershipLending commitments
ROE 15%+Work off risk concentrationsStronger credit, portfolio management processesDeposit growthLending commitments
Maintain high ROE Continued AuM growth Sustain UK market leadership
Key
Act
ions
Goa
ls

Slide 19
Re-balance assets/ liabilitiesPro-actively manage riskIncrease and diversify deposit baseMove to single brandSignificant cost restructuring
Re-invigorate top line growth by investing efficiencies Strengthen multi-channel distribution
Maximize value of global capabilitiesRightsize the global network (incl. country exits) Maintain service levelsSlimmed down operating model
Other businesses
Ulster Bank Insurance GTS
15%+ ROEImproved loan:depositratioRisk concentration reducedFranchises maintained
20%+ ROEExtend leadLowest cost operationsStrong UK commercial lines
Maintain high ROEEurope as core baseLeading SEPA bankExplore in-organic options
Key
act
ions
Goa
ls

Slide 20
Management disciplines and culture
Financial disciplineImproved controls and costs/capital fully allocated to Divisions
Focus on funding balance
Disciplined RWA usage in the core (value not volume)
Focus on returns (and setting of return targets) not just profits
Total balance sheet size controlled and liquidity surprises avoided
Risk management disciplinesReduced single name, sector & country concentration limits
Earnings volatility/ impairments managed down
Strengthened risk function role
Drive business performance through focus on returns and strategy
New reporting systems increase transparency
Underpinned by new management processes and incentives

Slide 21
Expenses
Maximising efficiency crucial
to restoring shareholder value
Deliver greater than £2.5bn (16%) efficiency cost savings by 2011 versus 2008, at constant exchange rates
This includes the remaining £0.5bn already promised from ABN AMRO integration not reflected in 2008
The greatest savings arise in GBM and Manufacturing
Restructuring charges likely over next 3 years: 1.5 - 1.75 year payback targeted
The programme does not include effect of inflation, incentive pay movements, or cost reductions arising from business exits or the impact of new projects (if any)

Slide 22
The Asset Protection Scheme
Secure asset insurance that protects and enhances capital strength and outlook, thereby
Enhancing financial strength and stability for customers and depositors
Reducing risk to shareholders
Allowing greater support for UK customers via increased lending
Facilitating Non-Core run-off plan, leaving Core Bank more free to restructure and progress
RBS objectives

Slide 23
The Asset Protection Scheme
RBS has the opportunity to “insure” the following portfolios:
– £225bn third party assets and £44bn undrawn commitments
– £33bn derivative counterparty risk exposures
– Total pool of £302bn, RWAs ~£160bn
Insured assets would be:
– 53% placed in non-core division
– 47% part of ongoing businesses. Rationale for latter to “make room” for new UK lending commitments
More detail and recommendation to shareholders to follow in the coming weeks
Overview

Slide 24
The Asset Protection Scheme
£6.5bn fee would be “paid” up front via issue to HMT of B shares, a Core Tier 1 capital instrument defined as ordinary shares with preferential rights in respect of dividends
Additional £13bn of capital would be issued to HMT as part of APS agreement with a further £6bn available thereafter at RBS’ option
Estimated at £144bn at 31 Dec 2008(Reflecting 90/10 risk sharing on second loss)
RWA relief
Percentage of first loss borne by RBS on pool
Split of second loss
Fee paid
6%
90% to HMT / 10% to RBS
2% of gross pool to be amortised over 7 years
Core elements of the scheme Description

Slide 25
Pro forma financial impact 31 Dec 2008
Pre Post
RWAs £578bn £434bn
Core Tier 1 capital £41bn £54bn
Core Tier 1 ratio 7.0% 12.4%
Post APS Core Tier 1 impacted by issuance of £19.5bn B shares, offset by the £6bn deduction of first loss exposure (50% of first loss, capped at 8% of RWAs)
Over time book value attributable to Ordinary Shareholders eroded by fee amortisation, the cost of the B shares and potential losses on insured assets
RBS would also be required to give up the tax shelter from any part of future UK losses prior to returning to profitability
Slide 26
UK lending commitments
Entry into the APS would also involve RBS committing to:
£25bn increase in net lending commitments in 2009 (vs current plan)
Further £25bn increase provisionally targeted in 2010
Commitment for each year divided– £9bn mortgages– £16bn SME and corporate
Lending subject to commercial pricing, credit decisions and risk limits

Slide 27
The quantum and urgency of change required at RBS to recover its standalone strength is a major additional challenge
Market pessimism, illiquidity, strained funding markets and industry de-leveraging make “short cuts” unviable
Need to retain and motivate our people and rebuild external confidence
Executing “business as usual” is a challenge for all banks in the current economic environment
Challenges at Hand
Market environment very uncertain – credit costs are rising, risk of further write-downs

Slide 28
Building Blocks Necessary for Recovery
What now – Execution!
Recapitalisation & Government funding support
Management and Board changes
Analysis and Presentation of ‘the problems’
TodayNew Strategy – roadmap to unite people and resources
Asset Protection Scheme – improve protection against extreme loss during strategy execution
Severity of downturn “manageable”
Today
Tbd

Slide 29

Financial Review

Slide 31
26.7
2008 group results
£bn
1 Net of Bancassurance claims2 Includes £0.5bn charged to impairments relating to re-classified assets3 Includes FV of debt of £1.2bn, £0.4bn disposal gains, £0.3bn share of shared assets, £1.1bn integration costs, £0.3bn restructuring costs & £0.4bn amortisation of intangibles4 Before exceptional goodwill impairments5 Including tax credit of £0.7bn
(7.8) 1.3 (1.0)
(16.2)
(15.9)
(3.7)(7.0)
(7.9)
Total income1
(0.5)
Insurance claims
Credit market
write-downs2
Attributable loss before
goodwill impairments4
Tax Exceptional goodwill
impairments5
Costs Other3 MI & Pre- ference shares
Impairments
Slide 32
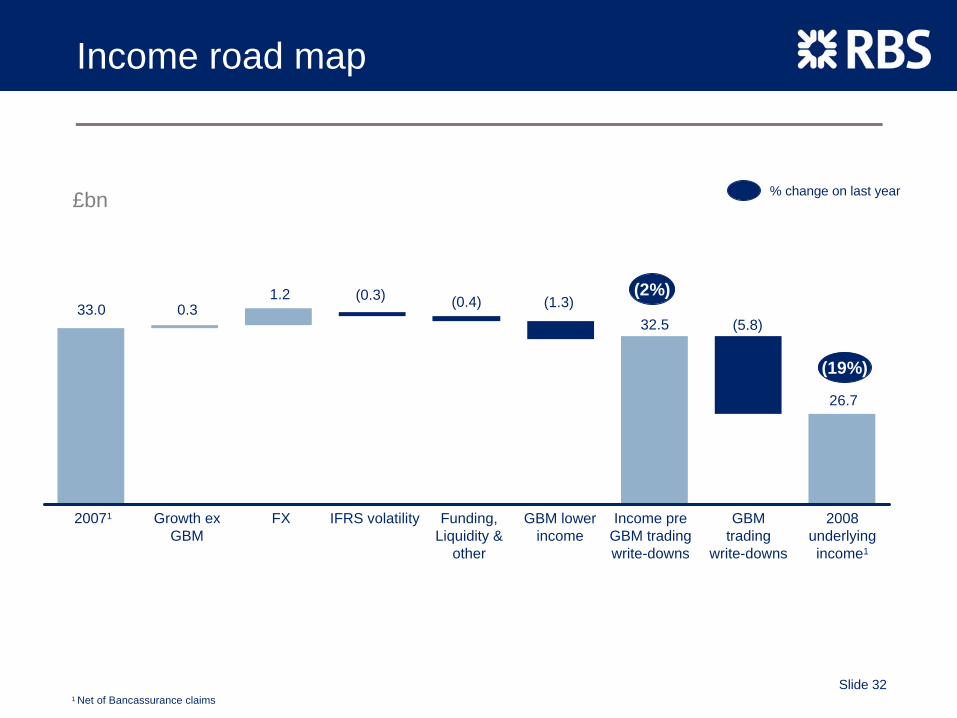
Income road map
FX
(5.8)
Growth ex GBM
(1.3)
20071
(0.3)
GBM trading
write-downs
(0.4)
Funding, Liquidity &
other
32.50.3
GBM lower income
1.2
IFRS volatility 2008 underlying income1
33.0
26.7
(2%)
Income pre GBM trading write-downs
(19%)
£bn
1 Net of Bancassurance claims
% change on last year

Slide 33
Cost road map
£bn % change on last year
FSCS Levy
Incremental investment
Operating lease
provisions
Wage awards
(1.9)
FXVariable pay
2007 2008
(66%) (4%)
15.90.20.10.60.10.216.6

Slide 34
Impairments road map
£bn
1 Impairments relating to re-classified assets shown separately in credit market write-downs
% change on last year
7.40.56.93.0
0.10.40.7
0.62.1
2008 inc re- classified
asset impairments
2007 UK R&C US R&C
EMER&C
AsiaR&C
GBM Re-classified asset impair-
ments1
2008 total
+230%

Slide 35
Divisional operating profit1
£bn
1 Post manufacturing costs2 Excludes £7bn of credit market write-downs & one off items, £0.5bn of impairments relating to re-classified assets, and includes £5.8bn of other trading asset
write-downs3 Includes central function headcount
0.1
1.3
0.8
0.10.5
0.41.1
1.8
UK Retail
UK Commercial
UK Wealth
(0.1)
GTS
(3.6)
GBM2
(1.3)
AsiaR&C
Central: funding costs
Underlying Group
operating profit
EMER&C
Insurance Central: other costs3
(0.9)
US R&C

Slide 36
Divisional income
£bn
1 Net of Bancassurance claims2 Excludes £7bn of credit market write-downs & one off items, includes £5.8bn of other trading asset write-downs
26.72.5
4.4
5.6
0.81.5
3.0
0.93.2
6.7
AsiaR&C
Insurance GBM2 GTS Centre & other
2008 underlying income1,2
UK Retail1
UK Commercial
UK Wealth
US R&C
EMER&C
(1.9)

Slide 37
Net interest margin trends
FY08 09 OutlookFY07 Comments
UK R&C 3.39 3.21
US R&C 2.74 2.73
EME R&C 2.23 2.02
GBM 0.75 1.19
Group 2.00 2.10
Higher funding costs/lower deposit margins
Outweigh improved front book pricing
%%
Strong Money Markets from declining rates
2009 outlook impacted by:Low interest rates 10-15bpsIncremental liquidity costs 5-10bpsLower deposit margins 5-10bps

Slide 38
GBM – underlying income
2008 Revenue = £10.2bn2008 £bn
2007 £bn %
Underlying revenue 10.2 10.9 (6)
Trading write-downs (5.8) - -
Published underlying revenue 4.4 10.9 (60)
Credit market write-downs (7.0) (1.8) -
Published headline revenue (2.5) 9.1 -
Rates, Currencies and Commodities strong
Debt and Equity subdued
Write-downs as previously indicated
Commodities: £0.8bn
Credit Markets: £1.4bn (-50%)
Currencies: £1.7bn (+55%)
Rates: £3.5bn (+40%)
Equities: £0.4bn (-64%)
A&PM: £2.4bn (-28%)
Other items: 2008 £bn
2007 £bn
- RBS Sempra Commodities 0.8 -
- other operating income 0.6 1.9
Note:Published write-downs = £7.0bn. This includes total losses of (£9.0bn) plus gains on fair value own debt and CDS hedging of £2.0bnA&PM = Asset & Portfolio Management

Risk Management

Slide 40
GBM – Trading asset write-downs
Write-down1
£bnComments
MTM write-downs on run-off businesses
CVA increase of £1.3bn offset by hedging benefits
Principal losses on Merchant Banking and Private Equity portfolios
Principal Finance
Structured credit
Counterparty
Total Trading write-downs
CDPCs
Lehman Brothers (£0.7bn)Icelandic Banks (£0.6bn)Madoff (£0.6bn)
0.5
0.6
2.3
2.4
5.8£0.8bn total Q3 08£4.1bn total Q4 08
1 Pre-tax write-downs for full year 2008

Slide 41
GBM – Credit Market write-downs
1 Pre-tax write-downs for full year 2008 excluding £0.5bn relating to re-classified assets2 Exposures as at 31 December 2008 net of hedges and write-downs3 Held-for-trading
Write-down1
£bn
CLOs
ABS CDOs
US Residential Mortgages
Total
0.1
1.5
3.0
0.2
1.6
3.1
7.3
1.1
US Commercial Mortgages
Monolines ExposuresLeveraged Loans - HFT
CDS Hedging
1.3 21
Net Exposure2
Avg Price %
0 n/a
0.5 81
0.1 n/a
4.8 n/a
0.4 87
Comments
Legacy positions
Legacy portfolio - small remaining exposure in HFT3
Legacy portfolio – small remaining exposure in HFT3
Legacy positions – now exited
CVA of £6bn, over 50% reserved
Legacy positions – exposures much reduced

Slide 42
Impairments by division
Impairments £bn
2008 inc re- classified assets
Re-classified assets
UK Retail & Wealth
UK Corporate & CommercialUS Retail & Commercial
EME
Asia
GBM
2008 Total
7.4
0.5
1.3
0.7
1.0
0.5
0.2
3.2
6.9
Comments
Personal unsecured flat, weaker H2Primarily small business deterioration
Mainly house builder and development propertyLosses concentrated in smaller end of corporate sectorRetail deterioration, SBO build and Commercial Real Estate
Primarily residential investment and development
Deterioration in consumer credit portfolios
£2.7bn in Q4, including LyondellBasell (£0.9bn) and other smaller cases
Total £4.8bn higher than 2007
IAS 39 re-classified assets

Slide 43
Credit quality
1 Gross loans & advances to customers excluding reverse repurchase agreements and stock borrowing 2 Impairment charge calculation excludes impairments from available-for-sale securities3 Provision coverage is in respect of both customers and banks
FY 2007Change
(reported)
5950Provision coverage %3
563 25% 8%701Gross Loans & Advances (L&A)1 £bn
8.4 126% 113%18.9NPL + PPL £bn
1.49%2.69%NPL + PPL % of L&A
0.370.91Impairment charge % L&A2
Change (constant FX)FY 2008
NPLs increased £10bn: 50% GBM, 50% Regional MarketsProvision balance−
60% RM−
40% GBMLower coverage ratio reflects changing mix from unsecured personal to secured exposures and write-offs of £3bn

Slide 44
Portfolio quality – overview
Exposure1 risk rating
0 10 20 30
AQ1
AQ2
AQ3
AQ4
AQ5
AQ6
AQ7
AQ8
AQ9
AQ10
Heightened monitoring
% of portfolio by grade
Normal monitoring
Financial institutions
Corporates and personal
Heightened monitoring
Financial institutions
Corporates and personal
NPLs
Total
Portfolio performance
£bn
703
110
593
133
64
69
19
855
Exposure by division
% of portfolio by division
GBM
UKCB
UK Retail
Citizens
Ulster
Other
10 20 30 40 50 60
1 Exposures are defined as credit risk assets consisting of loans and advances (including overdraft facilities), installment credit, finance lease receivables, debt securities and other traded instruments across all customer types.Asset Quality (AQ) bands allow the internal reporting and oversight of risk assets by differentiating on the basis of the key drivers of default for a customer type. Bands also map to asset quality and wholesale exposure scales, enabling detailed internal and external reporting of risk depending on audience and business need
Normal monitoring
Non-Performing Book

Slide 45
Exposure by sectorExposure by country
Portfolio quality – by country and sector
1 Exposures are defined as credit risk assets consisting of loans and advances (including overdraft facilities), installment credit, finance lease receivables, debt securities and other traded instruments across all customer types.
% of portfolio by country
0 10 20 30 40
United Kingdom
Western Europe (Excluding UK)
North America
Asia & Pacific
Latin America
CEE & Central Asia
Middle East & Africa
% of portfolio by sector 0 5 10 15 20 25 30
Personal
Banks, other FIs
Agriculture and Fisheries
Wholesale and retail trade
Building
Property
Power, Water & Waste
Natural Resources and Nuclear
Manufacturing
Public Sectors & Quasi-Government
TMT
Business Services
Tourism and Leisure
Transport and Storage
Heightened monitoring
Normal monitoring
Non-Performing Book

Slide 46
Commercial Property exposure1
RBS EME18%
RBS UK43%
US R&C7%
GBM32%
Global portfolio: £97bn
Core portfolio cumulative LTV distribution:
By Division:
90%
71%
45%
27%17%
8% 4%1%
>50% >60% >70% >75% >80% >85% >90% >100%
UK portfolio2, 3: £56bn
58% UK lending, 12% RoI, 8% US, Western Europe 17% o/w Spain 3%, Germany 6%73% investment, 24% developmentLess than 2% speculative lendingAverage LTV 84%3
Occupier markets are weakeningLower interest rates mitigates the impact on tenant cash flow
1 Includes commercial property and residential property developers2 Includes RBS UK (£41bn), GBM (£9bn) & UB NI (£6bn). LTV calculation based on a sub portfolio of £43bn where LTVs are applicable3 Basis of valuation - Cumulative LTVs, most recent valuation; Average LTVs - based on stress testing and applying property index movements to update valuations

Slide 47
Single Name Concentration1 exposure
1 Single Name Concentration defined as names > £0.5bn total committed exposure2 TCE (Total committed exposure) includes both credit and counterparty risk. Total TCE group-wide as of year end 2008 = £1trn
253Total (127 FIs)
132Of which top 20
160Total (170 corporates)
44Of which top 20
Fina
ncia
l In
stitu
tions
Cor
pora
te
Total committed exposure (TCE)2, £bn
TCE2/entity, £bn
Investment grade %
100%
93%
83%
75%
Heightened monitoring cases
2
5
2
18
6.6
2.0
2.1
0.9
% of total TCE2
13%
25%
4%
16%

Slide 48
Impairments outlook
2008: No. of corporate cases transferred to Recoveries Units Globally
Case flow reflects economic downturn
Cyclical industries impacted first e.g. Property, construction
Signs of broader weakness now showing
* Other includes TMT, Tourism & Leisure, Business Services, Banks & FIs and others
0
50
100
150
200
250
300
350
400
450
01234567891011121314
Jan DecNovOctSepJunMar
£bnNo. of cases
Value transferred into recoveries unit
Other*
Transport & Storage
Manufacturing
Construction
Wholesale & Retail Trade
Property

Slide 49
Risk mitigation actions
Problem recognition and management
Scale up of recoveries units globallyEarly transfer to specialist monitoring and management units
Trading counterparties
Reduced trading positionsReduced credit markets inventoryTightened collateral management
Single name concentrations
Targeted reduction of biggest exposures
Country risk concentration
Reduced limits to 25 emerging markets countries by 31%
APSSignificant risk mitigation across credit and trading portfolios

Slide 50
GBM – Derivative Trading Assets
£bn
Asset (Gross MTM) 2008 £bn 2007 £bn % Chg
Interest rate 648 201 223%
Currency 162 46 250%
Credit derivatives 161 26 526%
Equity 9 6 38%
GBM Total1 980 279 251%
Uncollateralised Derivative Portfolio 2008 £bn %
Government 8 8
Investment Grade 48 50
Monolines & CDPCs 17 18
Non-Investment Grade 23 24
Total 96 100
Netting Benefit
Collateral Offset
Uncollater- alised MTM
Gross MTM1
980 796
8896
184
Net MTM
1 Excludes £11bn of non-GBM derivatives. The net MTM is the MTM post legal netting applied in RBS GBM credit management systems
Collateralised exposure:
95% G7 cash or government bonds, 5% other securities with haircut
Uncollateralised exposure:
Includes mid-corporate exposure in non-investment grade
£9.9bn reserve against uncollateralised exposure
Growth in position driven by:
80% market parameters; i.e. interest rates/credit spreads
12% FX related
8% volume related
Derivatives: majority is flow product in liquid markets

Funding & Capital
Slide 52
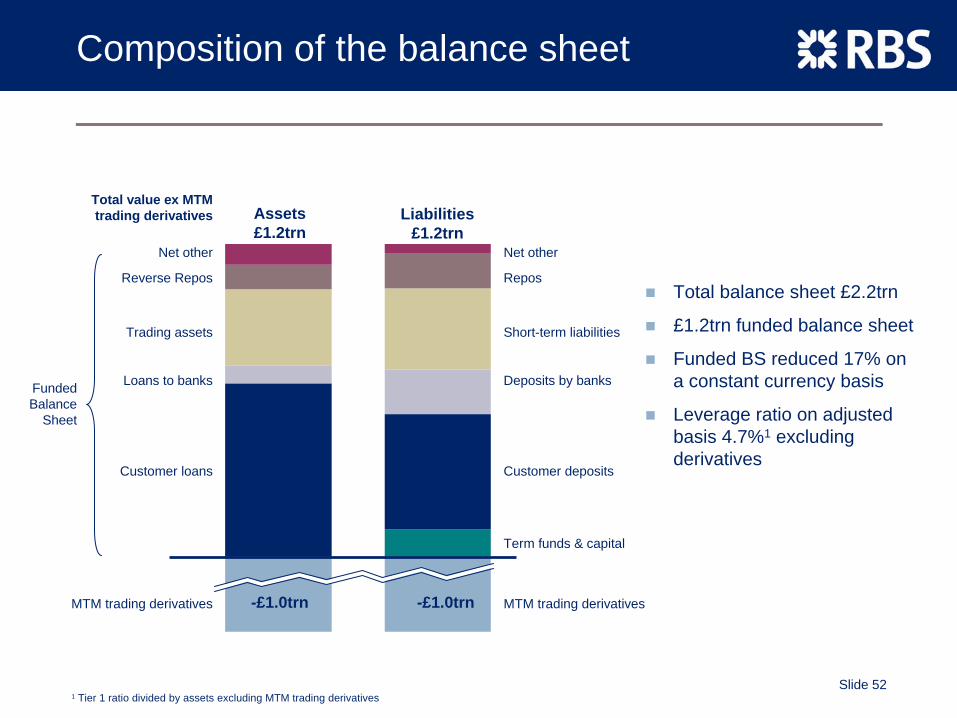
Composition of the balance sheet
Total balance sheet £2.2trn
£1.2trn funded balance sheet
Funded BS reduced 17% on a constant currency basis
Leverage ratio on adjusted basis 4.7%1 excluding derivatives
Trading assets
MTM trading derivatives
Customer loans
MTM trading derivatives
Term funds & capital
Customer deposits
Deposits by banks
Short-term liabilities
ReposReverse Repos
Loans to banks
Assets £1.2trn
Net other
Funded Balance
Sheet
Total value ex MTM trading derivatives
-£1.0trn -£1.0trn
Net other
Liabilities £1.2trn
1 Tier 1 ratio divided by assets excluding MTM trading derivatives

Slide 53
GBM funded balance sheet
Reported vs Constant FX
£bn
FY07 H108 FY08
874 874
767 750692
594
R C R C R C
R – Reported currencyC – Constant currency
Loans & AdvancesReverse ReposSecuritiesOther
Funded assets reduced 21% on a reported basisFunded assets reduced 31% on a constant currency basisSecurities & Repos reduced by 41% and 73% on a constant currency basisL&A up 14% underlying, predominantly reflecting increased drawdowns

Slide 54
RWA progression
£bn
1 Includes Basel II model benefits, underlying performance and methodology changes
5783665822486
RetailFull year 2007
(12)
Full year 2008
Other items1FX Sempra & small disposals
GBM Other corporate
Pro-cyclicality

Slide 55
Capital progression – Core Tier One Ratio
%
1 Other includes underlying RWA reduction and pension adjustment
(1.7)
(0.1)
(0.2)
FY07
(0.4)
Dividends
(0.6)
£12bn Rights Issue
RWA pro- cyclicality
Per FSA guideline
RWA FX impact
Attributable loss
FX capital hedge
Tier 1 deductions
£5bn Preference
share conversion
Pro forma 2008
Other1 £15bn Capital Raising
6.87.00.9
2.7
0.52.2
(0.5)4.0

Slide 56
Illustrative “target” shape of balance sheet
Non core bank
Reduce risk focused on core business
Balanced funding position
Stable returns
470
900
550
550
0
Core Tier 1 Ratio
RWA*
What would it take to get there?3-5 years
6.5%Nominal assets
Customer loans/deposits
Customer deposits
100%Customer loansCustomer loans- deposits
Return on equity
15%+
~£110bn reduction in RWA~£250bn reduction in nominal assets
3.6% CAGR in customer deposits (£90bn total increase)4.4% annual reduction in customer assets (£140bn total decrease)
Weathering 2009-11Smoothing volatility with APSCore businesses generating strong earnings by 2012-13
£bn

Slide 57

AppendixSupplementary Slides

Slide 59
Appendix - table of contents
Pg Pg
Strategic Review 60 GBM
– UK Retail 61 – Impairment losses 82
– UK Commercial 62 – Non-derivative trading assets 83
– Wealth 63 – Reverse repos 84
– Ulster Bank 64 UK R&C
– Insurance 65 – Impairment losses – UK Retail 85
– Global Transaction Services (GTS) 66 – Mortgages 86
Geographic Income – GBM & GTS 67 – Impairment losses – UK Corporate & Commercial 87
Profit Road Maps: US R&C
– Global Banking & Markets 68 – Consumer Portfolio 88
– Global Transaction Services 69 – Impairment losses – US Retail 89
– UK Retail & Commercial (inc Wealth) 70 – Consumer lending metrics 90
– US Retail & Commercial 71 – Commercial Property 91
– EME Retail & Commercial 72 – Impairment losses – US Commercial 92
– Asia Retail & Commercial 73 Ulster Bank
– Insurance 74 – UB Portfolio 93
– Manufacturing 75 – Impairment losses – UB Retail 94
Exposures – Commercial Property 95
– Credit by Corporate Sectors 76 – Impairment losses – UB Commercial 96
– UK Commercial Property 77 Asian Consumer Finance 97
Slide 60
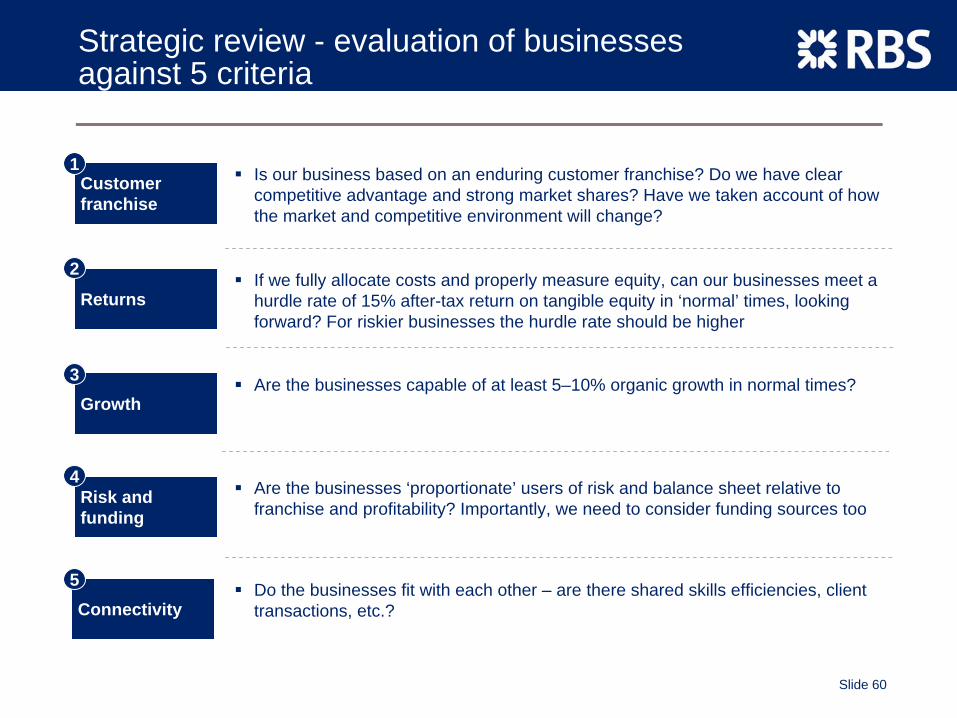
Strategic review - evaluation of businesses against 5 criteria
Customer franchise
Is our business based on an enduring customer franchise? Do we have clear competitive advantage and strong market shares? Have we taken account of how the market and competitive environment will change?
1
Returns
2 If we fully allocate costs and properly measure equity, can our businesses meet a hurdle rate of 15% after-tax return on tangible equity in ‘normal’ times, looking forward? For riskier businesses the hurdle rate should be higher
Growth3 Are the businesses capable of at least 5–10% organic growth in normal times?
Risk and funding
4 Are the businesses ‘proportionate’ users of risk and balance sheet relative to franchise and profitability? Importantly, we need to consider funding sources too
Connectivity5 Do the businesses fit with each other – are there shared skills efficiencies, client
transactions, etc.?

Slide 61
UK RetailRe-position in a changing market
Planned actionsReduce costs: shift online; lean processes and automationSegment service propositions by valueInvest in sales: improve cross-selling and front-line productivity
PositionLeading UK retail franchise with 15m+ customersSignificant revenue pressures from economic environment and regulation
Goals15%+ ROE regainedMaintain customer service reputationFunding growing faster than assetsLeading sales and cross-sales productivitySupport customers and fulfil lending commitments

Slide 62
UK Corporate and CommercialOptimise the value of market leadership
Planned actionsManage portfolio stressReduce cost base and tailor cost to serve to valueImprove funding contributionInvest in credit and MI systems, new channels and branch service
PositionMarket leaders with 30%+ market shareSignificant exposure to property Client stress a major short term challengeConsiderable opportunities to grow cross-sell, build deposits and lower costs
GoalsROE 15%+Improved balance sheet diversityStronger credit processes and portfolio managementImproved risk/return per customerFaster than market deposit growthMaintain market leadershipSupport customers and fulfil our lending commitments support customers

Slide 63
WealthFurther growth opportunities
Planned actionsConsolidate UK and International Wealth businessesGrow RM base, enhance productivityContinue investment in platform
PositionUK market leader, well positioned in its international marketsMarket leading performer on revenue margin and asset growthLarge profitable Group contribution with headroom to grow
GoalsMaintain high ROE Continued AuM growth from greater share of wallet and market penetrationSustain UK market leadership

Slide 64
Ulster BankManage tightly through economic weakness
Planned actionsSupport our customers whilst re-balancing assets/liabilitiesIncrease and diversify deposit base and reduce reliance on wholesale Pro-actively manage risk exposures Move to a single brand strategyAchieve significant cost reduction
Retention RationaleLeader in Northern Ireland and #3 position in Republic of IrelandFranchise is strong, fully invested and shares UK infrastructureMeets the Group tests over cycle
GoalsROE 15%+Improved loan to deposit ratioLeading franchises maintainedRisk concentration significantly reduced

Slide 65
InsuranceUK market leader
Planned actionsReinvigorate top line UK growth by investing cost and claims efficiencies into pricing, capability and other growth initiativesStrengthen multi-channel distribution:
– Bank channels – Online
Retention RationaleUK’s #1 personal lines insurer; operates the two leading direct brands Well capitalised and self-fundingProvides source of stable and differentiated earnings (e.g., insurance cycle not strongly correlated with banking)Tied to renewed focus on UKRecent sale process demonstrated sale option currently value destructive
GoalsExtend lead as UK’s largest and most profitable personal lines insurerTarget lowest cost operationsBuild strong UK commercial lines business Sustain 20%+ ROE

Slide 66
Global Transaction ServicesStrong product capabilities supporting Group customers
Planned actionsMaximize value of global capabilities acquired from ABN AMRORightsize the global network (including country exits) ensuring minimal impact on key global clientsMaintain service levels during change Implement a slimmed down GTS/ Manufacturing front to back operating model
Retention RationaleHigh ROE, low riskMajor contributor of funds to GroupIntegral to wholesale/ commercial businesses in core markets
GoalsEstablish Europe as our core baseBecome a leading SEPA bankContinue to deliver high ROE and funding to the GroupExplore in-organic options on segments of business

Slide 67
GTS: FY08 Income £2.5bn
Geographic income – GBM and GTS
GBM: FY08 Underlying income £10.2bn
Europe18%
Americas14%
Asia-Pacific6%
RoW1%
UK61%
Europe17%
Americas22%
Asia-Pacific14%
RoW2%
UK45%

Slide 68
Profit road map - GBM
Exceptional performance in Rates, FX and Currencies
Cost reductions driven by lower variable compensation
91% of Impairments occurred in H2
4.6
2007 operating
profit
(1.3)(0.7)
Cost reduction
(0.9)
RLMCC1 Credit markets
2008 operating
loss3
Impairments
2.41.3 (3.2)
Equities A&PM
(5.8)
1 Rates, Local Markets, Currencies & Commodities2 Includes £0.5bn of impairments relating to re-classified assets3 Operating loss after credit market write-downs (£7.0bn) impairments on re-classified assets (£0.5bn) and other trading asset write-downs (£5.8bn)
£bn
(7.4) (11.0)
Trading asset write- downs
Credit market write-
downs2

Slide 69
129
2007 operating
profit
42
Cash Management
Impairments
(81)1,339
2008 operating
profit
96
Trade Finance
GMSCC1
1,198(45)
Costs
Profit road map - GTS
Income growth driven by Cash Management up 9% and Trade Finance up 57%Cost increase driven by divisional development, investment in Global Merchant Services and Manufacturing allocation
1 Global Merchant Services & Commercial Cards
£m

Slide 70
0.5
4.0(0.2)
2008 operating
profit
Reduction in loan fee income
(0.1)
Other Non interest income
(0.6)(0.1)
Impairments2007 operating
profit
(0.1)
Lombard Residual
Value
(0.1)
Increased funding costs
BS volume growth
Manufacturing costs
3.3
Profit road map - UK Retail & Commercial
£bn
Strong balance sheet growth improving net interest incomeReduced appetite for unsecured loan products & bancassurance impacting non interest incomeImpairment growth primarily in small business & commercial

Slide 71
2.3
2007 operating profit
(0.1)
Asset margin income
(1.0)
Non-SBO impairments
(0.3)
1.0
2008 operating profit
SBO impairments
0.1
Deposit margin income
Profit road map - US Retail & Commercial
Widening asset marginsHitting deposit floors due to low rate environmentPrime loan portfolios impacted by US economic weakness
$bn
Slide 72
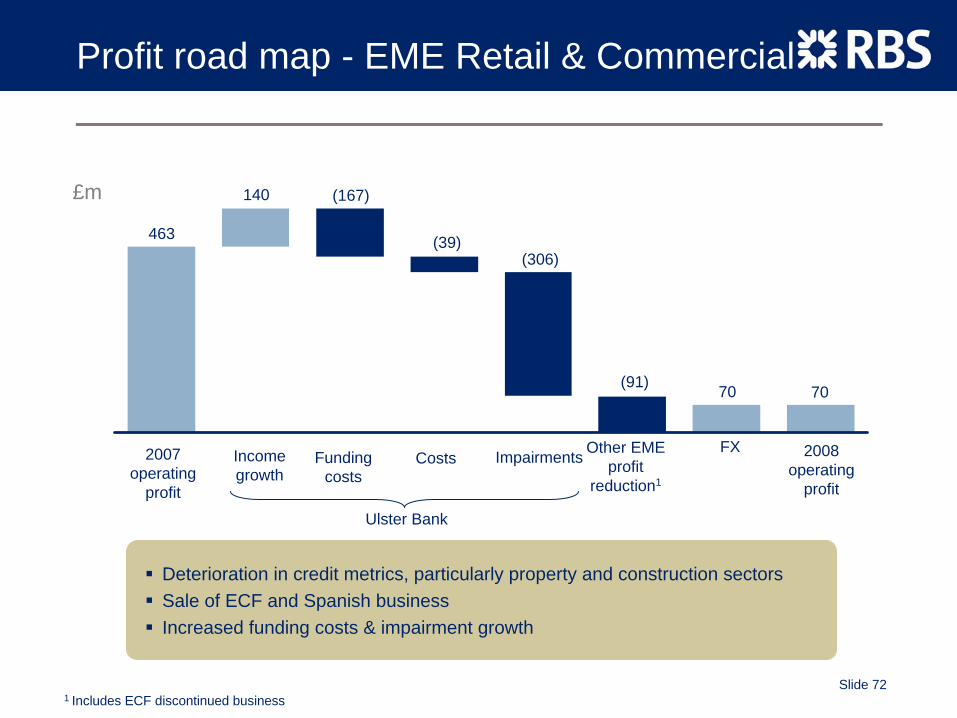
Profit road map - EME Retail & Commercial
1 Includes ECF discontinued business
Deterioration in credit metrics, particularly property and construction sectors Sale of ECF and Spanish business Increased funding costs & impairment growth
£m
463
2007 operating
profit
(39)
Income growth
(306)
70
2008 operating
profit
140
Other EME profit
reduction1
(167)
(91)
Funding costs
Costs Impairments
70
FX
Ulster Bank

Slide 73
Profit road map - Asia Retail & Commercial
(16)(52)
47
2008 operating loss
Manufacturing costs
(111)
(113)
(20)
2007 operating loss
Private Banking income
Increased provisioning
Cards & Consumer Finance
income
Cost
£m
Good growth in Private Banking and Cards & Consumer FinanceIncreased business investment driving cost growthIncreased provisioning related primarily to Indian franchise
39

Slide 74
Profit road map - Insurance
78
2007 operating
profit
(88)
Own brand underlying
profit
274
2007 floods
(212)
Partnership & broker
underlying profit
780
Realised & unrealised investment
losses
2008 operating
profit
Prior year reserve releases
68147
Record operating profit of £780mGood growth in own brand motor & home insuranceContinued strong claims managementContinued strategy to focus on profitability within partnership and broker
£m

Slide 75
Cost road map - Manufacturing
2% growth at constant FX
Investment in the Group’s Corporate Banking network & Manufacturing infrastructure
Productivity gains absorbing volume & inflation growth
0.20.1
4.5
2007 costs
0.1
FX
0.1
Increased volume
Productivity gains
(0.2) 4.8
Business investment
2008 costs
Inflation
£bn

Slide 76
Credit by corporate sector - Shipping
By sub-sector
Dry bulk29%
Container10%
Other9%
Gas/ Offshore
14%
Tankers38%
£16bn total portfolio, almost entirely within GBM
Primarily lending to SPVs with full security over the asset & related cashflow
Long relationships with established independent owners
£5bn customer deposits across the portfolio
Average LTV 56%
86% of lending against vessels built since 2000
LTV calculation basis – Calculated quarterly by reference to local ship brokers. Latest valuation 31st December 2008.

Slide 77
Credit by corporate sector - Oil & Gas
By sub-sector By geography
£24bn portfolio, 90% GBM, 5% UKCB, 5% other
Exploration & production exposures are principally secured borrowing base facilities, referenced to conservative forward looking oil price assumptions, adjusted on a regular basis
CEE & Central Asia
13%
Latin America
9%
Middle East& Africa
7%
North America
34%
United Kingdom
12%
Western Europe
(Excluding UK) 20%
Asia & Pacific
5%
Midstream21%
Refining & Marketing
19%
Oilfield Services
20%
RoW1%
Vertically Integrated / Exploration
& Production39%

Slide 78
Credit by corporate sector – Automotives1
By sub-sector By geography
£14bn portfolio - 62% GBM, 23% UKCB, 9% US, 6% other
Maintaining a cautious approach to the sector
Relationships with largest players
Expect pressure on the portfolio due to the scale of market downturn
1 Automotive exposure excludes conduits
Captive Finance
Companies8%
Component Suppliers
17%
Retailers / Services
35%
Rental17%
OEM23%
Asia & Pacific
6%
CEE & Central Asia
7%
Latin America
1%
North America
27%
Western Europe
(Excluding UK) 30%
United Kingdom
29%

Slide 79
Credit by corporate sector - Project Finance
By geography Western Europe, portfolio
£16bn portfolio, of which Western Europe 60%
Total deals – 615
Average deal size based on limits - £51m
£10bn portfolio
Spain11%
Italy4%
France3%
Other13%
UK69%
CEEMEA16%
Asia Pacific9%
Americas15%
Western Europe
60%

Slide 80
Credit by corporate sector - Retailers
By geography By type
£18.2bn total exposure
GBM 50%, UKCB 27%, Ulster 12%, US R&C 10%
Cautious stance taken in 2008/09
Small number of cases in Restructuring unit currently
Department stores13%
White goods/DIY
14%
Other50%
Food retailers
23%
Western Europe
33%
North America
17%
Asia Pacific4%
Other6%
UK40%

Slide 81
Commercial Property by type – RBS UK & GBM
RBS UK1 by property type – portfolio: £42bn GBM2 by property type – portfolio: £25bn
1 RBS UK Sector split based on RBS UK core portfolio2 Excludes £6bn relating to ABN AMRO and debt securities
Retail26%
Leisure and Tourism
15%
Mixed7%
Residential5%
Medical/Care
4%
Industrial4% Other
6% Office33%
Office20%
Mixed30%
Retail19%
Industrial12%
Corporate (General) Funding
5%
Residential14%

Slide 82
Impairment Losses by division – GBM
122410
1055
67
722
1389
FY07 FY 08
Manufacturing &Infrastructure
Property &Construction
Transport &Technology
Banks & FinancialInstitutions
Other
£122m
£3,643m1
Trends Analysis 2008 2007
NPL as % of L&A 1.9% 0.3%
1 Includes £466m on re-designated assets

Slide 83
GBM – Non-Derivative Trading Assets
Debt securities & reverse
repos
T Bills OtherL&A EquitiesNon- derivative
trading assets
31
322 204
1660
11
Asset 2008 £bn
2007 £bn
Y-o-Y %
Debt securities & reverse repos 204 476 (57%)
T Bills 16 16 -
Loans & advances 60 42 42%
Equities 11 29 (62%)
Other 31 23 35%
GBM Total 322 586 (45%)
£bn

Slide 84
GBM – Reverse Repos
CustomersTotal Reverse Repos
96 57
39
Maturity profile % of total MTM
< 3 months 83%
< 6 months 12%
< 1 year 4%
> 1 year 1%
Total 100%
Banks
Collateral quality distribution and tenor distribution are calculated based on gross reverse repos
Exposure by counterparty 2008 £bn
2007 £bn
Y-o-Y %
Reverse Repos – Banks 57 166 (66%)
Reverse Repos – Customers 39 143 (73%)
Total 96 309 (69%)
Collateral quality distribution
Government 89%
Corporates 7%
Other 4%
Total 100%
£bn

Slide 85
Impairment Losses by division – UK Retail Banking
58 6180
158
359
420
666
610
2133
FY07 FY 08
MortgagesPersonalCardsBusiness BankingOther
£1,184£1,281
Trends Analysis 2008 2007
NPL as % of L&A 4.1% 3.9%
IL as a % of closing book loans
Mortgages <0.1% <0.1%
Credit Cards 6.6% 4.6%
Personal 3.8% 3.9%
Business Banking 0.8% 0.4%
Business = companies with turnover below £1m
£m

Slide 86
UK Retail mortgages
Cumulative LTV distribution as % of book value1, 2:
93% Mainstream, 7% Buy-to-let
Mainstream LTV 54%
Buy-to-let LTV 63%
Average LTV 55%
Mortgage impairment charge in 2008 - £32m
73%
41%33%
19%12%
7%
>50% >75% >80% >90% >95% >100%
UK portfolio1: £75bn
0.0%
0.2%
0.4%
0.6%
0.8%
1.0%
1.2%
1.4%
1.6%
1.8%
Q12006
Q22006
Q32006
Q42006
Q12007
Q22007
Q32007
Q42007
Q12008
Q22008
Q32008
Q42008
CML 3+ % RBS & NW 3+ %
Mortgages – Arrears vs CML3
1 Excludes Northern Ireland & business off-set mortgages2 LTV basis – current valuation3 Council of Mortgage Lenders

Slide 87
Impairment Losses by division – UK Corporate & Commercial Banking
43 5022
11280
303
35
206
FY07 FY 08
CommercialCorporateLombardOther
£180m
£671mTrends Analysis 2008 2007
NPL as % of L&A 2.7% 1.2%
IL as % of closing book loans
Commercial 0.6% 0.1%
Corporate 0.4% 0.1%
Lombard 1.8% 0.4%
Other 0.5% 0.6%
Commercial = companies with turnover between £1-25mCorporate = companies with turnover above £25m
145
150
37
64 53
9223 20
87
Other consumerLatentConstructionReal EstateInstalment DebtorsManufacturingWholesale and Retail TradePrivate SectorFinance Leases
Sector Split of IL £m
£m

Slide 88
US Retail & Commercial
Total Portfolio - $113bn
Corporate & Industrial
27%
Commercial Real Estate
10%
Auto & Other
Consumer19%
SBO6%
Residential Mtg / Home
Equity38%
Cumulative LTV distribution as % of book value:
Average LTV 63%
Average FICO 700+
Home Equity & Residential Mortgage Portfolio (ex SBO)
LTV basis – most recent valuation
56%
36%27%
14%9% 6%
>60% >75% >80% >90% >95% >100%

Slide 89
Impairment Losses by division – US Retail
57
28085
175
112
196
87
128
329
592
52
82
21 29
FY07 FY 08
Small businessHome equity - SBOHome equity - otherResidential mortgagesCardsAutoOther consumer
$685m
$1,540m Trends Analysis 2008 2007
NPL as % of L&A 0.9% 0.5%
IL as a % of closing book loans
Small business 5.9% 3.8%
Home equity 0.5% 0.1%
SBO 8.4% 3.8%
Residential mortgages 0.6% 0.1%
Cards 8.2% 4.8%
Auto 1.6% 0.7%
Other consumer 3.2% 0.7%
Other consumer also includes Unallocated & General reserves and IFRS adjustments
$m

Slide 90
US Retail – consumer lending metrics
SBO book is closed, amortising bookFICOs & LTVs are current not at point of origination
Residential Mortgage
Core Home Equity
SBO Home Equity
Indirect Auto
Outstanding Balance $14bn $28bn $7bn $11bn
Percentage of Loans 14% 25% 6% 10%
Weighted Average FICO 732 747 712 747
Weighted Average CLTV 66% 62% 100% -
Fixed Rate Loans 63% 58% - -
Adjustable Rate Loans 37% 42% - -
First Lien 99% 49% 3% -
Second Lien 1% 51% 97% -
Portfolio 2008 5% 14% 0% 34%
Vintage 2007 11% 17% 19% 29%
2006 11% 16% 38% 18%
2005 32% 12% 38% 15%
Pre 2004 41% 41% 5% 4%
Cumulative >700 79% 82% 58% 85%
FICO >660 89% 91% 72% 98%
Distribution >520 99% 98% 89% 100%

Slide 91
US Retail & Commercial - commercial property
By Geography By Property Type
Total portfolio: $9bn
Average LTV 62%
Average loan size <$3m
LTV basis – current valuation
Retail26%
Office18%
Industrial7%
Lodging & Hospitality
6%
Land4%
Mixed Use3%
Other9%
Residential27%
Midwest31%
New England
41%
California0.4%
Other6%
Florida0.7%
Mid Atlantic21%

Slide 92
Impairment Losses by division – US Commercial
212
177
-2015
FY07 FY 08
CRE
Commercial &Industrial
$(5)m
$389mTrends Analysis 2008 2007
NPL as % of L&A 1.3% 0.6%
IL as a % of closing book loans
Commercial Real Estate 1.6% 0.2%
Commercial & Industrial 0.7% -0.1%
FY07 benefitted from a number of write backs and methodology changes
$m

Slide 93
Ulster Bank
Cumulative LTV distribution as % of book value1:
Average LTV 47%
Buy to Let LTV 55%
UB mortgage portfolio: £25bn
Property32%
Mortgages40%
Corporate Other24%
Personal Other
4%
40% of book is mortgage funding, secured by properties
Very low exposure to unsecured consumer lending
32% of book across commercial development & investment, residential development & investment and contractors/building suppliers
Total portfolio £60bn
53%
32%28%
18%13%
9%
>50% >75% >80% >90% >95% >100%
1 Calculated based on volume. LTV basis – current valuation

Slide 94
Impairment Losses by division – Ulster Bank Retail
713
11
3216
23
FY07 FY 08
UB - Mortgages
UB - Personalbanking
UB - Cards
£34m
£68mTrends Analysis 2008 2007
NPL as % of L&A 2.1% 1.2%
IL as a % of closing book loans
UB Mortgages 0.1% 0.1%
UB Personal Banking 3.5% 1.5%
UB Cards 3.9% 2.9%
£m

Slide 95
Ulster Bank - Commercial Property
Portfolio: £17bn
Cumulative LTV distribution as % of book value:By type:
88%
77%
55%
35%
21%12% 9%
3%
>50% >60% >70% >75% >80% >85% >90% >100%
65% Republic of Ireland, 35% UK
1.8% speculative lending, capped at 3%
Average LTV 70%, average ICR 136%
Commercial Development
18%Residential Investment
4%
Commercial Investment
47%
Residential Development
31%
Excludes house builders of £1.7bn and contractors/building suppliers of £0.8bnLTVs, basis for calculation is most recent valuation

Slide 96
105134
265
10
FY07 FY 08
CommercialInvestment &Development
ResidentialInvestment &Development
Other
Impairment Losses by division – Ulster Bank Corporate
£44m
£326mTrends Analysis 2008 2007
NPL as % of L&A 8.0% 1.5%
IL as a % of closing book loans
Commercial Investment & Development 0.1% 0.0%
Residential Investment & Development 3.2% 0.5%
Other 0.3% 0.1%
£m

Slide 97
Asian Consumer Finance
Only Portfolios with Balances over € 40m (£38m) shownTTBB was bought by ABN AMRO prior to the acquisition and is currently in run-off.
Country Product Program Balance (£m) 90+ past dueTaiwan Credit Cards 447 2%
Mortgages 93 0%
TTBB Legacy Mortgages 88 6%
TTBB Legacy Personal Loans 114 5%
India Credit Cards 217 7%
Personal Loans 343 4%
Mortgages 194 2%
SME 228 1%
Indonesia Credit Cards 49 3%
Unsecured Personal Loans 71 3%
Pakistan Personal Loans 40 7%
Credit Cards 39 9%
Singapore Credit Cards 92 1%
Unsecured Personal Loans 93 1%
Private Banking SME 52 0%
Investments 45 1%
Investment Secured Loans 42 0%
Mortgages 62 8%
Hong Kong Unsecured Personal Loans & Revolving Loans 73 0%
Recommended