ARTICLE
Integration of Probabilistic and Multi-Hazard Risk AssessmentWithin Urban Development Planning and EmergencyPreparedness and Response: Application to Manizales, Colombia
Gabriel A. Bernal1 • Mario A. Salgado-Galvez2• Daniela Zuloaga1
•
Julian Tristancho3• Diana Gonzalez1
• Omar-Darıo Cardona4
Published online: 6 September 2017
� The Author(s) 2017. This article is an open access publication
Abstract The details of a multi-hazard and probabilistic
risk assessment, developed for urban planning and emer-
gency response activities in Manizales, Colombia, are
presented in this article. This risk assessment effort was
developed under the framework of an integral disaster risk
management project whose goal was to connect risk
reduction activities by using open access and state-of-the-
art risk models. A probabilistic approach was used for the
analysis of seismic, landslide, and volcanic hazards to
obtain stochastic event sets suitable for probabilistic loss
estimation and to generate risk results in different metrics
after aggregating in a rigorous way the losses associated to
the different hazards. Detailed and high resolution expo-
sure databases were used for the building stock and
infrastructure of the city together with a set of vulnerability
functions for each of the perils considered. The urban and
territorial ordering plan of the city was updated for
socioeconomic development and land use using the hazard
and risk inputs and determinants, which cover not only the
current urban area but also those adjacent areas where the
expansion of Manizales is expected to occur. The emer-
gency response capabilities of the city were improved by
taking into account risk scenarios and after updating an
automatic and real-time post-earthquake damage
assessment.
Keywords Emergency response � Manizales
(Colombia) � Multi-hazard risk assessment � Probabilistichazard analysis � Probabilistic risk assessment � Urbanplanning
1 Introduction
Manizales is the capital city of the Department of Caldas,
located in the central Andean region of Colombia in an
area with steep topographic conditions that produce very
instable slopes. This condition facilitates the occurrence of
landslides that can be triggered either by the occurrence of
earthquakes or intense and prolonged rainfall. Within the
urban area there are approximately 370,000 inhabitants and
113,000 buildings according to census and cadastral data
(DANE 2005).
Since the 1980s the city has implemented an explicit
integrated disaster risk management process. It has been
based on a systemic institutional strategy that brings
together scientific knowledge, promotes inter-institutional
collaboration, and enhances overall community coping
capacity. A recent ambitious disaster risk management
program also was developed in Manizales, after an inter-
institutional agreement was made between the Universidad
Nacional de Colombia and the Autonomous Regional
Corporation of Caldas (CORPOCALDAS), the regional
environmental authority. The objective of joining inter-
institutional efforts was to develop a set of projects that
involve data management, research, monitoring, capacity
building, and technological transfer. The goal of these
integrated projects was to achieve ‘‘the improvement of the
& Mario A. Salgado-Galvez
1 INGENIAR Ltda, Bogota D.C. 110221, Colombia
2 Centre Internacional de Metodes Numerics en Enginyeria
(CIMNE), 08034 Barcelona, Spain
3 Universidad Distrital Francisco Jose de Caldas,
Bogota D.C. 110231, Colombia
4 Instituto de Estudios Ambientales (IDEA), Universidad
Nacional de Colombia Sede Manizales, Manizales 170004,
Colombia
123
Int J Disaster Risk Sci (2017) 8:270–283 www.ijdrs.com
DOI 10.1007/s13753-017-0135-8 www.springer.com/13753
integral disaster risk management by strengthening the
policies, strategies and instruments for risk understanding,
risk reduction and disaster management, articulated to the
development planning and the sustainable development’’
(Gestion del Riesgo – Manizales 2017).
The project was developed after taking into account the
emergencies that occurred in the city in 2008 and 2011,
which resulted in the closure of the main roads that provide
access to the city, a significant number of lost lives, and a
major disruption in the drinking water distribution services,
among other impacts. Those crisis situations were the result
of slope instability combined with the occurrence of
extreme hydrometeorological events, which were a con-
sequence of climate variability and change. Due to the
vulnerability of the city to landslides, these events caused a
significant social, economic, and environmental impact as
well as widespread worry, without any precedent among
inhabitants and local institutions, about future risk. This
anxiety indicated the need for Manizales to have a better
understanding of the overall vulnerability and risk condi-
tions in the city and better programs by which to cope with
future risk. The new program was financed by a temporary
tax that was dedicated exclusively for disaster risk man-
agement activities (set equal to 0.5% of property value).
Tasks to be developed within the program were split into
activities, and those related to risk knowledge aspects that
are useful for urban planning and emergency response
activities are summarized in this article. Within this risk
knowledge cluster, it is important to highlight the update
and harmonization of the city’s seismic microzonation in
order to comply with national requirements. Colombia’s
national earthquake resistant building code, NSR-10
(MAVDT 2010), mandates that every settlement with more
than 100,000 inhabitants must have a seismic microzona-
tion that is fully harmonized with the law’s earthquake
resistance specifications. Among the major requirements
related to the harmonization process are the development
of a detailed probabilistic seismic hazard analysis (PSHA),
a regional seismicity study, geotechnical studies, and a
comparison of the obtained design coefficients with those
previously defined in the NSR-10 statute. Also, it is spec-
ified that those urban areas that already have a micro-
zonation study, such as Manizales, need to harmonize that
study with the requirements and functional shape of the
elastic design spectra updated in 2010 by the Colombian
Association for Earthquake Engineering (AIS).
Most of the tasks developed under the framework of this
disaster risk management program are research activities
instead of traditional consultancies, which required evalu-
ation of the tasks (or their progress) during the execution
phase while at the same time allowing space for enough
flexibility to make adjustments at the execution stage.
2 Probabilistic Analysis of Multiple NaturalHazards
Manizales is located in an area prone to multiple hazards,
where events associated with earthquakes, landslides, flash
floods, and volcanic hazards can be expected. Therefore
any comprehensive disaster risk assessment effort needs to
take into account the contribution of the most relevant
hazards and evaluate how these hazards interact with each
other in order to have a complete overview of the catas-
trophe risk panorama. Within this project, a fully proba-
bilistic approach was considered for the analyses of
earthquakes, landslides, and volcanic eruptions, in order to
be employed later in a fully probabilistic risk assessment,
whose outputs would be useful to the development and
planning of activities related to territorial ordering, land-
use planning, and emergency response. A summary of the
approach selected for the analysis of the different natural
hazards is presented in Sect. 2.
2.1 Probabilistic Seismic Hazard Analysis
Seismic hazard, at bedrock level, was calculated using the
latest version of the program CRISIS (Ordaz et al. 2013), a
worldwide acknowledged and recognized tool for these
assessments (Kalyan Kumar and Dodagoudar 2011;
D’Amico et al. 2012), which corresponds to the seismic
hazard assessment module of the CAPRA (Comprehensive
Approach to Probabilistic Risk Assessment) Platform
(Cardona et al. 2012; Marulanda et al. 2013). Most of the
inputs used at this stage correspond to those used in the
PSHA conducted for the definition of the seismic design
coefficients for bridges in Colombia (Salgado-Galvez et al.
2016a); the classical probabilistic approach, first proposed
by Esteva (1967) and Cornell (1968), was followed. Local
ground motion prediction equations (GMPEs) were used
based on the study developed by Bernal (2014a) using a
genetic algorithm framework. Data to develop the GMPEs
was classified by tectonic environment and, as a result, two
different sets of GMPEs were developed, one for intraplate
and other subduction zone activity. Given the limited
geographical extent of the Manizales area, it was assumed
that, at bedrock level, there are not important spatial
variations in seismic hazard levels and that values obtained
at any location within the urban area are the same. The
seismic design coefficients established in the NSR-10 are
denoted as Aa and Av and are related to the acceleration for
peak ground acceleration (PGA) and 1.0 s respectively,
both for a 475 year return period. The results obtained in
this study for both parameters are equal to 0.20 and 0.21 g,
respectively.
Int J Disaster Risk Sci 271
123
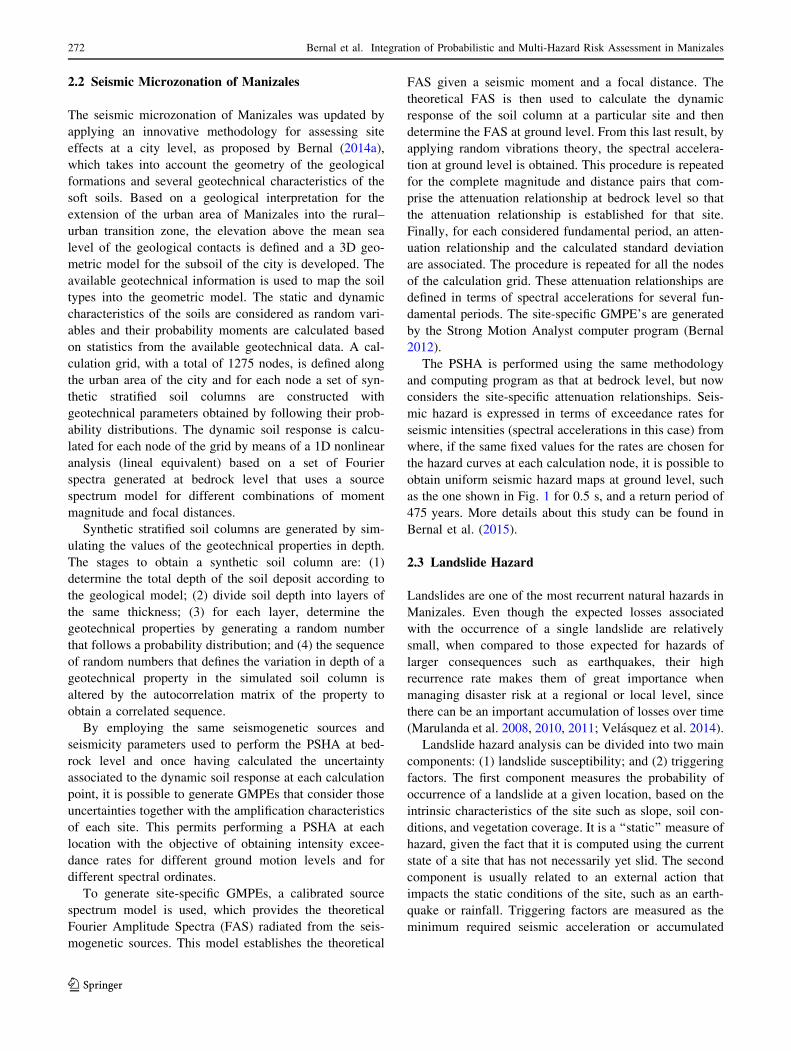
2.2 Seismic Microzonation of Manizales
The seismic microzonation of Manizales was updated by
applying an innovative methodology for assessing site
effects at a city level, as proposed by Bernal (2014a),
which takes into account the geometry of the geological
formations and several geotechnical characteristics of the
soft soils. Based on a geological interpretation for the
extension of the urban area of Manizales into the rural–
urban transition zone, the elevation above the mean sea
level of the geological contacts is defined and a 3D geo-
metric model for the subsoil of the city is developed. The
available geotechnical information is used to map the soil
types into the geometric model. The static and dynamic
characteristics of the soils are considered as random vari-
ables and their probability moments are calculated based
on statistics from the available geotechnical data. A cal-
culation grid, with a total of 1275 nodes, is defined along
the urban area of the city and for each node a set of syn-
thetic stratified soil columns are constructed with
geotechnical parameters obtained by following their prob-
ability distributions. The dynamic soil response is calcu-
lated for each node of the grid by means of a 1D nonlinear
analysis (lineal equivalent) based on a set of Fourier
spectra generated at bedrock level that uses a source
spectrum model for different combinations of moment
magnitude and focal distances.
Synthetic stratified soil columns are generated by sim-
ulating the values of the geotechnical properties in depth.
The stages to obtain a synthetic soil column are: (1)
determine the total depth of the soil deposit according to
the geological model; (2) divide soil depth into layers of
the same thickness; (3) for each layer, determine the
geotechnical properties by generating a random number
that follows a probability distribution; and (4) the sequence
of random numbers that defines the variation in depth of a
geotechnical property in the simulated soil column is
altered by the autocorrelation matrix of the property to
obtain a correlated sequence.
By employing the same seismogenetic sources and
seismicity parameters used to perform the PSHA at bed-
rock level and once having calculated the uncertainty
associated to the dynamic soil response at each calculation
point, it is possible to generate GMPEs that consider those
uncertainties together with the amplification characteristics
of each site. This permits performing a PSHA at each
location with the objective of obtaining intensity excee-
dance rates for different ground motion levels and for
different spectral ordinates.
To generate site-specific GMPEs, a calibrated source
spectrum model is used, which provides the theoretical
Fourier Amplitude Spectra (FAS) radiated from the seis-
mogenetic sources. This model establishes the theoretical
FAS given a seismic moment and a focal distance. The
theoretical FAS is then used to calculate the dynamic
response of the soil column at a particular site and then
determine the FAS at ground level. From this last result, by
applying random vibrations theory, the spectral accelera-
tion at ground level is obtained. This procedure is repeated
for the complete magnitude and distance pairs that com-
prise the attenuation relationship at bedrock level so that
the attenuation relationship is established for that site.
Finally, for each considered fundamental period, an atten-
uation relationship and the calculated standard deviation
are associated. The procedure is repeated for all the nodes
of the calculation grid. These attenuation relationships are
defined in terms of spectral accelerations for several fun-
damental periods. The site-specific GMPE’s are generated
by the Strong Motion Analyst computer program (Bernal
2012).
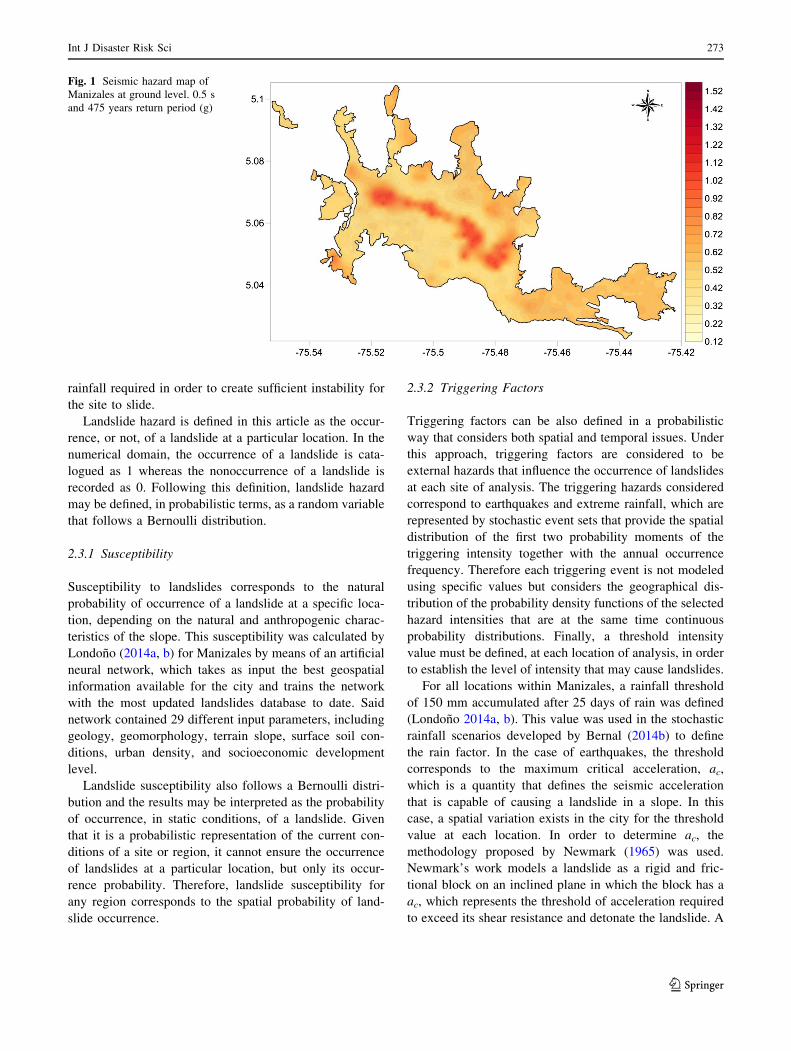
The PSHA is performed using the same methodology
and computing program as that at bedrock level, but now
considers the site-specific attenuation relationships. Seis-
mic hazard is expressed in terms of exceedance rates for
seismic intensities (spectral accelerations in this case) from
where, if the same fixed values for the rates are chosen for
the hazard curves at each calculation node, it is possible to
obtain uniform seismic hazard maps at ground level, such
as the one shown in Fig. 1 for 0.5 s, and a return period of
475 years. More details about this study can be found in
Bernal et al. (2015).
2.3 Landslide Hazard
Landslides are one of the most recurrent natural hazards in
Manizales. Even though the expected losses associated
with the occurrence of a single landslide are relatively
small, when compared to those expected for hazards of
larger consequences such as earthquakes, their high
recurrence rate makes them of great importance when
managing disaster risk at a regional or local level, since
there can be an important accumulation of losses over time
(Marulanda et al. 2008, 2010, 2011; Velasquez et al. 2014).
Landslide hazard analysis can be divided into two main
components: (1) landslide susceptibility; and (2) triggering
factors. The first component measures the probability of
occurrence of a landslide at a given location, based on the
intrinsic characteristics of the site such as slope, soil con-
ditions, and vegetation coverage. It is a ‘‘static’’ measure of
hazard, given the fact that it is computed using the current
state of a site that has not necessarily yet slid. The second
component is usually related to an external action that
impacts the static conditions of the site, such as an earth-
quake or rainfall. Triggering factors are measured as the
minimum required seismic acceleration or accumulated
272 Bernal et al. Integration of Probabilistic and Multi-Hazard Risk Assessment in Manizales
123
rainfall required in order to create sufficient instability for
the site to slide.
Landslide hazard is defined in this article as the occur-
rence, or not, of a landslide at a particular location. In the
numerical domain, the occurrence of a landslide is cata-
logued as 1 whereas the nonoccurrence of a landslide is
recorded as 0. Following this definition, landslide hazard
may be defined, in probabilistic terms, as a random variable
that follows a Bernoulli distribution.
2.3.1 Susceptibility
Susceptibility to landslides corresponds to the natural
probability of occurrence of a landslide at a specific loca-
tion, depending on the natural and anthropogenic charac-
teristics of the slope. This susceptibility was calculated by
Londono (2014a, b) for Manizales by means of an artificial
neural network, which takes as input the best geospatial
information available for the city and trains the network
with the most updated landslides database to date. Said
network contained 29 different input parameters, including
geology, geomorphology, terrain slope, surface soil con-
ditions, urban density, and socioeconomic development
level.
Landslide susceptibility also follows a Bernoulli distri-
bution and the results may be interpreted as the probability
of occurrence, in static conditions, of a landslide. Given
that it is a probabilistic representation of the current con-
ditions of a site or region, it cannot ensure the occurrence
of landslides at a particular location, but only its occur-
rence probability. Therefore, landslide susceptibility for
any region corresponds to the spatial probability of land-
slide occurrence.
2.3.2 Triggering Factors
Triggering factors can be also defined in a probabilistic
way that considers both spatial and temporal issues. Under
this approach, triggering factors are considered to be
external hazards that influence the occurrence of landslides
at each site of analysis. The triggering hazards considered
correspond to earthquakes and extreme rainfall, which are
represented by stochastic event sets that provide the spatial
distribution of the first two probability moments of the
triggering intensity together with the annual occurrence
frequency. Therefore each triggering event is not modeled
using specific values but considers the geographical dis-
tribution of the probability density functions of the selected
hazard intensities that are at the same time continuous
probability distributions. Finally, a threshold intensity
value must be defined, at each location of analysis, in order
to establish the level of intensity that may cause landslides.
For all locations within Manizales, a rainfall threshold
of 150 mm accumulated after 25 days of rain was defined
(Londono 2014a, b). This value was used in the stochastic
rainfall scenarios developed by Bernal (2014b) to define
the rain factor. In the case of earthquakes, the threshold
corresponds to the maximum critical acceleration, ac,
which is a quantity that defines the seismic acceleration
that is capable of causing a landslide in a slope. In this
case, a spatial variation exists in the city for the threshold
value at each location. In order to determine ac, the
methodology proposed by Newmark (1965) was used.
Newmark’s work models a landslide as a rigid and fric-
tional block on an inclined plane in which the block has a
ac, which represents the threshold of acceleration required
to exceed its shear resistance and detonate the landslide. A
Fig. 1 Seismic hazard map of
Manizales at ground level. 0.5 s
and 475 years return period (g)
Int J Disaster Risk Sci 273
123
function of the static safety factor, ac, and the geometry of
the slope, can be expressed as:
ac ¼ FS� 1ð Þ sin a ð1Þ
where FS is the static safety factor and a is the angle of the
slope. Additional details of this procedure can be found in
Bernal (2014b).
2.3.3 Landslide Hazard Assessment
Mathematically, the probability of occurrence of a land-
slide (PrL) at a particular site is given by,
PrL ¼ PrS � Pr I[ ITð Þ ð2Þ
where PrS is the susceptibility of landslide occurrence and
Pr(I[ IT) is the probability that the triggering intensity I
exceeds the threshold intensity IT. Given that triggering
hazards are modeled as a set of stochastic events, then the
landslide probability of occurrence can be computed for
each of those events, having each result in the same
temporal probability or annual occurrence frequency as the
triggering event. Therefore, a set of landslide hazard events
is developed where each event has the same annual
occurrence frequency as the triggering event, and is defined
by the first two probability moments: mean and variance.
Assuming a Bernoulli distribution, mean and variance are
defined as:
Mean ¼ PrL ð3ÞVariance ¼ PrL�ð1�PrLÞ ð4Þ
The total hazard probability at a single location may be
computed as the sum, for each landslide event, of the
landslide probability, multiplied by the annual occurrence
frequency of the event, Fi. This provides then an annual
probability of landslide occurrence at each analysis
location, which is also known as the annual occurrence
rate (mL), expressed as:
mL ¼XN
i¼1
PrL�Fi ð5Þ
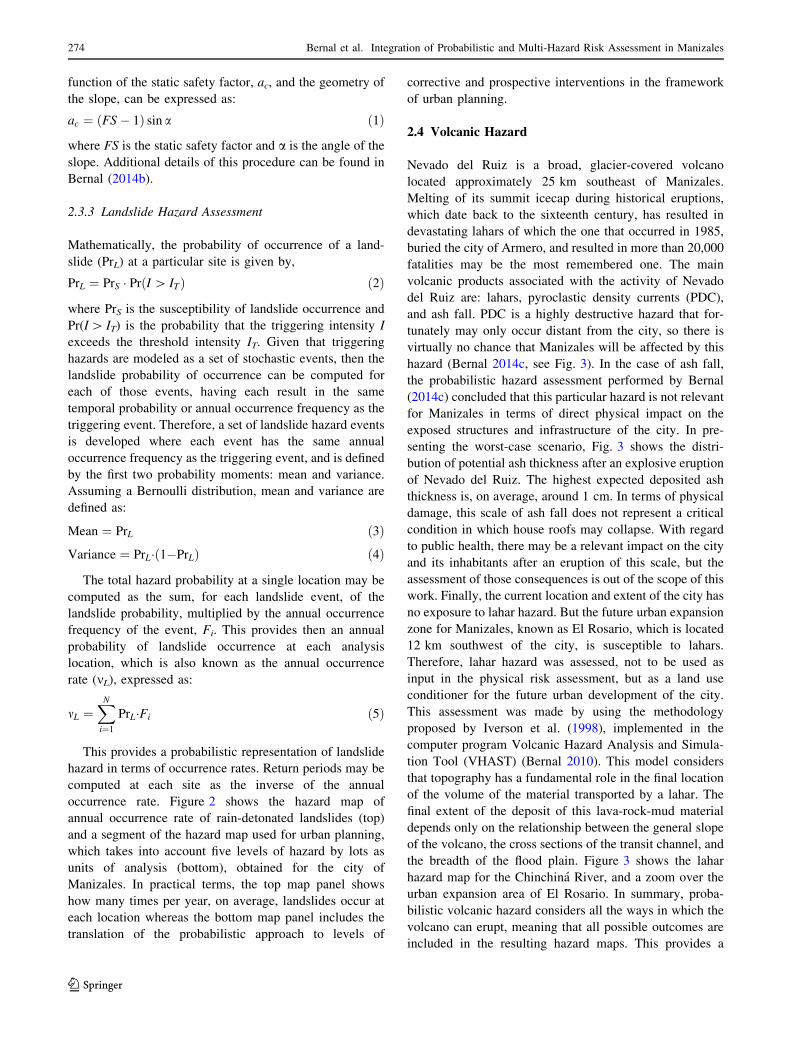
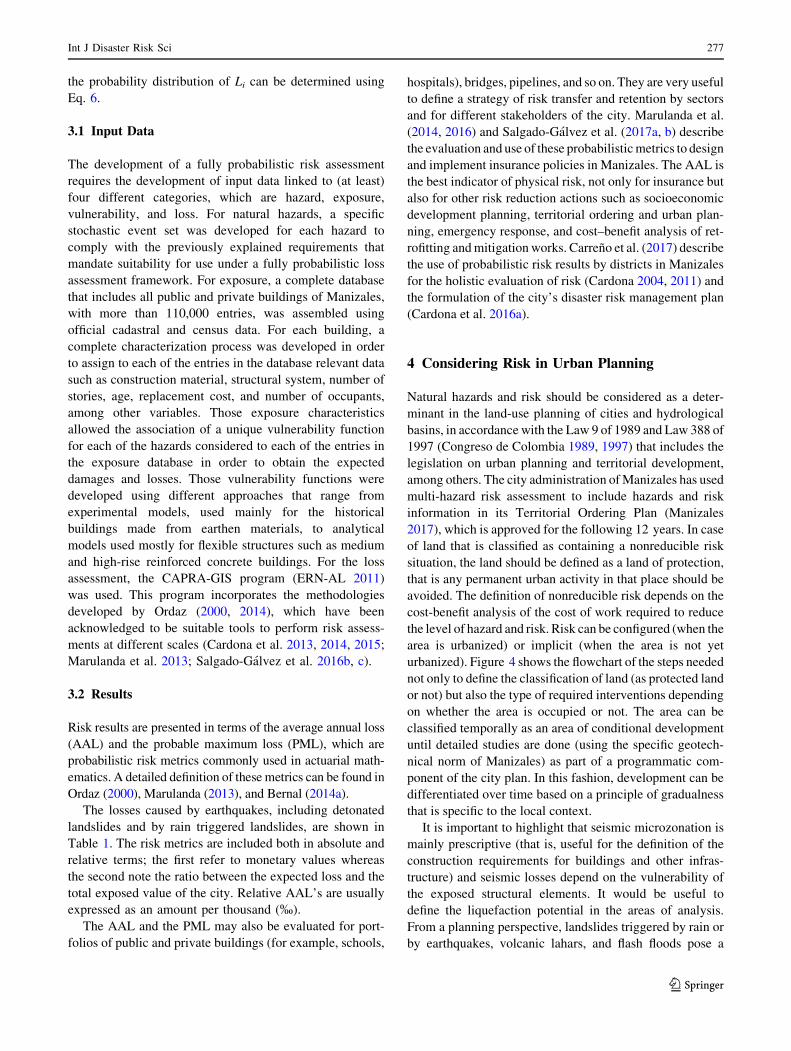
This provides a probabilistic representation of landslide
hazard in terms of occurrence rates. Return periods may be
computed at each site as the inverse of the annual
occurrence rate. Figure 2 shows the hazard map of
annual occurrence rate of rain-detonated landslides (top)
and a segment of the hazard map used for urban planning,
which takes into account five levels of hazard by lots as
units of analysis (bottom), obtained for the city of
Manizales. In practical terms, the top map panel shows
how many times per year, on average, landslides occur at
each location whereas the bottom map panel includes the
translation of the probabilistic approach to levels of
corrective and prospective interventions in the framework
of urban planning.
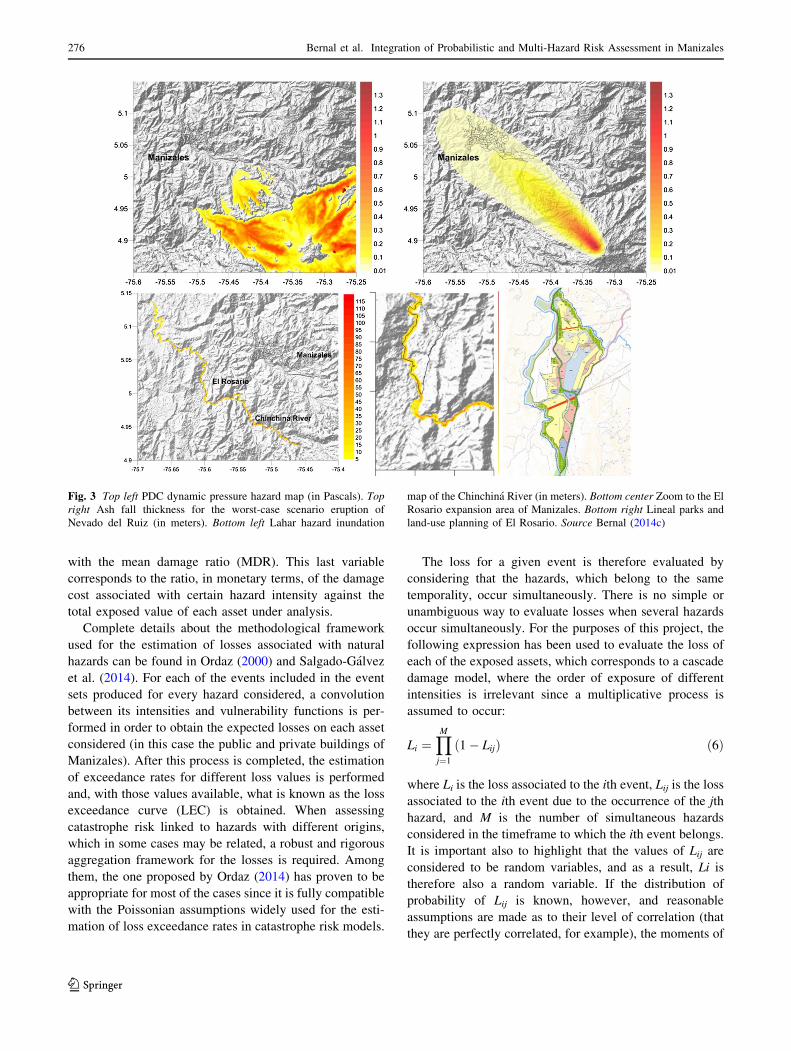
2.4 Volcanic Hazard
Nevado del Ruiz is a broad, glacier-covered volcano
located approximately 25 km southeast of Manizales.
Melting of its summit icecap during historical eruptions,
which date back to the sixteenth century, has resulted in
devastating lahars of which the one that occurred in 1985,
buried the city of Armero, and resulted in more than 20,000
fatalities may be the most remembered one. The main
volcanic products associated with the activity of Nevado
del Ruiz are: lahars, pyroclastic density currents (PDC),
and ash fall. PDC is a highly destructive hazard that for-
tunately may only occur distant from the city, so there is
virtually no chance that Manizales will be affected by this
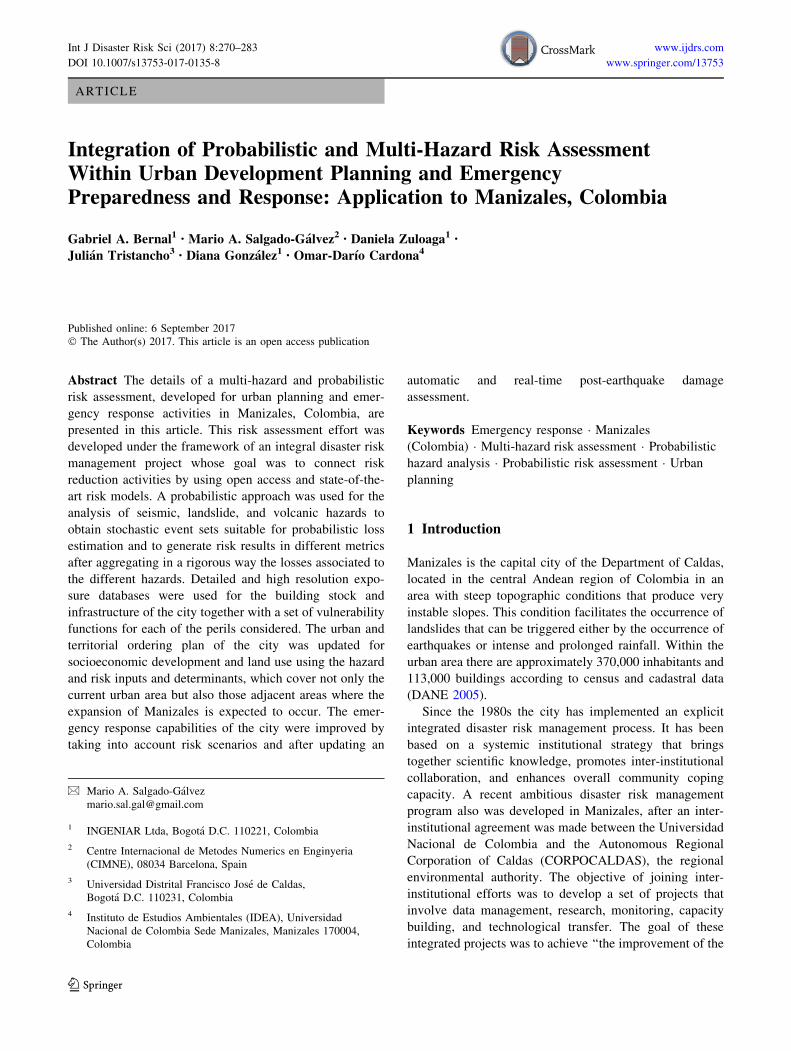
hazard (Bernal 2014c, see Fig. 3). In the case of ash fall,
the probabilistic hazard assessment performed by Bernal
(2014c) concluded that this particular hazard is not relevant
for Manizales in terms of direct physical impact on the
exposed structures and infrastructure of the city. In pre-
senting the worst-case scenario, Fig. 3 shows the distri-
bution of potential ash thickness after an explosive eruption
of Nevado del Ruiz. The highest expected deposited ash
thickness is, on average, around 1 cm. In terms of physical
damage, this scale of ash fall does not represent a critical
condition in which house roofs may collapse. With regard
to public health, there may be a relevant impact on the city
and its inhabitants after an eruption of this scale, but the
assessment of those consequences is out of the scope of this
work. Finally, the current location and extent of the city has
no exposure to lahar hazard. But the future urban expansion
zone for Manizales, known as El Rosario, which is located
12 km southwest of the city, is susceptible to lahars.
Therefore, lahar hazard was assessed, not to be used as
input in the physical risk assessment, but as a land use
conditioner for the future urban development of the city.
This assessment was made by using the methodology
proposed by Iverson et al. (1998), implemented in the
computer program Volcanic Hazard Analysis and Simula-
tion Tool (VHAST) (Bernal 2010). This model considers
that topography has a fundamental role in the final location
of the volume of the material transported by a lahar. The
final extent of the deposit of this lava-rock-mud material
depends only on the relationship between the general slope
of the volcano, the cross sections of the transit channel, and
the breadth of the flood plain. Figure 3 shows the lahar
hazard map for the Chinchina River, and a zoom over the
urban expansion area of El Rosario. In summary, proba-
bilistic volcanic hazard considers all the ways in which the
volcano can erupt, meaning that all possible outcomes are
included in the resulting hazard maps. This provides a
274 Bernal et al. Integration of Probabilistic and Multi-Hazard Risk Assessment in Manizales
123
representation of volcanic hazard that accounts for both
spatial and temporal probabilities that a particular location
is affected by volcanic products, at any moment in the
future. This type of assessment is very useful for land-use
and urban planning, as well as for evacuation purposes
during the development of an eruptive process detected by
the Volcano Observatory of Manizales.
3 Probabilistic Risk Assessment
State-of-the-art and fully probabilistic risk assessments
require specific representations for their different compo-
nents (mainly for hazard and vulnerability) in order to not
only obtain the feasible scope of future losses but also to
rigorously account for and propagate the uncertainties
associated with any losses throughout the analysis process.
In that sense, the required output for the probabilistic
hazard analyses generated for any of the considered perils
is a set of stochastic events that have to comply with dif-
ferent requirements, such as being collectively exhaustive,
mutually exclusive, have an associated occurrence fre-
quency and provide, at least, for each of the hazard
intensities, the first two probability moments. But in the
case of physical vulnerability, although it is acknowledged
that different representations of this dimension allow a
probabilistic representation (for example, damage proba-
bility matrixes and fragility curves), the one known as the
vulnerability function is far more useful. This function
provides a continuous, quantitative, and probabilistic rela-
tionship between different hazard intensities (for example,
spectral acceleration, water depth, and ash fall thickness)
Fig. 2 Top Rain triggered
landslide hazard map (annual
exceedance rate); Bottom Map
of levels of intervention by lots
for urban planning of Manizales
based on the level of hazard and
risk (very low, low, moderate,
high, and very high). Source
Londono (2014a, b)
Int J Disaster Risk Sci 275
123
with the mean damage ratio (MDR). This last variable
corresponds to the ratio, in monetary terms, of the damage
cost associated with certain hazard intensity against the
total exposed value of each asset under analysis.
Complete details about the methodological framework
used for the estimation of losses associated with natural
hazards can be found in Ordaz (2000) and Salgado-Galvez
et al. (2014). For each of the events included in the event
sets produced for every hazard considered, a convolution
between its intensities and vulnerability functions is per-
formed in order to obtain the expected losses on each asset
considered (in this case the public and private buildings of
Manizales). After this process is completed, the estimation
of exceedance rates for different loss values is performed
and, with those values available, what is known as the loss
exceedance curve (LEC) is obtained. When assessing
catastrophe risk linked to hazards with different origins,
which in some cases may be related, a robust and rigorous
aggregation framework for the losses is required. Among
them, the one proposed by Ordaz (2014) has proven to be
appropriate for most of the cases since it is fully compatible
with the Poissonian assumptions widely used for the esti-
mation of loss exceedance rates in catastrophe risk models.
The loss for a given event is therefore evaluated by
considering that the hazards, which belong to the same
temporality, occur simultaneously. There is no simple or
unambiguous way to evaluate losses when several hazards
occur simultaneously. For the purposes of this project, the
following expression has been used to evaluate the loss of
each of the exposed assets, which corresponds to a cascade
damage model, where the order of exposure of different
intensities is irrelevant since a multiplicative process is
assumed to occur:
Li ¼YM
j¼1
ð1� LijÞ ð6Þ
where Li is the loss associated to the ith event, Lij is the loss
associated to the ith event due to the occurrence of the jth
hazard, and M is the number of simultaneous hazards
considered in the timeframe to which the ith event belongs.
It is important also to highlight that the values of Lij are
considered to be random variables, and as a result, Li is
therefore also a random variable. If the distribution of
probability of Lij is known, however, and reasonable
assumptions are made as to their level of correlation (that
they are perfectly correlated, for example), the moments of
Fig. 3 Top left PDC dynamic pressure hazard map (in Pascals). Top
right Ash fall thickness for the worst-case scenario eruption of
Nevado del Ruiz (in meters). Bottom left Lahar hazard inundation
map of the Chinchina River (in meters). Bottom center Zoom to the El
Rosario expansion area of Manizales. Bottom right Lineal parks and
land-use planning of El Rosario. Source Bernal (2014c)
276 Bernal et al. Integration of Probabilistic and Multi-Hazard Risk Assessment in Manizales
123
the probability distribution of Li can be determined using
Eq. 6.
3.1 Input Data
The development of a fully probabilistic risk assessment
requires the development of input data linked to (at least)
four different categories, which are hazard, exposure,
vulnerability, and loss. For natural hazards, a specific
stochastic event set was developed for each hazard to
comply with the previously explained requirements that
mandate suitability for use under a fully probabilistic loss
assessment framework. For exposure, a complete database
that includes all public and private buildings of Manizales,
with more than 110,000 entries, was assembled using
official cadastral and census data. For each building, a
complete characterization process was developed in order
to assign to each of the entries in the database relevant data
such as construction material, structural system, number of
stories, age, replacement cost, and number of occupants,
among other variables. Those exposure characteristics
allowed the association of a unique vulnerability function
for each of the hazards considered to each of the entries in
the exposure database in order to obtain the expected
damages and losses. Those vulnerability functions were
developed using different approaches that range from
experimental models, used mainly for the historical
buildings made from earthen materials, to analytical
models used mostly for flexible structures such as medium
and high-rise reinforced concrete buildings. For the loss
assessment, the CAPRA-GIS program (ERN-AL 2011)
was used. This program incorporates the methodologies
developed by Ordaz (2000, 2014), which have been
acknowledged to be suitable tools to perform risk assess-
ments at different scales (Cardona et al. 2013, 2014, 2015;
Marulanda et al. 2013; Salgado-Galvez et al. 2016b, c).
3.2 Results
Risk results are presented in terms of the average annual loss
(AAL) and the probable maximum loss (PML), which are
probabilistic risk metrics commonly used in actuarial math-
ematics. A detailed definition of these metrics can be found in
Ordaz (2000), Marulanda (2013), and Bernal (2014a).
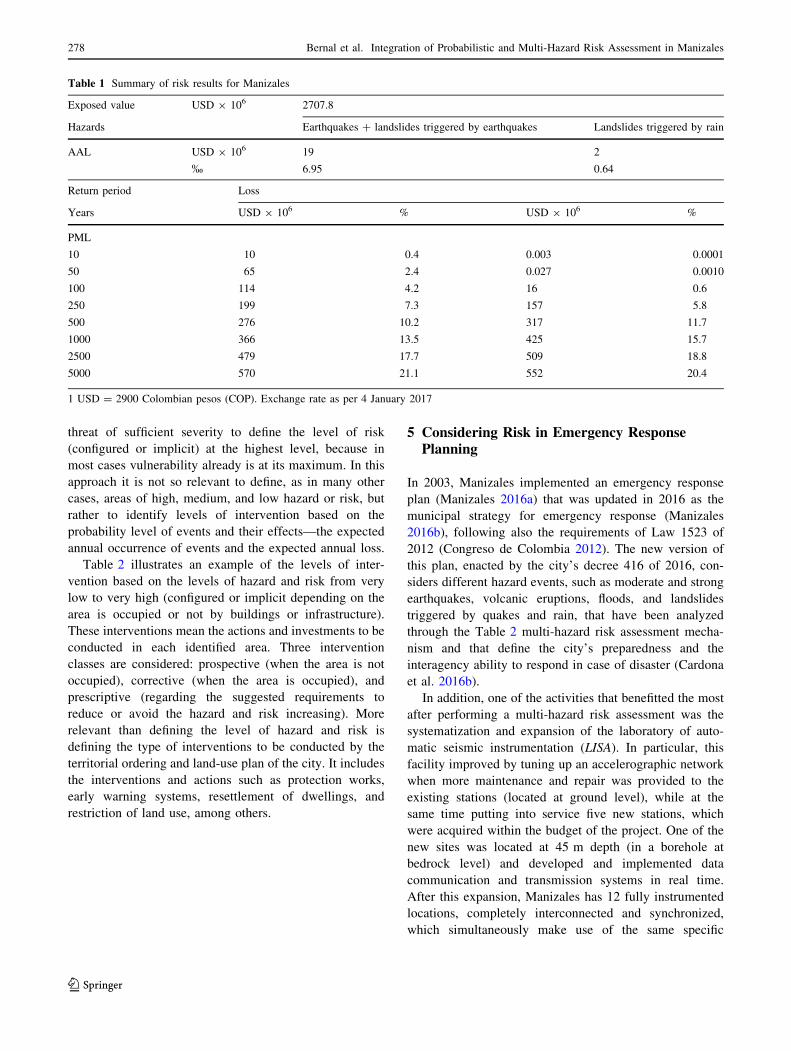
The losses caused by earthquakes, including detonated
landslides and by rain triggered landslides, are shown in
Table 1. The risk metrics are included both in absolute and
relative terms; the first refer to monetary values whereas
the second note the ratio between the expected loss and the
total exposed value of the city. Relative AAL’s are usually
expressed as an amount per thousand (%).
The AAL and the PML may also be evaluated for port-
folios of public and private buildings (for example, schools,
hospitals), bridges, pipelines, and so on. They are very useful
to define a strategy of risk transfer and retention by sectors
and for different stakeholders of the city. Marulanda et al.
(2014, 2016) and Salgado-Galvez et al. (2017a, b) describe
the evaluation and use of these probabilisticmetrics to design
and implement insurance policies in Manizales. The AAL is
the best indicator of physical risk, not only for insurance but
also for other risk reduction actions such as socioeconomic
development planning, territorial ordering and urban plan-
ning, emergency response, and cost–benefit analysis of ret-
rofitting andmitigation works. Carreno et al. (2017) describe
the use of probabilistic risk results by districts in Manizales
for the holistic evaluation of risk (Cardona 2004, 2011) and
the formulation of the city’s disaster risk management plan
(Cardona et al. 2016a).
4 Considering Risk in Urban Planning
Natural hazards and risk should be considered as a deter-
minant in the land-use planning of cities and hydrological
basins, in accordance with the Law 9 of 1989 and Law 388 of
1997 (Congreso de Colombia 1989, 1997) that includes the
legislation on urban planning and territorial development,
among others. The city administration ofManizales has used
multi-hazard risk assessment to include hazards and risk
information in its Territorial Ordering Plan (Manizales
2017), which is approved for the following 12 years. In case
of land that is classified as containing a nonreducible risk
situation, the land should be defined as a land of protection,
that is any permanent urban activity in that place should be
avoided. The definition of nonreducible risk depends on the
cost-benefit analysis of the cost of work required to reduce
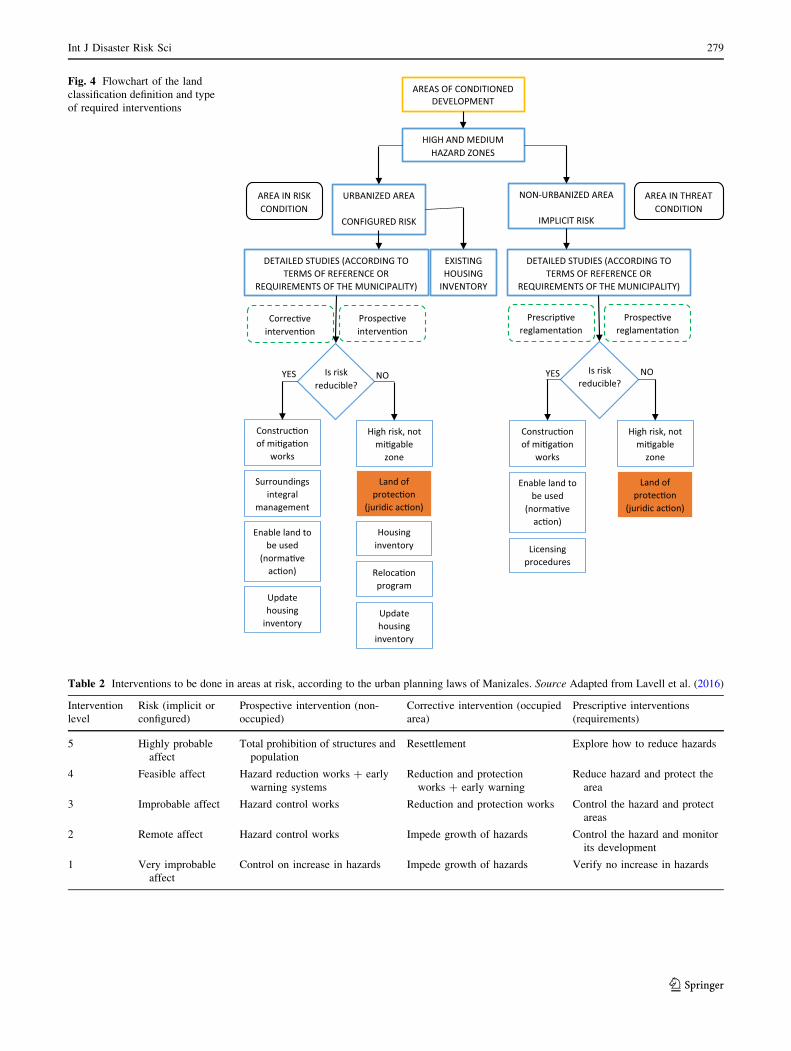
the level of hazard and risk. Risk can be configured (when the
area is urbanized) or implicit (when the area is not yet
urbanized). Figure 4 shows the flowchart of the steps needed
not only to define the classification of land (as protected land
or not) but also the type of required interventions depending
on whether the area is occupied or not. The area can be
classified temporally as an area of conditional development
until detailed studies are done (using the specific geotech-
nical norm of Manizales) as part of a programmatic com-
ponent of the city plan. In this fashion, development can be
differentiated over time based on a principle of gradualness
that is specific to the local context.
It is important to highlight that seismic microzonation is
mainly prescriptive (that is, useful for the definition of the
construction requirements for buildings and other infras-
tructure) and seismic losses depend on the vulnerability of
the exposed structural elements. It would be useful to
define the liquefaction potential in the areas of analysis.
From a planning perspective, landslides triggered by rain or
by earthquakes, volcanic lahars, and flash floods pose a
Int J Disaster Risk Sci 277
123
threat of sufficient severity to define the level of risk
(configured or implicit) at the highest level, because in
most cases vulnerability already is at its maximum. In this
approach it is not so relevant to define, as in many other
cases, areas of high, medium, and low hazard or risk, but
rather to identify levels of intervention based on the
probability level of events and their effects—the expected
annual occurrence of events and the expected annual loss.
Table 2 illustrates an example of the levels of inter-
vention based on the levels of hazard and risk from very
low to very high (configured or implicit depending on the
area is occupied or not by buildings or infrastructure).
These interventions mean the actions and investments to be
conducted in each identified area. Three intervention
classes are considered: prospective (when the area is not
occupied), corrective (when the area is occupied), and
prescriptive (regarding the suggested requirements to
reduce or avoid the hazard and risk increasing). More
relevant than defining the level of hazard and risk is
defining the type of interventions to be conducted by the
territorial ordering and land-use plan of the city. It includes
the interventions and actions such as protection works,
early warning systems, resettlement of dwellings, and
restriction of land use, among others.
5 Considering Risk in Emergency ResponsePlanning
In 2003, Manizales implemented an emergency response
plan (Manizales 2016a) that was updated in 2016 as the
municipal strategy for emergency response (Manizales
2016b), following also the requirements of Law 1523 of
2012 (Congreso de Colombia 2012). The new version of
this plan, enacted by the city’s decree 416 of 2016, con-
siders different hazard events, such as moderate and strong
earthquakes, volcanic eruptions, floods, and landslides
triggered by quakes and rain, that have been analyzed
through the Table 2 multi-hazard risk assessment mecha-
nism and that define the city’s preparedness and the
interagency ability to respond in case of disaster (Cardona
et al. 2016b).
In addition, one of the activities that benefitted the most
after performing a multi-hazard risk assessment was the
systematization and expansion of the laboratory of auto-
matic seismic instrumentation (LISA). In particular, this
facility improved by tuning up an accelerographic network
when more maintenance and repair was provided to the
existing stations (located at ground level), while at the
same time putting into service five new stations, which
were acquired within the budget of the project. One of the
new sites was located at 45 m depth (in a borehole at
bedrock level) and developed and implemented data
communication and transmission systems in real time.
After this expansion, Manizales has 12 fully instrumented
locations, completely interconnected and synchronized,
which simultaneously make use of the same specific
Table 1 Summary of risk results for Manizales
Exposed value USD 9 106 2707.8
Hazards Earthquakes ? landslides triggered by earthquakes Landslides triggered by rain
AAL USD 9 106 19 2
% 6.95 0.64
Return period Loss
Years USD 9 106 % USD 9 106 %
PML
10 10 0.4 0.003 0.0001
50 65 2.4 0.027 0.0010
100 114 4.2 16 0.6
250 199 7.3 157 5.8
500 276 10.2 317 11.7
1000 366 13.5 425 15.7
2500 479 17.7 509 18.8
5000 570 21.1 552 20.4
1 USD = 2900 Colombian pesos (COP). Exchange rate as per 4 January 2017
278 Bernal et al. Integration of Probabilistic and Multi-Hazard Risk Assessment in Manizales
123
AREAS OF CONDITIONED DEVELOPMENT
HIGH AND MEDIUM HAZARD ZONES
URBANIZED AREA
CONFIGURED RISK
NON-URBANIZED AREA
IMPLICIT RISK
AREA IN RISK CONDITION
AREA IN THREATCONDITION
EXISTING HOUSING
INVENTORY
DETAILED STUDIES (ACCORDING TO TERMS OF REFERENCE OR
REQUIREMENTS OF THE MUNICIPALITY)
DETAILED STUDIES (ACCORDING TO TERMS OF REFERENCE OR
REQUIREMENTS OF THE MUNICIPALITY)
Is risk reducible?
Correc�ve interven�on
Prospec�ve interven�on
Construc�on of mi�ga�on
works
Surroundings integral
management
Enable land to be used
(norma�ve ac�on)
Update housing
inventory
High risk, not mi�gable
zone
Land of protec�on
(juridic ac�on)
Housing inventory
Reloca�on program
Update housing
inventory
YES NO Is risk reducible?
Prescrip�ve reglamenta�on
Prospec�vereglamenta�on
YES NO
Construc�on of mi�ga�on
works
Enable land to be used
(norma�ve ac�on)
Licensingprocedures
High risk, not mi�gable
zone
Land of protec�on
(juridic ac�on)
Fig. 4 Flowchart of the land
classification definition and type
of required interventions
Table 2 Interventions to be done in areas at risk, according to the urban planning laws of Manizales. Source Adapted from Lavell et al. (2016)
Intervention
level
Risk (implicit or
configured)
Prospective intervention (non-
occupied)
Corrective intervention (occupied
area)
Prescriptive interventions
(requirements)
5 Highly probable
affect
Total prohibition of structures and
population
Resettlement Explore how to reduce hazards
4 Feasible affect Hazard reduction works ? early
warning systems
Reduction and protection
works ? early warning
Reduce hazard and protect the
area
3 Improbable affect Hazard control works Reduction and protection works Control the hazard and protect
areas
2 Remote affect Hazard control works Impede growth of hazards Control the hazard and monitor
its development
1 Very improbable
affect
Control on increase in hazards Impede growth of hazards Verify no increase in hazards
Int J Disaster Risk Sci 279
123
software, developed for the system’s management as well
as data reading, processing, and transmission.
Within this task, different activities were performed.
These efforts included the diagnosis of existing equipment,
the corrective maintenance of accelerograph stations, and
the design and construction of the sheds where new
equipment was installed. The seismic information system
of Manizales (SISMan-LISA) was updated. This strengthens
a tool that contributes to the city’s seismic risk manage-
ment in activities related to preparedness and emergency
response, since it provides relevant input data for the
proper operation and assignment of physical and human
resources within the city during a crisis situation.
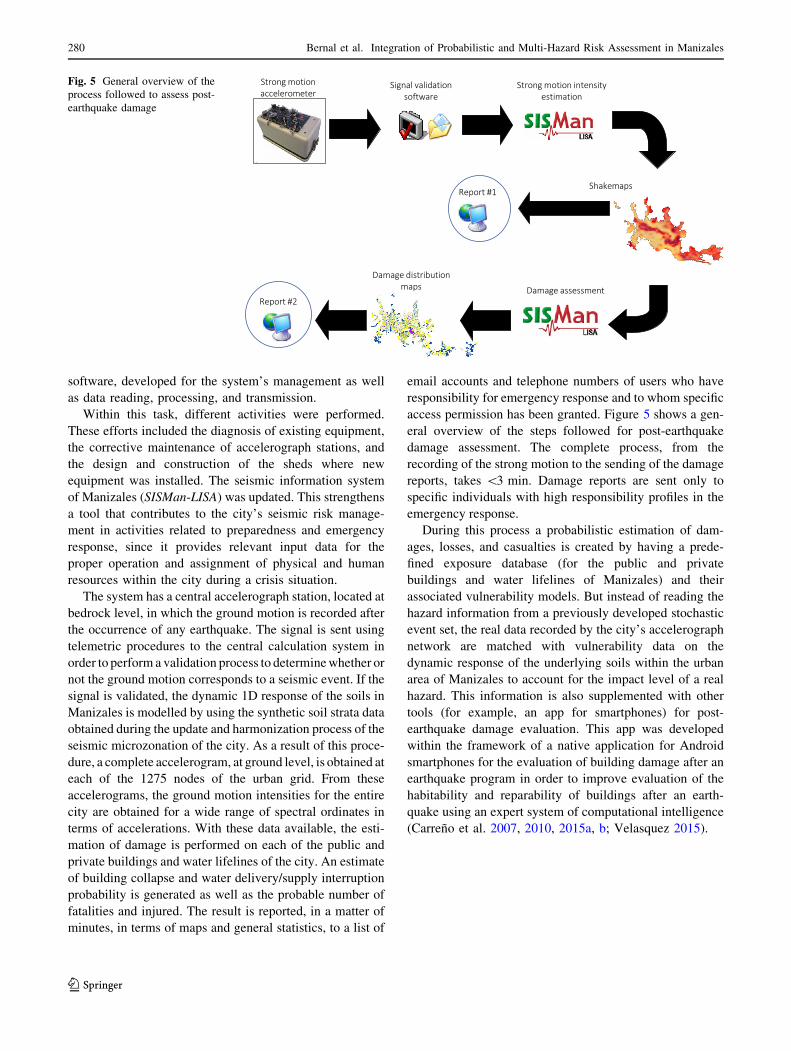
The system has a central accelerograph station, located at
bedrock level, in which the ground motion is recorded after
the occurrence of any earthquake. The signal is sent using
telemetric procedures to the central calculation system in
order to perform a validation process to determinewhether or
not the ground motion corresponds to a seismic event. If the
signal is validated, the dynamic 1D response of the soils in
Manizales is modelled by using the synthetic soil strata data
obtained during the update and harmonization process of the
seismic microzonation of the city. As a result of this proce-
dure, a complete accelerogram, at ground level, is obtained at
each of the 1275 nodes of the urban grid. From these
accelerograms, the ground motion intensities for the entire
city are obtained for a wide range of spectral ordinates in
terms of accelerations. With these data available, the esti-
mation of damage is performed on each of the public and
private buildings and water lifelines of the city. An estimate
of building collapse and water delivery/supply interruption
probability is generated as well as the probable number of
fatalities and injured. The result is reported, in a matter of
minutes, in terms of maps and general statistics, to a list of
email accounts and telephone numbers of users who have
responsibility for emergency response and to whom specific
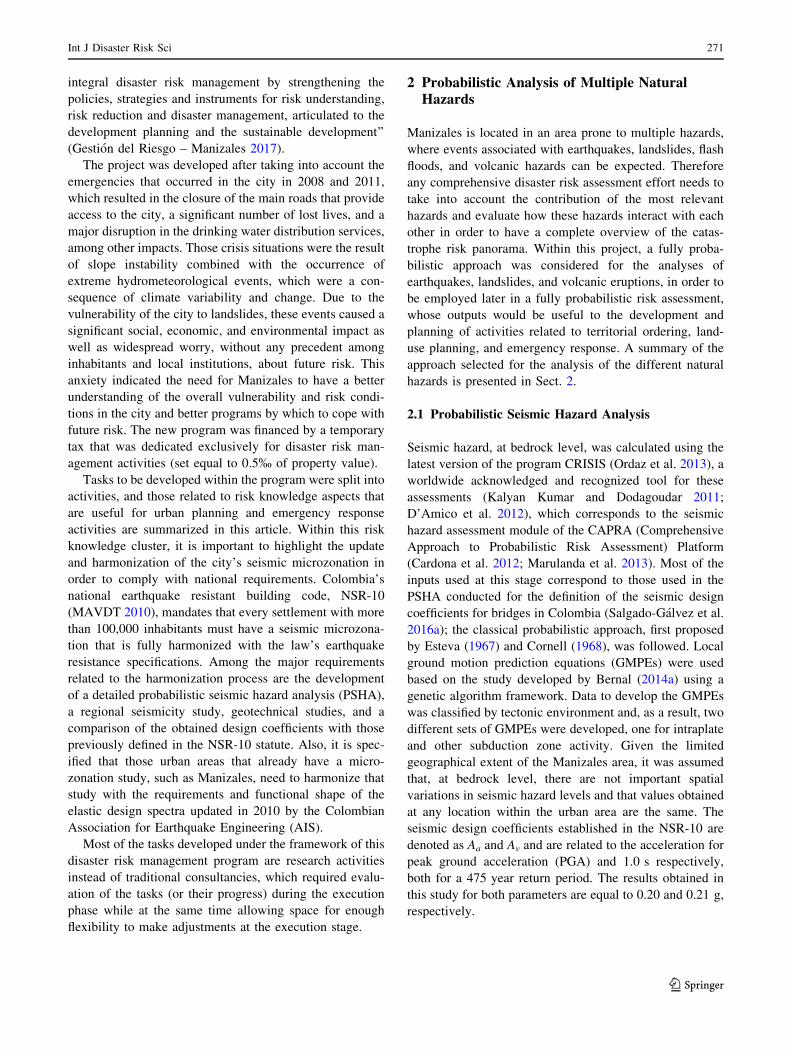
access permission has been granted. Figure 5 shows a gen-
eral overview of the steps followed for post-earthquake
damage assessment. The complete process, from the
recording of the strong motion to the sending of the damage
reports, takes \3 min. Damage reports are sent only to
specific individuals with high responsibility profiles in the
emergency response.
During this process a probabilistic estimation of dam-
ages, losses, and casualties is created by having a prede-
fined exposure database (for the public and private
buildings and water lifelines of Manizales) and their
associated vulnerability models. But instead of reading the
hazard information from a previously developed stochastic
event set, the real data recorded by the city’s accelerograph
network are matched with vulnerability data on the
dynamic response of the underlying soils within the urban
area of Manizales to account for the impact level of a real
hazard. This information is also supplemented with other
tools (for example, an app for smartphones) for post-
earthquake damage evaluation. This app was developed
within the framework of a native application for Android
smartphones for the evaluation of building damage after an
earthquake program in order to improve evaluation of the
habitability and reparability of buildings after an earth-
quake using an expert system of computational intelligence
(Carreno et al. 2007, 2010, 2015a, b; Velasquez 2015).
Strong motionaccelerometer
Signal validationsoftware
Strong motion intensityestimation
ShakemapsReport #1
Damage assessment
Damage distributionmaps
Report #2
Fig. 5 General overview of the
process followed to assess post-
earthquake damage
280 Bernal et al. Integration of Probabilistic and Multi-Hazard Risk Assessment in Manizales
123
6 Conclusions
Disaster risk must be evaluated following a multi-hazard
approach. Assessments of individual hazards are useful but
not exhaustive, and leave a knowledge gap that will lead to
management actions that are biased and partial. The most
appropriate way to perform multi-hazard risk assessments
is to follow a probabilistic approach in which not only the
uncertainties in the definition and calculation of hazard,
exposure, and vulnerability are rationally involved, but also
a mathematical framework is provided to combine in one
framework all the losses caused by different hazards, either
dependent (for example, rainfall and landslides) or inde-
pendent (for example, rainfall and volcanic eruptions).
Planning instruments at the city level need appropriate
inputs from disaster risk assessment techniques and from
research methods that provide useful responses to the real
questions that arise from urban planning, development
planning, risk management planning, and emergency
response planning. In the case of urban planning, for
example, it is necessary to provide insights better regarding
to what to do than if the risk is high, medium, or low.
A fully probabilistic multi-hazard risk model was
applied, for the first time, in Manizales, Colombia, as part
of an ambitious disaster risk assessment and management
program. The risk evaluations presented in this article can
be useful, not only to quantify the risk associated with
different perils, but to define concrete actions towards the
management and reduction of these risk. Having the same
knowledge base for all management activities allows the
city to constantly enhance its existing models of hazard,
exposure, and vulnerability, and to update risk evaluations
and provide feedback on the management actions con-
templated and/or implemented.
Acknowledgements This work was carried out within the framework
of the inter-institutional agreement between the Universidad Nacional
de Colombia, Manizales Campus, and the Corporacion Autonoma
Regional de Caldas (CORPOCALDAS)—the regional environmental
authority—and the authors are grateful for the unwavering support
and encouragement provided by the leaders and staff of both
institutions.
Open Access This article is distributed under the terms of the
Creative Commons Attribution 4.0 International License (http://crea
tivecommons.org/licenses/by/4.0/), which permits unrestricted use,
distribution, and reproduction in any medium, provided you give
appropriate credit to the original author(s) and the source, provide a
link to the Creative Commons license, and indicate if changes were
made.
References
Bernal, G.A. 2010. Volcanic Hazard Analysis and Simulation Tool
(VHAST). Computer program for probabilistic volcanic hazard
modelling. http://www.vhast.org/. Accessed 26 Nov 2016.
Bernal, G.A. 2012. Strong motion analyst. Computer program for
processing strong motion and seismological data.
Bernal, G.A. 2014a. Methodology for the modelling, calculation and
calibration of seismic hazard parameters to assess risk in a
probabilistic way (Metodologıa para la modelacion, calculo y
calibracion de parametros de la amenaza sısmica para la
evaluacion probabilista del riesgo). Doctoral thesis. Universidad
Politecnica de Cataluna, Barcelona, Spain (in Spanish).
Bernal, G.A. 2014b. Multi-hazard modelling of disaster risk in
Manizales (Modelacion multiamenaza del riesgo de desastes en
Manizales). Technical report. Gestion del Riesgo—Manizales.
Corporacion Autonoma Regional de Caldas (CORPOCALDAS)
2014 (in Spanish).
Bernal, G.A. 2014c. Use of a volcanic hazard evaluation technique,
compatible with CAPRA, based on the information available for
Manizales (Utilizacion de la tecnica de evaluacion de la
amenaza volcanica, con enfoque tipo CAPRA, con base en la
informacion disponible para Manizales). Technical report.
Gestion del Riesgo—Manizales. Corporacion Autonoma Regio-
nal de Caldas (CORPOCALDAS) 2014 (in Spanish).
Bernal, G.A., O.D. Cardona, M.A. Salgado-Galvez, and C. Villegas.
2015. Update of the seismic microzonation of Manizales
(Actualizacion de la microzonificacion sısmica de Manizales).
Proceedings of the VII National Congress on Earthquake
Engineering, Bogota D.C., Colombia (in Spanish).
Cardona, O.D. 2004. The need for rethinking the concepts of
vulnerability and risk from a holistic perspective: A necessary
review and criticism for effective risk management. In Mapping
vulnerability: Disasters, development and people, ed.
G. Bankoff, G. Frerks, and D. Hilhorst, 37–51. London:
Earthscan Publishers.
Cardona, O.D. 2011. Disaster risk and vulnerability: Concepts and
measurement of human and environmental insecurity. In Coping
with global environmental change, disasters and security—
threats, challenges, vulnerabilities and risks, ed. H.G. Brauch,
U. Oswald Spring, C. Mesjasz, J. Grin, P. Kameri-Mbote, B.
Chourou, P. Dunay, J. Birkmann, 107–121. Berlin and New
York: Springer-Verlag.
Cardona, O.D., G.A. Bernal, M.G. Ordaz, M.A. Salgado-Galvez, S.K.
Singh, M.G. Mora, and C.P. Villegas. 2015. Update on the
probabilistic modelling of natural risks at global level: Global
risk model – global earthquake and tropical cyclone hazard
assessment. Disaster risk assessment at country level for
earthquakes, tropical cyclones (wind and storm surge), floods,
tsunami and volcanic eruptions. CIMNE & INGENIAR Con-
sortium, Barcelona & Bogota.
Cardona, O.D., G.A. Bernal, M.G. Ordaz, M.A. Salgado-Galvez, S.K.
Singh, M.G. Mora, L.E. Yamın, and A.H. Barbat. 2013.
Probabilistic modelling of natural risks at the global level:
Global risk model. Global earthquake and cyclone models and
Disaster risk assessment of countries for seismic, cyclone and
flood hazards. Consortium CIMNE, INGENIAR, ITEC, EAI,
Barcelona—Bogota. http://www.preventionweb.net/english/
hyogo/gar/2013/en/bgdocs/CIMNE%20ET%20AL%20Global%
20Risk%20Model%20GAR-2013_Tables%20ENGr%20v2.pdf.
Accessed 6 Jan 2017.
Cardona, O.D., M.G. Ordaz, M.G. Mora, M.A. Salgado-Galvez, G.A.
Bernal, D. Zuloaga-Romero, M.C. Marulanda, L. Yamın, and D.
Gonzalez. 2014. Global risk assessment: A fully probabilistic
seismic and tropical cyclone wind risk assessment. International
Journal of Disaster Risk Reduction 10(B): 461–476.
Cardona, O.D., M. Ordaz, E. Reinoso, L.E. Yamın, and A.H. Barbat.
2012. CAPRA—Comprehensive approach to probabilistic risk
assessment: International initiative for risk management effec-
tiveness. Proceedings of the 15th world conference on earth-
quake engineering, 24–28 September 2012, Lisbon, Portugal.
Int J Disaster Risk Sci 281
123
Cardona, O.D., M.P Perez, and D.C. Suarez. 2016a. Municipal plan
for disaster risk management of Manizales. (Plan Municipal de
Gestion del Riesgo de Desastres de Manizales). INGENIAR
2016 (in Spanish).
Cardona, O.D., M.P Perez, and D.C. Suarez. 2016b. Municipal
strategy for emergency response of Manizales. (Estrategia
Municipal de Respuesta a Emergencias de Manizales). INGE-
NIAR 2016 (in Spanish).
Carreno, M.L. 2015a. Expert system for the evaluation of building
habitability and reparability after an earthquake. Theoretical
base and algorithm. (Sistema experto para evaluar la habitabil-
idad y reparabilidad en edificios despues de un sismo. Base
teorica y algoritmo). Technical report. Gestion del Riesgo—
Manizales. CORPOCALDAS 2015 (in Spanish).
Carreno, M.L. 2015b. Field manual for building inspection after an
earthquake. (Manual de campo para la inspeccion de edifica-
ciones despues de un sismo). Technical report. Gestion del
Riesgo—Manizales. CORPOCALDAS 2015 (in Spanish).
Carreno, M.L., O.D. Cardona, and A.H. Barbat. 2007. Neuro-fuzzy
assessment of building damage and safety after an earthquake. In
Intelligent computational paradigms in earthquake engineering,
ed. N.D. Lagaros, and Y. Tsompanakis, 123–157. Hershey, PA:
Idea Group Publishing.
Carreno M.L., O.D. Cardona, and A.H. Barbat. 2010. Computational
tool for post-earthquake evaluation of damage in buildings.
Earthquake Spectra 26(1): 63–86.
Carreno, M.L., O.D. Cardona, A.H. Barbat, D.C. Suarez, M.P. Perez,
and L. Narvaez. 2017. Holistic disaster risk evaluation for the
urban risk management plan of Manizales, Colombia. Interna-
tional Journal of Disaster Risk Science 8(3). doi:10.1007/
s13753-017-0136-7.
Congreso de Colombia. 1989. Law 9 of 1989. http://www.alcaldiabo
gota.gov.co/sisjur/normas/Norma1.jsp?i=1175. Accessed 26 Nov
2016 (in Spanish).
Congreso de Colombia. 1997. Law 388 of 1997. http://www.
alcaldiabogota.gov.co/sisjur/normas/Norma1.jsp?i=339. Acces-
sed 26 Nov 2016 (in Spanish).
Congreso de Colombia. 2012. Law 1523 of 2012. http://www.
alcaldiabogota.gov.co/sisjur/normas/Norma1.jsp?i=47141.
Accessed 26 Nov 2016 (in Spanish).
Cornell, C.A. 1968. Engineering seismic risk analysis. Bulletin of the
Seismological Society of America 58(5): 1583–1606.
D’Amico, V., C. Melleti, and F. Martinelli. 2012. Probabilistic
seismic hazard assessment in the high-risk area of south-eastern
Sicily (Italy). Bollettino di Geofisica Teoria ed Applicata 53(1):
19–36.
DANE (Departamento Administrativo Nacional de Estadıstica). 2005.
Results and projections (2005–2020) of the 2005 census
(Resultados y proyecciones (2005–2020) del censo 2005).
http://www.dane.gov.co/files/censo2005/PERFIL_PDF_
CG2005/17001T7T000.PDF. Accessed 6 Oct 2016 (in Spanish).
ERN-AL (Evaluacion de Riesgos Naturales America Latina). 2011.
CAPRA-GIS v2.0. Program for probabilistic risk assessment.Bogota D.C., Colombia.
Esteva, L. 1967. Criteria for the definition of seismic design spectra
(Criterios para la construccion de espectros de diseno sısmico).
Proceedings of the 3rd Pan-American Symposium of Structures,
3–8 July 1967, Caracas, Venezuela (in Spanish).
Gestion del Riesgo – Manizales. 2017. Risk management project
(Proyecto GR Manizales). http://www.gestiondelriesgomani
zales.com/index.php?option=com_content&view=article&id=
124&Itemid=228. Accessed 14 Jan 2016 (in Spanish).
Iverson, R.M., S.P. Schilling, and J.W. Vallance. 1998. Objective
delineation of lahar-inundation hazard zones. The Geological
Society of America Bulletin 110(8): 972–984.
Kalyan Kumar, G. and G.R. Dodagoudar. 2011. Seismic input motion
for Kanchipuram, South India. International Journal of Earth
Sciences and Engineering 4: 189–192.
Lavell, A., E. Mansilla, A. Chavez, O.D. Cardona, M.P. Perez. 2016.
Decision, implementation and social and economic impacts of
climate risk induced resettlement in urban areas: A final regional
report for Latin America. The Bartlett Development Planning
Unit. University College London. United Kingdom.
Londono, J.P. 2014a. Evaluation of susceptibility to landslides in the
city of Manizales (Evaluacion de la susceptibilidad a los
deslizamientos en la ciudad de Manizales). Technical report.
Gestion del Riesgo—Manizales. CORPOCALDAS 2014 (in
Spanish).
Londono, J.P. 2014b. Landslides susceptibility, hazard zoning and
triggering rain thresholds. (Zonificacion de susceptibilidad y
amenaza por deslizamientos y umbrales de lluvia detonante).
Technical report. Gestion del Riesgo – Manizales. CORPO-
CALDAS 2014 (in Spanish).
Manizales. 2016a. Municipal plan for disaster risk management (Plan
municipal de gestion del riesgo de desastres). http://www.
gestiondelriesgomanizales.com/index.php?option=com_con
tent&view=article&id=143&Itemid=251. Accessed 23 Oct 2016
(in Spanish).
Manizales. 2016b. Municipal strategy for emergency response
(Estrategia municipal de respuesta a emergencias). http://
www.gestiondelriesgomanizales.com/index.php?option=com_
content&view=article&id=144&Itemid=253. Accessed 23 Oct
2016 (in Spanish).
Manizales. Department of Planning. 2017. Territorial ordering plan
(Plan de ordenamiento territorial). http://www.manizales.gov.
co/Contenido/Alcaldia/86/plan-de-ordenamiento-territorial-vig
ente. Accessed 20 Jun 2017 (in Spanish).
Marulanda, M.C. 2013. Probabilistic modelling of earthquake
economic losses for the estimation of the fiscal vulnerability
and financial risk management (Modelacion probabilista de
perdidas economicas por sismo para la estimacion de la
vulnerabilidad fiscal del estado y la gestion financiera del
riesgo). Doctoral thesis. Universidad Politecnica de Cataluna,
Barcelona, Spain (in Spanish).
Marulanda, M.C., O.D. Cardona, and A.H. Barbat. 2008. The
economic and social effects of small disasters: Revision of the
local disaster index and the case study of Colombia. In
Megacities: Resilience and social vulnerability, ed. H.G. Bohle,
and K. Warner, 110–115. Bonn: United Nations University –
Environment and Human Security (EHS) and Munich: Re
Foundation.
Marulanda, M.C., O.D. Cardona, and A.H. Barbat. 2010. Revealing
the socioeconomic impact of small disasters in Colombia using
the DesInventar database. Disasters 34(2): 552–570.
Marulanda, M.C., O.D. Cardona, and A.H. Barbat. 2011. Revealing
the impact of small disasters to the economic and social
development. In Coping with global environmental change,
disasters and security - threats, challenges, vulnerabilities and
risks, ed. H.G. Brauch, U. Oswald Spring, C. Mesjasz, J. Grin, P.
Kameri-Mbote, B. Chourou, P. Dunay, and J. Birkmann,
575–584. Berlin and New York: Springer.
Marulanda, M.C., O.D. Cardona, M.G. Mora, and A.H. Barbat. 2014.
Design and implementation of a voluntary collective earthquake
insurance policy to cover low-income homeowners in a devel-
oping country. Natural Hazards 74(3): 2071–2088.
Marulanda, M.C., O.D. Cardona, M.G. Mora, and D.M. Gonzalez.
2016. Seismic risk assessment for risk transfer: The voluntary
collective insurance in Manizales, Colombia. Proceedings of
international conference on urban risks, ICUR2016, 30 June–2
July 2016, Lisbon.
282 Bernal et al. Integration of Probabilistic and Multi-Hazard Risk Assessment in Manizales
123
Marulanda, M.C., M.L. Carreno, O.D. Cardona, M. Ordaz, and A.H.
Barbat. 2013. Probabilistic earthquake risk assessment using
CAPRA: Application to the city of Barcelona, Spain. Natural
Hazards 69(1): 59–84.
MAVDT (Ministerio de Ambiente Vivienda y Desarrollo Territorial
de Colombia). 2010. Colombian earthquake resistant building
code NSR-10 (Reglamento Colombiano de Construccion Sismo
Resistente NSR-10) (in Spanish).
Newmark, N. 1965. Effects of earthquakes on dams and embank-
ments. Geotechnique 15(2): 139–160.
Ordaz, M. 2000. Methodology for the seismic risk assessment
oriented toward earthquake insurance management (Metodologıa
para la evaluacion del riesgo sısmico enfocada a la gerencia de
seguros por terremoto). Universidad Nacional Autonoma de
Mexico. Mexico City, Mexico (in Spanish).
Ordaz, M. 2014. A simple probabilistic model to combine losses
arising from the simultaneous occurrence of several hazards.
Natural Hazards 76(1): 389–396.
Ordaz, M., F. Martinelli, V. D’Amico, and C. Meletti. 2013.
CRISIS2008: A flexible tool to perform probabilistic seismic
hazard assessment. Seismological Research Letters 84(3):
495–504.
Salgado-Galvez, M.A., G.A. Bernal, and O.D. Cardona. 2016a.
Probabilistic seismic hazard assessment of Colombia with
updating purposes of the Earthquake-Resistant Building Code
for Bridges CCP-14 (Evaluacion probabilista de la amenaza
sısmica de Colombia con fines de actualizacion de la Norma
Colombia de Diseno de Puentes CCP-14). Revista Internacional
de Metodos Numericos para Calculo y Diseno en Ingenierıa
32(4): 230–239 (in Spanish).
Salgado-Galvez, M.A., G.A. Bernal, D. Zuloaga, M.C. Marulanda,
O.D. Cardona, and S. Henao. 2017a. Probabilistic seismic risk
assessment in Manizales, Colombia: Quantifying losses for
insurance purposes. International Journal of Disaster Risk
Science 8(3). doi:10.1007/s13753-017-0137-6.
Salgado-Galvez, M.A., M.L. Carreno, A.H. Barbat, and O.D.
Cardona. 2016b. Probabilistic seismic risk assessment of Lorca
through scenario simulations (Evaluacion probabilista del riesgo
sısmico en Lorca mediante simulaciones de escenarios). Revista
Internacional de Metodos Numericos para Calculo y Diseno en
Ingenierıa 32(2): 70–78 (in Spanish).
Salgado-Galvez, M.A., D. Zuloaga-Romero, G.A. Bernal, M.G. Mora,
and O.D. Cardona. 2014. Fully probabilistic seismic risk
assessment considering local site effects for the portfolio of
buildings in Medellın, Colombia. Bulletin of Earthquake Engi-
neering 12(2): 671–695.
Salgado-Galvez, M.A., D. Zuloaga, S. Henao, G.A. Bernal, and O.D.
Cardona. 2017b. Probabilistic assessment of annual repair rates
in pipelines and of direct economic losses in water and sewage
networks: Application to Manizales, Colombia. Natural
Hazards. doi:10.1007/s11069-017-2987-z.
Salgado-Galvez, M.A., D. Zuloaga Romero, C.A. Velasquez, M.L.
Carreno, O.D. Cardona, and A.H. Barbat. 2016c. Urban seismic
risk index for Medellın, Colombia, based on probabilistic loss
and casualties estimations. Natural Hazards 80(3): 1995–2012.
Velasquez, C.A. 2015. Native application for Android smartphones
for the evaluation of building damage after an earthquake
(Aplicacion nativa para telefonos inteligentes Android para la
Evaluacion del dano en edificaciones despues de un sismo).
Technical report. Gestion del Riesgo – Manizales. CORPO-
CALDAS 2015 (in Spanish).
Velasquez, C.A., O.D. Cardona, M.L Carreno, and A.H. Barbat. 2014.
Retrospective assessment of risk from natural hazards. Interna-
tional Journal of Disaster Risk Reduction 10(B): 477–489.
Int J Disaster Risk Sci 283
123
Recommended