HHFT AHSN Audit 2015 and 2016
Dr Harriet Gordon

Background
• 1.4% all death England and Wales from alcohol
• 77% of liver disease secondary to alcohol
• NCEPOD 2013
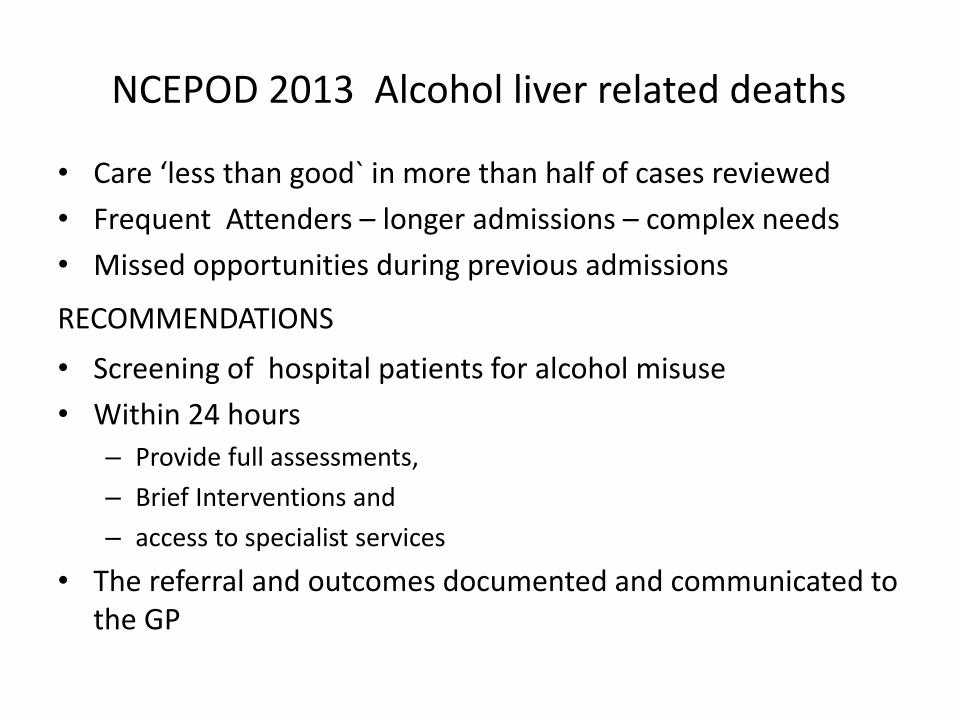
NCEPOD 2013 Alcohol liver related deaths
• Care ‘less than good` in more than half of cases reviewed
• Frequent Attenders – longer admissions – complex needs
• Missed opportunities during previous admissions
RECOMMENDATIONS
• Screening of hospital patients for alcohol misuse
• Within 24 hours
– Provide full assessments,
– Brief Interventions and
– access to specialist services
• The referral and outcomes documented and communicated to the GP

Outcomes
• Increased rates of early detection of harmful alcohol use and associated risk
• Reduce emergency admissions
• Reduce bed days- length of stay
• Reduce mortality
• Improve patient journey
• Improve staff knowledge

Wessex AHSN Quality Improvement
Audit patients admitted with liver disease
• Record screening for alcohol use in patients presenting with liver related pathology
• Document outcomes from screening:
– Units alcohol
– Referral to specialist team in harmful drinking
• Identify improvement pathways

Patient selection
• 1st January-31st March 2015
• Age >18
• >24 hours
• All ARLD admissions, liver disease or alcohol codes

Audit tool • Alcohol unit consumption
• Advice to cut down if above healthy guidelines (brief intervention)
• Higher risk: AUDIT C >8,, referral to Alcohol Intervention Team (AIT)
• Reviewed by AIT
• Evidence of D/C support offered
• Referral to community services
• First or subsequent admission to hospital
• GP Communication and discharge summary

Patient statistics
119 patients in 130 admissions
• 60% male
• 48 (37%) ARLD
• 82 (63%) Non-ARLD

Admission statistics
• 8 had 2 admissions
• 1 had 4 admissions
• 29 (24%) have died since audit
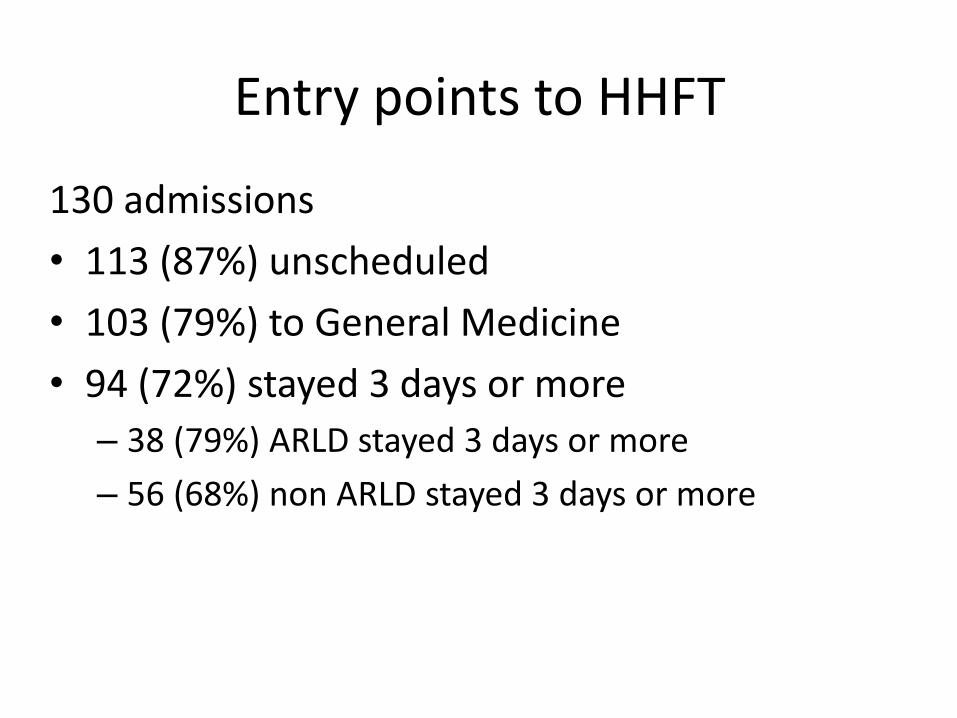
Entry points to HHFT
130 admissions
• 113 (87%) unscheduled
• 103 (79%) to General Medicine
• 94 (72%) stayed 3 days or more
– 38 (79%) ARLD stayed 3 days or more
– 56 (68%) non ARLD stayed 3 days or more
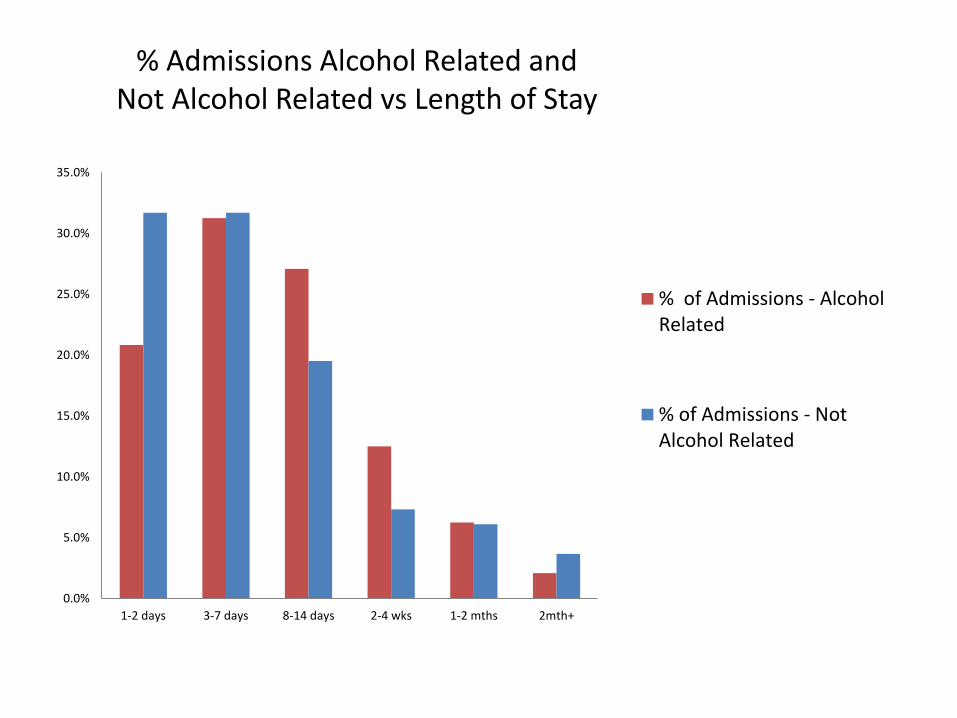
% Admissions Alcohol Related and Not Alcohol Related vs Length of Stay
0.0%
5.0%
10.0%
15.0%
20.0%
25.0%
30.0%
35.0%
1-2 days 3-7 days 8-14 days 2-4 wks 1-2 mths 2mth+
% of Admissions - AlcoholRelated
% of Admissions - NotAlcohol Related

Screening for alcohol use
ARLD, 35/48 notes available
• 33 (94%) asked about alcohol – 22 (64%) units calculated
– 6 (18%) AUDIT C screening tool NALD: 71/82 sets notes available • 61 (86%) asked about alcohol
– 8 (11%) units calculated
– 15 (21%) AUDIT C screening tool
– 56 (79%) vague history
(Notes review suggests 7 NALD actually ARLD)

Alcohol coding
63% not coded with alcohol.
A sample of 20 patient notes:
• 5 (25%) no record of alcohol history
• 15 (75%) non specific history, unable to code
– 4 (20%) of these showed excess alcohol use
• Need to accurately document alcohol units/day
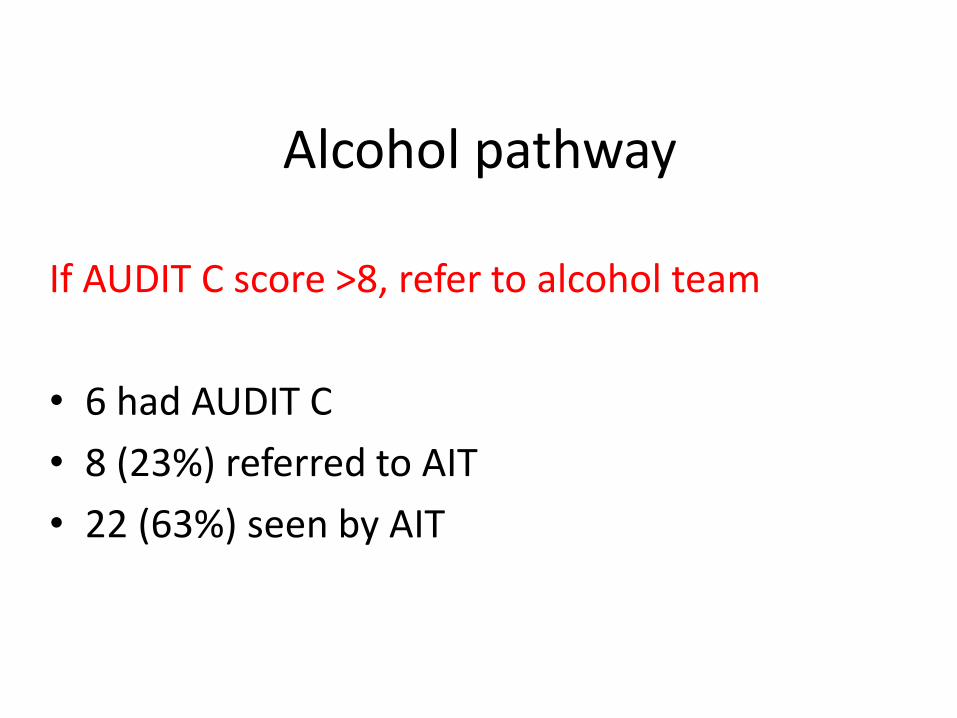
Alcohol pathway
If AUDIT C score >8, refer to alcohol team
• 6 had AUDIT C
• 8 (23%) referred to AIT
• 22 (63%) seen by AIT
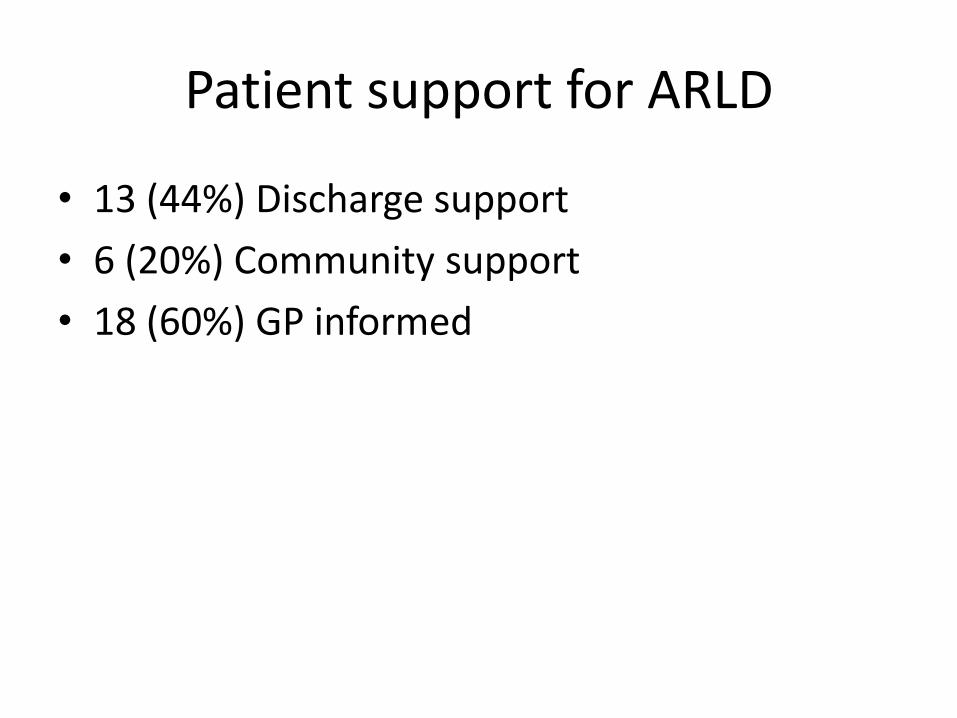
Patient support for ARLD
• 13 (44%) Discharge support
• 6 (20%) Community support
• 18 (60%) GP informed
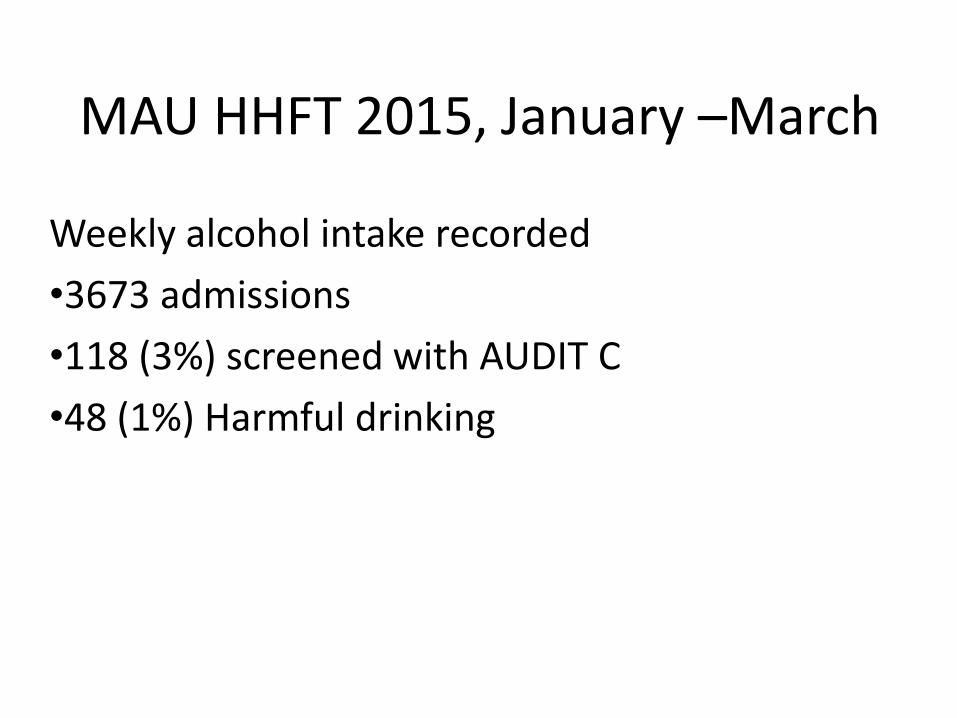
MAU HHFT 2015, January –March
Weekly alcohol intake recorded
•3673 admissions
•118 (3%) screened with AUDIT C
•48 (1%) Harmful drinking

Conclusions 2015 audit
• 37% in patient liver disease at HHFT coded as ARLD
• 87% presents as an emergency
• ARLD stays longer than NARLD
• 24% died in next 12 months
• 18% liver disease patients AUDIT C screening for alcohol
• 3% MAU patients screened for alcohol
• If harmful alcohol intake, not referred to AIT
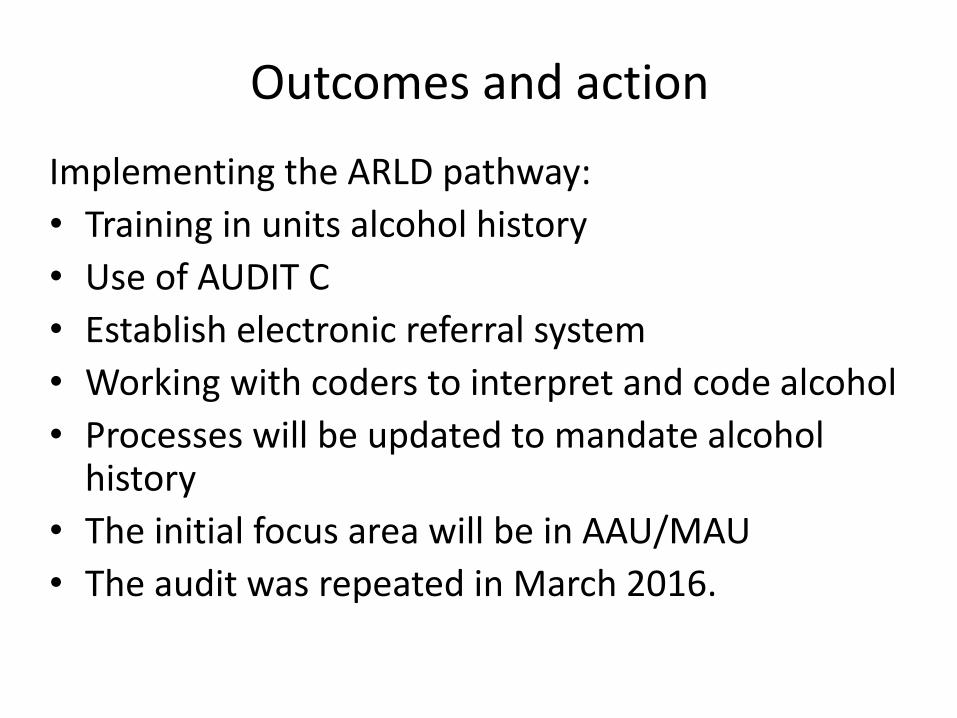
Outcomes and action
Implementing the ARLD pathway:
• Training in units alcohol history
• Use of AUDIT C
• Establish electronic referral system
• Working with coders to interpret and code alcohol
• Processes will be updated to mandate alcohol history
• The initial focus area will be in AAU/MAU
• The audit was repeated in March 2016.
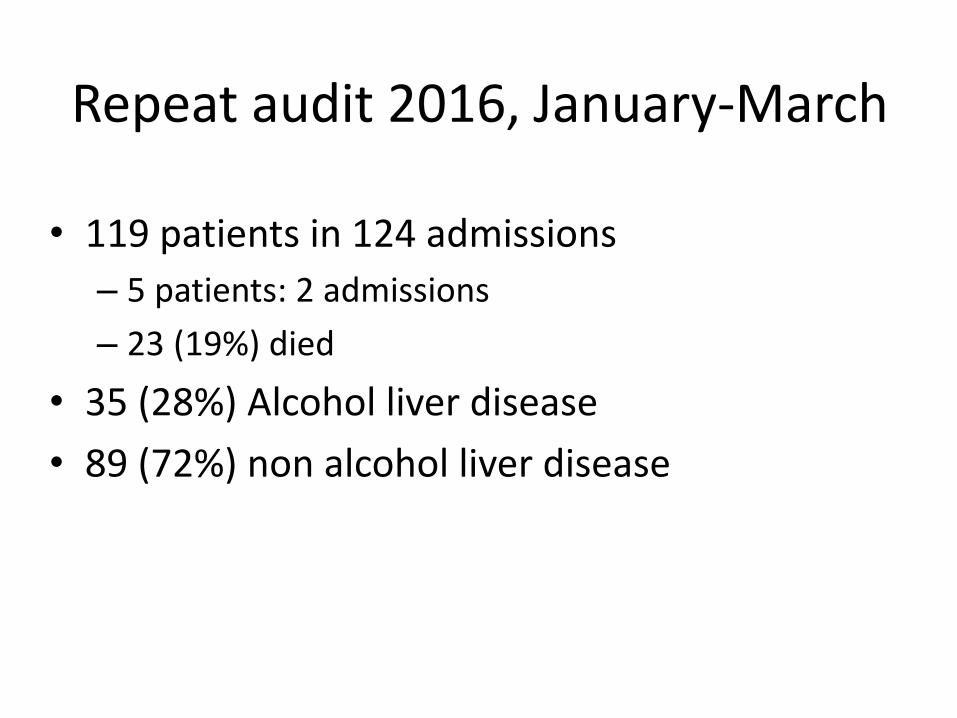
Repeat audit 2016, January-March
• 119 patients in 124 admissions
– 5 patients: 2 admissions
– 23 (19%) died
• 35 (28%) Alcohol liver disease
• 89 (72%) non alcohol liver disease
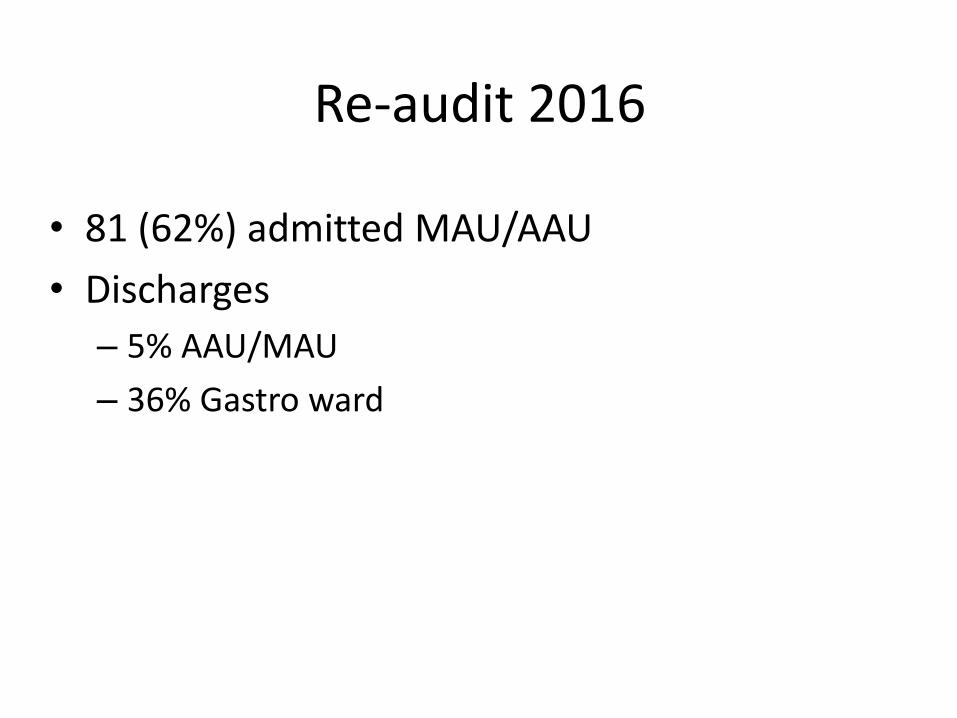
Re-audit 2016
• 81 (62%) admitted MAU/AAU
• Discharges
– 5% AAU/MAU
– 36% Gastro ward

Re-audit 2016
ARLD, 30 notes available
•26 (87%) asked about alcohol
– 13 (43%) AUDIT C
Non ARLD, 69 notes available
•65 (94%) asked about alcohol
– 23 (33%) AUDIT C
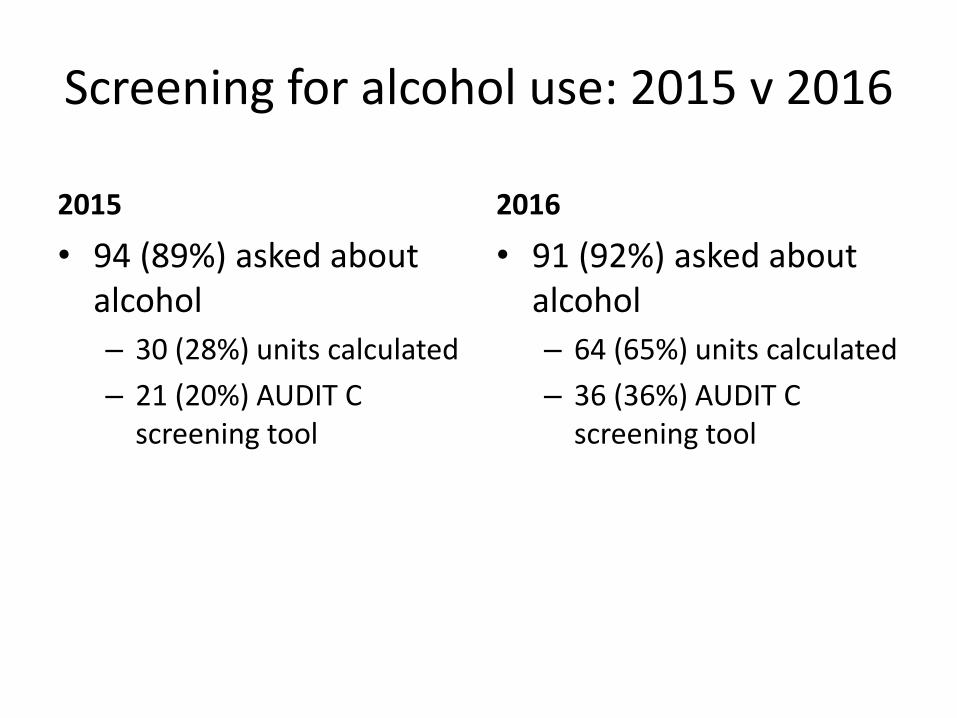
Screening for alcohol use: 2015 v 2016
2015
• 94 (89%) asked about alcohol
– 30 (28%) units calculated
– 21 (20%) AUDIT C screening tool
2016
• 91 (92%) asked about alcohol
– 64 (65%) units calculated
– 36 (36%) AUDIT C screening tool
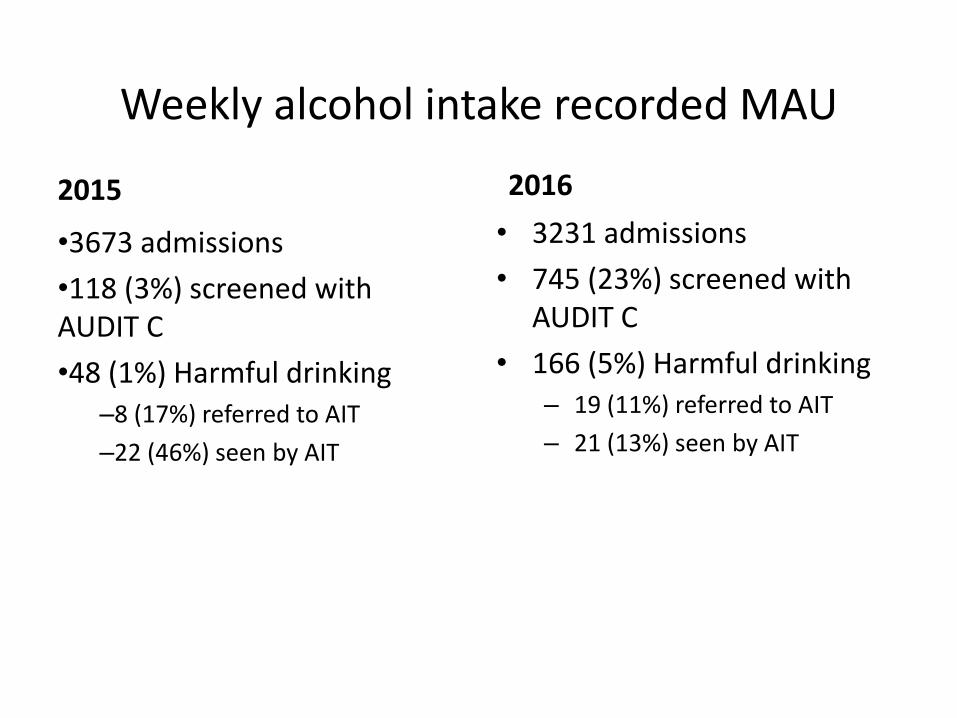
Weekly alcohol intake recorded MAU
2015
•3673 admissions
•118 (3%) screened with AUDIT C
•48 (1%) Harmful drinking –8 (17%) referred to AIT
–22 (46%) seen by AIT
2016
• 3231 admissions
• 745 (23%) screened with AUDIT C
• 166 (5%) Harmful drinking – 19 (11%) referred to AIT
– 21 (13%) seen by AIT
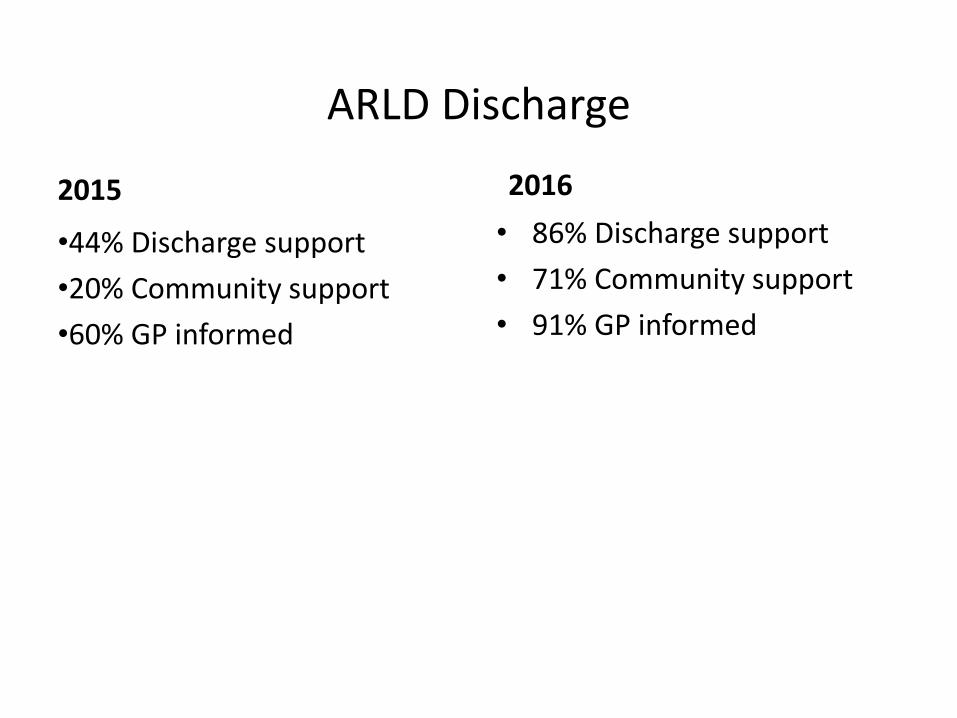
ARLD Discharge
2015
•44% Discharge support
•20% Community support
•60% GP informed
2016
• 86% Discharge support
• 71% Community support
• 91% GP informed
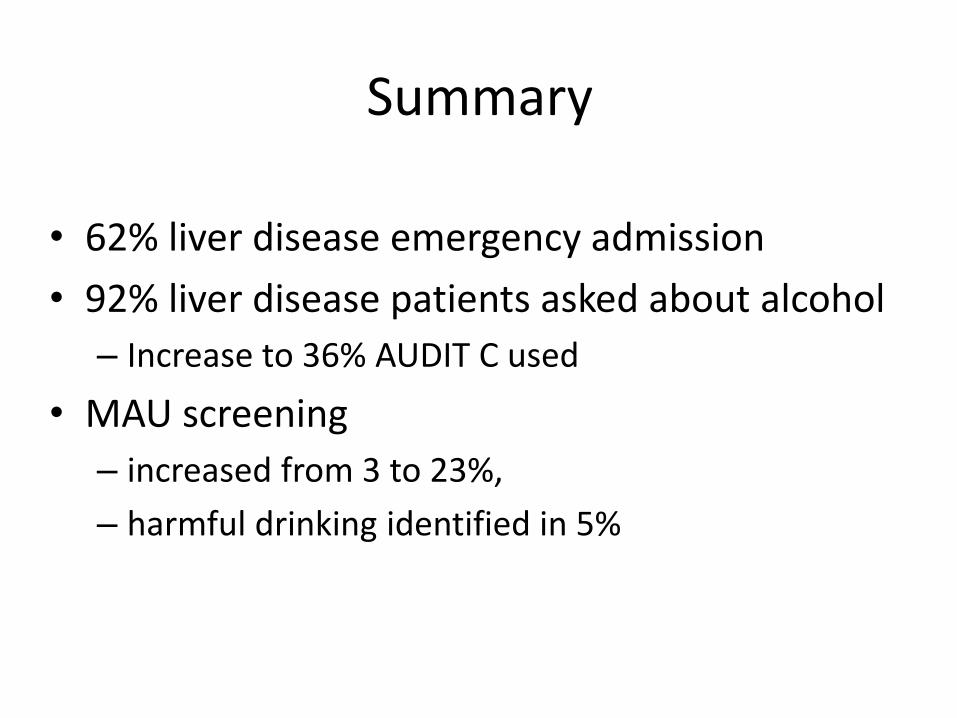
Summary
• 62% liver disease emergency admission
• 92% liver disease patients asked about alcohol
– Increase to 36% AUDIT C used
• MAU screening
– increased from 3 to 23%,
– harmful drinking identified in 5%

Conclusion
• Ongoing trustwide training in:
– AUDIT C for alcohol screening
– Referral for those identified with harmful drinking
• Ongoing audit
• Trustwide pathway

Identifying Patients with ARLD on the Isle of Wight Dr Leonie Grellier Consultant Gastroenterologist

Isle of Wight
• Population 140 500
• Socially deprived rural population – Ryde, Newport, Ventnor
• 24% aged 65 or above
• One acute trust with 246 beds, 22000 admissions/yr
• At least 10000 adults drinking at increased risk levels
• Evidence for significant under age drinking

Current provision for alcohol services
Community treatment –
Butler Gardens 70/yr
GP surgeries
?
Patient self
referral
IRIS community
3WTE band 4/5/6 800/yr
St Mary’s No alcohol
team 1 consultant
Small numbers of patients with MH problems treated in Sevenacres

Headline numbers: Isle of Wight NHS Trust (AHSN data)
• During Jan 2011 – Dec 2015:
– There were 1,652 LD admissions
– There were 535 ARLD admissions (from 272 ARLD patients)
– 36 % of all LD admissions had an alcohol-specific condition recorded
– 92 % of all LD admissions were emergency
– 47% ARLD group died in hospital (39% non ARLD)
* Cost may be under-reported by up to 10%, as some admissions could not be assigned to a HRG tariff 30

Liver Disease/ARLD inpatient journey St Mary’s IOW (2014-2015)
Key Narrative
This visualisation shows the routes of admission for Liver Disease and ARLD through wards at the Trust.
204 patients were admitted to surgical wards
In depth audit of admissions reveals an additional 27% of patients with non ARLD codes have evidence for
ARLD
Method of Admission
Admitting ward
ARLD/non-ARLD
admission
31
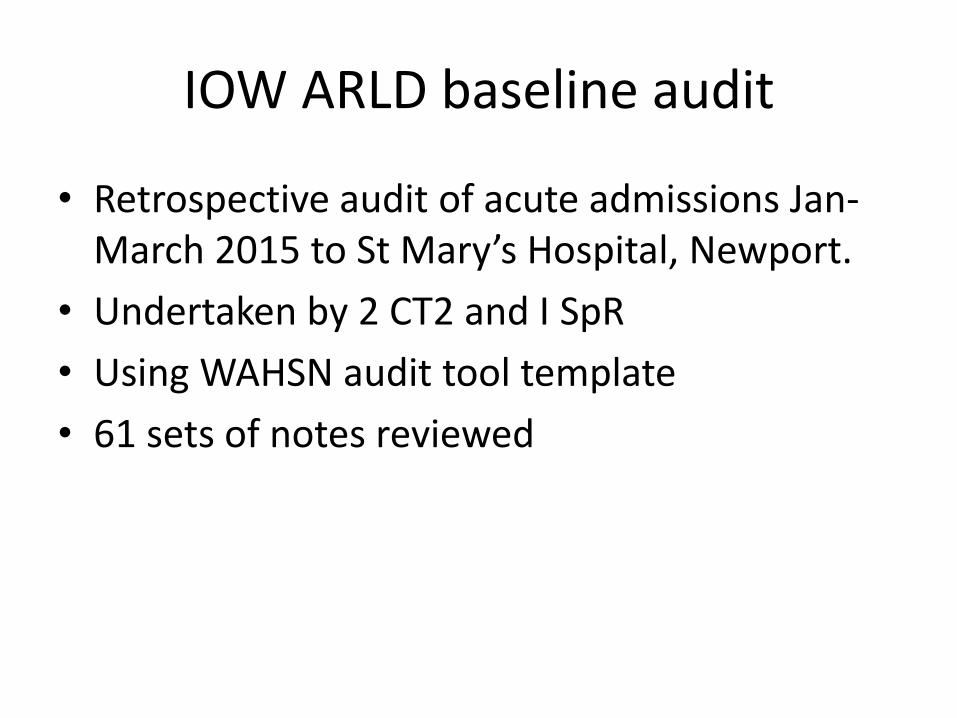
IOW ARLD baseline audit
• Retrospective audit of acute admissions Jan-March 2015 to St Mary’s Hospital, Newport.
• Undertaken by 2 CT2 and I SpR
• Using WAHSN audit tool template
• 61 sets of notes reviewed
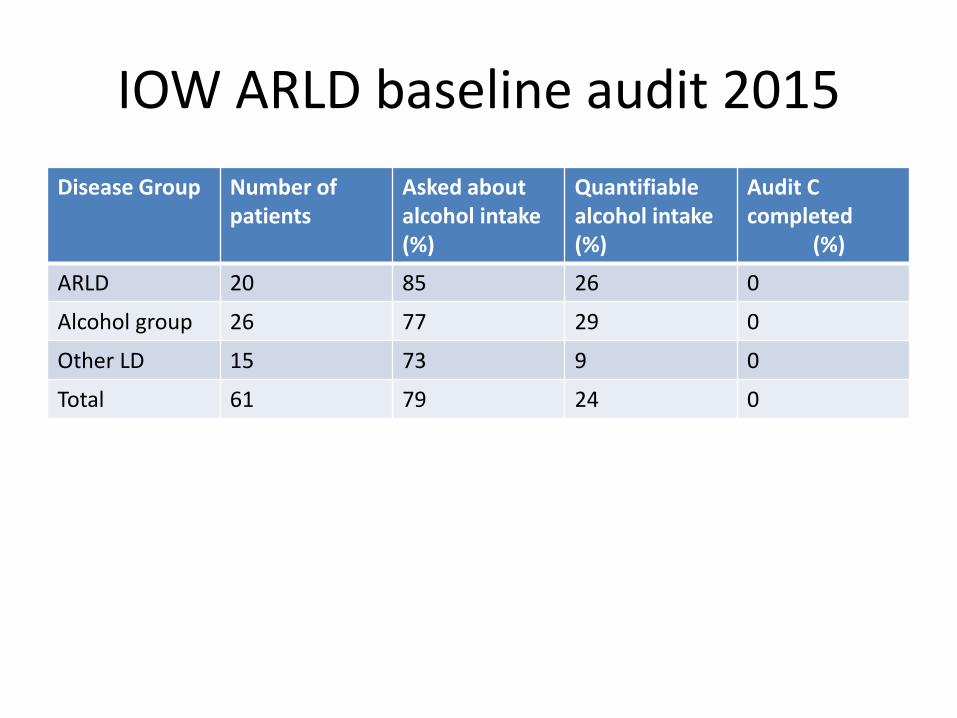
IOW ARLD baseline audit 2015
Disease Group Number of patients
Asked about alcohol intake (%)
Quantifiable alcohol intake (%)
Audit C completed (%)
ARLD 20 85 26 0
Alcohol group 26 77 29 0
Other LD 15 73 9 0
Total 61 79 24 0
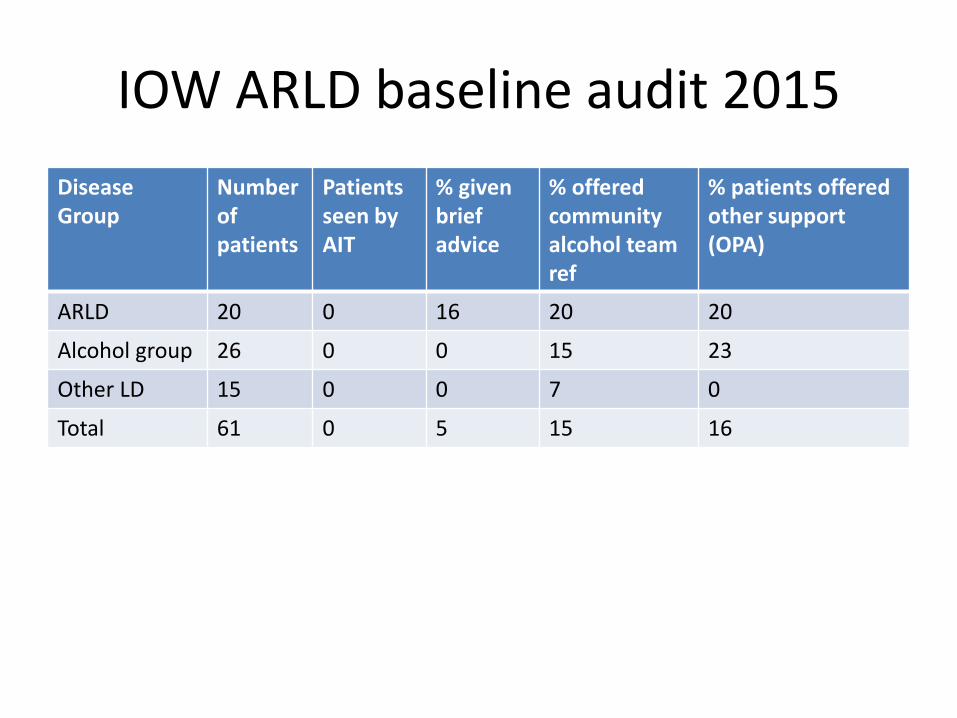
IOW ARLD baseline audit 2015
Disease Group
Number of patients
Patients seen by AIT
% given brief advice
% offered community alcohol team ref
% patients offered other support (OPA)
ARLD 20 0 16 20 20
Alcohol group 26 0 0 15 23
Other LD 15 0 0 7 0
Total 61 0 5 15 16

IOW ARLD baseline audit 2015
• 15 patients coded as ‘other liver disease’
• 5 had direct or indirect evidence of ARLD
• Anecdotal evidence of referral to community services ineffective
‘I can do it on my own’

Moving forward
• September 2016 baseline audit complete
• October – February 2016 – Stakeholder meetings CCG, PH, IRIS, Trust
CEO/MD
– Business case for inpatient team in development
– Training of front line staff in alcohol screening
– Audit of uptake of AUDIT C and CIWA in MAAU
– Presentation of results to ED / development of screening

Moving forward
– Presentation at clinical standards group AUDIT C/ CIWA to adopt as standard screening tools
– Development of research project using community pharmacies to screen and refer (more later)
– Plans for integrated alcohol service presented at JCB CCG 1st February
– Re audit planned Jan- March 2018

Integrated alcohol team
Community treatment clinics nurse/consultant
Pharmacies
Universal screening
GP surgeries
Universal screening
Patient self
referral
IRIS Team manager
–band 6/7 2WTE band 4/5 2WTE band 4/5
St Mary’s 2 WTE band 6/7
Admin 0.5 1WTE band 4,
Consultant 1 PA (Pharmacy) technicians)
Nurses work between locations to provide 7/7 daytime service
Barriers to Improvement
• Start up costs of hospital and community teams

Recommended