- 1 -
University of Naples “Federico II”
School of Mathematics, Physics and Natural Sciences
PhD in Chemical Sciences
cycle XXIII
(2007-2010)
INTEGRATED
COMPUTATIONAL/EXPERIMENTAL
APPROACHES TO THE STUDY OF THE
OXIDATIVE CHEMISTRY OF PHENOLIC
SYSTEMS
Dr. Marianna Arzillo
Supervisor Assessor
Prof. Orlando Crescenzi Prof. Marco d‟Ischia
PhD coordinator
Prof. Lucio Previtera

- 2 -
Università degli studi di Napoli “Federico II”
Facoltà di Scienze Matematiche Fisiche e Naturali
Dottorato di Ricerca in Scienze Chimiche
XXIII ciclo
(2007-2010)
APPROCCI INTEGRATI
COMPUTAZIONALI/SPERIMENTALI PER
LO STUDIO DELLA CHIMICA
OSSIDATIVA DI SISTEMI FENOLICI
Dott.ssa Marianna Arzillo
Tutore Relatore
Prof. Orlando Crescenzi Prof. Marco d‟Ischia
Coordinatore
Prof. Lucio Previtera

- 3 -
INDEX
GENERAL INTRODUCTION 6
INTRODUCTION TO COMPUTATIONAL METHODS 15
CHAPTER I: “Oxidative chemistry of the 2,7‟-biindolyl ” 23
INTRODUCTION 23
RESULTS AND DISCUSSION 25
CONCLUSIONS 41
CHAPTER II: “Structural effect on the electronic absorption properties
of oligomers of 5,6-dihydroxyindole ” 42
INTRODUCTION 42
RESULTS AND DISCUSSION 45
CONCLUSIONS 58
CHAPTER III: “Reaction behavior of 5,6-dihydroxyindole in
acidic medium” 61
INTRODUCTION 61
RESULTS AND DISCUSSION 62
CONCLUSIONS 83
CHAPTER IV: “Oxidative chemistry of 5,6-dihydroxy-1-methylindoles” 84
INTRODUCTION 84
RESULTS AND DISCUSSION 86
CONCLUSIONS 103
CHAPTER V: “Oxidative polymerization of 5,6-dihydroxyindole
in phosphate buffer/polyvinyl alcohol (PVA)” 105
INTRODUCTION 105
RESULTS AND DISCUSSION 109
CONCLUSIONS 117
CHAPTER VI: “Study of oxidative polymerization of 5,6-dihydroxyndole
by Dinamic Light Scattering (DLS) and Small-angle
Neutron Scattering (SANS)” 118
INTRODUCTION 118
INTRODUCTION TO LIGHT SCATTERING 119
DYNAMIC LIGHT SCATTERING (DLS) 123
SMALL ANGLE NEUTRON SCATTERING (SANS) 125

- 4 -
RESULTS AND DISCUSSION 127
CONCLUSIONS 133
CHAPTER VII: “Computational investigation of the stability of DHI-related
catechols, radicals, and quinonoid forms” 134
INTRODUCTION 134
RESULTS AND DISCUSSION 137
CONCLUSIONS 152
CHAPTER VIII: “ Other studies” 153
INTRODUCTION 153
RESULTS AND DISCUSSION 155
CONCLUSIONS 170
EXPERIMENTAL AND COMPUTATIONAL METHODS 171
1. Study of oxidative chemistry of the 2,7‟-biindolyl (4) 171
1.1 Material and strumenttion 171
2.1 Oxidation of 4: Isolation of tetramers 9-11 172
2. Structural effect on the electronic absorption
properties of oligomers of 5,6-dihydroxyindole (1) 176
2.1 Material and strumentation 176
2.2 Absorption measurements 176
2.3 Computational methods 177
3. Reaction behavior of 5,6-dihydroxyindole (1) in acidic medium 178
3.1 Materials and strumentation 178
3.2 Reaction of 1 in acidic medium. General procedure 179
3.3 Isolation of pentaacetyl derivative of 5,6-dihydroxy-2
(5,6-dihydroxyindol-3- yl) indoline (12) and heptaacetyl derivative of
2-(2-amino-4,5-dihydroxyfenyl)-1,1-bis(5,6-dihyidroxyindol-3-yl)ethane
(13) 180
3.4 Isolation of 2-(2-Acetamido-4,5-diacetoxybenzyl)-6,7-diacetoxy-3-
(5,6-diacetoxyindol-3-yl)quinoline (14b) 181
3.5 Reactions of 14b with anions 182
4. Oxidative chemistry of 5,6-dihydroxy-1-metyl-indoles 183
4.1 Materials and strumentation 183
4.2 Isolation of 19 and 20 acetylated 184
4.3 Isolation of 21-acetylated 185

- 5 -
4.4 Computational methods 186
5. Oxidative polymerization of 5,6-dihydroxyindole (1) in phosphate
buffer/polyvinyl alcohol (PVA) 187
5.1 Materials and strumentation 187
5.2 Oxidation of 1 for recording absorption spectra 188
5.3 Oxidation of 1 for products analysis 188
6. Study of oxidative polymerization of 5,6-dihydroxyindole (1)
by Dinamic Light Scattering (DLS) and Small-angle Neutron
Scattering (SANS) 189
6.1 Materials and strumentation 189
6.2 Preparation of the samples 190
7. Computational investigation of the stability of DHI-related catechols,
radicals, and quinonoid forms 191
7.1 Computational mehods 191
8. Other studies: Study of the chemistry of nitrated lipids 192
8.1 Experimental methods 192
8.2 Computational mehods 192
REFERENCES 193
LIST OF PUBLICATIONS 202
- 6 -
GENERAL INTRODUCTION
Mono- and polyphenolic compounds represent a very large group of natural
products with different structural and functional roles. Phenolic groups, and in particular
catecholic groups, establish a strong tendency to autoxidation and enzymatic oxidation;
these processes are accompanied by the formation of reactive radicals and quinones,
which usually tend to evolve further with formation of complex polymeric materials.
5,6-Dihydroxyindoles are a unique group of catechol-containing heterocyclic
compounds, which arise biogenetically by the oxidative cyclization of catecholamines
and related tyrosine-derived metabolites. The parent member of the series, 5,6-
dihydroxyindole (DHI, 1), is of great biological interest because of its central role in the
biosynthesis of eumelanins, the major determinants of human skin, hair, and eye
pigmentation.1,2
The biosynthesis of eumelanins takes place in specialized cells, the melanocytes,
via the tyrosinase-catalyzed conversion of tyrosine to 1 and 5,6-dihydroxyindole-2-
carboxylic acid (DHICA, 2) through a sequence of spontaneous or enzymatically
catalyzed reactions.3 Once formed, DHI and/or DHICA take part in a complex oxidative
polymerization process that leads to the deposition of the black eumelanin pigments
(Scheme 1).1,2

- 7 -
OHNH
2
COOH
NH
OH
OH
COOH
NH
O
O
COOH
NH
OH
OH
NH
OH
OH
COOHNH
O
O
COOH
NH
O
O
O
ONH
2
COOH
Dopaquinone Leucodopahcrome
Dopachrome
1
2 5,6-indolequinone-2-carboxylic acid
EUMELANIN
Tyrosine
5,6-indolequinone
Scheme 1. Scheme of the early stages of biosynthesis of eumelanins.
The unique status of eumelanins among natural pigments is due to their socio-
economic and biomedical relevance, encompassing racial pigmentation, skin
photoprotection, sun tanning and pigmentary disordes such as albinism, vitiligo and
melanoma.4 Moreover, they display a quite unusual set of physico-chemical properties
5
including insolubility in all solvents, broadband monotonic absorption in the UV-visible
range,6 a persistent free radical character,
7 metal and drug-binding properties,
8-10
susceptibility to redox changes,11
strong excited state-phonon coupling,12
and
amorphous electrical switch behavior.13
These properties have provided a basis to
propose the potential application of eumelanin-related materials in the field of
molecular electronics and photon harvesting systems14
.
Despite many decades of work within the organic chemistry, biophysics and
pigment cell communities, eumelanin structure remains virtually unknown, because of
the marked chemical heterogeneity and the lack of well defined physico-chemical
properties, preventing successful application of spectroscopic techniques.

- 8 -
While there is general agreement that at the primary level eumelanins are made
up of 5,6-dihydroxyindole units at various degrees of oxidation and linked together in a
covalent fashion, at the secondary level the situation is far less clear. According to an
early view, eumelanins are highly heterogeneous linear polymers arising by random
coupling of the monomer indole units.
According to a model proposed in the 90s15c
eumelanins are represented as a
set of oligomers consisting of 5 to 7 units of 5,6-indolquinone arranged in a planar
fashion to form 3-4 layers stacked with a distance of 3.4 Ǻ (Figure 1).
Figure 1. Eumelanins structural model proposed by Cheng et al.15c
Subsequently, this model was extended on the basis of data obtained from X-ray
scattering and scanning tunneling microscopy, suggesting that eumelanins consist of
supramolecular aggregates of 4-6 oligomers stacked in the z-plane in a graphene-like
fashion (Figure 2).16
In eumelanin from Sepia ink, a sequence of aggregation steps has been suggested
to account for the apparent three levels of structural organization.16,17,18
To sum up
numerous studies using atomic force microscopy (AFM),16,17,19
X-ray diffraction,20
mass-spectrometry,21
NMR spectroscopy,22
and advanced quantum chemical
calculations23-25
have addressed the eumelanin structure, and though most of them
appear to support the stacked-aggregate picture (Figure 3), definitive proof this model
remains however elusive.

- 9 -
In most cases, however, hypothetical structural models have been used as a
working basis to fit experimental data, because of the lack of knowledge of the
mechanisms of oxidative polymerization of 1 and its congeners.
Figure 2. Structural model of eumelanins (Clancy and Simon, 2001).16b

- 10 -
Figure 3. The hierarchical aggregate structure proposed for Sepia
eumelanin.16,17,18

- 11 -
Extensive studies carried out over the past two decades have elucidated the early
stages of the oxidation of 1 leading to dimers 3-5 and trimers 6 and 7 as the main
isolable oligomers.26
These structures underscored a dominant mode of coupling of 1
involving nucleophilic attack through the 2-position to the 4- and 7-positions of a
transient 5,6-indolequinone. Symmetric 2,2‟-coupling leading to dimer 5, on the other
hand, prevails in the presence of transition metal ions, e.g. Zn
2+ and Ni
2+, and is
probably dictated by formation of chelate complexes affecting the positional reactivity
of 1 or its quinone27
. The reactivity patterns of 1 exemplified by 3-7 (Scheme 2) have
provided a convincing ground to postulate that the higher oligomer structures ultimately
involved in the supramolecular aggregation processes are generated by sequential
oxidative coupling of 1 through the 2-, 4- and 7-positions. This mechanism, however,
has remained so far unverified because, as the size of the oligomers increases, their
isolation becomes increasingly complex, due to the gradational range of species of
increasing mass which typify the oxidation mixtures of 1, and the consequent need to
contend with very complex mixtures containing myriads of species.
In summary, while several aspects of the chemistry of 5,6-dihydroxyindoles
have been reasonably well clarified, it is also clear that many more remain to be
addressed.

- 12 -
NH
OH
OH
NH
OH OH NH
OHOH
NH
OH
OH
NH
OH
OH NH
OH
OHNH
OH
OH
NH
OH
OH
NH
OH OH
NH
OH
OH
NH
OH
OH
NH
OHOH
NH
OH
OH
7
1
43
metal cations
6
[O]
[O]
5
Scheme 2. Oligomers obtained by oxidation of 1 in biomimetic conditions.

- 13 -
An important support to experimental studies in this field can be provided by
computational techniques. A schematic and by no means exhaustive list of contexts in
which modeling approaches may prove helpful includes:
Providing structural confirmation for spectroscopically detected species
(e.g. unstable reaction intermediates), based on the agreement between measured
spectra and theoretically computed parameters;
Evaluating the thermodynamic and kinetic plausibility of reaction
mechanisms (typically postulated on the basis of experimental evidences);
Inspiring the setup of new experimental measurements.
In the present thesis, the chemistry of 5,6-dihydroxyindole has been investigated
by combining and integrating the information provided by computational and
experimental methodologies. This approach has proved useful to address and settle
many open issues concerning the mechanisms of oxidative polymerization of 5,6-
dihydroxyindoles and the basic features of eumelanin builiding blocks.
Main topics described herein include:
1. Oxidative chemistry of the 2,7‟-biindolyl (4); this study led inter alia to
the isolation of three new tetramers of 1
2. Structural effects on the electronic absorption properties of oligomers of 1,
analyzed by an integrated experimental-DFT approach
3. Reacation behavior of 1 in acidic medium; rather unexpectedly, this led to
the isolation of a trimer with selective binding properties toward
fluoride anion
4. Oxidative chemistry of 5,6-dihydroxy-1-metylindoles; this study led to
the isolation of the first 5,6-dihydroxyindole macrocycle (alongside a
tetramer)
5. Oxidative behavior of 1 in phosphate buffer/polyvinyl alcohol mixtures;
the results obtained have led to the formulation of a new model for
visible chromophore development in synthetic eumelanin polymers

- 14 -
6. Study of oxidative polymerization of 1 by Dinamic Light
Scattering (DLS) and Small-angle Neutron Scattering (SANS) in
collaboration with the group of Prof. Paduano of University of Naples
“Federico II”
7. Computational investigation of the stability of DHI-related catechols,
radicals, and quinonoid forms.
Moreover, during the course of my PhD, I collaborated in a project on the
chemistry of nitrated lipids, performing the computational work.
These topics will be discussed individually in the following chapters.

- 15 -
INTRODUTION TO COMPUTATIONAL METHODS
Computational chemistry approaches are categorized in terms of the underlying
“model chemistries”. Each model chemistry consists in a specific combinations of a
theoretical method with a basis set, and essentially represents a different approximation
to the Schrödinger equation. Taking into account the Born-Oppenheimer
approximation28
, this latter can be written as:
elel EH (1)
where and Eel are wavefunction and energy of the electronic ground state, and Hel is
the electronic Hamiltonian operator.
Basically all of the computational work presented in this thesis relies on methods
rooted in the Density Functional Theory (DFT).
According to equation 1, the energy can be written as
HE (2)
The formula highlights the functional relation (correspondence between a
function and a number) which connects ψ to E. In DFT, the multi-electronic
wavefunction ψ(r1,r2,...,rN) is replaced by the electronic density ψ(x,y,z), a function of
only three variables. The Hohenberg-Kohn theorem,29a
that forms the basis of DFT,
demonstrates the existence of a unique functional which determines the ground state
energy and density exactly; however, it does not provide the form of this functional.
Afterwards Kohn e Sham29b
formalized the DFT in terms of mono-electronic
Schrödinger equation:
iiKSV
2
2
1 (3)
here, VKS is a local mono-electronic potential, and the resulting orbitals are termed
Kohn-Sham (KS) orbitals. The total density is linked to the KS orbitals by the relation:
2
i
iif (4)

- 16 -
where fi are the molecular orbital expansion coefficients.
Furthermore, VKS can be decomposed into several terms:
XCCextKS VVVV (5)
where Vext is an external potential, VC is a Coloumb term, and VXC, the exchange-
correlation term, includes whatever portion of the electron-electron interactions is not
contained in the previous terms.
The energy of a interacting system is:
XCextT E
r
rrrdrdVrdEE
12
212
3
1
33
2
1 (6)
where ET is the kinetic energy, and EXC is related to corresponding potential as:
XCXC
EV (7)
The only system for which the density functional can be established exactly is
the uniform electron gas. Starting for this functional form is possible develop the
simplest approximation applied to real chemical system, the Local Spin Density
Approximation (LSDA): in essence, a term for the correlation between opposite spin
densities ρ and ρ* is added to the uniform electron gas functional.30
Another group of
functionals, dubbed Generalized Gradient Approximation (GGA) and capable of
providing a higher level of accuracy, are obtained by introducing the electron density
gradient in the functional form; this allows to explicitly account for density
inhomogeneities within molecules or isolated atoms. The several GGA functionals
differ for the presence of parameters; these can be provided by empirical optimizations
relying on comparisons with selected experimental data; in alternative, they can be
based on theoretical considerations.31
Among the most effective functionals are those
that include a mixture of Hartree-Fock (HF) and DFT exchange along with DFT
correlation; they are collectively termed hybrid functionals, representative members of
the class being the well-known B3LYP and PBE0.32
In particular, most calculations
performed in this thesis were based on the PBE0 functional, that has been shown to
provide quite satisfactory energies and geometries for a wide range of organic and

- 17 -
biological systems,33-36
as well as a rather accurate description of low-lying excited
states in the context of TD-TFD calculations (see below).37-42
DFT computations are very popular and highly successful, since in many cases
they allow to obtain accurate data (that include electronic correlation) with
computational costs quite comparable to those of a simple HF calculation. Therefore,
DFT usually permits a quantum-mechanical study of large chemical system.43
In order to investigate the effects of electric or magnetic fields on molecules and
extract features like excitation energies, frequency-dependent response properties, and
absorption spectra, time-dependent density functional theory (TD-DFT) can be used.
The foundation of modern TD-DFT was laid by Runge & Gross,44
who derived a
Hohenberg-Kohn-like theorem for the time-dependent Schrödinger equation. The
Runge-Gross theorem proves that there is a one-to-one correspondence between the
external (time-dependent) potential, Vext (r; t), and the electronic density, ρ(r; t), for
many-body systems evolving from a fixed initial state. This is a nontrivial statement,
and implies that, even if the information we have about a system is limited to its
density, we can still obtain all of its properties.
Within rather general assumptions, spectroscopic interactions between radiation
and matter can be modeled by an external perturbation (x) that alters the unperturbed
ground state energy of a molecular system, E(0)
:
... xExxE(x) 210
2
1TEE (8)
The coefficients of this expansion represent features of the molecular system and of its
quantum state. The energy associated with a transition between electronic states of a
molecular system typically falls in the UV-visible range of the electromagnetic
spectrum. To describe the physical situation of spectroscopic transitions, time-
indipendent perturbation theory45
must be replaced by a time-dipendent perturbation
approach. The molecular Hamiltonian in the presence of a time-dependent perturbation
can be written as46
AtFHtHHH 00 (9)

- 18 -
where H0 is the unperturbed Hamiltonian, A is a Hermitian operator describing the type
of perturbation, and F is a function determining its density. The problem is now to
determine the response of some property (described by B) to the perturbation described
by A. If the focus is initially placed on the first-order variation of B (linear response),
application of time-dependent perturbation theory allows to demonstrate46
that the
variation 0BBB at the time t is given by:
t
tdtFttBAKB (10)
where
0
00 0000n
ttitti nn eBnnAeAnnBittBAK )()( (11)
is the time correlation function, and the summation runs over the eigenstates of the
unperturbed Hamiltonian. This function can be transported into the frequency range by
a Fourier transform, giving:
0 000
0000lim
n nn i
BnnA
i
AnnBBA
(12)
This amount is termed Frequency Dependent Polarizabilty (FDP) of B with respect to
Aω at the frequency ω. The FDP (eq. 12) presents real poles in correspondence to the
natural frequencies of the system (the eigenstate energies); thus, computation of these
poles allows to assign the energies of excited electronic states.
TD-DFT represents an application of the approach outlined above, casted in the
frame of the electronic density functional. The DFT cannot be used directly in the form
of eq. 12, since this would require knowledge of all the eigenstates of the system. A
possible solution to this issue comes from an approximated variational expression of
FDP,46
that can be written as:
† AABBAB P (13)
where P(ω) is the response matrix that, for any frequency, describes the linear response
to the temporal variation of the expectation value of B, following the perturbation
associated to operator A. With good approximation, the poles of the response matrix
correspond to the poles of the FDP. The response matrix of a molecular system can be
expressed starting from a set of wavefunctions that approximate the eigenstates of the

- 19 -
system. In TD-DFT, the eigenstates chosen are obtained by allowing single excitations
from an occupied orbital (in the ground state) to a virtual orbital.
In terms of a Kohn-Sham formulation for the ground state, the electronic density
is represented by KS orbitals (eq. 4). From a phenomenological viewpoint, following a
variation v(t) of the external potential, the electronic density undergoes a perturbation
(t) can be stated in terms of the eigenstates corresponding to single excitations.
In the frequency domain, the density change can be written as:
st
tsstP rrrr ,, (14)
where the subscripts s and t run over both occupied and virtual orbitals. It is possible
demonstrate that the elements of the rotation matrix are:
,,, rrrSCF
ts
tsst vv
ffP
(15)
where s and t are the eigenvalues associated to the eigenfunctions s e t, respectively
(eq. 3); vSCF
(r,) indicates the first order variation of all terms of the KS operator that
depend on electronic density:
rrrr
rr
XC
SCF Vdv
,
, (16)
Therefore the general equations for forced oscillations can be written:47
**** v
v
P
P
10
01
AB
BA
(17)
where
rrrrrr
rr
rrrrrr
rr
ddE
ddK
KB
KA
jb
XCia
jbiabjai
jbaibjai
bjaiiaijabbjai
**
**,
,,
,,
2
1 (18)
Subscripts i and j refer to occupied KS orbitals, whereas a and b refer to virtual orbitals;
K is the so-called coupling matrix. Based on this matrix equation it is possible to

- 20 -
compute electronic excitation energies: in practice, these correspond to those values of
ω for which the matrix in square brackets in (eq. 17) has null eigenvalues.
One of the problems in computational work is the simulation of the reaction
environment. Concerning solvation effects, approaches in which the solvent degrees of
freedom are accounted for in an average way, e.g., in terms of a reaction field, have
proven particularly effective. Extensive review of the continuum-based method of
implicit solvation can be found in recent literature.48,49,50
Briefly, the most general
approach to the problem of solvent effects is based on a system-bath decomposition.
The solvation process can then be dissected into the creation of a cavity for the solute
(spending energy Ecav), and the successive switching-on of dispersion-repulsion (with
energy Edis-rep) and electrostatic (with energy Eel) interactions with surrounding solvent
molecules.
The polarizable continuum model (PCM),48,49,51
probably the best known
example of continuum methods, has been adopted in the computational work presented
in this thesis. The model consists of embedding the solute molecule within a cavity
made by the envelope of spheres centreted on the solute atoms. Inside the cavity, the
relative dielectric constant has the same value as in a vacuum (ε = 1), and it steeply goes
to the solvent bulk value outside (e.g., ε = 78.4 for water). The procedures to assign the
atomic radii and to form the cavity have been described in detail together with effective
classical approaches for evaluating Ecav and Edis-rep.48,49,52
The solvent is polarized by the presence of the solute molecule and undergoes a
new equilibration, giving rise to a reaction field that acts back onto the solute molecule.
Such phenomenon is described by the PCM in terms of a pattern of effective charges on
the cavity surface. The simple introduction of the PCM often provides substantial
improvements in energies, geometries and spectroscopic parameters computed for
molecular systems in a variety of solvent media.
The cavity surface is finely subdivided into small tiles (tesserae), and the solvent
reaction field determining the electrostatic contribution (Eel) is described in terms of a
pattern of apparent point charges appearing in tesserae and self-consistently adjusted
with the solute electron density. Within the framework of effective Hamiltonian
schemes, it is possible to write the solute molecular Hamiltonian as perturbed by a
reaction field operator:

- 21 -
surface
RF
RF
drdrrφrrDrφV
VHH
')(),'()'(2
1
0
where H0 is the Hamiltonian of the isolated molecule, φ(r) is the electrostatic potential
on the cavity surface, and D(r′,r) is a function depending on cavity geometry and
solvent dielectric constant. Solvation charges (q) depend, in turn, on the electrostatic
potential (V) on tesserae through a geometrical matrix Q (q = QV), related to the
position and size of the surface tesserae, so that the free energy in solution G can be
written:
G E VNN V QV
here E[] is the free-solute energy, but with the electron density () polarized by the
solvent, and VNN is the repulsion between solute nuclei. The core of the model is then
the definition of the Q matrix, which in the most recent formulations of PCM depends
only on the electrostatic potentials, takes into the proper account the part of the solute
electron density outside the molecular cavity, and allows the treatment of conventional,
isotropic solutions, and anisotropic media like liquid crystals. Starting from these
definitions, very effective linear-scaling algorithms53
have been implemented for cavity
construction and evaluation of energy and of its first and second derivatives with respect
to geometric, electric and magnetic parameters, thus allowing for the inclusion of PCM
contributions in the calculation of optical and magnetic spectroscopic parameters.33,54-56
However, the PCM may also display limitations in some cases, e.g., when highly
specific interactions, like hydrogen bonds, come into play.57
Cluster approaches can
provide a straightforward route to describe localized phenomena, including the
spectroscopic transitions of molecules; once again, the PCM can be brought into play to
account for the “bulk” solvent, and thus to reduce the number of solvent molecules to be
described explicitly.33
In other words, such a discrete-continuum scheme takes into
account both the quantum mechanical nature of specific solute-solvent interaction, i.e.
hydrogen bonds, and the classical Coulomb long-range effects tuned by the dielectric

- 22 -
properties of the solution. The resulting cluster-PCM description represents a very
versatile tool that can be adapted to different structural and spectroscopic situations; of
course, which and how many solvent molecules need to be explicitly described is a
question that has to be defined case by case. Moreover, a single structure of the solute-
solvent cluster or supra-molecular frame could not be representative of a very flexible
situation.40
This means that the structures of the solute and its closest solvent molecules
must be statistically averaged among all the energetically accessible configurations.
Thus, the cluster-PCM approach is also attractive for the computation of
averaging effects brought about by dynamics.

- 23 -
CHAPTER I
Oxidative chemistry of the 2,7’-biindolyl (4)
INTRODUCTION
Structural characterization of high oligomer derived from DHI (1) is essential for
predicting their planarity and, hence, the efficiency of π-electron delocalization and the
possible extent of the π-stacking in the final aggregation process.
Moreover, it would offer a valuable background for the purposeful design of
eumelanin-like materials for potential practical applications.
A strategy to obtain higher oligomers of 1 is the oxidation of the oligomers
previously isolated from the mixture. Thus, for exemple, a straightforward access route
to tetramers is the oxidation of dimers. In a previous study the first tetramer of 1,
5,5‟,5‟‟,5‟‟‟,6,6‟,6‟‟,6‟‟‟-octahydroxy-2,4‟:2‟,3‟‟:2‟‟,4‟‟‟-tetraindolyl (8), was obtained
as the acetyl derivative by oxidation of the 2,4‟-biindolyl 358
(Scheme 3). Structure 8
featured an “anomalous” 2,3‟-biindolyl linkage which was unprecedented in 5,6-
dihydroxyindole chemistry, and that was suggested to reflect nucleophilic attack of 3 to
an extended quinone methide intermediate.59
Whether this peculiar mode of coupling
denoted a general modification of the 5,6-dihydroxyindole reactivity pattern in dimers
and higher oligomers was an important issue raised by that study. It seemed therefore
important to extend the study to the oxidation of another dimer, the 2,7‟-biindolyl (4)
in order to increase knowledge of the reaction behavior of dimer intermediates and gain
further insights into higher oligomers. In this chapter, I report the structures of three
new tetramers of 1 obtained by oxidation of the biindolyl 4 and a discussion of how the
emerging pathways of dimer oxidation fit with currently accepted schemes of oxidative
polymerization of 1.

- 24 -
NH
OH
OH
NH
OH OH
NH
OH
OH
NH
NH
NH
OH OH
OH OH
OH
OH
24'
2'
3"2"
4'"
13
4
56
7
89
3
[O]
3
8
Scheme 3. Oxidative conversion of 3 to 5,5’,5’’,5’’’,6,6’,6’’,6’’’-
octahydroxy-2,4’:2’,3’’:2’’,4’’’-tetraindole (8).

- 25 -
RESULTS AND DISCUSSION
The oxidation of 4 was carried out as described,58
using the peroxidase/H2O2
system. The dimer, stored as the acetyl derivative, was deprotected by an established
methodology involving treatment with 0.1 M phosphate buffer, pH 12 for 1-2 min under
an Ar atmosphere, to prevent aerobic oxidation of the deacetylated dimer by air.
Eventually, the pH was brought to 8, to ensure sufficient solubility of the dimer at
1 mM concentration.
A critical parameter affecting product composition and yields was the reaction
time, with too short times resulting in much unreacted substrate and prolonged
oxidation times leading to abundant eumelanin-like materials with little isolable
oligomers. Accordingly, after several trials, a reaction time of 20s was adopted for all
experiments. The purple-blue reaction mixture thus obtained was treated with excess
sodium dithionite, and the clear ethyl acetate-extractable fraction was acetylated to
ensure stability and improve chromatographic behavior of the products. TLC analysis
(CHCl3:CH3OH=98:2) of the resulting mixture indicated little residual 4 and a number
of chromatographically distinct fluorescent products, two of which could be isolated by
repeated TLC and HPLC fractionation and were characterized by extensive spectral
analysis, including 1H,
1H COSY,
1H,
13C HSQC,
1H,
13C HMBC and ROESY spectra.
The product at Rf = 0.42 gave a pseudomolecular ion peak in the ESI(+)-MS
spectrum at m/z 949 [M+Na]+, indicating a tetramer of 1 and was formulated as the
symmetric 5,5‟,5‟‟,5‟‟‟,6,6‟,6‟‟,6‟‟‟-octahidroxy-7,2‟:3‟,3‟‟:2‟‟,7‟‟‟-tetraindole (9)
acetylated in which the 2,7‟-biindolyl units were linked through a 3,3‟-bond.
The 1H NMR spectrum of 9 acetylated (Figure 4) exhibited five signals in the
aromatic region at 6.02, 6.94, 6.95, 7.34 and 7.49. Of the two NH protons, only that at
9.02 gave cross peaks in the 1H,
1H COSY spectrum with protons resonating at 6.95
(H-2) and 6.02 (H-3), while the N-H resonance at 10.54 did not show apparent
correlation peaks (Figure 5).

- 26 -
Figure 4. 1H NMR spectrum of 9 acetylated.
The ROESY spectrum (Figure 6) revealed a distinct NOE contact between the H-7
proton at 7.34, and the N-H proton resonating at 10.54, allowing definitive
assignment of this resonance to the disubstituted indole moiety, and between the two
N-H protons, suggesting that they are in close proximity in the most populated
conformations. It is also worth noting that a number of protons, i.e. H-3a (δ 6.02), H-
4a (δ 6.94), H-2a (δ 6.95) and N-Ha (δ 9.02) resonate significantly upfield relative to
dimer 4, indicating that the outer ring a/a‟ falls in the shielding cone of the inner ring
b/ b‟. Figure 7 shows the structure of 9 acetylated with assignment of the proton and
carbon resonances.

- 27 -
Figure 5. 1H, 1H COSY spectrum of 9 acetylated.

- 28 -
Figure 6. ROESY spectrum of 9 acetylated.

- 29 -
NH
OH
OH
OH
HN
OH
OH
OHNH
OH
NH
HO
H
H
H
H
H
H
H
H
H
9.02
6.95
6.02
6.94
128.5
101.6
114.9
135.1136.1
110.1
133.8125.1
10.54
7.49
7.34
133.8
101.1114.1
137.5
139.6
106.7133.8
125.6
ab
b'a'
Figure 7. Structure of 9-acetylated with proton (regular style) and carbon
(italic style) resonances
The product eluted under the band at Rf = 0.27 was identified as another
symmetric tetramer, with pseudomolecular ion peak at m/z 949 [M+Na]+ in the
ESI(+)-MS and five aromatic proton resonances and four acetyl signals in the 1H-NMR
spectrum (Figure 8). Closer spectral analysis eventually allowed its formulation as
5,5‟,5‟‟,5‟‟‟,6,6‟,6‟‟,6‟‟‟-octaidroxy-2,7‟:4‟,4‟‟:7‟‟,2‟‟‟-tetraindolyl (10) acetylated
featuring a 4,4‟-linkage between the inner units. The 1H-NMR spectrum displayed
typical resonances for two H-3 protons and one H-2, H-4 and H-7 protons. The 1H,
1H
COSY spectrum (Figure 9) indicated coupling of the NHb proton resonating at 10.71
with the signals at 7.39 (H-2b) and 6.16 (H-3b), and coupling of the NHa ( 10.78)
with the resonance at 6.84, attributed to the H-3a proton.

- 30 -
Figure 8. 1H NMR spectrum of 10 acetylated.
The ROESY spectrum (Figure 10) showed moreover cross-peaks between H-
3a and H-4a, H-7a and NHa, and H-3a and NHb allowing complete assignment of all
resonances. The marked upfield shift of the H-3b proton (δ 6.16) is attributable to the
diamagnetic anisotropy of the adjacent indole ring. In Figure 11 is represented the
structure of 10 acetylated with assignment of proton and carbon resonances.

- 31 -
Figure 9. 1H, 1H COSY spectrum of 10 acetylated.

- 32 -
Figure 10. ROESY spectrum of 10 acetylated.

- 33 -
OH
OH NH
OH
HN
OH
OH
NH
OH
OH
OHNH
H
H
H
H
H
H
H
H H
H
10.78
6.847.44
7.40
132.4
103.8114.3
137.7
139.9
106.5134.9
126.7
10.71
7.39
6.16127.0 103.9
121.4
138.0139.5
111.8
134.9 126.8
a b b' a'
Figure 11. Structure of 10 acetylated with proton (regular style) and
carbon (italic style) resonances.
The results so far described are a significant achievement when considered in the
light of the notorious difficulties in isolating higher oligomers of 1.
Unfortunately, attempts to isolate other oxidation products of 4 were unsuccessful
due to the marked complexity of the reaction mixture and the very low formation yields
of the products. During the recent investigation of the oxidation chemistry of 358
it was
found that transition metal cations, particularly Zn2+
and Ni2+
ions directed the reaction
course towards the formation of a more defined pattern of products, allowing the
isolation of tetramer 8 in sufficient yields for structural characterization. It seemed
therefore of interest to extend the study of the role of transition metal cations to the
oxidative coupling of 4.
A preliminary screening of the effect of various divalent cations showed that Zn2+
ions could lead to a simpler reaction mixture. Accordingly, the oxidation of 4 (1 mM)
was repeated in the presence of 3 mM Zn2+
in 0.5 M TRIS buffer, pH 8, using
peroxidase/H2O2, the latter at 4.9 mM concentration.
TLC fractionation after the usual work up revealed two main products, one of
which proved to be chromatographically and spectrally indistinguishable from 9
acetylated, while the other was a new tetramer which was present in much lesser
amounts in the reaction mixture obtained under metal-free conditions, as evident from
TLC and HPLC analysis.

- 34 -
On the basis of a pseudomolecular ion peak at m/z 949 [M+Na]+ (ESI(+)-MS) and
extensive 2D NMR analysis, the new product (Rf = 0.20, CHCl3:CH3OH=98:2, isolated
yield 5%) was eventually assigned the structure of the asymmetric tetramer
5,5‟,5‟‟,5‟‟‟,6,6‟,6‟‟,6‟‟‟-octaaidroxy-2,7‟:2‟,3‟‟:2‟‟,7‟‟‟-tetraindole (11) acetylated.
The 1H-NMR spectrum (Figure 12) exhibited ten resonances in the aromatic
proton region, with only one H-2-type proton ( 7.18), showing coupling with the H-3
( 6.47) and NH ( 10.39) protons on the same terminal unit, designated d in the
structural formula.
Figure 12. 1H NMR of 11 acetylated.

- 35 -
The 1H,
1H COSY spectrum (Figure 13) allowed unambiguous assignment of the four
NH protons and the three H-3 protons to each of the remaining units, designated a, b
and c.
Figure 13. 1H, 1H COSY spectrum of 11 acetylated.

- 36 -
Distinct cross-peaks were observed in the ROESY spectrum (Figure 14) between the
following resonances: H-3b ( 6.84) and H-4b ( 7.81); H-3d ( 6.47) and H-2d ( 7.18)
and H-4d ( 7.64); H-7a ( 7.30) and NHa ( 10.18); H-7c ( 7.43) and NHc ( 10.97).
This data, coupled with 1H,
13C HMBC correlations, allowed straightforward assignment
of all protons and carbons to the relevant units (Figure 15), and provided conclusive
evidence for the 2,3‟-mode of coupling of the dimer.
Figure 14. ROESY spectrum of 11 acetylated.

- 37 -
OH NH
OH
OHOH
NH
OH
OH NH
OH
NH
OH
H
H
H
H
H
H
H
H
H
H
a b
c d
10.18
5.967.44
7.30 9.26 6.84
7.81
10.97
7.35
7.43
10.39
7.18
6.47
7.64
135.2*
102.8
114.2
137.3
139.2
106.1
126.3
134.7
134.5*100.5
113.9
137.3139.9
105.8
134.7 127.0
133.3*
108.4113.4
137.3
139.6
106.6134.7
124.6
127.7
102.6
116.0
137.3137.8
107.4
134.7 127.7
* interchangeble
Figure 15. Structure of 11 acetylated with proton (regular style) and
carbon (italic style) resonances.
Structures 9-11, along with the previously isolated tetramer 8, allowed an
unprecedented insight into oligomers of 1 past the trimer stage. For all isolated
tetramers markedly non planar structures would be anticipated, due to the presence of
sterically congested 2,3‟-disubstituted indole units in 9 and 11, or the 4,4‟-linkage with
a high torsional barrier in 10.60
The novel bonding modes that derive from the
dimer-dimer coupling pathways would accommodate a much greater degree of
structural complexity and a broader variety of molecular shapes for higher oligomers
than previously believed, supporting the chemical disorder model (but not a true
statistical randomness) for the secondary level structures of eumelanins.61
Clearly, only
a few tetramers have been isolated in small amounts; therefore, other oligomerization
pathways and coupling mechanisms are possible.62
The workup procedure used, based
on ethyl acetate extraction, ensured a virtually quantitative recovery of the low

- 38 -
molecular weight oligomers. This was checked in each experiment after ethyl acetate
extraction by subjecting to acetylation the residual insoluble fraction of the mixture,
with no further isolable species. Accordingly, it can confidently be argued that the
workup procedure does not inherently favor linear oligomers over other possible
species, e.g., extended aromatic oligomers or bi-coupled species. These latter, if present
in sufficient amounts, should not have escaped isolation, as shown in previous studies
demonstrating that planar diindolocarbazole cyclotrimers obtained from 1 are easily
isolated by the same workup. Nonetheless, a note of caution about the actual
significance of the isolated oligomers is in order until a more complete picture of the
oligomerization process and product patterns is available.
Mechanistically, formation of tetramers 8-11 discloses different patterns of
reactivity of the 5,6-dihydroxyindole system when framed into the dimeric scaffolds 3
and 4. Oxidation of 3 has recently been shown to proceed via a quinone intermediate
featuring a planar extended quinone methide structure with an interring double bond.59
A similar intermediate, 4-quinone, may be involved in the oxidative coupling of 4
leading to 9-11 (Scheme 4). DFT calculations on 4-quinone indicated a planar structure
with a high LUMO coefficient on the 3-position of the 2-substituted indole unit,59
suggesting that such position may display electrophilic reactivity and may be attacked
by 4 in a frontier orbital-controlled fashion leading to tetramers 9 and 11. Whereas
formation of 11 would thus resemble the previously described formation of 8,58
in the
symmetric tetramer 9 the 3-position would serve both as electrophilic site in 4-quinone
and as nucleophilic site in the reduced counterpart 4.
Tetramer 10 may arise by an alternate reaction mode of 4 and its quinone via the
4-positions, but the factors underlying this regiochemistry are less clear (Scheme 4). It
may be worth noting that the LUMO of 4-quinone bears a modest coefficient at the
reactive 4-position,59
but whether this has any role remains to be determined.

- 39 -
O
NH
O
H
NH
OOH
NH
OHOH
NH
OH
OH
OH NH
OHOHOH
NH
OH
OH NH
OH
NH
OH
a b
c d
NH
OH
OH
OH
HN
OH
OH
OHNH
OH
NH
HO
OH
OH NH
OH
HN
OH
OH
NH
OHOH
OHNH
4
4-quinone
[O]I
IIIII
I
II
III
10
11
ab
a' b'
9
a b a'b'
Scheme 4. Proposed mechanism of formation of tetramers 9-11.
The ability of Zn2+
to favor formation of 11 (route III) over 10 probably reflects
an enhanced nucleophilic reactivity at the 2-position of the 7-substituted unit of 4. This
effect is analogous to that observed in the case of dimer 3 and would be the
consequence of the partial ionization of the OH group at C6 following chelate
formation. It should be emphasized that the role of the metal is only to direct more
dimer towards route III, since the same route is operative also under metal-free
conditions, albeit to a lesser extent.
An alternative mechanism for 11 based on nucleophilic attack of 4 through the 3-
position to the free 2-position of 4-quinone would be ruled out on the basis of the
negligible LUMO coefficient at the 2-position.59
Tetramers 8-11 offer hints for an improved mechanistic view of the oxidative
polymerization of 1, in which the gradational sequence of oligomeric indole units would

- 40 -
be populated at the tetramer level both by species arising by attack of trimers to 1
quinone, likely via 2,4‟-and 2,7‟-linkages, and by species derived from oxidative
coupling of 3 and 4 via 2,3‟-, 3,3‟- and 4,4‟-linkages. The relative involvement of the
oligomer-monomer versus the oligomer-oligomer coupling pathways would depend on
several factors, including the rate of substrate oxidation and the extent of the reaction,
since it is likely that the dimer coupling route becomes especially significant in the later
phases of the process when most of the monomer has been consumed and sufficient
amounts of dimers begin to accumulate. The tetramer construction process via dimer-
dimer coupling offers significant opportunities to engineer the structures of 5,6-
dihydroxyindole oligomers beyond the limits explored to-date and might allow the
design and preparation of innovative bioinspired polyindole-based materials for various
applications.14
An important point raised by this study concerns the relevance to eumelanin
structure and properties. It is known that, in addition to 1, 5,6-dihydroxyindole-2-
carboxylic acid (2) also plays an important role in melanogenesis.2-5
The presence of the
carboxylic group dramatically affects the reactivity and oxidative coupling patterns of
the 5,6-dihydroxyindole system, hindering reactivity at the 3-position. Indeed, an array
of tetramers of the 2-carboxylic acid have been described in a previous paper,60
which
exhibit only 4,4‟-, 7,7‟-, and 4,7‟-inter-unit bonds, implying atropisomerism, at least in
their reduced forms. It will be of interest, and an important goal for future studies, to
investigate how the different coupling behaviors of the indole monomers and their
oligomers affect the geometry/planarity of eumelanin building blocks, both in their
reduced and oxidized states, and concur to determine the final properties of natural
eumelanins also in terms of chemical disorder.

- 41 -
CONCLUSIONS
In this chapter I have reported the results of a study on the oxidative
polymerization of the 2,7‟-biindole 4 leading to the isolation and structural
characterization of three new tetramers of 1. This study represents an important step
forward toward an improved model of eumelanin structure. One important outcome is
the recognition of the potential role of dimer coupling as an alternative to the trimer-
monomer reaction in the mechanisms of tetramer formation. This issue has been
overlooked in traditional models of 5,6-dihydroxyindole polymerization and should
now be taken into due consideration when attempting to draw consistent models of
oligomer chain growth.
Another relevant outcome is the availability of structurally characterized tetramer
structures to probe currently held models of supramolecular organization of oligomers
in eumelanin related polymers.16
A variety of fully planar structures for 5,6-
dihydroxyindole oligomers have been proposed,24,63
which envisage either bicoupling
(two bonds between adjacent monomer units) or cyclic scaffolds featuring an inner
porphyrin ring. Though in principle attractive, these structures remain so far
hypothetical and have never been supported by direct experimental evidence.
While waiting for additional oligomers to be isolated and characterized, to depict
a more detailed scenario of the later stages of 5,6-dihydroxyindole polymerization, it is
advisable that only the structures of tetramers 8 and 9-11 be used when elaborating
predictive or interpretative models of supramolecular oligomer layer aggregation and
particle buildup.

- 42 -
CHAPTER II
Structural effect on the electronic absorption properties
of oligomers of 5,6-dihydroxyindole (1)
INTRODUCTION
As anticipated in the background section, eumelanins display a peculiar set of
optical and photochemical properties, including a broad, monotonic and featureless
absorbance profile extending from the UV to the near-IR, that are defined by the
molecular, supramolecular and aggregate-level structures of the pigments.5 These
properties, that still defy elucidation, are central to elucidating the actual role of
eumelanins in skin photoprotection, one of the main supposed functions of the
pigmentary system.5,64,65
Therefore, dissecting the fundamental structural factors responsible for the broad-
band absorption spectrum and black color remains a central goal of eumelanin research.
In particular, it is actively debated whether the eumelanin “chromophore” is due to an
extended conjugated polymeric backbone or rather reflects a highly disordered system
made up of mixtures of π-staked oligomers.5,15,16
A viable approach toward settling this controversy relies on systematic studies of
spectrophotometric properties in the oligomeric series, which have so far remained
largely uncharted. Elucidation of the structural effects on the optical band gap may
enable structure-property relationships to be derived to aid a fundamental understanding
of the underlying photochemical and optical processes.
Recent advances in computational methods have provided basic information on
the structural and photophysical properties of 1 and 2.5 In addition to structural studies
on the monomeric 5,6-dihydroxyindoles63(a),66-70
and a time dependent density
functional theory (TD-DFT) investigation of the oscillator strengths of various
tautomers of 1 and its quinone to predict absorption spectra71
a number of papers have
focused on the HOMO-LUMO gap and the compression effects of oxidation states,
tautomerism and -stacking in oligomers of 1. Besides semiempirical quantum
mechanics calculations on small oligomeric units72, semiempirical spectroscopic
simulations of five dimeric structures in a double-quinone form, comprising two

- 43 -
rotamers of the 2,2‟-biindolyl (5), the 2,7‟-biindolyl (4) and two rotamers of a
hypothetical 3,7‟-biindolyl, have been reported.63(a)
Calculated absorption spectra showed for oxidized dimer 4 an absorption
maximum at 320 nm and for the rotamers of oxidized dimer 5 bands around 300 nm.
HOMO–LUMO gaps for a range of oligomers have also been calculated63(b)
using as
structural models polyquinone layers up to a hexamer with the carbonyl residing along
the perimeter of the nanometer-sized structures. The simulations have been extended23
to include stacked aggregates of the oligomeric sheets as well as changes in their
oxidation states.
The key findings from all these papers are that different oxidation states and
tautomeric forms can have dramatically different gaps, and that increasing oligomer size
can have the effect of red-shifting the absorption maxima as can -stacking, to the point
that the whole UV-vis absorption spectrum can be covered through proper structural
combinations at the low oligomer level.
Notably, as few as 11 individual species have been calculated as being necessary
to cover the UV, visible and near infrared with realistic inhomogeneous line
broadening.14b,61
More recently a structural model for eumelanin protomolecules, consisting of 4 or
5 of the basic molecular units (hydroquinone, indolequinone, and its tautomers), in
arrangements that contain an inner porphyrin ring has been proposed. Interestingly, an
average of the spectra of the 16 dominant tetramers produced a largely featureless
spectrum, except for two weak and broad shoulders at around 350 nm and around 240
nm.24
Although these calculations concur to delineate a model in which the broad,
featureless eumelanin spectrum can indeed be constructed from a few chemically
distinct building blocks with overlapping individual absorption spectra, they have a
fundamental limitation in that they refer to hypothetical, chemically unverified
oligomeric skeletons that bear little resemblance to the structures so far isolated.
Some insight into the relationship between oxidation level, π-electron
delocalization and HOMO-LUMO gaps in DHI oligomers has derived from integrated
pulse radiolysis and computational investigation of the transient species generated by
oxidation of DHI and related oligomers59, 73
.

- 44 -
On this basis, a systematic investigation of the effects of structural parameters on
the spectroscopic absorption properties of isolated oligomers of 1 appeared desirable as
a necessary background on which to build an improved model to understand the optical
properties of eumelanins.
In this chapter I report the first vis-à-vis comparison of the experimental spectra
of the known oligomers of 1 with the corresponding ones simulated at the TD-DFT
level.

- 45 -
RESULTS AND DISCUSSION
Dimers 3–5 were prepared as described59
and were obtained as the acetyl
derivatives. To determine their absorption spectra, a mild deacetylation procedure was
used, which involves treatment with 0.1 M phosphate buffer, pH 12, under argon prior
to acidification to pH 7.0 and registration of the spectrum. Under these conditions,
deacetylation was complete, as checked by NMR analysis of samples obtained under the
same conditions,59
and no oxidation to melanin-like material occurred.
The experimental UV absorption spectra of 3–5 are reported in Figure 16.
Figure 16. UV absorption spectra of dimers 3–5 (2.5 × 10⁻⁵M) in aqueous
phosphate buffer, pH 7.0. 3, dotted line; 4, dot-dashed line; 5, full line.

- 46 -
Symmetric biindole 5 absorbs at relatively high wavelengths and its highest
wavelength maximum (369 nm) is shifted as much as 60 nm relative to 4 (λmax 308 nm),
whereas a less pronounced shift is observed in the case of 3 (λmax 328 nm). A similar
trend can be observed for the acetylated derivatives: in methanol as solvent, acetylated 5
shows a complex absorption spectrum with maxima at 325 (sh), 342 and 361 nm,
acetylated 3 displays a maximum at 322 nm and acetylated 4 exhibits bands at 297 and
307 (sh) nm.26
Notably, recent studies of the transient species obtained by pulse
radiolytic oxidation of dimers 3–5 at pH 7.0 also indicated a relatively long wavelength
absorption for the extended quinone-methide like species obtained by oxidation of 5
(520 [sh], 570 nm), and similar absorption spectra for the quinonoid oxidation products
of 3 and 4 (maxima around 530 nm).59
To inquire into the structural factors underlying the different absorption properties
of 3–5, the structural and electronic absorption spectra of these dimers were investigated
at the DFT level. Absorption spectra of all the energetically relevant species were
computed using the TD-DFT approach,47,51,74,75
with a large basis set. The PCM52,53,76
was employed to account for the influence of the aqueous environment on molecular
geometries and electronic transitions.77
Table 1 lists the conformers identified for the
three dimers, along with relevant geometrical, energetic and spectroscopic features; UV
spectra were computed for the most significant conformers of 3, 4 and 5 and are
displayed in Figure 17 (a Lorentzian line-broadening of 20 nm was imposed). For 5,
two non-planar structures constrained to inter-ring dihedrals of 155° and 130° were also
examined. For each dimer, a Boltzmann-weighted combination of the spectra of all
individual conformer is also shown.
As confirmed by reference computations performed on 1, in the absence of other
constraints the phenolic hydroxyl groups tend to be coplanar to the ring they belong to,
and to assume the same orientation, so as to form an intramolecular OH---O hydrogen
bond. The preferred orientation places the OH groups anti with respect to the indole
nitrogen. However, the opposite orientation, dubbed „„OH syn,‟‟ is only slightly higher
in energy (in the order of 0.3 kcal mol-1
), and can become predominant under the
influence of a compensating favorable interaction: this is, for example, the case for the
syn (OH syn) conformer of 3, which features an inter-ring hydrogen bond between the

- 47 -
NH proton on the first indole moiety, and the oxygen atom at the 5 position of the
second ring.
The most stable geometry of the symmetrical dimer 5 is planar, with an anti
arrangement at the 2,2‟ ring junction, and a computed λmax of 357 nm; by contrast, a syn
inter-ring junction implies a non-planar minimum energy conformation, in which the
reference dihedral (N-C2-C2‟-N‟) takes on a value of 25°, and the absorption is blue-
shifted by 6 nm; however, this conformer is higher in (PCM) energy by ca.
1.0 kcal mol-1
, and is expected to be significantly less populated at room temperature.

- 48 -
Table 1: Geometrical, energetic and spectroscopic features of the
significant conformers of dimers 3, 4 and 5, computed at the PBE0 level in
aqueous solution.
Conformer Inter-ring
dihedral,
(degrees)
Relative
energy,a
(kcal mol-1)
Relative
energy,b
(kcal mol-1)
Oscillator
strength
(λ, nm)
Apparent
λmax,c, nm
3 d
anti 180 0.0 e 0.0 f 357.0 (1.36) 357
anti 155 (restrained) 0.3 0.4 347.9 (1.28) 348
anti 130 (restrained) 1.9 2.2 327.8 (1.09) 328
syn 25 0.9 1.1 350.7 (1.26) 351
4 g
anti 137 1.6 1.2 332.5 (0.70),
307.2 (0.12)
331
anti (OH syn) h 148 1.4 1.2 343.8 (0.79),
305.8 (0.11)
343
syn 41
2.4
- - -
syn (OH syn) h 24
0.0 i
0.0 j 349.9 (0.81),
308.3 (0.11)
350
5 k
anti 143 1.3 1.2 332.2 (0.74),
303.7 (0.12)
331
anti (OH syn) h 133 1.9 1.6 322.4 (0.64),
303.9 (0.12)
320
syn 29 0.0 l 0.0 m 338.6 (0.80),
307.7 (0.10)
338
syn (OH syn) h 44 2.5 - - -
aPBE0 / 6-31+G(d,p) / PCM. bPBE0 / 6-311+G(2d,2p) / PCM // PBE0 / 6-31+G(d,p) / PCM.
cMaxima of a simulated spectrum with a Lorentzian line-broadening of 20 nm.
dReference dihedral N-C2-C2’-N’. e-1026.303677 hartree. f-1026.543679 hartree.
gReference dihedral N-C2-C4’-C5’. hOrientation of the phenolic hydroxyl groups on the second
unit syn with respect to the indole nitrogen of the same ring.
i-1026.298457 hartree. j -1026.537480 hartree. kReference dihedral N-C2-C7’-C6’.
l-1026.296921 hartree. m-1026.536278. Only maxima above 300 nm are recorded.
- 49 -
Accordingly, in the averaged spectrum the λmax is close to that of the anti
conformer, and compares quite well to the experimental value. If the anti conformation
is forced out of coplanarity by the same extent as the syn conformer (inter-ring dihedral
of 155°), the computed blueshift is similar (7 nm). Larger distortions can have much
stronger effects (e.g. almost 30 nm for an inter-ring dihedral of 50°); this may be of
interest in the comparison with other oligomers, for which strongly nonplanar
conformers may occur.
As a matter of fact, both 3 and 4 feature nonplanar minima, with distortions from
planarity that can exceed 45°; for the whole series of all conformers of 3, 4 and 5, a
remarkable correlation is observed between the distortion from planarity and the
computed transition wavelength. For each of the dimers 3 and 4, a single main
conformer contributes mostly to the spectra. The predicted λmax of 3 is around 347 nm,
in fair agreement with experiment. The agreement is worse in the case of 4 (~ 336 nm);
however, the observed order of the absorption maxima wavelengths, λ5 > λ3 > λ4, is
well reproduced. For all three dimers, the long wavelength band is due to
a HOMO → LUMO transition, both involved orbitals being strongly delocalized over
the two rings.

- 50 -
300 400 500
0.5
1.0
1.5
0.0
0.5
1.0
1.5
0.0
0.5
1.0
1.5
0.0
C
B
A
, nm
Abso
rban
ce,
arb
itra
ry u
nit
s
Figure 17. Computed [TD-DFT, PBE0 / 6-311++G(2d,2p) / PCM // PBE0 /
6-31+G(d,p) / PCM] UV-visible spectra of DHI dimers. Panel A, dimer 2: full line, anti; dashed line, syn; dotted line, anti structure constrained to an inter-ring dihedral of 155°; dot-dashed line, anti structure constrained to an
inter-ring dihedral of 130°; thick gray line, Boltzmann-weighted sum of anti and syn spectra. Panel B, dimer 3: full line, anti; dashed line, anti (OH
syn); dotted line, syn (OH syn); thick gray line, Boltzmann-weighted sum of the individual spectra. Panel C, dimer 4: full line, anti; dashed line, anti (OH syn); dotted line, syn; thick gray line, Boltzmann-weighted sum of the
individual spectra.

- 51 -
The trimers investigated in this study include 6 and 7, which were obtained as the
acetyl derivatives by oxidation of 1 according to a previous procedure26
and were
deprotected as above. From the structural viewpoint, 6 and 7 can be viewed as arising
from dimer 3 via a 2,4‟- or a 2,7‟-linkage with an additional indole unit, so that they
differ only by the mode of coupling of one terminal unit. Tetramer 8 was the sole
tetramer available for this study. The UV spectra of the trimers 6 and 7 and of tetramer
8 are shown in Figure 18.
Figure 18. UV absorption spectra of 2.5 x 10 -5 M trimers 6 and 7 and
tetramer 8 in aqueous phosphate buffer, pH 7.0. 6, dotted line; 7, dot-
dashed line; 8, full line.
It is noted that the chromophores of the trimers differ appreciably despite rather
similar structures with positional isomerism at one unit. Quite unexpectedly, 7 absorbed
at longer wavelengths (maximum at 347 nm) relative to 6 (λmax 305 nm with shoulder

- 52 -
around 335 nm). Again, a similar trend can be observed for the acetylated derivatives:
acetylated 7 displays a maximum at 342 nm whereas acetylated 6 shows a rather flat
absorption band with broad maxima at 310 and 330 nm.
Interestingly, tetramer 8 exhibited an almost featureless chromophore extending
over the entire UV range with a tail in the visible, while the spectrum of the acetylated
derivative was characterized by a broad band centered around 315 nm with shoulder at
340 nm.58
The absorption properties of trimers 6 and 7 were then investigated at the
TD-DFT level. The large molecular size of the trimers, combined with the sizeable
number of variable dihedrals, would make a systematic conformational search like that
carried out for the dimers extremely demanding in terms of computational resources.
Therefore, DFT optimizations were performed for a subset of starting structures which,
based on a preliminary visual exploration, could be energetically favored, e.g. because
of inter-ring hydrogen bonding. As a matter of fact, the first and the third indole units
are always rather distant from each other, and their interaction is expected to be small:
therefore, preliminary criteria to score the conformations of 6 can be deduced in a rather
straightforward way from the results of the conformational analysis of dimer 3,
discussed above, while for trimer 7 the conformational preferences of both dimers 3 and
4 must be taken into account. Table 2 lists the conformers identified for the two trimers,
while UV spectra of the most significant conformers are displayed in Figure 19 (as
before, a Lorentzian line-broadening of 20 nm was imposed).

- 53 -
Table 2: Geometrical, energetic and spectroscopic features of the
significant conformers of trimers 5 and 6, computed at the PBE0 level in
aqueous solution.
Conformer Inter-ring
dihedrals,
degrees
Relative
energy,a
kcal mol-1
Relative
energy,b
kcal mol-1
λ,nm
(Oscillator strength)
Apparent
λmax,c nm
6 d
+anti, -anti 136, -136 3.6 - - -
+anti, +anti 135, 136 3.0 - - -
+anti, -syn (OH syn)e 136, -24 1.6 1.2 376.0 (0.74), 340.6
(0.32), 316.8 (0.11),
311.6 (0.23)
374, 318
+anti,+syn (OH syn)e 136, 22 2.0 1.6 376.8 (0.73), 341.2
(0.32), 317.1 (0.11),
312.6 (0.23)
374, 317
-syn (OH syn), +anti f -25, 136 1.5 1.1 372.4 (0.79), 341.2
(0.31), 319.5 (0.09),
309.5 (0.07), 306.3
(0.19)
370,320
(sh)
-syn (OH syn), -anti f -24, -136 1.6 1.3 373.5 (0.79), 341.1
(0.30), 320.0 (0.09),
310.1 (0.09), 307.3
(0.18)
371, 316
-syn (OH syn), +syn
(OH syn) e,f
-24, 24 0.2 0.2 390.3 (0.72), 350.6
(0.36), 319.5 (0.09),
315.5 (0.33), 311.0
(0.06)
389, 317
-syn (OH syn), -syn
(OH syn) e,f
-25, -24 0.0 g 0.0 h 389.4 (0.72), 350.5
(0.36), 319.4 (0.11),
314.9 (0.31), 310.9
(0.06)
388, 316
7 i
+anti, -anti 136, -144 2.9
-
- -
+anti, -syn 135,-27 1.5 1.1 365.7 (0.77), 337.4
(0.26), 316.0 (0.13),
305.0 (0.18)
362, 308
+anti, +syn 136, 27 2.3 1.9 366.3 (0.76), 337.9
(0.26), 316.1 (0.13),
305.9 (0.18)
363, 308
-syn (OH syn), +anti f -24, 143 1.0 0.9 376.8 (0.78), 342.2
(0.32), 316.4 (0.09),
309.22 (0.13), 307.0
374, 311

- 54 -
(0.22)
-syn (OH syn), +anti
(OH syn) e,f
-25, 133 1.7 1.3 367.6 (0.75), 336.5
(0.33), 317.3 (0.08),
309.1 (0.06), 303.2
(0.22)
364, 313
(sh)
-syn (OH syn), -anti f -24, -142 1.2 1.1 375.9 (0.78), 341.0
(0.32), 315.9 (0.08),
309.4 (0.15), 307.0
(0.20)
374, 312
-syn (OH syn), +syn f -24, 28 0.5 0.5 382.0 (0.75), 346.4
(0.32), 318.8 (0.11),
311.9 (0.17), 309.4
(0.16)
380, 312
-syn (OH syn), -syn f -25, -28 0.0 j 0.0 k 380.9 (0.76), 346.5
(0.32), 318.7 (0.12),
311.3 (0.10), 308.6
(0.20)
378, 311
[a] PBE0 / 6-31+G(d,p) / PCM. [b] PBE0 / 6-311+G(2d,2p) / PCM // PBE0 / 6-31+G(d,p) /
PCM.
[c] Maxima of a simulated spectrum with a Lorentzian line-broadening of 20 nm.
[d] Reference dihedrals N-C2-C4’-C5’ and N’-C2’-C4”-C5”. [e] Orientation of the phenolic
hydroxyl groups on the third unit syn with respect to the indole nitrogen of the same ring.
[f] Orientation of the phenolic hydroxyl groups on the second unit syn with respect to the
indole nitrogen of the same ring. [g] -1538.854019 hartree. [h] -1539.211479 hartree.
[i] Reference dihedrals N-C2-C4’-C5’ and N’-C2’-C7”-C6”. [j] -1538.852378 hartree. [k] -
1539.210035 hartree.

- 55 -
300 400 500
0.5
1.0
1.5
0.0
0.5
1.0
1.5
0.0
B
A
, nm
Abs
orb
ance
, ar
bit
rary
un
its
Figure 19. Computed [TD-DFT, PBE0 / 6-311++G(2d,2p) / PCM // PBE0 /
6-31+G(d,p) / PCM] UV-visible spectra of DHI trimers. Panel A, dimer 5:
full line, +anti, -syn (OH syn); dashed line, +anti, +syn (OH syn); dotted
line, -syn (OH syn), +anti; dot-dashed line, -syn (OH syn), -anti; double-
dot-dashed line, -syn (OH syn), +syn (OH syn); dot-double-dashed line, -
syn (OH syn), -syn (OH syn); thick gray line, Boltzmann-weighted sum of
the individual spectra. Panel B, trimer 6: full line, +anti, -syn; dashed line,
+anti, +syn; dotted line, -syn (OH syn), +anti; dot-dashed line, -syn (OH
syn), +anti (OH syn); double-dot-dashed line, -syn (OH syn), -anti; dot-
double-dashed line, -syn (OH syn), +syn; double- dot-double-dashed line, -
syn (OH syn), -syn; thick gray line, Boltzmann-weighted sum of the
individual spectra.

- 56 -
Inspection of simulated absorption spectra of 6 and 7 indicates in all cases two
main bands around 310-320 and 360-390 nm. Depending on the specific conformation,
the computed wavelengths display appreciable changes: in particular, the long
wavelength band spans a range of about 20 nm. However, these conformational effects
are comparable to those observed for some of the dimers. A significant difference with
respect to the dimers is the presence of a large number of conformers with similar
stabilities. Thus, the experimentally measured spectrum should reflect an overlap of all
individual spectra, with comparable statistical weights. In other words, the
conformational inhomogeneity of the sample is probably an important factor in
determining the broader lineshapes of the experimental spectra of trimers with respect
to those of the dimers.
A second factor which can play a role in this sense is represented by a more
complex series of electronic transitions, which partly overlap to produce the overall
bands. Thus, for all conformers of trimer 6 the long wavelength band is mostly due to a
HOMO → LUMO transition (ranging from 390 to 372 nm), but unresolved
contributions from a HOMO-1 → LUMO transition, at 351-341 nm, are also present,
followed closely by other, essentially HOMO-2 → LUMO and HOMO → LUMO+1
transitions.
The situation is similar for 7: the HOMO → LUMO transition (ranging from 382
to 366 nm) is the main component of the long wavelength band, and overlaps to the
HOMO-1 → LUMO transition (346-336 nm); HOMO-2 → LUMO and HOMO →
LUMO+1 excitations are also located above 300 nm.
In the case of the trimers, the comparison with experiment is less satisfactory than
for the dimers, as it would appear that the computed maxima lie at significantly higher
wavelengths with respect to the experimental spectra. However, it is also conceivable
that the computed oscillator strengths may be slightly inaccurate: this would produce
little change in the dimer spectra (Figure 17), but would impact significantly on the
appearance of those of the trimers (Figure 19).
Moreover, some of the electronic transitions that underlie the trimer spectra
feature a significant charge-transfer character, which may imply a distinctly less
accurate description at the DFT level. For each trimer, the character of a given transition
depends on the specific conformer: in particular, the HOMO-1 → LUMO transition of

- 57 -
has strong charge-transfer character for the +anti, -syn (OH syn) and +anti, +syn (OH
syn) conformers of 6, and for the +anti, -syn and +anti, +syn conformers of 7, i.e., for
those structures where the junction between the first and the second indolic ring is anti.
In these cases, the HOMO-1 is mostly located on the first and part of the second indolic
ring, while HOMO and LUMO have little density on the first unit. Conversely, in those
structures which adopt a syn orientation at this junction the predominant spatial
localization of HOMO and HOMO-1 is inverted, and the charge-transfer transition
becomes HOMO → LUMO. Evidently, the overall effect of an hypothetical inaccuracy
of oscillator strengths would be rather complex to predict. However, it is noteworthy
that the ratio of computed oscillator strengths between the first and the second lowest
energy transitions seems strongly affected by environmental effects: for example, for
the -syn (OH syn), +syn (OH syn) conformer of 6 the ratio obtained with PCM is 2.0,
but drops to 1.2 in a vacuum TD-DFT computation performed at the same molecular
geometry.
Tetramer 8 was too demanding for DFT calculations and was not pursued further.

- 58 -
CONCLUSIONS
In this chapter I have reported the results of an integrated experimental and
computational investigation on the absorption properties of dimers, trimers and a
tetramer of 1 to gain some insight into the effects of bonding mode and increasing
molecular size. Three key points emerged from this study.
1) No regular and predictable bathochromic shift occurs with increasing chain
length. This is unusual in the field of aromatic π-conjugated oligomers, such as the
phenyl oligomers78
and is a consequence of the peculiar mode of coupling of the indole
units connecting pyrrole-benzene moieties in a non-repetitive fashion incompatible with
linear or rod-shaped oligomeric structures. In tetramer 8, for example, the sterically
congested 2,3-disubstituted moiety would force adjacent units out of coplanarity, thus
limiting effective π-electron delocalization to lengths less than the molecular length.
2) A marked broadening of the absorption bands occurs when going from the
monomer to the tetramer structure. This trend can be deduced from comparative
inspection of the spectra in Figures 17 and 19 and is even apparent in the more clearly
shaped spectra of the acetylated derivatives. To better illustrate this trend, the acetylated
monomer–dimer–trimer–tetramer series, which is characterized by a prevalent 2,4‟
mode of coupling, is shown in Figure 20.
This effect requires further investigation, especially when additional tetramer
structures are available. The computational approach we adopted concentrates on the
vertical excitation energy, and the vibrational structure of the absorption bands is
neglected.79,80
Changes in the vibrational structure may in principle contribute to the
observed dependence of bandwidth on oligomerization degree. However, as hinted
before, it is probable that band broadening reflects mostly the presence of increasingly
complex mixtures of conformers, whose chromophoric features are in turn modulated
by the variable degree of conjugation; further, each conformation of the trimers (and
presumably of the higher oligomers as well) displays an articulate array of low-energy
transitions, which overlap to create broad absorption bands.

- 59 -
Figure 20. UV absorption spectra of acetylated 1 (dotted line), 3 (light
grey line), 6 (dark grey line) and 8 (black line). Spectra were recorded in
methanol as the solvent. Sample concentration was ca. 1 × 10⁻⁵ M.
3) The mode of coupling of the monomer units is a critical structural parameter
governing the absorption properties of indole oligomers. This is perhaps the most
significant and relevant result of this study which can be fully appreciated when
considering the dramatic impact it may have on the degree of torsional freedom between
the units and, hence, on the accessibility of fully planar conformations, efficient electron
delocalization and, at the secondary level, -stacking interactions. Based on the present
and previous data, it appears that the indole bonding mode may affect the absorption
properties of the oligomers both in the reduced and oxidized quinonoid forms.59
The
emerging implication is that, in addition to chain length and redox state, the mode of
coupling may be another key contributor to the variety of chemically distinct
chromophoric species supposedly responsible for the broad featureless spectrum of
eumelanin. The effects caused by positional isomerism are complex, in some instances
they may even exceed those due to chain length, and seem at present to escape
rationalization.
In view of the foregoing, one could note that, apart from the pulse radiolysis
results of transient species presented recently,59
there does not appear to be any concrete

- 60 -
experimental verification of the existence of stable visible light-absorbing
chromophores derived from oligomers of 1 in the reduced 5,6-dihydroxyindole form,
however extended the oligomer size may be. In fact, the key question of why eumelanin
is black can only be addressed in the context of the multi-chromophoric heterogeneous
ensemble model by considering supramolecular aggregates in which oligomeric species
at variable or mixed levels of oxidation are stabilized in the solid state. In other words,
it is difficult to obtain a black chromophore by mixing oligomers of different chain
lengths in their reduced form.
Visible light absorption and significantly redshifted HOMO-LUMO gaps can be
achieved only by oxidizing oligomeric scaffolds. In this regard, the residual absorption
tail of tetramer 8 in the visible region (Figure 20) is probably indicative of adventitious
oxidation during rapid recording of the spectrum, reinforcing the notion that oligomer
oxidation is a necessary requisite for visible absorption and significant narrowing of
HOMO-LUMO gaps. Oxidized quinonoid oligomers, however, have never been
identified as stable entities in solution as they tend to evolve through chemical coupling
and⁄or supramolecular interactions leading to black insoluble materials which apparently
owe their coloration to phenomena belonging to the realm of solid state physics.
In conclusion, despite some persisting uncertainties and the lack of a broad
repertoire of oligomeric structures, the results of this study clearly show that a correct
mode of coupling of monomer indole units derived from experimental evidence is a
critical and essential prerequisite if feasible and reliable structural models are to be
constructed for interpretative and predictive purposes, while arbitrary bonding may lead
to misleading and unwarranted conclusions.
- 61 -
CHAPTER III
Reaction behavior of 5,6-dihydroxyindole (1) in acidic medium
The chemistry of indolic substrates in the presence of acids has been the subject of
much interest since a long time, and is known to give rise to a variety of dimerization
and trimerization products with partial oxidation and/or ring fission.81,82
Typically,
dimers featuring a 2,3‟-biindole mode of coupling and trimers with a 2-(2-
aminophenyl)-1-bis(indol-3-yl)ethane ring system are obtained. Moreover, the
unexpectedly facile cyclotrimerization of 1 and related hydroxyindole derivatives when
oxidized with persulfate in acidic media has also been reported.62
In all these reactions,
the starting event is protonation of the indole ring at the basic 3-position to produce an
electrophilic imine-like species which then undergoes attack by the nucleophilic
positions of the unprotonated indole. In the frame of a program aimed at designing
novel DHI-based functional materials,14b
it was therefore of interest to explore in a
systematic investigation the reaction behavior of 1 when left to stand in an aqueous
medium under mildly acidic conditions. Main aims of the study were a detailed
understanding of the chemistry of the 5,6-dihydroxyindole system when exposed to
acids and an assessment of the scope of this reaction for preparative purposes.
In this chapter I report the unexpected results of this study leading to the isolation
of a rearranged trimer featuring an unusual 2-benzyl-3-indolylquinoline skeleton. In
addition, I describe the selective binding properties of the acetylated trimer toward
fluoride anions, as revealed by the marked F--induced changes in the absorption and
fluorescence spectra.

- 62 -
RESULTS AND DISCUSSIONS
The reactivity of 1 in phosphate buffer at pH 2 was investigated. The course of
the reaction was monitored by LC/MS (0.2% formic acid, solvent A; acetonitrile,
solvent B; 5% B, 0–10 min; from 5 to 30% B, 10–25 min; from 30 to 70% B, 25–50
min); at a time of 3 h the mixture was characterized by the presence of two main
products eluted at 11.1 and 16.7 min, with pseudomolecular peaks [M+H]+
at m/z 299
and 448 respectively, indicative of the formation of a dimeric and a trimeric derivative
of 1.
After lyophilization of the residue and treatment with acetic anhydride/pyridine,
TLC analysis showed the presence of two main products at Rf 0.39 and 0.15 (eluent
CHCl3: AcOet = 3:7).
The mass spectrum (ESI+) of the product at Rf 0.39 showed a pseudomolecular
peak [M+H]+ at m/z 509, indicative of a pentaacetylated dimeric structure.
The compound was therefore tentatively assigned the structure of the acetylated
derivative of the dimer 5,6-dihydroxy-2-(5,6-dihydroxyindol-3-yl) indoline (12),
previously obtained from 1 by oxidation with ammonium persulphate in 0.1 M
phosphoric acid.62
This structure was confirmed by a full one and two-dimensional NMR analysis
(Figure 21). The 1H NMR spectrum showed only one signal typical of an NH proton
(δ 8.39) and a doublet (J = 9.6 Hz) at δ 5.53, which correlated in the 1H,
13C HSQC-
DEPT spectrum with a signal at δ 57.8 and in the 1H,
1H COSY spectrum with a double
doublet (J = 16.0, 9.6 Hz) at δ 3.53. The latter showed a correlation in the 1H,
1H COSY
spectrum with a doublet (J = 16.0 Hz) at δ 2.58; also the protons at δ 3.53 and 2.58
correlated with the same signal at δ 36.9 in the 1H,
13C HSQC -DEPT spectrum. These
elements confirm the presence of a 5,6- dihydroxyindolic N-acetylated unit reduced at 2
and 3 positions and linked through the 2-position to the second indole unit.
The aromatic region of the 1H NMR spectrum was characterized by the presence
of five signals, one at very low fields (δ 8.13), attributed to H-7 proton of the reduced
indolic unit, probably deshielded because of a diamagnetic anisotropy effect exerted by
the adjacent N-acetyl group. On the basis of the correlations observed in the
1H,
13C HMBC spectrum, a signal at δ 6.78 was attributed to the H-4 proton of the
reduced indolic unit, while the remaining 3 signals at δ 6.53, 7.15 and 7.18 were

- 63 -
assigned to the second indolic unit. Of these, the first correlated in 1H,
1H COSY
spectrum with the signal of the NH proton at δ 8.39 and was therefore attributed to an
H-2 type proton, while signals at δ 7.15 and 7.18, which showed a direct correlation
with carbon signals at δ 111.9 and 106.1, were attribueted to H-4 and H-7 type protons,
respectively.
N
N
AcO
AcO
H
H
H
AcO
H
H
H
OAc
Ac
H
H
H
138.4
136.2
111.9
117.2
106.1
122.8
138.3
140.5
112.2
119.6128.4
140.9
36.9
57.8
133.9120.7
8.13
6.78
5.53
6.53
7.18
7.15
3.53
2.58
8.39
Figura 21. Structure of the acetylated derivative of 12 with proton (regular
style) and carbon (italic style) resonances.
Product at Rf 0.15 presented in the ESI(+)-MS spectrum [M+H]+ and [M+Na]
+
pseudomelecular peaks at m/z 742 and 764, respectively, indicative of a heptaacetylated
trimeric structure, which is also characterized by the presence of a nitrogen functionality
capable of acetylation. The 1H NMR spectrum showed a triplet (1H) at δ 4.35 and a
doublet (2H) a δ 3.15 in the aliphatic region, while in the aromatic region it was
possible to distinguish two spin systems, one of which was characterized by signals
integrating for 2H, and therefore hinted to a symmetrical structure. On this basis, and by
comparison with data reported in the literature,62
the compound was assigned the
structure of the acetylated derivative of 2-(2-amino-4,5-dihydroxyfenyl)-1,1-bis(5,6-
dihyidroxyindol-3-yl)ethane (13).

- 64 -
The formation of such products would proceed through the mechanism shown in
Scheme 5, similar to that described above for the reaction of indolic systems at acid
pH,62
which consists in the addition of an indolic unit through the 3 position to the 2
position of a second protonated indolic unit.
OH
NH
OH
OH
N+
OH
OH
NHOH
H
H
OH
OH N
HH
H
OH
NH
OH
OH
NH
OH
OH
NH
OH
OH
NH
OH
OH
OH
NH2
OH NH
OH
OHOH
OH
NH
OH
NH2
OH
NH
OH
OH
NH
OH
OH
NH2OH
+
+
H+
H+
+
-
H+
H+-
1
12
13
1
1
Scheme 5. Proposed formation mechanism of 12 and 13.62

- 65 -
In subsequent experiments further processes of conversion of compounds 12 and
13 in acidic conditions were examined. LC/ MS analysis of the reaction mixture of 1 at
pH 2 showed a progressive decrease of compounds with pseudomolecular peaks
[M+H]+ at m/z 299 and 448, accompanied by the formation of a product eluted at 23.6
min, characterized by a pseudomoleculare peak [M+H]+ at m/z 446, indicative of an
oxidized trimeric derivative, which reached a maximum yeld of formation at 24 h
(Figure 22).
Figure 22. TIC of the reaction of 1 at pH 2 at 24 h.
This compound was obtained in 10% yield by a simple work-up procedure
involving acetylation of the crude mixture followed by a chromatographic step, and was
identified as 2-(2-acetamido-4,5-diacetoxybenzyl)-6,7-diacetoxy-3-(5,6-diacetoxyindol-
3-yl)quinoline (14b) following complete spectral characterization.
The mass spectrum (ESI+) showed a pseudomolecolar peak [M+H]+ at m/z 740,
indicative of a heptaacetylated trimer in an oxidation state higher than the acetylated
derivative 13. The compound showed absorption maxima in the UV-Vis spectrum at
276 and 330 nm in acetonitrile.
[M+H]+= m/z 446

- 66 -
The 1H NMR spectrum (Figure 23) was characterized by a singlet at δ 4.14 (2H),
which correlated with a signal at δ 39.1 in the 1H,
13C HSQC-DEPT spectrum,
indicating the probable presence of an open indolic unit.
Figure 23. Selected region of 1H NMR spectrum of 13b.
The aromatic region of 1H NMR spectrum showed eight signals; the singlets at δ
6.28 and 7.96, showing direct correlation with carbon signals at δ 124.8 and 117.3
respectively in the 1H,
13C HSQC-DEPT spectrum (Figure 24), were assigned to the 2-
acetylamino-4,5-diacetoxybenzilyc unit deriving from opening of an indolic unit on the
basis of correlations observed in the 1H,
13C HMBC spectrum (Figure 25). The signal
at δ 7.04 was attributable to an indolic proton in 2-position, as correlated with a signal
at δ 127.1 in the 1H,
13C HSQC-DEPT and with a signal at δ 8.99 assigned to the NH
proton of the same indolic nucleus in 1H,
1H COSY spectrum (Figure 26).

- 67 -
Figure 24: Selected region of 1H, 13C HSQC-DEPT of 14b.

- 68 -
Figure 25. Selected region of 1H, 13C HMBC spectrum of 14b.

- 69 -
The absence of other correlations in the 1H,
1H COSY spectrum for the signal at δ
7.04 suggested the lack of a proton in 2-position, indicating that the indolic unit in
question had to be linked through 3 the position. Analysis of the 1H,
13C HSQC-DEPT,
1H,
13C HMBC and ROESY (Figure 27) spectra has allowed to assign to that unit also
proton resonances at δ 7.09 (H-4 type proton, direct correlation with carbon signal at δ
112.3) and δ 7.32 (H-7 type proton, direct correlation with carbon signal at δ 106.2 and
ROESY contact with the N-H proton at δ 8.99).
Signals attributable to the third unit were rather peculiar: a proton at δ 8.02, linked
to a particularly deshielded carbon (δ 139.0) that correlates in the 1H,
13C HMBC
spectrum with a quaternary carbon signal at δ 160.5, and two protons at δ 7.59 and 7.87
which showed a direct correlation with carbon signals at δ 120.4 and 120.9 respectively,
values quite unusual for an indolic ring. Those factors, combined with the absence in
the 1H NMR spectrum of a signal attributable to a third NH proton, suggested the
structure of the acetylated derivative of 2-(2-amino-4,5-dihydroxybenzyl)-6.7-
dihydroxy-3-(5,6-dihydroxiindol-3-yl)quinoline (14b) for the compound at Rf = 0.25
(Figure 28). In agreement with the proposed structure, the signal at δ 2.8 attributed to
the H-4 proton of the quinoline ring showed contacts in the ROESY spectrum with the
H-5 proton at δ 7.59 and the H-4‟‟ indolic ring proton at δ 7.09 while the signal of the
benzylic protons at δ 4.14 correlated with the signal of the H-2 indolic ring proton at δ
7.04.

- 70 -
Figure 26. Selected region of 1H, 1H COSY spectrum of 14b.

- 71 -
Figura 27. Selected region of ROESY spectrum of 14b.

- 72 -
H
NH
AcO
OAc
NAcO
AcO
H
H H
H
H
Ac
H
N
AcO
OAc
H
H
H
H
7.59
7.87
8.02
7.04
7.09
4.14
7.96
6.28
10.82
144.4
120.4
120.9 144.0
139.0
128.6
160.5
39.1
127.1124.8
137.5
140.5117.3
135.9
112.8
124.8
127.1
133.1
106.2138.6
136.9
112.3
141.7
125.3
1
45
8
9
10
1''
2''
4''
7''
1'
4'
2'
7.32
8.99
Figure 28. Structure of heptaacetyl derivative of 2-(2-amino-4,5-
dihydroxybenzyl)-6,7-dihydroxy-3-(5,6-dihydroxyindol-3-yl)chinoline (14b)
with proton (regular style) and carbon (italic style) resonaces.
The facile formation of 14a from 1 is therefore attributed to the specific reactivity
of this indole via the 2-position,83
steering in part the acid-promoted polymerization
pathway through the usually less favorable 2-(2-amino-4,5-dihydroxyphenyl)-1-(5,6-
dihydroxyindol-2-yl)-1-(5,6 dihydroxyindol- 3-yl)ethane (15) (Scheme 6). Formation of
the quinoline system of 14a from 15 may proceed through a rearrangement step akin to
that described for indole trimers in acidic media.84

- 73 -
OH
NH
OH
OH
NH
OH
RHN
OROR
NRO
RO
ORRO
NH
OH
OHNH
NH2
OH
OH
OH
NH
OH
OR
ORNH
NHRRO
RO
OR
NH
RO
NH2
OHOH
NOH
OH
OHOH
NH
H+
[O]
14a, R=H
12
15
+
rearrangement
H+
Ac2O14b, R=Ac
13a, R=H Ac2O13b, R=Ac
Scheme 6. Representative mechanism of formation of 14.

- 74 -
A comparative study showed that none of the other indoles examined, i.e. indole,
5-hydroxyindole, 6-hydroxyindole, 5,6-dimethoxyindole, and 5,6-dihydroxy-N-
methylindole, gives the corresponding 3-(indol-3-yl)quinoline trimer under the same
conditions. Use of stronger acids, e.g., HCl, or organic acids, e.g., acetic acid, was not
productive, furnishing invariably ill-defined mixtures.
The 2-(2-aminobenzyl)-3-(indol-3-yl)quinoline system featured by 14a has
previously been obtained only by harsh treatment of indole under Friedel–Crafts
acylation conditions85
or in the presence of p-toluenesulfonic acid followed by complex
work-up, extraction, and chromatographic separation steps.84
Given the structural characteristics of 14b ( an indolic unit linked to a quinoline
unit), the properties of this compound as a sensor for the determination of F- ions were
evaluated.87c,90
The absorption properties of 14b are shown in Figure 29.
The compound exhibited a distinct maximum at 330 nm in CH3CN. Upon the
addition of increasing concentrations of F- a yellow coloration developed, due to the
formation of a chromophore absorbing at 414 nm. Examples of colorless-to-yellow
color changes associated with F- binding to an organic compound had already been
reported in the literature.86
No clear isosbestic point is apparent from data in Figure 29,
which suggests that color development involves more complex equilibria than a simple
1:1 substrate–anion binding process.

- 75 -
Figure 29. Changes in the UV-vis spectra of 14b (1×10⁻⁵ M) in CH3CN after
addition of 0, 10, 15, 20, 25, 50, 100, 150, and 200 equiv of
tetrabutylammonium fluoride (TBAF).
Inset: Absorbance at 414 nm versus equiv of F-.
The acetylated derivative 14b exhibited a remarkable fluorescence enhancement
upon the addition of F-
(Figure 30). The fluorescence spectra of 14b displayed
important changes upon addition of up to 300 equiv F-. In Figure 31 the spectra of a
5×10⁻⁷
M solution of 14b in acetonitrile are showed before and after the addition of 25
molar equivalents of F- ions, for excitation wavelengths of 270 (plot A) or 414 nm (plot
B), that is in correspondence with the absorption maxima developed following the
addition of F-. In both cases the development of a fluorophore at 489 nm is observed.

- 76 -
Figure 30. Fluorescence changes of 14b (5×10⁻⁵ M) in CH3CN upon
addition of 25 equiv of TBAF. (A) no additive; (B) +TBAF (under a UV lamp
at 366 nm).
Figure 31. Fluorescence spectra of 5 10-5 M solution of 14b in
acetonitrile before (I) and after (II) addition of 25 molar equivalents of F-
ions: (A) excitation at 270 nm; (B) excitation at 414 nm. For recording the
spectra the solutions were diluted 1:100.
I
II
II
I
A B

- 77 -
The fluorescence response of 14b (5×10⁻⁷
M) upon addition of up to 300 equiv F-
is shown in Figure 32. In the absence of F-, fluorescence of the free compound was
weak and barely detectable. Addition of the anion to the solution caused the emergence
of a distinct emission band at 489 nm following excitation at either 270 or 414 nm.
Figure 32. Changes in the fluorescence spectra of 14b (5×10⁻⁷ M) in
CH3CN after addition of TBAF from 0 to 300 equiv.: (A) excitation
wavelength 270 nm, (B) excitation wavelength 414 nm.
A
B

- 78 -
This effect is worthy of note since anion binding causes fluorescence quenching for
most of the reported sensors,87
with only a few exhibiting fluorescence
enhancement.86c,88
The recognition process was selective for F- since in the presence of
other anions, including Cl-, Br
-, I
-, AcO
-, NO2
-, HSO4
-, no significant changes in the
fluorescence spectra were observed. Complete fluorescence quenching was noted
however in the presence of water (>20%). The change of fluorescence intensity at 489
nm versus equivalents of F- and the Job‟s plot from which the stoichiometry of the
fluoride–14b interaction was determined to be 2:1 are shown in Figure 33.
Figure 33. (A) Fluorescence intensity at 489 nm versus equiv of F- and (B)
Job’s plot of 14b–fluoride interaction in CH3CN (total [14b]+[F-]=5×10⁻⁵ M)
B
[14b]:[F-]
A

- 79 -
In subsequent experiments, the effects of F- binding on the parent
5,6-diacetoxyindole and the acetylated trimer 13b were investigated. Trimer 13b was a
suitable model to identify the chromogenic and fluorogenic systems in 14b, since it
exhibited the diacetoxyindole and acetamido moieties placed at a comparable distance
by a non-conjugating spacer chain replacing the rigid quinoline ring. Upon the addition
of F- neither diacetoxyindole nor 13b developed significant fluorescence. This
observation suggests that the quinoline ring is an essential constituent of the fluoride
sensing fluorophore.
To gain a deeper insight into the mechanism of F- coordination by 14b,
1H NMR
titration experiments were carried out in DMSO-d6. With 0.5 equiv F-, the indole NH
proton signal at δ 11.6 (Figure 34A) disappeared (Figure 34B). A similar behavior has
previously been reported for several systems containing NH protons, indicating
interaction with F- anions.
86a,c,88a,89 Addition of further amounts of the anion caused
disappearance of the amide NH proton signal at δ 9.81, accompanied by a slight upfield
shift of the other proton signals (Figure 34C).88c,89,90
A visible fluorescence with
concomitant color change was well apparent at this stage. No alteration of the signals
due to the acetyl groups was observed, ruling out deacetylation during F- coordination.
The ROESY spectrum of 14b in the absence of F- showed distinct cross peaks
between: (a) the quinoline H-4 and the indole H-4 resonances; (b) the quinoline H-8 and
the amide NH signals; and (c) the benzylic proton singlet and the indole H-2 proton
doublet. These contacts suggested a preferential conformation with the indole NH group
close to the benzylic methylene and the amide group facing the quinoline nitrogen, as
previously described for related systems on the basis of X-ray analysis.85
Interestingly,
in the ROESY spectrum recorded after addition of 0.5 equiv of F-, at a stage when only
the indole NH has disappeared, the cross peak between the amide NH and the quinoline
H-8 signals was no longer detectable.

- 80 -
Figure 34. Partial 1H NMR spectra of 14b in DMSO-d6 (A) in the absence or
in the presence of (B) 0.5 or (C) 2.5 equiv of TBAF.

- 81 -
Based on the above NMR data and the 2:1 stoichiometry inferred from the
titration experiments, it is suggested that the initial coordination of F- to the indole NH
hydrogen induces a rotation of 180° of the benzylic ring. Upon the addition of further
aliquots of fluoride, significant deprotonation may occur,91
and the deprotonated indole
can be stabilized by an intramolecular hydrogen bond with the amide NH group
(Scheme 7).92
A locked coplanar disposition of the indole and quinoline rings would
then ensue, with consequent fluorescence enhancement and UV bathochromic
shift.88a,92b
Attempts to detect the HF2- signal in the
1H NMR spectrum at ca. δ 16 were
however unsuccessful. This has been attributed to fast proton exchange with the water
impurity present in the DMSO solvent.88c
Verification of the proposed Bronsted acid–base reaction by titration experiments
with the strong base [(Bu)4N]OH (TBAOH) was precluded by deacetylation of the
catechol functions under such conditions.59
Because of this deacetylation reaction and
the lack of effect of acetate and hydrogen sulfate anions, 14b should be regarded as a
specific fluoride sensor and not a mere acid–base sensor.
The fluorescence titration profile apparently supported the two-step process
depicted in Scheme 7. Quantitative measurements of the F- affinity from the titration
data by previously reported procedures93
gave values of logK = 6.04 and 4.08, which are
comparable with those of many known fluorescence based sensors.88c, 82,92b, 94

- 82 -
Ac
N
NAcO
AcO
OAc
AcO
OAcAcO
N
H
FH
NH
Ac
OAc
OAc
NAcO
AcO
OAcAcO
NH
H
H
H
H
Ac
N
NAcO
AcO
OAc
AcO
OAcAcO
N
H-
F-
F-
+ [F-H-F]-
a
c
b
14b
= ROESY contacts
2
45
8
9 1''3''
4''
7''
8''9''
1'2'
10
Scheme 7. Mechanism of coordination of F- to 14b

- 83 -
CONCLUSIONS
Despite the vast literature that accumulated during the past few years, the quest
for easily accessible and efficient fluoride-sensing molecular systems is still an active
area of research6 because of the significant biological, medical, industrial, and
environmental relevance of fluoride chemistry.
In this chapter I have reported a novel fluoride-sensing scaffold featuring an
unusual 2-(2-amidobenzyl)-3-(indol-3-yl)quinoline skeleton, which was obtained from
1 by a mild one-pot variant of the classic acid-promoted trimerization of indoles
followed by acetylation. Compound 14b represents a chromogenic and fluorogenic
fluoride sensing system95
operating in the turn-on mode and its characterization may
stimulate further studies on the potential fluoride sensing properties of related
indolylquinoline systems.

- 84 -
CHAPTER IV
Oxidative chemistry of 5,6-dihydroxy-1-methylindole
INTRODUCTION
In the previous chapters I reported the results of studies directed to the preparation
and characterization of higher oligomers with a 5,6-dihydroxyindole-based scaffolds58,96
by an oligomer coupling strategy. In particular, interesting results concerning new
tetramer products were obtained by isolation of the main intermediates in the oxidative
polymerization of a 2,4‟-biindole and a 2,7‟-biindole. Since 5,6-dihydroxyindole
derivatives tend to dimerize via 2,2‟-bonds under metal ion-assisted conditions, it was
of considerable interest to extend the study to the oxidation behavior of the 2,2‟-
biindole system from 1. Unfortunately, pursuit of this goal was frustrated by the marked
difficulty to obtain sufficient amounts of the desired 2,2‟-dimer by metal-assisted
oxidation of 1, the reaction leading invariably to side products and impurities difficult to
remove. However, it was known that 5,6-dihydroxy-1-metyl-indole (16), a major
oxidation product of adrenaline (epinephrine) undergoes metal ion-assisted oxidation,
e.g. with Ni2+
or Zn2+
to give as main oligomer products dimer 17 and trimer 18, which
share the desired and little explored 2,2′-biindole system (Scheme 8). On this basis it
was decided to investigate 5,6-dihydroxy-1-methylindole-derived oligomers as potential
building blocks for novel oligomeric scaffolds. An additional advantage of using 16 as
the starting substrate relates to the more favorable solubility and chromatographic
properties of its oligomers with respect to those of most oligomers of 1.97, 98

- 85 -
N
OH
OH
CH3
N
OH
OHCH
3
N
OH
OH
CH3
N
OH
OHCH
3
N
OH
OH
CH3
N
OHOH
CH3
[O]
metal cations
16
17
18
Scheme 8: Oligomers obtained by oxidation of 16 in the presence of metal
cations.

- 86 -
RESULTS AND DISCUSSION
Biomimetic oxidation of dimer 17 was carried out with peroxidase/H2O2 at pH
7.4. The dimer, stored as the acetyl derivative, was deprotected in MeOH with sodium
tert-butoxide under an Ar atmosphere; after oxidation, the reaction mixture was
acidified and reduced and the ethyl acetate extractable fraction was acetylated.
TLC analysis (CHCl3:AcOEt=4:6) of the resulting mixture indicated a principal product
at Rf 0.53 and traces of a product at Rf 0.33, that were been isolated by repeated TLC.
ESI-MS analysis of principal product showed pseudomolecular ion peaks [M +H]+ and
[M+Na]+ at m/z 983 and 1005, indicating a tetramer of 16. The
1H NMR spectrum
exhibited only 5 signals in the aromatic region (Figure 35), suggesting a symmetric
structure.
Figure 35. Selected region of the 1H NMR spectrum of tetramer 19-
acetylated.
The presence of two resonances above δ 7.00 correlating with N-CH3 protons in
the ROESY spectrum (Figure 36) and only one correlating with a resonance typical of a

- 87 -
3-H allowed formulation of the compound as the acetylated symmetric tetramer
19-acetylated, with a 4,4 link between the dimeric units.
Figure 36. ROESY spectrum of tetramer 19-acetylated.
Analysis of the 1H,
13C HSQC -DEPT and
1H,
13C HMBC spectra allowed the
assignment of all proton and carbon resonances (Figure 37).
Preferential reactivity of 17 via the 4-position may be largely determined by steric
factors, including the effect of the N-Me groups hindering the 7-position relative to the
parent 5,6-dihydroxyindole.97

- 88 -
N
CH3
N
N
CH3
N
AcO
AcO
OAc
OAc
OAc
OAc
AcO
AcO
H
H H
H
H
HH
HCH3
CH3
H
H
6.51 7.37
7.313.69
6.28
7.14 3.53
132.5
104.7114.1
135.6*
139.0*
104.2135.3
125.3
31.2
132.2
105.3120.4
134.5#
138.5#
104.1135.0
125.1
31.1
*,# interchangeble
ab
b' a'
Figure 37. Structure of tetramer 19-acetylated with proton (regular style)
and carbon (italic style) resonances.
The product at Rf 0.33 could not be fully characterized, because of the small
amount isolated. However ESI(+)-MS analysis showed pseudomolecular ion peaks
[M +H]+ and [M+Na]
+ at m/z 1473 and 1495, indicating a hexamer; however, the
1H-NMR spectrum displayed a smaller number of resonances that those expected for an
asymmetric hexamer; in particular, only three resonances typical of protons at the
indolic 3-position and only three signals for N-CH3 groups were observed. Based on
this, the structure of the acetylated symmetric hexamer 20-Ac was hypothesized
(Figure 38).

- 89 -
N
CH3
OAc
OAc
N
CH3
AcO
AcO
N
CH3
OAc
OAc
N
CH3
AcO
AcO
N
CH3
OAc
OAc
N
CH3
AcO
AcO
20-acetylated
Figure 38. Proposed structure of the product at Rf 0.33
(CHCl3:AcOEt=4:6).
Quite interestingly, biomimetic oxidation of an equimolar mixture of 17 and 18
with peroxidase/H2O2 at pH 7.4 followed by reductive treatment and acetylation of the
ethyl acetate extractable fraction led to the formation of a single isolable product, along
with abundant eumelanin-like material. Repeated chromatographic steps eventually
afforded small amounts of the product, which displayed pseudomolecular ion peaks
ESI(+)-MS at m/z 1226 ([M+H]+) and 1248 ([M+Na]
+), i.e., two mass units lower than
those expected for a pentamer. The 1H NMR spectrum (Figure 39) indicated only 10
singlets in the aromatic region, and the 13
C NMR spectrum displayed consistently 10 sp2
C-H signals.

- 90 -
Figure 39. Selected region of 1H NMR spectrum of pentamer
21-acetylated.
These resonances were attributed to the presence of five H3-type protons and five
H7-type protons on the basis of 1H,
13C HSQC -DEPT and
1H,
13C HMBC spectra and
comparison with available NMR data for 5,6-dihydroxyindole oligomers.97,98
The presence of five H7-type protons was confirmed since these correlated in the
ROESY spectrum with N-CH3-type protons (Figure 40).

- 91 -
Figure 40. Selected region of the ROESY spectrum of 21-acetylated.
Accordingly, the product was unambiguously identified as the cyclopentamer 21-
acetylated (Figure 41).

- 92 -
N
AcO
OAc
CH3
N
CH3
OAC
OAc
N
AcO
AcO
CH3
N
CH3
OAc
OAc AcO
AcO
N
CH3
21-acetylated
Figure 41. Structure of cyclopentamer 21-acetylated.
Compound 21-acetylated is the highest 5,6-dihydroxyindole oligomer so far
isolated and the first macrocycle composed of five N-methyl-5,6-dihydroxyindole units.
Its isolated yield (ca. 5%) is comparable to that of most 5,6-dihydroxyindole
oligomers58
and is significant considering that the building of cyclic structures, though
entropically favored, has to compete against the distribution of the linear oligomers.
The structural features of 21 were explored at the DFT level of theory, using the
hybrid PBE0 functional42
in conjunction with the 6-31+G(d,p) basis set.99
All structural
minima are of C1 symmetry and therefore occur as pairs of conformational enantiomers.
Table 3 lists computed inter-ring dihedrals and relative energies of the main conformers
of the N-Me-DHI cyclic pentamer 21. For the sake of clarity, the five indole units have
been dubbed as A (unprimed), B (primed), C (double primed), etc. only the one for
which the first dihedral is positive is reported in the Table 3.

- 93 -
Table 3. Computed inter-ring dihedrals and relative energies of the main
conformers of the N-Me-DHI cyclic pentamer 21
Conformer N(A)-
C2(A)-
C2(B)-
N(B)/
deg
C8(B)-
C4(B)-
C4(C)-
C8(C)/
deg
N(C)-
C2(C)-
C2(D)-
N(D)/
deg
C8(D)-
C4(D)-
C2(E)-
N(E)/
deg
C8(E)-
C4(E)-
C4(A)-
C8(A)/
deg
E/
kcal/mol
20a 109 -49 44 -132 -67 0.001
20b 114 -49 43 -132 -68 0.33
20c 35 -50 78 97 62 2.76
20d 34 48 -70 -112 -72 3.35
20e 33 48 -68 -112 -73 3.58
20f 36 -50 80 97 56 3.76
20g 35 -51 83 96 56 4.31
20h 109 -46 -17 -131 -64 10.82
1 -2759.005272 hartree
Equilibration of the enantiomeric pairs would require a concerted inversion at the
C4(A)-C4(E) and C2(E)-C4(D) interring dihedrals, which cannot be achieved without
severe strain of the macrocyclic ring (as a matter of fact, steric interactions at the
biphenyl-type 4,4′- bonds suffice to induce atropisomerism even in linear biindoles).100
Within each series, two main conformational basins can be identified: in the first
one, the A and B indole rings assume an almost perpendicular disposition (and the C
and D units are much less skewed); the opposite holds in the second basin. Additional
conformational complexity is connected to the details of the pattern of intramolecular
O-H···O hydrogen bonds. Such a complex conformational behavior suggests an
inherent difficulty to efficient supramolecular packing, which may well account for our
failure to grow crystals suitable for X-ray analysis. Figure 42 shows the most stable
conformer identified.

- 94 -
Figure 42. Most stable conformer of 21.
Compound 21 conceivably arises by sequential crosscoupling-cyclization of 17
and 18 via catechol-quinone interactions.96,97
A DFT investigation was therefore carried out on 17 and 18, both in their reduced
and oxidized (quinonoid) forms and computed inter-ring dihedrals and relative energies
of the main conformers / tautomers are listed in Tables 4 and Table 5.
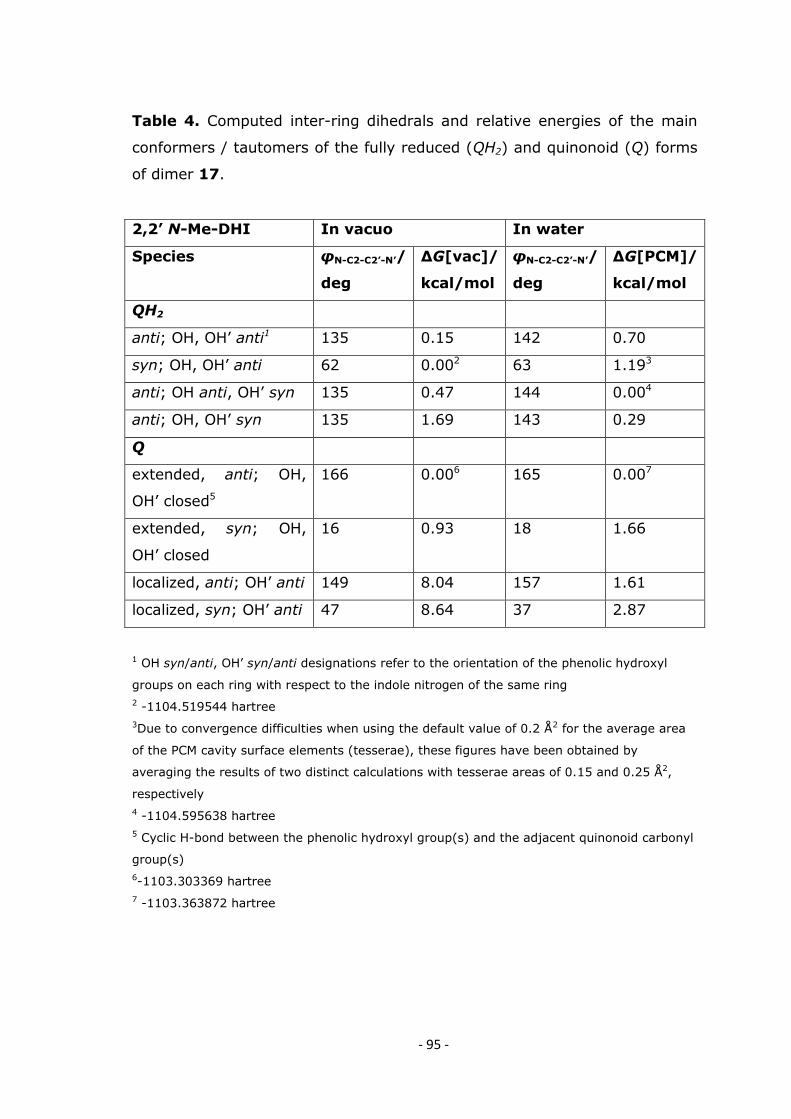
- 95 -
Table 4. Computed inter-ring dihedrals and relative energies of the main
conformers / tautomers of the fully reduced (QH2) and quinonoid (Q) forms
of dimer 17.
2,2’ N-Me-DHI In vacuo In water
Species φN-C2-C2’-N’/
deg
∆G[vac]/
kcal/mol
φN-C2-C2’-N’/
deg
∆G[PCM]/
kcal/mol
QH2
anti; OH, OH’ anti1 135 0.15 142 0.70
syn; OH, OH’ anti 62 0.002 63 1.193
anti; OH anti, OH’ syn 135 0.47 144 0.004
anti; OH, OH’ syn 135 1.69 143 0.29
Q
extended, anti; OH,
OH’ closed5
166 0.006 165 0.007
extended, syn; OH,
OH’ closed
16 0.93 18 1.66
localized, anti; OH’ anti 149 8.04 157 1.61
localized, syn; OH’ anti 47 8.64 37 2.87
1 OH syn/anti, OH’ syn/anti designations refer to the orientation of the phenolic hydroxyl
groups on each ring with respect to the indole nitrogen of the same ring
2 -1104.519544 hartree
3Due to convergence difficulties when using the default value of 0.2 Å2 for the average area
of the PCM cavity surface elements (tesserae), these figures have been obtained by
averaging the results of two distinct calculations with tesserae areas of 0.15 and 0.25 Å2,
respectively
4 -1104.595638 hartree
5 Cyclic H-bond between the phenolic hydroxyl group(s) and the adjacent quinonoid carbonyl
group(s)
6-1103.303369 hartree
7 -1103.363872 hartree

- 96 -
Table 5. Computed inter-ring dihedrals and relative energies of the main
conformers / tautomers of the fully reduced (QH2) and quinonoid (Q) forms
of trimer 18.
2,2’:4’,2’’
N-Me-DHI
In vacuo In water
Species φN-C2-C2’-N’/
deg
φC8’-C4’-C2”-N”/
deg
∆G[vac]/
kcal/mol
φN-C2-C2’-N’/
deg
φC8’-C4’-C2”-N”/
deg
∆G[PCM]/
kcal/mol
QH2
+anti, +anti;
OH, OH’, OH”
anti1
138 123 1.21 142 117 0.002
+anti, +anti;
OH, OH” anti,
OH’ syn
137 128 4.33
+anti, -anti; OH,
OH’, OH” anti3
+anti, -anti; OH,
OH” anti, OH’
syn
138 -128 4.68
+anti, +syn;
OH, OH’, OH”
anti
139 59 0.49 142 66 1.39
+anti, -syn; OH,
OH’, OH” anti
136 -58 0.004 141 -71 0.76
+anti, -syn; OH,
OH” anti, OH’
syn
137 -55 4.92 138 -69 0.91
Q
extended across
2,2’, +anti,
-anti; OH, OH’
closed, OH” anti5
167 -130 1.55 167 -125 0.45
extended across
2,2’, +anti,
+anti; OH, OH’
closed, OH” anti
167 129 1.65 166 124 0.006
extended across
2,2’, +anti,
-syn; OH, OH’
closed, OH” anti
166 -60 2.18 166 -64 1.07

- 97 -
extended across
2’,4”, +anti,
-anti; OH anti;
OH’, OH” closed
135 -156 0.57 143 -152 3.62
extended across
2’,4”, +syn,
-anti; OH anti,
OH’, OH” closed
65 -156 0.007 61 -152 3.08
extended across
2’,4”, +anti,
+anti; OH anti;
OH’, OH” closed
133 156 0.43 141 153 2.82
extended across
2’,4”, +syn,
+anti; OH anti;
OH’, OH” closed
66 156 0.22 62 153 2.94
extended across
2,2’ and 2’,4”,
+anti, -anti; OH,
OH” closed, OH’
syn
159 -145 18.46
extended across
2,2’ and 2’,4”,
+anti, -syn; OH,
OH” closed, OH’
syn
158 -32 18.91
extended across
2,2’ and 2’,4”,
+syn, +syn;
OH, OH” closed,
OH’ syn
42 36 26.20
extended across
2,2’ and 2’,4”,
+anti, +anti;
OH, OH” closed,
OH’ syn
158 144 18.73 161 143 11.90
localized on the
first unit, +anti,
-syn; OH closed,
OH’ OH” anti
149 -58 7.26 157 -71 3.65
localized on the
second unit,
+anti, -syn; OH,
OH” anti, OH’
closed
148 -40 10.33 158 -54 2.24

- 98 -
localized on the
third unit, +anti,
-syn; OH OH’
anti, OH” closed
137 -52 7.74 146 -53 5.06
localized on the
first unit,+anti,
+anti, OH
closed, OH’ OH’’
anti
149 126 8.22 159 122 2.70
localized on the
second unit,
+anti, +anti;
OH, OH” anti,
OH’ closed
149 139 8.81 158 127 1.46
localized on the
third unit, +anti,
+anti; OH OH’
anti, OH” closed
138 139 9.30 146 134 4.17
1 The OH syn/anti, OH’ syn/anti, OH” syn/anti designations refer to the orientation of the
phenolic hydroxyl groups on each ring with respect to the indole nitrogen of the same ring
2-1656.294387 hartree
3Evolves to +anti, -syn; OH, OH’, OH” anti
4 -1656.191433 hartree
5 The OH closed/OH’ closed/OH” closed designations indicate the presence of a cyclic H-bond
between the phenolic hydroxyl group and the adjacent quinonoid carbonyl group on the
same ring
6 -1655.062432 hartree
7 -1654.973367 hartree

- 99 -
The most stable conformation of 17-quinone (17Q) (Figure 43) features an
interunit double bond with a N-C2-C2′-N′ dihedral angle of 165°, consistent with
previous results on the N-unsubstituted 2,2′-dimer.59
On the other hand, the most stable
tautomer of the quinone trimer (18Q) possesses only one inter-ring double bond on the
2,2′-biindole moiety (Figure 43).
The free energy change for the equation 17 + 18Q 17Q + 18 was estimated
as -1.19 kcal/mol (in vacuo) and as -0.12 kcal/mol following introduction of solvent
effects by means of the polarizable continuum model (PCM)52,53,76
in its united atom for
Hartree-Fock (UAHF) parametrization.51
On this basis, it was suggested that formation of 21 involves generation of 17-
quinone and its coupling with 18 via a 4,4′- type bonding (Scheme 9). The rigid 2,2′-
biindole moieties in the resulting pentamer would bring the two termini into close
proximity upon folding, thus favoring intramolecular cyclization after an additional
oxidation step.
Figure 43. Optimized structures of the most stable (in water) reduced
(QH2) and quinonoid (Q) forms of dimer 17 and trimer 18.
17, QH2, anti; OH, OH’ syn 17, Q, extended, anti; OH, OH’ closed
18, Q, extended across 2,2’, +anti, -anti; OH, OH’ closed, OH anti
18, QH2, +anti, +anti; OH, OH’, OH” anti

- 100 -
N
OH
OH
CH3
N N OH
OH
OH
OH
CH3
CH3
N
OH
OH
CH3
N
OH
OHCH
3
N
OH
OH
CH3
N N
OH
OH
OH
CH3
CH3
N
OH
OH
CH3
N
OH
OHCH
3
O
17Q + 18
oxidation
21 .
Scheme 9. Representative mechanism of formation of 21.

- 101 -
Some insights into 17-quinone was gained by pulse radiolytic oxidation of 17 (Figure
44), using the same methods as previously applied to the corresponding unmethylated
2,2′ dimer.59
The initial product formed 200 μs after the pulse was the semiquinone,
with a maximum around 460 nm (for the reaction of 17 with Br2-•, k = 3.5×10
8 M
-1 s
-1).
Figure 44. Changes in absorption at various times after pulse radiolysis of
an N2O-saturated aqueous solution of dimer 17: (♦)200 μs, (■) 1060 μs,
(▲) 4060 μs, (×) 8980 μs.
The transient species decayed by second order kinetics (2k = 3.6 × 10⁹ M
-1s
-1) to
a strongly absorbing chromophore (λmax= 600 nm, ε = 5.3 × 10⁴ M
-1 cm
-1) which was
attributed to the quinone based also on the good agreement with the computed
absorption maximum (584 nm) of the most stable conformer of 17Q in water
(Figure 45).
Quinone formation apparently involves disproportionation of the semiquinone, as
suggested by the isosbestic point at 480 nm and second order kinetics (Scheme 10).
0
0,1
0,2
0,3
0,4
0,5
0,6
0,7
360 460 560 660 760nm
AU

- 102 -
400 600 800Wavelength, nm
0
0.5
1
1.5
2
Ab
sorb
an
ce, arb
itra
ry u
nit
sA
400 600 800Wavelength, nm
0
0.5
1
1.5
2
Ab
sorb
an
ce, arb
itra
ry u
nit
s
B
Figure 45. A: spectra computed in vacuo; B: spectra computed in water
(PCM). Black line: 17Q, extended, anti; OH, OH’ closed; red line: 17Q,
extended, syn; OH, OH’ closed (see Table 4 for an explanation of the
nomenclature adopted).
No detectable self-coupling products (e.g., 19 or hexamers) were formed by co-
oxidation of equimolar amounts of 17 and 18. This would point to prevalent cross-
coupling pathways of 17 and 18, with the necessary caution imposed by the poor mass
balance and the abundant polymeric material interfering with product analysis.
N
OH
OMe
N
OH
OMe
17semiquinone species(460 nm)
17-quinone (600 nm)
-e-, -H+
2k = 3.6 x 10⁹ M-1s-1
disproportionation
pulse radiolysis
Scheme 10. Generation of 17-quinone by disproportionation of the semiquinone radical.

- 103 -
CONCLUSIONS
In this chapter I have disclosed the generation under biomimetic conditions of the
first cyclic 5,6-dihydroxyindole oligomer. Indole-based macrocyclic systems attract
increasing interest in relation to their conformational and self-association properties,
stacking interactions, spectroscopic features, cavity shape, and performance as ligands
or ion-sensing scaffolds.101
However, no macrocyclic structure built solely on indole
units was described in the literature. In this connection, the cyclic 5,6-dihydroxyindole
oligomer 22 (Figure 46), consisting of four units in an arrangement that contains an
inner porphyrin ring,24,102
has recently been proposed on a theoretical basis as a
fundamental building block accounting for the structural and spectral properties of
eumelanins.
NH
OHOH
NH
OH
OH
NH
OH OH
NH
OH
OH
22
Figure 46. The cyclic 5,6-dihydroxyindole oligomer recently proposed on a
theoretical basis to account for the structural and spectral properties of
eumelanins.
Unfortunately, verification of this hypothesis has been hampered by the notorious
difficulties in the investigation of the oxidative polymerization of 5,6-dihydroxyindoles,
the key step in eumelanin synthesis.97,101
The characterization of cyclic 5,6-
dihydroxyindole based oligomers has remained therefore a theoretical curiosity as well
as an experimental challenge in an intriguing field of research at the crossroads of
biology and materials science.97,103

- 104 -
The importance of the results described in this chapter lies mainly in the discovery
and characterization of an unprecedented indole-based structural motif of potential
academic and practical interest. For example, the modular assembly of 21 by 2,2′-
biindole-containing scaffolds highlights the bonding patterns and geometries required to
construct a five-membered indole macrocycle. The spontaneous oligomer-oligomer
coupling/cyclization pathway suggests, moreover, that macrocyclic structures like those
recently hypothesized24,102
are not entirely devoid of foundation and may contribute to
the patterns of structural diversity generated during 5,6-dihydroxyindole
polymerization.14b,24
The great versatility of 5,6-dihydroxyindole in terms of positional
reactivity would in principle allow for the formation of a diverse range of cyclic
structures during eumelanin buildup.
On the other hand the isolation of symmetrical oligomers by oxidation of 17
suggests the possibility of realizing melanic polymers with higher structural order.

- 105 -
CHAPTER V
Oxidative polymerization of 5,6-dihydroxyindole
in phosphate buffer/polyvinyl alcohol (PVA)
INTRODUCTION
The elucidation of the structure and mechanism of buildup of eumelanin is a most
challenging task because of the high molecular heterogeneity, the amorphous character
and the lack of solubility in common solvents which makes it impossible even to draw a
tentative description of the polymer at molecular level.
Recently, the importance of the structural organization of melanosomes, the
melanin-containing organelles, in determining pigment roles and functions has also
been emphasized.104,105
As a result of such investigations,105
it has become increasingly
clear that an understanding of the biological significance of melanin pigmentation is
strictly dependent on a detailed elucidation of the molecular composition, architecture
and surface properties of melanosomes. The latter is crucial to some of the key
properties and supposed functions of melanins, e.g. as organic semiconductors and
photoprotecting agents.103,106
The absorbance in the ultraviolet and visible is monotonic and broad-band that is,
it is featureless and fits a single exponential in wavelength space to a high degree of
accuracy (Figure 47). The exponential shape can be fitted by a sum of Gaussians with
full widths at half maxima characteristic of inhomogeneously broadened chromophores
at room temperature.16b,17

- 106 -
Figure 47. The broad-band absorption of eumelanin: the spectrum is
monotonic and fits an exponential in wavelength space (insert shows the
logarithmic–linear plot).
Dissecting the fundamental structural factors responsible for this absorption
spectrum and black color remains therefore a central goal of eumelanin research. In fact
it is an actively debated issue whether broad-band absorption is due to an extended
conjugated polymeric backbone or rather reflects a highly disordered system made up of
mixtures of π-staked oligomers. Whether the black chromophore of DHI-derived
synthetic eumelanins is due to the formation of a high molecular weight polymer with
extended electron delocalization or of mixtures of oligomers remains also a subject of
debate.
Although both scattering and molecular absorption effects have been reported to
contribute to the optical properties of eumelanin,5 current evidence suggests that the
black color of the pigment is mainly intimately associated with the multichromophoric
heterogeneous mixtures of species of different structures that are produced by the
oxidation of DHI and DHICA.
Early studies of DHI oxidation107
revealed the initial generation of a distinct
chromophoric species, termed melanochrome, with a maximum centered at 530 nm
attributed initially to 5,6-indolequinone and later to an oxidized oligomer (Scheme 11).

- 107 -
In all these studies, however, the efforts toward chromophore characterization were
thwarted by the exceedingly low solubility of the intermediate and final products, their
instability and the marked scattering effects that hindered spectrophotometric
investigations.
NH
OH
OH
NH
O
O
max = 292 nm max = 530 nm
DHI
dimers oligomers to polymer
max = 540 nm
5,6-indolequinoneblack color,broad band absorption
Scheme 11. Early hypothesis on the origin of spectral changes during DHI
oxidation.109
Some insight into the relationships between oxidation level, π-electron
delocalization and HOMO-LUMO gaps in DHI oligomers has derived from integrated
pulse radiolysis and computational investigations of the transient species generated by
oxidation of DHI and related oligomers,59,73
as well as from studies of the chromophoric
changes that occur along the oligomer sequence from the monomer to a tetramer. Other
information has been obtained from characterization of organic-soluble eumelanin-like
pigments from DHICA benzyl and octyl esters,108
as well as from a study of DHI
oxidation using a Cu(II) mimic of tyrosinase at low temperature.109
More recently, the development and characterization of the first water-soluble
DHI polymer110
obtained by oxidative polymerization of a thioglycosyl derivative of
DHI has yielded unprecedented insights into the origin of eumelanin black
chromophore. The results underscored the importance of the coexistence of reduced and
oxidized moieties for the visible absorption properties and black chromophore. Finally,
a reinvestigation of eumelanin supramolecular structure using low voltage-high
resolution transmission electron microscopy has lent further support to the conclusions
that the absorption spectra reflect more the intrinsic properties of the oligomers than
effects due to their aggregation in the solid state.111

- 108 -
Despite these and other advances, the characterization of visible light-absorbing
intermediates in the oxidative polymerization of underivatized DHI in aqueous solution
and in the absence of precipitation phenomena remains a most important goal for an
understanding of the origin of eumelanin absorption spectrum and optical properties.
A novel approach to elucidating eumelanin chromophore is based on a systematic
evaluation of the effect of various additives on the spectrophotometric course of DHI
oxidation. In this chapter I report the results of a study aimed at developing conditions
that could prevent oligomer and polymer precipitation in order to investigate
intermediate and final chromophores in the absence of scattering effects.

- 109 -
RESULTS AND DISCUSSION
In searching for additives capable of preventing aggregation and precipitation of
DHI oligomers/polymers in neutral aqueous solution, the attention was directed to
polymers with hydrophilic properties and functional groups capable of establishing
efficient interactions with the growing synthetic melanin. It was found that
polyvinylalcohol (PVA) was a suitable candidate combining good water solubility with
efficient emulsifying and surfactant properties.
Accordingly, the effects of PVA (27000 Da) on DHI oxidation in 0.1M phosphate
buffer, pH 7.0, were investigated using peroxidase/H2O2 as the oxidizing system and the
polymer up to 10% wt/wt. On visual inspection, oxidation led to the generation of dark
brown species that persisted in solution over prolonged periods of time without apparent
precipitation of solid material (Figure 48).
Figure 48. Synthetic eumelanin produced by peroxidase catalyzed
oxidation of 1: (A) in phosphate buffer pH 7.0, (B) 1% PVA w/w /
phosphate buffer pH 7.0.
A B
a

- 110 -
A systematic analysis showed that 1% wt/wt PVA was sufficient to prevent solid
separation during the reaction (as checked by filtration on a Millipore membrane).
Another test was carried out by centrifugation of solution at ca. 23000 g for 30 min at
4°C, as shown by the UV–Vis spectrum before and after centrifugation (Figure 49)
Figure 49. UV–Vis absorption of melanin solution in 0.1 M phosphate buffer,
pH 7.4, containing 1% wt/wt of PVA at 24 h from the beginning of the DHI
oxidation. (gray square, □) before centrifugation; (black line, —) after
centrifugation.
Spectrophotometric monitoring of the oxidation course revealed the development
of a broad band around 530 nm which remained virtually unchanged for 1 h or so and
then decayed slowly to give after several hours an almost featureless trace in the visible
region. This behavior was in marked contrast with that of a typical oxidation reaction
carried out in the absence of PVA, which showed the almost immediate precipitation of
a dark solid with marked scattering effects partly covering chromophoric features.
Generation of the 530 nm band was apparently related to the chemical events
underlying the transient chromophoric phase traditionally referred to as
“melanochrome”.2,107
Treatment of the dark reaction mixture with a reducing agent, e.g.
sodium borohydride or dithionite, led to the complete discoloration of the solution
0
0,4
0,8
1,2
1,6
250 350 450 550 650 750
AU
nm

- 111 -
(Figure 50) and a corresponding decrease in the visible absorption (Figure 51).
No significant effect of dithionite was observed on the black solid obtained in the
absence of PVA. It is noteworthy that a distinct absorption band was eventually
apparent in the UV region around 320 nm, typical of reduced oligomers, which was not
affected by the reductive treatment. This behavior supports previous observations110
suggesting the existence, along with oxidized quinonoid moieties, of reduced o-
diphenolic units within the pigment polymer.
Figure 50. (A) Synthetic eumelanin produced by peroxidase catalyzed
oxidation of 1 in phosphate buffer, pH 7.0, containing 1% PVA; (B) as (A),
after reduction with NaBH4.
A B
a

- 112 -
0,20
0,40
0,60
0,80
1,00
1,20
250 350 450 550 650 750
Au
nm
0
0,4
0,8
1,2
1,6
250 350 450 550 650 750
Au
nm
Figure 51 UV–Vis absorption profiles of H2O2 ⁄ peroxidase-promoted DHI
oxidation in 0.1 M phosphate buffer pH 7.4 containing 1% wt ⁄ wt of PVA.
Upper plot: (○) 1 min, (x) 5 min, (●) 15 min, (□) 30 min;
lower plot: (●) 1 h, (∆) 2 h, (—) 4 h, ( ▲) 6 h, (◊) 24 h (arrows denote the
trend with time); the profile after reduction of the mixture (24 h) with
sodium dithionite is also shown (*).

- 113 -
Virtually similar traces were obtained by increasing the PVA concentration up to
5% or using PVA of higher molecular weight (112000 Da) (data not shown).
The results in Figure 51 are of structural interest and support the fundamental role
of the redox state in the “black chromophore” of eumelanin-like pigments from DHI. In
particular, it appears that the individual components of the synthetic eumelanin polymer
possess intrinsic chromophoric features that depend on the oxidation state, and that
these chromophores are relatively stable under conditions preventing collapse into
separate particles.
In Figure 52 are reported kinetic experiments aimed at measuring the rates of
chromophore formation and decay in the presence of 1% PVA.
Data show that the visible absorption plateaus after ca 1 h and is not significantly
modified during the subsequent 2 h. Very similar kinetic and spectrophotometric
courses were observed with 5% PVA, suggesting that 1% additive is sufficient to
stabilize oxidized DHI polymers and that higher PVA concentrations do not influence
chromophore features and development.
Figure 52. Kinetic course of DHI oxidation in 1 % PVA as measured at
530 nm.
Based on spectrophotometric results, it is concluded that DHI oxidation leads in
the early stages to a transient quinone which is not detectable and is converted to
mixtures of dimers and other oligomers of low molecular weights containing quinonoid
moieties accounting for the 530 nm band59
(Scheme 12).

- 114 -
NH
OH
OH
NH
O
O
OH
NH
O
NH
OHO
NH
OH
OH
OH
NH
O
NH
OHO
max = 296 nm max = 530 nm
DHI dimers oligomers to polymer
broad band absorption in the visible
Scheme 12. Proposed origin of spectral changes during DHI oxidation.
Persistence of this band over unexpectedly long periods of time reflects probably
the presence in the growing oligomer chains of quinonoid chromophores spanning over
dimeric and trimeric substructures and separated by stereochemically enforced breaks of
inter-ring conjugation. This conclusion is supported by the following arguments: (1)
intense absorption bands above 500 nm have been detected in the pulse radiolysis
oxidation of DHI dimers;59
(2) oxidation of DHI in the cold with a biomimetic copper-
peroxo oxidant followed by warming at room temperature results in a broad and intense
absorption band around 580 nm, suggesting mixtures of oligomers at various levels of
oxidation or partially degraded, as indicated by mass spectrometric analysis;109
(3)
known oligomer structures from DHI feature inter-ring bondings that would hinder
coplanar conformations and extended electron delocalization over a high number of
units,58
much like the case of DHICA.112
To inquire into the effects of PVA on the mechanism of DHI polymerization,
oxidation mixtures were prepared by reacting 5 mM DHI and 20 mM H2O2 with
36 U mL−1
HRP in the presence and in the absence of added polymer. These mixtures
were then analyzed at various intervals of time by an established protocol involving
reduction with dithionite, acidification to pH 5, extraction with ethyl acetate and
acetylation.97
TLC analysis indicated in both cases a complex pattern of products
corresponding to oligomers of variable molecular size. Product distribution, as apparent
from TLC analysis, markedly changed with reaction time, reflecting the gradual
conversion of the initial oligomers into more polar species of supposedly high
molecular weight. The partial oxidative breakdown of indole units may also play a role
in determining the complexity of reaction mixtures.2,109
A relatively abundant low

- 115 -
molecular weight fraction could be recovered when the oxidation reaction was halted
and worked up in the early stages (e.g. 1 min). This fraction contained two main species
which were isolated and identified on the basis of NMR and MS data as the 2,4′-
biindole 3 and the 2,7′-biindole 4, which appear to be obligatory intermediates in the
oxidative polymerization of 1 in phosphate buffer at pH 7.0. Dimer 3 usually occurs in
greater amounts than dimer 4106
so it was of interest to find that in the presence of 5%
PVA a marked alteration in the dimer formation ratio occurred, with a significant
prevalence for 4, as observed from HPLC analysis. (Figure 53).
Figure 53. Percent molar yields (HPLC quantitation) of products 4 (gray)
and 3 (black) obtained by DHI oxidation with peroxidase/H2O2 in phosphate
buffer 0.1 M pH 7.0 and phosphate buffer/PVA.
A similar variation in product formation with medium was previously observed in
the presence of organic solvents, such as methanol, ethanol, THF or acetone. For
example, 75% acetone subverted the 3/4 product ratio from ca 1.6 to ca 0.3. Thus, the
effect of PVA reported herein not only definitively supports the influence of the polarity
of the medium on the chemical course of DHI polymerization and its coupling mode,
but also provides an indirect demonstration of the active role of the polymer during DHI
oxidation. Clearly, there is scope for further work to establish precisely the effects of
PVA on the rate and mode of formation of higher oligomers.
0
2
4
6
8
10
12
14
16
Yie
lds
No PVA added PVA added

- 116 -
Previous detailed investigations of solvent effects on the aggregation behavior of
PVA113
have shown that water is a poor solvent for PVA molecules and the polymer
chains would be largely unperturbed coils. Weak H-bonding is expected between PVA
and water, whereby the polymer coils would be arranged midway between extended and
collapsed conformations. They would therefore be capable of wrapping the growing
indole chains thus affecting the oxidative polymerization process. Besides acting as a
disaggregating agent, PVA may thus establish effective hydrophobic interactions
driving the reactivity of quinonoid intermediates. Along these “hydrophobic tracks,”
growing DHI oligomers might be somewhat shielded from both extensive water
solvation and mutual interactions, thus exhibiting stable chromophoric features devoid
of scattering effects. In this regard it is noteworthy that PVA concentrations as low as
1% serve to completely prevent synthetic eumelanin from precipitating, and higher
PVA concentrations induce little or no further effect. We have established that PVA and
other solvents exert regiocontrol over DHI coupling. One ponders whether it is possible
in future work to tailor the properties of eumelanin by the fine modulation of pigment
aggregation. The incorporation of stabilized eumelanin-type chromophores into PVA
films or gels is another possible extension of this study for practical applications.

- 117 -
CONCLUSIONS
This chapter reports a novel experimental approach to the direct investigation of
eumelanin-related chromophores which relies on the discovery of the efficient oligomer
solubilizing properties of 1–10% PVA in phosphate buffer. By this approach I have
shown that the initial chromophoric phases of DHI oxidation are due to absorbing
species which persist in solution for a relatively long time indicating relatively stable
mixtures of oligomers. This is the first spectrophotometric characterization of oxidized
DHI oligomers as such (i.e. without derivatization) in the absence of precipitation and
scattering. Interestingly, the addition of PVA, like other organic modifiers, has been
found to significantly affect product distribution at the dimer stage, which may provide
a new means of controlling the properties of the final polymer. Moreover, the
absorption profile of the final polymer is similar to that of suspensions of synthetic DHI
melanins except for the lack of scattering effects, suggesting that the latter are not the
key determinant of the spectral features of eumelanin, in line also with recent
conclusions by a different approach.111
As a most relevant finding, I have finally shown
that the polymer absorption spectrum can be significantly modified in the visible region,
but not at the main UV band (320 nm), after a reductive treatment, corroborating the
notion that the coexistence of reduced and oxidized components is critical for
broad- band absorption and the dark chromophore.110
- 118 -
CHAPTER VI
Study of oxidative polymerization of 5,6-dihydroxyindole (1) by Dinamic
Light Scattering
(DLS) and Small-angle Neutron Scattering (SANS)
INTRODUCTION
As mentioned in previous chapters, eumelanin structure is still little
understood.5,74, 103
Pending issues include the bonding modes of the base units, the basic
three-dimensional structure of the pigment particle, and the average molecular weight.
In order to investigate the fundamental mechanism of eumelanin formation,
Dynamic Light Scattering (DLS) and Small-angle Neutron Scattering (SANS)
experiments were performed on the oxidation behavior of its precursor 1. The reaction
was studied in phosphate buffer without or with PVA that, as previously described,
inhibits precipitation of the eumelanin polymer. In this chapter are reported the results
of preliminary experiments carried out in collaboration with the group of Prof. L.
Paduano of the University of Naples “Federico II”.
DLS (also known as Photon Correlation Spectroscopy-PCS or Quasi-Elastic Light
Scattering-QELS) is a technique which can be used to determine the size distribution
profile of small particles in suspension or polymers in solution while SANS can give
information about the size, shape and orientation of structures in a sample.
Details of the fundamental principles of these techniques are given in the following.

- 119 -
INTRODUCTION TO LIGHT SCATTERING
A light beam crossing a polarizable medium undergoes the phenomenon of light
scattering in all directions due to local inhomogeneities. These are formed by the
aggregates present in solution, that represent the scattering centers (scatterers) and,
being larger than the particles of solvent, give a stronger signal than the background of
scattered light from the solvent.114
In a microscopic description of the phenomenon, when light interacts with matter,
the electric component of electromagnetic radiation induces an electronic polarization,
and the resulting oscillating dipoles become secondary sources of light (scattered light).
When the light source is a monochromatic incident laser beam, one can observe a
fluctuation of scattering intensity (Is) which depends on the time.
The scattered light is subject to phenomena of constructive and destructive
interference, due to the presence of other particles nearby in the solution; therefore,
variations observed in the scattered intensity can provide information concerning the
reciprocal movement of the aggregates in solution.
A schematic representation of the scattering process is reported in Figure 54.
Figure 54. Schematic representation of scattering process.

- 120 -
An incident monochromatic laser beam of wavelength λi and wavevector irradiates the scattering volume Vs containing N particles. The scattered light, with
wavevector , is observed at a scattering angle θ.
The scattering vector q is defined as the vector difference between the two
wavevectors (Figure 54).
In elastic scattering, which is predominant in the DLS experiments, the impact of
photons occurs without changes in energy and then
where λ is the laser wavelenght in vacuum and n is the refractive index of the solution.
Scattering light intensity (IS) is a complex function that depends on many factors
and can be described by the following relation
where I0 is incident light intensity, λ its wavelenght in vacuum, n0 and n are the
refractive indexes of the solvent and solution respectively, n C is the refractive
index increment, N is the number of scattering particles in the irradiated volume, R is
the radius of the particles , P (Q) and S (Q; C) are the form factor and structure factor
respectively.
P (Q) provides useful information on the form and structure of macromolecules in
solution while S (Q; C) take into account the effects of interference between the
particles, so it depends on concentration (for dilute solutions S ≈ 1) and allows for an
assessment of the structure of the solution.

- 121 -
In a diluted sample in which aggregates can act as scatterers, the scattered light
intensity depends on several parameters:
the optical contrast factor compared to the solvent (refractive index of the particles);
the considered angle of measures;
number, size and shape of particles;
relative position of particles;
Specifically, the signal characteristic of the suspended particles can be detected
experimentally only if their refractive index is sufficiently different from that of the
solvent.
For this purpose often is introduced the relative index of refraction:
where subscripts p and s are related to particles and solvent respectively.
Particle/solvent systems with relative refractive index very close to 1 will be
hardly visible in a light scattering experiment, since the aggregates will produce a weak
signal compared to the background of light scattered by molecules of the solvent. (4)
Assuming spherical particles, the concentration (N) and size (and hence
polarizability, R6) dependence shows the dependence of the scattered light from
extensive properties such as the scatterers number and the volume of material that
diffuses the light (Volume2 or R
6).
In the case in which factors S(Q,C) e P(Q) are close to 1 (diluited solutions and
particles that are small in comparison to the incident radiation wavelength), the
scattered light varies with the sixth power of the radius of the involved particles.
Within the approximations made, in conditions of elastic scattering (Rayleigh
regime), a particle with a radius of 50 nm diffuses light a million times more than a
particle having a radius of 5 nm. Therefore the technique is more sensitive to the
presence of large particles, rather than small.
Focusing on the dependence of scattering from scattering angle, we have:
where S(Q;C) takes into account interference between particles, providing information
regarding the distribution of aggregates in space, while P(Q) models the effect of the

- 122 -
shape of the particle, and is important only if particle size is comparable to the radiation
wavelength λ.
Particles with sizes much smaller than λ can be considered point-like, so that P → 1 and
the diffused radiation is isotropic. In contrast, particles of a size comparable to the
radiation wavelength λ, are characterized by an angular dependence of the scattered
light, which can be predicted on the basis of the shape of such particles.

- 123 -
DYNAMIC LIGHT SCATTERING (DLS)
In a DLS experiment the fluctuations of the scattered light intensity, originated by
Brownian motions of particles, are measured as a function of time at a constant
scattering angle.
The temporal variation of the intensity is measured and represented usually
through the so-called intensity autocorrelation function.
In practice, temporal fluctuations of the scattered light are recorded and analyzed
through by estimating the time correlation function of the electric field
where Es (t) and Es (t + τ) represent the electrical field intensity of the scattered light at
time t and (t + τ) and described the correlation level of a dynamic quantity in a delay
time τ. This function is obtained by the intensity autocorrelation function:
The two functions are correlated by Siegert relation115
Where β is the coherence factor, which accounts for deviation from ideal correlation and
depends on the experimental geometry.
For a monodisperse system, will decay as a single exponential function
with a characteristic relaxation time τ:116
whereas for a polydisperse system will be multiexponential
where q is the scattering vector, D is the mutual diffusion coefficient, the subscript j
indicate particles of different size present in solution and the weights Wj are related to
particles concentration and their molecular weight.
Measuring the relaxation rate G = 1/τ from the first moment of the relaxation time
distribution, from its value is possible to estimate the apparent translational diffusion
coefficient D, through this relation:117

- 124 -
D is, thus, obtained from the slope of G as a function of q2, where G is measured at
different scattering angles.
Finally, using the Stokes–Einstein equation,118,119
the value of the hydrodynamic
radius (Rh) of the equivalent sphere can be determined from
valid for infinite dilute dispersions, where η is the solvent viscosity, kB the Boltzmann
constant and T the absolute temperature.
In Figure 55 is reported a schematic representation of a DLS experiment.
Figure 55. Schematic representation of a DLS experiment.

- 125 -
SMALL ANGLE NEUTRON SCATTERING (SANS)
SANS is a small angle scattering technique that exploits the wave-particle duality
of the neutron and its unique nuclear properties to provide information about the size
(length scale varies from 1 to 1000 nm) and shape of molecules and their assemblies.
In SANS, the scattering vector is used to describe the relationship between the
incident and the scatter wavevectors. Its module, q , is the independent variable in a
SANS experiment and has magnitude q = 2πsin(θ/2)/λ and dimensions of
(length)-1
.
By combining q with the Bragg law of diffraction, one obtains the simple and
useful relationship d = 2π/ q, from which the molecular-level length scale ( d ) at any
accessible q can be obtained. The dependent variable in a SANS experiment is the
differential scattering cross-section, dΣ/dΩ, improperly also called intensity of
scattering I (q) . The scattering cross-section dΣ/dΩ contains information on
interactions, size and shapes of aggregates present in the system, and can be expressed
for a collection of monodisperse bodies as120
where np represents the number density of the scattering object present in the system,
P(q) and S(q) are respectively the form and the structure factor of the scattering
particles, whereas (dΣ/dΩ)inch, takes into account for the incoherent contribution to the
cross-section measured, mainly due to the presence of hydrogenated molecules, that has
no angular dependence. The form factor contains information on the shape of the
scattering objects, whereas the structure factor accounts for inter-particle correlations
and is normally important for concentrated or charged systems. Provided that solutions
are quite dilutes (c < 10-3
mol kg-1
) the structure function S (q) can be approximated to
the unity, and the scattering cross-section is reduced to

- 126 -
By applying the appropriate model to experimental SANS data, chosen on the
basis of the characteristics of the graph I(q) vs. q, is possible to obtain the
microstructural parameters of the aggregates.
The models used for fitting of graphs with a linear section of slope -2, as those
obtained in the experiments reported in this thesis, consider analyzed objects as infinite
planar sheets of thickness d, because in the characteristic SANS q range (10-3
Å ÷ 1Å) it
is not possible detect the curve plateau.
The model adopted is therefore based on the following wording of the form
factor:121
where (ρv - ρ0) is the difference between the scattering density of particles and that of
the solvent, τ is the thickness of the plane and S is the flat surface per volume unit.

- 127 -
RESULTS AND DISCUSSION
In a DLS experiment analysis of the intensity fluctuations allows determination
of the distribution of diffusion coefficients of the particles which are converted then into
a size distribution using established theories.118,122
A solution of 1 in phosphate buffer exposed to an oxidizing atmosphere readily
develops a brown coloration. However, DLS measurements require light-colored
samples in order to prevent the decrease of the incident light intensity due to absorption.
After several tests, an initial concentration of 1 0.1 mM was selected as suitable for
DLS measurements. A solution of 1 at this concentration in phosphate buffer was
treated with peroxidase/H2O2 and, after filtration, the oxidation was followed by DLS.
Data showed that the hydrodynamic radius Rh increased from an initial value of about
300 nm at 1 min from the addition of oxidant to reach ~ 1200 nm in about 1 hour
(Figure 56).
This shows that the largest size that the eumelanic polymer can reach before
precipitation corresponds to an Rh value of about 1200 nm.
Figure 56. Hydrodinamic radii obtained by means of DLS technique (▲)
and absorbance measured at 530 nm (●) for the oxidative process of 1 with
peroxidase/H2O2 in phosphate buffer in the absence (left pannel) and in the
presence (right pannel) of PVA 0.1 w/w.
0.0 0.5 1.0 1.5 2.0
0
10
20
30
40
50
60
70
80
90
100
110
120
0.00
0.05
0.10
0.15
0.20
0.25
0.30
0.35
0.40
DHI 0.1mM PVA (M.W. 27000 amu) 0.1 w/w in phosphate buffer 0.1M pH 7.4
Peroxidase 7 units, H2O
2 15 eq.
Ab
s5
30
nm
Rh/
nm
Elapsed Time / h
0.0 0.5 1.0 1.5 2.0 2.5
200
400
600
800
1000
1200
1400
1600
1800
0.0
0.1
0.2
0.3
0.4
0.5
0.6
DHI 0.1mM in phosphate buffer 0.1M pH 7.4.
Peroxidase 7 units, H2O
2 15 eq.
Data: Data1_B
Model: Langmuir
Weighting:
y No weighting
Chi^2/DoF = 7420.91319
R^2 = 0.95478
y0 414.2297 ±36.88671
A 1278.68406 ±212.45849
B 0.56133 ±0.17052
Rh/
nm
Elapsed Time / h
Indolo 0.1mM + enzima + H2O2 + tampone
Ab
s 5
30
nm
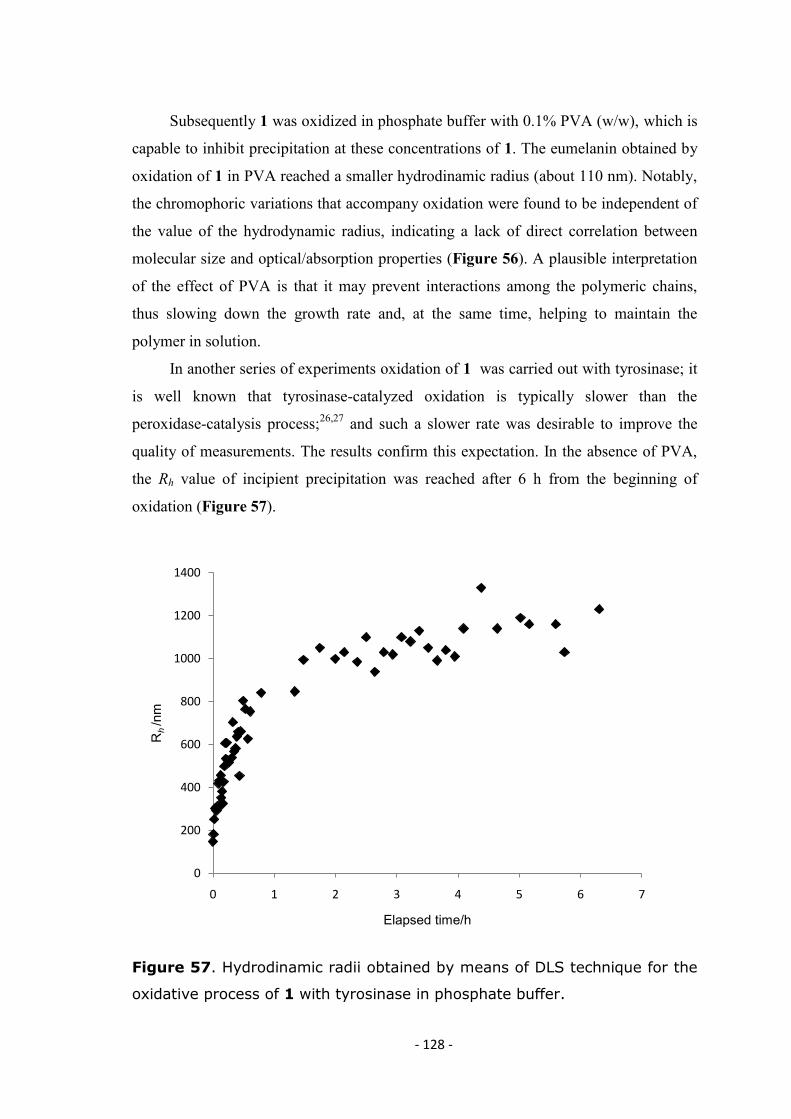
- 128 -
Subsequently 1 was oxidized in phosphate buffer with 0.1% PVA (w/w), which is
capable to inhibit precipitation at these concentrations of 1. The eumelanin obtained by
oxidation of 1 in PVA reached a smaller hydrodinamic radius (about 110 nm). Notably,
the chromophoric variations that accompany oxidation were found to be independent of
the value of the hydrodynamic radius, indicating a lack of direct correlation between
molecular size and optical/absorption properties (Figure 56). A plausible interpretation
of the effect of PVA is that it may prevent interactions among the polymeric chains,
thus slowing down the growth rate and, at the same time, helping to maintain the
polymer in solution.
In another series of experiments oxidation of 1 was carried out with tyrosinase; it
is well known that tyrosinase-catalyzed oxidation is typically slower than the
peroxidase-catalysis process;26,27
and such a slower rate was desirable to improve the
quality of measurements. The results confirm this expectation. In the absence of PVA,
the Rh value of incipient precipitation was reached after 6 h from the beginning of
oxidation (Figure 57).
Figure 57. Hydrodinamic radii obtained by means of DLS technique for the
oxidative process of 1 with tyrosinase in phosphate buffer.
0
200
400
600
800
1000
1200
1400
0 1 2 3 4 5 6 7
Rh /n
m
Elapsed time/h

- 129 -
In the presence of PVA (0.1%, w/w), the initially detected Rh value of ~ 30 nm
gradually increased to about 100 nm over the time span of 5 hours. In subsequent
experiments, it was noted that even lower concentrations of PVA (down to 0.01%, w/w)
were able to inhibit the precipitation of polymer. A series of measurements at different
PVA percentages was then carried out, and it was observed that the kinetics of growth
of eumelanin slowed and the hydrodynamic radius of the aggregates decreased with
increasing concentration of PVA. Figure 58 shows data for the four PVA
concentrations studied: 0.01%, 0.05%, 0.1% and 0.5%, w/w.
Figure 58. Hydrodinamic radii obtained by means of DLS technique for the
oxidative process of 1 with tyrosinase in phosphate buffer with several PVA
percentages w/w: (▲) 0.01%, (−) 0.05%, (●) 0.1%, (■) 0.5%.
20
40
60
80
100
120
140
160
0 1 2 3 4 5 6
Rh /n
m
Elapsed time/ h

- 130 -
In all DLS experiments performed a single distribution of Rh shifted gradually to
higher values (Figure 59). Failure to detect multiple hydrodynamic radii may indicate
that growth of the polymer occurs sequentially.
Figure 59. Rh distributions determined by means of DLS technique at two
different times.
In order to gain more information on the polymerization process, SANS
measurements were then performed.
The measurements were carried out in deuterated phosphate buffer in order to
minimize the incoherent scattering contribution to the total cross section; substrate
concentrations were larger than in DLS measurements, on account of instrumental
sensitivity.
As shown by the DLS experiments, in the presence of PVA the eumelanic
polymer grew to a certain size within a few hours and then remained “stable” for days.
SANS measurements were performed at 24 hours from the beginning of the oxidation to
make sure that the system was in a stable condition. A graph of scattering intensity I(q)
vs. scattering vector q shows a power law of -2 at low q: this hints that the final polymer
is a two-dimensional object, such as a plane or a disk. Based on this model, a thickness
of 44 ± 4 nm could be estimated. Furthermore, since d = 2π/ q, the presence of small
5 min 3 h

- 131 -
oligomers (less than about 30 nm) was ruled out by the fact that no peaks were observed
at values over 0.01Å-1
. Several different concentrations of PVA were tested, but all
samples analyzed showed a rather uniform behavior (Figure 60). No further
information concerning polymer size could be deduced from these measurements
because of instrumental limitations.
SANS data obtained in the absence of PVA at 2 min after oxidant addition
produced a graph of I(q) vs. q similar to that recorded in the presence of PVA; in
particular, a power law of -2 at low values of q, and the absence of peaks at high values
(0.01-0.1 Å-1
) (Figure 61). The curvature of the graph obtained in the absence of PVA
may be traced back to the fact that the measurement was performed at 2 min after the
beginning of the oxidative polymerization process, when the largest objects in the
mixture were still modest in size.
Overall, the SANS data are in agreement with a growth model of the polymer
consisting in the consecutive addition of low molecular weight units; the observed lack
of small objects is particularly significant in this respect.
Figure 60. Scattering Intensity vs. scattering vector obtained by SANS
technique for the oxidative process of 1 with tyrosinase at 24 hours in
phosphate buffer with several PVA percentage w/w: (■) 0.05%, (▲) 0.1%,
(○) 0.2%.
0,01
0,1
1
10
0,001 0,01 0,1 1
I(q)/
cm
-1
q/Å-1

- 132 -
Figure 61. Scattering intensity vs. scattering vector obtained by SANS
technique for the oxidative polymerization of 1 with tyrosinase in phosphate
buffer without PVA at 2 min (■) and with PVA (0.01% w/w at 24 h (▲).
0,001
0,01
0,1
1
10
100
0,001 0,01 0,1
I(q)/
cm
-1
q/Å-1

- 133 -
CONCLUSIONS
Fom DLS experiments it was inferred that the eumelanic polymer grows
sequentially until it reaches such a size that it can no longer remain in solution (Rh ~
1200 nm), at which stage it precipitates out. Such precipitation is inhibited in the
presence of PVA: in these conditions, smaller polymer sizes can be reached.
The SANS measurements showed that the polymer has a two-dimensional
structure, such as a flat or a disk; it was not possible to detect oligomers consisting of a
small number of monomers in the mixture.
In summary, the growth process of the polymer should be of the type:
Eumelanin n-1 + n = eumelanin n
where n is an oligomer consisting of 1 to 5 monomer units, that cannot be detected by
the instrumentation adopted.

- 134 -
CHAPTER VII
Computational investigation of the stability of DHI-related catechols, radicals, and
quinonoid forms
INTRODUCTION
Another topic addressed during the PhD study concerns the computational
stability of the radical and quinone forms of DHI (1) and related catechols. The
chemical and spectroscopic characterization of 5,6-indolequinones and their
semiquinones, key transient intermediates in the oxidative conversion of 5,6-
dihydroxyindoles to eumelanin biopolymers, is a most challenging task.
The unstable semiquinone and quinone species produced by oxidation of DHI and
related compounds have been detected in previous studies by the pulse radiolysis,73,123
technique that allows the recording of UV-vis spectra in a time comparable to the
lifetime of these species. In pulse radiolysis experiments, the oxidizing species Br2.-
is
generated by irradiating N2O-saturated solutions of KBr. Br2.-
radicals are formed within
0.1 μs after the radiation pulse according to the following equations
H2O e-aq + OH
.
e-aq + N2O + H2O → OH
. + N2 + OH
-
OH. + Br
- → OH
- + Br
.
Br. + Br
- → Br2
-.
This technique allowed to record the first transient spectrum at such time that the
buildup of initial radical absorption was complete and that subsequent decay had not
proceeded to ant significant extent.
DHI is converted by one-electron oxidation into an unstable semiquinone that
decays with second order kinetics (2k = 3.0 x 10⁹ M
-1 s
-1) to give a chromophore at 450
nm (Figure 62).123

- 135 -
Figure 62. Absorption changes 14 μs (○) and 864 μs (▲) after pulse
radiolysis of an N2O-saturated aqueous solution of 3.0 x 10⁻⁴ M DHI in the
presence of 0.1 M KBr and 0.01 M phosphate buffer, pH 7.0.123
Similarly, from 5,6-dihydroxy-3-iodoindole a semiquinone is obtained that decays
with second-order kinetics (2k = 1.1 × 10¹⁰
M-1
s-1
) to give a chromophore with broad
absorption bands centered around 600 and 750 nm.73
Commonly it is believed that the semiquinone decays with a disproportionation
mechanism to give an o-quinone in equilibrium with its tautomeric quinonmetide and
quinonimine forms (Scheme 13).
Scheme 13. Disproportionation mechanism of DHI radical.
NH
O
O NH
OH
OHNH
O
OH
2+
.

- 136 -
However, the position of the absorption maximum computed for the
5,6-indolquinone71
(280 nm) does not seem to be compatible with the
spectrophotometric course of the reaction under the conditions of pulse radiolysis
experiments.
These results may be of relevance in connection with the interpretation of the
chemical course of pulse radiolysis experiments involving oxidation of DHI and related
catechols.

- 137 -
RESULTS AND DISCUSSION
The mechanism of bimolecular decay of semiquinones derived from
dihydroxyindoles has been investigated by computational methods. The
dihydroxyindoles considered are shown in Figure 63:
OH
OH N
H
OH
OH N
H
COOH
OH
OH N
H
I
OH
OH N
H
CH3
CH3
OH
OH N
CH3
5,6-dihydroxyidole (DHI)
5,6-dihydroxy-3-iodoindole (3-IODO-DHI)
5,6-dihydroxyindole-2-carboxylic acid (DHICA)
5,6-dihydroxy-2,3-dimetyl-idole (2,3-dimetyl-DHI)
5,6-dihydroxy-1-methyl-indole N-Me-DHI
Figure 63. Structures of dihydroxyindoles investigated by computational
methods
For each species examined different tautomers / conformers have been explored,
whose geometries were optimized at the DFT level with the hybrid functional PBE032b
and a reasonably large basis set [6-31+G(d,p)]99
; the unrestricted formulation was
adopted to describe radical species. The calculations were performed both in vacuum
and in aqueous environment, modeled by the polarizable continuum model
(PCM).52,53,76
Selected single point energy evaluations were also performed at the
PBE0/6-311++G(2d,2p) level. Energies and free energies calculated for each specie are
reported in the following tables (Table 6, 7, 8, 9, 10).

- 138 -
Table 6. Relative energies and free energies for several tautomers /
conformers of DHI. Data are reported in kcal mol-1
DHI Energy [Evac]
Free
energy [Gvac,RRHO]
PCM free
energy [GPCM]
PCM free
energy [GPCM,RRHO]
Energy
(large base) [Evac]
QH2
5-OH anti, 6-OH anti
NH
O
O
H
H
0.0a
0.0b
0.0c
0.0d
0.0e
5-OH syn, 6-OH syn
NH
O
O
H
H
1.0 0.8 0.2 0.4
5-OH anti,
6-OH syn
NH
O
O
H
H
5.1 5.1 2.2 2.5
Q
quinone
NH
O
O
0.0f
0.0g
0.0h
0.0i
0.0l
quinonemethide
N
O
O
H
0.6 1.4 7.6 8.2
quinonimine
4.9 5.4 12.4 12.7
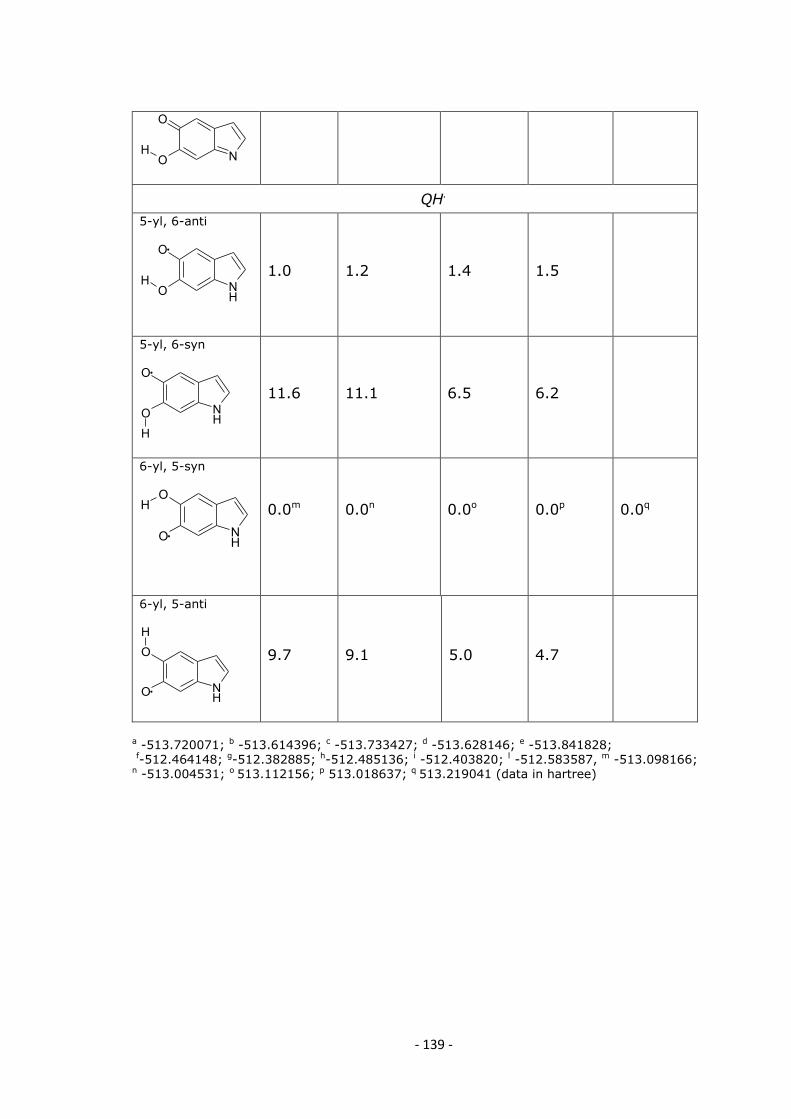
- 139 -
N
O
OH
QH.
5-yl, 6-anti
NH
O
OH
1.0 1.2 1.4 1.5
5-yl, 6-syn
NH
O
O
H
11.6 11.1 6.5 6.2
6-yl, 5-syn
NH
O
O
H
0.0m
0.0n
0.0o
0.0p
0.0q
6-yl, 5-anti
NH
O
O
H
9.7 9.1 5.0 4.7
a -513.720071; b -513.614396; c -513.733427; d -513.628146; e -513.841828; f-512.464148; g-512.382885; h-512.485136; i -512.403820; l -512.583587, m -513.098166; n -513.004531; o 513.112156; p 513.018637; q 513.219041 (data in hartree)

- 140 -
Table 7. Relative energies and free energies several tautomers /
conformers of DHICA. Data are reported in kcal mol-1
DHICA PCM free energy [GPCM]
PCM free energy [GPCM,RRHO]
PCM free energy (large base) [GPCM]
QH2
carboxylate, 5-OH anti, 6-OH anti
NH
O
O
H
H O
O
0.0a
0.0b
0.0c
carboxylate, 5-OH syn, 6-OH syn
NH
O
OO
OH
H
0.2 0.4
carboxylate, 5-OH anti, 6-OH syn
NH
O
OO
O
H
H
2.2 2.2
Q
carboxylate, quinone
NH
O
OO
O
0.0d
0.0e
0.0f
carboxylate, quinonemethide, planar
N
O
OO
OH
10.8 Saddle point
carboxylate, quinonemethide, staggered
N
O
O
H O
O
9.9 10.1
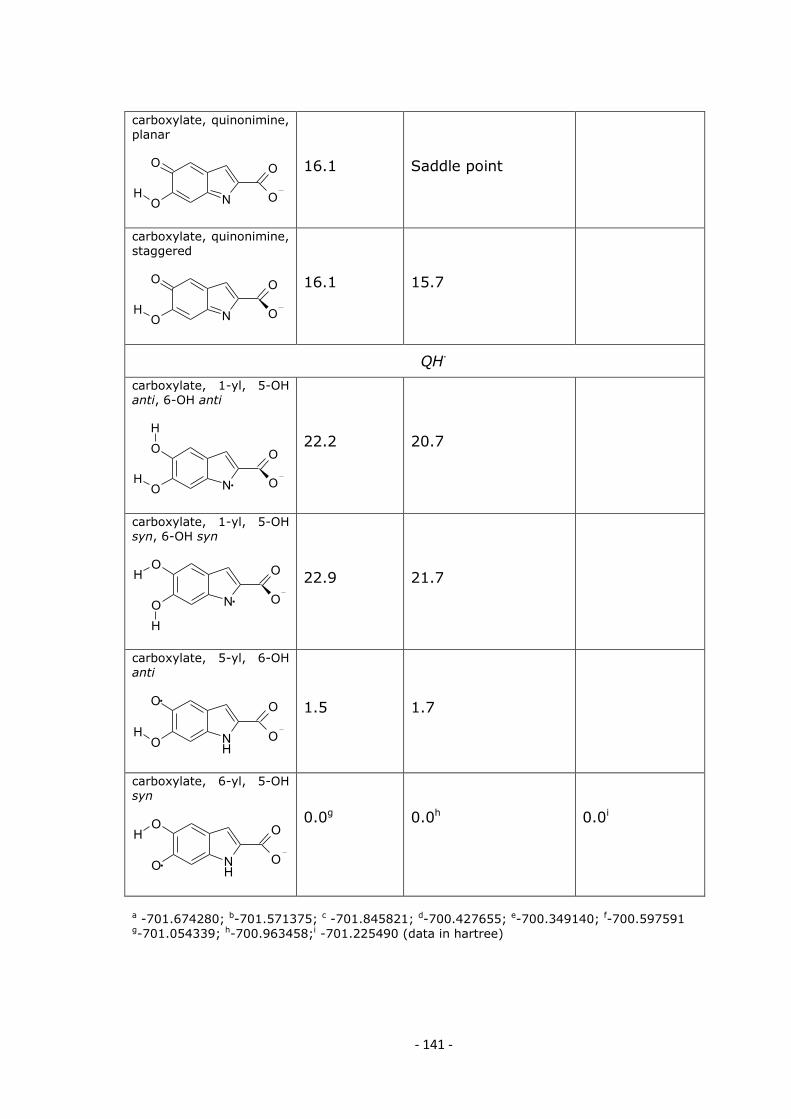
- 141 -
carboxylate, quinonimine, planar
N
O
OO
O
H
16.1 Saddle point
carboxylate, quinonimine, staggered
N
O
O
O
OH
16.1 15.7
QH∙
carboxylate, 1-yl, 5-OH anti, 6-OH anti
N
O
O
O
OH
H
22.2 20.7
carboxylate, 1-yl, 5-OH syn, 6-OH syn
N
O
O
O
O
H
H
22.9 21.7
carboxylate, 5-yl, 6-OH anti
NH
O
OO
O
H
1.5 1.7
carboxylate, 6-yl, 5-OH syn
NH
O
O O
OH
0.0g
0.0h
0.0i
a -701.674280; b-701.571375; c -701.845821; d-700.427655; e-700.349140; f-700.597591 g-701.054339; h-700.963458;i -701.225490 (data in hartree)

- 142 -
Table 8. Relative energies and free energies for several tautomers /
conformers of 3-iodo-DHI. Data are reported in kcal mol-1
3-iodo-DHI Energy [Evac]
Free energy [Gvac,RRHO]
PCM free energy
[GPCM]
PCM free energy [GPCM,RRHO]
QH2
5-OH anti, 6-OH anti
NH
O
O
H
H
I
0.0a
0.0b
0.0c
0.0d
5-OH syn,
6-OH syn
NH
O
O
H
H
I
1.4 1.2 0.2 0.3
5-OH anti, 6-OH syn
NH
O
O
H
H I
5.2 5.2 2.2 2.4
Q
Quinine
NH
O
O
I
2.8 2.0
0.0e
0.0f
quinonemethide, 5-OH syn
N
O
O
H
I
0.0g
0.0h
4.8 5.3
quinonemethide, 7.4 7.0 8.3 8.6
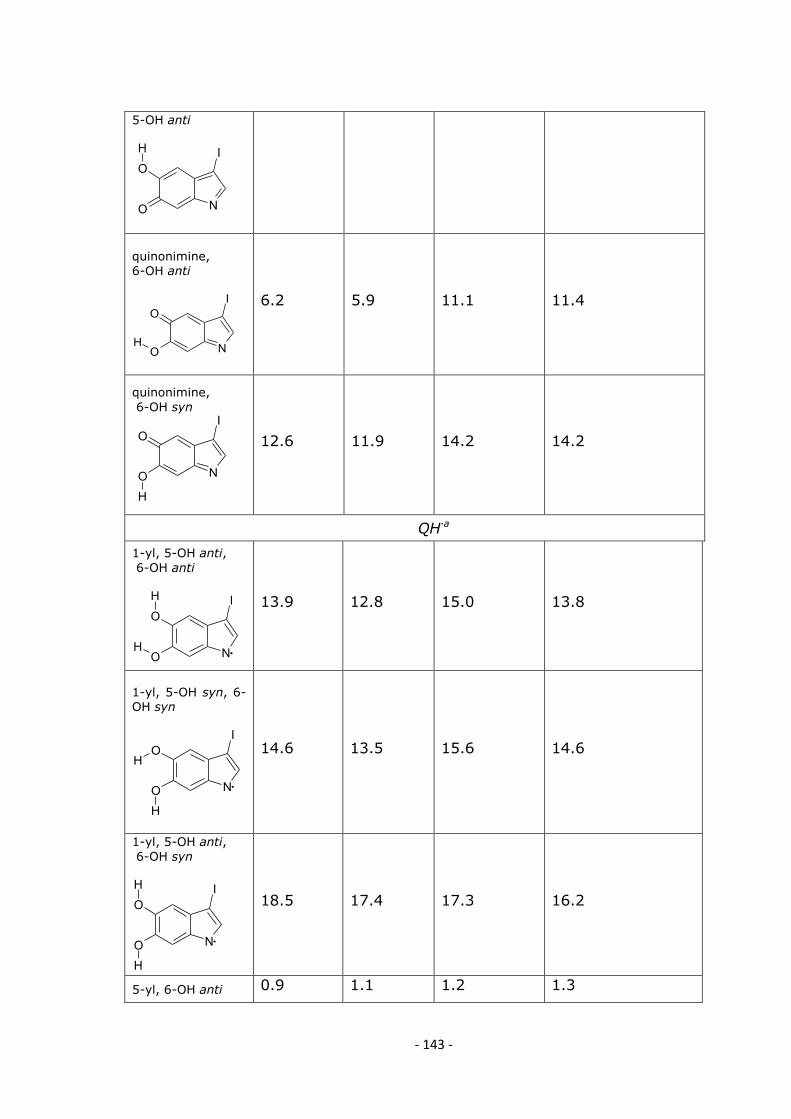
- 143 -
5-OH anti
N
O
O
IH
quinonimine, 6-OH anti
N
O
OH
I
6.2 5.9 11.1 11.4
quinonimine,
6-OH syn
N
O
O
I
H
12.6 11.9 14.2 14.2
QH∙a
1-yl, 5-OH anti,
6-OH anti
N
O
OH
H I
13.9 12.8 15.0 13.8
1-yl, 5-OH syn, 6-OH syn
N
O
O
H
H
I
14.6 13.5 15.6 14.6
1-yl, 5-OH anti,
6-OH syn
N
O
O
H
H I
18.5 17.4 17.3 16.2
5-yl, 6-OH anti 0.9 1.1 1.2 1.3

- 144 -
NH
O
OH
I
5-yl, 6-OH syn
NH
O
O
H
I
11.4 11.0 6.2 6.0
6-yl, 5-OH syn
NH
O
O
H
I
0.0i
0.0l
0.0m
0.0n
6-yl, 5-OH anti
NH
O
O
H I
9.3 8.7 4.9 4.6
a-524.532738; b524.441171; c-524.546393; d-524.454964; e-523.293643; f-523.226692; g-523.277158; h-523.209055; i-523.908182; l-523.828975; m-523.92244; n-523.843128 (data in hartree)
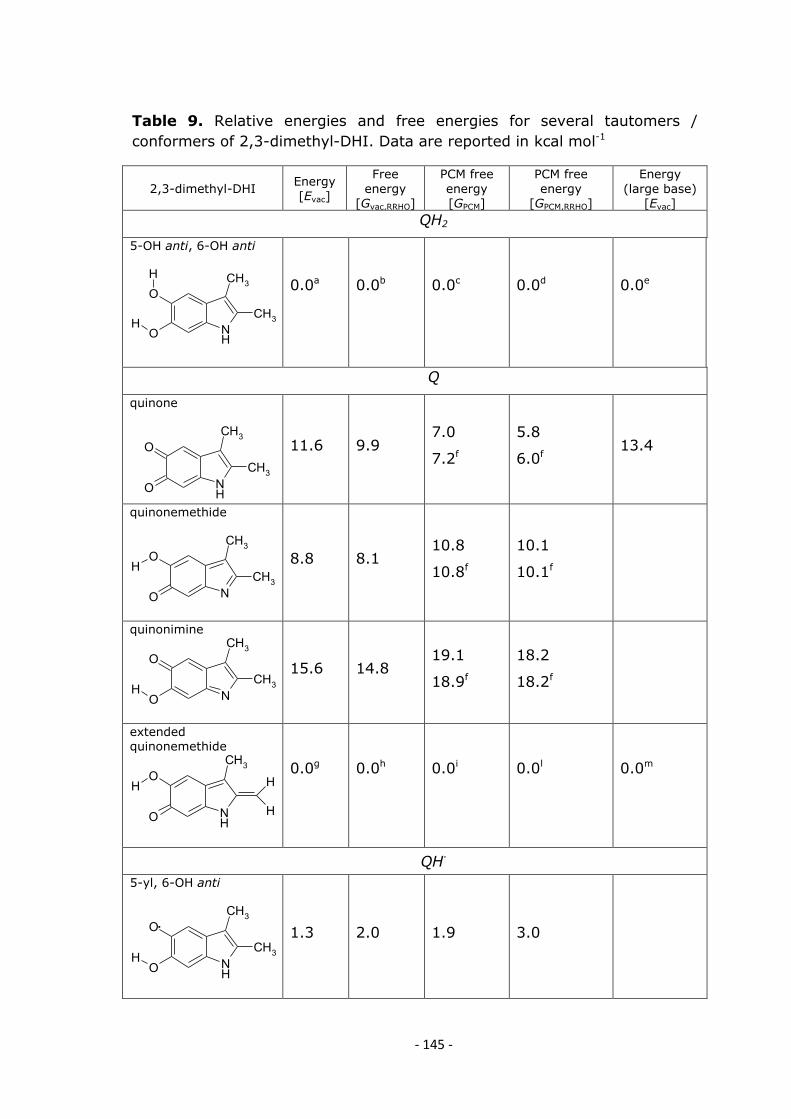
- 145 -
Table 9. Relative energies and free energies for several tautomers /
conformers of 2,3-dimethyl-DHI. Data are reported in kcal mol-1
2,3-dimethyl-DHI Energy [Evac]
Free
energy [Gvac,RRHO]
PCM free
energy [GPCM]
PCM free
energy [GPCM,RRHO]
Energy
(large base) [Evac]
QH2
5-OH anti, 6-OH anti
NH
O
O
H
H
CH3
CH3
0.0a
0.0b
0.0c
0.0d
0.0e
Q
quinone
NH
O
O
CH3
CH3
11.6 9.9 7.0
7.2f
5.8
6.0f 13.4
quinonemethide
N
O
O
CH3
CH3
H
8.8 8.1 10.8
10.8f
10.1
10.1f
quinonimine
N
O
O
CH3
CH3
H
15.6 14.8 19.1
18.9f
18.2
18.2f
extended quinonemethide
NH
O
O
CH3
H H
H
0.0g
0.0h
0.0i
0.0l
0.0m
QH∙
5-yl, 6-OH anti
NH
O
OH
CH3
CH3
1.3 2.0 1.9 3.0

- 146 -
6-yl, 5-OH syn
NH
O
O
CH3
CH3
H
0.0n
0.0o
0.0p
0.0q
0.0r
2-benzylic, 5-OH anti, 6-OH anti
NH
O
O
CH3
C
H
H
H
H
13.8 13.1 15.2 14.7
3-benzylic, 5-OH anti, 6-OHanti
NH
O
O
C
CH3
H
H
HH
17.1 16.2 17.6 17.1
a-592.266824; b-592.110863; c-592.279781; d -592.124149; e-592.404484;
f Values computed in methanol; g-591.034437; h-590.899891; i-591.048844, -591.048379f; l-590.914726, -590.914298f;m -591.172704; n-591.647585; o -591.504139; p-591.662237; q -591.519577; r-591.784297 (data in hartree)

- 147 -
Table 10. Relative energies and free energies for several tautomers /
conformers of N-Me-DHI. Data are reported in kcal mol-1
N-Me-DHI Energy [Evac]
Free
energy [Gvac,RRHO]
PCM energy [EPCM]
PCM free
energy [GPCM,RRHO]
QH2
5-OH anti,6-OH anti
N
CH3
O
O
H
H
0.0a 0.0b 0.0c 0.0d
5-OH syn, 6-OH syn
N
CH3
O
O
H
H
1.0 0.9 0.2 0.4
Q
Quinone
N
CH3
O
O
0.0e 0.0f 0.0g 0.0h
QH.
5-yl, 6-OH anti
N
CH3
.O
OH
1.1 1.2 1.4 1.4
5-yl, 6-OH syn
N
CH3
.O
O
H
11.8 11.2 6.9 6.1

- 148 -
6-yl, 5-OH syn
N
CH3
.O
OH
0.0i 0.0l 0.0m 0.0n
6-yl, 5-OH anti
N
CH3
.O
O
H
9.7 9.1 5.3 5.1
a -552.982542; b -552.85143; c-552.979394; d-552.848342;e-551.727716427; f 551.620846;g-551.732013;h-551.625052;i-552.361363;l-552.242211; m-552.359077; n-552.239798 (data in hartree)
As reference compound to validate the computational results and possibly to
correct for systematic errors p-benzoquinone was considered (Table 11), for which
experimental data are available in the literature.125

- 149 -
Table 11. Relative energies and free energies for hydroquinone,
p-benzoquinone and the related phenoxyl radical. Data are reported in kcal
mol-1
p-benzoquinone Energy [Evac]
Free energy
[Gvac,RRHO]
PCM free energy
[GPCM]
PCM free energy
[GPCM,RRHO]
Energy (large base) [Evac]
QH2
C2h
OO
H
H
0.0a
0.0b
0.0 0.0
0.0c
C2v
OO
H H
0.1 0.1
0.0d
0.0e
0.1
Q
D2h
OO
0.0f
0.0g
0.0h
0.0i
0.0l
QH.
Cs
O O
H
0.0m
0.0n
0.0o
0.0p
0.0q
a-382.283145; b-382.203648; c-382.377467; d-382.294580; e-382.215177; f-381.041526; g-380.985144; h-381.050980; i-380.994688; l-381.133294; m-381.647944; n-381.582033; o-381.661873; p-381.595801; q-381.740244 (data in hartree)

- 150 -
Considering for simplicity only the most stable tautomers / conformers obtained,
the energy parameters for the reaction of disproportionation of the semiquinone to
quinone and catechol were then calculated (Table 12).
Table 12. The energy balances for the disproportionation reaction, referred
to the most stable tautomers / conformers identified for each species. Data
are reported in kcal mol-1
Substrate Reaction ∆Evac ∆Gvac,RRHO ∆GPCM ∆GPCM,RRHO ∆Evac
(large base)
DHI 2 QH∙ → QH2 + Q 7.6
7.4
3.6 3.3 7.9
DHICA
2 QH∙ → QH2 + Q 4.2 4.0 4.7a
3-iodo-DHI
2 QH∙ → QH2 + Q
(quinonemethide)
4.0 4.8 7.9 8.2 3.1
2 QH∙ → QH2 + Q
(quinone)
6.8 6.8 3.0 2.9 7.2
2,3-dimethyl-
DHI
2 QH∙ → QH2 + Q
(extended
quinonemethide)
-3.8 -1.6 -2.6 0.2 -5.4
2 QH∙ → QH2 + Q
(quinone)
7.7 8.4 4.4 6.0 8.0
N-Me-DHI
2 QH∙ → QH2 + Q 7.8 7.6 3.9
p-benzoquinone 2 QH∙ → QH2 + Q -18.1
-15.5
-13.7 -11.5 -19.0

- 151 -
The experimental standard free energy change for the disproportionation reaction
of p-benzosemiquinone radicals124
in DMSO (-15.1 kcal mol-1
) compares quite well
with the results computed in vacuo (-15.5 kcal mol-1
). Even in aqueous solution, the
experimental value at low pH (∆G = -14.4 kcal mol-1
) is reasonably close to the value
obtained by a PCM calculation (-11.5 kcal mol-1
). Overall, this preliminary comparison
with experimental results hints that the computational levels adopted are capable of
providing useful estimates of the reaction energetics in the cases at hand.
In DHI, DHICA, 3-iodo-DHI and N-Me-DHI the disproportionation of
semiquinone radicals to quinones and catechol-like species is in general
thermodynamically unfavorable.
In 2,3-dimethyl-DHI, conversion of the 2-methyl substituent into an exocyclic
methylene provides a pathway for further stabilization of the quinonoid species; in this
case, the overall thermodynamic balance for the disproportionation reaction becomes
favorable.

- 152 -
CONCLUSIONS
The disproportionation reaction of radicals derived from DHI and related
compounds appears to be thermodynamically unfavorable; in those situations in which
5,6-dihydroxyindole oxidation occurs by the initial formation of phenoxyl radicals,
these will display little tendency to convert into indolequinones, and the concentration
of indolequinones will remain small with respect to that of the radicals. On account of
the high reactivity expected from radical species, it is conceivable that other reaction
channels may prevail over the disproportionation reaction (e.g., radical coupling
reactions).
Phenoxyl radicals are definitely involved in the initial stages of pulse-radiolysis
oxidation of 5,6-dihydroxyindoles and their derivatives: however, the computational
results presented above cast some doubt on the contention that the reaction proceeds in
all cases through the intermediacy of indolequinones. Instead, different / concurrent
reaction pathways may be involved, depending on the energetic balance of the specific
disproportionation reaction.
In specific chemical or enzymatic oxidation conditions (e.g., periodate oxidation,
or tyrosinase-catalyzed oxidation), two-electron oxidation products may be formed and
released directly by mechanisms which do not imply the disproportionation of phenoxyl
radicals: in these cases, kinetic considerations may favor indole / quinone couplings
even at the expense of a thermodynamically favorable comproportionation reaction
(H2Q + Q = 2 QH∙). Thus, in principle, both reaction pathways remain available.

- 153 -
CHAPTER VIII
Other studies
INTRODUCTION
During the course of my PhD, I collaborated in the computational aspects of a
project on the chemistry of nitrated lipids.
Nitrated derivatives of unsaturated fatty acids have emerged during the past
decade as important products of lipid modification under (patho)physiological
conditions associated with oxidative stress and elevated production of nitric oxide
(NO).125,126
Although the detailed structural features of the nitrated fatty acids generated
in vivo remain to be defined, a significant proportion of them appears to be present in
the form of nitroalkene derivatives, such as the nitrooleic acids and the nitrolinoleic
acids.127,128
These latter comprise four isomeric derivatives of (Z,Z)-9,12-
octadecadienoic acid exhibiting a conjugated nitro group on the terminal (9- and 13-) or
inner (10- and 12-) positions of the (Z,Z)-1,4-pentadienyl system. So far, 10-
nitrolinoleic acid, (9E,12Z)-10-nitrooctadecadienoic acid (24), and the 12-nitro isomer
have been detected in human plasma and urine by LC-MS techniques,129-131
whereas 9-
nitrolinoleic acid, (9E,12Z)-9-nitrooctadecadienoic acid (23), and its 13-nitro isomer
have been described only as products of chemical nitration of linoleic acid in an organic
solvent.132,133
COOH
NO2
O2N
COOH
23
24
Figure 64. Structures of (9E,12Z)-9-nitrooctadecadienoic acid (23) and
(9E,12Z)-10-nitrooctadecadienoic acid (24).
A substantial body of evidence indicates that nitrolinoleic acids behave as
pluripotent signaling molecules that transduce the actions of NO via multiple
mechanisms,131,134,135
which in part are receptor-mediated and in part reflect the

- 154 -
electrophilic and NO-releasing behavior of the nitropentadiene reactive moiety in a
physiological milieu. The electrophilic nature of nitrolinoleates is deduced by their
ability to cause post-translational modifications of protein residues133,136,137
and by the
occurrence in vivo of a significant proportion of vicinal hydroxynitro derivatives,131,134
suggesting addition of water onto the double bond. The ability of nitrolinoleic acids to
release NO is the focus of much interest. Experimental evidence derived from different
experiments (EPR, chemiluminescence, deoxy- and oxymyoglobin assays)134,138-141
suggests the release of NO as well as nitrite,139,140
but the detailed pathways remain to
be definitively assessed. In the presence of other lipids or amphiphiles at levels above
the critical micellar concentration, nitrolinoleic acids are stabilized and become highly
resistant to NO-release. This finding suggests that nitrolinoleic acids provide a
hydrophobically stabilized NO reserve and, in view of their accumulation to detectable
levels in lipophilic biological compartments, represent the single largest pool of
bioactive oxides of nitrogen in the vasculature.134
Apart from the above studies, current
knowledge of the chemical behavior and fate of these nitroalkene fatty acid derivatives
under physiologically relevant conditions is scanty and limited to the decomposition
routes supposedly associated to their NO donor abilities. Surprising is also the lack of
general information about the free radical oxidation pathways of the nitro-1,4-
pentadienyl system, the reactive core of nitrated polyunsaturated fatty acids. A detailed
elucidation of the chemical properties of nitrolinoleic acids under physiologically
relevant conditions is therefore of paramount importance for further progress toward an
understanding of the signaling capabilities of these bioactive lipids. To this aim, access
to the individual isomers is essential to advancing structure-activity knowledge and to
rationally design new more active structural variants for therapeutic purposes. Was thus
developed the first convenient access route to pure 23 and 24 as free acids and a
comparative investigation of their chemical behavior in aqueous phosphate buffer at pH
7.4. By integrating product analysis with mechanistic experiments, was provided a
comparative description of the basic chemistry of nitrolinoleic acids under
physiologically relevant conditions. The remarkable position-dependent influence of the
nitro group on the oxidation behavior of the 1,4-pentadienyl moiety is also addressed
with the aid of a density functional theory (DFT) investigation.

- 155 -
RESULTS AND DISCUSSION
Preparation, stability and product studies of 23 and 24 (this section reports
work carried out mainly by Drs Luigia Capelli and Paola Manini)
Unlike nitrooleic acids, for which simple access routes based on standard Henry
condensation chemistry are available,141,142
nitrolinoleic acids are difficult to synthesize.
Their preparation currently relies on direct nitration of the parent fatty
acid127,129,131,132,143,144
because of the lack of synthetic routes assembling the C-18
nitrated fatty acid chain. Early methods based on acidic nitrite or NO2+-forming
reagents led invariably to mixtures of regio- and stereoisomers in low yields, along with
abundant side-products, and only small amounts of 24 and the 12-nitro isomer as
carboxylate esters could be obtained. More recently, a
nitrophenylselenenylation/oxidation protocol has been reported to produce a statistical
distribution of the four regioisomeric nitrolinoleic acids in good overall yields,133
but
their separation as free acids remained a difficult task. To provide access to individual
nitrolinoleic acid isomers needed for probing the structural basis of their biological
activities and fate, to determine if certain isomers are more reactive than others in
competing autoxidation/NO-release and water addition pathways, and to understand
why unsaturated lipids with the nitro group on terminal positions of the polyene systems
(e.g. 23) have so far eluded identification in vivo, it was necessary to devise expedient
methods for preparation of representative isomeric nitrolinoleates as pure free acids.
Nitrolinoleates 23 and 24 were thus selected for the purposes of the present study
because of their appropriate positional isomerism. After an extensive search of reaction
conditions with a variety of nitrating systems, it was found that the target nitroalkenes
23 and 24 could be conveniently obtained by a modification of the reported
nitrophenylselenenylation/oxidation procedure133
through a judicious combination of
experimental conditions and protection strategies.
Compound 1 was prepared by a modified protocol in which linoleic acid was
reacted with PhSeBr in THF at –78 °C and then with HgCl2 and AgNO2 in dry
acetonitrile to produce regioisomeric nitrophenylselenenyl-adducts (Scheme 14).145
Preparative HPLC then afforded a main fraction containing a mixture of the appropriate
stereoisomeric nitrophenylselenenyl-adducts, which were treated with H2O2 to remove

- 156 -
phenylseleninic acid and give the desired 23 in 12% overall yield, characterized by a
complete spectroscopic analysis.
R R'
R R'
PhSe NO2
23
1. PhSeBr in dry THF -78 °C, 10 min2. HgCl2, AgNO2 in dry AcN
-78 °C 2h, rt 1.5 h
H2O2 in CHCl34 °C 30 min, rt 30 min
R = CH3(CH2)3-
R' = HOOC(CH2)6-
80%
15%
mixture of stereoisomers
Scheme 14. Preparation of 23.
The same procedure was successfully extended to obtain 15
N-labeled 23 in 9%
isolated yield using Na15
NO2 in the place of AgNO2. Preparation of 24 as free acid
could not be achieved by the same protocol because of difficulties in the separation of
the appropriate nitrophenylselenenyl intermediates or the final nitrolinoleates.
Accordingly, an alternate strategy was devised which involved the use of the allylic
ester of linoleic acid as the substrate. This ester group was preferred over simple alkyl
groups because of the facile removal by hydrogenolysis142
and the presence of an
additional double bond expected to improve chromatographic separation over silver
nitrate-impregnated silica gel.132
Indeed, nitrophenylselenenylation/oxidation of linoleic
acid allylester as above followed by a chromatographic step gave pure 24-allylester,
from which 24 was eventually obtained in ca. 10% overall yield after a deprotection
step (Scheme 15).

- 157 -
R COOR'
R
O2N O
OR'
1. PhSeBr in dry THF -78 °C, 10 min
2. HgCl2, AgNO2 in dry AcN
-78 °C 2h, rt 1.5 h
H2O2 in CHCl34 °C 30 min, rt 30 min
R = CH3(CH2)3-Allyl alcohol, pTsOHtoluene reflux, 18 h
HCOOH, Pd(PPH3)4
dry THF, reflux, 24 h
90%
60%
17%
82%
R' = H
R' = -CH2CH=CH2
nitrophenylselenenyl derivatives (mixture of isomers)
24: R' = H
R' = -CH2CH=CH2
Scheme 15. Preparation of 24.
Prior to product investigation, the relative stability of regioisomeric nitrolinoleic
acids under physiologically relevant conditions was investigated. Accordingly, freshly
prepared pure 23 and 24 were dissolved in phosphate buffer at pH 7.4 containing 20%
ethanol, under the conditions used in previous and related studies134,146
and their rates of
decomposition at 20 °C were monitored by HPLC. Data revealed a markedly faster
decay of 23 relative to 24: after 15 min nearly 80% 23 had decayed versus little or no
24. Under the same conditions, linoleic acid remained virtually unchanged over more
than 5 hours.
The faster decay of 23 relative to 24 was also apparent from NMR analyses of the
crude ethyl acetate extracts of the reaction mixtures from the nitrolinoleic acids
suspended in 0.1 M phosphate buffer, pH 7.4 and from NMR analysis of an equimolar
mixture of 23 and 24. Notably, even when stored dry in the cold, 23 was unstable
compared to 24: whereas pure samples of the former underwent extensive degradation
after a month or so, the latter remained virtually unaffected during the same period. In
separate experiments the NO-releasing abilities of 23 and 24 in phosphate buffer were
investigated using the oxymyoglobin assay.134,128,139
The results indicated a faster
decrease in the 580 and 543 nm maxima (characteristic of the visible α- and β-band

- 158 -
absorbance of oxymyoglobin) and a more rapid increase in the 630 and 503 nm maxima
(characteristic of metmyoglobin) in the case of 23, suggesting faster NO-release from
this fatty acid.
Overall, these preliminary data highlighted a marked instability of 23 in phosphate
buffer when compared to 24, and a consistently higher tendency to release NO. With
this information available, the main reaction products generated under the same
conditions were then investigated.
Incubation of 23 in 0.1 M phosphate buffer, pH 7.4, resulted in the generation of a
very complex mixture of products. After 2 h the mixture was worked up and
chromatographed on silica gel plates to give three main UV visible bands, identified on
the basis of ESI(+)/MS, ESI(-)/MS/MS, and NMR data as compounds 25, 26 and 27
(Figure 65).
OH
NO2
OH
O
O
NO2
OH
O
NO2
ONO2
OH
O
25
26
27
Figure 65. Structures of (9E,11E)-13-hydroxy-9-nitro-9,11-
octadecadienoic acid (25), (9E,11E)-9-nitro-13-oxo-9,11-octadecadienoic
acid (26), (9E,11E)-9-nitro-13-nitrate-9,11-octadecadienoic acid (27).
Formation of products 25-27 was independent of substrate concentration (HPLC
evidences). In a subsequent set of control experiments it was found that: a) in
unbuffered water (pH around 5) formation of peroxidation products of 23 was markedly
slower with no detectable 27; b) under an argon atmosphere formation of products 25-
27 was inhibited; c) when 23 was left to decompose at room temperature as a dry film
formation of 25 and 26 occurred but no detectable 27.

- 159 -
To gain a deeper insight into the products resulting from aqueous decomposition
of 23, the crude reaction mixtures obtained from both the unlabeled and 15
N-labeled
substrates were investigated by LC-MS. Besides 25, 26 and 27 in the mixtures there
were several additional species, including the 13-hydroperoxy derivative of 23 and a
dienone in which the nitro group was evidently lost. Similar species generated by
decomposition of nitrolinoleic acids had been reported previously.134
In contrast to 23, decay of 24 in aqueous phosphate buffer at pH 7.4 gave after 2 h
a single isolable species which was obtained by preparative TLC and was identified as
(12Z)-9-hydroxy-10-nitrooctadec-12-enoic acid (28) (9% isolated yield, Figure 66) by
extensive spectral characterization.
O
OH
OHO2N
28
Figure 66. Structure of (12Z)-9-hydroxy-10-nitrooctadec-12-enoic acid
(28).
Unreacted 24 accounted for some 80% of the mixture after 2 h reaction time.
Although no other single product could be isolated from the mixture, NMR and LC-MS
investigations indicated the formation, besides 28, of several species all in minute
amounts.
The product studies reported above revealed three main degradation channels of
the nitropentadienyl system in neutral aqueous buffer, namely: a) H-atom abstraction
from the bis-allylic methylene group triggering classic peroxidation chain reactions; b)
NO-release; and c) nucleophilic addition of water onto the nitroalkene moiety. Whereas
the latter path accounts for the observed formation of 28 by decay of 24, the first two
routes may lead to 25-27, as outlined in Scheme 16.

- 160 -
NO2
H H
R R'
NO2
R'R
OOH
NO2
R'R
OONO
H.
N+
R R'
O
O
OH
N
R R'
OH
O
OH
N
R R'
O
R R'
ONO2
R'R
OO.
NO2
H
R R'
NO2
R'R
. .
O2
23
25 + 26 R = CH3(CH2)3-
R' = HOOC(CH2)6-
27
decomposition products, e.g.
m/z 295 [M+H]+
m/z 380 [M+Na]+
-OH
path A
H.
path B H2O
-H2O
NO
Scheme 16. Mechanistic pathway proposed for the formation of compounds
25-27 from 23.
H-Atom abstraction from the bis-allylic methylene group (Scheme 16, path A)
would result in a stabilized nitropentadienyl radical which would undergo coupling with
oxygen to give 25 and 26 via the classic lipid peroxidation steps. This path is supported
by the mass spectrometric identification of the hydroperoxy derivative and the
substantial inhibition of product formation in the absence of oxygen. NO-Release is
apparently a pH-dependent route triggered by a deprotonation equilibrium, and is
involved in the formation of 27 at pH 7.4. One viable mechanism for NO-release is
based on the recently proposed modified Nef sequence136
and is sketched in Scheme 16,
path B.
Product analysis suggested a higher oxidizability of 23 relative to 24. Since H-
atom abstraction from the 1,4-pentadiene system (C-H bond dissociation enthalpy
(BDE) = 76.4 kcal mol-1
)147-148
dictates the oxidizability of polyunsaturated fatty acids,
at least a rough estimate of the relative abilities of nitrolinoleic acids to act as H-atom
donors was desirable. Accordingly, the activity of 23 and 24 in the
diphenylpicrylhydrazide (DPPH) radical quenching spectrophotometric test was
determined against linoleic acid, as a reference fatty acid.150
This test, which is run in

- 161 -
ethanol and is therefore independent of pH-related effects, enables to measure the
radical scavenging properties of a given substance and is often used in the food industry
to establish the rank order of antioxidants. The results in Figure 67 indicated more
effective H-atom transfer to the DPPH radical from 23 than from 24 or linoleic acid.
This trend can be taken to suggest a larger radical-stabilizing effect of the nitro group on
the terminal pentadienyl positions, making 23 more prone to H-atom loss and free
radical formation.
Figure 67. Absorbance decay at 515 nm of a 100 μM solution of DPPH in
ethanol after addition of: 23 (), 24 () and linoleic acid (). Final fatty
acid concentration: 7.7 mM. All experiments have been carried out in
triplicate. Data are expressed as average + S.D.
0
20
40
60
80
100
120
0 50
% D
PP
H r
em
ain
ing
Time (min)

- 162 -
Computational studies
To support this conclusion and to investigate in some detail the position-
dependent influence of the nitro group on radical stability, I performed a computational
investigation at the DFT level of the isomeric nitro-1,4-pentadienyl systems. A
theoretical description of the 1,4-pentadiene system and the corresponding radical, and a
discussion of how theoretical methodologies perform in modeling these systems,
including determination of bond dissociation enthalpies (BDEs), has appeared
recently.148
For the purposes of the present study two simplified truncated structures
featuring the isomeric nitropentadiene moieties typical of 23 and 24 were investigated,
namely 29 and 30, respectively.
O2N NO
2
29 30
Figure 68. Truncated structures featuring the isomeric nitropentadiene
moieties typical of 23 (29) and 24 (30).
Geometry optimizations were based on the “hybrid” PBE0 functional,32b
which
has provided quite satisfactory energies and geometries for a wide range of organic and
biological systems (including notably radical species) in combination with the 6-
31+G(d,p) basis set.98
The unrestricted formulation was used to describe radical species.
The conformational spaces of 29 and 30, as well as the corresponding bis-allylic
radicals (dubbed 29R and 30R), were sampled by relaxed grid-searches of the C3-C4
and C4-C5 dihedrals (methyl rotations were not systematically explored). For both 29
and 30, four minima were identified, arranged in enantiomeric pairs which, within each
compound, are separated by 0.2 - 0.4 kcal mol-1
: the energy difference between the
absolute minimum of 30 with respect to 29 is also rather small (0.5 kcal mol-1
). The bis-
allylic radical 29R gives rise to six minima (two enantiomeric pairs, and two structures
of Cs symmetry), one of the planar conformers being definitely more stable than the
others (by at least 3.9 kcal mol-1
). By contrast, planar conformers were not found among
the stable conformers of 30R, which features instead four pairs of enantiomeric minima:

- 163 -
even in those conformers in which the carbon skeleton is approximately planar, the nitro
group is significantly distorted out of the molecular plane. A first indication of the
relative stabilities of the two radicals can be gained by comparison of the energies of
their most stable conformers: then, 29R is favored by 9.0 kcal mol-1
with respect to
30R. Such a direct comparison is significant, since, as stated before, 29 and 30 are
almost isoenergetic at this level. Moreover, the overall picture is confirmed when more
refined treatments are adopted, including single point energy evaluations with the
recently developed M05-2X density functional,151
which has shown remarkable
performance for energetics involving radicals,152
use of a large basis set, and
introduction of rotational/harmonic vibrational contributions: in terms of computed
enthalpies at 298.15 K, 30 is more stable than 29 by 0.4 kcal mol-1
, while 30R is less
stable than 29R by 8.4 kcal mol-1
. Selected geometric parameters (dihedrals in degrees)
and relative energies of the main conformers of 29, 30, 29R and 30R are listed in Table
13, whereas thermal corrections to enthalpy are listed in Table 14.

- 164 -
Table 13. Selected geometric parameters (dihedrals in degrees) and
relative energies (in kcal mol-1) of the main conformers of 29 and 30, and
the corresponding bis-allylic radicals, computed at the PBE0/6-31+G(d,p)
level. For radical species, the unrestricted formulation was adopted. Single
point energies computed at the M05-2X/6-31+G(d,p) and M05-2X/6-
311+G(2df,p) levels are also shown.
C2-C3-
C4-C5
C3-C4-
C5-C6
O-N-C2-
C3/
O-N-C3-C2a
∆E
PBE0/6-
31+G(d,p)
∆E
M05-2X/6-
31+G(d,p)
∆E
M05-2X/6-
311+G(2df,p)
29
Conformer 1 116.6 114.4 180.0 0.0b 0.0c 0.0d
Conformer 2 128.0 -120.8 179.9 0.4 0.3 0.3
30
Conformer 1 100.2 118.1 170.4 0.0e 0.0f 0.0g
Conformer 2 99.1 -124.2 -176.8 0.2 0.4 0.4
29R
Conformer 1 180.0 180.0 180.0 0.0h 0.0i 0.0j
Conformer 2 180.0 0.0 180.0 3.9 3.7 3.9
Conformer 2 10.4 -178.7 176.1 4.8 - -
Conformer 4 22.4 36.4 -173.7 10.1 - -
30R
Conformer 1 11.7 -178.9 171.1 0.0k 0.0l 0.0m
Conformer 2 176.8 -176.9 147.3 0.3 0.3 0.2
Conformer 3 38.6 24.2 170.9 5.8 - -
Conformer 4 -157.0 17.7 -144.7 6.3 - -
[a] For 29/29R, and 30/30R, respectively. [b] -477.920670 hartrees.
[c] -478.388108 hartrees. [d] -478.522353 hartrees. [e] -477.919887 hartrees.
[f]-478.388567 hartrees. [g] -478.522986 hartrees. [h] -477.305368 hartrees.
[i] -477.768374 hartrees. [j] -477.902367 hartrees. [k] -477.291091 hartrees.
[l] -477.754970 hartrees. [m] -477.888747 hartrees.
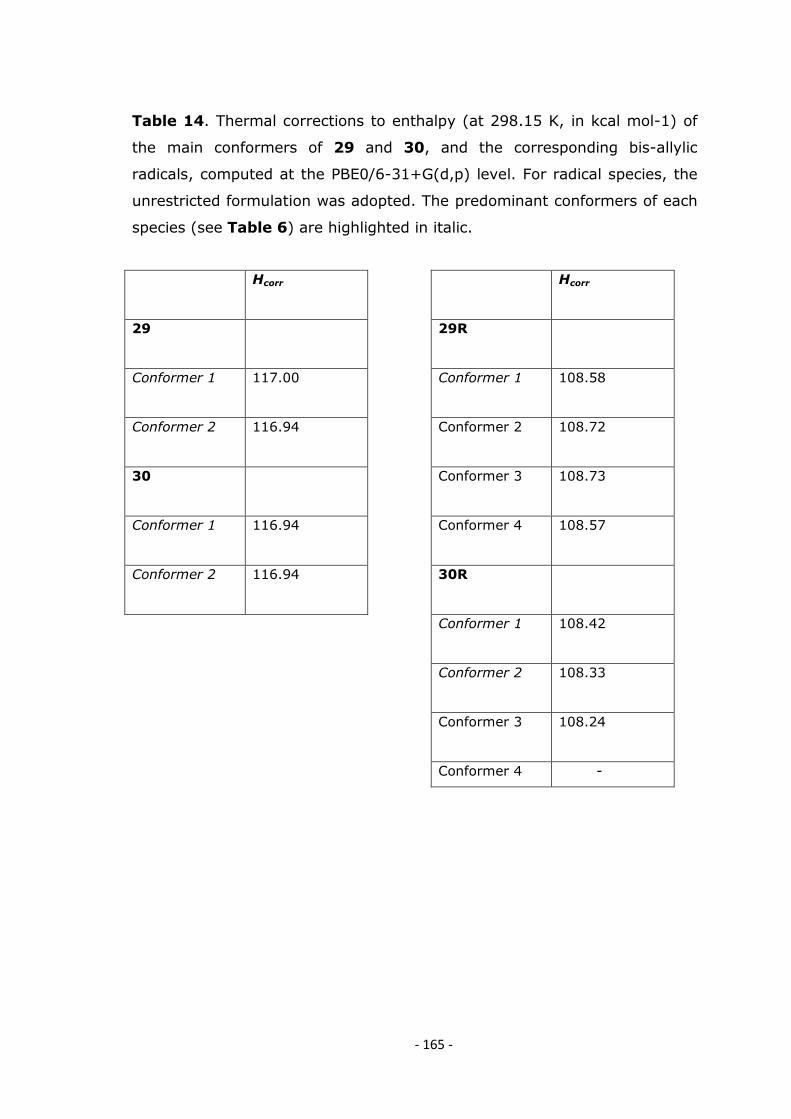
- 165 -
Table 14. Thermal corrections to enthalpy (at 298.15 K, in kcal mol-1) of
the main conformers of 29 and 30, and the corresponding bis-allylic
radicals, computed at the PBE0/6-31+G(d,p) level. For radical species, the
unrestricted formulation was adopted. The predominant conformers of each
species (see Table 6) are highlighted in italic.
Hcorr
29
Conformer 1 117.00
Conformer 2 116.94
30
Conformer 1 116.94
Conformer 2 116.94
Hcorr
29R
Conformer 1 108.58
Conformer 2 108.72
Conformer 3 108.73
Conformer 4 108.57
30R
Conformer 1 108.42
Conformer 2 108.33
Conformer 3 108.24
Conformer 4 -
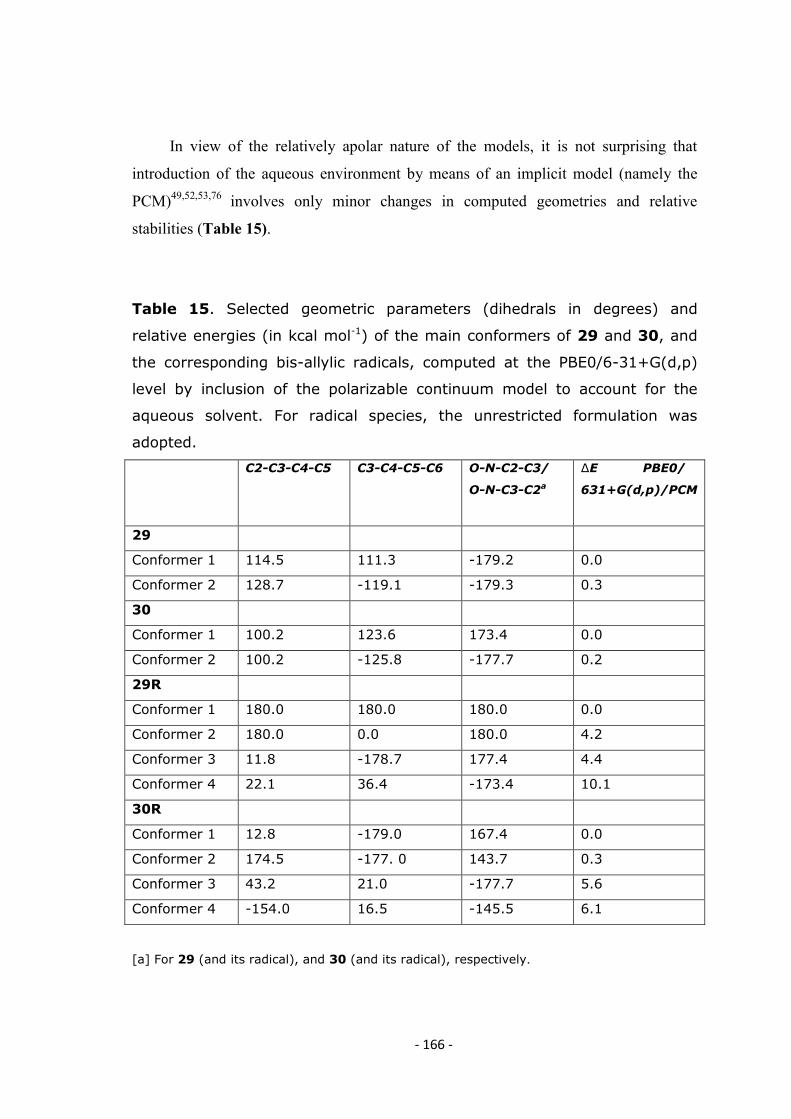
- 166 -
In view of the relatively apolar nature of the models, it is not surprising that
introduction of the aqueous environment by means of an implicit model (namely the
PCM)49,52,53,76
involves only minor changes in computed geometries and relative
stabilities (Table 15).
Table 15. Selected geometric parameters (dihedrals in degrees) and
relative energies (in kcal mol-1) of the main conformers of 29 and 30, and
the corresponding bis-allylic radicals, computed at the PBE0/6-31+G(d,p)
level by inclusion of the polarizable continuum model to account for the
aqueous solvent. For radical species, the unrestricted formulation was
adopted.
C2-C3-C4-C5 C3-C4-C5-C6 O-N-C2-C3/
O-N-C3-C2a
∆E PBE0/
631+G(d,p)/PCM
29
Conformer 1 114.5 111.3 -179.2 0.0
Conformer 2 128.7 -119.1 -179.3 0.3
30
Conformer 1 100.2 123.6 173.4 0.0
Conformer 2 100.2 -125.8 -177.7 0.2
29R
Conformer 1 180.0 180.0 180.0 0.0
Conformer 2 180.0 0.0 180.0 4.2
Conformer 3 11.8 -178.7 177.4 4.4
Conformer 4 22.1 36.4 -173.4 10.1
30R
Conformer 1 12.8 -179.0 167.4 0.0
Conformer 2 174.5 -177. 0 143.7 0.3
Conformer 3 43.2 21.0 -177.7 5.6
Conformer 4 -154.0 16.5 -145.5 6.1
[a] For 29 (and its radical), and 30 (and its radical), respectively.

- 167 -
Figure 69 depicts the SOMO and the total spin density for the main conformer of 29R:
the 2, 4 and 6 positions appear almost equivalent, with significant involvement of the
nitro group.
SOMO Spin density
Figure 69. Isodensity surfaces of the singly occupied molecular orbital and
total spin density of the main conformer of 29R, computed at the
UPBE0/6-31+G(d,p) level.
A more quantitative comparison (Table 16) based on SOMO localization and on
use of a larger basis set shows a slightly lower relative weight at position C-6 with
respect to C-2 and C-4.

- 168 -
Table 16. SOMO localization153 for the bis-allylic radicals 29R and 30R,
computed at the UPBE0/6-31+G(d,p) and UPBE0/6-311+G(2df,p)
//UPBE0/6-31+G(d,p) levels, with the VMOdes program (Nemykin, V. N.,
and Basu, P. VMOdes, Revision A 7.1; Department of Chemistry, Duquesne
University: Pittsburgh, PA, 2001, 2003). The predominant conformers of
each species (see Table 6) are highlighted in italic
UPBE0/6-31+G(d,p)
C-2 C-3 C-4 C-5 C-6 NO2
29R
Conformer 1 0.267 0.009 0.264 0.010 0.254 0.117
Conformer 2 0.261 0.008 0.266 0.010 0.256 0.118
Conformer 3 0.178 0.041 0.234 0.161 0.266 0.065
Conformer 4 0.221 0.067 0.228 0.050 0.137 0.076
30R
Conformer 1 0.296 0.055 0.250 0.097 0.233 0.008
Conformer 2 0.305 0.205 0.190 0.022 0.168 0.045
Conformer 3 0.140 0.155 0.309 0.052 0.182 0.027
Conformer 4 0.267 0.444 0.102 0.100 0.051 0.009
UPBE0/6-311+G(2df,p)
C-2 C-3 C-4 C-5 C-6 NO2
29R
Conformer 1 0.263 0.010 0.264 0.013 0.247 0.124
Conformer 2 0.256 0.008 0.266 0.012 0.252 0.121
Conformer 3 0.263 0.020 0.267 0.017 0.236 0.114
Conformer 4 0.228 0.037 0.222 0.045 0.151 0.088
30R
Conformer 1 0.249 0.066 0.302 0.012 0.260 0.010
Conformer 2 0.279 0.170 0.235 0.015 0.210 0.009
Conformer 3 0.174 0.170 0.267 0.052 0.208 0.027
Conformer 4 0.247 0.340 0.188 0.039 0.131 0.008

- 169 -
A note of caution here is in order concerning the validity of the truncated
structure to model lipid peroxidation. In particular, steric interactions between the long
tails of the real lipids are evidently ill reproduced by the small methyl groups of the
models. However, for both 29 and 30, the most stable conformer is characterized by a
skew arrangement of the terminal C-CH3 units, which should be compatible even with
the complete chains. The chain termini are almost cooriented in the secondary
conformers identified, but again this holds for both 29 and 30. The situation is slightly
more involved for the radical species: in the most stable conformer of 29R, the C-CH3
units are coplanar and point in the same direction; in the conformer which comes next,
the backbone is still planar, but the methyl groups are now on opposite sides (however,
as hinted above, this conformer is significantly less stable). The most stable conformer
identified for 30R corresponds, with minor distortions, to this latter chain fold;
conversely, the second conformer of 30R resembles the geometry of the absolute
minimum of 29R (but is much closer in energy to its own minimum). While the relative
orientation of the terminal C-CH3 groups can admittedly provide only a rough
indication as to the stability of the untruncated compounds, overall it would appear that
longer terminal tails could be better accommodated in the floppier 30R than in 29R; in
turn, this would imply a smaller energy separation between the two radicals, and would
to some extent qualify the rather drastic reactivity differences predicted by use of the
heptadiene models.

- 170 -
CONCLUSIONS
The preparation of two isomeric nitrolinoleic acids in pure form is reported for the
first time (only the ester derivative of 24 was obtained previously),132
and their
markedly different chemical behavior is disclosed. Compound 23, bearing a nitro group
on a terminal position of the pentadiene moiety, is markedly unstable when exposed to
phosphate buffer at pH 7.4, and partitions mainly between two concurrent degradation
pathways, one resulting in NO-release presumably via a base-dependent Nef-type
reaction, and the other involving a typical peroxidation process. A remarkable outcome
is formation of the nitronitrate ester 27 involving probably trapping of NO by transient
peroxyl radicals. Compound 24 decays at slower rate and gives mainly the
stereoisomeric hydroxynitro derivatives 28 by nucleophilic addition of water. The
differential behavior of 23 and 24 can be rationalized on the basis of DPPH radical
quenching experiments and DFT calculations, indicating a higher H-atom donating
ability and a larger radical stabilization when the nitro group is located on the terminal
rather than inner positions of the 1,4-pentadienyl core. These results provide an
underpinning for ongoing investigations of the physiological properties of nitrolinoleic
acids, and may orient the design of new pharmacologically active nitrated lipids. They
also offer a plausible explanation as to why 23 and the isomeric 13-nitrolinoleic acid
have so far eluded detection in biological systems.

- 171 -
EXPERIMENTAL AND COMPUTATIONAL METHODS
1. Oxidative chemistry of the 2,7’-biindolyl (4)
1.1 Materials and strumentation
L-Dopa, sodium dithionite, hydrogen peroxide (30% solution in water),
horseradish peroxidase (HRP) (donor: H2O2 oxidoreductase, EC 1.11.1.7) type II were
commercially available and were used as obtained. All the solvents were of analytical
grade quality.
ESI+/MS(HR) and ESI+/MS spectra were with the cone and the fragmentator
voltages set at 4 kV and 80 V respectively and obtained in 1% TFA-methanol. UV
spectra were obtained on a diode array spectrophotometer equipped with a thermostated
sample cell holder.
1H NMR spectra were recorded at 600, 400 or 300 MHz,
13C NMR spectra at 75
MHz. 1H,
1H COSY and
1H,
1H ROESY experiments were run using standard pulse
programs. 1H,
13C DEPT HSQC, and
1H,
13C HMBC experiments were run at 600 and
400 MHz respectively on instruments equipped with a 5 mm 1H/broadband gradient
probe with inverse geometry using standard pulse programs. The HMBC experiments
used a 100 ms long-range coupling delay. Chemical shifts are reported in δ values
(ppm) downfield from TMS.
Analytical and preparative TLC were carried out on silica gel plates (0.25 and
0.50 mm, respectively) using CHCl3/MeOH (98:2) as the eluant. TLC plates were
visualised using a UV lamp (λ = 254 nm). Liquid chromatography was performed on
silica gel (60-230 mesh).
HPLC analysis of the reaction mixtures was carried out on an apparatus equipped
with a UV detector set at 280 nm using a Sphereclone ODS (5 micron, 4.6 × 250 mm)
column; 1% v/v acetic acid/acetonitrile 95:5 (v/v) (eluant A) , aceto nitrile (eluant B)
gradients were used as follows: from 0-5 min 30% eluant B, 5-40 min 30-80% eluant B,
40-50 min 80% eluant B. Flow rate of 1 mL/min was used. Purity of isolated
compounds was estimated by 1H NMR analysis.
5,6-dihydroxyindole (1)154
and 5,5‟,6,6‟tetraacetoxy-2,7-biindolyl (4)59
were
synthesized as previously reported.

- 172 -
1.2 Oxidation of 4: Isolation of tetramers 9-11
A solution of 4 (280 mg, 0.60 mmol) in acetone (5 mL) was taken under a flux of
argon and treated with 0.1 M phosphate buffer pH 12 (0.5 L) which had been prior
thoroughly purged with argon. After 2 min the pH of the solution was taken to 8 by
addition of 3 M HCl and peroxidase (4.9 U/mL) and 30% H2O2 (135 µL, 1.3 mmol)
were added sequentially. The reaction mixture turned immediately from pale yellow to
deep violet. After 20 s the oxidation was halted by addition of 5% w/w aqueous solution
of sodium dithionite and acidified to pH 4 with 3 M HCl. The reaction mixture was
extracted repeatedly with ethyl acetate (3 x 250 mL) and the combined organic layers
were dried over sodium sulphate and taken to dryness. The residue was acetylated with
acetic anhydride-pyridine 95:5 (v/v) and fractionated by preparative TLC
(CHCl3/MeOH 98:2) to give besides residual 4 (Rf 0.70, 50 mg), acetylated 9 (Rf 0.42;
Rt 24.5 min; 8 mg, 3% yield, >95% pure by 1H NMR analysis) and acetylated 10 (Rf
0.27, Rt 26.7 min; 10 mg, 4% yield, >95% pure by 1H NMR analysis). In other
experiments the oxidation reaction was carried out in the presence of zinc sulfate (534
mg, 1.8 mmol) in 0.5 M TRIS buffer at pH 8.0 as the reaction medium. Workup and
fractionation as above afforded besides unreacted 4 (60 mg), acetylated 9 (Rf 0.42; 6
mg, 2% yield) and acetylated 11 (Rf 0.20; Rt 23.8 min; 15 mg, 5% yield, >95% pure by
1H NMR analysis) as colorless oils.

- 173 -
9-acetylated:
HR ESI+-MS m/z 949.2186 [M + Na]+, calcd for C48H38N4O16Na 949.2180;
UV λmax (EtOH) 301, 320 (s) nm;
1H-NMR (CD3COCD3): δ (ppm) 2.12 (3H×2, s, -COCH3), 2.28 (3H×3, s, -COCH3 ),
2.32 (3H×3, s, -COCH3 ), 6.02 (1H×2, s, H-3, H-3‟‟‟), 6.94 (1H×2, s, H-4‟, H-4‟‟), 6.95
(1H×2, s, H-2, H-2‟‟‟), 7.34 (1H×2, s, H-7‟, H-7‟‟), 7.49 (1H×2, s, H-4, H-4‟‟‟), 9.02
(1H×2, s, -NH, -NH‟‟‟), 10.54 (1H×2, s, -NH‟, -NH‟‟).
13C-NMR (CD3COCD3): δ (ppm) 20.2 (COCH3), 169.5 (COCH3), 101.6 (C-3, C-3‟‟‟),
106.7 (C-7‟, C-7‟‟), 110.1 (C-7, C-7‟‟‟), 110.1 (C-3‟, C-3‟‟), 114.1 (C-4‟, C-4‟‟), 114.9
(C-4, C-4‟‟‟), 125.1 (C-9, C-9‟‟‟), 125.6 (C-9‟-C-9‟‟), 128.5 (C-2, C-2‟‟‟), 133.8 (C-2‟,
C-2‟‟), 133.8 (C-8, C-8‟‟‟), 133.8 (C-8‟, C-8‟‟), 135.1 (C-5, C-5‟‟‟), 136.1 (C-6, C-6‟‟‟),
137.5 (C-5‟, C-5‟‟), 139.6 (C-6‟, C-6‟‟)

- 174 -
10-acetylated:
HR ESI+-MS m/z 949.2175 [M + Na]+, calcd for C48H38N4O16Na 949.2180;
UV λmax (EtOH) 313, 337 nm;
1H-NMR (CD3COCD3): δ (ppm) 2.04 (3H×2, s, -COCH3), 2.21 (3H×2, s, -COCH3),
2.31 (3H×2, s, -COCH3), 2.32 (3H×2, s, -COCH3); 6.16 (1H×2, s, H-3‟, H-3‟‟), 6.84
(1H×2, s, H-3, H-3‟‟‟), 7.39 (1H×2, s, H-2‟, H-2‟‟), 7.40 (1H×2, s, H-7, H-7‟‟‟), 7.44
(1H×2, s, H-4, H-4‟‟‟), 10.71 (1H×2, s, -NH‟, -NH‟‟), 10.78 (1H×2, s, -NH, -NH‟‟‟).
13C-NMR (CD3COCD3): δ (ppm) 20.1 (COCH3), 168.3 (COCH3), 103.8 (C-3, C-3‟‟),
103.9 (C-3‟, C-3‟‟), 106.5 (C-7, C-7‟‟‟), 111.8 (C-7‟, C-7‟‟), 114.3 (C-4, C-4‟‟), 121.4
(C-4‟, C-4‟‟), 126.7 (-C9, C-9‟‟‟), 126.8 (C-9‟, C-9‟‟), 127.0 (C-2‟, C-2‟‟), 132.4 (C-2,
C-2‟‟‟), 134.9 (C-8, C-8‟‟‟), 134.9 (C-8‟, C-8‟‟), 137.7 (C-5, -C5‟‟‟), 138.0 (C-5‟, C-
5‟‟), 139.5 (C-6‟, C-6‟‟), 139.9 (C-6, C-6‟‟‟)

- 175 -
11-acetylated:
HR ESI+-MS m/z 949.2178 [M + Na]+, calcd for C48H38N4O16Na 949.2180;
UV λmax (EtOH) 313 nm;
1H-NMR (CD3COCD3): δ (ppm) 2.17 (3H, s, COCH3), 2.27(3H, s, COCH3), 2.30
(3H×2, s, COCH3), 2.31 (3H, s, COCH3), 2.32 (3H, s, COCH3), 2.33 (3H, s, COCH3),
2.34 (3H, s, COCH3), 5.96 (1H, m, H-3), 6.47, (1H, m, H-3‟‟‟), 6.84 (1H, m, H-3‟), 7.18
(1H, d, H-2‟‟‟), 7.30 (1H, s, H-7), 7.35 (1H, s, H-4‟‟), 7.43 (1H, s, H-7‟‟), 7.44 (1H, s,
H-4), 7.64 (1H, s, H-4‟‟‟), 7.81 (1H, s, H-4‟), 9.26 (1H, s, -NH‟), 10.18 (1H, s, -NH),
10.39 (1H, s, -NH‟‟‟), 10.97 (1H, s, -NH‟‟).
13C-NMR (CD3COCD3): δ (ppm) 20.1 (COCH3), 169.9 (COCH3), 100.5 (C-3‟), 102.6
(C-3‟‟‟), 102.8 (C-3), 105.8 (C-7‟), 106.1 (C-7), 106.6 (C-7‟‟), 107.4 (C-7‟‟‟), 108.4 (C-
3‟‟), 113.4 (C-4‟‟), 113.9 (C-4‟), 114.2 (C-4), 116.0 (C-4‟‟‟), 124.6 (C-9‟‟), 126.3 (C-9),
127.0 (C-9‟), 127.7 (C-2‟‟‟), 127.7 (C-9‟‟‟), 133.3 (C-2‟‟)a, 134.5 (C-2‟)
a, 134.7 (C-8),
134.7 (C-8‟), 134.7 (C-8‟‟), 134.7 (C-8‟‟‟), 135.2 (C-2)a, 137.3 (C-5), 137.3 (C-5‟),
137.3 (C-5‟‟), 137.3 (C-5‟‟‟)137.8 (C-6‟‟‟), 139.2 (C-6), 139.6 (C-6‟‟), 139.9 (C-6‟)

- 176 -
2. Structural effect on the electronic absorption properties of oligomers of
5,6-dihydroxyindole (1)
2.1 Materials and strumentation
5,6-dihydroxyindole (1)154
and acetylated oligomers 3-826,58,59
were synthesized as
previously reported. All the solvents were of analytical grade quality.
UV spectra were made with a diode array spectrophotometer.
2.2 Absorption measurements
Deacetylation of oligomers was carried out as follows73
: a solution of oligomer
(ca. 5 mg) in methanol (1.0 mL) was slowly added under vigorous stirring to a 0.025 M
trisodium phosphate solution (2.5 mL) that had previously been purged with argon. The
reaction mixture was stirred under an argon atmosphere and after 10 min acidified to pH
7.0 with 2 M HCl. The solutions thus obtained were immediately used for
spectrophotometric determinations following appropriate dilution in 0.05 M phosphate
buffer, pH 7.0, up to 1 mL. A minimal time of exposure of the deacetylated oligomers
to air was critical for limiting melanin formation. Deacetylated oligomers were
markedly unstable to air and were therefore unsuitable for standard procedures of molar
extinction coefficient determination using crystallized samples. Residual acetate in the
mixture was at a concentration up to eight-fold that of the oligomer and was judged not
to affect the spectrophotometric measurements because it absorbs below 240 nm, i.e. a
region where the oligomers do not exhibit diagnostic absorption bands and which is
therefore out of the range of interest for the purposes of the present paper. Absorption
measurements were carried out on a single beam spectrophotometer using phosphate
buffer at pH 7.0 as the blank.

- 177 -
2.3 Computational methods
Computational studies were carried out at the DFT level, using the „„hybrid‟‟
PBE0 functional.32b
Geometry optimizations were performed with the 6–31 + G(d,p)
basis set,99
using the most recent implementation52
of the polarizable continuum model
(PCM)52,53,76
to simulate the aqueous environment. The effective cavities occupied by
the solute in the solvent were built using UA0 atomic radii52
during optimizations, while
the final evaluations of PCM energies were performed with the UAHF radii51
, as these
latter provide more reliable estimates for solvation free energies. The thresholds for the
maximum and the root mean square (RMS) forces and the maximum and the RMS
atomic displacements (in a.u.) were set to 0.00045, 0.00030 and 0.00180, 0.00120,
respectively. Absorption spectra of all the energetically relevant species were computed
using the TD-DFT approach,47,74,75,77
and the large 6–311 + +G(2d,2p) basis set. As the
absorption process presents a short characteristic time, only the electronic distribution
of the solvent can adapt to the excited state electronic structure: therefore, the
appropriate nonequilibrium formulation of the PCM55
was employed. All quantum
mechanical computations were performed with the Gaussian 03 suite.155

- 178 -
3. Reaction behavior of 5,6-dihydroxyindole (1) in acidic medium
3.1 Materials and strumentation
L-Dopa, potassium ferricyanide, il 5-hydroxiindole, il 6-hydroxiindole, cerium
ammonium nitrate and tetrabutylammonium salts were commercially available and were
used as obtained. All the solvents were of analytical grade quality.
5,6-Dihydroxyindole was prepared as reported.154
TBAF 1.0 M solution in THF
was used as obtained.
UV spectra were made with a diode array apectrophotometer. The fluorimetric
measurements were performed with a spectrofluorimeter Jasco.
1H and
13C NMR spectra were recorded at 400 or 100 MHz, respectively.
1H,
1H
COSY, 1H,
13C HMBC,
1H,
13C HSQC-DEPT, and ROESY spectra were run at 400 MHz
using standard pulse programs. Chemical shifts are reported in δ values (ppm)
downfield from TMS.
ESI+/MS(HR) mass spectra were registered with the cone and the fragmentator
voltages set at 4 kV and 80 V, respectively.
LC/MS analysis was carried out on an instrument equipped with an ESI ion
source; an octadecylsilane-coated column, 150 mm×4.6 mm, 3.5 mm particle size, at
0.4 mL/min was used. The eluant system was 0.2% formic acid, solvent A; acetonitrile,
solvent B; 5% B, 0–10 min; from 5 to 30% B, 10–25 min; from 30 to 70% B, 25–50
min.
Analytical and preparative TLC were carried out on silica gel plates (0.25 and
0.50 mm, respectively). TLC plates were visualised using a UV lamp (λ = 254 nm).
The liquid chromatography was performed on silica gel (60-230 mesh).

- 179 -
3.2 Reaction of 1 in acidic medium. General procedure
A solution of 1 (10 mg) in MeOH (200 μL) was added to 2 mL of 0.1 M
phosphate buffer (pH 2) in Argon atmosphere. Mixture was kept under vigorous
stirring and periodically analyzed by LC/MS or freeze-dried, treated with acetic
anhydride (500 L) and pyridine (20 L) for 16 h at room temperature and analyzed by
TLC.
In other experiments the reaction was carried out: 1) at 1 concentration of 60 mM,
2) in the presence of (NH4)2Ce(NO3)6 (2 molar equivalent), 3) in 0.1 M phosphate
buffer at pH 1 or 3, 4) in 0.1 M phosphate buffer at pH 2 and after 2 h the mixture was
adjusted to pH 8 by addition of NaHCO3; 5) in 0.1 M phosphate buffer at pH 2 to air; 6)
in methanol containing 1 M HCl or 6 M at 10% in the air.

- 180 -
3.3 Isolation of pentaacetyl derivative of 5,6-dihydroxy-2-(5,6-dihydroxyindol-3-
yl) indoline (12) and heptaacetyl derivative of 2-(2-amino-4,5-dihydroxyfenyl)-1,1-
bis(5,6-dihyidroxyindol-3-yl) ethane (13)
Reaction was carried out under Argon atmosphere in 0.1 M phosphate buffer at
pH 2, as described in the general procedure on 200 mg of 1. After 2h mixture was
freeze-dried, treated with acetic anhydride (2 mL) and pyridine (80 L) for 16 h at room
temperature and fractionated by TLC to give the acetylated derivative of 12 (Rf = 0.39,
17 mg, yield 5%) and 13 (Rf = 0.15, 12 mg, yield 4%).
12 acetyl derivative:
ESI+/MS: m/z 509 [M+H]+.
1H NMR CDCl3: δ (ppm) 2.02-2.33 (COCH3), 2.58 (1H, d, J= 16.0 Hz, H-3), 3.53 (1H,
dd, J= 16.0, 9.6 Hz, H-3), 5.53 (1H, d, J= 9.6 Hz, H-2), 6.53 (1H, s, H-2‟), 6.78 (1H, s,
H-4), 7.15 (1H, s, H-4‟), 7.18 (1H, s, H-7‟), 8.13 (1H, s, H-7), 8.39 (1H, s, NH).
13C NMR CDCl3: δ (ppm) 20.6-20.7 (COCH3), 23.5 (NCOCH3), 36.9 (C-3), 57.8 (C-2),
106.1 (C-7‟), 111.9 (C-4‟), 112.2 (C-7), 117.2 (C-3‟), 119.6 (C-4), 120.7 (C-9‟), 122.8
(C-2‟), 128.4 (C-9), 133.9 (C-8‟), 136.2 (C-5‟), 138.3 (C-5), 138.4 (C-6‟), 140.5 (C-6),
140.9 (C-8), 168.6-169.5 (COCH3).
13 acetyl derivative:
ESI+/MS: m/z 742 [M+H]+, 764 [M+Na]
+.
1H NMR CDCl3: δ (ppm) 2.04-2.29 (COCH3), 3.15 (2H, d, J= 6.0 Hz), 4.35 (1H, m),
6.16 (2H, bs), 6.89 (1H, s), 7.12 (4H, s), 7.48 (1H, s), 8.44 (2H, bs).

- 181 -
3.4 Isolation of 2-(2-Acetamido-4,5-diacetoxybenzyl)-6,7-diacetoxy-3-
(5,6-diacetoxyindol-3-yl)quinoline (14b)
To a solution of 5,6-dihydroxyindole (200 mg) in methanol (4 mL) 0.1 M
phosphate buffer (pH 2.0) (40 mL) was added and the reaction mixture was taken under
stirring. After 24 h, when LC/MS analysis showed the formation of a product at tR 24
min with a pseudomolecular ion peak [M+H]+ at m/z 446 as a major constituent, the
mixture was taken to dryness. The residue was treated with acetic anhydride (2 mL) and
pyridine (80 mL) for 16 h at room temperature and fractionated by silica gel column
chromatography (2 cm×36 cm) using chloroform–ethyl acetate as the eluant (9:1 to 4:6
gradient mixtures). Fractions eluted with chloroform–ethyl acetate 7:3 were collected
and taken to dryness to give 14b (33 mg, 10% yield, >97% purity estimated by 1H NMR
analysis) as a pale yellow oil.
HR ESI+/MS: m/z 740.2089 [M+H]
+, calcd for C38H34N3O13 m/z 740.2092;
UV (CH3CN): λmax 276, 330 nm;
IR (CHCl3): νmax 3468, 1767, 1691, 1611, 1550, 1497, 1417, 1365, 1326, 1197, 1117,
1012, 903 cm-1;
1H NMR (CDCl3): δ (ppm) 2.18–2.39 (21H, COCH3), 4.14 (2H, s, –CH2), 6.28 (1H, s,
H-60), 7.04 (1H,br s, H-2”), 7.09 (1H, s, H-4”), 7.32 (1H, s, H-7”), 7.59 (1H, s, H-5),
7.87 (1H, s, H-8), 7.96 (1H, s, H-3‟), 8.02 (1H, s, H-4), 8.99 (1H, br s, NH), 10.82 (1H,
br s, NHCOCH3);
13C NMR (CDCl3): δ (ppm) 20.5–20.8 (COCH3), 24.9 (NHCOCH3), 39.1 (-CH2),
106.2 (C-7”), 112.3 (C-4”), 112.8 (C-3”), 117.3 (C-3‟), 120.4 (C-5), 120.9 (C-8), 124.8
(C-6‟, C-9”), 125.3 (C-10), 127.1 (C-1‟, C-2”), 128.6 (C-3), 133.1 (C-8”), 135.9 (C-2‟),
136.9 (C-5”), 137.5 (C-5‟), 138.6 (C-6”), 139.0 (C-4), 140.5 (C-4‟), 141.7 (C-6), 144.0
(C-9), 144.4 (C-7), 161.5 (C-2), 167.9–169.1 (COCH3).

- 182 -
3.5 Reactions of 14b with anions
A 5 10-5
M solution of 14b in acetonitrile was treated with 25 molar equivalents
of the appropriate anion in the form of tetrabutylammonium salt (F-, HSO4
-, IO4
-, I
-, Br
-,
NO2-). The mixtures obtained were subjected to UV-vis and fluorescence analysis.
In other experiments, the UV-vis spectra and fluorescence were recorded after
addition of increasing amounts of F-(0.5-300 molar equivalent) at a 1 10
-5 or 5 10
-7
M solution of 14b in acetonitrile.

- 183 -
4. Oxidative chemistry of 5,6-dihydroxy-1-metyl-indoles
4.1 Materials and strumentation
16, 17 and 18 were synthesized as previously reported.97,98
Sodium dithionite, sodium tert-butoxide, hydrogen peroxide (30% solution in
water), horseradish peroxidase (HRP) (donor: H2O2 oxidoreductase, EC 1.11.1.7) type
II were commercially available. All the solvents were of analytical grade quality.
ESI+/MS(HR) and ESI+/MS spectra were registered with the cone and the
fragmentator voltages set at 4 kV and 80 V, respectively and obtained in 1% TFA-
methanol.
1H NMR spectra were recorded at 400 or 300 MHz,
13C NMR spectra at 75 MHz.
1H,
13C DEPT HSQC, and
1H,
13C HMBC experiments were run at 400 MHz,
respectively on instruments equipped with a 5 mm 1H/broadband gradient probe with
inverse geometry using standard pulse programs. The HMBC experiments used a 100
ms long-range coupling delay. Chemical shifts are reported in δ values (ppm) downfield
from TMS.
Analytical and preparative TLC were carried out on silica gel plates (0.25 and
0.50 mm, respectively) using CHCl3/AcOEt (7:3) or (1:1) as the eluant. TLC plates
were visualised using a UV lamp (λ = 254 nm). The liquid chromatography was
performed on silica gel (60-230 mesh).
Purity of isolated compounds was estimated by 1H NMR analysis.

- 184 -
4.2 Isolation of 19 and 20 acetylated
MeOH (80 mL) was taken under a flux of argon and, after 10 min, sodium tert-butoxide
(60 mg) and 17-acetylated (50 mg) dissolved in the smallest amount of chloroform were
added sequentially. Mixture was left to react for 5 min and was treated with 0.1 M
phosphate buffer pH 7.4 (250 mL) and than peroxidase (3u/mL) and 30% H2O2 (28 μL,
2.8 eq) were added sequentially. After 60 s the oxidation was stopped by addition of a
5% w/w aqueosus solution of sodium dithioninte, acidified to pH 4 with 3 M HCl. The
reaction mixture was extracted with ethyl acetate (3 x 250 mL) and the united organic
layers were dried over sodium sulfate and taken to dryness. The residue was acetylated
with acetic anhydride-pyridine 95:5 v/v and fractionated by preparative TLC
(CHCl3/AcOEt 4:6) to give 19-acetylated ( Rf 0.53; 2.5 mg, 5% yield) and
20- acetylated (Rf 0.53 in traces).
19 acetylated:
ESI(+) /HRMS m/z 983.3105 [M+H]+, calc for C52H47N4O16 983.2987; m/z
1005.2765 [M+Na]+ calc for C52H46N4O16Na , 1005.2806;
1H-NMR (CDCl3): δ (ppm) 2.2-2.4 (3H x4,s, -COCH3), 3.53 (3H×2, s, N-CH3
‟, N-
CH3‟‟), 3.69 (3H×2, s, N-CH3, N-CH3‟‟‟), 6.28 (1H×2, s, H-3‟, H-3‟‟), 6.51 (1H×2, s,
H-3, H-3‟‟‟), 7.14 (1H×2, s, H-7‟, H-7‟‟), 7.31 (1H×2, s, H-7, H-7‟‟‟), 7.37 (1H×2, s, H-
4, H-4‟‟‟).
13C-NMR (CDCl3): δ (ppm) 20.3-20.9 (COCH3), 31.1 (N-CH3‟, N-CH3‟‟), 31.2 (N-
CH3, N-CH3‟‟‟), ( 167-169 (COCH3), 104.1 (C-7‟, C-7‟‟), 104.2 (C-7, C-7‟‟‟), 104.7
(C-3, C-3‟‟‟), 105.3 (C-3‟, C-3‟‟), 114.1 (C-4, C-4‟‟‟), 120.4 (C-4‟, C-4‟‟‟), 125.1 (C-9‟,
C-9‟‟), 125.3 (C-9, C-9‟‟‟), 132.2 (C-2‟, C-2‟‟), 132.5 (C-2, C-2‟‟‟), 134.5 (C-5‟, C-5‟‟),
135.0 (C-8‟, C-8‟‟), 135.3 (C-8, C-8‟‟‟), 135.6 (C-5, C-5‟‟‟), 138.5 (C-6‟, C-6‟‟),139.0
(C-6, C

- 185 -
4.3 Isolation of 21-acetylated
Sodium tert-butoxide (80 mg) was added to MeOH (80 mL) taken under a flux of argon
for 10 min and than 17-acetylated (40 mg, 0.056 mmol) and 18-acetylated (28 mg,
0.056 mmol) dissolved in the smallest amount of chloroform were added too. Mixture
was left to react for 5 min and was treated with 0.1 M phosphate buffer pH 7.4 (240
mL) and than peroxidase (5u/mL) and 30% H2O2 (48 μL, 4.3 eq) were added
sequentially. Oxidation was stopped by addition of a 5% w/w aqueosus solution of
sodium dithioninte and acidified to pH 4 with 3 M HCl. The reaction mixture was
extracted with ethyl acetate (3 x 250 mL) and the united organic layers were dried over
sodium sulfate and taken to dryness. The residue was acetylated with acetic anhydride-
pyridine 95:5 v/v and fractionated by preparative TLC (CHCl3/AcOEt 1:1) to give 21-
acetylated ( Rf 0.36; 3.5 mg, 5% yield):
ESI(+)/HRMS m/z 1226.3551 [M+H]+, calc for C65H56N5O20 1226.3519; m/z
1248.3380 [M+Na]+ calc for C65H55N5O20Na ,1248.3338;
1H NMR (CDCl3): δ (ppm) 3.55 (3H, N-CH3); 3.58 (3H, N-CH3); 3.61 (3H, N-CH3);
3.68 (3H, N-CH3); 3.73 (3H, N-CH3); 5.92 (1H, H-3); 6.07 (1H, H-3); 6.19 (1H, H-3);
6.31 (1H, H-3); 6.42 (1H, H-3); 7.19 (1H, H-7); 7.22 (1H, H-7); 7.24 (1H, H-7); 7.29
(1H, H-7); 7.31 (1H, H-7); 2.25-2.45 (10 x COOCH3,) ;
13C NMR (CDCl3): δ (ppm) 30.8 (N-CH3); 30.9 (N-CH3); 31.2 (N-CH3); 32.2 (N-
CH3); 32.4 (N-CH3); 104.0 (C-7); 104.1 (C-7); 104.4 (C-7); 104.5 (C-7); 104.6 (C-7);
103.6 (C-3); 105.3 (C-3); 105.8 (C-3); 107.7 (C-3); 107.9 (C-3); 120.5; 120.6; 120.7;
120.8; 120.9 ; 125.4 ; 125.8; 125.9; 126.2 ; 126.4; 131.5; 131.9; 133.6; 134.0; 134.2;
134.4; 134.5; 134.5; 134.7; 135.2; 135.5; 135.7; 136.4; 136.5; 138.2; 138.6; 138.6;
138.8; 139.0; 139.1; 20.2-21.0/168-170 (COOCH)

- 186 -
4.4. Computational methods
All optimizations and frequency calculations were carried out at the DFT level,
using the „„hybrid‟‟ PBE0 functional32b
and the 6–31 + G(d,p) basis set.
99
All quantum mechanical computations were performed with the Gaussian 03
suite.155
In the calculations labelled “PCM” the influence of the aqueous medium was
accounted for by the polarizable continuum model (PCM)52,53,76
in its UAHF
parametrization;51
dispersion, repulsion156
and cavitation157
contributions are included.
Electronic absorption spectra of significant tautomers/conformers of 17Q were
estimated on the basis of excitation energy calculations using the time-dependent DFT
(TD-DFT) approach.32b,47,74,75
The PBE0 functional with the large 6-311++G(2d,2p)
basis set was employed for TD-DFT computations. Spectra in solution were computed
with the non-equilibrium formulation of the PCM method.158
To produce graphs of
computed UV-Vis spectra, transitions above 190 nm were selected, and an arbitrary
Gaussian linewidth of 20 nm was imposed.

- 187 -
5. Oxidative polymerization of 5,6-dihydroxyindole (1) in phosphate
buffer/polyvinyl alcohol (PVA)
5.1 Materials and strumentation
L-Dopa, sodium dithionite, hydrogen peroxide (30% solution in water),
horseradish peroxidase (HRP) (donor: H2O2 oxidoreductase, EC 1.11.1.7) type II, PVA
(F.W. 27000 Da) were commercially available and were used as obtained. All the
solvents were of analytical grade quality.
1 was synthesized as reported previously154
Absorption spectra were taken on a spectrophotometer having the cell
compartment thermostated at 25 + 0.2°C. Mass spectra were registered in ESI+ mode
with the cone and the fragmentator voltage set at 4 kV and 80 V, respectively and and
obtained in 1% TFA-methanol.
1H and
13C NMR spectra were recorded at 400 or 300 MHz, respectively.
Analytical and preparative TLC was carried out on silica gel plates (0.25 and 0.50 mm,
respectively) from Merck. TLC plates were visualised using a UV lamp (λ = 254 nm).
HPLC analysis of the reaction mixtures was carried out on a Gilson apparatus
equipped with a UV detector set at 280 nm using a Sphereclone ODS (5 μm,
4.6 × 250 mm) column; 1% v/v acetic acid/acetonitrile 95:5 (v/v) (eluant A),
acetonitrile (eluant B) gradients were used as follows: from 0-5 min 30% eluant B, 5-40
min 30-80% eluant B, 40-50 min 80% eluant B. Flow rate of 1 mL/min was used.
Centrifugations were performed with a Beckman Avant J-25 centrifuge.

- 188 -
5.2 Oxidation of 1 for recording absorption spectra
Oxidation of 1 (8 mM) in 0.1 M phosphate buffer pH 7.0 was carried out with
horseradish peroxidase (HRP; 36 U mL−1
) and H2O2 (20 mM) in the absence or in the
presence of several percentage of PVA; at different times solution was diluted 25 fold
with 0.1 M phosphate buffer pH 7.4 and spectra were recorded. When necessary the
mixture was treated with a solution of NaBH4 in water (20 mM). In PVA-added
medium the buffers used was prepared by dissolving PVA in the appropriate weight
ratio and warming to prevent cluster formation.
5.3 Oxidation of 1 for products analysis
To a 8 mM solution of 1 in 0.1 M phosphate buffer at pH 7.4 with or without 5%
PVA were added horseradish peroxidase (HRP; 36 U mL−1
) and H2O2 (20 mM).
Mixture was analyzed at different times by TLC after being subjected to the following
procedures: reduction with sodium dithionite, acidification to pH 5, extraction with
ethyl acetate and acetylation with acetic anhydride-pyridine 95:5 (v/v). In other
experiments mixture was analyzed by HPLC with 1% vol/vol acetic acid/acetonitrile
95:5 (vol/vol) (eluant A), acetonitrile (eluant B) gradients: 0–5 min 30% eluant B, 5–
40 min 30–80% eluant B, 40–50 min 80% eluant B, flow rate of 1 mL min−1
.
- 189 -
6. Study of oxidative polymerization of 5,6-dihydroxyindole (1) by Dinamic
Light Scattering (DLS) and Small-angle Neutron Scattering (SANS)
6.1 Materials and strumentation
Sodium dithionite, hydrogen peroxide (30% solution in water), horseradish
peroxidase (HRP) (donor: H2O2 oxidoreductase, EC 1.11.1.7) type II, tyrosinase
(monophenol monooxygenase, EC 1.14.18.1), PVA (F.W. 27000 Da) were
commercially available and were used as obtained. All the solvents were of analytical
grade quality.
1 was obtained as described above.154
The light scattering setup was an ALV/CGS-3 based compact goniometer system
from ALV-GmbH (Langen, Germany).
The light source was constituted by a He–Ne laser operating at 632.8 nm with a
fixed output power of 22 mW.
Laplace transform for the parameter g(1)
(t) was performed using the RILT
algorithm incorporated in the commercial ALV/CGS-3 software.159
SANS measurements were performed at 25 °C with the KWS2 instrument located
at the Heinz Meier Leibnitz Source, Garching Forschungszentrum (Germany). Neutrons
with a wavelength spread ∆λ/λ 0.2 were used. A two-dimensional array detector at
three different wavelengths (W)/collimation (C)/sample-to-detector(D) distance
combinations (W7ǺC8mD2m, W7ǺC8mD8m and W19ǺC8mD8m), measured neutrons scattered
from the samples. These configurations allowed collecting data in a range of the
scattering vector modulus between 0.0019 and 0.179 Ǻ-1
. The investigated samples
were contained in a closed quartz cell, in order to prevent the solvent evaporation, and
kept under measurements for a period such as to have ~ 2 million counts of neutrons.
The obtained raw data were then corrected for background and empty cell scattering.
Detector efficiency corrections, radial average and transformation to absolute scattering
cross sections dΣ/dΩ were made with a secondary plexiglass standard.160,161

- 190 -
6.2. Preparation of the samples
For DLS measurements 500 μL of a solution of 1 ( 2 mg, 0.01 mmol) in MeOH
(5 mL) were added to 0.1 M phosphate buffer pH 7.4 (10 mL) without or with several
percentage of PVA ( 0.05, 0.1, 0.5 mM ), in order to obtain a concentration of 0.1 mM.
2 mL of this solution were taken and filtrated on MILLEXHA 0.45 μm filter in a test
tube and peroxidase/H2O2 (7 units and 15 molar equivalents respectively) or tyrosinase
(161 units) were added . DLS measurements were performed at time intervals from
1min to several hours.
For SANS measurements was used deuterated phosphate buffer as solvent in
order to minimize the incoherent scattering contribution to the total cross section. To a
solution 2 mM of 1 in 0.1 M deuterated phosphate buffer pH 7.4 without or with several
percentage of PVA, was added tyrosinase (161 units) and in some tests sodium
dithionite as reductive agent.

- 191 -
7. Computational investigation of the stability of DHI-related catechols, radicals,
and quinonoid forms
7.1 Computational methods
All calculations were performed with the Gaussian package of programs.155
All structures were geometry optimized at the DFT level, with a hybrid functional
(PBE0)32b
and basis set [6-31+G(d,p)]99
; the unrestricted formulation was adopted to
describe radical species. For the iodine atom, a valence basis with pseudopotentials was
employed, augmented with one d function.
Computations were performed in aqueous ambient with adoption of a polarizable
continuum medium (PCM)52,53,76
to account for the influence of the aqueous
environment.
Vibrational-rotational contributions to the free energy were also computed.
Selected single point energy evaluations were also performed at the PBE0 / 6-
311++G(2d,2p) level in vacuo.

- 192 -
8. Other studies: Study of the chemistry of nitrated lipids
8.1 Experimental methods
Sections regarding material, strumentation and synthesis procedures and
characterization of the various nitro-linoleic acids can be found in the publication on
this study (Manini P., Capelli L., Reale S., Arzillo M., Crescenzi O., Napolitano A.,
Barone V., d‟Ischia M. J. Org. Chem 2008,73, 7517-7525)
8.2 Computational methods
All calculations were performed with the Gaussian package of programs.155
Geometries were optimized at the DFT level of theory using the PBE0 functional with
the 6-31+G(d,p) basis set.,99
The PBE0 (also referred to as PBE1PBE) is a hybrid
functional obtained by combining a predetermined amount of exact exchange with the
Perdew-Burke-Ernzerhof exchange and correlation functionals.32b
In control
calculations, the polarizable continuum model (PCM)52,53,76
was used to simulate the
aqueous environment. In view of the faster convergence, a scaled Van der Waals cavity
based on universal force field (UFF) radii162
was used, and surface elements were
modeled by spherical Gaussian functions.163,164
All minima were checked by computing
the harmonic vibrational frequencies. Single-point energy evaluations were also
performed with the recently developed M05-2X density functional151
and the large
6-311+G(2df,p) basis set.
- 193 -
REFERENCES
1. Nordlund, J. J.; Boissy, R. E.; Hearing, V. J.; King, R. A.; Ortonne, J., Eds., The
pigmentary system. Physiology and pathophysiology. 1998, Oxford University
Press, New York
2. Prota, G. Melanins and Melanogenesis, 1992, Academic Press, San Diego CA
3. Prota, G. “The chemistry of melanins and melanogenesis”, in “Fortschritte der
chemie organischer Naturstoffe”, Hertz, W.; Kirby, G. W.; Moore, R. E.; Steglich,
W.; Tamm, Ch., Eds., 1995, vol. 64, Sprinter-Verlag, Wien, p. 93
4. Prota, G.; d'Ischia, M.; Napolitano, A. In The Pigmentary System: Its Physiology
and Pathophysiology; Nordlund, J. J.; Boissy, R. E.; Hearing, V. J.; King, R. A.;
Ortonne, J. P. Eds.; Oxford University Press: New York, 1998; chap. 24, pp. 307-
332
5. Meredith, P.; Sarna , T. Pigment Cell Res. 2006, 19, 572-594
6. Nighswander-Rempel, S. P.; Riesz, J.; Gilmore, J.; Bothma, J.P.; Meredith, P. J.
Phys. Chem. B 2005, 109, 20629-20635
7. Seagle, B.L.; Rezai, K. A.; Gasyna, E. M.; Kobori, Y.; Rezaei, K.A.; Norris, J.R. Jr.
J Am Chem Soc. 2005, 127,11220-11221
8. Bridelli, M. G.; Ciati, A.; Crippa, P. R.; Biophys. Chem.. 2006, 119, 137-145
9. Hong, L.; Liu, Y.; Simon, J. D. Photochem Photobiol. 2004, 80, 477-481.
10. Samokhvalov, A.; Liu, Y.; Simon, J. D. Photochem Photobiol. 2004, 80, 84-88
11. Ye, T., Hong, L., Garguilo, J., Pawlak, A., Edwards, G. S.; Nemanich, R. J.; Sarna,
T.; Simon, J. D. Photochem Photobiol. 2006, 82, 733-777
12. Meredith, P; Riesz, J. Photochem Photobiol. 2004, 79, 211-216
13. McGinness, J.; Corry, P.; Proctor, P. Science. 1974, 183, 853-855
14. (a) de Albuquerque, J. E.; Giacomantonio, C.; White, A. G.; Meredith, P. Eur.
Biophys. J. 2006, 35, 190-195. (b) Meredith, P.; Powell, B. J.; Riesz, J.;
Nighswander-Rempel, S. P.; Pederson, M. R.; Moore, E. G. Soft Matter 2006, 2, 37-
44. (c) Meredith, P.; Powell, B. J.; Riesz, J.; Vogel, R.; Blake, D.; Kartini, I.; Will,
G.; Subianto, S. In: Broadband photon-harvesting biomolecules for photovoltaics.
Collings, A. F.; Critchley, C. Eds 2005, 37-65
15. Cheng, J.; Moss, S. C.; Eisner, M. Pigment Cell Res. 1994, 7, 263-273
16. (a) Simon, J D.; Ito, S. Pigment Cell Res. 2004, 17, 423-424. (b) Clancy, C. M. R.;
Simon, J. D. Biochemistry 2001, 40, 13353-13360. (c) Cheng, J; Moss, S.C.; Eisner,
M. Pigment Cell Res. 1994, 7, 263-273. (d) Zajac, G.W.; Gallas, J.M.; Alvarada-
Swaisgood, A.E. J: Vac. Sci. Technol. B. 1994, 12, 1512
17. (a) Liu Y., Simon J. D., Pigm. Cell Res. 2003, 16, 606 – 618. (b) Liu Y., Simon J.
D., Pigm. Cell Res. 2005, 18, 42 – 48
18. Adhyaru B. B., Akhmedov N. G., Katritzky A. R. , Bowers C. R., Magn. Reson.
Chem. 2003, 41, 466 – 474

- 194 -
19. Lorite G. S., Coluci V. R., da Silva M. I. N., Deziderio S. N., Graeff C. F. O.,
Galvao D. S., Cotta M. A. J. Appl. Phys. 2006, 99, 113511
20. Capozzi V., Perna G., Carmone P., Gallone A., Lastella M., Mezzenga E., Quartucci
G., Ambrico M., Augelli V.,. Biagi P. F, Ligonzo T., Minafra A., Schiavulli L.,
Pallara M., Cicero R., Thin Solid Films 2006, 511–512, 362 – 366
21. Pezzella A., Napolitano A., d_Ischia M., Prota G., Seraglia R., Traldi P., Rapid
Commun. Mass Spectrom. 1997, 11, 368 – 372
22. Ghiani S., Baroni S., Burgio D., Digilio G., Fukuhara M., Martino P., Monda K.,
Nervi C., Kiyomine A., Aime S., Magn. Reson. Chem. 2008, 46, 471 – 479.
23. Stark, K. B.; M. Gallas, J.; Zajac, G. W.; Golab, J. T.; Gidanian, S.; McIntire, T.;
Farmer P. J. J. Phys. Chem. B 2005, 109, 1970-1977
24. Kaxiras E., Tsolakidis A., Zonios G., Meng S., Phys. Rev. Lett. 2006, 97, 218102.
25. Meng S., Kaxiras E. Biophys. J. 2007, 94, 2095 – 2105
26. d'Ischia, M.; Napolitano, A.; Tsiakas, K. Prota, G. Tetrahedron 1990, 46, 5789-5796
27. Napolitano, A.; Corradini, M.G.; Prota, G. Tetrahedron Lett. 1985, 26, 2805-2808.
28. Szabo A., Ostlund N. S. Modern Quantum Chemistry McGraw-Hill Inc., New York
(1989)
29. (a) Hohenberg P., Kohn W. Phys. Rev. 136, B864 (1964); (b) Kohn W., Sham L.J.
Phys. Rev. 140, A1133 (1965)
30. Ceperley D. M., Alder B. J. Phys. Rev. Lett. 1980, 45, 566 (1980)
31. (a) Becke A. D., Phys. Rev. A 1988, 38, 3098; (b) Murray C. W, Laming G. J.,.
Handy N. C, Adams R. D. Chem. Phys. Lett. 1992, 199, 551; ( c) Perdew J. P.,
Zunger A. Phys. Rev. B 1981, 23, 5048
32. (a) Becke A. J. Chem. Phys. 1993, 98, 648 b) Adamo C.,. Barone V J. Chem. Phys.
1999 110, 6158
33. Improta, R.; Barone, V. J. Am. Chem. Soc. 2004, 126, 14320–14321.
34. Benzi, C.; Improta, R.; Scalmani, G.; Barone, V. J. Comp. Chem. 2002, 23, 341–
350
35. Langella, E.; Rega, N.; Improta, R.; Crescenzi, O.; Barone, V. J. Comp. Chem.
2002, 23, 650–661
36. Improta, R.; Mele, F.; Crescenzi, O.; Benzi, C.; Barone, V. J. Am. Chem. Soc.
2002, 124, 7857–7865
37. Jacquemin, D.; Wathelet V.; Perpete, E. A. J. Phys. Chem. A 2006, 110, 9145–
9152
38. Preat, J.; Jacquemin, D.; Wathelet, V.;. Andre, J.M.; Perpete, E. A. J. Phys. Chem.
A 2006, 110, 8144–8150
39. Jacquemin, D.; Preat, J.; Wathelet, V.; Fontaine, M.; Perpete E. A. J. Am. Chem.
Soc. 2006, 128, 2072–2083

- 195 -
40. Crescenzi, O.; Pavone, M.; De Angelis, F.; Barone V. J. Phys. Chem. B 2005, 109,
445–453
41. Aquilante, F.; Cossi, M.; Crescenzi, O.; Scalmani G.; Barone, V. Mol. Phys. 2003,
101, 1945–1953
42. Adamo, C; Barone, V. Chem. Phys. Lett. 2000, 330, 152–160
43. Adamo C., Cossi M., Rega N., Barone V. Processes and Properties of Biological
Systems, L.Eriksson, Ed., Elsevier, 467 (2001)
44. Runge E, Gross E.K.U. Phys. Rev. Lett 1984, 52:997
45. Galli G., Pasquarello A., in Computer Simulation in Chemical Physics, eds. M.P.
Allen, D. J. Tildesley, p. 261, Kluwer: Dordrecht, 1994
46. Pavone M., Barone V., Ciofini I., Adamo C. J. Chem. Phys. 2004, 120, 9167
47. Stratmann R. E.,. Scuseria G. E, Frish M. J. J. Chem. Phys. 1998, 109, 8218
48. Tomasi J., Persico M. Chemical Reviews 1994, 94, 2027
49. Tomasi J., Mennucci B., Cammi R. 2005, 105, 2999
50. Cramer C. J., Truhlar D. G. Chemical Reviews 1999, 99, 2161
51. Barone, V.; Cossi, M.; Tomasi, J. J. Chem. Phys. 1997, 107, 3210–3221.
52. Cossi, M.; Scalmani, N.; Rega, N.; Barone, V. J. Chem. Phys. 2002, 117, 43-54
53. Scalmani, G.; Barone, V.; Kudin, K. N.; Pomelli, C. S.; Scuseria, G. E.; Frisch, M.
J. Theor. Chem. Acc. 2004, 111, 90-100
54. Cossi, M.; Barone, V. J. Chem. Phys. 1998, 109, 6246
55. Cossi, M.; Barone, V. J. Chem. Phys. 2001, 115, 4708-4717
56. Ciofini I., Adamo C., Barone V. J. Chem. Phys. 2004, 121, 6710
57. Benzi C., Crescenzi O., Pavone M., Barone V. Magnetic Resonance In Chemistry
2004, 42, S57
58. Panzella, L.; Pezzella, A.; Napolitano, A.; d‟Ischia, M. Org. Lett. 2007, 9, 1411-
1414
59. Pezzella, A.; Panzella, L.; Crescenzi, O.; Napolitano, A.; Navaratnam, S.; Edge, R.;
Land, E. J.; Barone, V.; d‟Ischia, M. J. Am. Chem. Soc. 2006, 128, 15490-15498
60. Pezzella, A.; Vogna, D.; Prota, G. Tetrahedron: Asymmetry 2003, 14, 1133-1140
61. Tran, M. L.; Powell, B. J.; Meredith, P. Biophys. J. 2006, 90, 743-752
62. Manini, P.; d‟Ischia, M.; Milosa, M.; Prota, G. J. Org. Chem. 1998, 63, 7002-7008
63. (a) Stark, K. B.; Gallas, J. M.; Zajac, G. W.; Eisner, M.; Golab J. T. J. Phys. Chem.
2003, 107, 3061-3067. (b) Stark, K. B.; Gallas, J. M.; Zajac, G. W.; Eisner, M.;
Golab J. T. J. Phys. Chem. 2003, 107, 11558-11562
64. Ito, S. Pigment Cell Res. 2003, 16, 230-236
65. Alaluf, S.; Heath, A.; Carter, N.; Atkins, D.; Mahalingam, H.; Barrett, K.; Kolb, R.;
Smit, N. Pigment Cell Res. 2001, 14, 337-347

- 196 -
66. Powell, B. J.; Baruah, T.; Bernstein, N.; Brake, K.; McKenzie, R. H.; Meredith, P.;
Pederson, M. R. J. Chem. Phys. 2004, 120, 8608-8615
67. Powell, B. J. Chem. Phys. Lett. 2005, 402, 111-115
68. Sobolewski, A. L.; Domcke, W. ChemPhysChem 2007, 8, 756-762
69. Olsen, S.; Riesz, J.; Mahadevan, I.; Coutts, A.; Bothma, J. P.; Powell, B. J.;
McKenzie, R. H.; Smith S. C.; Meredith P. J. Am. Chem. Soc. 2007, 129, 6672-
6673
70. Okuda, H.; Nakamura, A.; Wakamatsu, K.; Ito, S.; Sota, T. Chem. Phys. Lett. 2007,
433, 355-359
71. Il‟ichev, Y. V.; Simon, J. D. J. Phys. Chem. B 2003, 107, 7162-7171
72. Bochenek, K.; Gudowska-Nowak E. Acta Phys. Pol. B 2003, 34, 2775-2790
73. Pezzella A., Crescenzi O., Natangelo A., Panzella L., Napolitano A., Navaratnam S.,
Edge R., Land E.J., Barone V., d'Ischia M. J. Org. Chem. 2007, 72, 1595-1603
74. Bauernschmitt, R.; Ahlrichs, R. Chem. Phys. Lett. 1996, 256, 454–464
75. Casida, M. E.; Jamorski, C.; Casida, K. C.; Salahub, D. R. J. Chem. Phys. 1998,
108, 4439–4449
76. Miertus, S.; Scrocco, E.; Tomasi, J. Chem Phys. 1981, 55, 117-129
77. Adamo, C.; Scuseria, G. E.; Barone, V. J. Chem. Phys. 1999, 111, 2889-2899
78. O‟Neill, L.; Byrne, H. J. J. Phis. Chem. 2005, 109, 12685-12690
79. Santoro, F.; Improta, R.; Lami, A.; Bloino, J.; Barone, V. J. Chem. Phys. 2007,
126(8), 084509
80. Improta, R.; Barone, V,; Santoro, F. Angew. Chem. Int. Edit. 2007, 46, 405-408
81. Wahlström, N.; Slätt, J.; Stensland, B.; Ertan, A.; Bergman, J.; Janosik, T. J. Org.
Chem. 2007, 72, 5886-5889
82. Wu, Y. H.; Lobeck, W. G. Jr.; Ryan, R. P. J. Med. Chem. 1972, 15, 529-534
83. Manini, P.; Pezzella, A.; Panzella, L.; Napolitano, A.; d‟Ischia, M. Tetrahedron
2005, 61, 4075–4080
84. Ishii, H.; Sakurada, E.; Murakami, K.; Takase, S.; Tanaka, H. J. Chem. Soc.,
PerkinTrans. 1 1988, 2387–2395.
85. Mahato, S. B.; Mandal, N. B.; Chattopadhyay, S.; Nandi, G.; Luger, P.; M.
Tetrahedron 1994, 50, 10803–10812.
86. (a) Liu, B.; Tian, H. J. Mater. Chem. 2005, 15, 2681–2686; (b) Vasquez, M.;
Fabbrizzi,L.; Taglietti, A.; Pedrido, R. M.; Gonza´ lez-Noya, A. M.; Bermejo, M. R.
Angew. Chem., Int. Ed. 2004, 43, 1962–1965; (c) Wu, Y.; Peng, X.; Fan, J.; Gao,
S.;Tian, M.; Zhao, J.; Sun, S. J. Org. Chem. 2007, 72, 62–70; (d) Kim, S. K.; Bok, J.
H.;Bartsch, R. A.; Lee, J. Y.; Kim, J. S. Org. Lett. 2005, 7, 4839–4842; (e) Gale, P.
A. Chem. Commun. 2005, 3761–3772; (f) Winstanley, K. J.; Sayer, A. M.; Smith, D.
K Org. Biomol. Chem. 2006, 4, 1760–1767

- 197 -
87. (a) Xu, Z.; Kim, S.; Kim, H. N.; Han, S. J.; Lee, C.; Kim, J. S.; Qian, X.; Yoon, J.
Tetrahedron Lett. 2007, 48, 9151–9154; (b) Duke, R. M.; Gunnlaugsson, T.
Tetrahedron Lett. 2007, 48, 8043–8047; (c) Wu, C.-Y.; Chen, M.-S.; Lin, C.-A.;
Lin, S.-C.; Sun, S.-S. Chem. Eur. J. 2006, 12, 2263–2269; (d) Gunnlaugsson, T.;
Davis, A. P.; Hussey, G. M.; Tierney, J.; Glynn, M. Org. Biomol. Chem. 2004, 2,
1856–1863; (e) Miao, R.; Zheng, Q.-Y.; Chen, C.-F.; Huang, Z.-T. Tetrahedron
Lett. 2004, 45, 4959–4962; (f) Black, C. B.; Andrioletti, B.; Try, A. C.; Ruiperez,
C.; Sessler,J. L. J. Am. Chem. Soc. 1999, 121, 10438–10439
88. (a) Xu, G.; Tarr, M. A. Chem. Commun. 2004, 1050–1051; (b) Chu, Q.; Medvetz,
D.A.; Pang, Y. Chem. Mater. 2007, 19, 6421–6429; (c) Peng, X.; Wu, Y.; Fan, J.;
Tian,M.; Han, K. J. Org. Chem. 2005, 70, 10524–10531
89. (a) Jose, D. A.; Kumar, D. K.; Ganguly, B.; Das, A. Org. Lett. 2004, 6, 3445–
3448;(b) Boiocchi, M.; Del Boca, L.; Esteban-Go´ mez, D.; Fabbrizzi, L.; Licchelli,
M.;Monzani, E. J. Am. Chem. Soc. 2004, 126, 16507–16514
90. He, X.; Hu, S.; Liu, K.; Guo, Y.; Xu, J.; Shao, S. Org. Lett. 2006, 8, 333–336
91. See for example: (a) Pfeffer, F. M.; Lim, K. F.; Sedgwick, K. J. Org. Biomol. Chem.
2007, 5, 1795–1799; (b) Suresh, M.; Jose, D. A.; Das, A. Org. Lett. 2007, 9, 441–
444; (c) Bonizzoni, M.; Fabbrizzi, L.; Taglietti, A.; Tiengo, F. Eur. J. Org. Chem.
2006, 3567–3574; (d) Amendola, V.; Bonizzoni, M.; Esteban-Go´ mez, D.;
Fabbrizzi, L.; Licchelli, M.; Sanceno´ n, F.; Taglietti, A. Coord. Chem. Rev. 2006,
250, 1451–1470; (e) Evans, L. S.; Gale, P. A.; Light, M. E.; Quesada, R. Chem.
Commun. 2006, 965–967; (f) Quinlan, E.; Matthews, S. E.; Gunnlaugsson, T.
Tetrahedron Lett. 2006, 47, 9333–9338
92. (a) Caltagirone, C.; Bates, G. W.; Gale, P. A.; Light, M. E. Chem. Commun. 2008,
61–63; (b) Lin, C.-I.; Selvi, S.; Fang, J.-M.; Chou, P.-T.; Lai, C.-H.; Cheng, Y.-M.
J. Org. Chem. 2007, 72, 3537–3542
93. (a) Connors, K. A. Binding Constants. The Measurement of Molecular Complex;
Wiley: New York, NY, 1987; (b) Benesi, H. A.; Hildebrand, J. H. J. Am. Chem. Soc.
1949, 71, 2703–2707
94. (a) Ghosh, T.; Maiya, B. G.; Wong, M. W. J. Phys. Chem. A 2004, 108, 11249–
11259; (b) Anzenbacher, P., Jr.; Palacios, M. A.; Jursı´kova´ , K.; Marquez, M. Org.
Lett. 2005, 7, 5027–5030; (c) Jose, D. A.; Kar, P.; Koley, D.; Ganguly, B.; Thiel,
W.; Ghosh, H. N.; Das, A. Inorg. Chem. 2007, 46, 5576–5584; (d) Quinlan, E.;
Matthews,S. E.; Gunnlaugsson, T. J. Org. Chem. 2007, 72, 7497–7503
95. Lin, Z. H.; Zhao, Y. G.; Duan, C. Y.; Zhang, B. G.; Bai, Z. P. Dalton Trans. 2006,
3678–3684
96. Okuda, H.; Wakamatsu, K.; Ito, S.; Sota, T. J. Phys. Chem. A 2008, 112, 11213–
11222
97. d‟Ischia M., Napolitano A., Pezzella A., Land E. J., Ramsden C. A., Riley P. A.
Adv. Heterocycl. Chem. 2005, 89, 1-63
98. Corradini, M. G.; Napolitano, A.; Prota, G. Tetrahedron 1985, 42, 2083–2088
99. Francl, M. M.; Pietro, W. J.; Hehre, W. J.; Binkley, J. S.; Gordon, M. S.; DeFrees,
D. J.; Pople, J. A. J. Chem. Phys. 1982, 77, 3654-3665

- 198 -
100. Pezzella A., Iadonisi A., Valerio S., Panzella L., Napolitano A., Adinolfi M.,
d‟Ischia M. J. Am. Chem. Soc. 2009, 131, 15270-15275
101. For examples of indole macrocycles and their applications, see: (a) Black,
D.St.C.; Craig, D.; Kumar, N. Tetrahedron Lett. 1995, 36, 8075–8078. (b)
Bowyer, P. K.; Black, D.St. C.; Craig, D. C. Tetrahedron 2005, 61, 10781–10792.
(c) Chang, K.-J.; Moon, D.; Lah, M. S.; Jeong, K.-S. Angew. Chem., Int. Ed.
2005, 44, 7926–7929. (d) Hiyoshi, H.; Sonoda, T.; Mataka, S. Heterocycles 2006,
68, 763–769. (e) Suk, J.-M.; Chae, M. K.; Kim, N.-K.; Kim, U.-I.; Jeong, K.-S.
Pure Appl. Chem. 2008, 80, 599–608. (f) Santoso, M.; Somphol, K.; Kumar, N.;
Black, D.St. C. Tetrahedron 2009, 65, 5977–5983
102. Meng, S.; Kaxiras, E. Biophys. J. 2008, 94, 2095–2105
103. d‟Ischia M., Napolitano A., Pezzella A., Meredith and Sarna T. Angew. Chem. Int.
Ed. Engl. 2009, 48, 3914-3921. S3914/1-S3914/40
104. Liu, Y., L. Hong, K. Wakamatsu, S. Ito, B. Adhyaru, C. Y. Cheng, C. R. Bowers
and J. D. Simon Photochem. Photobiol. 2005 81, 135–144
105. Simon, J. D., L. Hong and D. N. Peles J. Phys. Chem. B 2008, 112, 13201–13217
106. Nighswander-Rempel, S. P., I. Mahadevan, H. R. Rubinsztein-Dunlop and P.
Meredith Photochem. Photobiol. 2007, 83, 1449–1454
107. Bu'Lock, J. D. & Harley-Mason, J. (1960). Arch.Biochem. Biophys. 91, 189-193
108. Lawrie, K. J., P. Meredith and R. P. McGeary Photochem. Photobiol. 2008, 84,
632–638
109. Hatcher, L. Q. and J. D. Simon Photochem. Photobiol. 2008, 84, 608–612
110. Pezzella, A., A. Iadonisi, S. Valerio, L. Panzella, A. Napolitano, M. Adinolfi and
M. d‟Ischia J. Am. Chem. Soc. 2009, 131, 15270–15275
111. Watt, A. A. R., J. Bothma and P. Meredit Soft Matter 2009, 5, 3754–3760
112. Pezzella, A., L. Panzella, O. Crescenzi, A. Napolitano, S. Navaratnam, R. Edge,
E. J. Land, V. Barone and M. d‟Ischia J. Org. Chem. 2009, 74, 3727–3734
113. Tacx, J. C. J. F., H. M. Schoffeleers, A. G. Brands and L. Teuwen Polymer 2000,
41, 947–957
114. Fennell Evans, D.; Wennerström, H.; The Colloidal Domain (1994), Wiley VCH
115. Pusey, P.N. In Neutrons, X-Ray and Light: Scattering Methods Applied to
SoftCondensed Matter; Lindener, P.; Zemb, T.; Eds. Elsevier: Amsterdam, 2002,
pp 203-220
116. Brown, W. Scattering Methods: A brief Introduction. Lecture notes; 1994,
Uppsala University, Sweden
117. Brehm G. A. and Bloomfield V. A. Macromolecules, 1975, 8(5), 663–665
118. Berne, B.J.; Pecora, R. Dynamic Light Scattering: with Applications to Chemistry,
Biology, and Physics, 2nd
2000, ed. Dover publications, Inc.: New York
119. Cussler, E.L. Diffusion Mass Transfer in Fluid Systems, 2 1997, ed. Cambridge
University Press: Cambridge, UK

- 199 -
120. Kotlarchyk, M.; Chen, S. H. Journal of Chemical Physics 1983, 79, 2461
121. Morel, S.; Terreno, E.; Ugazio, E.; Aime, S.; Gasco, M. R., European Journal of
Pharmaceutics and Biopharmaceutics 1998, 45, 157
122. Pusey, P.N.; Lindener, P.; Zemb T. ,In Neutrons, X-Ray and Light Scattering Eds.
Elsevier: Amsterdam, 2002, pp 203
123. Lambert, C.; Chacon, J. N.; Chedekel, M. R.; Land, E. J.; Riley, P. A.; Thompson,
A.; Truscott, T. G. Biochim. Biophys. Acta 1989, 993, 12-20
124. Hale,J.M.; Parson,R. Transaction of the Faraday Society 1963, 59,1429-1437
125. Freeman, B.A.; Baker, P.R.S.; Schopfer, F.J.; Woodcock, S.R.; Napolitano, A.;
d‟Ischia, M. J. Biol. Chem. 2008, 283, 15515-15519
126. a) Trostchansky, A.; Rubbo, H. Free Radic. Biol. Med. 2008, 44, 1887-1896; b)
Trostchansky, A.; Souza, J.M.; Ferreira, A.; Ferrari, M.; Blanco, F.; Trujillo, M.;
Castro, D.; Cerecetto, H.; Baker, P.R.S.; O‟Donnell, V.B.; Rubbo, H.
Biochemistry 2007, 46, 4645-4653
127. Cui, T.; Schopfer, F.J.; Zhang, J.; Chen, K.; Ichikawa, T.; Baker, P.R.S.;
Batthyany, C.; Chacko, B.K.; Feng, X.; Patel, R.P.; Agarwal, A.; Freeman, B.A.;
Chen, Y.E. J. Biol. Chem. 2006, 281, 35686-35698
128. Lim, D.G.; Sweeney, S.; Bloodsworth, A.; White, C.R.; Chumley, P.H.; Krishna,
N.R.; Schopfer, F.; O‟Donnell, V.B.; Eiserich, J.P.; Freeman, B.A. Proc. Natl.
Acad. Sci. USA 2002, 99, 15941-15946
129. Lima, E.S.; Di Mascio, P.; Rubbo, H.; Abballa, D.S.P. Biochemistry 2002, 41,
10717-10722
130. Baker, P.R.S.; Schopfer, F.J.; Sweeney, S.; Freeman, B.A. Proc. Natl. Acad. Sci.
USA 2004, 101, 11577-11582
131. Baker, P.R.S.; Lin, Y.; J. Schopfer, F.J.; R. Woodcock, S.R.; Groeger, A.L.;
Batthyany, C.; Sweeney, S.; Long, M.H.; Iles, K.E.; Baker, L.M.S.; Branchaud,
B.P.; Chen, Y.E.; Freeman, B.A. J. Biol. Chem. 2005, 280, 42464-42475
132. (a) Napolitano, A.; Camera, E.; Picardo, M.; d‟Ischia, M. J. Org. Chem. 2000, 65,
4853-4860; (b) d‟Ischia, M. Tetrahedron Lett. 1996, 37, 5773-5774; (c) d‟Ischia,
M.; Rega, N.; Barone V. Tetrahedron 1999, 55, 9297-9308
133. Alexander, R.L.; Bates, D.J.P.; Wright, M.W.; King, S.B.; Morrow, C.S.
Biochemistry 2006, 45, 7889-7896
134. Schopfer, F.J.; Baker, P.R.S.; Giles, G.; Chumley, P.; Batthyany, C.; Crawford, J.;
Patel, R.P.; Hogg, N.; Branchaud, B.P.; Lancaster, J.R. Jr.; Freeman, B.A. J. Biol.
Chem. 2005, 280, 19289-19297
135. Wright, M.M.; Schopfer, F.J.; Baker, P.R.S.; Vidyasagar, V.; Powell, P.;
Chumley, P. Iles, K.E.; Freeman, B.A.; Agarwal, A. Proc. Natl. Acad. Sci. USA
2006, 103, 4299-4304
136. Batthyany, C.; Schopfer, F.J.; Baker, P.R.S.; Duran, R.; Baker, L.M.S.; Huang,
Y.; Cervenansky, C.; Branchaud, B.P.; Freeman, B.A. J. Biol. Chem. 2006, 281,
20450-20463

- 200 -
137. Baker, L.M.S.; Baker, P.R.S.; Golin-Bisello, F.; Schopfer, F.J.; Fink, M.;
Woodcock, S.R.; Branchaud, B.P.; Radi, R.; Freeman, B.A. J. Biol. Chem. 2007,
282, 31085-31093
138. Gorczynski, M.J.; Huang, J.; Lee, H.; King, S.B. Bioorg. Med. Chem. Lett. 2007,
17, 2013-2017
139. Chakrapani, H.; Gorczynski, M.J.; King, S.B. J. Am. Chem. Soc. 2006, 128,
16332-16337
140. Gorczynski, M.J.; Huang, J.; King, S.B. Org. Lett. 2006, 8, 2305-2308
141. Lima, E.S.; Bonini, M.G.; Augusto, O.; Barbeiro, H.V.; Souza, H.P.; Abballa,
D.S.P. Free Radic. Biol. Med. 2005, 39, 532-539
142. Woodcock, S.R.; Marwitz, A.J.V.; Bruno, P.; Branchaud, B.P. Org. Lett. 2006, 8,
3931-3934
143. O‟Donnell, V.B.; Eiserich, J.P.; Chumley, F.H.; Jablonsky, M.J.; Krishna, N.R.;
Kirk, M.; Barnes, S.; Darley-Usmar, V.M.; Freeman, B.A. Chem Res. Toxicol.
1999, 12, 83-92
144. O‟Donnell, V.B.; Eiserich, J.P.; Bloodsworth, A.; Chumley, F.H.; Kirk, M.;
Barnes, S.; Darley-Usmar, V.M.; Freeman, B.A. Methods Enzymol. 1999, 301,
454-470
145. Hayama, Y.; Tomoda, S.; Takeuchi, Y.; Nomura, Y. Tetrahedron Lett. 1982, 23,
4733-4734
146. Lin, D.; Zhang, J.; Sayre, L.M. J. Org. Chem. 2007, 72, 9471-9480
147. Trenwith, A.B. J. Chem. Soc. Faraday Trans. 1 1982, 78, 3131-3136
148. Pratt, D.A.; Mills, J.H.; Porter, N.A. J. Am. Chem. Soc. 2003, 125, 5801-5810
149. Tallman, K.A.; Pratt, D.A.; Porter, N.A. J. Am. Chem. Soc. 2001, 123, 11827-
11828
150. Yu, L.; Adams, D.; Gabel, M. J. Agric. Food Chem. 2002, 50, 4135-4140
151. Zhao, Y.; Schultz, N.E.; Truhlar, D.G. J. Chem. Theory Comput. 2006, 2, 364-382
152. Zhao, Y.; Truhlar, D.G. J. Phys. Chem. A 2008, 112, 1095-1099
153. Ros, P.; Schuit, G.C.A. Theor. Chim. Acta 1966, 4, 1-12
154. Edge, R.; d‟Ischia, M.; Land, E. J.; Napolitano, A.; Navaratnam, S.; Panzella, L.;
Pezzella, A.; Ramsden, C.A.; Riley. P. A. Pigment Cell Res. 2006, 19, 443-450
155. Frisch, M. J.; Trucks, G. W.; Schlegel, H. B.; Scuseria, G. E.; Robb, M. A.;
Cheeseman, J. R.; Montgomery Jr., J. A.; Vreven, T.; Kudin, K. N.; Burant, J.
C.; Millam, J. M.; Iyengar, S. S.; Tomasi, J.; Barone, V.; Mennucci, B.; Cossi, M.;
Scalmani, G.; Rega, N.; Petersson, G. A.; Nakatsuji, H.; Hada, M.; Ehara, M.;
Toyota, K.; Fukuda, R.; Hasegawa, J.; Ishida, M.; Nakajima, T.; Honda, Y.;
Kitao, O.; Nakai, H.; Klene, M.; Li, X.; Knox, J. E.; Hratchian, H. P.; Cross, J.
B.; Bakken, V.; Adamo, C.; Jaramillo, J.; Gomperts, R.; Stratmann, R. E.;
Yazyev, O.; Austin, A. J.; Cammi, R.; Pomelli, C.; Ochterski, J. W.; Ayala, P. Y.;
Morokuma, K.; Voth, G. A.; Salvador, P.; Dannenberg, J. J.; Zakrzewski, V. G.;
- 201 -
Dapprich, S.; Daniels, A. D. ; Strain, M. C.; Farkas, O.; Malick, D. K.; Rabuck,
A. D.; Raghavachari, K.; Foresman, J. B.; Ortiz, J. V.; Cui, Q.; Baboul, A. G. ;
Clifford, S.; Cioslowski, J. ; Stefanov, B. B.; Liu, G.; Liashenko, A.; Piskorz, P.;
Komaromi, I.; Martin, R. L.; Fox, D. J.; Keith, T.; Al-Laham, M. A.; Peng, C.
Y.; Nanayakkara, A.; Challacombe, M.; W. Gill, P. M.; Johnson, B.; Chen, W.;
Wong, M. W.; Gonzalez C.; Pople J.A. Gaussian 03 (Revision D.02). Gaussian,
Inc., 2004, Wallingford, CT
156. (a) Floris, F.; Tomasi, J. J. Comp. Chem. 1989, 10, 616-627. (b) Floris, F.;
Tomasi, J.; Pascual-Ahuir, J. L. J. Comp. Chem. 1991, 12, 784-791
157. Pierotti, R. A. Chem. Rev. 1976, 76, 717-726
158. Cossi, M.; Barone, V. J. Phys. Chem. A 2000, 104, 10614-10622
159. Peters R., ALV-5000/E/EPP%ALV-60X0 for WINDOWS-95/NT 4.0 Software,
3.0.1.12, 2003
160. Wignall G. D. and Bates F. S. Journal of Applied Crystallography, 1987, 20(1),
28–40
161. Russell T. P., Lin J. S., Spooner S. and Wignall G. D. Journal of Applied
Crystallography, 1988, 21(6), 629–38
162. Rappé, A.K.; Casewit, C.J.; Colwell, K.S.; Goddard III, W.A.; Skiff, W.M. J. Am.
Chem. Soc. 1992, 114, 10024-10035
163. York, D.A.; Karplus, M. J. Phys. Chem. A 1999, 103, 11060-11079
164. Caricato, M.; Scalmani, G.; Frisch, M.J. In: Continuum Solvation Models in
Chemical Physics; Mennucci, B., Cammi, R. Eds.; John Wiley & Sons:
Chichester, 2007; pp. 64-81

- 202 -
LIST OF PUBBLICATIONS
PEZZELLA ALESSANDRO, PANZELLA LUCIA, NATANGELO ANNA, ARZILLO
M., NAPOLITANO ALESSANDRA, D'ISCHIA MARCO. (2007). 5,6-
dihydroxyindole tetramers with "anomalous" interunit bonding patterns by oxidative
coupling of 5,5',6,6'-tetrahydroxy-2,7'-biindolyl: emerging complexities on the way
toward an improved model of eumelanin buildup. JOURNAL OF ORGANIC
CHEMISTRY vol. 72, pp. 9225-9230 ISSN: 0022-3263.
D'ISCHIA MARCO, CRESCENZI ORLANDO, PEZZELLA ALESSANDRO,
ARZILLO M., PANZELLA LUCIA, NAPOLITANO ALESSANDRA, BARONE
VINCENZO. (2008). Structural effect on the electronic absorption properties of 5,6-
dihydroxyindole oligomers: the potential of an integrated experimental and DFT
approach to model eumelanin optical properties. PHOTOCHEMISTRY AND
PHOTOBIOLOGY vol. 84, pp. 600-607 ISSN: 0031-8655.
MANINI PAOLA, CAPELLI LUIGIA, REALE SAMANTHA, ARZILLO M.,
CRESCENZI ORLANDO, NAPOLITANO ALESSANDRA, BARONE VINCENZO,
D'ISCHIA MARCO. (2008). Chemistry of nitrated Lipids: remarkable instability of 9-
nitrolinoleic acid in neutral aqueous medium and a novel nitronitrate ester product by
concurrent autoxidation/nitric oxide-release pathways. JOURNAL OF ORGANIC
CHEMISTRY vol. 73, pp. 7517-7525 ISSN: 0022-3263.
PANZELLA LUCIA, PEZZELLA ALESSANDRO, ARZILLO M., MANINI PAOLA,
NAPOLITANO ALESSANDRA, D'ISCHIA MARCO. (2009). A novel fluoride-
sensing scaffold by a peculiar acid-promoted trimerization of 5,6-dihydroxyindole.
TETRAHEDRON vol. 65, pp 2032-2036.
ALESSANDRO PEZZELLA, VERONICA AMBROGI, MARIANNA ARZILLO,
ALESSANDRA NAPOLITANO, COSIMO CARFAGNA, MARCO D‟ISCHIA.
(2010). 5,6-dihydroxyindole oxidation in buffer/polyvinyl alcohol: a new model system
for studies of visible chromophore development in synthetic eumelanin polymers.
PHOTOCHEMISTRY AND PHOTOBIOLOGY vol. 86, pp 533-537.
MARIANNA ARZILLO, ALESSANDRO PEZZELLA, ORLANDO CRESCENZI,
ALESSANDRA NAPOLITANO, EDWARD J. LAND, VINCENZO BARONE,
MARCO D‟ISCHIA. (2010). Cyclic Structural motifs in 5,6-dihydroxyindole
polymerization uncovered: biomimetic modular buildup of a unique five-membered
macrocycle. ORGANIC LETTERS vol.12, pp 3250-3253.
Recommended