Integrated Assessment ofAdvanced Energy Technology
OptionsGCEP Research Symposium 2005Frances C. Arrillaga Alumni Center
Stanford University June 16, 2005
John P. WeyantGraduate Research Assistants: Oscar Mascarenhas
& Geoff BlanfordDepartment of Management Science & Engineering
Stanford University

Outline
• Philosophy of Assessment Framework• Structure of Assessment Framework• A Couple of Key Design Issues• Initial Applications of Assessment Framework• Initial Insights From Assessment Framework• Future Directions

Recommendations On GlobalEnergy-Economic Modeling in General
• Don’t Take It Too Seriously
• Don’t Ignore It Either

Revolutionary Energy Technologies and “Other” Climate Policies
ClimatePolicies
RevolutionaryNew Energy Technologies
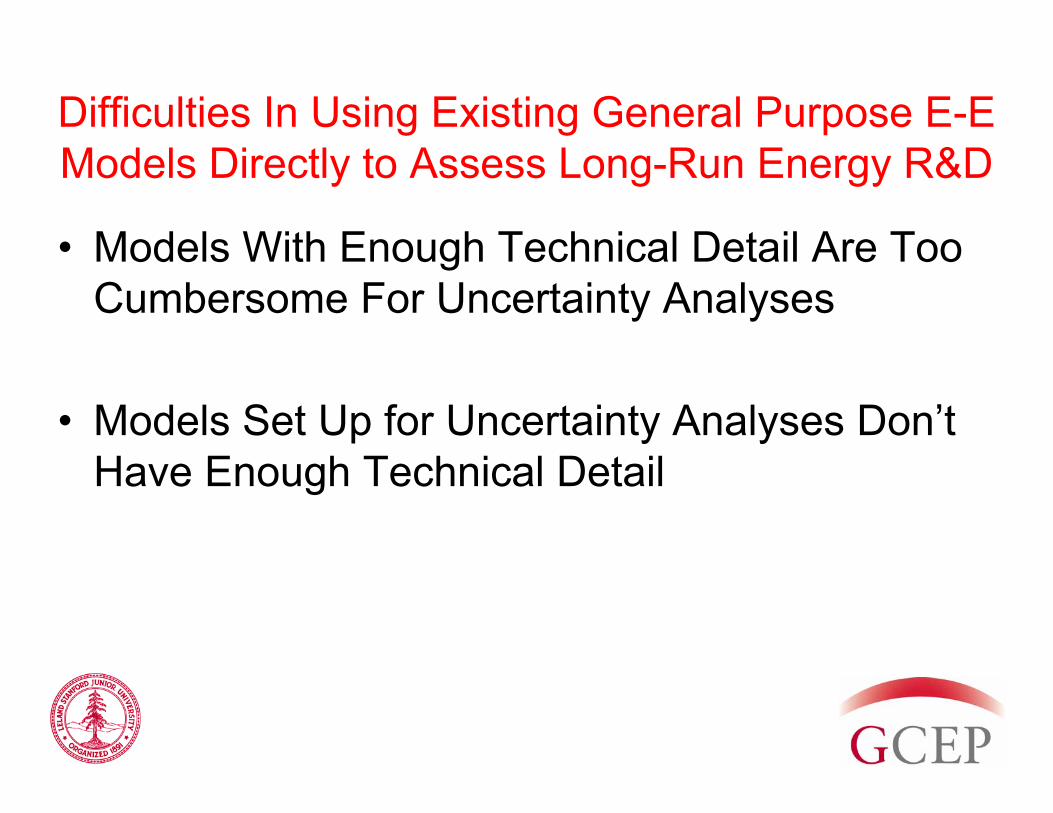
Difficulties In Using Existing General Purpose E-E Models Directly to Assess Long-Run Energy R&D
• Models With Enough Technical Detail Are Too Cumbersome For Uncertainty Analyses
• Models Set Up for Uncertainty Analyses Don’t Have Enough Technical Detail

Design Criteriafor Assessment Framework
• Reflect Uncertainties in:– Future Energy Demands– Future Energy-Environment Policies– Future Energy Prices\Resource Availabilities– Target Technology Performance– Competing Technology Performance
• Focus on Critical Features of GCEP Portfolio:– Value New Technologies Contingent on Availability
of Other New Technologies– Value New Technology Contingent on a Broad
Range of Possible Market Futures
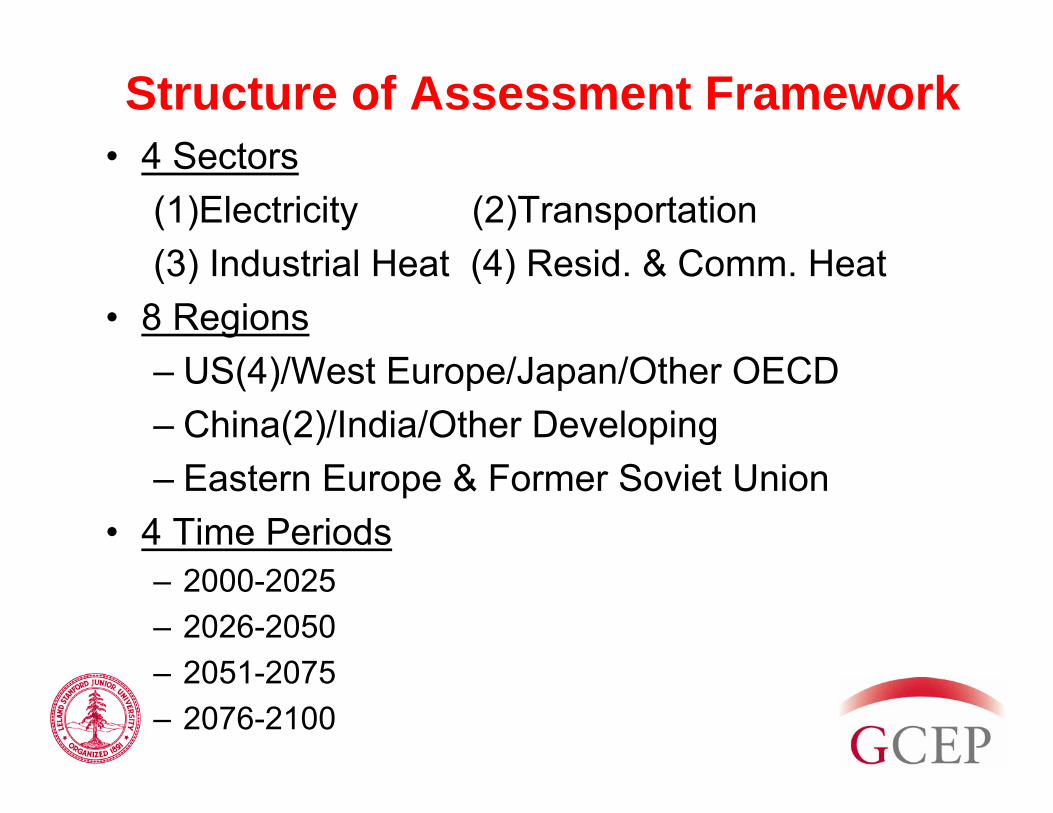
Structure of Assessment Framework• 4 Sectors
(1)Electricity (2)Transportation(3) Industrial Heat (4) Resid. & Comm. Heat
• 8 Regions– US(4)/West Europe/Japan/Other OECD– China(2)/India/Other Developing– Eastern Europe & Former Soviet Union
• 4 Time Periods– 2000-2025– 2026-2050– 2051-2075– 2076-2100

Structure of Assessment Framework(continued)
• Technology Areas – Approx. 250 Technologies– Solar/Wind/Biomass/Sequestration– Advanced Combustion/Hydrogen/Nuclear– Advanced Electric/ Advanced Coal
• Output Metrics– Carbon Emission Reductions/Fuel Use– Total Benefits– Public & Private Benefits– By Technology and Portfolio (Inc. Option Values)– Water/Land/Platinum Use/Price Feedbacks
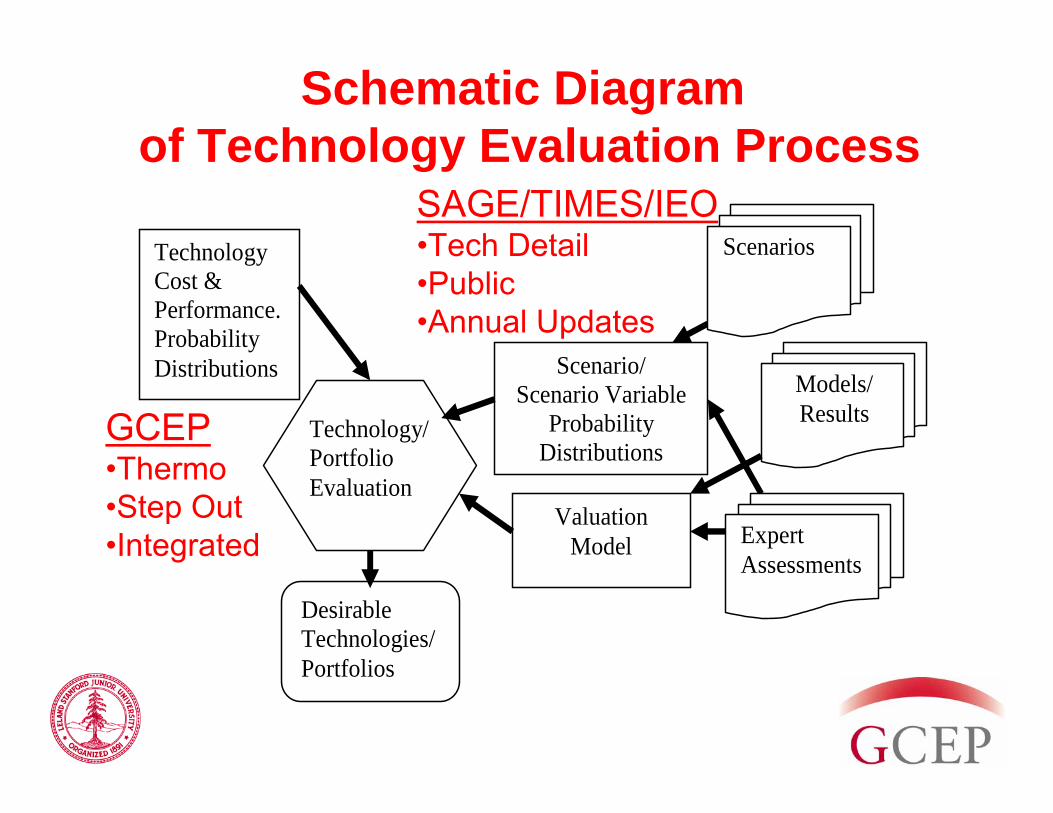
Technology Cost & Performance. Probability Distributions Models/
Results Technology/Portfolio Evaluation
Scenario/ Scenario Variable
Probability Distributions
Valuation Model
Desirable Technologies/Portfolios
Expert Assessments
Scenarios
Schematic Diagramof Technology Evaluation Process
SAGE/TIMES/IEO•Tech Detail •Public•Annual Updates
GCEP•Thermo•Step Out•Integrated

Levelized Cost Comparison for Electric Power GenerationWith $100 per Ton Tax on Carbon (2004-5 Fuel Prices)
0
0.05
0.1
0.15
0.2
0.25
Nuclear Coal Gas CC Gas CT Solar PV SolarThermal
Wind
Generation Technology
Carbon TaxFuel-2004/5Variable O&MFixed O&M ChargesCapital Charges
$/KWHr(2003$s)
Levelized Cost Comparison Concept

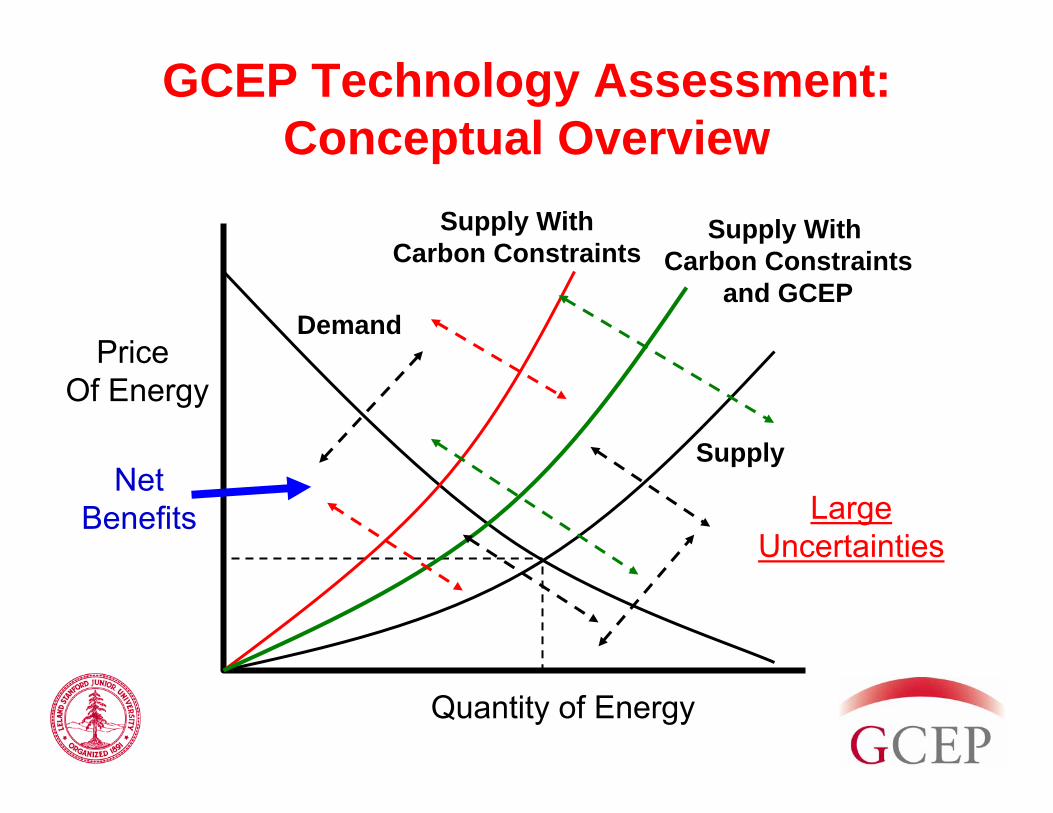
Price Of Energy
Quantity of Energy
Demand
Supply
Supply WithCarbon Constraints
Supply With Carbon Constraints
and GCEP
GCEP Technology Assessment: Conceptual Overview
NetBenefits
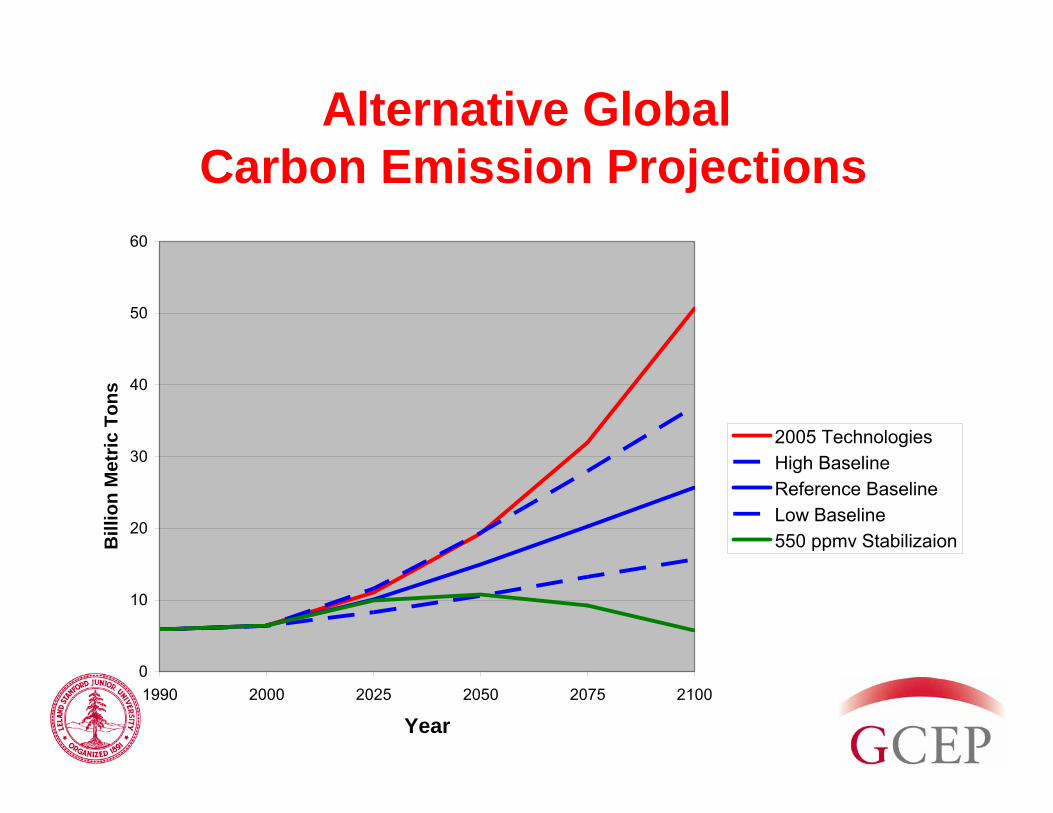
Alternative GlobalCarbon Emission Projections
0
10
20
30
40
50
60
1990 2000 2025 2050 2075 2100
Year
Bill
ion
Met
ric T
ons
2005 TechnologiesHigh BaselineReference Baseline Low Baseline550 ppmv Stabilizaion

Key UncertaintiesConsidered in Integrated Technology
Assessment Framework• Specific to Advanced Technologies
– Cost– Performance– Public Acceptability
• Market Uncertainties– Energy Demand Levels– Oil & Gas Prices– Government Policies
(Esp. Related to Climate Change)
Price Of Energy
Quantity of Energy
Demand
Supply
Supply WithCarbon Constraints
Supply With Carbon Constraints
and GCEP
GCEP Technology Assessment: Conceptual Overview
LargeUncertainties
NetBenefits
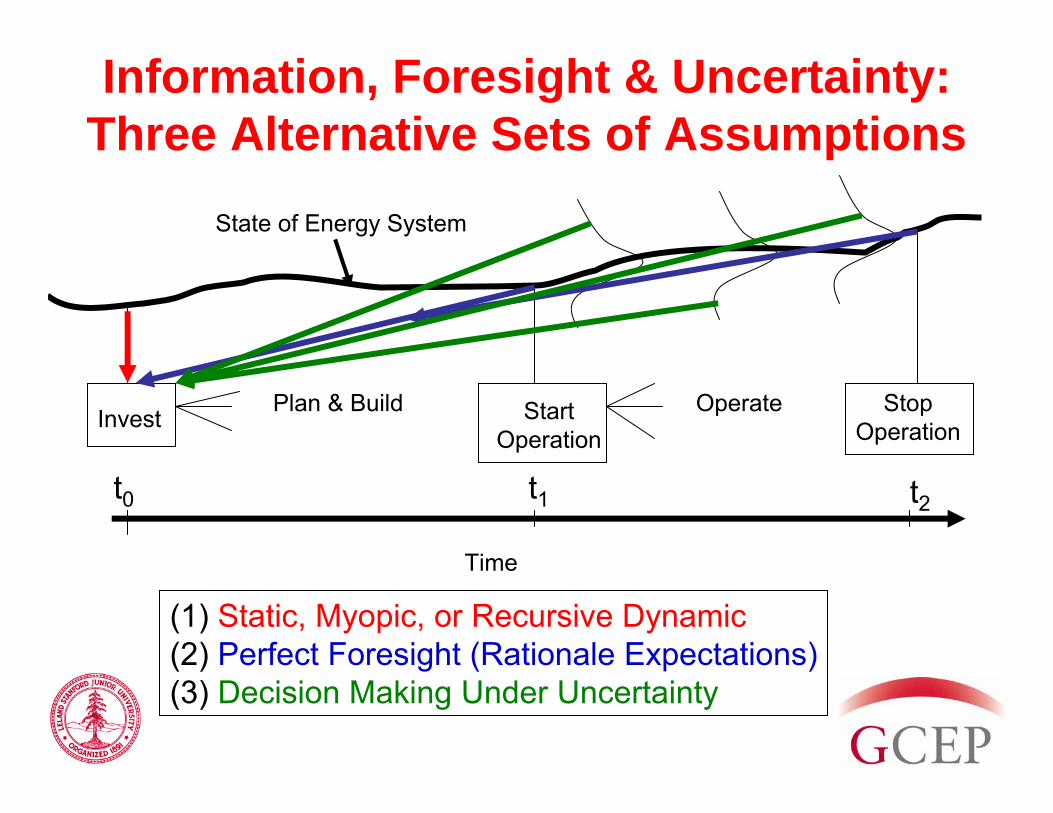
Information, Foresight & Uncertainty:Three Alternative Sets of Assumptions
Invest StartOperation
StopOperation
State of Energy System
Time
Plan & Build Operate
t1 t2t0
(1) Static, Myopic, or Recursive Dynamic(2) Perfect Foresight (Rationale Expectations)(3) Decision Making Under Uncertainty

Information, Foresight & Uncertainty:Three Alternative Sets of Assumptions
Invest StartOperation
StopOperation
State of Energy System
Time
Plan & Build Operate
t1 t2t0
(1) Static, Myopic, or Recursive Dynamic(2) Perfect Foresight (Rationale Expectations)(3) Decision Making Under Uncertainty

Interplay BetweenR&D and Investment Decisions
R&DDecision
C0
InvestmentDecision
C1C1 C2
∞Cost Cost
Time
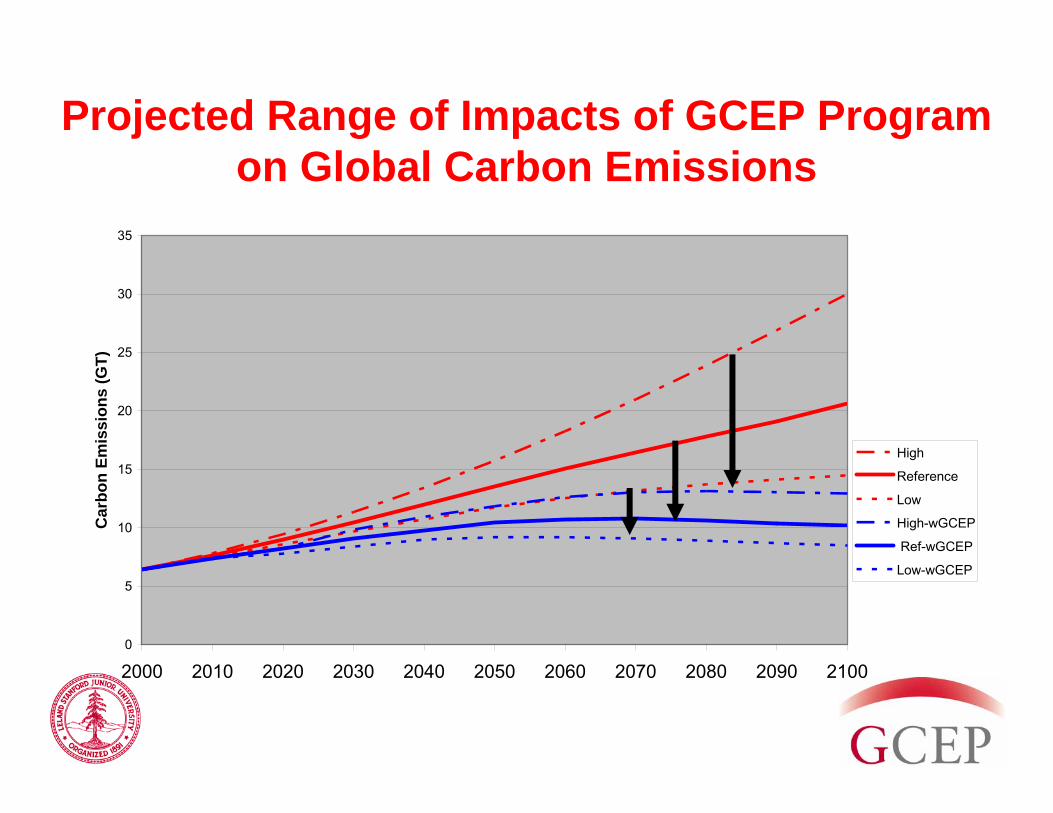
Projected Range of Impacts of GCEP Programon Global Carbon Emissions
0
5
10
15
20
25
30
35
2000 2010 2020 2030 2040 2050 2060 2070 2080 2090 2100
Car
bon
Emis
sion
s (G
T)
High
Reference
Low
High-wGCEP
Ref-wGCEP
Low-wGCEP

Carbon Emission Reductions Resulting From GCEP Renewables R&D
0
0.05
0.1
0.15
0.2
0.25
0.3
25 50 75 100 125 150 175 200 225 250 275 300 325 350 375 400 425 450 475 500 525 550
Cumulative Carbon Emission Reductions Through 2100 (GT)
Freq
uenc
y
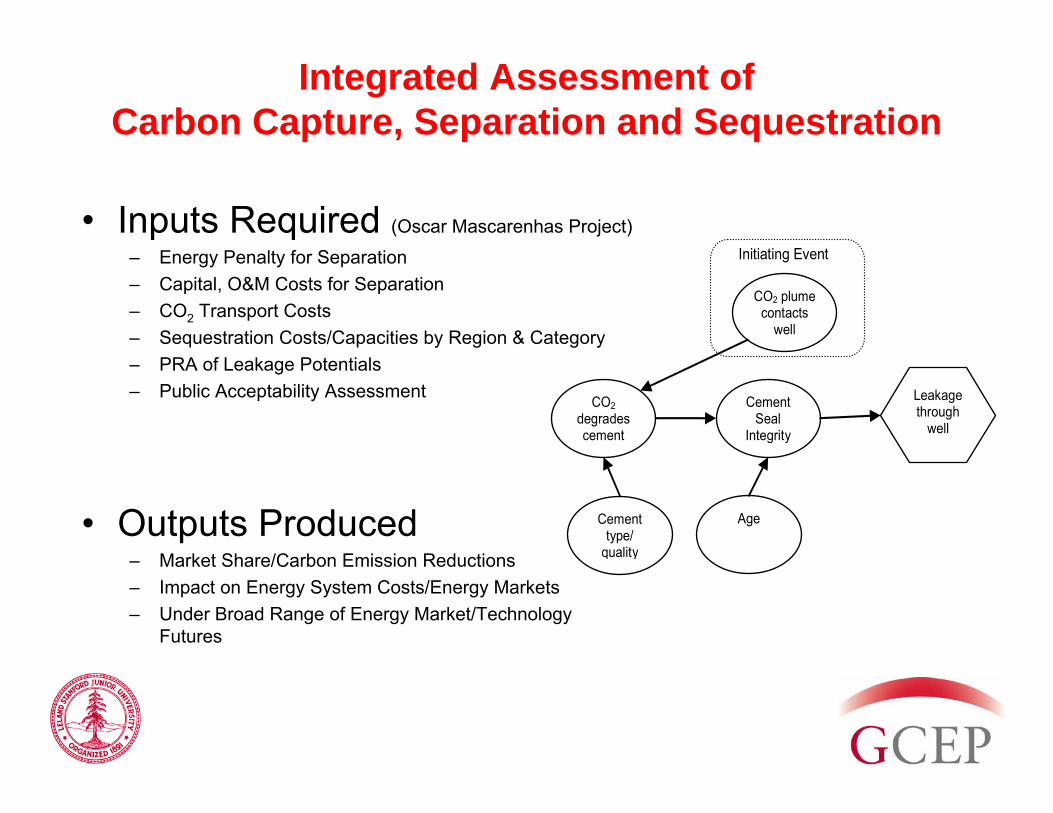
Integrated Assessment ofCarbon Capture, Separation and Sequestration
• Inputs Required (Oscar Mascarenhas Project)– Energy Penalty for Separation– Capital, O&M Costs for Separation– CO2 Transport Costs– Sequestration Costs/Capacities by Region & Category – PRA of Leakage Potentials– Public Acceptability Assessment
Initiating Event
CO2 plume contacts
well
Age
CO2 degrades cement
Cement Seal
Integrity
Cement type/
quality
Leakage through
well
• Outputs Produced– Market Share/Carbon Emission Reductions– Impact on Energy System Costs/Energy Markets– Under Broad Range of Energy Market/Technology
Futures

Carbon Emission Reductions Resulting From GCEP Sequestration R&D
0
0.05
0.1
0.15
0.2
0.25
0.3
25 50 75 100 125 150 175 200 225 250 275 300 325 350 375 400 425 450 475 500 525 550
Cumulative Carbon Emission Reductions Through 2100 (GT)
Freq
uenc
y

Carbon Emission Reductions Resulting From GCEP R&D Portfolio
0
0.02
0.04
0.06
0.08
0.1
0.12
0.14
50 100
150
200
250
300
350
400
450
500
550
600
650
700
750
800
850
900
950
1000
1050
1100
Cumulative Carbon Emission Reductions Through 2100 (GT)
Freq
uenc
y

Contributions of GCEP Technologiesto Carbon Emission Reductions
0
2
4
6
8
10
12
2000 2010 2020 2030 2040 2050 2060 2070 2080 2090 2100
Year
Bill
ion
Tonn
es C
arbo
n
Hydrogen
Renewables
Sequestration
Advanced Combustion

Incremental Value of Renewables Program
0
0.02
0.04
0.06
0.08
0.1
0.12
0.14
0.16
0.18
50 100
150
200
250
300
350
400
450
500
550
600
650
700
750
800
850
900
950
1000
1050
1100
All ProgramsAll Less Renewables
Cumulative Carbon Emission Reductions Through 2100 (GT)
Freq
uenc
y

Preliminary Insights From Assessment Framework• All Areas Have High Option Values
– Can Identify Plausible Cases Leading to 5-10 Times Expected Values– Nuclear & End-Use Efficiency Wildcards– Choice of Policy Instruments Can Affect Substitutability and
Complementarity of Technologies• Advanced Combustion
– Large Benefits Robust Over Many Uncertainties• Carbon Capture and Sequestration
– Potentially Large Benefits– Public Acceptability & Economic Incentive Issues
• Renewables– Large Potential Benefits Possible, But Timing Uncertain– Economic Incentives And/Or Failures Elsewhere Can Accelerate– Key Potential Roles for Niche Markets
• Hydrogen– Large Benefits Possible, But They Depend on Success in A Number
Complementary Areas – Need Careful Internal Co-ordination and External Monitoring
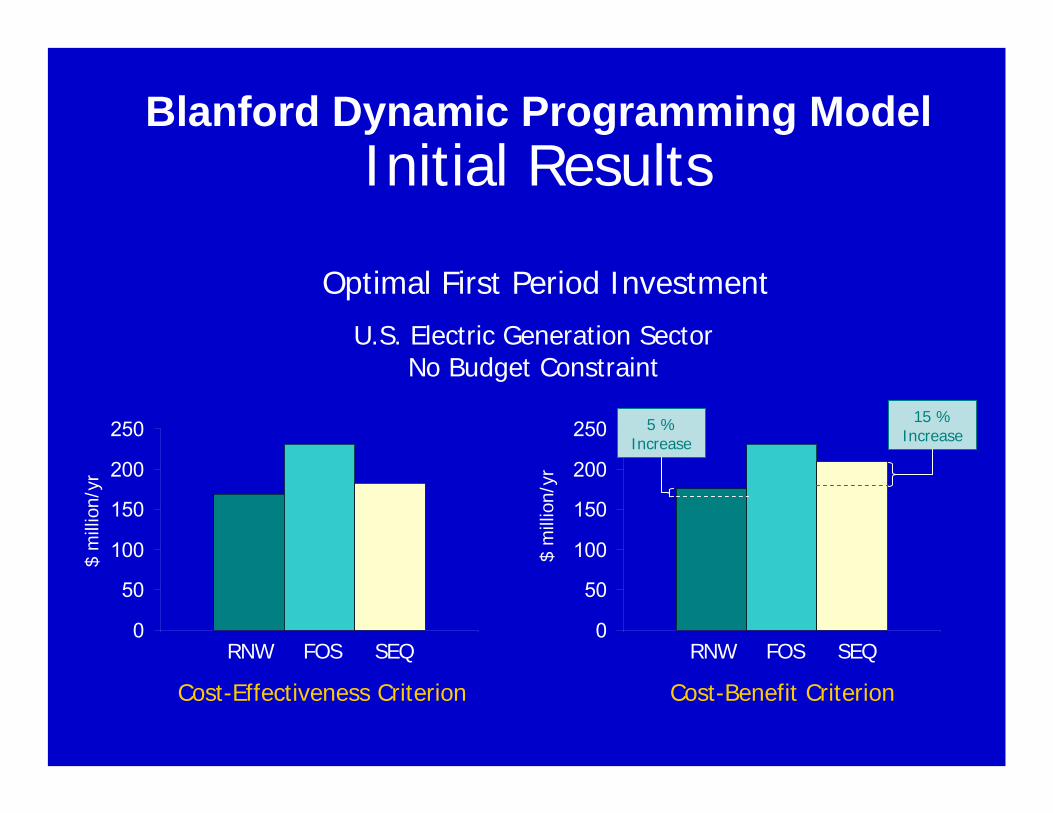
Initial Results
Optimal First Period Investment
RNW FOS SEQ RNW FOS SEQ
$ m
illio
n/yr
$ m
illio
n/yr
U.S. Electric Generation Sector No Budget Constraint
0
50
100
150
200
250
0
50
100
150
200
250
Cost-Benefit CriterionCost-Effectiveness Criterion
5 % Increase
15 % Increase
Blanford Dynamic Programming Model
Thank You!
The End

Many Technologies Can Contribute
??
But What is the Optimal R&D Investment Portfolio?
R&D Investment R&D Outcomes Market Outcomes
Nuclear Carbon SequestrationHydrogen
Renewables Combustion Efficiency

GCEP Approach for Assessment Activities
Initial Technical Area
Assessment
Rigorous Energy System Efficiency
Analysis
Integrated Cost and Environmental
Analysis
Selection of Technical Area for Study
Review of current state of energy systems and research directions
• Literature Studies• Workshops
Thermodynamic Framework
Report on issues, barriers and clear opportunities
framed around thermodynamic principles
applied to the area
Second Law Analysis of Selected
Components
System Integration of Components
Exergy Analysis of Systems
Report on potential for significant improvement
over current energy systems based on fundamental
thermodynamics of systems
System Components and Structure
Performance Limits and Expectations
Report on potential market penetration and projected overall impact on global
greenhouse gas emissions
Scenario Probabilities Cost Modeling
Global Impact on GHGs
Recommended