INSTITUTIONAL PORTFOLIO MANAGEMENT:
A MODEL OF INTEGRATED PLANNING
by
Anne Klees Zulick Milkovich
A dissertation submitted in partial fulfillment
of the requirements for the degree
of
Doctor of Education
in
Education
MONTANA STATE UNIVERSITY
Bozeman, Montana
April, 2016

© COPYRIGHT
by
Anne Klees Zulick Milkovich
2016
All Rights Reserved

ii
DEDICATION
I dedicate this work to two beloved comrades who were called from this world
before my goal was reached: Betsy Palmer and Dewitt Latimer. Although I only knew
Betsy for a few short months, her spirit was indefinably gentle and challenging, energetic
and calm, insightful and inspiring. Dewitt crashed into my life in May of 2012 and
crashed out just as suddenly a year later. In the blessed and tumultuous time that we
worked together, he became a mentor, teacher, protector, supporter, and friend. He saw
something in me that I did not see. His belief in me has given me the confidence and
courage to stand my ground in the face of personal challenge and to follow my own path.
In my heart I communicate with him regularly and know that he is proud.

iii
ACKNOWLEDGEMENTS
I am grateful for the support and encouragement of my committee colleagues on
this journey. My advisor Carrie Myers has guided me toward the finish line in ways that
kept me on track, kept me inspired, and kept me scholarly, yet also allowed me to be
creative and authentic in my own way. Jim Rimpau has been a source of constant
kindness and encouragement, the one who first introduced me to the field of higher
education and first inspired me to pursue this degree. Bob Dickeson has provided the
shoulders on which I stand, leading me into his expertise in program prioritization and
kindly taking me under his wing to help me grow. Chris Fastnow has been a pleasure to
work with over the years and also gave me the mantra to persist by: “Remember, it’s only
a six-week writing project. It may take you months or years to complete, but it’s only a
six-week project.” I am also grateful to Ian Godwin, colleague and instructor, who
challenged me to do better work when I was tempted to cut corners and showed me that I
was perfectly capable of better work, no excuses. I reserve special acknowledgement for
my children Sam, Isabel, and Maryrose. More than just tolerating my constant and almost
obsessive pursuit of knowledge and the long hours of distraction that entailed, they have
enthusiastically supported and encouraged me to follow my dreams and reach my fullest
potential. I could not be more proud! Of all my mentors and guides, to my husband Tom I
have deepest gratitude for shouldering without complaint more than his share of life’s
chores so that I could read and write and think and learn. And talk a lot about it. He has
been the lifelong tree under which I grow.

iv
TABLE OF CONTENTS
1. INTRODUCTION ........................................................................................................ 1
History........................................................................................................................... 5 Yale Report of 1828 ................................................................................................ 7 Civil War Era .......................................................................................................... 7 Scientific Management Movement ......................................................................... 8
World War Years .................................................................................................... 8 Era of Public Contraction........................................................................................ 9
Statement of the Problem ............................................................................................ 11
Defining Institutional Performance....................................................................... 12 Deficiencies in Institutional Performance Measurement ...................................... 13 Deficiencies in Program Prioritization Research .................................................. 16
Purpose ........................................................................................................................ 18
Assumptions ................................................................................................................ 21 Limitations and Delimitations ..................................................................................... 22
Significance of this Work ........................................................................................... 23
Constructs ................................................................................................................... 24
Chapter Summary ....................................................................................................... 28
2. LITERATURE REVIEW ........................................................................................... 31
Introduction ................................................................................................................. 31 Theoretical Model Explaining the Cycle .................................................................... 33 Historical Development of Program Prioritization ..................................................... 40
Sector Contextual Literature ....................................................................................... 44 Revenue Theory of Cost ....................................................................................... 45
Cost Disease Theory ............................................................................................. 45
Accountability Movement .................................................................................... 47 Funding Trends ..................................................................................................... 52
Institutional Contextual Literature .............................................................................. 56
Resource Dependence Theory .............................................................................. 56 Organizational Adaptation .................................................................................... 57 Institutional and Neo-institutional Theory ............................................................ 58 Scientific Management and Social Cognition Theories........................................ 60
Institutional Performance Indicators ........................................................................... 62
Prevailing Performance Indicators ........................................................................ 68 Indicators of Cost .................................................................................................. 70
Indicators of Throughput ...................................................................................... 71 Indicators of Quality ............................................................................................. 74
Economic and Organizational Portfolio Theories....................................................... 75 Portfolio Management Literature ................................................................................ 80 Program Prioritization Literature ................................................................................ 81
v
TABLE OF CONTENTS CONTINUED
Early Program Prioritization Literature ................................................................ 82
Contemporary Program Prioritization Literature .................................................. 83 Program Prioritization and Institutional Characteristics ....................................... 86
Chapter Summary ....................................................................................................... 88
3. PILOT STUDY: ACADEMIC PROGRAM PRIORITIZATION
AMONG INSTITUTIONS OF HIGHER EDUCATION.......................................... 89
Introduction ................................................................................................................. 89 Purpose of the Study ............................................................................................. 90
Theoretical Framework and Related Literature .................................................... 91
Guiding Hypotheses .............................................................................................. 93 Significance........................................................................................................... 94
Methods....................................................................................................................... 94
Participants ............................................................................................................ 95 Procedure .............................................................................................................. 96
Data Analysis ........................................................................................................ 99 Researcher’s Role ............................................................................................... 105
Research Methods Refinement ........................................................................... 105 Results ....................................................................................................................... 107
Discussion ................................................................................................................. 114 Common Drivers of Adaptive Change ............................................................... 114 Approaches and Results ...................................................................................... 116
Institutional Characteristics ................................................................................ 118 Lessons Learned.................................................................................................. 120
Predictions........................................................................................................... 124 Future Research .................................................................................................. 126
4. ORGANIZATIONAL PORTFOLIO MANAGEMENT AND
INSTITUTIONS OF HIGHER EDUCATION ......................................................... 129
Contribution of Authors and Co-Authors ................................................................. 129 Manuscript Information Page ................................................................................... 130 Introduction ............................................................................................................... 131 Background ............................................................................................................... 132 Methods..................................................................................................................... 133
Results ....................................................................................................................... 135
Discussion ................................................................................................................. 135
References ................................................................................................................. 138 Author Biography ..................................................................................................... 139 Planning for Higher Education ................................................................................. 140

vi
TABLE OF CONTENTS CONTINUED
5. HOW INCREMENTAL SUCCESS SLOWS TRANSFORMATIVE
CHANGE AND INTEGRATED PLANNING ACHIEVES IT ............................... 141
Contribution of Authors and Co-Authors ................................................................. 141 Manuscript Information Page ................................................................................... 142 Abstract ..................................................................................................................... 143
How Incremental Success Slows Transformative Change ....................................... 145 How Integrated Planning Assures Transformative Change ...................................... 150 Organizational Portfolio Management from Corporate Industry .............................. 151
Program Prioritization Applied in Higher Education ............................................... 152 Portfolio Management and Program Prioritization Compared ................................. 153 The Framework of Institutional Portfolio Management ........................................... 154 The Sum of the Parts is Greater than the Whole ....................................................... 158
6. INSTITUTIONAL PORTFOLIO MANAGEMENT:
IMPLEMENTING A FRAMEWORK TO IMPROVE
INSTITUTIONAL PERFORMANCE...................................................................... 159
Contribution of Authors and Co-Authors ................................................................. 159
Manuscript Information Page ................................................................................... 160 Abstract ..................................................................................................................... 161
Introduction ............................................................................................................... 162 The Challenges.......................................................................................................... 162 The Solutions ............................................................................................................ 165
About Portfolio Management ................................................................................... 166 About Program Prioritization .................................................................................... 167
Framework for Institutional Portfolio Management ................................................. 168
Foundational Elements........................................................................................ 169 Process Overview................................................................................................ 170 Evaluation Criteria .............................................................................................. 172
Business Case...................................................................................................... 175 Scoring Rubric .................................................................................................... 178
The Story of Waters State University ....................................................................... 180 Setting the Stage ................................................................................................. 181 Communications ................................................................................................. 182
Process Design .................................................................................................... 183 Discover .............................................................................................................. 185
Assess .................................................................................................................. 186 Reallocate ............................................................................................................ 188 Evaluate............................................................................................................... 190 Reflections .......................................................................................................... 191
Conclusion ................................................................................................................ 191

vii
TABLE OF CONTENTS CONTINUED
APPENDIX A: Business Case Template .................................................................. 193
APPENDIX B: Scoring Rubric Template................................................................. 194
7. CONCLUSION ......................................................................................................... 195
Unique Contributions ................................................................................................ 195
Implications and Recommendations ......................................................................... 199 Limitations ................................................................................................................ 202 Future Research ........................................................................................................ 203 A Voyage Just Beginning ......................................................................................... 204
REFERENCES CITED ................................................................................................... 205
viii
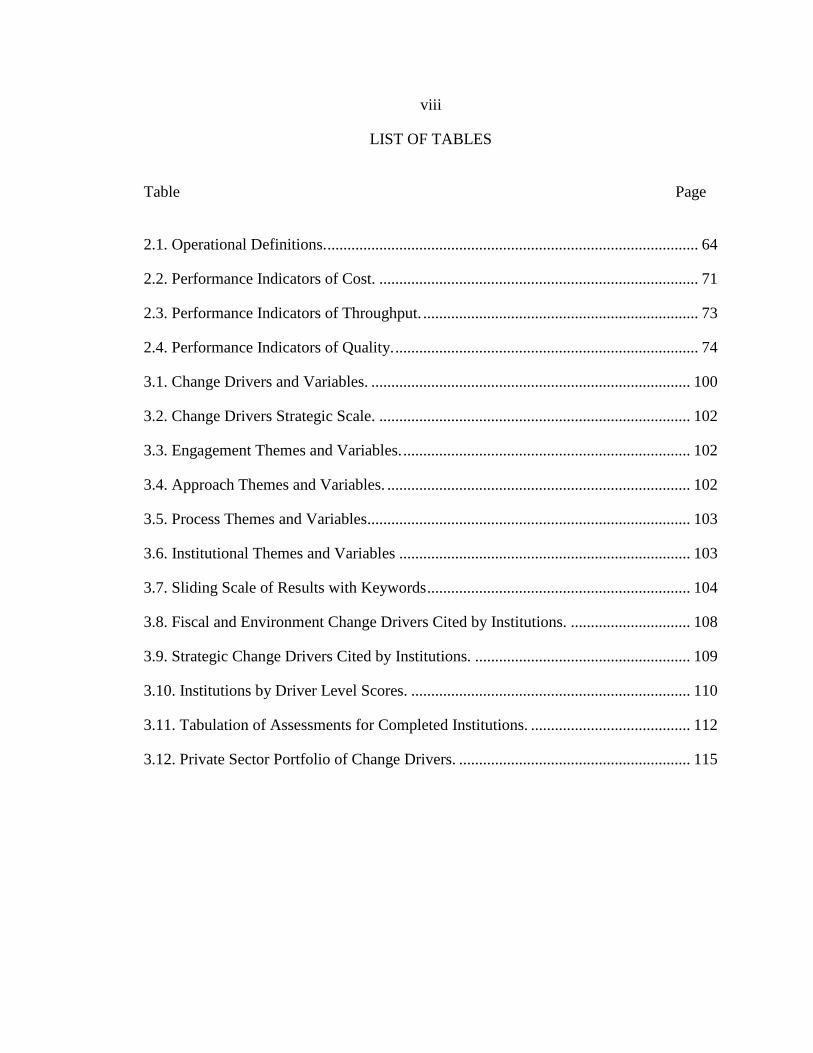
LIST OF TABLES
Table Page
2.1. Operational Definitions. ............................................................................................. 64
2.2. Performance Indicators of Cost. ................................................................................ 71
2.3. Performance Indicators of Throughput. ..................................................................... 73
2.4. Performance Indicators of Quality. ............................................................................ 74
3.1. Change Drivers and Variables. ................................................................................ 100
3.2. Change Drivers Strategic Scale. .............................................................................. 102
3.3. Engagement Themes and Variables. ........................................................................ 102
3.4. Approach Themes and Variables. ............................................................................ 102
3.5. Process Themes and Variables................................................................................. 103
3.6. Institutional Themes and Variables ......................................................................... 103
3.7. Sliding Scale of Results with Keywords .................................................................. 104
3.8. Fiscal and Environment Change Drivers Cited by Institutions. .............................. 108
3.9. Strategic Change Drivers Cited by Institutions. ...................................................... 109
3.10. Institutions by Driver Level Scores. ...................................................................... 110
3.11. Tabulation of Assessments for Completed Institutions. ........................................ 112
3.12. Private Sector Portfolio of Change Drivers. .......................................................... 115

ix
LIST OF FIGURES
Figure Page
2.1. Theoretical Model. ..................................................................................................... 35
2.2. Theoretical Evolution of Founding Theories. ............................................................ 77
3.1. Theoretical Framework Model. ................................................................................. 91
3.2. Distribution of IHEs Across Change Drivers. ......................................................... 107
3.3. Chart of Results by Drivers and Approach. ............................................................. 113
3.4. Exploring Institutions by Drivers and Approach. .................................................... 125
3.5. Work-in-Progress Institutions by Drivers and Approach. ....................................... 125
4.1. Institutional Characteristics Variables. .................................................................... 134
4.2 Results of Chi-Square Analysis of Significance and Effect. .................................... 135
4.3. Frequency and Distribution of Institutional Characteristics. ................................... 136
5.1. Structural Contingency Theory Illustrated............................................................... 146
6.1. Institutional Portfolio Management Process ............................................................ 171

x
ABSTRACT
The pilot study and manuscripts presented in this dissertation introduce
institutional portfolio management as a model of integrated planning to address
institutional performance improvement. Higher education is under pressure to
demonstrate and improve institutional performance in terms of access, cost, and
throughput. Few models exist to guide leaders in implementing transformative change
that will address the problem. Program prioritization is a means to do so yet it is usually
implemented as a one-time solution and not without controversy. A parallel model of
portfolio management is used in private industry as an ongoing and rational practice of
organizational strategy. The parallels of the two disciplines have not previously been
noted in extant literature.
Through my collected body of doctoral work, I provide empirical data on the
processes and outcomes of program prioritization. I establish structural contingency
theory as a central paradigm explaining the cycle of mission fragmentation and program
prioritization in higher education. I evaluate the practices of program prioritization and
illustrate the parallel with its industry cousin portfolio management. I introduce
institutional portfolio management as a model of integrated planning based on the best
practices of both disciplines.
A pilot study published as a conference proceeding finds common themes from
interviews of institutional leaders who have undertaken program prioritization. The
themes revealed a relationship between strategic approach and successful outcomes. They
also provided support for the practice of inclusivity and transparency in the process as
important keys to successful outcomes. The first article searches for correlation between
institutional characteristics and the tendency toward program prioritization. The study
finds that large doctoral and land-grant institutions are more inclined toward program
prioritization than those with more focused missions, such as private liberal arts
institutions. The second article establishes structural contingency theory as a central
paradigm that explains the cycle of mission fragmentation and program prioritization,
inductively reasoned from the history of higher education. It also explains why the
needed transformational change is hindered by administrative success and how a model
of integrated planning can overcome that impediment. The third article elaborates the
practical elements of the framework so that practitioners can deploy it.

1
CHAPTER ONE
INTRODUCTION
“I thank my fortune for it,
My ventures are not in one bottom trusted,
Nor to one place; nor is my whole estate
Upon the fortune of this present year…”
(William Shakespeare, Merchant of Venice,
Act I, Scene I, spoken by Antonio)
The Merchant of Venice was grateful that he had diversified his holdings across
more than one ship’s bottom, more than one location, and more than one year’s
investment return. Shakespeare, through the character of Antonio, provided an early
example of applied economic portfolio theory: the intentional and collective management
of a portfolio of investments to maximize return and minimize risk in alignment with
strategic objectives (Rad & Levin, 2006). Economic portfolio theory posits that when
investments or assets are collectively managed and balanced, the return can be
maximized while the risk can be minimized to better weather the storms of economic
uncertainty (Markowitz, 1990) such as the maritime storms the Merchant’s goods faced
at sea. This practice of collective and intentional management of investments is known
today as portfolio management, which can be applied to organizational investments and
assets as well as financial investments (Donaldson, 2000; Kumar, Haya, & Niu, 2008).
This dissertation presents the application of portfolio management as a potential
means to improve the institutional performance of resource investments in academic and
administrative programs, through a pilot study and three publishable-quality, peer-
reviewed manuscripts. The first manuscript was published by the journal Planning for
2
Higher Education in its Winter 2015 issue. The second manuscript has been accepted for
publication by the journal Planning for Higher Education in the Winter issue with
expected release in March, 2016. The third manuscript has been submitted to the peer-
reviewed journal EDUCAUSE Review and is under review.
Why is it important to explore methods to improve institutional performance?
Higher education is an investment by society and by individuals with an expected return
in public good and private benefit (Duderstadt & Womack, 2003; Kezar, 2004; United
States Department of Education, 2006).
Over the last decades, the expectation of higher education as a public good has
shifted toward a greater emphasis on individual benefits, from an investment in
institutions as generators of national knowledge and advancement toward an investment
as an industry benefiting the students who attend (Gumport, 2005; Kezar, 2004).
Evidence of this shift can be seen in the changing price of higher education, which has
shifted to be borne by the students who attend. From 1960 to 2008, the portion of family
income required to pay for a student’s education, for the lowest quintile of income, has
gone from 13% to 27% (Immerwahr, Johnson, & Gasbarra, 2008). From 1996 to 2006,
public university tuition increased at an average compounded annual rate of 5.98%
compared to a 2.44% increase in the Consumer Price Index over the same time period,
even though instructional expenditures remained largely steady (McPherson &
Shulenburger, 2010). Wellman explains the trend by illustrating that enrollments have
been increasing faster than public support, resulting in lower funding per student, or a
shift in burden of the cost from the public to the students who attend. The decline in per-
student funding is compounded by the fact that the increased number of students is

3
coming from predominantly low-income families and first-generation students (Wellman,
2006).
Regardless of where the return on investment accrues—to society or the
individual—the expectation of better return has been steadily increasing. Both
governments and the general public are scrutinizing the higher education sector with
greater concern and demands for a better return (Archibald & Feldman, 2008a;
Immerwahr et al., 2008; National Center for Public Policy and Higher Education, 2008;
Powell, Gilleland, & Pearson, 2012; Richardson, 2009; Wellman, 2006). In today’s era of
increased funding pressure, public scrutiny, and performance expectations, institutions of
higher education face new challenges that compel them to undertake new practices
toward improved institutional performance.
As the literature review will elaborate, institutional performance itself is not
clearly defined, much less how to measure or improve it. For an institution today,
demonstrating institutional performance, and improvement thereof, can include a range of
activity from communicating anecdotes of institutional and academic achievements to
stakeholders and the general public, to publishing assessment and accreditation
information, to reporting any number of selected performance metrics to system offices
or state governments. Those metrics typically include 4- or 6-year graduation rates,
budget information, number and type of degrees awarded, and any other quantitative data
points that serve to justify the institution’s value.
At the same time that institutions of higher education are facing increased
pressure to improve the return on the investment, they are also facing increased
turbulence and economic uncertainty at the sector level, or industry level in private-sector

4
terms. Michael Porter (1980) defined five forces that shape industries, still known today
as “Porter’s Five Forces,” as being supplier power, threat of substitutes, threat of new
entrants, buyer power, and competitive rivalry. Patricia Gumport illustrates that while
higher education has faced changing industry forces in the past, the current climate is the
first time that all five of the industry forces are changing simultaneously (Gumport,
2007). The changes in industry forces manifest for higher education as: a) society shifting
toward a view of higher education as an individual benefit rather than a social good,
believing the expense should be borne by the individual and not the state; b) state budgets
in fiscal crisis in conjunction with the economic downturn; c) legislatures less inclined to
fund higher education as a result of social pressures and less able to fund higher
education as a result of fiscal pressures, d) for-profit institutions increasing in number and
competitiveness, e) enrollments rising, adding increased pressure on institutional
infrastructure; f) the student demographic shifting away from the traditional post high-
school four-year experience to a profile of older working adults or more transient
students who stop and start or come and go among schools; g) distance education
breaking down geographic boundaries and expanding the competitor base from which
students can select an institution (Birnbaum, 1988; Duderstadt & Womack, 2003; Eckel,
2002). While the Merchant faced high risk on high seas, he did not have an entire nation
demanding improvement in his investment portfolio at the same time.
Private-sector organizations adapt to changing market forces by restructuring their
portfolio of resource investments to align with new objectives (Donaldson, 2000)
similarly to the rebalancing of a financial portfolio in response to changing risk/return
objectives (Kumar et al., 2008). Through a process of evaluation and prioritization, a

5
mission-critical program may be augmented with additional resources while a lower
priority program may see its resources reduced or eliminated. This practice has evolved
into a formal discipline and published standard known as portfolio management.
Portfolio management in the private sector has a close cousin in the higher-
education sector, known as program prioritization1. Program prioritization treats
academic and administrative programs and services as a collection of investments that
should be intentionally and collectively allocated and optimized to achieve strategic
balance. As in private-sector organizations, in institutions of higher education, the
practice of program prioritization likewise comprehensively evaluates and prioritizes all
academic and administrative programs in an effort to optimize investment of institutional
resources, e.g. funding, physical assets, and human time and effort, to meet strategic
objectives (Dickeson, 1999, 2010).
History
Program prioritization has an equally long history in higher education although its
evidence must be interpreted just as portfolio management must be inductively reasoned
from the Merchant’s words. Thelin’s compiled history of higher education (Thelin, 2011)
illustrates that national trends and events at the sector level have fostered recurring cycles
of expansion in higher education followed by attempts at corrective contraction. As
institutions expanded their offerings, they broadened their portfolio of programs and
services, yet often without increased resources to invest. For example, in the later 1800’s,
1 The term program prioritization came into use at the turn of the 21st century when Robert C. Dickeson
popularized program prioritization as a solution to the continually contracting constraints on the higher
education sector (Dickeson, 1999, 2010).

6
institutions responded to the emerging industrial economy by adding professional
programs to attract new students, without additional funding except the hoped-for
increase in students, and without reducing their existing portfolio of traditional programs.
This resulted in mission fragmentation2, where limited resources were thinly spread
among a disparate array of unaligned goals. Mission fragmentation was then followed by
varying degrees of program prioritization, where institutions attempted to realign and
refocus their resources to achieve a more articulated mission. Empirical evidence
supporting the theory of mission fragmentation is found in the second study of this
dissertation, presented in Chapter Four, that demonstrates a relationship between
institutional characteristics and the initiation of program prioritization. Large doctoral
institutions and land-grant institutions, i.e. those that have broad missions and program
portfolios, were found to be significantly more likely to undertake program prioritization
than institutions whose characteristics implied they had a more focused mission, such as a
private liberal arts institution.
Examples of the cycle of mission fragmentation and program prioritization are
illustrated in the following events and eras. In each era, I will illustrate that funding
sources are a theme of change across the sector of higher education (as opposed to the
private sector or public sector) that drives institutional responses.
2 The term mission fragmentation has not been defined in prior literature; I use it here to refer to the
tendency of institutions to distribute resources among many competing demands that are not prioritized or
aligned with mission objectives.
7
Yale Report of 1828
In the late 1700s and early 1800s, higher education institutions were small and
focused on programs in the classics intended to prepare young men for roles in the clergy
or civic leadership. New disciplines in science, geometry, law, medicine and general
preparation for the practical professions began to emerge with increased national interest
in having an educated citizenry (Goodchild, 2007). Institutions responded by expanding
their curricula to meet these interests without a concomitant increase in funding or
resources (Thelin, 2011). This led to the Yale Report of 1828, where the authors
defended a higher education mission focused on the traditional curriculum of classical
study but also called upon their fellow institutions to continually reexamine their purpose
and adapt their programs to the needs of the age including the possibility of “breaking up
its older system” (Mattingly, 2007, p. 245) or in other words, redistributing resources
from the older curriculum to the newer. This is the essence of program prioritization.
Civil War Era
The national context of the Civil War era was characterized by nascent industry
that was becoming an attractive alternative to higher education. Colleges added
professional schools and redefined themselves as universities with broader focus,
attempting to support a broader range of disciplines and competing to attract more
students. Yet other institutions responded with a form of program prioritization directed
at competitive advantage when in 1890 Harvard, Princeton, and Yale asserted individual
missions to differentiate from each other in competition for students (Thelin, 2011). For
example, Northeastern University promoted its work-study program to urban high-school

8
graduates and avoided competing for the prep-school prospect pool, while Boston
College sent its faculty to doctoral programs at Harvard rather than expand into those
advanced degree programs. By delimiting their program expansions to avoid encroaching
on each other’s offerings, they effectively prioritized their resources to align with their
own individual missions.
Scientific Management Movement
In the industrial era of the early 1900’s, the hierarchical structure of industrial
organizations along with the concept of scientific management began to influence higher
education. Educationally oriented foundations also emerged during this era, namely the
Rockefeller Foundation General Education Board in 1903 and the Carnegie Foundation
for the Advancement of Teaching (CFAT) in 1905. The foundation of the Association for
American Universities formed in 1900 defined “great” universities, creating the early
beginnings of rankings and competition for prestige. Institutions competed for
recognition as a destination campus through investments in administrative programs,
athletics, gothic architecture, landscaping, and more. Going against the tide of investment
in administrative program proliferation, Princeton demonstrated program prioritization by
intentionally avoiding growth. Instead they maintained their focus, and therefore the
alignment of their resources, on the college experience as their differentiated mission
(Thelin, 2011).
World War Years
The cycle of mission fragmentation and program prioritization gained speed
during the World War years of 1920-1945. Sector-level changes began with the nation’s
9
call for wartime scientific research, primarily from higher education institutions.
Foundations introduced soft money and generous per capita funding amply covered the
base costs of running an institution and rewarded large class sizes and enrollments. In
response, institutions invested resources to expand student enrollments and attract PhDs.
This resulted in the establishment of postdocs, a proliferation of doctoral programs, and
an increased span of program offerings, with advanced courses, libraries and labs, and
administrative offices (Geiger, 2007). And yet, there was still a rebound toward program
prioritization from the increasingly influential foundations as well as select institutions.
The Carnegie Foundation for the Advancement of Teaching and the Rockefeller
Foundation issued a call for non-duplication of programs throughout the higher education
system to improve efficiency and advocated a corporate model of management “toward
the common goal of rationalizing colleges and universities into effective systems”
(Thelin, 2011, p. 238). Other institutions respond with the Steeples of Excellence
initiatives in the 1950s that augmented prestigious academic programs with additional
resources at the expense of other fields.
Era of Public Contraction
In the latter part of the 20th century, the rapid expansion of the Golden Age met
the realities of contracting public resources. In 1971 the Hodgkinson Study found higher
education in general to have moved into an “omnibus model” to be all things to all people
(Hodgkinson, 1971), echoing the words of Ezra Cornell almost a century earlier who
would build an institution where “any body can study any thing” (Thelin, 2011, p. 301).
Former widespread mission fragmentation now faced declining support across the nation.

10
The practice of program prioritization, although clearly evident in prior eras, for the first
time was formally articulated as a solution for institutions facing fiscal crisis. A
contemporary expert, former college president and co-founder of the Lumina Foundation
focused on higher education improvements, Robert C. Dickeson advocated the practice of
institution-wide program prioritization which gained a small following of institutions
driven either by crisis or an interest in gaining a competitive advantage (Dickeson, 2010).
Driven to maximize their mission and prestige they have repeatedly battled
funding limitations as an obstacle to achieving their goals, with trends in funding sources
becoming a significant driver of institutional change. Of the major sources of funding for
higher education—federal appropriations and research grants, state appropriations,
student tuition, fund-raising and gifts, endowments, and auxiliaries (Duderstadt &
Womack, 2003; Serna, 2013)—trends for two in particular have significant impact on
program prioritization: state appropriations and student tuition. Generous public funding
drove mission fragmentation through increases in undergraduate programs and campus
amenities. New grant funding sources drove mission fragmentation through increases in
doctoral programs and administrative support systems. Reductions in public funding
during eras of contraction triggered fiscal crises that resulted in a loose form of program
prioritization to realign and refocus decreasing resources.
Realigning the resource investments in programs and services, defined as program
prioritization, likewise is an exercise in portfolio management. These two practices,
portfolio management and program prioritization, have evolved in parallel channels
without prior cross-reference yet both apply the same economic portfolio theory to
improve investment results. By whatever name, the practice in higher education may be

11
entering a new era of interest as a means of demonstrating institutional performance in
response to increased public pressures. If portfolio management saved the fortune of the
Merchant of Venice can it save the future of higher education?
Statement of the Problem
Program prioritization may be effective in responding to fiscal crises,
demonstrating better institutional performance, or justifying changed resource allocation
to better align with mission objectives. Eliminating or reducing academic programs for
any reason is a controversial undertaking (Dickeson, 1999, 2010) of second-order change
that is disruptive to institutional cultures and hard to achieve (Kezar, 2014). While
portfolio management in the private sector is a rational and ongoing process to utilize
valuable resources to best effect, program prioritization in the higher-education sector has
been viewed as an attack on academic quality and freedom and has often been applied as
a one-time drastic solution rather than the ongoing process it was meant to be (Milkovich,
2013). The problem is compounded by a higher education environment where scholars do
not have a definitive agreement on ways of defining or measuring institutional
performance, much less how to improve it, although metrics have been proposed and
studied. The problem therefore is twofold: we have deficiencies in the definition of
institutional performance and how to measure it and we have deficiencies in the
application of program prioritization as a hypothetical means to improve institutional
performance. In the following sections I describe the current understanding of
institutional performance and measurement supported by recent studies in the field.

12
Defining Institutional Performance
Although work has been done in the study and understanding of institutional
performance, we do not yet have a clear and commonly agreed upon definition and must
accept proxies, or approximate definitions, to make any progress. The field is narrowing
to a few commonly discussed aspects of institutional performance, referred to as the iron
triangle of cost, quality, and access. According to a study of higher education leaders
conducted in 2008, cost, quality and access are interrelated such that a change in one
must create a reciprocal change in the other (Immerwahr et al., 2008). For example, to
decrease cost one must decrease quality or decrease access to disadvantaged students who
require more services to succeed; to increase quality one must increase cost to achieve it
and so on. In private sector portfolio management (encompassing project management),
there is a similar paradigm known as the triple constraint of budget (cost of the
investment), scope (quality, the specific criteria that will be met), and time (access, or
throughput of graduates) (Project Management Institute, 2008; Rad & Levin, 2006;
Reginato, 2005). Like the iron triangle, a change in one must create a reciprocal change
in another. To decrease the budget (cost) of a project one must decrease the scope
(quality) or decrease the schedule (access, or throughput of graduates). To increase the
scope (quality) one must increase the budget (cost) to achieve it, and so on.
Powell, Gilleland & Pearson narrowed the definition of institutional performance
from the trinomial metaphors of the iron triangle and triple constraint to a binomial
discussion of efficiency and effectiveness. The authors link efficiency to cost, in that
more efficient institutions can offer lower price of education to students, and link
effectiveness to quality, in that more effective institutions better meet the educational

13
goals of stakeholders such as society, students, and parents (Powell et al., 2012). Both are
illustrated as difficult to measure, especially measurements of quality and outcomes, i.e.
the long-term positive impacts of education on society, such as improved health or
reduced welfare (Barnetson & Cutright, 2000).
Deficiencies in Institutional Performance Measurement
While some work has been done to define institutional performance and
reasonable proxies to demonstrate it, developing quantitative metrics, or measurement
units, has still proven elusive. In 2012, the National Research Council published a report
on the measurement of productivity in higher education, noting the difficulty and
complexity of establishing common metrics for measuring institutional performance.
They discuss the difference in measuring inputs, such as student quality or institutional
expenditures, versus measuring outputs, such as graduation rates. While inputs are
valuable to measure, they do not tell us of the effectiveness of those inputs in achieving
desired outcomes nor the efficiency in utilizing them. The benefits of higher education
are also nonmarket in nature, such as the benefit to society of an educated citizenry,
making it difficult to establish a clear and measurable value that a market price can
support. The Council acknowledges that the quantitative measurement of either outputs
or inputs does not take into account the variability or importance of quality. Finally, they
note the added complication of variability by institutional mission and characteristics that
calls into question the validity of a standardized set of performance measures (National
Research Council, 2012). This summary of the measurement of institutional productivity

14
describes the challenges and limitations of using any metrics of institutional performance,
yet also challenges researchers to use what metrics we have, albeit imperfect.
The work of Michael Middaugh (2010) also supports the difficulty of measuring
institutional performance. In studies of institutional expenditures Middaugh found that
the variability of expenditures across institutions was best explained by the differences in
institutional mission. Different missions, such as high research activity versus primarily
instructional activity, drive different curricula. In turn, different curricula require
different levels of investment to support. Research laboratories and teaching hospitals are
far more expensive to maintain than undergraduate libraries, for example. Those
differences must be taken into account when measuring institutional performance.
As noted by the National Research Council, quality is the most difficult aspect of
performance to measure. Rachelle Brooks in 2005 conducted a study of the use of metrics
to measure quality and noted many deficiencies. Either quality was not explicitly defined
or it was operationalized with metrics that were available but not necessarily good
measures. For example, Brooks illustrated that the measurement of research productivity
often uses federal grant awards as a readily-available metric but this does not take into
account research conducted in the social sciences or humanities, nor does it assess the
quality of the research produced (Brooks, 2005). In any study of institutional
performance, researchers must recognize and address the selection and limitations of
available performance metrics.
Similarly, a study conducted in 2002 by Burke, Minassians, and Yang provides a
basis for defining and selecting measures of institutional performance but illustrates that
there is little commonality among the use of performance indicators. The purpose of the

15
study was to determine if performance metrics were aligned with proclaimed policy
issues at the state level regarding higher education. The authors categorized metrics as
inputs, process, outputs, and outcomes. Input indicators refer to the resources received,
such as funding. Process indicators refer to the means used to deliver programs and
services, such as the use of technology3 in the classroom. Output indicators refer to the
quantity of production, such as the number of degrees awarded. Outcome indicators refer
to the quality and benefit of programs and services, such as student satisfaction surveys.
Graduation rates were the most commonly used metric, found in 24 state performance
reports (Burke, Minassians, & Yang, 2002).
Building on those studies, Powell et al (2012) indicated as possible metrics
student credit hours, time to degree, degrees awarded, job placement, student retention,
and graduation rates. They grounded these selections in the works of Middaugh (1996),
Burke, Minassians, & Yang (2002), Hamrick, Schuh, & Shelley (2004), and McPherson
& Shulenburger (2006). Other studies using these metrics include Fung (2010) and Scott
et al (M. Scott, Bailey, & Kienzl, 2006), who used graduation rates to measure
institutional performance, and Shin (2010), who used graduation rates and research
funding expenditures as measures of institutional performance.
While the jury is still out on measures of institutional performance with no
definitive measures yet agreed upon, the field is narrowing to metrics that are both
meaningful and measurable. Throughput, or access, can be demonstrated by graduation
3 Throughout this dissertation, technology refers to information hardware and software, which may or may
not be a capital investment and may or may not be innovative.
16
rates; quality, or scope, can be measured by retention; and cost, or affordability4, can be
measured by expenditures. Or, in the binomial model of efficiency and effectiveness,
efficiency can be measured by cost or expenditures and effectiveness can be measured by
graduation rates or retention. So while imperfect, we have metrics available to measure
institutional performance in reasonably acceptable ways.
Deficiencies in Program Prioritization Research
Little research has been conducted explicitly on the practice or efficacy of
program prioritization as a solution to institutional performance improvement. Scholars
have studied numerous theories of organizational change within institutions of higher
education (de Zilwa, 2007; Kezar, 2014; Kumar et al., 2008) that provide general
guidance to practitioners of program prioritization but effective practices must be
extrapolated from empirical studies of those more generalized theories. What studies
exist on program prioritization itself are limited and few in number.
The study of program prioritization as a practice dates back to the 1970s and
begins to take shape in the 1990s in both empirical and theoretical literature. Shirley and
Volkwein (1978) proposed theoretical criteria and a process for setting priorities among
academic programs. In an early empirical study, Cope and Delaney (1991) illustrated the
use of market-oriented variables used by universities to comprehensively review
programs. They provided a case study of a large Midwestern university that used a
4 Affordability refers to the price students must pay to obtain a college education. Cost does not exactly equate to affordability, as costs are subsidized by public or private support and not purely passed on to students. Generally speaking, however, changes in cost have a direct or indirect influence on affordability, confounded by changes in public or private support.

17
market perspective to strategically align program selection of both academic and non-
academic programs. Gumport (1993) illustrated a growing trend of external
constituencies influencing decision making in program reduction and the shift of program
selectivity from a perspective of public good to industrial and professional demands
(2000), which presumes a degree of prioritization in alignment with external
expectations, i.e. the market perspective that Cope and Delaney described. El-Khawas
(1994) surveyed and described restructuring initiatives conducted by institutions of
higher education in response to financial crisis, which involved some level of
prioritization in selective decision making. Barak and Sweeney (1995) studied the
integration of program review with institutional planning and budgeting, empirically
supporting that incorporating program review improved the planning and budgeting
process. They also noted that public four-year institutions were more likely to incorporate
program review than private two-year institutions, providing a basis supporting
differences in practice according to institutional characteristics. Eckel (2002) studied the
use of decision-making rules when programs were evaluated for potential closure,
shedding some light on how institutions were applying the practice. Similarly, Deer
(2006) provided a case study of a shared-governance approach to program prioritization,
providing some depth into the efficacy of a particular approach. While these studies
provide peer-reviewed research into program prioritization, they are all focused on
narrow aspects of the practice, such as external influences, integration with planning, and
styles of decision making. They provide support for the why and the how of program
prioritization, but do not illustrate a holistic, integrated approach.

18
Beginning in 1999 and continuing into the early 2000s, popular literature
emerges. Robert C. Dickeson (2010) expounded on the extant literature and evangelized
the practice of program prioritization as a means to improve institutional performance
and respond to national critics and legislatures. Other authors also published popular
articles on the subject, applying portfolio management explicitly to academic program
prioritization or to other areas of higher education. Vernon Harper (2013) proposed the
use of portfolio analysis to strategically manage the academic programs of an institution
based on demand, contribution margin, and service to other programs and William
Daigneau (2010) advocated portfolio management as a means of prioritizing resource
allocation for university facilities maintenance and investment. The literature provides
theoretical propositions, empirical cases, and popular study on the subject of program
prioritization, yet the authors in this body of knowledge have not yet drawn the
connection between program prioritization and portfolio management that could benefit
the practice.
Purpose
The purpose of this dissertation is to illustrate the parallels between portfolio
management and program prioritization, and in doing so present a refined means to
improve institutional performance by drawing on the best of both. Institutions have faced
pressures in the past to improve performance in terms of access, affordability, and
quality, but have not faced such a complex set of pressures as they do now (Gumport,
2007). From increased public scrutiny, to fiscal crises, and the gaining popularity of
performance-based funding, institutions must improve their performance in the public

19
eye. Program prioritization is a controversial activity within an institution, with high-
stake risks for administrators who undertake it, often implemented as a one-time fix with
strong internal resistance to a perceived attack on institutional quality. Portfolio
management is closely similar in practice, but implemented as an ongoing discipline with
internal support for a perceived rational strategy to improve organizational performance.
Yet portfolio management has never been applied to institutions of higher education.
Combining the best of both disciplines—the academic emphasis and criteria of program
prioritization with the ongoing practice and rational acceptance of portfolio
management—could address the challenges and limitations in a refined discipline with
the potential to improve institutional performance.
In either case of private corporation or higher education institution, while
performance improvement is defined and measured differently, both seek improvement in
similar ways. For a private industry organization, performance is improved through
portfolio management by augmenting resources on new success strategies, eliminating
under-performing programs or programs that are no longer in alignment with corporate
strategy or mission. Ultimately, improvement in organizational performance is realized
by improved shareholder value and profit. For an institution of higher education,
performance potentially can be improved by augmenting resources on new or high-
demand programs, eliminating under-performing programs or programs that are no
longer in alignment with institutional strategy or mission. Ultimately, and by whatever
means, improvement in institutional performance is recognized by improved performance
metrics such as graduation rates or post-graduate placement.

20
I examine and present the parallels and the refined framework of institutional
portfolio management through a pilot study that led to three peer-reviewed and published,
or publishable, manuscripts:
1. “Academic Program Prioritization among Institutions of Higher Education,” is
a pilot study that was peer-reviewed and accepted by the Association for the
Study of Higher Education for presentation at the annual conference,
November of 2013. In this study I interviewed 20 institutional leaders, either
Provosts or Presidents, who had undertaken a program prioritization initiative.
Through structured inquiry, I gathered information about the motives, context,
approach, process, and outcomes of the initiatives, analyzed themes, and
discovered patterns of relationship between positive outcomes and strategic
approach. This pilot study then led me to pursue further research.
2. “Organizational Portfolio Management and Institutions of Higher Education,”
published in the journal Planning for Higher Education, issue 43(2), Winter
2015. In this article I present a quantitative study of institutions that have
undertaken program prioritization to determine any possible relationship with
institutional characteristics. The study found a correlation between Carnegie
classification and program prioritization, with public comprehensive doctoral
and land-grant institutions more likely to undertake the practice than
institutions with a more focused mission, such as private liberal arts.
3. “How Success Slows Transformative Change and Integrate Planning Achieves
It,” submitted to the journal Planning for Higher Education for its Winter

21
2016 issue, accepted and scheduled to be published in March, 2016. In this
manuscript I illustrate the parallels between program prioritization and
portfolio management for an institutional planning audience, who are familiar
with program prioritization but not with portfolio management. I introduce
structural contingency theory as a central paradigm explaining the slow pace
of improvement in institutional performance efforts. I anchor institutional
portfolio management in the broader context and practice of integrated
planning, espoused by the journal’s professional organization as a means of
improving institutional performance.
4. “Institutional Portfolio Management: Implementing the Framework”
submitted to EDUCAUSE Review March 21, 2016. In this manuscript I
operationalize the institutional portfolio management framework with
practical guiding principles and techniques blended from the parallel
disciplines. I include an example of a fictitious institution that walks the
audience through the recommended process step by step.
Assumptions
This dissertation compiles multiple studies and articles over time; different
assumptions apply to different applications. In this section I compile those underlying
assumptions, as:
1. Interviewees responded honestly and with reasonably objective reflections.
Understandably, as they were responsible for the process and outcomes of
their efforts toward program prioritization, their perspectives were probably

22
biased, but since they understood and valued empirical study, I assumed that
they overcame their bias with reasonable objectivity.
2. Data from the Integrated Postsecondary Educational Data Set (IPEDS),
although self-reported and subject to interpretation, is reliable enough to
analyze and draw conclusions. This is a reasonable assumption as numerous
studies of higher education use IPEDS information.
3. Generalities of sector-level issues, be they higher-education sector or private-
sector, are relevant and applicable to individual institutions. This is a
reasonable assumption as much of the study of higher education is similarly
founded.
4. The sectors of higher education and private industry are different, but enough
similarities exist to derive value and apply knowledge from one to the other.
This is a reasonable assumption as numerous scholars have similarly looked at
both sectors and applied knowledge gained from one to the other.
Limitations and Delimitations
As with the assumptions, different limitations and delimitations exist for different
studies and manuscripts included in this dissertation.
1. A limitation of the qualitative study, wherein I interviewed institutional
leaders, was a sample of convenience, using snowballing technique, and an n
of 20. Although results could not be generalized to the population, patterns of
correlation were evident. This initial study provided a good starting place to
identify areas for further research.

23
2. A limitation of the descriptive study, where I looked at the relationship of
institutional characteristics and the initiation of program prioritization, was
again a sample of convenience and an n of 62.
3. A limitation of the theory-building manuscripts, where I proposed and
elaborated a new framework of institutional portfolio management, was the
obvious fact that the framework was new to the body of knowledge and not
already in practice. I accepted this limitation as a natural consequence of
theory building.
4. A delimitation of the descriptive study was to use only data and variables
available in IPEDS, and only institutions that reported information to IPEDS,
thus eliminating institutions from outside the United States.
Significance of this Work
This work is significant in that it presents unique contributions to the body of
knowledge:
This work applies Structural Contingency Theory to higher education. While
other authors have cited the theory in reference to higher education, the theory
originating in business context has not previously been mapped to extant
theory of higher education. This work grounds Structural Contingency Theory
in extant higher education theory to demonstrate its efficacy.
This work demonstrates parallels between private-industry and higher-
education context: the iron triangle and the triple constraint

24
This work demonstrates parallels between private-industry and higher-
education practices: organizational portfolio management and program
prioritization.
This work provides practical and empirical support for a framework that can
improve institutional performance.
The primary audience for this dissertation are the institutional leaders and
administrators who will potentially undertake an intervention to improve institutional
performance, such as program prioritization or the refined framework of institutional
portfolio management. They will benefit by acquiring a grounded knowledge in the
history, theory, and potential efficacy of such interventions, as well as gain practical
knowledge for the possibilities and limitations of such interventions.
Constructs
While theories of organizational change guide the practice and implementation of
program prioritization in higher education, within that practice are a range of constructs
that are potentially new or that could be differentially interpreted. In this section I define
the primary constructs and variables associated with program prioritization and how
those constructs can influence the process.
The practice of portfolio management is a discipline (Project Management
Institute, 2008), and like other disciplines it has a nomenclature of terms and constructs.
In higher education the practice of program prioritization is similarly developing a set of
useful and commonly used terms and constructs. Creating a common vocabulary and
understanding of the language of program prioritization will prepare constituents and

25
inform the process. Following are some of the common constructs and study variables of
program prioritization with an explanation of how they influence the process.
Three terms I frequently use in this dissertation that bear clarification are
discipline, framework, and practice. A discipline is a branch or field of knowledge, often
studied by academics or put into practice by practitioners. It has agreed-upon constructs
that are commonly known by those familiar with the field. A framework I loosely define
as a defined collection of knowledge, tools, and techniques that practitioners can use as
guidance to operationalize the constructs of their field. It offers practical advice and
application of abstract knowledge. A practice is something that is commonly done and
that may or may not be formally defined. It is just something that people tend to do.
Institutional performance itself as a construct is not consistently and commonly
defined, with many variables available to operationalize it. In the private-sector discipline
of portfolio management, performance operates within a triple constraint of cost, quality,
and throughput wherein a change to one has a corresponding effect on another (Project
Management Institute, 2008). In higher education, this has been similarly expressed as
the “iron triangle” of cost, quality, and access wherein changes to one have a
corresponding effect on another (Immerwahr et al., 2008). These related concepts serve
to triangulate an operationalization of institutional performance.
Mission, as a construct, refers to the overarching purpose of the institution and its
values, goals and scope of intellectual pursuits (Shirley & Volkwein, 1978). Mission
alignment, strategic alignment, and centrality of mission all refer to how closely a
program operationalizes the mission of the institution. Tierney (2008) includes mission as
an essential element in his study of organizational culture and its impact on decision

26
making. While abstractions such as values and goals are not articulated in data sets,
mission as a study variable can be construed from data fields in the Integrated
Postsecondary Data System (IPEDS) such as institutional type (public or private and the
degrees it confers), affiliation (public, private with religious affiliation or private without
religious affiliation), or Carnegie Class (classification based on programs, research,
urbanization, and other considerations). As the intended outcome of program
prioritization or portfolio management is a closer alignment of resources to mission
objectives and institutional purpose (Dickeson, 2010; Eckel, 2002; Gumport, 1993),
mission as a construct is a key input and strong influencer of the process.
Some constructs can only be clearly understood by considering them together
along with their interconnectedness. The iron triangle described by college presidents
reflects the interconnectedness of quality, efficiency, and affordability of education in
which any change to one affects another (Immerwahr et al., 2008; Powell et al., 2012;
U.S. Department of United States Department of Education, 2006). Effectiveness, as a
construct, can be thought of as achieving a desired level of quality through investment in
selected activities. It is sometimes used synonymously with the construct of quality.
Efficiency, as a construct, can be thought of as a ratio of outputs to inputs, of the benefits
achieved for the cost invested, or the return on investment of effort. If the value or cost of
effort exceeds the value or return of benefits, the activity that produces the output is
inefficient (Bowen, 1980; Cameron, 1978; Powell et al., 2012).
Effectiveness is difficult to operationalize as the output of quality is hard to
measure; inputs of resources such as funding are much easier to measure (Cameron,
1978). Everyone knows “quality” when they see it but few people agree on how to define

27
it. Effectiveness is focused on how well quality goals are achieved regardless of inputs;
efficiency is a ratio of outputs to inputs that focuses on how well inputs are used to
achieve a goal. Effectiveness and efficiency influence the process of program
prioritization because of the strongly held values, differing perceptions, and general lack
of agreement on how to define and measure the constructs.
Another construct to understand is productivity, which is also related to
effectiveness and efficiency. Productivity can be thought of as the volume or quantity of
output of a given activity. In higher education there are two distinctly different functions
that generate distinctly different outputs, which can be loosely categorized as learning
and research with different measures of productivity (Middaugh, 2002; National
Research Council, 2012; Shin, 2010). The productivity construct has a strong influence
on the program prioritization process, similarly to effectiveness and efficiency.
Productivity can be interpreted as a measure of how hard or how well one works,
triggering a sense of judgment or questions of inferiority and superiority. Furthermore,
quality and productivity can be inferred to have an inverse relationship (Immerwahr et
al., 2008; Powell et al., 2012), i.e. if you increase the volume of output (e.g. graduating
more students) you must be compromising quality (e.g. creating a diploma mill).
Discussions of productivity are therefore sensitive and potentially charged.
A final pair of constructs that should be considered together are those of
educational cost and price. Cost is the level of expenditure by an institution to produce
degrees; price is what a student pays to obtain that degree. Cost and price are sometimes
used interchangeably but are not synonymous or even directly related. While not
synonymous in meaning, both words can correctly refer to the same thing; for example,
28
the price the institution offers is simultaneously the cost to the student, and much of the
literature thus conflates the two terms. The two are not directly related, as costs to the
institution are not directly passed on to the student. Numerous studies have shown that
while the price of a public education has risen over the last decades, the cost in public
educational expenditures has not; price increases at public institutions are a result of the
decline in state appropriations (Cunningham, Wellman, Clinedinst, & Merisotis, 2001;
McPherson & Shulenburger, 2010; Middaugh, 2005; United States Government
Accountability Office, 2007; Wellman, 2010). Variables to operationalize cost and price
are comparatively straightforward as reported instructional expenditures available from
IPEDS and tuition or college price available from the Delta Cost Project, the Delaware
Study or the College Board (Middaugh, Graham, & Shahid, 2003; Wellman, 2010). The
general public has heard much rhetoric about the “college cost crisis” or the rising cost of
education, generally aimed as a criticism at institutions and their presumed inefficiency.
Few people, including faculty and administrators, have investigated the economic
analyses and scholastic literature on the subject for themselves. Empirical demonstration
that college price increases are not the direct result of institutional mismanagement may
come as welcome news to constituents of program prioritization. At the same time, it
could also lead participants to believe that energy would be better spent publicizing the
facts and lobbying for increased funding.
Chapter Summary
Institutions of higher education are under increasing pressure to demonstrate
effective management of resources to improve efficiency and outcomes. A number of

29
sector-level forces are combining to create a perfect storm demanding transformative
change in institutional management. Student demographics are changing, public
confidence is waning, expectations for measurable outcomes are increasing, and funding
is declining simultaneously (Gumport, 2000, 2007).
The history of higher education illustrates a continual cycle of expansion, leading
to mission fragmentation, and contraction, leading to realignment of resources in
response. The cycle is driven by changes in the environment which require adaptive
response by the institution to maintain high performance. Intentionally managing
academic and administrative programs as an investment portfolio of organizational
resources could be a means to proactively manage the cycle rather than react when forced
to by fiscal crisis or other external pressures.
Portfolio management in the private sector is a discipline that demonstrably can
focus an organization’s resources into better alignment with its mission and competitive
strategy (Daigneau, 2010; Donaldson, 2000; Harper, 2011; Kumar et al., 2008; Project
Management Institute, 2008; Rad & Levin, 2006; Reginato, 2005; Stummer &
Heidenberger, 2003). Portfolio management is based on the economic portfolio theory
developed by Harry Markowitz in the 20th century (Markowitz, 1990) and has been
applied to organizational resource portfolios as well (Donaldson, 2000; Miljkovic, 2006)
but has not been applied to institutions of higher education. Program prioritization in
higher education is a close cousin, likewise a discipline to bring institutional resources
into closer alignment with mission and competitive strategy while mitigating the external
influences that challenge performance (Dickeson, 1999, 2010).

30
Giving institutional leaders an understanding of the disciplines and application in
higher education, and combining the best of both into a single framework, creates new
maps and navigational systems by which to chart their course. From the themes found
among leaders who have undertaken program prioritization, to the empirical evidence
supporting the theory of mission fragmentation, and the proposed framework with
practical application, the work of this dissertation provides leaders with a compass by
which to demonstrate and improve institutional performance in the current era of intense
pressure and public scrutiny on the investment of their holdings.

31
CHAPTER TWO
LITERATURE REVIEW
Introduction
Shakespeare illustrated through the reflections of the Merchant of Venice that
economic portfolio theory was applied and used long before it was recognized in
academic literature. Through inductive reasoning we can extrapolate themes from
literature that are not explicitly defined in ways we might recognize today. Similarly,
program prioritization and its many associated theories can be extrapolated from
literature both past and present. In order to support program prioritization as an influence
on institutional performance, we must first have an understanding of what institutional
performance is and how it can be measured. The body of knowledge in the study of
higher education does not enjoy a commonly shared definition of institutional
performance, or ways and means to measure and analyze it. While authors have
recognized that limitation, they also recognize that we must work our way toward the
ideal understanding using what tools we have rather than wait for an ideal understanding
to present itself. Indicators, metrics, and analytical models are emerging as acceptable
means to define, measure and analyze institutional performance.
In this chapter, I review the theories found in literature using structural
contingency theory as the central paradigm that explains the historical cycle of mission
fragmentation and program prioritization and connects the array of theories around the
economy and sociology of higher education. The literature is organized in a conceptual

32
format around the historical cycle as explained by structural contingency theory to
support the goals of the review. The first goal of this review is to establish that scholars
can reasonably apply structural contingency theory to institutions of higher education. I
meet this goal by illustrating that existing, well-established theories of sociology in
higher education elaborate the components of structural contingency theory. The second
goal of this review is to illustrate the parallels between the disciplines of program
prioritization in higher education and portfolio management in private industry. I meet
this goal by examining the literature in those fields. A third goal of this review is to
summarize the operationalization of institutional performance measurement by reviewing
the most commonly used definitions and metrics. Throughout this review I use a method
of purposive sampling, selecting literature that is commonly cited in the field, as well as
published standards that practitioners follow, and authors who are recognized as thought
leaders in the fields of program prioritization, portfolio management, or performance
measurement.
Because this review is broad in scope, covering multiple fields of practice, I
anticipate that the primary audience for this review has expertise in one of the examined
fields, i.e. institutional sociology, program prioritization, and/or performance
measurement. The audience is not likely to be familiar with portfolio management from
private industry, nor are they likely to have expertise spanning all of the fields within the
review. I therefore explain practices in greater detail where I believe the audience may be
less well versed.
This sets the stage for the introduction of institutional portfolio management as a
framework for integrated planning that builds on the disciplines of program prioritization
33
in higher education and portfolio management in private industry, as presented in the
pilot study and manuscripts that follow the literature review. As a framework for
integrated planning, institutional portfolio management places academic programs at the
heart of the planning process, incorporating all other institutional plans into the process—
from the strategic plan through enrollment, workforce, development, financial, capital,
and technology plans (Dickeson, 2015).
Theoretical Model Explaining the Cycle
Structural contingency theory is a foundational theory in the field of business
strategy, stating that business performance is contingent on the fit between internal
structure and external environment. It explains the interactions of environmental factors,
organizational change, and organizational performance. When something changes in the
external environment, business performance declines until the business is restructured to
return to optimal fit (A. D. Chandler, 2013; Burton R. Clark, 2008; Burton R. Clark,
2008/1966). Structural contingency theory is the central paradigm of a theoretical model
explaining the cycle of expansion and contraction in higher education and also explaining
the internal change resistance that slows the response of institutions to changing external
pressures.
Structural contingency theory posits that a relationship exists between the
structure of the organization and its performance and the nature of that relationship is
contingent on external variables, referred to as contingencies (A. D. Chandler, 2013;
Donaldson, 2001; Lawrence & Lorsch, 1986; Pfeffer & Salancik, 2003; Sporn, 1999).
When an organization is performing well, its structure is well fitted to the external

34
variables, such as market environment, resource availability, or competition. When an
external, or exogenous, variable changes, it changes the relationship between the
organizational structure and the organization’s performance. The organizational structure
is now in misfit with its environment, which in turn degrades performance. For example,
when societal expectations change to demand more job-oriented educational programs, a
for-profit institution or even a two-year institution might shift their program portfolio to
incorporate more job-oriented programs and meet that expectation, where a four-year
institution does not do so as quickly. The four-year institution could be perceived as non-
responsive to societal needs, fostering decreased public support. When performance
degrades sufficiently, it prompts the organization to redesign its structure to bring it back
into fit with its environment. Forces internal, or endogenous, to the organization affect
how the organization adapts to the changed environment. Lex Donaldson (2001) states
that managers make unit-level changes that improve unit-level performance sufficiently
to satisfy the concern; or as the term has been coined, managers satisfice. Donaldson goes
on to say that because unit-level managers do not see overall performance effects and are
motivated to satisfice, performance improves just sufficiently to prevent a crisis but
remains sub-optimal. To carry through the example, an academic dean might initiate a
more job-oriented program that in turn engenders public support, albeit on a small scale,
but sufficient to assure the dean that she, at least, is responsive within the appropriate
academic discipline. Concurrently, the career services unit could increase its emphasis on
practical job opportunities for existing program majors. These incremental changes are
positive and satisfy the unit leaders, but are not sufficient to transform the institution
enough to satisfy the changed expectations of society. An organization can remain in this
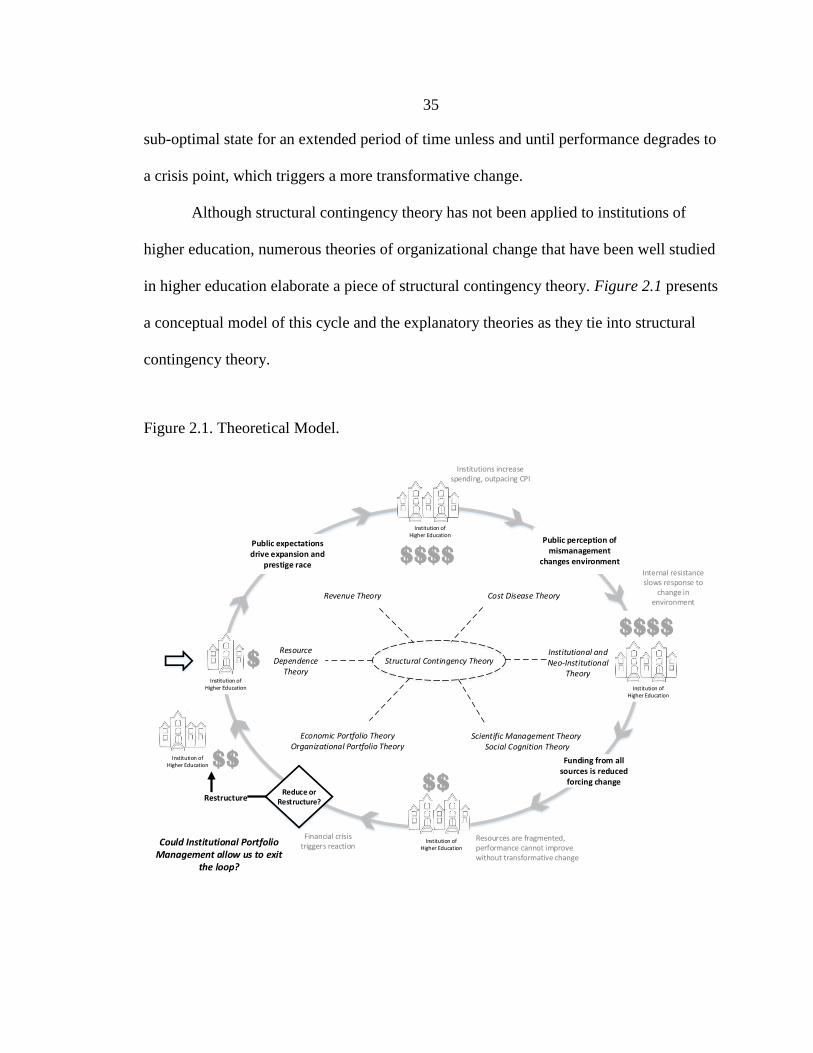
35
sub-optimal state for an extended period of time unless and until performance degrades to
a crisis point, which triggers a more transformative change.
Although structural contingency theory has not been applied to institutions of
higher education, numerous theories of organizational change that have been well studied
in higher education elaborate a piece of structural contingency theory. Figure 2.1 presents
a conceptual model of this cycle and the explanatory theories as they tie into structural
contingency theory.
Figure 2.1. Theoretical Model.
$
Public expectations drive expansion and
prestige race
Public perception of mismanagement
changes environment
Institution of Higher Education
Institution of Higher Education
$$
Internal resistance slows response to
change in environment
Funding from all sources is reduced
forcing change
Financial crisis triggers reaction
Reduce or Restructure?
$$
Restructure
Resource Dependence
Theory
Revenue Theory
Institutional and Neo-Institutional
Theory
Could Institutional Portfolio Management allow us to exit
the loop?
$$$$
Institution of Higher Education
Structural Contingency Theory
Resources are fragmented, performance cannot improve without transformative change
Scientific Management Theory Social Cognition Theory
Economic Portfolio Theory Organizational Portfolio Theory
Institutions increase spending, outpacing CPI
Cost Disease Theory
$$$$
Institution of Higher Education
Institution of Higher Education

36
The cycle goes round and round, so like a carousel, one can jump into the
explanation at any point. A logical place to start is with the early dependence of
institutions on the resources available to them, hypothetically before any change in the
environment occurred. From that point reading clockwise:
Resource dependence theory establishes that institutions are influenced by
external resources: Organizations are dependent on the ecosystem of resources
available to them, including funding, and are driven by the need to obtain and
maintain adequate resources (Burton R. Clark, 2008/1966; Pfeffer &
Salancik, 2003).
Revenue theory explains the prestige race: Institutions spend as much money
as they can obtain to meet rising expectations, an explanation for the
escalating price of higher education (Bowen, 1980).
Cost disease theory supports price inflation relative to CPI: Higher education
is a service-intensive industry of highly-skilled, and therefore higher-priced,
labor. Technological innovations save labor costs in the manufacturing sector
but do not save labor costs in the service industries; in fact, savings in
manufacturing eventually further drive up the labor costs of service industries,
outpacing the Consumer Price Index (Archibald & Feldman, 2008a).
Institutional and neo-institutional theory rationalizes why institutions seem
unresponsive to external pressures: Institutions are collections of individuals
whose decisions are motivated by pressure to conform to social norms and
isomorphism (Oliver, 1991) and who thereby enact an environment of
collective decision making (Tierney, 2008).
37
Scientific management theory rationalizes how institutions might respond to
external pressures: Organizations are run by rational decision makers who
scan the environment for information and resource availability, then
systematically plan and manage performance accordingly (Kezar, 2014).
Social cognition theory explains the difficulty of transformative change:
Individuals within an organization must challenge deeply held beliefs and
assumptions to create a new paradigm, and enough individuals must accept
the new paradigm for a large-scale or deep-scale change to be realized (Kezar,
2014)
Economic portfolio theory is a foundation to intentional performance
management: Assets can achieve higher performance if managed as a
collection that are diversified and offset against each other to optimize risk
and return on investment (Markowitz, 1990).
Organizational portfolio theory applies economic portfolio theory to
organizational performance: Organizational resources function as a collection
of assets that behave like an economic portfolio in that the organization can
achieve higher performance if its resources (financial, human, facilities, etc.)
are managed as a collection to optimize risk and return (Donaldson, 2000).
Structural contingency theory ties all of the supporting theories together by
explaining the relationship between organizational structure and performance. The
performance of an organization is contingent on organizational structure being well fitted
to external variables (resource dependence theory), such as resources or funding among
others, which change. Changes in external variables (cost theories) require the

38
organization to restructure to return to fit with its environment and therefore return to
high performance. However, internal forces, especially managers, unintentionally
counteract and slow the response (institutional and neo-institutional theory) in a sub-
optimal performance state until a crisis point is reached and a transformative change
(social cognition theory) is needed to recover. Organizations eventually recognize the
overall performance trend (scientific management theory) and intentionally restructure in
response (economic and organizational portfolio theories), returning to fit with
environmental variables, until the environmental variables change once again.
The intentional restructuring can be done in a variety of ways: one of them being
program prioritization and another the related practice of portfolio management. As I
illustrate in this dissertation and elaborate in greater detail in following sections, program
prioritization and portfolio management have evolved in parallel and share many
characteristics. Program prioritization in higher education evaluates all academic and
administrative programs against a set of preselected criteria to determine alignment with
institutional priorities and make resource allocation decisions accordingly, whether
augmenting a program with additional funding, reducing funding, or eliminating a
program entirely. Portfolio management works the same way in private industry. The
major differences are that program prioritization is often applied as a one-time fix and
met with resistance and suspicion that it is a willful and subjective attack; portfolio
management is applied as an ongoing process and recognized as a rational decision-
making process.
The model proposes that the refined framework of institutional portfolio
management, which blends program prioritization with portfolio management, could

39
intervene to manage the cycle by continually realigning resources with strategic
objectives in response to changes in external variables such as funding and public
perception. In this framework, the external environment and institutional performance is
continually analyzed; new academic or administrative programs are evaluated in the same
manner for their potential to meet institutional goals and performance objectives. When
new programs are added, or when a change in the external environment occurs, resources
are redistributed within the portfolio to accommodate the new program or the exogenous
change with the intent of maintaining or improving overall performance. Assessment of
existing programs informs portfolio management: struggling programs are evaluated for
resource redistribution, either augmenting or reducing resources or eliminating the
program altogether if it no longer serves institutional priorities or is feasible to maintain.
Also as part of this practice, changing environmental demands are continually monitored
and predicted and institutional strategies are adapted, which in turn influences goals and
subsequent resource redistribution. All of this is done persistently and in slow motion,
rather than reactively. In this manner portfolio management therefore intentionally and
continually maintains alignment of resources with strategic objectives to maintain high
performance in relation to external pressures. Intentional and ongoing management of
institutional resources could mitigate the cycle of expansion and contraction that
heretofore in higher education has been a reactive cycle seemingly beyond control of
institutional leadership.
The work of this dissertation also supports the application of structural
contingency theory in higher education. The first study I conducted, presented in Chapter
Three, found evidence in the interviews of institutional leaders of cultural resistance to
40
the dramatic change of program prioritization. One leader described the intent of
undertaking program prioritization that did not gain traction within the institution for
several years, until a budget crisis created a sense of urgency for change. The article
presented in Chapter Five illustrates the disaggregated approach to planning that many
institutions satisfice with, by having a collection of unit level plans, at best connected to
the institutional strategic plan, but typically not connected with each other. Each unit
manager is planning improvements and strategies within the scope of their bounded
rationality and not in a holistic manner.
In the following sections of this review I organize literature around structural
contingency theory by starting with the historical development of the cycle. I then present
literature of the operating context at both the sector and institutional levels that
influenced the cycle. To support the use of variables and discussion of institutional
performance in the manuscripts, I summarize the literature on performance indicators,
metrics, and analysis. I conclude with literature covering portfolio management and
program prioritization to elaborate the details of the disciplines and their parallels.
Historical Development of Program Prioritization
The early history of program prioritization was deduced from the cycle of mission
fragmentation and contraction found in historical literature as presented in Chapter One.
Contemporary authors have summarized the cycle of expansion and economic crisis in
higher education at a sector level, providing foundational literature leading to the present
day. This section expounds on the history presented as background to this study in
41
Chapter One by further examining related literature of historical consequence. In a
subsequent section I present literature on contemporary program prioritization.
Elaine El-Khawas (2011) looked at the history of higher education through the
lens of economic crises, to better inform leaders facing economic crises today. As in
Thelin’s work, El-Khawas presented the eras of the Great Depression and the World
Wars as leading crisis points. In the 1930’s, most colleges and universities were in
financial distress, resulting in institutional closures and mergers. The growth in public
junior colleges and fields of practical study also placed pressure on institutions of more
traditional four-year programs. During the World Wars, enrollments dropped as men of
college age joined the war effort. The wars ultimately spurred economic growth, which
led to expansion of programs and services. El-Khawas also describes the economic slow-
down of the 1980’s as a crisis point for higher education, driving retrenchment of
programs, hiring, and general expenses. One of El-Khawas’ conclusions questions
whether colleges and universities have become too fragmented by program proliferation.
Although not explicitly referred to as such, this suggests whether program prioritization
is a potential solution to the cycle of fragmentation and proliferation.
From a global perspective, Schofer and Meyer (2005) evaluate the drivers of
expansion and contraction across national boundaries. Rather than economic conditions,
the authors identify conditions of secondary enrollment with strong links to world
identity as drivers of expansion. They note their findings are consistent with
institutional/neo-institutional theory, applying that theory to the embeddedness of
organizations within global societies. Schofer and Meyer’s study provides support for the

42
use of institutional/neo-institutional theory as one of the foundational theories for this
dissertation study.
John Thelin’s (Thelin, 2011) history of American higher education gives us a
comprehensive view into the cycle of expansion and program proliferation that resulted
in the contraction of program prioritization. Detailed in Chapter One as the background to
modern-day program prioritization, Thelin describes higher education through each era of
United States history. Since the early 1800’s, higher education has experienced driving
forces toward expansion and program proliferation interspersed with driving forces
toward contraction and program prioritization. Beginning in the 1860’s, Thelin provides
evidence that institutions were adapting to changing sector-level forces by adding
curricula, such as agricultural programs in response to the Hatch Act of 1887 and
research programs in response to the World Wars. These periods of program proliferation
fragmented available resources, as traditional programs were still sustained. Rather than
redirect available resources from traditional programs to fund new programs, institutions
instead sought increased funding from state appropriations, donors, or tuition. Duderstadt
and Womack (2003) support this explanation with their assertion:
Universities usually begin with the assumption that all of their current
activities are both worthwhile and necessary. They first seek to identify the
resources that can fund these activities. Beyond that, since there is always
an array of meritorious proposals for expanding ongoing activities or
launching new activities, the university always seeks additional resources.
It has only been in recent years that the possibility of reallocating resources
away from ongoing activities to fund new endeavors has been seriously
considered. (p. 115)
One of Thelin’s conclusions about present-day higher education that echoes
Duderstadt and Womack is that “American colleges and universities have wandered into

43
a state of continual expansion characterized by overextension of functions without clarity
of purposes” referring to a “drift in mission and character” (p. 361). This is what I refer to
as mission fragmentation, where resources are overextended across too many programs,
no matter how meritorious. Where the term drift conveys a move away from purpose and
lack of focus, it does not convey the detrimental impact to all programs and the overall
loss and fragmentation of resources. Undernourished programs cannot thrive.
Following on this history of higher education that evolved through cycles of
expansion and contraction, in 2006 the United States Department of Education released
what is commonly referred to as the Spellings Report but is formally titled “A Test of
Leadership: Charting the Future of U.S. Higher Education” (United States Department of
Education, 2006). The Spellings Report acknowledged higher education as one of
America’s greatest success stories and a world model but also called upon it to improve
performance in critical areas of access, cost and affordability, financial aid, learning,
transparency and accountability, and innovation. In 2008 this was summarized more
succinctly as the Iron Triangle of cost, access, and quality (Immerwahr et al., 2008). The
three-point iron triangle in higher education resonates with the triple constraint in
portfolio management of cost, time, and quality (Project Management Institute, 2008;
Rad & Levin, 2006). Both access and time refer in a sense to productivity or throughput,
where access to a wider volume of students yields greater throughput of graduates and
where longer time in a production schedule yields greater throughput of product. In
higher education, students are both our graduates and our product. For purposes of this
dissertation we will use the terms cost, throughput, and quality, where throughput refers
to a wider range of incoming students and a higher volume of graduation.

44
Sector Contextual Literature
According to structural contingency theory, institutional performance is
influenced by contextual factors at the sector and institutional levels. Sector-level context
includes such things as funding models and accountability trends. In this section I review
the literature of the theories and trends at the sector level that influence the cycle of
expansion and contraction and the performance of higher education institutions within
that cycle.
National and societal trends affect the entire sector of higher education, that is to
say, the tide lifts all boats equally, or has comparable effect on all institutions of higher
education. Trends of particular relevance to structural contingency theory and
institutional portfolio management include cost theories, the accountability movement,
funding trends, and portfolio theories. Institutional theories of particular relevance
include resource dependence theory, institutional change theories, scientific management
and social cognition theories. These are but a few of the many theories explaining the
world of higher education. I selected these theories to review because they each expound
on a key element of structural contingency theory, thus providing support for its
application in higher education. They also explain the factors that drive institutions to
implement program prioritization and the reasons for the resistance thereto. The selected
theories also resonate with the pattern of themes, such as a weak or strong culture and its
effect on resistance to change, found among the institutional leaders who had undertaken
program prioritization in my pilot study presented in Chapter Three.

45
Revenue Theory of Cost
Much work has been done on the rising price of college education and the cost
factors that could be driving the increase in price for consumers (Layzell & Caruthers,
2002; Wellman, 2006). Studies of college costs and price indicate that instructional
expenditures at public institutions have not been increasing over the past 20 years and
have not been exceeding the inflation rate of the Consumer Price Index (CPI). However,
the price of college that students pay at public institutions has been increasing and
outpacing the CPI as state appropriations per student decline (Cunningham et al., 2001;
McPherson & Shulenburger, 2010; Middaugh, 2005; Wellman, 2010).
Howard Bowen’s 1980 seminal work on the costs of higher education, still quoted
by many authors today, posits the revenue theory of cost in higher education in which the
“dominant goals of institutions are to achieve educational excellence, prestige, and
influence” (Bowen, 1980, p. 19). The theory further states that there is no limit to the
amount of money that could be invested in this continual quest. Each institution raises as
much money as it can and spends as much as it raises. The resulting effect is a trend of
continually increasing price, based on continually increased expenditures, due to
continual pursuit of prestige, growth, and excellence (Bowen, 1980; Powell et al., 2012).
Cost Disease Theory
Other authors have studied and refuted the revenue theory of cost, preferring the
theory of cost disease offered by authors such as William Baumel and William Bowen
(Archibald & Feldman, 2008a). Cost disease explains that service-intensive industries
rely on highly skilled labor at premium salaries. While manufacturing industries have

46
seen decreases in labor costs due to mechanization, service industries have not realized
similar productivity improvements because the nature of their industry, e.g. teaching or
healthcare, cannot replace highly educated labor with technological innovations.
Assembly lines are not yet teaching or healing; the care of students and the care of
patients requires a lot of human intervention and time. In comparison to CPI trends based
largely on manufactured goods that have realized productivity improvements, highly
educated service industries perform poorly. Additionally, technological innovations in
manufacturing have shifted profits to fewer but more skilled laborers, increasing their
salary base over time, which in turn has driven up the cost of the labor required for highly
educated service-intensive industries and thus driven up the price of service (Archibald &
Feldman, 2008a, 2010; Wellman, 2006, 2010). Higher education is not simply a service
industry; it is also, or even more so, a social good. The nature of higher education,
however, matches the characteristics of a highly educated service-intensive industry, in
that it relies on intensive human interaction by highly educated individuals.
Bowen foreshadows program prioritization as a future solution by saying “The
higher educational system itself provides no guidance of a kind that weighs costs and
benefits in terms of the public interest.” (p. 20) and asserting that without that self-
regulation, the responsibility for setting those limits must lie elsewhere, with the funding
sources—the legislators issuing state appropriations and the citizens paying student
tuitions. In support of this assertion, a study conducted for the National Center for Public
Policy and Higher Education in 2008 (Immerwahr et al., 2008), summarized the
sentiments of over two dozen college and university presidents as:

47
Most of the presidents believe that if one wants to improve the quality of
higher education, one must either put more money in the system or be
prepared to see higher education become less accessible to students.
Conversely, cutting costs in higher education must eventually lead to cuts
either in quality or access. (p. 4)
This is what the study refers to as the iron triangle of access, quality, and cost
where any change to one component will cause a reciprocal change to another. This view
supports Bowen’s revenue theory of cost (1980), where institutions raise what money
they can and spend what they raise in an unlimited pursuit of excellence. Another factor
fueling the competitive “arms race” toward excellence and prestige is the difference in
instructional spending between private and public institutions. Public institutions increase
student tuition as a funding source to offset the decrease in state appropriations where
private institutions invest their tuition price increases into educational support
(McPherson & Shulenburger, 2010; United States Government Accountability United
States Government Accountability Office, 2007).
Accountability Movement
Scrutiny of institutional performance has been building over the last couple of
decades, with greater demand placed on institutions of higher education to demonstrate
their efficiency and effectiveness and improvements thereof (Gumport, 2007; Powell et
al., 2012; Serna, 2013). F. King Alexander (2000) summarized the trend of the 1990s as
the “accountability movement” (p. 413) describing greater government interest in
assessing higher education performance and intervening through management or funding
changes to influence performance. Alexander establishes that governments have shown
increased use of performance funding models since the early 1990s, citing the drivers of

48
this movement as the massification of higher education from earlier decades colliding
with limited public funding availability. This is an example of an environmental or
exogenous change and a shift in the expectations of higher education from a social good
to an industry. Performance-based funding arose from the accountability movement, as
explained by Hillman and Tandberg (2014):
Performance-based funding changes the traditional way states subsidize
public higher education. Under this funding model, public colleges receive
state appropriations according to how well they are meeting broader
educational goals such as college completions and degree production.
(p. 827)
While state and national government bodies recognize the value of higher
education and a more educated citizenry as an economic and scientific research engine,
funding it remains a lower priority than other demands on public budgets (Serna, 2013).
Adrianna Kezar (2004) describes the changing demands on institutions as a fundamental
shift in the charter between society and the institution of higher education as a whole,
from the model of a public good to an industrial model meeting short-term demands for
workforce development. She cites examples throughout history of public pressure on
institutions to respond to new societal needs, such as modernized curriculum, research,
public service, or greater access to returning war veterans, now pressuring institutions
toward a more corporate model of accountability and management.
The seminal work of the accountability movement is the report known as the
Spellings report, commissioned by United States Secretary of Education Margaret
Spellings in 2006 (United States Department of Education, 2006). The commission called
upon institutions of higher education to improve access to a wider range of students, to
improve quality but also efficiency and affordability, to create new knowledge and

49
prosperity with a greater competitive position among nations, and to do so with rapid
agility in response to changes in technology and global trends. The Spellings report
criticizes higher education as “at times self-satisfied, and unduly expensive” (p. ix)
comparing it to industries that have failed to respond to changes in the environment and
implying that without fundamental change it is headed toward obsolescence. Structural
contingency theory predicts the same conclusion: that organizational slow to respond to
changes in the environment slide toward failure unless and until a crisis triggers a
correction (Donaldson, 2000).
The Spellings report, as a culminating work of the accountability movement to
that date, presents an inflection point in the structural contingency cycle, increasing
pressure on institutions to demonstrate their quality, access, and efficiency. One of the
organizations increasing public pressure was the National Center for Public Policy and
Higher Education (2008) that issued periodic “Measuring Up report cards” on the
performance of public higher education state by state and nationally in aggregate. The
reports looked at preparation of high school students for tertiary education, access and
affordability, completion rates, and quality outcomes. The intent of the reports was to
promote self-directed performance improvement by state governments of their public
higher education institutions against national and international benchmarks, through the
use of policy or funding interventions. The language of the Spellings report, citing issues
with “efficiency, productivity, transparency, and accountability” (p. 9) and the Measuring
Up report cards, grading higher education and demanding improvement, are examples of
increasing pressure from the public and public sector agencies demanding performance
improvement in higher education. The increasing pressure generated reaction from

50
institutional leaders and academics. The reaction to Measuring Up criticized two points
in particular: lack of focus on learning outcomes and lack of correlation between
governance intervention and state grades. A time series analysis indicates the correlation
to state grades lies in uncontrollable characteristics such as state affluence and
demographics (Volkwein & Tandberg, 2008) that in turn influence costs and completion
rates. For example, states that have a high population of disadvantaged students require
public institutions to spend more on supplemental support services to aid their success.
In a seminal example of the reaction from higher education, a report titled “The
Iron Triangle: College Presidents Talk about Cost, Quality, and Access” (Immerwahr et
al., 2008), also published by the National Center for Public Policy and Higher Education,
presented findings from interviews with over two dozen presidents from a variety of
higher education institutions to add their perspective to the public dialog. The subjects of
the study describe the competing demands for reduced cost, maintained quality, and
increased access as being in a reciprocal relationship they refer to as the “iron triangle”
(p. 4), wherein a change in one causes an inverse change in another. For example,
maintaining quality and increasing accessibility to a wider range of students costs money.
To reduce costs you must either sacrifice quality, for example with a higher student-to-
faculty ratio, or decrease access, for example by offering less support to disadvantaged
students making it harder for them to complete (Daniel, Kanwar, & Uvalic-Trumbic,
2009; Immerwahr et al., 2008).
Note the similarity between the iron triangle of cost, quality, and access in the
sector of higher education compared to the triple constraint of cost, quality, and
throughput in the discipline of project and portfolio management. The triple constraint is

51
so named because a change in one causes an inverse change in another. For example,
increasing throughput, e.g. speed of product produced, or increasing quality, e.g.
materials used to produce the product, costs money. To reduce costs you must either
sacrifice quality, for example with lesser-grade materials, or decrease speed, for example
by reducing the number of people working on the project (Project Management Institute,
2008; Rad & Levin, 2006). To correlate this with higher education, to reduce costs you
must sacrifice quality, for example with reduced services to support academic
achievement, or decrease throughput, by graduating fewer students so they are assured
adequate available support services.
Another example of the literature in response to increasing public pressure is a
study published by J. Fredericks Volkwein and David A. Tandberg in 2007 that examines
state characteristics in comparison with the Measuring Up report cards. Through time
series analysis and ordinary least squares regression, the study found little association
between state policies or interventions in higher education performance and the results of
the Measuring Up reports. The indicators used in Measuring Up to demonstrate
institutional performance were associated with state size and economics, among other
environmental factors beyond state or institutional control. And in fact, the time
comparison showed that interventions such as performance systems and governance in
the prior decade were not corollary to the Measuring Up results (Volkwein & Tandberg,
2008).
Accountability in higher education is complicated by many confounding factors
and conflicting demands, yet the movement is by no means quelled (Alexander, 2000).
Economics, demographics, and governance structures play a large role in institutional

52
performance, with availability and allocation of resources varying by state characteristics
and institutional mission. (Knott & Payne, 2004; Serna, 2013; Volkwein & Tandberg,
2008). The goals of reduced cost, sustained quality, and increased access cannot be
simultaneously achieved (Immerwahr et al., 2008; Powell et al., 2012; Project
Management Institute, 2008). Yet states continue to intervene in institutional
management in an attempt to achieve greater accountability and change in institutional
management.
Funding Trends
Another example of a change at the sector level that changes the fit of an
institution in relation to its environment is performance-based funding, wherein states
allocate public funding based on outcomes such as retention and completion rather than
inputs such as enrollments (Dougherty, Natow, Bork, Jones, & Vega, 2013). State-funded
institutions are not the only type of institutions subject to changes in funding trends,
however. Impactful funding trends are also occurring in privately-funded institutions,
where economic downturns have a harmful effect on endowments (Dickeson, 2010) and
where religious institutions face a declining student population (Milkovich, 2013).
Nevertheless, performance funding as a trend has been the only intentional intervention
in the management of institutional performance.
As states are interested in improving institutional performance, and as
performance funding is supposedly a direct lever to apply toward improved outcomes,
one might assume that performance funding would be widely applied but such is not the
case. Performance funding has been applied in some states and not others, and of the
53
states that have implemented it, some have even reversed the action (Hermes, 2012). At
least one of the reasons for failed or reversed performance funding initiatives is the
difficulty in selecting metrics that are both meaningful and reasonably obtainable.
Although the government continues to demand improvement in institutional performance,
the trend toward revised funding models has been indistinct.
Performance funding is not a recent invention, but it has recently been re-invented
and continues to evolve. Early experiments date back to the 1960s, with the state of
Tennessee maintaining performance funding since 1979. Between 1979 and 2007,
26 states initiated performance funding trends while 14 states also eliminated them.
Problems with the early funding models included too small of a percentage of funding
allocated to performance outcomes, making it ineffective in results while still
burdensome to manage. The newest wave of performance funding trend is sometimes
referred to as performance funding 2.0, in a reference to software naming conventions.
This latest iteration still focuses on outcomes, but devotes a greater percentage of
funding, and attempts to give institutions greater flexibility in meeting them, while giving
states better alignment between institutional priorities and state priorities (Hermes, 2012;
McKeown-Moak, 2013).
A study by Mary P. McKeown-Moak in 2013 examines performance funding
systems in 32 states, with an in-depth look at six state models that were in place under the
older models of performance funding and are being updated in light of the more recent
2.0 trend. Common guiding principles to support performance funding models were
inductively reasoned from the six detailed models. The principles include measuring
performance within-subjects over time, due to the unique mission and characteristics of

54
each institution, which affect performance. Common among the more successful
programs were factors such as having good data systems, using few but relevant metrics,
and including indicators related to state and regional goals.
In spite of these improvements, a study in 2010 found that performance funding
did not have an influence on changes in institutional performance metrics. The study
evaluated data from the Integrated Postsecondary Education Data System (IPEDS) for
467 institutions using graduation rates as the teaching and learning performance metric
and 123 institutions using research expenditures as the research productivity performance
metric. Through hierarchical equation modeling, the study concluded that institutional
characteristics accounted for most of the variance in performance. The performance
funding model had no correlation with performance, regardless of the variation of
performance funding used or the length of time it had been in place (Shin, 2010).
When state or private funding declines, institutions have responded to the
environmental change, often by seeking alternative funding sources, such as increased
tuition and fees (Powell et al., 2012; Serna, 2013). Not all institutions have the option to
increase student tuition as an alternate funding source when state appropriations decline,
whether due to defined statutory limitations or public pressure (Serna, 2013). Public
perception holds that the price of college is increasing because institutions are increasing
their spending, not because state appropriations have declined (Wellman, 2010). An
alternative to seeking increased funding in student tuition in response to a decline in state
allocations is to change how existing funding is allocated, as suggested by Dickeson,
Duderstadt, and others (Dickeson, 1999, 2010; Duderstadt & Womack, 2003). According
to a study I presented at the Association for the Study of Higher Education, leaders of

55
over 20 institutions considering the use of program prioritization as a solution to improve
institutional performance cited fiscal pressure, changing societal expectations, and the
pursuit of excellence as the drivers of that consideration (Milkovich, 2013).
Duderstadt and Womack (2003) effectively summarize the impact of funding
trends on higher education institutions in general with their own call for program
prioritization when stating:
There will have to be much more care in setting priorities, along with a
painful acknowledgement that in order to do something new one generally
will have to eliminate something old. Innovation by substitution, not growth
by incremental resources, will have to become the operative management
philosophy. (p. 117)
Comparing the costs and benefits of individual programs within the entire
portfolio, prioritizing programs and aligning funding with those priorities, eliminating or
reducing support for lower-priorities, and recognizing that all programs are meritorious
but some are more meritorious than others, are the essential principles of program
prioritization. It is a balancing act of multiple intersecting criteria, not a simple cost and
effectiveness equation. As explained in the manuscript presented in Chapter Six,
programs of high cost and low throughput are just as likely to be essential to the
institution as programs of low cost and high throughput; cost is but one of many factors
that inform portfolio decisions. Somewhere substitution must occur if new programs and
innovations are needed and increasing funds are not available. Trends in the major
funding sources for higher education, namely state appropriations and student tuitions,
therefore have a direct impact on the need for and application of program prioritization
particularly among the public institutions of higher education.

56
Institutional Contextual Literature
According to structural contingency theory, institutional performance is also
influenced by contextual factors at the institutional level. Institutional-level context
includes such things as the culture and sociology of organizational change. In the study
presented in Chapter Three, the strength of culture combined with the level of resistance
was found to play a role in the success of program prioritization. In this section I review
the literature of the theories and trends at the institutional level that influence the cycle of
expansion and contraction and the performance of higher education institutions within
that cycle.
Resource Dependence Theory
Resource dependence theory explains the interaction between institutions and
their environmental resources. Resource dependence theory views organizations as
dependent on their environment and the resources they obtain, which in turn influences
their effectiveness and ability to survive. According to this theory, organizational
performance exists in an ecosystem of resources that it needs and its performance is
therefore affected by availability of resources, be they funding, labor supply, or raw
materials (Gornitzka, 1999; A. J. Hillman, Withers, & Collins, 2009; Oliver, 1991;
Pfeffer & Salancik, 2003; Sporn, 1999). Burton Clark (2008/1966) adds that as
institutions have evolved toward professionalization of faculty, individual faculty have
become dependent on external sources of funding, which yields them not only financial
support but also power within the institution for their ability to bring in revenue.
Institutions are dependent on the funding resources of their environment, be it public

57
funding for state institutions, grant funding, or donation funding for private institutions.
Structural contingency theory, our central theoretical paradigm, starts with the
dependence of institutions on available resources in their environment. Changes in those
resources is but one exogenous change that can trigger the cycle leading to the need for
program prioritization.
Organizational Adaptation
Theories and studies of organizational adaptation in higher education support the
application of structural contingency theory as a paradigm. According to Cameron,
“‘Organizational adaptation’ refers to modifications and alterations in the organization or
its components in order to adjust to changes in the external environment” (Cameron,
1984 p. 123). Structural contingency theory also posits that organizations change in
response to changes in their environment, and the ideal structure of the organization is
contingent on the variables of its environment (de Zilwa, 2007; Donaldson, 2001; Sporn,
1999). A study by de Zilwa of 112 academic units supports that position in higher
education with its findings that the units adapted to changes in their environment which
pushed them “far from equilibrium” (de Zilwa, 2007 p. 571). The units responded to the
environmental changes in different ways linked to their cultural norms and heterogeneity.
Scholars have studied how culture promotes change and how change modifies the culture
(Tierney, 2008). Kezar and Eckel present a third possibility: that culture shapes the way
change happens in an institution (Kezar & Eckel, 2002). Structural contingency theory
holds that organizations enact or resist change in response to changes in their
environment. The literature in the following sections describes the ways that individuals

58
and units in institutions of higher education enact or resist change, including attempts to
prioritize programs.
Institutional and Neo-institutional Theory
Institutional and neo-institutional theory (hereinafter referred to as institutional
theory) provide a supporting explanation for the slowness of change in higher education,
supporting the satisficing element of structural contingency theory. Institutional theory
views higher education as an institution of society rather than an industrial service
provider, and as an institution, it should respond slowly and deliberately to changes in
society or other environmental factors. A social institution, according to institutional
theory, should be more enduring than the fluctuations of market pressures (Kezar, 2014;
W. R. Scott, 1987, 2008). However, institutions are still subject to external pressures and
must eventually respond to survive (Gornitzka, 1999). Institutionalism values conformity
and convention as stabilizers against rapid change; external pressures are met by internal
norms, which shapes the speed and nature of change. Christine Oliver (1991) compared
the institutional perspective with the resource dependence perspective and found several
areas of convergence. Both perspectives illustrate how institutions interact with external
pressures and seek to preserve their interests and legitimacy; however, according to
Oliver, the institutional perspective illustrates that adaptation to external forces is less
about conscious choice and more about unconscious conformity, where the resource
dependence perspective illustrates more active choice and conscious attempts to control
resources and reduce uncertainty. Oliver suggests that a multiplicity of perspectives better
explain organizational change in higher education. The convergence factors of

59
institutional theory and resource dependence theory support the premise of structural
contingency theory, in that managers and organizations enact change through actions that
have counter-effects and thus slow performance improvement in response to
environmental changes that create a misfit between the organization and its environment
(Donaldson, 2000, 2001). One of the arguments they may pose for doing so is that of
institutional theory—that an institution should be slow to change only as much as
necessary, or to a satisficing level, rather than reactive to the environment.
A subset of institutional theory focuses on the agency of individual actors within
an organization, also referred to as institutional entrepreneurialism. The theory of
embedded human agency defines the paradox wherein institutions are the product of
human actors as well as the influencers of human actions. Those individuals who break
with dominant group norms are referred to as institutional entrepreneurs (Battilana,
2006). Battilana hypothesizes that social position within an institution affects an
individual’s view of the organization and influences the extent to the actor may be able to
resist or enact change. Those individuals of higher social status or with strong
connections to individuals of higher social status have the social capital and access to
resources required to succeed. Where institutionalism seeks to serve the interests and
legitimacy of the organizational unit (Oliver, 1991), institutional entrepreneurs seek to
serve their own interests and legitimacy, resisting change through passive adaptation
when they do not share the interests of their executives and when they have sufficient
social capital to do so (de Zilwa, 2007). Institutional entrepreneurialism elaborates the
premise of structural contingency theory, in that individuals within an institution of
higher education resist change when the change does not align with their interests. This

60
would be particularly true in higher education, where a high number of actors, such as
faculty, view the organization through a strong sense of social capital and right to self-
govern (Birnbaum, 1988; Duderstadt & Womack, 2003). It also illustrates the motivation
of managers to satisfice, rather than force any more change than necessary on
constituents who do not see the change as aligning with their own interests, particularly
where attempts to prioritize programs invites the specter of possible program closures.
Scientific Management and Social Cognition Theories
The remaining schools of thought on higher education sociology that elaborate a
premise of structural contingency theory are those of scientific management and social
cognition, well summarized by Adrianna Kezar (Kezar, 2014). Scientific management is
a prescriptive change process whose practitioners apply a standard set of tools to enact
change regardless of the context. In this perspective, managers recognize and logically
respond to external forces by driving internal change. A hallmark example of a scientific-
management approach to change is the work of John P. Kotter advocating a standardized
set of stages and tools (Kotter, 1998, 2008). Social cognition theorists describe how
individuals construct their environment, make sense of it, and connect with the
organization. In this perspective, people’s perceptions of the organization are the reality
in which they live, thus shaping their ability or desire to change to resolve a sense of
cognitive dissonance. Because of this, among other factors, templates for managing
change such as Kotter’s cannot be applied (Kezar & Eckel, 2002).
In describing the change process in institutions of higher education, Kezar
proposes that multiple theories must be understood and used by change agents to

61
appropriately identify and successfully implement strategies for change. Scientific
management strategies, such as strategic planning and steering committees, can enact
visible, first-order change at largely superficial levels. However, significant cultural
change requires social cognition strategies, such as altering paradigms and creating new
mental models, to enact the deeper second-order change in individual mindsets needed to
truly transform an organization and sustain the change (Kezar, 2014). The interplay of
these two perspectives illustrates a premise of structural contingency theory, in that
organizations are slow to adapt to changes in the external environment because managers
attempting to enact change face an uphill struggle, causing them to satisfice with an
acceptable, incremental degree of change.
In this section I have illustrated how structural contingency theory presents a
central paradigm around which numerous, more commonly applied theories and studies
of higher education sociology and change can be shown to support it. Structural
contingency theory encapsulates the cycle of mission fragmentation through program
proliferation that eventually triggers a crisis. The supporting theories elaborate how
institutions are dependent on the resources of their environment and how changes in
those resources, i.e. reduced funding, require internal changes to maintain performance.
Yet, although managers may attempt first-order changes through strategies such as
strategic planning, they are met with resistance from entrepreneurial actors who are
preserving their own legitimacy and interests or group members who are interested in
complying with strongly-held institutional values and social norms. And so the managers
accept an incremental but acceptable level of change within their own bounded rationality
of decision making. This keeps the organization in an extended period of suboptimal
62
performance due to misfit with its environment until a crisis triggers a more
transformative change, such as program prioritization, which requires a new mindset and
fundamental reconstruction of environmental sense making by individual actors.
Institutional Performance Indicators
In this section I review the literature around institutional performance focusing on
the indicators, metrics, and analytical models most often used, to provide the basis for the
manuscripts. No single definition of institutional performance or the metrics to measure it
exists; however, literature is available to better inform and guide our understanding. Even
the term institutional performance has varied use, with some authors using effectiveness
or efficiency interchangeably, and with even more variability in the criteria or indicators
used to measure performance (Alfred, 2011; Cameron, 1978). Of particular difficulty is
the measure of quality, which many authors agree is important but few agree on how to
define, much less measure it (Alfred, 2011; Daniel et al., 2009; Toutkoushian, Dundar, &
Becker, 1998). The selection of criteria, or performance indicators as they are
contemporarily referred to, is also contingent on availability and reliability of data
sources. That information which is easy to measure is not necessarily meaningful or
valid, and that which is meaningful and valid is not necessarily easy to obtain (Burke,
1998; Burke & Minassians, 2002; Burke et al., 2002; McKeown-Moak, 2013). For
example, inputs, i.e. the resources that go into a product, such as faculty salaries, are
relatively easy to measure and could be considered representative of quality, if one
believes that higher faculty salaries correlate with higher prestige. Outputs, i.e. the
quantity or type of products produced, such as degrees awarded, are relatively easy to

63
measure and could be considered representative of productivity. However outcomes, such
as quality of learning or the positive impact of an education on health or employment, are
much harder to measure but meaningful to know (Barnetson & Cutright, 2000).
In the study of institutional leaders who had undertaken program prioritization,
presented in Chapter Three, intended outcomes described in the interviews varied widely
and were difficult to measure. For purposes of the study, I defined a successful outcome
as the ability to reach a strategic goal because of program prioritization. For example,
participants described successful outcomes as anything from absorbing a drastic budget
cut to opening a new college.
Scholars of institutional performance have used a variety of performance
indicators in their studies, and through their studies have attempted to develop a standard
and accepted set of performance indicators that can be used to compare performance
across institutions. While progress has been made, a standard set of indicators does not
yet exist. The literature and dialog around institutional performance uses terminology that
is sometimes unclear to readers, sometimes used interchangeably by different authors,
and sometimes used with distinct meanings by other authors. Table 2.1 clarifies and
operationalizes the terms used in the discussion of institutional performance
measurement. The sources cited either define the term or use the term congruent with the
definition as written.

64
Table 2.1. Operational Definitions.
Term Definition
Access The volume and range of students who can attend and complete postsecondary
education (Immerwahr et al., 2008; United States Department of Education,
2006).
Cost The value of a product or service purchased, e.g. what a university pays for
materials used to teach (Archibald & Feldman, 2010; Cunningham & Merisotis,
2002).
Effectiveness How well a process achieves the intended goals, i.e. the quality of the outputs or
outcomes (Cameron, 1978; Powell et al., 2012).
Efficiency Ratio of outputs to inputs, e.g. the ratio of degrees awarded to expenditures
(Cameron, 1978; Powell et al., 2012).
Input Resources or raw materials submitted into a process to produce something, e.g.
funding or staffing (Barnetson & Cutright, 2000; Burke et al., 2002).
Outcome Long-term effects or benefit of the output of a process, e.g. employment rates
(Barnetson & Cutright, 2000; Burke et al., 2002).
Output The quantifiable results produced by a process that used resources, e.g. degrees
awarded (Barnetson & Cutright, 2000; Burke et al., 2002).
Performance
indicator
A variable that tells us something about the performance of a system, i.e. how
efficiently or effectively it operates (Revelle, 2004).
Performance
measure
A snapshot of the performance indicator at a point in time; the value of the
variable (Revelle, 2004).
Performance
metric
A comparison of the performance measure to any given standard, e.g. an
institutional graduation rate compared to a national graduation rate (Revelle,
2004).
Price The value of a product or service sold, e.g. the tuition that an institution charges
consumers (Archibald & Feldman, 2010; Cunningham & Merisotis, 2002).
Process The activities that transform inputs into outputs and outcomes, e.g. teaching or
research (Barnetson & Cutright, 2000; Burke et al., 2002).
Productivity Volume of output per unit of input. For example, if one instructor is a unit of
input and student credit hours is the output then dividing student credit hours by
number of instructors yields the teaching productivity per instructor unit
(Middaugh, 2002).
Quality No one can define it, but you know it when you see it.
Throughput Volume and range of product that can be processed through a system (National
Research Council, 2012).

65
What indicators are available tend to be grouped in broad categories of efficiency
(ratio of outputs to inputs) and effectiveness (accomplishing goals) (Powell et al., 2012).
A few researchers have studied the development of indicators and how the use of
performance indicators influences our understanding of performance. Cameron (1978)
conducted a study to identify criteria that were generally recognized as characteristics of
institutional effectiveness, out of a broad set of 130 items. The study concluded that
organizational effectiveness in higher education was multi-dimensional and varied across
domains such as constituencies, analyses, missions, and a host of others. Cameron also
pointed out that much research had focused on defining indicators of efficiency, often
using costs per student or student-faculty ratios, with little work done on defining
indicators of effectiveness or quality.
Following on the quest to identify ways of measuring effectiveness,
Toutkoushian, Dundar, and Becker (1998) noted that peer assessments were one means
used to determine program effectiveness. The authors undertook a study to determine the
efficacy of that method, using the National Research Council’s 1993 graduate program
ratings as a sample. The program ratings were generated using peer assessments of
faculty quality along with quantitative measures of research output. The results indicated
a strong relationship between faculty quality ratings with research output but also found
evidence of rater bias where raters likely had insufficient information to effectively
evaluate a program and used their knowledge of faculty quality as a proxy that was not
necessarily valid. Peer assessments cannot solely be used to measure quality or
effectiveness based on these findings.

66
One study in particular evaluates how the use of performance indicators
influences, rightly or wrongly, the discussion about performance. Barnetson and Cutright
(2000) posited that performance indicators are instruments that shape not only how we
think about issues but also what issues we think about. For example, a public agency that
uses graduate employment rates as a performance indicator of higher education focuses
public attention on individual benefit of employment and diverts public attention away
from other social benefits. The authors also state that the very use of performance
indicators to regulate institutional performance requirements shifts accountability from
the institution to the regulator, which has the power to change regulations to improve
performance.
Burke & Minassians (2002) also noted that the choice of performance indicators
used by states to measure higher education reflects the priorities and interests of state
policymakers. The authors studied the performance indicators most used by states with
either performance reporting or performance funding models and found a wide range of
indicators used with little consistency except for the indicators of graduation and
retention that were used by most states. States with performance reporting models
focused more on access, diversity and affordability while states with performance
funding models focused more on indicators of efficiency and productivity. Their study
also joined the chorus of findings that inputs and outputs are easier to measure than
outcomes or quality. The selection of quantitative measures of inputs and outputs focuses
public attention on efficiency and productivity and diverts attention away from the
difficult-to-measure outcomes. While acknowledging the difficulty, the authors criticize
the academic community for failing to develop good indicators of quality and outcomes.

67
Mary P. McKeown-Moak (2013) also evaluated state performance models and
indicators used. Based on models that were deemed successful, Mckeown-Moak
developed a set of guiding principles for selecting and establishing performance
indicators. Those principles included recognizing that continuous improvement is non-
linear and non-infinite, developing indicators that are few in number and also relevant to
goals at the state or local level, and that measures should not be driven by availability of
data but that availability of data should be driven by appropriate measures. The author
also relied on the model of measuring a balanced combination of inputs, processes,
outputs, and outcomes rather than relying too heavily on any of them.
Finally, the National Research Council issued a policy report titled “Improving
Measurement of Productivity in Higher Education” where they acknowledge the
complexity of characterizing productivity for the teaching mission of higher education
(National Research Council, 2012). Using the inputs-process-outputs-outcomes model,
the panel of authors particularly note the necessity and difficulty of measuring quality in
any of those components. The authors also testify to the competing demands facing
higher education, wherein an increase in volume, be it wider access or higher graduation
rates, has a counter effect on quality or cost. This statement echoes the concept of the iron
triangle of higher education and the triple constraint in private-sector business, where
quality, volume, and cost are in competition for improvement. As in the studies described
above, the authors also caution that developing productivity measures will incentivize
institutions to focus on activities that improve those metrics, perhaps at the expense of
other important activities related to quality or service. Cautions notwithstanding, the
report concludes that quality must be sustained and measured by other means, in parallel

68
with the development of productivity measures, that lack of productivity measures also
carries problems, and the benefits of developing a solid model for measuring productivity
outweigh the risks.
As these highlighted studies and reports show, determining appropriate measures
of institutional performance is not easy. Policymakers and scholars in the field have not
yet agreed on a common set. Challenges to doing so include the difficulty of capturing
quality measures and the availability of appropriate data to use to generate meaningful
information that guides institutions toward the right goals for improvement. Some argue
that until good metrics and supporting data are identified we should not attempt to
measure institutional performance, as poor metrics will drive behavior toward
inappropriate goals (National Research Council, 2012). Nevertheless, attempts are
continually made and the field of possibilities appears to be narrowing. As scholars
develop a stable and agreed-upon set of performance metrics, practitioners of program
prioritization should refine their practice to use the prevailing performance indicators.
Prevailing Performance Indicators
While the literature on institutional performance includes study and development
of appropriate measurement models that to date are inconclusive, scholars concurrently
use available indicators to study institutional performance as best they can with available
and acceptable indicators. Themes have coalesced around the use and selection of
performance indicators from the very studies that use them.
A primary theme prevalent in the literature around the selection of performance
indicators is that comparisons must be confined to institutions of like characteristics,

69
mission, and discipline mix (N. W. Hillman et al., 2014; McPherson & Shulenburger,
2010; Middaugh, 2002; National Research Council, 2012; Powell et al., 2012). Preferably
scholars are advised to use performance indicators to make longitudinal comparisons of
performance improvement within an institution (National Research Council, 2012). The
variability of performance among institutions is primarily due to the mix of disciplines
within each institution (Middaugh, 2005); therefore, comparing institutions against other
institutions has questionable validity when the different institutions have different
combinations of disciplines.
Another theme in the literature is that the indicators selected must be meaningful
and utilize information that is obtainable and reliable, in that it is consistently reported on
across multiple institutions and state systems. Not all institutions report information to
the same data stores or in the same way. The Integrated Postsecondary Educational Data
System (IPEDS) is a system of data reporting common to institutions across the United
States (B. L. Bailey, 2006; National Research Council, 2012) but does not include
Canadian institutions. The Delta Cost Project is another source of institutional
performance information but not all institutions participate (Wellman, 2010). The
Delaware Study is another source of reported information but again only a subset of
institutions participate (Middaugh, 2005).
A third theme is the importance of selecting the unit of analysis, i.e. some
analyses are done at the institutional level, some at the departmental or discipline level
and some at the individual level. Porter and Umbach (2001) explain the potential for error
if the unit of analysis is not carefully controlled with a hypothetical example. Using the
department as the unit of analysis, a department with a high percentage of female faculty

70
could demonstrate lower productivity than departments with a lower percentage of
females. A researcher could interpret this to mean that individual female productivity is
lower; however, an analysis at the individual level of the same department could indicate
that the female faculty are more productive than their male counterparts even though the
overall department is not as productive as others. This illustrates how the unit of analysis
can yield different results from the same data and must be carefully managed.
In this section I compile a selection of commonly used performance indicators
and list the literature sources that use them or support their use. I organize them
according to the three dimensions of competing performance objectives described as the
iron triangle in higher education literature (Immerwahr et al., 2008) and the triple
constraint in business literature (Hossenlopp, 2010) operationalized into a single set as
explained earlier: cost, throughput, and quality. In some cases, a performance indicator
can be used to illustrate more than one dimension. For example, expenditures per student
credit hour can be viewed as an indicator of cost passed on to the student and as an
indicator of quality provided to the student. In each section I list the common indicators
and then discuss some salient highlights of the indicators listed.
Indicators of Cost
The Delaware Study (Wellman, 2010) and the Delta Cost Study (Middaugh,
2005) are exemplars of work done to collect, dissect and explain the costs of higher
education. In Table 2.1 I list the cost indicators used to evaluate institutional performance
and the sources that use or support them. I then discuss some highlighted points about the
indicators listed.

71
Table 2.2. Performance Indicators of Cost.
Cost Indicator Literature Sources
Cost per credit or degree (National Research Council, 2012)
Expenditures per student credit hour (Middaugh, 2002)
Expenditures per FTE faculty (Middaugh, 2002)
Expenditures per FTE student (N. W. Hillman et al., 2014)
(Powell et al., 2012)
(McPherson & Shulenburger, 2010)
(M. Scott et al., 2006)
(Hamrick, Schuh, & Shelley, 2004)
Instructional cost (N. W. Hillman et al., 2014)
Expenditures per FTE student appear to be the most widely used indicator of cost
and the most recent. This is an indicator of cost, as it is passed on to the student, but it is
also an indicator of quality, as presumably more expenditures per student indicate a
higher level of instructional quality provided to the student. Cost per credit or degree that
is used by the National Research Council is a clearer indicator of cost passed on to the
student, as it illustrates the cost that a student invests to complete a degree regardless of
the quality of service provided.
Indicators of Throughput
Throughput addresses both the access dimension of the iron triangle, where in the
higher education sector we attempt to intake and graduate a wider range of student
characteristics in a timely manner, and the scope dimension of the triple constraint, where
in the private sector we attempt to intake and produce a wider range of product features in
a timely manner. Where throughput is concerned, teaching and research are considered

72
such different processes that they must be evaluated independently and using different
indicators (National Research Council, 2012; Shin, 2010). This also allows for separately
evaluating the performance of research-intensive universities from teaching-intensive
universities.
For the evaluation of teaching throughput, graduation rate is commonly used
because it is a primary purpose of higher education and because they are available in
IPEDS (M. Scott et al., 2006). Graduation rate is typically looked at as percentage of
students completing their degree within four or six years. However, Hillman et al argue
for the use of annual number of degrees awarded per 100 students as a better indicator.
The percentage of students completing that is reported by institutions into IPEDS does
not take into account transfers in or out (N. W. Hillman et al., 2014).
For the evaluation of research throughput, publication or citation rates are
commonly used. However, Shin makes a compelling argument that annual research
expenditures is a better indicator. While citation rates are a good indicator of quality, they
do not indicate volume, or throughput, and are associated with authors rather than
institutions. Institutional publication rates are not easy to obtain, whereas research grant
dollars awarded and annual expenditures are readily available through IPEDS. Because
multi-year grants are awarded in a single year, annual awards are erratic and invalidate
the results. Shin argues that expenditures are comparable to awards only more evenly
distributed across the life of the grant. And, since most grant awards are federally funded
through a very competitive process, one can assume that quality of research is controlled
in that process.

73
Table 2.3. Performance Indicators of Throughput.
Throughput Indicator Literature Sources
Graduation rate (National Research Council, 2012)
(Powell et al., 2012)
(Asmussen, 2010)
(Fung, 2010)
(Shin, 2010)
(B. L. Bailey, 2006)
(M. Scott et al., 2006)
(Hamrick et al., 2004)
Number of degrees
awarded
(N. W. Hillman et al., 2014)
(Brooks, 2005)
Time to degree (National Research Council, 2012)
(Burke & Minassians, 2002)
(Brooks, 2005)
Student credit hours
produced
(Middaugh, 2002)
Racial/ethnic diversity (N. W. Hillman et al., 2014)
(M. Scott et al., 2006)
Research expenditures in
dollars
(Shin, 2010)
(Brooks, 2005)
(Dundar & Lewis, 1998)
Research awards in dollars (Stephen R. Porter & Umbach, 2001)
Research publication and
citation rates
(S. R. Porter & Toutkoushian, 2006)
(Brooks, 2005)
(Toutkoushian, Porter, Danielson, & Hollis,
2003)
(Stephen R. Porter & Umbach, 2001)
(Fox, 1992)
(Baird, 1991)
(Bentley & Blackburn, 1990)
Proportion of faculty
receiving grants
(Dundar & Lewis, 1998)
(Bentley & Blackburn, 1990)
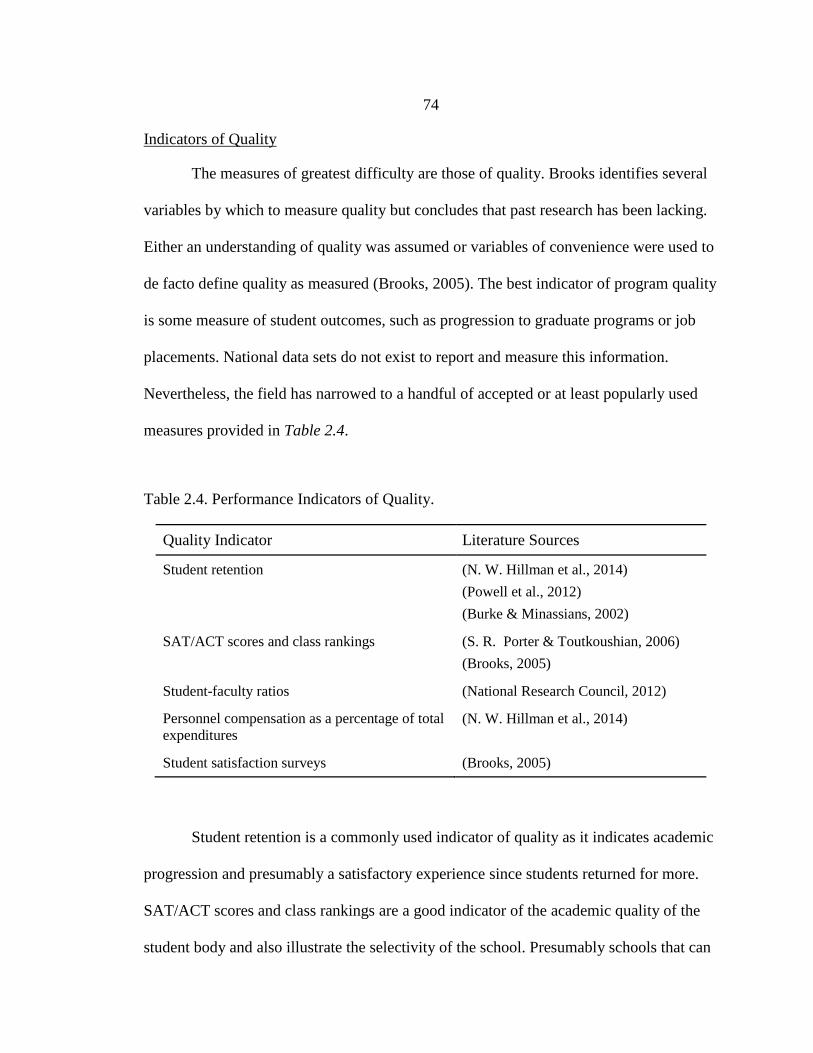
74
Indicators of Quality
The measures of greatest difficulty are those of quality. Brooks identifies several
variables by which to measure quality but concludes that past research has been lacking.
Either an understanding of quality was assumed or variables of convenience were used to
de facto define quality as measured (Brooks, 2005). The best indicator of program quality
is some measure of student outcomes, such as progression to graduate programs or job
placements. National data sets do not exist to report and measure this information.
Nevertheless, the field has narrowed to a handful of accepted or at least popularly used
measures provided in Table 2.4.
Table 2.4. Performance Indicators of Quality.
Quality Indicator Literature Sources
Student retention (N. W. Hillman et al., 2014)
(Powell et al., 2012)
(Burke & Minassians, 2002)
SAT/ACT scores and class rankings (S. R. Porter & Toutkoushian, 2006)
(Brooks, 2005)
Student-faculty ratios (National Research Council, 2012)
Personnel compensation as a percentage of total
expenditures (N. W. Hillman et al., 2014)
Student satisfaction surveys (Brooks, 2005)
Student retention is a commonly used indicator of quality as it indicates academic
progression and presumably a satisfactory experience since students returned for more.
SAT/ACT scores and class rankings are a good indicator of the academic quality of the
student body and also illustrate the selectivity of the school. Presumably schools that can

75
attract the highest achieving students can be considered a high quality institution since
those students have the greatest range of choices. SAT/ACT scores also have a strong
correlation with popular rankings such as those published by U.S. News and World
Report (National Research Council, 2012).
While considerable literature is available on the measure of various institutional
performance indicators, little research has been done on specific interventions to improve
institutional performance or their efficacy. Portfolio management is one such
intervention, along with its academic cousin program prioritization. In the next sections I
review the literature on these two practices.
Economic and Organizational Portfolio Theories
Both program prioritization in higher education and portfolio management in the
private sector are the offspring of economic portfolio theory largely developed by Harry
Markowitz, for which he received the Nobel prize in economics (Markowitz, 1990). In
that context it refers to the management of a portfolio of financial assets, such as stocks
and bonds. The fundamental principle of economic portfolio theory is that, as the
Merchant did, investors diversify their holdings to reduce the risk of uncertainty. As
Markowitz points out, if uncertainty did not exist, an investor would only invest in the
opportunity of highest return. Had the Merchant known which ship would be lost at sea
he would not have put any cargo on it to begin with. Since uncertainty does exist,
investors entrust their resources to more than one ship’s bottom to offset the risks. They
do so by selecting investments, evaluating their risk and return, and allocating funds to
maximize the return and minimize the risk in accordance with investor objectives for

76
growth and safe harbor. Similarly, a corporation diversifies its product and service lines,
either to offset the risk of uncertainty, or to create synergies, when, for example, the
know-how of one process supports another.
Economic portfolio theory originated as principles to guide financial investment
portfolios but the principles have been transferred to other applications and industries.
Following the Nobel prize award in 1990, private sector organizations, especially in the
field of information technology, began applying portfolio theory to the management of
their internal projects and programs in diverse fields including commercial corporations
(Donaldson, 2000), global non-profits (Miljkovic, 2006), the biopharmaceutical industry
(Reginato, 2005), and information technology (Kumar et al., 2008; Project Management
Institute, 2008). Since its early adoption by information technology organizations in the
1990’s, (Project Management Institute, 2008), success of this approach is evidenced in
the growing field of portfolio management now gaining a foothold in professional
organizations such as ISACA and the Project Management Institute, even evolving to a
formal standard (ISACA, 2012; Project Management Institute, 2008).
Figure 2.2 traces the linkages from portfolio management and program
prioritization back to portfolio theory and structural contingency theory. As evidenced in
the diagram, portfolio management and program prioritization evolved in parallel tracks,
unbeknownst to each other. After discussing the evolution of the parallel practices, I shall
examine the different collections of literature specific to each.

77
Figure 2.2. Theoretical Evolution of Founding Theories.
Economic Portfolio Theory
Technology Portfolio Management
Organizational Portfolio Theory
Institutional Portfolio Management
Organizational Portfolio Management
1990
1990s
2000s
Structural Contingency Theory
1962
2016
Program Prioritization
The first theoretical evolutionary advancement from the foundation of economic
portfolio theory is the development of technology portfolio management and
organizational portfolio theory in the 1990s. On the technology portfolio management
side, information technology organizations (IT), usually embedded within larger
corporations, realized the need to manage the risk and return of technology investments,
and the discipline of project portfolio management was born (Project Management
Institute, 2008; Rad & Levin, 2006; Reginato, 2005). On the organizational portfolio
theory side, Lex Donaldson applied portfolio theory to organizations, positing that
organizations themselves are a collection of investments, affected by internal and external
forces that drive change (Donaldson, 2000; Miljkovic, 2006). While Donaldson applied
this theory in the private sector, Dragan Miljkovic applied the same theory to

78
international not-for-profit organizations: the World Bank, International Monetary Fund,
and World Trade Organization (Miljkovic, 2006).
The second theoretical evolutionary advancement is the practice of organizational
portfolio management and the practice of program prioritization in the 2000s, when the
practices converge. Organizational portfolio management is distinct from both
technology portfolio management and organizational portfolio theory of the 1990s,
although related to both. In both cases, however, the practitioners were likely unaware
that the practices they were wielding are the manifestation of portfolio theory. Where
technology portfolio management is the application of portfolio theory to a collection of
IT projects, or resource investments of time and money, organizational portfolio
management is the application of portfolio theory to the project investments of the entire
organization, technology or not (Hossenlopp, 2010). And where organizational portfolio
theory is the application of portfolio theory to the organization as a whole, it is looking at
the organization as a portfolio, which can interactively adapt to environmental changes as
if it is a portfolio of investments (Donaldson, 2000). It is not looking at the projects of the
organization as the portfolio, but the organization itself.
The difference between program prioritization and its predecessors is similarly
nuanced. Where organizational portfolio theory is the, perhaps accidental, application of
portfolio theory to the resource collection of private sector organizations, program
prioritization is the, perhaps accidental, application of portfolio theory to higher
education organizations. Program prioritization views all of the time-and-effort
investments of an institution of higher education as a collection of investments that must
be evaluated, selected, and prioritized by allocating funds in accordance with

79
institutional, regional, and state objectives for growth and preservation (Dickeson, 2010).
And where organizational portfolio management looks at the resource allocation of the
organization as a portfolio of investments, it is looking at the projects of private-sector
organizations, not the programs of higher-education organizations.
Although known by different terms, the comparison of the corporate practice of
portfolio management and the higher education practice of program prioritization
illustrates that both practices utilize similar principles and techniques, customized to the
characteristics of the individual organization. Both practices rely on elements such as: a)
governance of the portfolio and prioritization process by a group of stakeholders; b)
predefined criteria to evaluate, select, and prioritize programs within the portfolio; c) use
of criteria that address cost, risk, and alignment to mission objectives; and d) adaptation
of common practices to the culture and characteristics of the organization (Cope &
Delaney, 1991; Dickeson, 2010; Harper, 2013; Project Management Institute, 2008; Rad
& Levin, 2006). This collection of literature and examples is based on the fundamental
theory underlying portfolio management: that management of organizational resources
constitutes a portfolio of investments, which can be optimized to achieve strategic
objectives more effectively and efficiently if it is intentionally managed to that end.
Combining the best of these practices creates institutional portfolio management,
which this dissertation proposes as a framework of integrated planning that can mitigate
the cycle of mission fragmentation and program prioritization in higher education. It
provides a new navigation system by which institutions can chart their course through
changing winds of public expectations.
80
Portfolio Management Literature
The principles of portfolio management focus on the selection of assets based on
a desired balance of risk and return, no matter what the collection of assets is. Portfolio
management can be described as the operationalization of business strategy, where an
organization invests and optimizes its resources to deliver its strategic objectives,
maximizing the return on the investment in balance against the risks. The practice
involves considering all possible investments in new or existing programs, i.e. products
or services, that could consume organizational resources such as personnel time and
effort, facilities space, or financial funds. The practice is to then evaluate and select the
correct level of investment in the correct mix of programs to best achieve strategic
objectives.
Institutions of higher education also have a portfolio of offerings in lines of
teaching, research, and service. Because higher education is a public good serving
society’s interests, the programs of that portfolio are driven by public demand and
responsibility. In that sense the portfolio is already diversified, and not by strategic
choice. It is still within the power of the institution to manage the diversification and the
alignment of resources among programs to offset the uncertainties of changing public
demands, among others.
While not as common in the higher education sector, some institutions are
likewise re-evaluating their portfolio of academic and administrative programs in an
effort to improve institutional performance or establish competitive advantage, and some
scholars have addressed portfolio management in a higher education setting.

81
Examples of portfolio management in the higher education arena include a 2013
article in Planning for Higher Education describing the use of portfolio management
techniques to optimize an institution’s strategic allocation of funds to academic programs
using demand, contribution margin, and service as criteria (Harper, 2013), which
correspond to the common portfolio criteria of cost and risk (Project Management
Institute, 2008). Similarly, a 2010 article in Facilities Manager explicitly describes the
use of portfolio management to optimize investment in real property development and
maintenance, using the criteria risk, mission criticality, and credit-hour production as the
criteria (Daigneau, 2010). Likewise, Cope and Delaney (1991) describe the use of
portfolio management, although not explicitly referred to as such, to realize strategic
objectives in higher education institutions, where they discuss a market-oriented strategy
applied to program review. A market-oriented strategy in effect evaluates programs in
accordance with market demands and therefore prioritizes them according to centrality of
a market-oriented strategy. This is the essence of portfolio management: aligning
investments with objectives. In these examples, we see early and oblique introductions of
portfolio management into higher education literature.
Program Prioritization Literature
Contextual literature around program prioritization exists in the private-sector,
where it is known as portfolio management, with some application of it in the higher
education sector, as seen in the previous section. In this section I describe the literature
more explicitly about program prioritization, organized in chronological categories.

82
Early Program Prioritization Literature
The historical foundation of program prioritization was inductively reasoned from
literature that did not explicitly refer to it as such. The concept of program prioritization
begins to take shape more explicitly in the 1970’s with an article by Shirley and
Volkwein. The authors note that market forces such as declining population and declining
financial support have forced the need for program priority setting. The article proposes a
process and criteria for developing a campus plan of program offerings and priorities
(Shirley & Volkwein, 1978).
Patricia Gumport contributed to the subject in 1993 with an examination of
academic program reduction by two public research universities in response to reductions
in state appropriations. Gumport’s case studies give readers an insight into the mechanics
employed by the individual actors of these universities, such as executive administrators,
subordinate administrators, faculty researchers, and other faculty involved, as they
struggled with the challenges they faced. While not intended to be conclusive, Gumport
notes that external constituencies have “gained prominence in academic decision
making” (p. 286). This indicates a shift in strategic alignment from social good to market
influence (Gumport, 1993). Gumport also notes that institutions are driven to prioritize
programs when resources become scarce. Facing competing demands to both maintain
traditional programs and add new programs in response to changing market forces is no
longer an option when budgets must be cut. Gumport cautions against the use of
prioritization at the detriment of the social contract between higher education as an
enduring institution and the society it serves (Gumport, 2005).

83
Elaine El-Khawas furthered the conversation in 1994 with her article on
restructuring initiatives in higher education. She notes that doctoral-granting and research
institutions are using multiple strategies in response to fiscal constraints, among them,
changes in academic programs. The institutions also employed the more traditional
strategies of across-the-board expenditure control and increasing the sources of revenue.
In her study, she found that institutional characteristics played a role in the selection of
strategies employed. Doctorate-granting and research universities were more likely to use
a collection of strategies to address the fiscal constraints, where comprehensive
institutions and community colleges used a narrower array of strategies (El-Khawas,
1994).
Barak and Sweeney (1995) evaluated the use of program review as an integral
piece of the planning and budgeting process on campuses. The authors summarize
literature that notes the desirability of incorporating program review and outcomes
assessment into strategic planning to define institutional mission, priorities, and strategic
objectives but stop short of calling for prioritization of programs. Their study quantifies
the institutions that incorporate program review into planning, budgeting and assessment,
finding that of the 452 institutions in the sample, 83% conducted systematic review but
the majority did so to improve program quality and did not find it particularly effective in
guiding their planning.
Contemporary Program Prioritization Literature
Beginning around the turn of the century, literature emerges that more explicitly
looks at the selection of academic programs relative to the institutional mission and

84
strategies. Patricia Gumport (2000) summarizes the trends affecting institutions of higher
education that drive the shift from a social orientation to a market orientation. Gumport
notes the professionalization of academic administrators as “managers who diagnose and
prescribe organizational well-being” (p. 76) and suggests that managers are driven to
allocate resources and restructure academic programs in response to market demands and
organizational constraints. Without explicitly describing program prioritization, this
article indicates a shift toward intentional management of resources in alignment with
strategic objectives that shape the academic program offerings of an institution.
In 1999, and later updated in 2010, Robert C. Dickeson, former college president
and co-founder of the Lumina Foundation, published the first work explicitly advocating
for and describing the practice of program prioritization. The monograph presents a case
for the need to strategically and intentionally allocate resources across all programs of an
institution, both academic and administrative, to align limited resources with mission
objectives and reduce the fragmentation associated with program proliferation. Where
Gumport in 2000 decries the shift from social institution to industrial organization that
intentional management and alignment represents, Dickeson advocates that practice as a
necessity, good or bad, in response to the climate of fiscal constraints and public
expectations. His seminal work presents the case and also carefully prescribes
recommended practices and process to follow to assure a greater probability of success as
well as practices to avoid. While well-grounded in literature, Dickeson does not present
any empirical evidence to support the efficacy of program prioritization in improving
institutional outcomes (Dickeson, 2010). Dickeson’s model has gained a following of
85
institutions driven either by crisis or an interest in gaining a competitive advantage,
where the objective is the need to improve and demonstrate institutional performance.
Peter D. Eckel in 2002, citing Dickeson’s work, published a study on four
prominent research institutions that had recently closed academic programs to determine
the decision rules and process they used. Three of the four institutions developed formal
criteria to use, similar to those proposed by Dickeson. The common core of criteria were
mission centrality (i.e. strategic alignment), quality (measured by reputation and the
quality of faculty and graduate students), and cost. Other criteria included contribution to
the region and demand for the program, confirming a market orientation influence. Eckel
found that programs with weak leadership, few students, few faculty, and lacking
centrality to the mission were most likely to be closed and that regardless of the criteria
or process, most participants interviewed felt the closure selections held no surprises and
were predictable by most faculty (Eckel, 2002). This study evaluates only one outcome of
program prioritization—program closure—it does not include other potential outcomes
such as program augmentation or sustainment.
Another study conducted around program prioritization is that of Susan Deer in
2006. Deer conducted a Delphi study of the use of a shared governance model of decision
making around program prioritization at the community college level. The purpose of the
study was to evaluate the inclusive decision-making model of shared governance at the
community college level that is more accustomed to top-down decision making. Program
prioritization as a controversial decision exercise provided an opportunity to test and
evaluate the decision making model (Deer, 2006). The study provides insight into the
efficacy of the participatory process described by Dickeson in a culture that is largely

86
unaccustomed to such a model. However, it does not provide empirical evidence as to the
efficacy of the outcomes of the prioritization.
Program Prioritization and Institutional Characteristics
Literature supports that there is a relationship between institutional characteristics
and differential adaptive responses to changing sector forces. In her 1994 study, Elaine
El-Khawas investigated adaptive changes including program selectivity among four
categories of institutions: community colleges, comprehensive universities and colleges,
doctorate-granting universities, and research universities based on an ACE College
Trends survey. Of 296 public institutions polled, over two-thirds were redistributing
operations funds in response to changes in state appropriations, including consideration
of realigning academic programs. However, among the 1987 Carnegie Classifications
used in the study, research universities were significantly more likely to reduce,
eliminate, or augment academic programs as a strategy than other types of institutions, at
a ratio of 35% for research universities compared to 23% for doctorate-granting
universities, 15% for comprehensive colleges and universities, and 17% for community
colleges. El-Khawas suggests that institutional size may be a factor, where larger
institutions have a wider array of programs (an example of mission fragmentation) and
can more easily reduce programs without affecting core academics than can smaller
institutions with more focused curricula (El-Khawas, 1994).
Other studies also support institutional characteristics as predictors of a potential
adaptive program prioritization response. In 1973 Blau found that institutional size
correlates with academic specialization into new fields (Blau, 1973) which would

87
contribute to a wide distribution of resources (mission fragmentation ) and the potential
need to optimize the portfolio in response (program prioritization). And more recently in
2010, Michael Middaugh found that “80% of the variation in instructional costs across
four-year institutions in the United States… is explained by the mix of disciplines that
make up the academic curriculum” (Middaugh, 2010, p. 111). A broader mix of
disciplines in the public research and doctoral institutions would lead those institutional
types toward a cycle of expanding mission fragmentation followed by a retrenchment of
program prioritization. This is a conclusion supported by a study I conducted and
published in 2015, also included as a manuscript of this dissertation, which found a
correlation between institutional characteristics and the use of program prioritization to
align resources (Milkovich, 2015). Studies of adaptive responses among community
colleges illustrate that they are more responsive to changing societal and workforce needs
but that too much fragmentation of resources impacts their effectiveness in delivering on
an increasingly diverse mission (T. R. Bailey & Averianova, 1998; Gumport, 2003). And
finally, religious-affiliated institutions might well have an advantage in maintaining
mission focus as suggested by Bailey and Averianova (1998) in referencing the work of
Bryk, Lee and Holland (Bryk, Lee, & Holland, 1993). All of these studies support the
influence of institutional characteristics on mission fragmentation and differential
responses to program prioritization, but with little empirical evidence indicating which
types are more likely to respond to changing sector-level forces specifically with the
adoption of program prioritization.
The body of literature on program prioritization gradually builds from early
descriptions of intentional management of higher education institutional program

88
offerings, to explicit recommendations on the need for and practice of program
prioritization. A very few number of studies look at narrow aspects of program
prioritization, including Deer’s study of shared decision making in the process at
community colleges and Eckel’s study of program closure criteria at research institutions.
Other studies, such as the manuscript in Chapter Four, look at an association of
institutional characteristics with program prioritization.
Chapter Summary
In this chapter I reviewed a comprehensive selection of literature with structural
contingency theory as the central paradigm. The literature reviewed supports the
application of structural contingency theory in higher education by grounding it in
accepted, scholarly extent literature. Structural contingency theory explains the cycle of
mission fragmentation and program prioritization that has dogged the performance of
higher education over the last few hundred years. The literature explains the rocky shoals
of sector and institutional context that leaders must navigate. This literature review also
sets the stage for the manuscripts on the subject that have been published, accepted, or
submitted to peer-reviewed professional conference and peer-reviewed journals. Through
the literature reviewed and the manuscripts presented, I continue to call for a dramatic sea
change in the way institutional strategies are charted and fulfilled. The Merchant did not
have public scrutiny on his investment strategies, but we in higher education do. It is
imperative that we chart a new course of intentional, institutional, portfolio management.

89
CHAPTER THREE
PILOT STUDY: ACADEMIC PROGRAM PRIORITIZATION AMONG
INSTITUTIONS OF HIGHER EDUCATION
Introduction
The changing context of higher education is creating a perfect storm of conditions
that could compel institutions of higher education (IHEs) to transform more dramatically
than seen in history in order to adapt to and survive the industry paradigm shift. Echoing
Darwin’s theory that animals best fitted to their environment are those most likely to
survive, organizations best adapted to their industry are likewise those most likely to
survive. Adapting to a changed environment or industry requires an evolutionary or
organizational transformation, or adaptive change. In the current industry paradigm shift,
many IHEs are undergoing adaptive change by restructuring their portfolio of academic
programs in an effort to remain competitive and cost-effective in an effort to survive.
Academic program prioritization therefore serves as an example of adaptive change in
higher education. Understanding the drivers of academic program prioritization and the
more or less successful approaches can help the industry of higher education respond
with greater agility to changing conditions, without compromising academic integrity.
Gumport (2007) illustrates that while higher education has faced changing
industry forces in the past, the current climate is the first time that all five of the
recognized industry forces known as “Porter’s Five Forces” are changing simultaneously:
supplier power, threat of substitutes, threat of new entrants, buyer power, and competitive

90
rivalry. The changes in industry forces manifest for higher education as: a) society
shifting toward a view of higher education as an individual benefit rather than a social
good, believing the expense should be borne by the individual and not the state; b) state
budgets in fiscal crisis in conjunction with the economic downturn; c) legislatures less
inclined to fund IHEs as a result of social pressures and less able to fund IHEs as a result
of fiscal pressures, d) for-profit institutions increasing in number and competitiveness, e)
enrollments rising, adding increased pressure on institutional infrastructure; f) the student
demographic shifting away from the traditional post high-school 4-year experience to a
profile of older working adults or more transient students who stop and start or come and
go among schools; g) distance education breaking down geographic boundaries and
expanding the competitor base from which students can select an institution. (Birnbaum,
1988; Duderstadt & Womack, 2003; Eckel, 2002)
This is the perfect storm for change in higher education. Organizations intent on
thriving in the new conditions will need to undertake adaptive change, such as academic
program prioritization.
Purpose of the Study
The purpose of this study is to discover patterns among institutions that have
undertaken adaptive change in the form of academic program prioritization. What drivers
toward adaptive change did they have in common? What approaches did they use and
what were the outcomes? What predictions can be made for institutions considering or
beginning academic program prioritization?
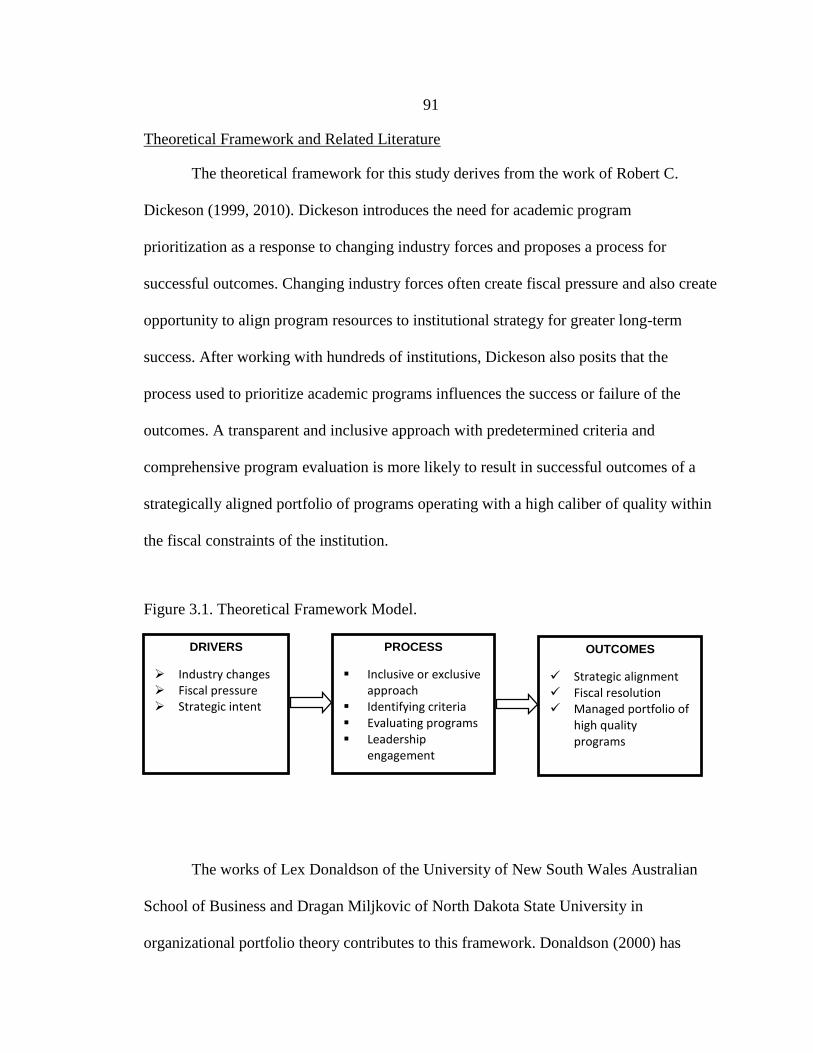
91
Theoretical Framework and Related Literature
The theoretical framework for this study derives from the work of Robert C.
Dickeson (1999, 2010). Dickeson introduces the need for academic program
prioritization as a response to changing industry forces and proposes a process for
successful outcomes. Changing industry forces often create fiscal pressure and also create
opportunity to align program resources to institutional strategy for greater long-term
success. After working with hundreds of institutions, Dickeson also posits that the
process used to prioritize academic programs influences the success or failure of the
outcomes. A transparent and inclusive approach with predetermined criteria and
comprehensive program evaluation is more likely to result in successful outcomes of a
strategically aligned portfolio of programs operating with a high caliber of quality within
the fiscal constraints of the institution.
Figure 3.1. Theoretical Framework Model.
The works of Lex Donaldson of the University of New South Wales Australian
School of Business and Dragan Miljkovic of North Dakota State University in
organizational portfolio theory contributes to this framework. Donaldson (2000) has
DRIVERS
Industry changes Fiscal pressure Strategic intent
PROCESS
Inclusive or exclusive approach
Identifying criteria Evaluating programs Leadership
engagement
OUTCOMES
Strategic alignment Fiscal resolution Managed portfolio of
high quality programs

92
proposed an organizational portfolio theory of internal and external change drivers that
operates similarly to a financial portfolio of balanced risk factors. Certain factors prompt
change and certain factors deter change. The interaction of the factors creates a balance
or imbalance of risk that results in adaptive change or stasis. Donaldson’s work and
theory applied explicitly to private-sector corporations. Miljkovic (2006) applied
organizational portfolio theory to public-sector organizations, specifically international
not-for-profits. In this public-sector application, different factors were identified as
comprising the change driver portfolio from the portfolio identified by Donaldson for
private-sector corporations.
In related literature, Deanna de Zilwa of the University of Melbourne studied
adaptive change responses among IHEs in Australia; however, her work focuses on
internal cultural factors and their relationship to adaptive change responses rather than a
portfolio of change factors (de Zilwa, 2007).
According to database searches and the author’s correspondence with Dickeson
(personal communication January 5, 2012) and Donaldson (personal communication,
February 1, 2012) no research has been conducted applying organizational portfolio
theory to the higher-education sector and no research has been conducted evaluating the
different approaches and results of academic program prioritization, from which to
possibly draw correlations or conclusions regarding better or worse practices.
Additional areas of study are identifiable among the available literature: studies of
the types of adaptive changes undertaken by different categories of IHEs and studies of
the methods of program restructuring and prioritization used by IHEs.
93
In the first category, a study by Elaine El-Khawas in 1994 summarized adaptive
changes including program selectivity among four categories of IHE: community
colleges, comprehensive universities and colleges, doctorate-granting universities, and
research universities based on an ACE College Trends survey. (El-Khawas, 1994).
Patricia Gumport also studied adaptive responses among the traditionally more
responsive community college institutions (Gumport, 2003).
In the second category, methods of decision-making within academic program
prioritization efforts have been proposed and studied by several authors including Peter
Eckel and Patricia Gumport, using different approaches. Eckel studied an economic
decision making approach (Eckel, 2002); Gumport studied the more cultural and
sociological factors involved in academic retrenchment and program reduction and their
long-term impacts on knowledge (Gumport, 1993, 2000, 2005).
Guiding Hypotheses
Donaldson’s Organizational Portfolio Theory (Donaldson, 2000) states that a
common set of change drivers interact as a portfolio, similar to a portfolio of financial
risk and reward, offsetting or reinforcing each other to inhibit or trigger adaptive risk
responses among private sector corporations. Guiding hypotheses related to portfolio
theory include:
1. A portfolio of change drivers will exist for IHEs; however, the balance of
factors that inhibit or trigger adaptive risk responses will be different from
private sector.

94
2. The identified change drivers will demonstrate a portfolio effect: some drivers
alone may directly trigger adaptive change while some drivers will be
contingent on other factors.
Guiding hypotheses related to approaches and outcomes include:
3. A correlation will be found between approaches and outcomes that will
indicate more successful approaches for other IHEs to learn from.
4. Institutional characteristics will influence approaches and outcomes and their
correlations.
Significance
This research contributes to the body of knowledge surrounding academic
program prioritization by increasing IHEs’ understanding of the process, approaches, best
practices, and correlated results. Validating the approach espoused by Dickeson provides
a scholarly basis for adopting those methods as a best practice to guide IHEs through the
challenging activity of academic program prioritization. Further research will need to be
conducted on a broader scale within academic program prioritization, as well as in the
arena of understanding the common characteristics among IHEs that drive them toward
adaptive change.
Methods
This research project was an initial pilot study to identify general patterns of the
factors driving institutions to undertake academic program prioritization as well as

95
characteristics of their approach and results. From this pilot, the research questions and
hypotheses will be refined for future study.
As the purpose of this pilot study was to cast a wide net to capture any possible
change driver or approach characteristic that might prove common among multiple
subjects, qualitative interviews were used as the primary instrument. The questions were
general and open-ended, resulting in a wide and rich array of data that was subsequently
narrowed down into themes.
Participants
Participants of this study were a selection of 20 institutions including large public
research institutions, small privates, community colleges and religious institutions whose
leaders are exploring, working on, or have completed academic program prioritization.
The participants were located from three sources:
Attendees at a workshop who were considering academic program
prioritization were solicited by the researcher and volunteered for the study.
Names of institutional leaders who had completed the effort were provided by
Robert C. Dickeson, an academic program prioritization author-expert, and
were contacted by the researcher to participate in the study.
Institutions who had published the process and results of their academic
program prioritization were located via Google search and solicited by the
researcher to participate in the study.
A total of 40 prospective institutions were identified. Of the institutions that had
completed academic program prioritization, many of the leaders responsible for the
96
undertaking had retired or were not locatable. Those prospective participants were
eliminated from the list. Of the 26 potential participants subsequently approached by the
researcher via email or phone, 20 participated over the course of four weeks. Participants
included large public research institutions, small privates, community colleges and
religious institutions in North America. Institutional identifying information was masked
to preserve anonymity. Summaries of results were offered to the subjects in exchange for
their participation.
Given that institutions of varying size and type were interested in or pursuing
academic program prioritization, it was assumed for this study that size and type were not
significant factors driving the need to prioritize. Future research will investigate this
assumption.
Institutional representatives interviewed included 2 Presidents; 8 Provosts or
comparable title, e.g. Vice President of Academic Affairs; 4 Vice Presidents or
comparable title, e.g. Chief of Staff; 3 Associate Provosts or Associate Vice Presidents;
and 3 Deans or Associate Deans. In all cases the representatives interviewed were
responsible for, or integrally involved in a team responsible for, academic program
prioritization at their institution.
Procedure
Prospective institutions were assigned a number as they were located, resulting in
random numbering as they were subsequently weeded out. As institutions identified the
stage they were at, the number was prepended to identify them as having completed

97
academic program prioritization (COM_), exploring, (EXP_) or a work in progress
(WIP_).
After establishing connections with the subjects, 30-minute telephone interviews
were conducted using a pre-established set of open-ended questions. The questions
addressed 6 general topics that could be contributing factors to the need for and approach
to academic program prioritization: drivers, approach, culture, obstacles, results,
sustainability. For each general topic a set of conversational prompts were developed to
flesh out details for that topic. In this manner participants were free to suggest any
characteristics related to the topic that they considered significant for their institution but
were also prompted to consider characteristics other institutions mentioned in order to
develop some consistency in responses among the participants. The same topics were
used throughout the interviewing process; however, after the first couple of interviews
the prompts and grouping of the questions were adjusted to better fit the natural flow of
the conversations. Approximately half of the interviews were recorded to spot-check
note-taking, which proved reasonably accurate. The questions and prompts were put into
a note-taking template used to capture descriptive and reflective notes for each interview.
Interview notes were reviewed and summarized in keywords in the reflective notes
section of the template.
Keywords used by the subjects in the interviews were listed in tables for an
overview. Variables were defined for similar qualitative keywords. For example, the
variable “board strength” was used to aggregate different interview keywords related to a
governing board’s influence, e.g. “strong board,” “weak board,” “distant hands-off
board.” Variables were then aggregated into themes related to the research questions

98
(drivers of and approaches to academic program prioritization) and more specific
interview topics (drivers, culture, approach, obstacles, results, sustainability). Variables
were then grouped into themes. A single change drivers theme summarized information
on the drivers that led institutions to undertake academic program prioritization. Other
variables that were reflective of the process or institutional characteristics were grouped
into non-driver themes. Through this iterative aggregation process eight final themes
emerged, listed and defined below:
Change driver Institutional culture
Strategic approach Institutional resistance
Process openness Board engagement
Process framework Leadership engagement
The themes were operationalized as:
Board engagement: Aggregation of the board-related variables into a single
theme and institutional rating of High, Medium or Low.
Change driver: A factor compelling an institution to undertake an internal,
perhaps dramatic, adaptive change such as academic program prioritization.
Examples of change drivers in this study include a desire to achieve a quality
benchmark or a fiscal crisis.
Institutional culture: Theme aggregating the variables of shared governance,
internal trust, and unionization.
Institutional resistance: Theme aggregating the variables of faculty
resistance, staff resistance, student resistance, and leadership resistance.

99
Indicates the extent to which the institution faces strong opposition to
prioritization.
Leadership engagement: Theme indicating the style or strength of
institutional executive leadership (CEO, VPs) with a rating of Strong,
Medium, or Weak.
Process framework: Aggregation of the variables referring to how program
prioritization was approached, which are data usage, criteria usage, rubric use,
categorization, and model.
Process openness: Theme aggregating the variables of academic only,
admin/auxiliary, transparency, engagement, developed process, web
publishing, and structure. Indicates how broadly and deeply all levels and
units of the institution were involved in conducting prioritization as well as
having their programs and services included in the prioritization decision-
making.
Strategic approach: Theme aggregating the variables goal, dollar target,
augmentation, redirect funds, funding source, and ongoing/onetime with a
rating of Low, Medium, High.
Data Analysis
The variables of the change driver theme were aggregated into terms hereafter
referred to as change drivers. Change drivers could be ordered from least to most
strategic, as listed in Table 3.1. Least strategic are defined as those that forced an
institution into change without regard to strategic intent. Most strategic are those that an

100
institution consciously chose, recognizing a competitive advantage. For example, a fiscal
crisis was not a conscious strategic choice of the institution. An intent to improve quality
as a competitive advantage was a strategic choice.
Table 3.1. Change Drivers and Variables.
Change Drivers Variables
Fiscal Fiscal Crisis
Fiscal Budget Pressure
Environ Enrollment Decline
Environ Legislative Pressure
Environ Accreditation
Strategic Mission Deficient
Strategic Increased Revenue
Strategic Enrollment Growth
Strategic Strategic Planning
Strategic Quality Improvement
Levels of least to most strategic were developed and defined as defined below and
illustrated in Table 3.2.
Level 1: The institution is purely crisis and dollars driven, reacting to fiscal
pressure.
Level 2: The institution is reacting to fiscal pressure as well as responding to
environmental pressures, such as legislative or accreditation influence. It is
still in reactive mode but has reasons other than purely fiscal.

101
Level 3: The institution is reacting to fiscal pressure, responding to
environmental changes and recognizing strategic reasons. As fiscal and
environmental drivers are both forms of pressure to change, the institution is
citing more reactive reasons to prioritize than strategic.
Level 4: The institution is realizing strategic value to prioritization in addition
to reacting to fiscal pressure. There are fewer pressure reasons to prioritize
therefore a greater percentage of strategic reasons compared to Level 2.
Level 5: The institution is recognizing and responding to environmental
changes, without fiscal pressure, but also without strategic goals. While
responding to environmental changes is still somewhat reactive, the lack of
fiscal pressure indicates proactive outward-looking responsiveness similar to
strategic drivers.
Level 6: The institution is recognizing and responding to environmental
pressures while also recognizing strategic value.
Level 7: The institution is purely strategy-driven, using prioritization as a
means to accomplish strategic goals.
In this manner, every possible combination of change driver variables was ranked
from least to most strategic and institutions could be assessed on that basis. Non-driver
keywords and variables were more varied and numerous, lending themselves to more
subjective interpretation.

102
Table 3.2. Change Drivers Strategic Scale.
Strategic Level Driver Combinations
1 Fiscal only
2 Fiscal/Environ
3 Fiscal/Environ/Strategic
4 Fiscal/Strategic
5 Environ only
6 Environ/Strategic
7 Strategic only
Three themes were identified as having insufficient information to be useable and
were removed from further analysis: Legislature Involvement, Shared Urgency, and
Obstacles. Tables 3.3–3.6 show the remaining non-driver themes and variables.
Table 3.3. Engagement Themes and Variables.
Leadership Engagement Board Engagement
Leadership Board strength
Board selection
Board support
Table 3.4. Approach Themes and Variables.
Strategic Approach Sustained/Ongoing
Goal
Dollar target
Augmentation
Redirect funds
Funding source
Ongoing
Onetime

103
Table 3.5. Process Themes and Variables
Process Openness Process Framework
Academic only
Administration/Auxiliary
Transparency
Engagement
Developed process
Web publishing
Structure
Data usage
Criteria usage
Rubric usage
Categorization
Model
Table 3.6. Institutional Themes and Variables
Institutional Culture Institutional Resistance
Shared governance
Internal trust
Unionization
Faculty
Staff
Student
Leadership
Institutions were then rated on each non-driver theme using a general tri-level
assessment, such as High/Neutral/Low, to avoid any illusion of precision in assessing and
comparing these more subjective characteristics.
Results emerged for those institutions that had completed academic program
prioritization and could describe the outcomes. Results varied widely across institutions
and were not readily quantifiable; however, there were clear differences in success and
failure across institutions. Institutional results could be ranked on a sliding scale from
most to least successful based on definitions of success that most people familiar with
higher education would probably consider reasonable. For example, a faculty vote of no-

104
confidence would reasonably be considered an unsuccessful outcome by most people
familiar with the industry of higher education while the ability to launch new fulltime
tenure-track faculty lines, attract grants, and improve student retention would reasonably
be considered successful outcomes. Table 3.7 illustrates the scale used with examples
from institutional keywords.
Table 3.7. Sliding Scale of Results with Keywords
Scale Example
Very High Success = 7
Very high investment
High investment
Reinvestment
Improvement
Gained funds
Met required cuts
Conserved funds
Learned something
Failed to meet cuts
Didn’t know outcome
Vote of no confidence
Very Low Success = 1
New school
New FTT faculty lines
New programs
Improved metrics
New contribution model
Reduce enough cost
Reduce some cost
Gain something out of it
Gain less than needed
Unknown results
Vote of no confidence
With a success scale defined for results, institutions could then be assessed
according to how successful their efforts were. Non-driver themes were only generally
assessed because there was no reasonable way to quantify the results of such generalized
and qualitative themes. Results, however, lent themselves to a slightly more analytical
method. With 7 institutions and a reasonably defined scale, institutions could be

105
compared on a pair-wise basis and ranked in order from most successful (7) to least
successful (1). Ranking completed institutions was a simple, clear, doable method to
distinguish results for use in predictions for other institutions.
With institutional ratings for each of the eight themes and a ranking of results for
those that had completed academic program prioritization, correlations could be drawn
between the themes and the results and predictions could be made for those institutions
still in earlier stages.
Researcher’s Role
The role of the researcher in this study involved establishing trusted relationships
with the leadership of the participating institutions. Access to the institutions was gained
through email and telephone introductions. Several institutions expressed concern that
identifying information be masked, or spoke only on condition of anonymity. Several
institutions expressed interest in receiving the results of the study also as a condition of
participation. All participants whose interviews were recorded granted permission to
record; one institution granted permission only after assurance that the recording would
be kept secure.
Research Methods Refinement
As a pilot study, lessons learned from this research will be applied to future
research to improve and refine knowledge gained. Following are identified refinements
for follow-up studies:

106
Record all interviews. Although spot-checking a large proportion of the
interviews proved the note taking reliable, recordings were beneficial and a
more thorough approach for the future.
Refine the question set. The use of open-ended questions worked as expected
to gather any possible characteristic or driver rather than assuming
characteristics and drivers. As interviews progressed and themes emerged,
gaps also emerged that should be filled with more structured questions, while
some questions proved less fruitful than expected and could be eliminated.
Control the interviews more tightly. Some interviewees tended to focus on a
particular topic and expound at length. Now that structured questions are
presentable, guiding the interview more tightly, but still politely, will reduce
gaps. Some practice may be required to hone techniques for tactfully moving
interviews forward.
Develop a questionnaire that can be used to follow up with the current
participating institutions to fill in gaps without requiring them to participate in
another interview.
Gather more empirical data. This study gathered leadership perspectives on
the drivers, characteristics, and results of program prioritization. Finding
artifacts and evidence to support their perspectives will strengthen the
conclusions. For example, researching board records to assess level of
engagement could be more reliable evidence than an individual’s assessment
of the board’s level of engagement.
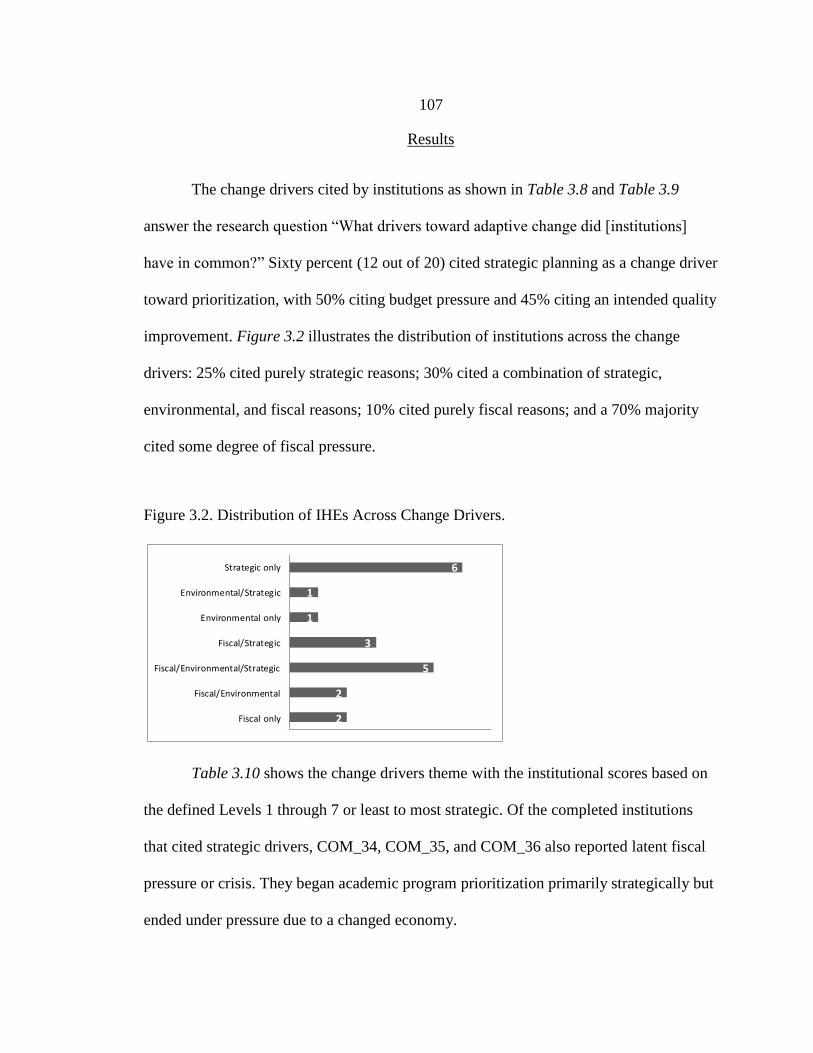
107
Results
The change drivers cited by institutions as shown in Table 3.8 and Table 3.9
answer the research question “What drivers toward adaptive change did [institutions]
have in common?” Sixty percent (12 out of 20) cited strategic planning as a change driver
toward prioritization, with 50% citing budget pressure and 45% citing an intended quality
improvement. Figure 3.2 illustrates the distribution of institutions across the change
drivers: 25% cited purely strategic reasons; 30% cited a combination of strategic,
environmental, and fiscal reasons; 10% cited purely fiscal reasons; and a 70% majority
cited some degree of fiscal pressure.
Figure 3.2. Distribution of IHEs Across Change Drivers.
2
2
5
3
1
1
6
Fiscal only
Fiscal/Environmental
Fiscal/Environmental/Strategic
Fiscal/Strategic
Environmental only
Environmental/Strategic
Strategic only
Table 3.10 shows the change drivers theme with the institutional scores based on
the defined Levels 1 through 7 or least to most strategic. Of the completed institutions
that cited strategic drivers, COM_34, COM_35, and COM_36 also reported latent fiscal
pressure or crisis. They began academic program prioritization primarily strategically but
ended under pressure due to a changed economy.

108
Table 3.8. Fiscal and Environment Change Drivers Cited by Institutions.
Fiscal Environment
IHE
Fiscal
Crisis
Budget
Pressure
Enrollment
Decline
Legislative
Pressure
Accreditation
Suggestion
EXP_03 1
EXP_05 1 1 1
EXP_09 1 1
EXP_11 1
EXP_40
WIP_01 1 1
WIP_07 1 1
WIP_04 1 1 1
WIP_10 1
WIP_02
WIP_08 1 1
WIP_12 1 1
WIP_37
COM_32
COM_33 1 1
COM_34
COM_35
COM_36 1 1
COM_38 1 1
COM_39 1
TOTALS 5 10 3 4 4

109
Table 3.9. Strategic Change Drivers Cited by Institutions.
Strategic
IHE
Mission
Deficient
Increased
Revenue
Enrollment
Growth
Strategic
Planning
Quality
Improvement
EXP_03 1 1
EXP_05 1 1
EXP_09
EXP_11 1 1
EXP_40 1 1 1 1
WIP_01 1
WIP_07 1
WIP_04 1
WIP_10 1
WIP_02 1
WIP_08
WIP_12 1
WIP_37 1 1
COM_32 1 1
COM_33
COM_34 1 1
COM_35 1 1
COM_36 1 1 1
COM_38
COM_39
TOTALS 3 1 2 12 9
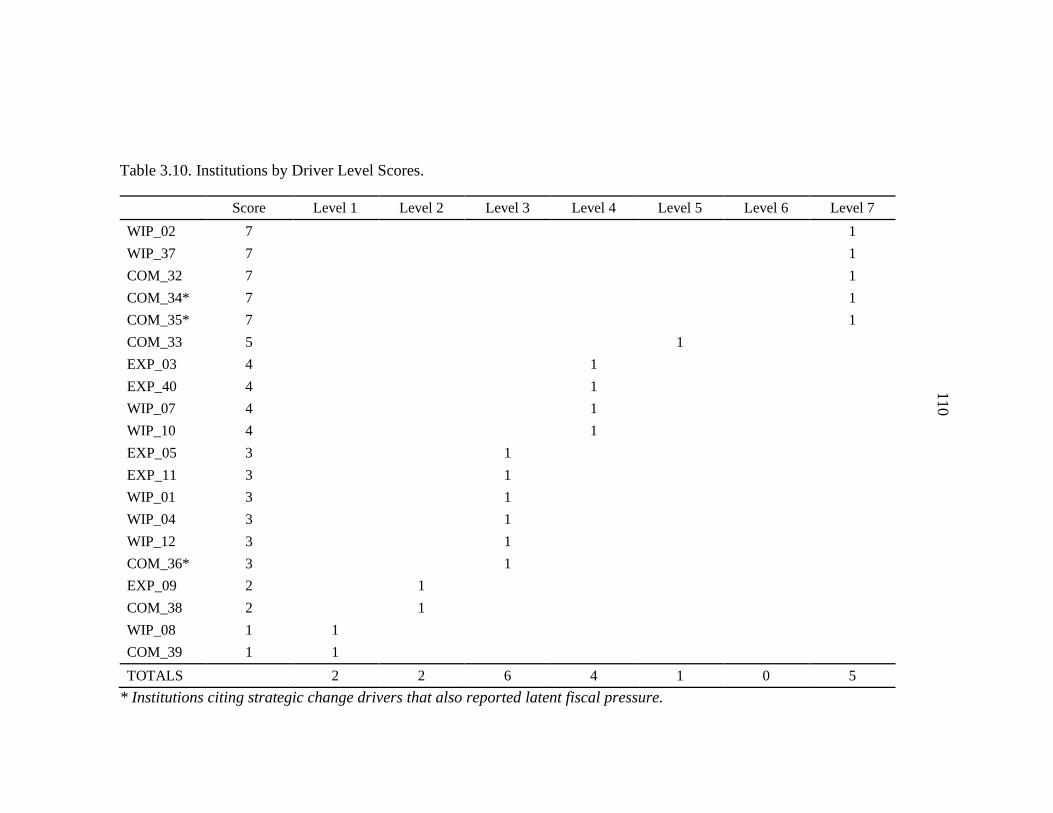
110
Table 3.10. Institutions by Driver Level Scores.
Score Level 1 Level 2 Level 3 Level 4 Level 5 Level 6 Level 7
WIP_02 7 1
WIP_37 7 1
COM_32 7 1
COM_34* 7 1
COM_35* 7 1
COM_33 5 1
EXP_03 4 1
EXP_40 4 1
WIP_07 4 1
WIP_10 4 1
EXP_05 3 1
EXP_11 3 1
WIP_01 3 1
WIP_04 3 1
WIP_12 3 1
COM_36* 3 1
EXP_09 2 1
COM_38 2 1
WIP_08 1 1
COM_39 1 1
TOTALS 2 2 6 4 1 0 5
* Institutions citing strategic change drivers that also reported latent fiscal pressure.
110
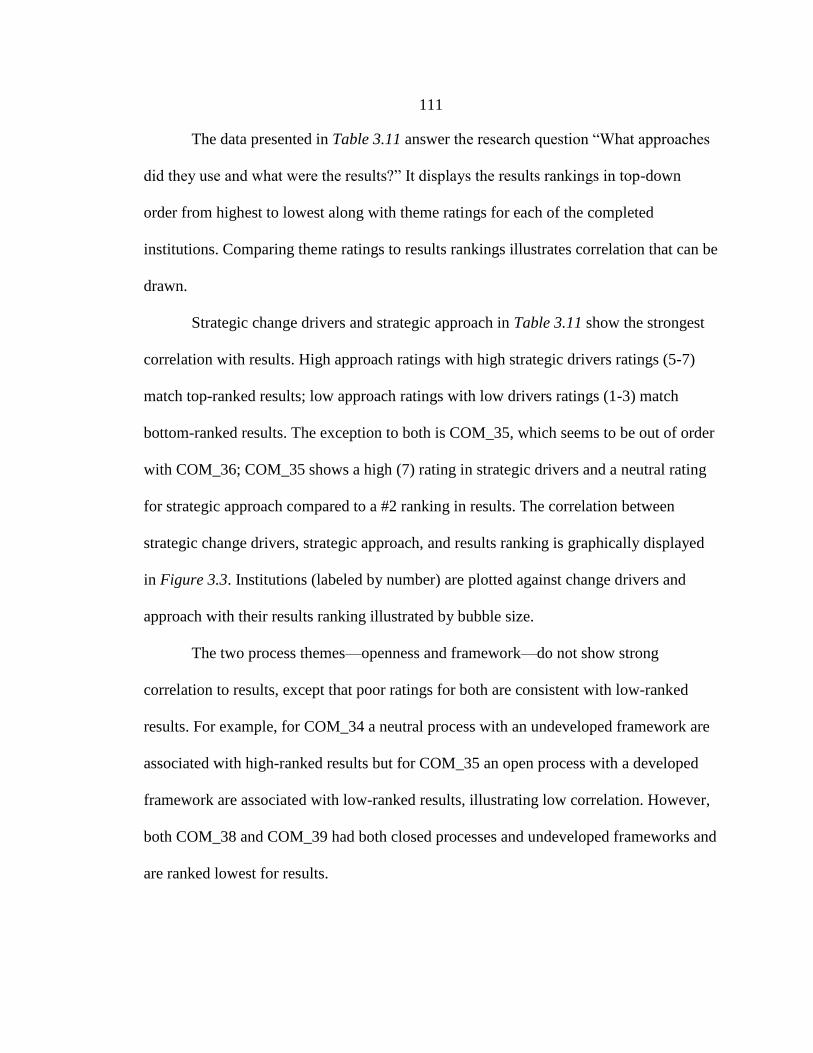
111
The data presented in Table 3.11 answer the research question “What approaches
did they use and what were the results?” It displays the results rankings in top-down
order from highest to lowest along with theme ratings for each of the completed
institutions. Comparing theme ratings to results rankings illustrates correlation that can be
drawn.
Strategic change drivers and strategic approach in Table 3.11 show the strongest
correlation with results. High approach ratings with high strategic drivers ratings (5-7)
match top-ranked results; low approach ratings with low drivers ratings (1-3) match
bottom-ranked results. The exception to both is COM_35, which seems to be out of order
with COM_36; COM_35 shows a high (7) rating in strategic drivers and a neutral rating
for strategic approach compared to a #2 ranking in results. The correlation between
strategic change drivers, strategic approach, and results ranking is graphically displayed
in Figure 3.3. Institutions (labeled by number) are plotted against change drivers and
approach with their results ranking illustrated by bubble size.
The two process themes—openness and framework—do not show strong
correlation to results, except that poor ratings for both are consistent with low-ranked
results. For example, for COM_34 a neutral process with an undeveloped framework are
associated with high-ranked results but for COM_35 an open process with a developed
framework are associated with low-ranked results, illustrating low correlation. However,
both COM_38 and COM_39 had both closed processes and undeveloped frameworks and
are ranked lowest for results.

112
Table 3.11. Tabulation of Assessments for Completed Institutions.
IHE Results
Strategic
Drivers
Strategic
Approach
Process
Openness
Process
Framework
Institutional
Culture
Institutional
Resistance
Board
Engagement
Leadership
Engagement
COM_34 #7 7 High Neutral Undeveloped Weak Strong High High
COM_32 #6 6 High Open Developed Neutral Neutral High Unknown
COM_33 #5 5 High Open Neutral Weak Unknown High Unknown
COM_36 #4 3 Low Neutral Undeveloped Unknown Unknown Low Unknown
COM_35 #3 7 Neutral Open Developed Strong Strong Unknown Weakened
COM_38 #2 2 Low Closed Undeveloped Unknown Strong High Unknown
COM_39 #1 1 Low Closed Undeveloped Unknown Unknown Unknown Low
112
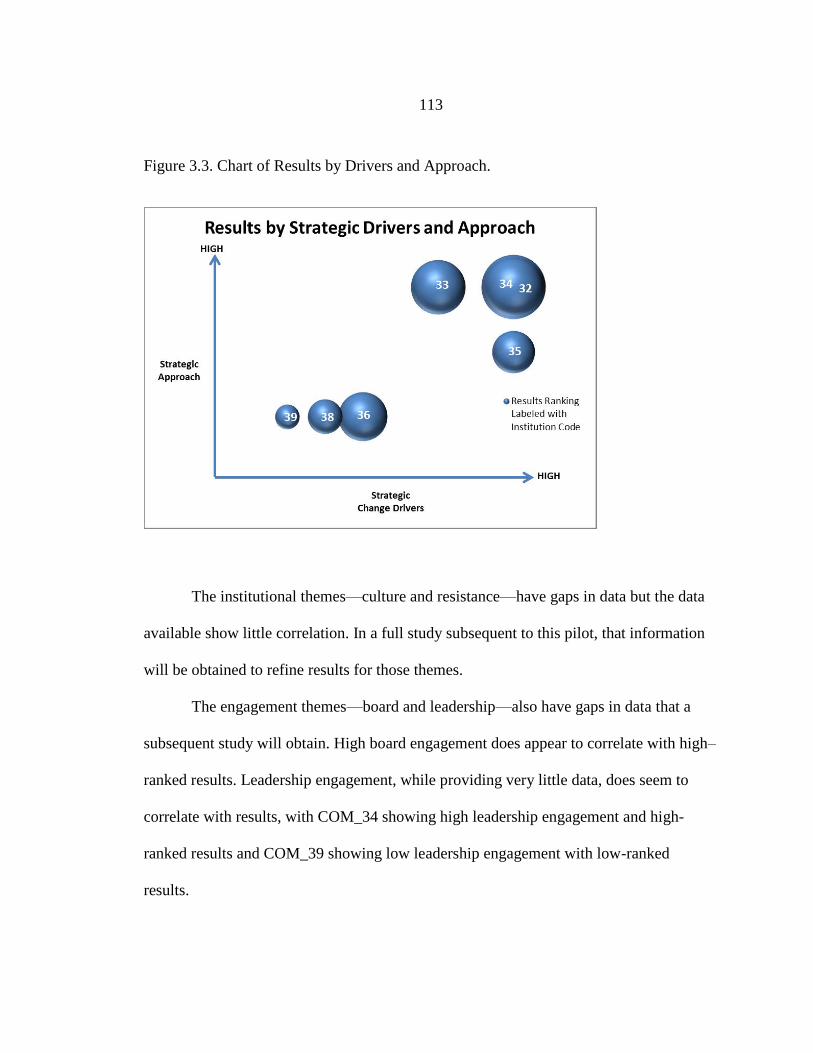
113
Figure 3.3. Chart of Results by Drivers and Approach.
The institutional themes—culture and resistance—have gaps in data but the data
available show little correlation. In a full study subsequent to this pilot, that information
will be obtained to refine results for those themes.
The engagement themes—board and leadership—also have gaps in data that a
subsequent study will obtain. High board engagement does appear to correlate with high–
ranked results. Leadership engagement, while providing very little data, does seem to
correlate with results, with COM_34 showing high leadership engagement and high-
ranked results and COM_39 showing low leadership engagement with low-ranked
results.

114
Discussion
The results of this pilot study answer the research questions and indicate support
for the guiding hypotheses; further research can be conducted using this pilot information
to draw stronger conclusions.
Common Drivers of Adaptive Change
The first research question asked what drivers toward adaptive change IHEs have
in common. By using open-ended interview questions that prompted for overlooked
information, institutional representatives were able to provide any change driver they
personally recognized as a contributing factor to the undertaking of academic program
prioritization. Ten change drivers were identified that were held in common by the 20
participants in the study. Only one of those ten change drivers was cited by fewer than
two institutions. The change drivers were aggregated into three categories: fiscal,
environmental, and strategic. An example of a fiscal change driver was an institution that
was reacting to a severe and sudden state budget cut. An example of an environmental
change driver was an institution that was responding to accreditation findings that needed
to be addressed and required program funding to do so, which had to be obtained from
existing institutional budget allocations to other programs. An example of a strategic
change driver was an institution that desired to achieve a certain fine-arts quality
designation. When looked at in aggregate, 12 institutions cited fiscal change drivers, 9
institutions cited environmental change drivers, and 15 institutions cited strategic change
drivers, illustrating commonality among institutions in their identified change drivers
toward academic program prioritization.
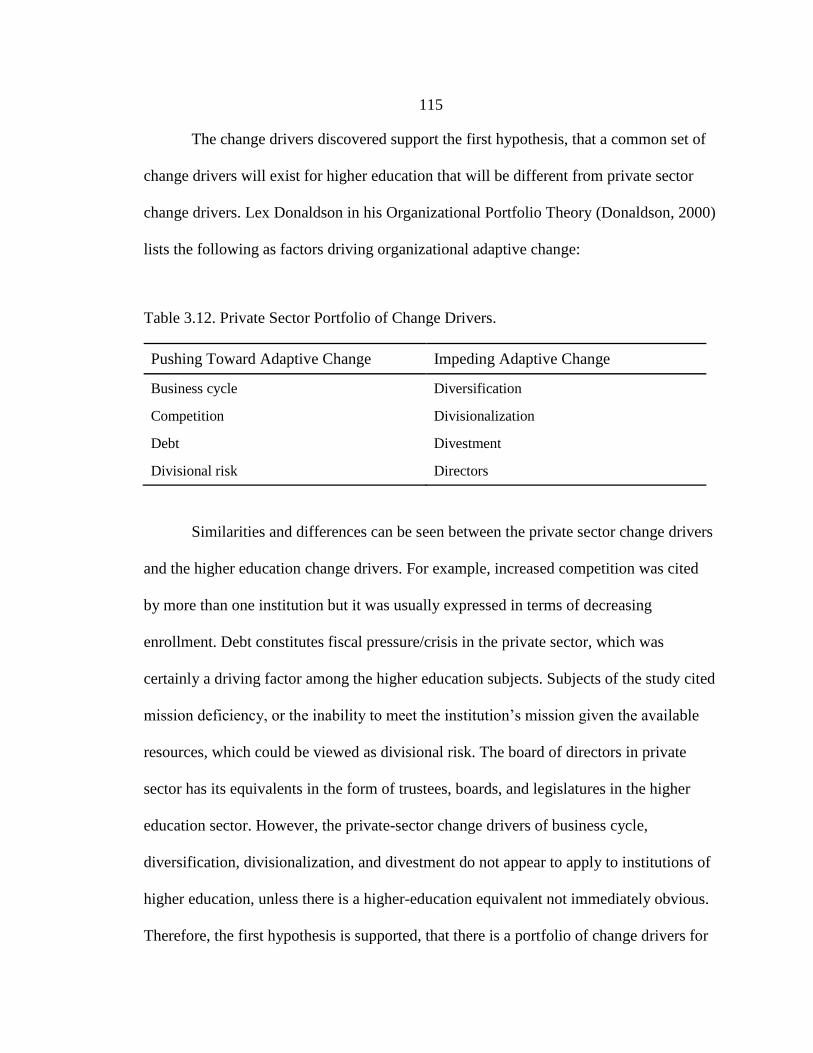
115
The change drivers discovered support the first hypothesis, that a common set of
change drivers will exist for higher education that will be different from private sector
change drivers. Lex Donaldson in his Organizational Portfolio Theory (Donaldson, 2000)
lists the following as factors driving organizational adaptive change:
Table 3.12. Private Sector Portfolio of Change Drivers.
Pushing Toward Adaptive Change Impeding Adaptive Change
Business cycle Diversification
Competition Divisionalization
Debt Divestment
Divisional risk Directors
Similarities and differences can be seen between the private sector change drivers
and the higher education change drivers. For example, increased competition was cited
by more than one institution but it was usually expressed in terms of decreasing
enrollment. Debt constitutes fiscal pressure/crisis in the private sector, which was
certainly a driving factor among the higher education subjects. Subjects of the study cited
mission deficiency, or the inability to meet the institution’s mission given the available
resources, which could be viewed as divisional risk. The board of directors in private
sector has its equivalents in the form of trustees, boards, and legislatures in the higher
education sector. However, the private-sector change drivers of business cycle,
diversification, divisionalization, and divestment do not appear to apply to institutions of
higher education, unless there is a higher-education equivalent not immediately obvious.
Therefore, the first hypothesis is supported, that there is a portfolio of change drivers for

116
higher education that will be different from those of private sector industries. Further
study is needed to compare change drivers between private sector and the higher
education sector more thoroughly.
The change drivers that emerged in this study indicate support for the second
hypothesis, which states that the identified change drivers will demonstrate a portfolio
effect, with some drivers directly triggering adaptive change while some drivers are
contingent on other factors. Two institutions cited a single driving force of budget
pressure or strategic planning. Two cited fiscal-only change drivers and one institution
cited environmental-only change drivers. Those drivers appear to be able to trigger
adaptive change regardless of other drivers. The majority of institutions cited multiple
driving forces. Two institutions citing strategic change drivers also indicated that lack of
urgency originally slowed their ability to prioritize. This supports the portfolio theory
concept of impeding factors and the hypothesis of a portfolio effect, i.e. where the effect
of one factor is contingent on the presence of a different factor. In the example of the two
institutions citing strategic change drivers, the effectiveness of strategic change drivers
was contingent on the presence of a sense of urgency among constituents.
Approaches and Results
The second research question asked what approaches toward academic program
prioritization were used and with what correlating results. The strongest correlation with
results was demonstrated by the change drivers and strategic approaches themes. The
combination of strategic change drivers and approaches can be thought of as strategic
intent: the degree to which the institution operates strategically both in recognizing a

117
need to make an adaptive change and the manner in which they approach it. Strategic
intent correlates strongly with results, with the exception of institution COM_35
(Table 3.11).
There appears to be an explanation for that anomaly in the characteristics data for
COM_35. The institution appears to have embarked on academic program prioritization
with strong strategic intent as evidenced by the high rating (7) on change drivers and a
neutral rating on strategic approach. They had an open process and a developed
framework, as evidenced by the ratings for each of those themes. The institutional culture
was strong and the resistance was strong. Finally, note that the leadership engagement
“weakened.” According to the interview notes, when resistance manifested in the
organization, the leadership backed down. This seems to explain the lack of good results
in spite of strategic intent. The strength of leadership engagement in the process, while
unknown for four of the institutions does correlate with successful results among the
three where data is available. Where the leadership engagement weakened, it appears to
have dragged down the results for the institution.
The strong correlation between strategic intent and results supports the third
hypothesis, which states that a correlation will be found between approaches and
outcomes that will indicate more successful approaches for other institutions to learn
from. The specific lessons learned are discussed in the Lessons Learned section below.
Other factors that answer the question of how institutions undertook academic
program prioritization are the process openness and process framework, providing
characteristics of the overall process used by institutions. They do not show as strong a
correlation with results as strategic change drivers and strategic approach. Certainly for

118
COM_38 and COM_39, where strategic intent was low, the process was closed and the
framework undeveloped, results were also low. COM_39 as the lowest-ranked institution
for results provides an example of a very closed process with an undeveloped framework.
The interviewee was not familiar with more strategically inclined models for
prioritization, making statements such as “No one does this voluntarily” and “Everyone
does this because of budget cuts.” In reviewing the keywords for COM_39, that
institution also used only a single criterion, graduation rates, on which to base program
cuts compared to institutions that compiled a rubric or developed a set of criteria.
Another aspect of COM_39’s closed process was the use of a website only to make post-
hoc announcements rather than communicate criteria and progress throughout the
process. These details behind the ratings for process openness and process framework
provide lessons learned for other institutions and answer the research question that certain
factors and approaches will correlate with results sufficiently to indicate better practices
for other institutions to follow.
Institutional Characteristics
Institutional characteristics of culture and resistance are two themes that provide
the context in which academic program prioritization was occurring. Together they paint
a picture of the institutional readiness to undergo this adaptive change. Two cases,
COM_34 and COM_35, appear to tell an interesting story. For COM_34, the institutional
resistance was strong; however, the culture was rated as weak. Seemingly, strong
resistance in a weak organization (e.g. low shared governance indicating low cohesion
among faculty and staff) was not enough to lower results. Since board and leadership
119
engagement are both rated as high for this subject, we can infer that high resistance in a
weak culture was not enough to derail results, perhaps in light of the strength of board
and leadership engagement. However, in COM_35, strong culture combined with strong
resistance and weakened leadership is associated with lower results than would be
indicated by the strategic drivers and approach, which otherwise correlate strongly with
results.
Board and leadership engagement are additional institutional characteristics that
could explain how neutral openness and an undeveloped framework are associated with
successful results. Possibly the interaction of high board engagement helped to overcome
other weaker factors. While high ratings on board engagement generally correlate with
high success rankings, in the case of COM_38 high board engagement is associated with
low results ranking, where the preponderance of other factors was also low. Possibly high
board engagement is not enough to overcome other low factors.
This would seem to indicate a contingency effect, where the relationship between
results and a contributing factor is contingent on another factor, as predicted by
contingency theorists (Donaldson, 2001). What is not clear, in the case of COM_38, is
whether a critical mass of low-rated factors overcame high board engagement or whether
a single low-rated factor was strong enough to outweigh board engagement. The missing
information on leadership engagement could help to tell that story. The second
hypothesis predicted a portfolio effect among change drivers. Results appear to indicate a
portfolio effect among overall process, institutional readiness, and leadership engagement
factors, where the impact of one or more factors is contingent on the strength of another
factor.

120
The institutional characteristics analysis also supports the fourth hypothesis, that
“Institutional characteristics will influence approaches and outcomes and their
correlations.” The relationship between strong resistance and results is contingent on the
strength of the culture to begin with. Where resistance is strong and the culture is strong,
results were low but where resistance is strong and the culture is weak results were not
low. While results do not appear dependent on institutional characteristics, given the low
correlation in general, institutional characteristics do appear to influence the outcome, as
predicted in the fourth hypothesis, and contain a contingency effect, as predicted for
change drivers in the second hypothesis.
Lessons Learned
As indicated in the discussion of approach and results above, from the results of
this study institutions can learn better practices to follow that can be summarized as:
Strategy-driven versus crisis-driven
Overall process
Institutional readiness
Leadership engagement
For the strategy-driven versus crisis-driven lesson, based on the correlation
between strategic intent and results, institutions can learn from this that a proactive,
strategic rationale and approach will generally yield greater results than a reactive, crisis-
driven rationale and approach.
In a strategy-driven mode, institutions have more time to be open and inclusive.
Institutions that were under fiscal pressure or crisis made statements such as, “We didn’t

121
have time to plan,” or “We were given a 90-day mandate to prioritize and had no time to
include people in the process.” On the other hand, strategy-driven institutions that
reported latent fiscal pressure also noted that they had trouble galvanizing people into
action until the crisis hit. Constituents were skeptical or failed to see the need to
undertake such a dramatic institutional effort. They made statements such as, “Once
people saw the need they were more inclined to participate. It was still difficult but they
knew we needed to do something.” Institutions found it harder to get buy-in without a
sense of crisis or urgency, but the process worked better and results were higher when
they could operate strategically rather than reactively. Institutions who collectively
sought to achieve a quality benchmark without fiscal pressure achieved the highest
results.
Institutions can learn from this that it is better to predict the need to change and
operate strategically, while creating a sense of shared urgency to reach a common goal.
Urgency and strategy best go hand in hand. As an administrator, it is more difficult to
implement a transformative change with strategic intent, when that transformative change
is disruptive and painful for constituents, and when those constituents see no real need to
subject themselves to it. Yet it is better to implement the change before the sense of
urgency becomes a crisis almost overnight. To balance those paradoxical
recommendations, a leader can start the process with strategic intent before a crisis
occurs, and create a sense of urgency by reminding constituents of the very real crises
that historically have been served upon them. This is the same challenge as engaging
constituents to develop a disaster recovery plan when they have not experienced any
disasters recent enough to remember the pain and want to prepare. Leveraging other
122
peoples’ disasters or crises in the news is another helpful strategy, as is biding one’s time
if necessary but being as prepared as possible in advance. The paradox is doable, but
admittedly challenging.
For the overall process lesson, institutions can learn that while the correlation
between process and results were not particularly strong and may be contingent on other
factors, there is certainly a correlation between a closed and undeveloped process and
poor results. Maintaining an open process, i.e. one that is broadly inclusive of participants
and looks broadly across the institution rather than academics alone, seems to contribute
to more successful results. Likewise, while a robust developed framework, i.e. broad
criteria and a proven model to follow, does not guarantee good results, an undeveloped
framework is still more likely to yield poor results.
Institutions can learn from this that it is better to use an open process and
developed framework than to lack inclusiveness or use a narrow framework.
For the institutional readiness lesson, institutional characteristics of culture and
resistance combine to create a context of institutional readiness for undertaking academic
program prioritization. Strong resistance combined with a strong culture could impede
progress or adversely impact results; whereas, strong resistance with a weak culture can
be overcome. To explicate, a strong culture is characterized by trusting relationships and
strong coupling among faculty, such as through shared governance or unionization,
compared to a weak or more loosely coupled culture. If resistance is strong and a strong
network is already in place, it will be easier to galvanize more individuals into the
resistance movement. In a weak or loosely coupled culture, a resistance movement will
have a harder time gaining traction.

123
The relationship between results and institutional readiness appears to be
contingent on leadership engagement and possibly influenced by process. Institutions can
learn from this that they should assess their institutional readiness prior to beginning
academic program prioritization and identify factors, such as process and engagement,
that could be used to mitigate those characteristics or that could compound the risk.
For the leadership engagement lesson, several subject interviews suggest insight
into leadership engagement. COM_38 suggested that it was critical that the board take “a
blood oath” to support the institution’s efforts as they are likely to be lobbied publicly
and individually to undermine the decisions. COM_35 held the weakened leadership as a
significant factor in the low results for that institution after a promising start. As a
singular example, COM_33 reported that the executive in charge of academic program
prioritization launched the initiative as a means of building trust among faculty in a
formerly low-trust environment, and succeeded. In this instance academic program
prioritization was seen not as a risky venture but as an opportunity for cultural
transformation as well as competitive advantage. COM_34 was able to overcome strong
resistance with a combination of a strong culture but high leadership engagement. High
engagement by the board and institutional executives appears to be a tipping factor and
possibly a contingency of other factors.
Institutions can learn from this that without leadership engagement they are at
greater risk of poor results and if their leadership engagement is not predictably high they
may be well served to improve their institutional readiness and overall process before
embarking on academic program prioritization.
124
Predictions
The final research question asked what predictions could be made for institutions
considering or beginning academic program prioritization. Since the strongest correlation
with positive results for those institutions that had completed academic program
prioritization was found in strategic drivers and strategic approach, it is possible to plot
the exploring and work-in-progress institutions on the same x and y axes to predict their
results based on those factors. Figure 3 in the Results section demonstrated that
institutions plotting high on the strategic-drivers axis and high on the strategic-approach
axis correlated with high results.
Figure 3.4 below plots exploring institutions against the same axes of strategic
change drivers and strategic approach. Comparing these data points to those in Figure 3,
it appears that EXP_11 and EXP_40 are likely to realize positive results from their
academic program prioritization. As discussed above, results are likely contingent on
their overall process, institutional readiness, and leadership engagement.
Figure 3.5 plots work-in-progress institutions against the same axes of strategic
change drivers and approach. Comparing these data points to those in Figure 3, it appears
that WIP_37 and WIP_02 are likely to realize positive results from their academic
program prioritization, contingent on overall process, institutional readiness, and
leadership engagement.

125
Figure 3.4. Exploring Institutions by Drivers and Approach.
Figure 3.5. Work-in-Progress Institutions by Drivers and Approach.
126
This answers the third research question of the ability to predict outcomes based
on a correlation of approaches with results. Further research is needed to could confirm
the validity of these correlations and their predictive potential.
Future Research
As a pilot, this study revealed techniques to modify, gaps in information from
existing participants, research questions to answer more fully, and new studies to pursue.
Techniques to modify include:
Audio recording all interviews
Refining the question set to more directly target needed information
Guiding the interviews more strictly, yet tactfully, to stay on track
Gathering more empirical evidence to support interviewee perspectives
Gaps in information include:
Process framework
Institutional characteristics
Leadership engagement
Research questions include:
Compare the portfolio of higher education change drivers with the portfolio of
private-sector change drivers to better understand the similarities and
differences
Investigate more thoroughly the institutional characteristics and process
characteristics to draw stronger correlations between approaches and results

127
New studies include:
Test portfolio theory and portfolio effect on the overarching themes of
strategic intent, overall process, institutional readiness, and leadership
engagement
Follow exploring and work-in-progress subjects to completion to compare
process, institutional characteristics, and leadership engagement with final
results
Study administrative prioritization methods and framework, as most of the
existing work has focused on academic prioritization
Compare institutional performance of strategy-driven subjects to crisis-driven
Compare institutional performance before and after academic program
prioritization
Compare models of private industry organizational redesign “refitting” the
institution to its environment with higher education models of administrative
restructuring
Compare administrative structures with institutional performance to define
and evaluate what constitutes organizational “fit” for higher education
institutions as opposed to private-sector organizations
The comparison studies are dependent on a fundamental metric for the industry of
higher education: the definition and measurement of institutional performance. Until we
can understand institutional performance we cannot empirically evaluate and compare the

128
results of any adaptive change, be it academic program prioritization or another. Future
research must begin there.
129
CHAPTER FOUR
ORGANIZATIONAL PORTFOLIO MANAGEMENT AND
INSTITUTIONS OF HIGHER EDUCATION
Contribution of Authors and Co-Authors
Manuscripts in Chapters 4, 5, 6
Author: Anne Milkovich
Contributions: Sole author and contributor.

130
Manuscript Information Page
Anne Milkovich
Planning for Higher Education
Status of Manuscript:
Prepared for submission to a peer-reviewed journal
Officially submitted to a peer-review journal
Accepted by a peer-reviewed journal
X Published in a peer-reviewed journal
Published by the Society for College and University Planners
43(2)

131
Introduction
(Burke, 2005)
(McPherson & Shulenburger, 2006)
("Modern Portfolio Theory," 2009)

132
Background

133
Methods
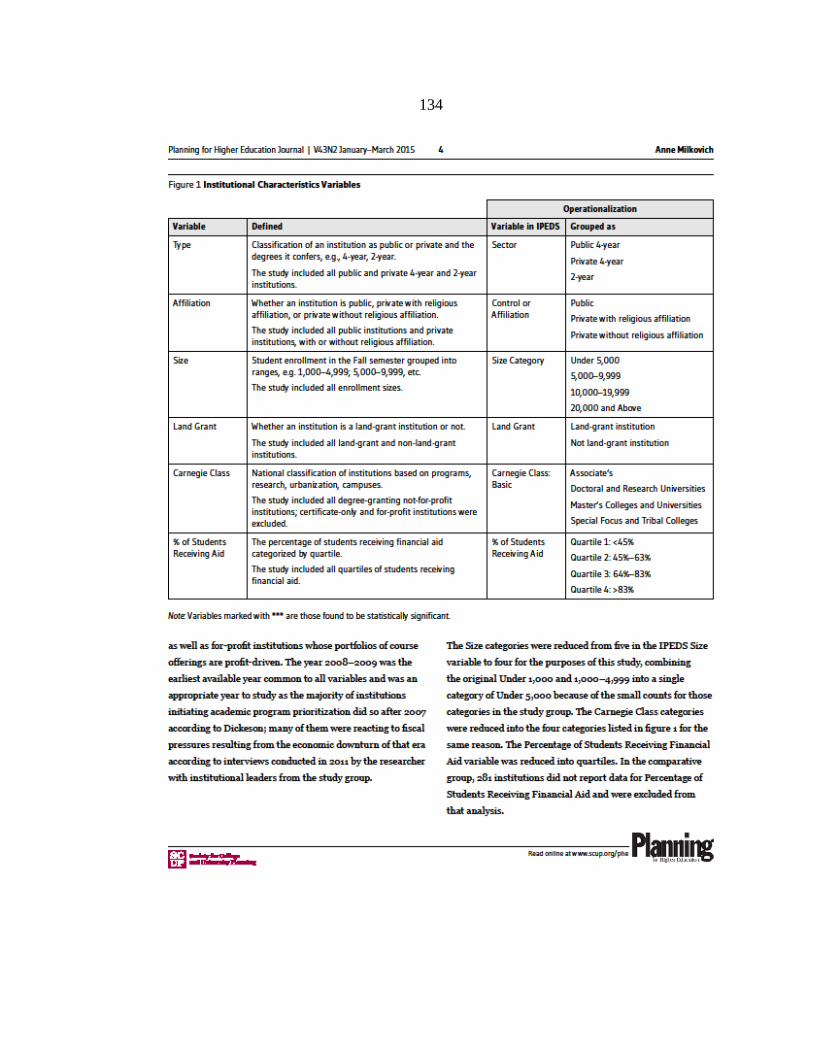
134
Figure 4.1. Institutional characteristics variables.

135
Results
Figure 4.2 Results of chi-square analysis of significance and effect.
Discussion

136
Figure 4.3. Frequency and distribution of institutional characteristics.

137

138
References

139
Author Biography

140
Planning for Higher Education

141
CHAPTER FIVE
HOW INCREMENTAL SUCCESS SLOWS TRANSFORMATIVE CHANGE AND
INTEGRATED PLANNING ACHIEVES IT
Contribution of Authors and Co-Authors
Manuscripts in Chapters 4, 5, 6
Author: Anne Milkovich
Contributions: Sole author and contributor

142
Manuscript Information Page
Anne Milkovich
Planning for Higher Education
Status of Manuscript:
Prepared for submission to a peer-reviewed journal
Officially submitted to a peer-review journal
X Accepted by a peer-reviewed journal
Published in a peer-reviewed journal
Published by the Society for College and University Planners
Winter Issue, January-March 2016

143
HOW INCREMENTAL SUCCESS SLOWS TRANSFORMATIVE CHANGE AND
INTEGRATED PLANNING ACHIEVES IT
Abstract
Higher education institutions are under pressure to make transformative changes
toward improving key areas of performance: access, affordability, price, and productivity
to name a few. Institutions have responded with budget cuts and efficiency gains with
incremental success. Yet paradoxically the very success they have achieved has also
impeded the transformative change their stakeholders seek.
Many theories exist to support adaptive change in higher education. A single
foundational theory of organizational change in industrial enterprises explains the
paradox and illustrates how incremental success slows transformative change. Structure
Contingency Theory was introduced by Alfred Chandler in 1962 and encapsulates a
number of higher education change theories, further grounding practitioners in assisting
institutions to adapt to changing conditions and informing their planning efforts.
To achieve transformative change requires a model of integrated planning to
synthesize unit improvements into institutional change greater than the sum of its parts.
This article presents structural contingency theory to explicate the change process and
introduces institutional portfolio management as an operational model of integrated
planning. It speaks to an audience of practitioners seeking pragmatic solutions to very
real and present problems.
144
HOW INCREMENTAL SUCCESS SLOWS TRANSFORMATIVE CHANGE AND
INTEGRATED PLANNING ACHIEVES IT
The higher education sector is under pressure to undertake transformative change
that leads to improvement in key areas of institutional performance such as access,
affordability, and productivity. Institutions have adjusted to public pressure or funding
reductions by cutting expenditures and seeking efficiency improvements, with
incremental success. Few have achieved transformative change on the scale expected by
national stakeholders. And in fact, the very incremental success they have achieved has
counteracted and slowed the transformative change they need.
Integrated planning prevents incremental success from slowing transformative
change. Integrated planning is indeed elusive and abstract but practical frameworks can
be borrowed from other industries where integrated planning is well established. In this
article I provide support substantiating the assertion that incremental change is an
impediment to transformative change; I also provide a practical framework of integrated
planning well established in private industry that can be applied in higher education to
overcome the impediment of incremental change.
Why is this important? Institutions of higher education are under increasing
pressure to transform. Scrutiny of institutional performance has been building over the
last couple of decades, with greater demand placed on institutions of higher education to
demonstrate their efficiency and effectiveness and improvements thereof (Gumport,
2007; Powell et al., 2012; Serna, 2013). The Spellings report, commissioned by United
States Secretary of Education Margaret Spellings in 2006 (United States Department of
145
Education, 2006) criticizes higher education as “at times self-satisfied, and unduly
expensive” (p. xii), comparing it to industries that have failed to respond to changes in
the environment and implying that without fundamental change it is headed toward
obsolescence. The Spellings report, citing issues with “efficiency, productivity,
transparency, and accountability” (p. 10) is but an example of increasing pressure
demanding performance improvement in higher education. Our critics have seen
transformative change in other private and publicly funded industries. They have seen
layoffs and restructurings, mergers and acquisitions, outsourcing and offshoring, in
dissimilar industries such as manufacturing but also in more institutional industries such
as healthcare and banking. Right or wrong, like it or not, they simply may not be satisfied
that leaders in higher education are doing our part to control costs and extend access until
they have seen transformative change the likes of which they have seen elsewhere.
How Incremental Success Slows Transformative Change
First let’s unpack structural contingency theory to explain how incremental
success slows transformative change. Structural contingency theory posits that a
relationship exists between the structure of the organization and its performance, and the
nature of that relationship is contingent on external variables, referred to as
contingencies. Structural contingency theory was developed by Alfred Chandler in the
mid-20th century to explain organizational structures and performance of industrial
entities (A. D. Chandler, 2013; Donaldson, 2001; Lawrence & Lorsch, 1986; Pfeffer &
Salancik, 2003; Sporn, 1999). According to Chandler, when an organization is
performing well, its structure is well fitted to the external variables, such as market

146
environment, resource availability, or competition. When an external variable changes, it
changes the relationship between the organizational structure and the organization’s
performance. The organizational structure is now in misfit with its environment, which in
turn degrades performance. When performance degrades sufficiently, it prompts the
organization to redesign its structure to bring it back into fit with its environment. Figure
1 illustrates the cycle in a conceptual model.
Figure 1. Structural Contingency Theory Illustrated.
$
Public expectations drive expansion and
prestige race
Public perception of mismanagement
changes environment
Institution of Higher Education
Institution of Higher Education
$$
Internal resistance slows response to
change in environment
Funding from all sources is reduced
forcing change
Financial crisis triggers reaction
Reduce or Restructure?
$$
Restructure
Resource Dependence
Theory
Revenue Theory
Institutional and Neo-Institutional
Theory
Could Institutional Portfolio Management allow us to exit
the loop?
$$$$
Institution of Higher Education
Structural Contingency Theory
Resources are fragmented, performance cannot improve without transformative change
Scientific Management Theory Social Cognition Theory
Economic Portfolio Theory Organizational Portfolio Theory
Institutions increase spending, outpacing CPI
Cost Disease Theory
$$$$
Institution of Higher Education
Institution of Higher Education
But performance doesn’t degrade visibly and significantly. Managers make
incremental, unit-level changes that improve unit-level performance sufficiently to satisfy
the unit-level concern; or as the term has been coined, managers satisfice. Because unit-

147
level managers are motivated to satisfice and do not see overall performance effects,
performance improves sufficiently to prevent a crisis but remains suboptimal.
Incremental success leads planners—leaders who are responsible for planning—to accept
that improvement has been achieved. An organization can remain in this suboptimal state
for an extended period of time unless and until performance degrades to a crisis point,
which triggers a more transformative change (Donaldson, 2001).
Structural contingency theory has been studied in the private sector and not-for-
profit sector but few scholars have studied or applied it in higher education literature.
However, many theories that have been studied and applied in higher education support
different aspects of structural contingency theory and further elaborate the cycle of
external forces and internal responses. They are each a narrow slice of the overarching
theory of structural contingency.
Structural contingency theory posits that the performance of an organization is
contingent on organizational structure being well fitted to external variables, such as
resources or funding among others, which change. Resource dependence theory views
organizations as dependent on their environment and the resources they obtain, which in
turn influences their effectiveness and ability to survive. According to this theory,
organizational performance exists in an ecosystem of resources that it needs and its
performance is affected by availability of those resources, be they funding, labor supply,
or raw materials (Gornitzka, 1999; A. J. Hillman et al., 2009; Oliver, 1991; Pfeffer &
Salancik, 2003; Sporn, 1999).
Structural contingency theory then posits that managers enact change within the
limits of bounded rationality, that is, within the bounds of what they know, what they can
148
influence, and what time they have. Those actions have counter effects, which can also
counteract greater performance improvement (Donaldson, 2000, 2001). Institutionalism
values conformity and convention as stabilizers against rapid change; external pressures
are met by internal norms, which shapes the speed and nature of change (Kezar, 2014; W.
R. Scott, 1987, 2008). Within institutionalism, the theory of embedded human agency
defines the paradox wherein institutions are the product of human actors as well as the
influencers of human actions. Those individuals who break with dominant group norms
are referred to as institutional entrepreneurs (Battilana, 2006). Where institutionalism
seeks to serve the interests and legitimacy of the organizational unit (Oliver, 1991),
institutional entrepreneurs seek to serve their own interests and legitimacy, resisting
change through passive adaptation when they do not share the interests of their
executives and when they have sufficient social capital to do so (de Zilwa, 2007). This
would be particularly true in higher education, where a high number of actors view the
organization through a strong sense of social capital and self-governance (Birnbaum,
1988; Duderstadt & Womack, 2003). Thus internal forces shape change at an incremental
level and resist change at a transformative level.
The remaining schools of thought on higher education sociology that elaborate a
premise of structural contingency theory are those of scientific management and social
cognition. Scientific management is a prescriptive change process, whose practitioners
apply a standard set of tools to enact change regardless of the context. In this perspective,
managers recognize and logically respond to external forces by driving internal change
(Kezar, 2014). A hallmark example of a scientific-management approach is the work of
John P. Kotter advocating a standardized set of stages and tools to lead change (Kotter,

149
1998, 2008). Social cognition theorists describe how individuals construct their
environment, make sense of it, and connect with the organization. In this perspective,
people’s perceptions of the organization create the reality in which they live, thus shaping
their ability or desire to change to resolve a sense of cognitive dissonance. Because of
this, among other factors, social cognition theory suggests prescriptive templates such as
Kotter’s cannot effect transformative change (Kezar & Eckel, 2002). Scientific
management strategies, such as strategic planning and steering committees, can enact
visible, first-order change at high levels. However significant cultural change requires
social cognition strategies, such as altering paradigms and creating new mental models, to
enact the deeper second-order change in individual mindsets needed to truly transform an
organization and sustain the change (Kezar, 2014). The interplay of these two
perspectives thus supports a premise of structural contingency theory: organizations are
slow to adapt to changes in the external environment because managers attempting to
enact change face an uphill struggle, causing them to satisfice with an acceptable,
incremental degree of change.
In 2007 Deanna de Zilwa conducted a study of 112 academic units that supports
the application of structural contingency theory and its connection to sociology theories
in higher education. The units responded to the environmental changes in different ways
linked to their cultural norms and heterogeneity, and only adapted when those changes
had pushed them “far from equilibrium” (de Zilwa, 2007 p. 571) or in the language of
structural contingency theory, when they were out of fit with their environment. The
social norms and entrepreneurial actors shaped the change to the point necessary to
recover equilibrium, or in other words, they satisficed.

150
How Integrated Planning Assures Transformative Change
Incremental change is fostered in an institution when unit leaders are not
integrated in their planning practices. They plan change within the limits of bounded
rationality: what they know, what they can influence, and what time is available. Their
efforts are further limited by cultural norms and institutional entrepreneurs who operate
toward their own interests. The unit leaders can only do what they can to achieve an
acceptable level of incremental change. Integrated planning expands the boundaries by
incorporating additional information and perspectives. Even if institutional leaders can
see the entire landscape of environmental change and unit planning efforts, institutional
entrepreneurs and cultural norms perpetuate internal counterforces driving unit leaders to
satisfice.
To be successful, a transformative change effort must be larger than the
counterforces. Unit planning toward incremental change must be aligned to reach a
transformative level. The actors of the institution as a whole must recognize the need for
change and embrace the integrated planning practices into a new normal that connects
them toward a common purpose. To embrace these practices, they must understand the
practices and be prepared for the outcomes. And all of these elements must be
implemented in a sustainable and ongoing manner or the interests of stability and
conformity will overcome them once again. This is the definition of integrated planning:
a sustainable approach that aligns the organization, builds relationships, and prepares for
change.

151
But… how? While the principles are comprehensible at the 30,000-foot level, in a
meeting of faculty and administrators at ground level it’s hard to know where to start.
Two models are available to operationalize integrated planning: academic program
prioritization already practiced in higher education and its cousin organizational portfolio
management practiced in corporate industry. The disciplines grew up in parallel with
striking similarities yet practitioners in either field were unaware of their cousin’s
existence. I propose a blended framework bringing together the best of both worlds to use
as an operational model of integrated planning for higher education. First I will introduce
each of the parallel disciplines, then present the blended version.
Organizational Portfolio Management from Corporate Industry
Organizational portfolio management views all the assets of an organization—
human resources, finances, facilities, and any others—as a portfolio of investments to be
continually managed in alignment with strategic objectives. It is based on Markowitz’s
economic portfolio theory that won a Nobel prize in 1990 (Markowitz, 1990). While
economic portfolio theory was intended to guide management of financial investment
portfolios, the principles have been transferred to other applications and industries,
including commercial corporations (Donaldson, 2000), the biopharmaceutical industry
(Reginato, 2005), global non-profits (Miljkovic, 2006), information technology (Kumar
et al., 2008; Project Management Institute, 2008), facilities management (Daigneau,
2010), and, hypothetically, the academic programs of higher education (Harper, 2011).
The fundamental principle of economic portfolio theory is that investors diversify
their holdings to reduce the risk of uncertainty. According to the now-global standard of

152
Portfolio Management (Project Management Institute, 2008; Rad & Levin, 2006;
Reginato, 2005), mature organizations intake, evaluate, select, and prioritize projects to
align funding with strategic objectives. They then continually monitor and recalibrate the
portfolio the same way an investor does with a financial portfolio, balancing risk and
reward. Organizational Portfolio Management takes it one step further, looking not just at
the proposed new projects of the organization, but also including all existing programs,
operational activities and resources of the organization itself as the portfolio (Hossenlopp,
2010). In this way it more closely aligns with program prioritization, which is also
designed to comprehensively evaluate all the programs and activities of the institution at
the same time.
Program Prioritization Applied in Higher Education
Program prioritization was introduced in the late 1990s, when Robert C. Dickeson
(Dickeson, 1999, 2010) published his recommended practice on the prioritization of
academic and administrative programs, which largely used the same principles as
portfolio management. In the Dickeson model, institutional constituents collaborate in
developing a set of criteria by which to evaluate all academic and administrative
programs. They then make decisions to augment, decrease, or eliminate resource
allocation for individual programs in alignment with strategic objectives. Program
prioritization has been viewed with a controversial eye by some institutions but has been
successfully implemented by others when the recommended methods were carefully
followed. Although Dickeson advocates the use of program prioritization on a continual
basis, most institutions have viewed it as a one-time or potentially repeatable exercise of
153
necessity but not a continual practice. Dickeson also advocates a transparent, inclusive
and collaborative decision-making process that works well where adhered to; of a sample
of 20 institutions, those that operated in a more closed or opaque process had less positive
outcomes (Milkovich, 2013).
Portfolio Management and Program Prioritization Compared
Both corporate portfolio management and higher education program prioritization
are integrated planning disciplines calling for comprehensive review of resources in
alignment with strategic planning. Those resources include human personnel and staffing
plans, budget planning and funding sources, facilities management and IT investment
management, among the most common. But as disciplines arising in different sectors,
they also differ in significant ways.
First, as the organizational portfolio must be maintained and continually
recalibrated, it is always implemented as a continual practice; conversely, program
prioritization is usually implemented as a one-time solution to a problem, potentially to
be repeated in the future but only if needed.
Second, and most obvious, is that program prioritization is applied to academic
programs, which traditionally can take years to put in place and are rarely closed. If
closed, that exercise usually takes just as long. While corporations also have programs
with long start-up and close-out requirements, they tend to have less durable programs as
well, which are easier to reduce or discontinue to realign the resources.
Third, portfolio management aligns programs and their associated resources with
strategic priorities and in practice that results in some programs being prioritized over

154
others. Balance is the emphasis, however, and not prioritization. Because the portfolio is
continually recalibrated, and because strategic priorities are expected to change, the
balance is expected to change. Programs that were a low priority could become a high
priority at any time. Balance and realignment are viewed as reasonable business logic;
whereas, in the academic world of equality, the emphasis, and in fact the very word
prioritization, implies that some programs could be labeled unimportant. Every program
is important to somebody and every somebody has a program important to them, so any
implication of unimportant is a challenge to the cultural norm. And so, where programs
are difficult to start or stop, are often led by highly specialized faculty, and are each
important to somebody, realignment of resources is not viewed as reasonable business
logic but as institutional anathema.
Those three differences in combination help to explain why program prioritization
in higher education is often resisted and portfolio management in corporate industry is
usually not. Yet program prioritization is specially designed to apply to higher education
where portfolio management does not take into consideration the nuances of academic
programs and institutional cultures. The framework I propose as institutional portfolio
management combines the best of these worlds.
The Framework of Institutional Portfolio Management
Institutional portfolio management integrates strategic planning, program
assessment, budget and resource planning, and applies the integrated plan to the existing
assets and proposed investments of academic and administrative programs in institutions
of higher education. Program performance is continually measured and analyzed; new

155
programs are evaluated for their potential to meet institutional goals and performance
objectives. When new programs are added, whether academic or administrative,
resources are redistributed within the portfolio to accommodate the new program with the
intent of maintaining or improving overall performance. It is a continuous process of
integrated management.
The process begins with strategic planning to establish the vision for the
institution’s future and the goals necessary to achieve it. As the ultimate goal is to align
resources to strategic objectives and improve performance outcomes, the strategic
objectives and desired outcomes must be established first. The institution as a whole must
know what its future should look like, what its competitive advantage is, and what its
performance metrics should be so that integrated planning has a clearly known target.
The process is informed by a comprehensive assessment of all academic and
administrative programs. The existing assessment practice of the institution is thus
incorporated into the planning process, the primary distinctions being that all programs
are assessed simultaneously using the same criteria, and incorporating costs and resource
uses such as staffing, technology, and facilities. In portfolio management, the criteria are
often summarized in categories of cost, benefit, risk, and strategic alignment. Dickeson’s
model proposes a base set of ten criteria more appropriately elaborated for a higher
education setting. For this step to be successful, each institution must develop the criteria
appropriate to its mission, values, and culture and must do so in a transparent, inclusive,
and collaborative manner involving or led by faculty and staff.
The process is applied by reviewing all program assessments to determine which
programs most closely align, either directly or indirectly, with strategic objectives, with

156
what investment requirements, and with what probable return on the investment. Let’s
look at each piece of that application.
Alignment: A program might directly align with strategic objectives when it is
clearly tied to a future goal, such as a new engineering program at a school relying on its
engineering reputation for competitive advantage. A program might indirectly align with
strategic objectives when it is a service program essential to all engineering programs.
Those could include a mathematics program with few majors, a composition program
that teaches technical writing with no majors, a humanities course that develops critical
thinking, or a program of historic value to the institution for any reason. Indirect
alignment also includes administrative programs that are essential to the operation of the
institution.
Investment: Each program requires investment of faculty, staff, funding,
technology, and space. Planners must understand the level of investment required for
each program to maintain its current performance and to reach any future performance
goals. This is a touch point of integrated planning, where formerly disparate planning
processes and data need to be interwoven. Institutional information systems do not
always allocate resources such as personnel, technology, and facilities on a program
basis, it is more often aggregated by resource type. Planners will likely need to develop
analytical models to approximate resource usage.
Return: Understanding return on investment in higher education is not a
quantitative exercise as it is in corporate industry. The benefits of academic programs to
society and the mission of the institution is far more qualitative in nature. Nevertheless,
there is still a finite availability of resources to allocate. The institution needs to think

157
through the alignment of the program compared to the investment required. A simple
understanding of high or low alignment and high or low investment will be informative.
The probability of success is also a part of the return analysis, particularly for programs
requiring additional investment to achieve goals. Probable return is a balance of reward
and risk.
While planners inform the portfolio with integrated information, it is up to
institutional leaders to make decisions about resource allocation according to the culture
of the organization. Where a strong culture of shared governance exists, shared
governance should participate or lead portfolio decisions. Where an institution is strongly
supported by alumni donors or has heavily engaged board members, those groups should
also participate. The sociology and relationships within the institution must be honored
and incorporated into the decision process in order to sustain it and prepare the culture for
transformative change.
Portfolio calibration means that programs are continually (that is, perhaps
annually or biannually) considered for resource allocation. That could include sustaining,
augmenting or reducing resources, adding new programs, or eliminating programs over
time. Resource allocation in turn informs budget planning, technology planning, and
facilities planning. When new programs are added or existing programs augmented, the
resources must come from somewhere in the portfolio, requiring recalibration by
collecting, reducing or eliminating somewhere else. Additional resources can be
collected, for example, when increased revenue is realized and allocated to selected
programs or when efficiency gains are found in administrative programs. Ongoing
calibration also involves continually monitoring and predicting changing environmental
158
demands and adapting institutional strategies, which in turn influences changing goals
and subsequent resource redistribution in a continuous cycle.
The Sum of the Parts is Greater than the Whole
Institutional portfolio management is an ongoing process that is both informed by
integrated planning data and in turn drives integrated planning in response to portfolio
decisions. The framework operationalizes the definition of integrated planning as a
sustainable approach that relies on and builds relationships within the institution, aligns
resources with strategic objectives, and prepares the culture for change through a
transparent and inclusive process. Integrated planning prevents incremental unit-level
successes from slowing transformative institutional change, enabling institutions to
incorporate and achieve performance goals and satisfy stakeholders. All of this is done
persistently and in slow motion, rather than reactively. Institutional portfolio management
intentionally and continually maintains alignment of resources with strategic objectives to
achieve high performance in relation to external pressures.

159
CHAPTER SIX
INSTITUTIONAL PORTFOLIO MANAGEMENT: IMPLEMENTING A
FRAMEWORK TO IMPROVE INSTITUTIONAL PERFORMANCE
Contribution of Authors and Co-Authors
Manuscripts in Chapters 4, 5, 6
Author: Anne Milkovich
Contributions: Sole author and contributor

160
Manuscript Information Page
Anne Milkovich
EDUCAUSE Review
Status of Manuscript:
Prepared for submission to a peer-reviewed journal
X Officially submitted to a peer-review journal
Accepted by a peer-reviewed journal
Published in a peer-reviewed journal
Published by EDUCAUSE
Submitted: March 21, 2016

161
INSTITUTIONAL PORTFOLIO MANAGEMENT: IMPLEMENTING A
FRAMEWORK TO IMPROVE INSTITUTIONAL PERFORMANCE
Abstract
Institutions of higher education are under pressure to demonstrate improvement in
performance metrics, such as graduation rates. To be effective and valued strategic
partners, Chief Information Officers and technology leaders should educate themselves
on the political and economic challenges their institutions face. Even better than coming
to the table with knowledge is to come to the table with solutions that will help improve
institutional performance. In this article I summarize the political and economic
landscape of higher education today and present a new framework of Institutional
Portfolio Management, borrowing from the best practices of strategic management in
higher education and private industry. The future for all institutional leaders is to address
those performance metrics. IT leaders who understand the parallels and can apply the
framework have an opportunity to guide their institutional leaders in demonstrating
performance improvement. In this article I provide practical principles, guidelines,
techniques and tools of institutional portfolio management. I also provide a fictitious case
study based on my knowledge of applied program prioritization and my personal
experience as a practitioner of portfolio management.
162
INSTITUTIONAL PORTFOLIO MANAGEMENT: IMPLEMENTING A
FRAMEWORK TO IMPROVE INSTITUTIONAL PERFORMANCE
Introduction
In today’s era of increased funding pressure, public scrutiny, and performance
expectations, institutions of higher education face new challenges that compel them to
undertake new practices toward improved institutional performance. As Chief
Information Officers increasingly become strategic partners at the leadership table, it
behooves them to be educated in the political and economic challenges facing the
institution, not just the technological challenges. Even better than coming to the table
with knowledge is to come to the table with solutions that will help improve institutional
performance. In this article I point out similar challenges and practices from higher
education and private-sector industry and present a combined framework borrowing from
the best of both. IT practitioners might recognize the triple-constraint challenge and
portfolio-management techniques from their own experience, and be surprised to learn
the same exist in parallel form in the academies of higher education. Armed with the
knowledge and the practical framework I elaborate in this article technology leaders will
be better prepared as the institutional leaders of the future.
The Challenges
In 2006 the United States Department of Education released what is commonly
referred to as the Spellings Report but is formally titled “A Test of Leadership: Charting
the Future of U.S. Higher Education” (United States Department of Education, 2006).

163
The Spellings Report acknowledged higher education as one of America’s greatest
success stories and a world model but also called upon it to improve performance in
critical areas of access, cost and affordability, financial aid, learning, transparency and
accountability, and innovation. No small charge.
The National Center for Public Policy and Higher Education responded with a
report titled “The Iron Triangle: College Presidents Talk about Cost, Quality, and
Access” (Immerwahr et al., 2008), having interviewed over two dozen presidents from a
variety of higher education institutions to add their perspective to the public dialog. The
presidents describe the competing demands for reduced cost, maintained quality, and
increased access as being in a reciprocal relationship they refer to as the iron triangle,
wherein a change in one causes an inverse change in another. For example, reducing
costs requires that an institution either sacrifice quality, such as with a higher student-to-
faculty ratio, or decrease access, such as by offering less support to disadvantaged
students making it harder for them to complete. Increasing accessibility to a wider range
of students increases costs through additional faculty, additional marketing campaigns,
and additional support services (Daniel et al., 2009; Immerwahr et al., 2008). More,
better, cheaper—each one takes from another. If you want more, you either have to spend
more or decrease quality. If you want better, you either have to spend more or push
through fewer units. If you want cheaper, you either have to push through fewer units or
reduce quality. In technology, units might be function points in a software program; in
higher education, units are our students.
The three-point iron triangle of cost, quality, and access in higher education bears
a striking resemblance to the triple constraint of cost, quality, and time in the discipline of

164
project and portfolio management (Project Management Institute, 2008; Rad & Levin,
2006). Both access and time refer in a sense to productivity or throughput, where
providing access to a wider volume of students yields greater throughput of graduates and
where longer time in a development schedule yields greater throughput of product. As in
the iron triangle, making a change to one of the triple constraints creates a reciprocal
change in another. For example, increasing throughput, e.g. speed of delivery, or
increasing quality, e.g. features incorporated into the product, increases cost. To reduce
costs you must either sacrifice quality, for example with fewer function points, or
decrease speed, for example by reducing the number of people working on the project
(Project Management Institute, 2008; Rad & Levin, 2006). While it’s possible to realize
efficiency gains that increase throughput without increasing cost, those gains are typically
found in manufacturing environments or routine operations, not in industries that rely on
highly educated, touch-intensive labor such as healthcare and education (Archibald &
Feldman, 2010). In these industries, the same rule holds—more, better, cheaper—each
one takes from another—but efficiency innovations are not easily realized.
Today’s era of increased pressure to improve institutional performance is not new,
although the intensity may be greater today than in bygone eras, as all five of “Porter’s
Five Forces” in the higher-education sector are changing simultaneously (Gumport,
2007). The changes in industry forces manifest for higher education as: a) society shifting
toward a view of higher education as an individual benefit rather than a social good,
believing the expense should be borne by the individual and not the state; b) legislatures
less inclined to fund higher education as a result of social pressures and less able to fund
higher education as a result of fiscal pressures, e) for-profit institutions increasing in

165
number and competitiveness, d) enrollments widening, adding increased pressure on
institutional infrastructure; e) the student demographic shifting away from the traditional
post high-school four-year experience to a profile of older working adults or more
transient students who stop and start or come and go among schools; f) distance
education breaking down geographic boundaries and expanding the competitor base from
which students can select an institution (Birnbaum, 1988; Duderstadt & Womack, 2003;
Eckel, 2002).
The Solutions
Both higher education and private-sector industry have experimented with or fully
adopted solutions to the pressures they face. As institutions have faced reduced financial
support from state allocations or private donors and endowments, they have often cut
their budgets in an across-the-board method, each unit contributing its proportional share.
It’s not strategic, since you’re cutting the good along with the bad indiscriminately, but
it’s simple, “fair,” and easy to explain to internal stakeholders. Some institutions have
attempted a more strategic approach of program prioritization, which evaluates all
academic programs and administrative services and reallocates resources in alignment
with strategic objectives (Dickeson, 1999, 2010; Milkovich, 2013, 2016). The practice of
program prioritization in higher education has a parallel practice of portfolio management
in private industry (Milkovich, 2016). Both serve to align limited resources with strategic
objectives by intentionally allocating those resources among the organization’s collection
of programs. Both offer strengths to capitalize on in a combined framework, as described
below.

166
About Portfolio Management
Portfolio management treats all operational programs as a collection of
investments that should be evaluated in comparison with each other through a pre-
defined set of cost-benefit-risk-alignment criteria. Organizational resources, e.g. funding,
physical assets, and human time and effort, are then allocated in alignment with strategic
objectives. A high-priority program may be augmented with additional resources while a
lower priority program sees its resources reduced or eliminated (Kumar et al., 2008). A
change in market conditions or environmental context may suggest a change in the
portfolio mix to recalibrate the resource allocation, the risk-reward balance, the strategic
emphasis, or to pursue new opportunities. It is an ongoing process, not a one-time fix.
Portfolio management has been applied in multiple disciplines, such as electrical
engineering, biopharmaceuticals, global non-profits, information technology, and
facilities management, and incorporates a variety of organizational assets, such as human
resources, facilities space, equipment, and funding (Daigneau, 2010; Donaldson, 2000;
Harper, 2011; Miljkovic, 2006; Reginato, 2005). Success of this approach in improving
corporate profits and share value is evidenced in the growing field of portfolio
management now gaining a foothold in professional organizations such as ISACA and
the Project Management Institute, even evolving to a formal standard (ISACA, 2012;
Project Management Institute, 2008).
SIDEBAR: Although related, portfolio management differs from project management or program
management. Project management delivers a defined output within the prescribed time,
budget, and scope. A project can be successfully executed even if it’s an unneeded project—you
can cut down the trees really well, but still be in the wrong forest. Program management

167
delivers the intended benefits of an outcome, defining projects and balancing the resources that
have been allocated in the process. Program management makes sure you’re sent to the right
forest. Portfolio management encompasses both program and project management, focusing on
the selection of programs and allocating resources to achieve strategic objectives. Portfolio
management makes sure that cutting down forests is the right business to be in, compared to
other opportunities to achieve the mission.
About Program Prioritization
Program prioritization treats academic programs and administrative services as a
collection of investments that should be evaluated in comparison with each other through
a pre-defined set of criteria. Institutional resources, e.g. funding, physical assets, and
human time and effort, are then allocated in alignment with strategic objectives. A high-
priority program may be augmented with additional resources while a lower priority
program sees its resources reduced or eliminated (Dickeson, 1999, 2010). A change in
market conditions or environmental context may suggest a new program to pursue and
thus require a change in the resource allocation of the existing program mix. A program
may be maintained for many reasons not readily apparent; for example, although a
program does not directly align with the institutional mission, e.g. it is not a science
program in a STEM land-grant, it could be a sustaining service to those that do, e.g. it is
an English program that fulfills undergraduate education. Just like in technology, an
investment may not directly align with institutional mission, e.g. it is a network security
service, but it is a sustaining service to the overall operation of the campus. Program
prioritization has been used by institutions to achieve quality recognition awards, add
faculty lines and new programs, and open new colleges, in addition to absorbing dramatic

168
budget cuts (Milkovich, 2013). Program prioritization is not without its critics. Just the
word prioritization is inflammatory to some, implying that some programs could be more
important than others. Although Dickeson’s model calls for a highly inclusive and
transparent process, inclusive and transparent are still open to interpretation and have
been applied differently with different results, not always favorably viewed by the
academy. While recommended as an ongoing process, program prioritization has often
been applied as a one-time solution (Milkovich, 2013), reinforcing suspicions that it is
reactive in nature.
Framework for Institutional Portfolio Management
Blending the best practices from each field into a framework of institutional
portfolio management has the potential to create a powerful tool in support of
institutional performance improvement (Milkovich, 2016). Although known by different
terms, both practices rely on common elements of: a) governance of the portfolio and
prioritization process by a group of stakeholders; b) predefined criteria to evaluate, select,
and prioritize programs within the portfolio; c) use of criteria that address cost, value, and
alignment to mission objectives; d) incorporation of other organizational plans, such as
strategic and financial plans; and e) adaptation of common practices to the culture and
characteristics of the organization (Cope & Delaney, 1991; Dickeson, 2010; Harper,
2013; Project Management Institute, 2008; Rad & Levin, 2006). Primary differences are
that program prioritization emphasizes a transparent and inclusive process to develop the
criteria of evaluation; portfolio management emphasizes an ongoing process of continual
re-balancing. Combining the best practices of both in a new framework that emphasizes

169
transparency and inclusivity as well as continuity and balance offers institutional leaders
a standard for guiding institutional performance improvement. I elaborate these points
and explain the framework in the following sections.
Foundational Elements
Foundational elements are features that should be included in some way, shape, or
form for the framework to be successfully implemented. They might also be called
critical success factors—those things that must happen for the initiative to succeed.
1. Evaluation criteria are developed through an inclusive and transparent
process incorporating shared governance appropriate to the culture of the
institution.
2. All existing programs are assessed according to the evaluation criteria.
3. Program resources are aligned according to institutional objectives:
augmented, reduced, or eliminated as needed.
4. Performance of the overall program portfolio is continually reviewed.
5. New programs are evaluated for their potential to meet institutional
objectives.
6. When new programs are added, whether academic or administrative, the
portfolio is reviewed and resources are redistributed to accommodate the
new program with the intent of maintaining or improving overall
performance.

170
7. Strategic planning and financial planning are incorporated into program
planning.
8. Environmental demands and constraints are continually monitored and
forecasted, e.g. changes in demographics, public support, or funding
sources.
9. Institutional goals and strategies are adapted in response to changing
conditions.
10. Goals, process, outcomes, and overall performance are continually
assessed and communicated.
All of this is done persistently and methodically, rather than reactively.
Institutional portfolio management thereby intentionally and continually maintains
alignment of resources with strategic objectives to demonstrate and maintain high
performance in relation to institutional goals and external pressures.
Process Overview
Figure 1 illustrates a process map of institutional portfolio management. At the
heart of the process is ongoing portfolio review that can be conducted on a regular
schedule and/or when information triggers a review, such as a revised strategic plan,
financial plan, or changing environmental conditions. A review is also triggered when a
new investment is proposed, i.e. a new academic or administrative program. New
investments should move through the process in a stage-gate model, only proceeding to
the next stage upon clearance from the prior stage, described below.
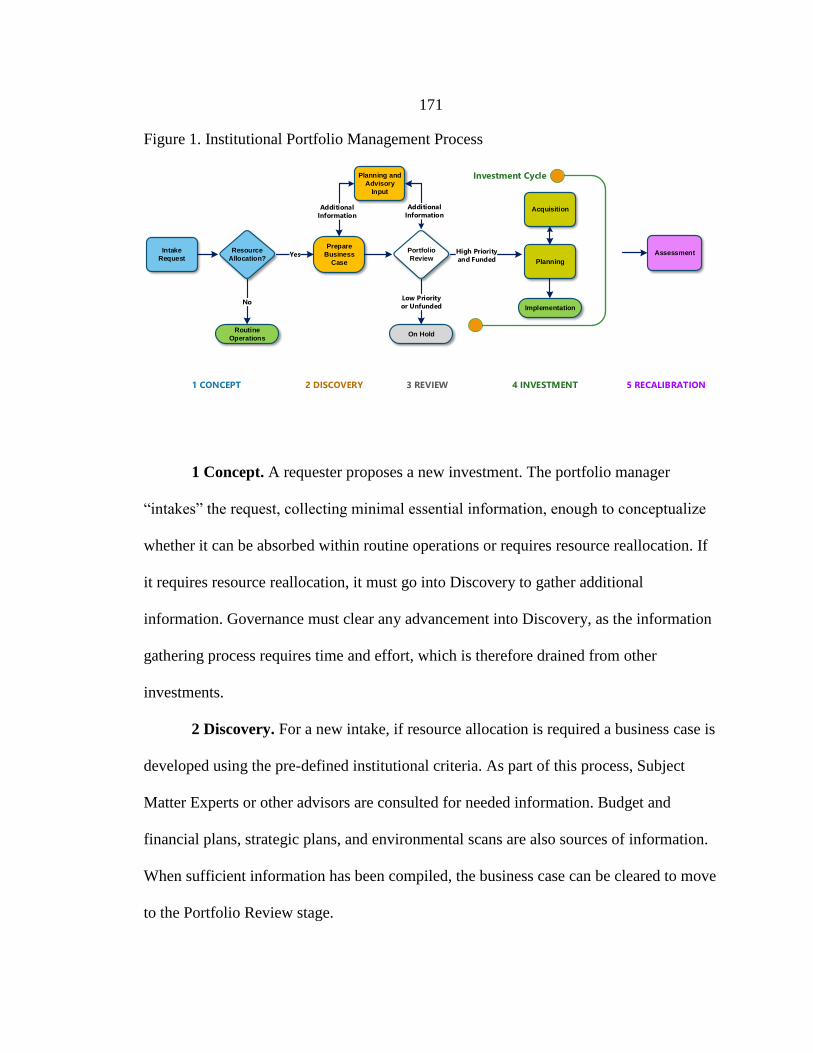
171
Figure 1. Institutional Portfolio Management Process
Investment Cycle
Intake
RequestPlanning
Acquisition
Implementation
On Hold
Prepare
Business
Case
Portfolio
Review
Low Priority
or Unfunded
High Priority
and Funded
Resource
Allocation?
Routine
Operations
No
Yes
Planning and
Advisory
Input
Additional
Information
Additional
Information
Assessment
1 CONCEPT 2 DISCOVERY 3 REVIEW 4 INVESTMENT 5 RECALIBRATION
1 Concept. A requester proposes a new investment. The portfolio manager
“intakes” the request, collecting minimal essential information, enough to conceptualize
whether it can be absorbed within routine operations or requires resource reallocation. If
it requires resource reallocation, it must go into Discovery to gather additional
information. Governance must clear any advancement into Discovery, as the information
gathering process requires time and effort, which is therefore drained from other
investments.
2 Discovery. For a new intake, if resource allocation is required a business case is
developed using the pre-defined institutional criteria. As part of this process, Subject
Matter Experts or other advisors are consulted for needed information. Budget and
financial plans, strategic plans, and environmental scans are also sources of information.
When sufficient information has been compiled, the business case can be cleared to move
to the Portfolio Review stage.

172
3 Review. With necessary information compiled, the existing portfolio is
reviewed to determine whether the proposed investment has the potential to improve
overall performance compared to other programs and opportunities. The portfolio
reviewers are appointed according to the culture of the institution, including executives
and governance representatives as appropriate. If the proposed investment is adopted,
resources within the portfolio must be realigned to accommodate it—the money has to
come from somewhere. Once funded, the proposed investment enters the portfolio as a
new program.
4 Investment. In the investment cycle, a new project or program is planned,
developed and/or acquired according to standard practices, then executed along with the
rest of the portfolio.
5 Recalibration. A new proposed investment is a trigger to review and recalibrate
the portfolio by realigning resources. Any additional information could also trigger a
review, such as a revised strategic plan, a new budgeting cycle, or new market
information. Even without new information, the portfolio should be regularly reviewed,
at least annually, to assess opportunities for improvement.
Evaluation Criteria
Dickeson (2010) suggests an initial set of ten criteria to evaluate programs, which
institutions can consider and adapt to their own needs. Those criteria are briefly
summarized below; for more in-depth explanation, refer to Dickeson’s work.

173
1. History, development, expectations. Why was the program developed? Is
it meeting its original intent and/or has it changed to adapt to changing
needs?
2. External demand. What do national statistics indicate is the present and
future demand of students and society for this program? It’s important not
to be reactive to shifting whims, such as an increase in demand for
criminal forensics shortly following the introduction of a new popular
television crime series. At the same time, it’s also important to understand
regional and national long-term needs supported by evidence.
3. Internal demand. Many academic programs do not host many majors or
minors but do act as a critical service program to others, which should be
taken into account.
4. Quality of inputs. Inputs are the faculty, technologies, students, funding
and other resources that support a program. Inputs are relatively easy to
measure and are often used as a proxy for program quality.
5. Quality of outcomes. Outcomes are the measures of effectiveness of a
program and are much harder to evaluate than inputs. Recent trends in
program assessment are driving the field more toward evaluation of
outcomes, such as measuring learning outcomes or placement into careers
or graduate programs.

174
6. Size, scope, productivity. This criterion is a look at volume and ratios to
support it. How many students pass through the program? What is the
ratio of faculty to students and the ratio of staff to faculty in the
department? What is the density of faculty specialists or the ratio of tenure
to non-tenure?
7. Revenue. Some programs bring in additional revenue to the institution,
through enrollments but also through research grants, donor gifts, fees,
ticket sales or other sources. Service programs can also be viewed as
subsidies for a net comparison.
8. Costs. What are the relevant, direct and indirect, costs of a program? What
additional costs would be needed to achieve performance goals for the
program or what efficiencies could be realized with same or less
investment?
9. Impact. This criterion is a broad narrative of the positive effect the
program has on the institution or the negative effect if the program were
reduced or discontinued. Any information about the program that is
important to understand in consideration of its future can be included here.
10. Opportunity analysis. This final criterion is a consideration of new
opportunities for the institution. What else should the institution be
pursuing that it isn’t already, or how could it be doing things differently to
better effect?

175
Business Case
A business case involves an analysis of cost, benefit, risk, and alignment to
objectives, with varying interpretations. Some define “business case” as a statement of
benefit in a larger analysis of benefit, cost, and risk; some define the business case as the
entire analysis. In any interpretation of a business case, cost is typically quantifiable
where benefit and alignment are qualitative and risk is a combination of quantitative and
qualitative. For purposes of an institutional portfolio management framework, business
case is defined as the complete analysis of cost, benefit, risk, and alignment, as defined
below.
Cost = a quantitative analysis of the upfront and ongoing costs of an investment.
Costs include time and effort (labor) associated with the program, regardless of where the
salary and benefits are paid from, as well as purchases. Upfront and ongoing costs are
usually reported separately so that decision makers can see the initial outlay required as
well as the annual commitment.
Benefit = a narrative description of the benefits the institution will realize through
the program. Although it’s theoretically possible to quantify an expected return on
investment as a benefit, in reality it’s a pretty sophisticated organization that can do that
with any validity. A narrative description is effective for most audiences, without the
management system becoming larger than the outcome it manages.
Risk = a combination of quantitative and qualitative analysis of probable risks and
outcomes. Program risk in a technical organization is usually assessed in terms of the
probability of an event or outcome occurring, expressed in a percentage, and the cost of
impact if the event or outcome does occur, expressed in currency. Multiplying the

176
probability times the impact, or the percentage times the currency, results in a risk score.
But in spite of its seemingly quantifiable precision, the original estimate of probability
and the original estimate of cost are still qualitative, albeit highly educated, guesses. The
best approach is to show the quantitative math along with a qualitative narrative to
explain the impacts. Program risk is not normally associated with academic program
review or new academic program proposals. Present or future lack of interest in a
program by prospective students or employers does constitute a risk to academic program
success, as well as high overhead to provision or sustain operations compared to marginal
interest among stakeholders.
Alignment = a narrative describing how the program addresses strategic
institutional objectives. Objectives can be explicitly published in a strategic plan or
deduced from common knowledge, i.e. the strategic plan developed a few years ago
doesn’t necessarily speak to operating more efficiently, but we know in the current
climate that increased efficiency is an emphasis.
A cost-benefit-risk-alignment analysis gives a comprehensive picture to decision
makers of how a program contributes to the institution as well as how it consumes
resources of the institution. Dickeson’s ten criteria of program prioritization correlate
with the business case criteria of portfolio management, as I categorize in Table 1.
Dickeson’s list of criteria provide a more detailed explanation of information that should
be included in a cost-benefit-risk-alignment analysis, which is just a different and more
generalized way of grouping the same vital information. Some of the program criteria
could be matched to more than one portfolio criterion, there are multiple ways to slice
and dice. Table 1 illustrates one alignment.

177
Table 1. Comparison of Portfolio Management and Program Prioritization Criteria.
Portfolio Criteria
Program Criteria
Rationale
Cost
8. Costs
Costs include time and effort of faculty, staff, and administration as well as space and other expenses. Revenue offsets cost and should be considered as part of the analysis. Costs needed to improve a program should also be considered.
6. Size, scope, productivity
Like revenue, size and productivity of the program could outweigh the costs with a net positive effect. A low-productivity program does not mean the program is struggling; different disciplines have different productivity scales.
10. Opportunity analysis
Opportunity “cost” is the loss to the institution of other alignment opportunities not realized because of the investment in this program.
Benefit
1. History, development, expectations
A program may have historical or other value to an institution that does not necessarily align with strategic objectives; that doesn’t mean the institution wants to discard all other benefits.
2. External demand
External demand is a benefit to the institution as it indicates positive attraction and attention by constituents.
7. Revenue A low-revenue program does not mean the program is not important or should be cut. Revenue potential varies with discipline. Should also be considered as part of cost.
Risk
4. Quality of inputs
Low-quality inputs indicate a program is at risk, as low-quality inputs are more likely to generate low-quality outcomes.
5. Quality of outcomes
Low-quality outcomes indicate a program is struggling, and therefore a risk to the overall success of the institution.
Alignment
3. Internal demand
A program may be a service program to other programs, making it essential to the university and therefore in alignment with objectives, even though it does not itself attract any external attention. Could also be considered as part of benefit.
9. Impact This is a catch-all criterion to incorporate any information that doesn’t fit in one of the other criteria. Should also be considered as part of benefit.
The criteria are intended to provoke thought, be comprehensive, and be adapted to
individual institutions. The process for developing criteria is as-important as the criteria
themselves and should be inclusive (everyone is included in the process and decision-
making, even if only in some representative manner) and transparent (everyone knows
how decisions are made and what the decisions are). All programs, academic and
administrative, must be evaluated by a set of criteria developed in advance. Some
institutions have chosen to use different criteria for academic versus administrative

178
programs. Certainly some of the more specific criteria do not apply to administrative
programs, such as revenue or external demand or historical value. An administrative
program such as “Payroll Processing” or “IT Network” will score zero points in any of
those criteria, but certainly score very high on internal demand and impact. The criteria
are intended to inform decision-making, not become a mathematical substitute for human
judgment. Administrative programs can be evaluated separately from academic
programs, but at the end of the process, decisions must be made that distribute limited
resources among all programs. An example of a business case template is provided in
Appendix A.
Scoring Rubric
A scoring rubric can be used with any set of criteria. Like an academic grading
rubric, it describes the characteristics that achieve a score for a given criterion. When
evaluating something as complex as competing program investments, decision makers
should not rely solely on a scoring rubric, the scores are merely informative. The value is
as much in defining what low, medium, and high look like for each criterion. Defining
the outcomes in writing, in advance, helps everyone understand what the outcomes might
look like and improves inter-rater reliability. One method to develop a rubric is to define
only the maximum possible outcome, then when applying the rubric score each candidate
according to how close it comes using a Likert scale. An example of a scoring rubric is
provided in Appendix B. Another method is to define high, medium, and low outcomes
and assign the category. The format doesn’t matter; the rubric can be a descriptive
document or a spreadsheet. The scale does not need to be evenly spaced, in fact, a

179
nonlinear scale may be easier to use, such as only offering Low, Medium, and Very High.
This reduces the tendency to cluster programs in the middle.
Some guiding principles to keep in mind when using scoring rubrics:
Keep it open. The process of developing a scoring rubric is as important as the
results of its use. For the results to be trusted the process must be trusted, therefore the
process must be transparent and inclusive.
Keep it simple. Resist any temptation to develop a sophisticated or highly precise
rubric. No matter how precise or quantitative the analysis appears, most criteria are still
based on qualitative information and professional judgment; precision is an illusion.
Keep it positive. Define everything in the positive form to avoid pole confusion.
For example, High or 5 when applied to a positive criterion such as Overall Benefit is
clearly positive. When applied to a criterion such as Risk, is High Risk good or bad? One
way to address that is to try to get everyone to remember that when talking about risk,
High or 5 is bad. Alternatively, rephrase Risk as a positive Probability of Success so the
scoring poles remain aligned in the same direction.
In the following fictitious example, I present a case study of a university
implementing institutional portfolio management. The story is compiled from my
interviews of 20 university presidents and provosts who implemented program
prioritization and my own experience implementing portfolio management at two
different universities.

180
The Story of Waters State University
Waters State University is a comprehensive university in the upper Midwest. It
serves the region’s population of primarily traditional-age first-generation students, with
undergraduate programs in liberal studies, education, business, and nursing, numerous
master’s programs, and a few recently opened doctoral programs. As with many of the
public institutions in the Midwest, Waters U has struggled with a decreasing population
of high school students and repeated cuts to their state allocation. In spite of the
challenges and their declining enrollments, Waters has maintained high academic quality,
launched an innovative general studies program, and built up a reputation for
sustainability research.
In recent years, Waters State University hired Dr. Anthony Gofortt as Chancellor
following the retirement of the previous, long-standing and well-regarded Chancellor.
Chancellor Gofortt had ambitious ideas to advance the unsung quality of the institution to
a position of national renown but the severity of the budget cuts brought into stark reality
the necessity of finding alternative means. Chancellor Gofortt launched a new strategic
planning initiative, led by Provost Lance Wynns, as he investigated solutions to his
resource problems.
As the strategic plan began taking shape, priorities emerged to increase diversity,
expand academic programs in technology, sustain the widely-acclaimed general studies
program, and pursue the highest-possible national ranking for sustainability research and
campus practices. But the institution had still not found a way to fund any of the
priorities. Over dinner with colleagues at a national conference, Chancellor Gofortt

181
shared his worries with his old friend Akeem Bashar, who told him of a newly proposed
framework that might be useful to him, called Institutional Portfolio Management.
Akeem also gave him the contact information for the author and well-regarded scholar in
the field, Dr. Antonia Williams.
Setting the Stage
Over the phone, Chancellor Gofortt and Dr. Williams discussed a consulting
engagement for Antonia to assist Waters U with their Institutional Portfolio Management
(IPM) initiative. Antonia explained to the Chancellor that she has studied in this area for
years but this is a new framework that has not been completely tested. She was looking
for a university to pilot it and participate as a case study. The Chancellor agreed to the
opportunity and listened carefully to Antonia’s high-level plan of action.
Antonia arrived for the first of many campus visits to hold a workshop on IPM for
all faculty, staff, administrators. The Chancellor kicked it off to explain why the campus
community needs to do things differently, and the opportunity to participate in a newly
developed practical framework for intentionally managing institutional performance
metrics. Antonia explained how IPM works, emphasizing inclusivity, transparency, and
balance, and the firm belief that the campus must define and manage the process; she was
there only as a facilitator and guide-on-the-side.
To start, Antonia asked the audience what values the institution holds dear, and
what groups should be involved in any large-scale change effort. As the audience shared
ideas, Antonia recorded them, displaying her notes on the large screen that was also
streamed to office desks for staff and faculty who couldn’t break away for the event. The

182
audience suggested a Steering Committee with wide representation from shared
governance and all constituents. A volunteer monitored the remote participants to collect
their viewpoints as well. With feedback collected and the campus community apprised of
the coming initiative, the Provost worked on convening the Steering Committee and
Antonia returned home to polish up the plan before vetting with the Steering Committee,
at their first of many weekly video-conference meetings. Over the next several months,
Antonia guided and supported the Steering Committee through the steps listed and
described below, engaging a grad student to help with scribing and scheduling, and the
university IT team to help with digital document sharing and remote tech support.
Communications
The first thing the Steering Committee did was to appoint a Communications
Team, with expert support from the Marketing & Communications department
(“Marcomm”). The Comm Team planned their communications to include a web site,
weekly news updates posted on the web and pushed through email, a rumor hotline, and a
series of scheduled press releases. With Marcomm’s input, they quickly realized the
promotional value of the initiative in demonstrating to the board and legislature the
proactive, transformative, and strategic approach the university was taking through the
IPM initiative. The Chancellor and Antonia, along with the university’s Chief
Communications Officer, held a conference call with the board, explaining the initiative
and the expected outcomes. The board responded with cautious optimism.

183
Process Design
Next, the Steering Committee appointed a Process Team to design and lead the
process. Antonia coached the process team about the sociology of change in higher
education that would be useful to understand and provided resources for learning. She
noted it was especially important to “get down to the DNA of the organization” to
achieve transformative change. To succeed, individuals needed to construct new ways of
thinking about the institution, in the face of a new reality. A top-down only process
would not endure. While the Process Team got started, the Steering Committee
researched and selected institutional performance metrics to use post-process to
demonstrate the long-term results of their transformative change to constituents, board,
and legislature.
The Process Team decided on two separate teams to gather information and
evaluate academic programs and administrative programs, to be merged eventually. They
believed faculty should lead both teams to keep the emphasis on academic quality,
whether directly through academic programs or indirectly through administrative support
programs. They also made sure that staff were widely represented on both teams, then
decided to convene the teams to help design the process.
The expanded Process Team decided on a single set of general evaluation criteria
for both teams, finally deciding on Alignment, Value, and Risk as it would be easier to
merge the two sets in the end, but each one was detailed differently for academic versus
administrative programs. As they worked, the Process Team members each continually
checked in with constituents, sharing their progress and incorporating feedback.
184
The Process Team moved on to develop a workflow for both the academic and
administrative Process Teams: Discover (gather information), Assess (categorize the
programs according to the information), Reallocate (make decisions about the programs),
and Evaluate (determine and report on the success of the process and the outcomes).
The first challenge for the Process Team was to determine what constitutes a
program. Certainly it meant every major, minor, certificate, or other official stamp of
academic completion, but what about classes that served multiple majors without being a
distinctive major themselves? And what about administrative programs—was HR one
program or should it be broken into multiple programs such as one for Recruiting and one
for Compensation? They discovered as much art as science to this part of the process and
developed lists that they vetted with constituents until everyone was fairly comfortable
with the programs named. They made sure to include new programs suggested by the
priorities of the strategic plan.
The second challenge for the Process Team was to identify the information they
would need about each program to make informed decisions. This is where it became
important to distinguish between academic and administrative programs. Even though the
general criteria were the same—Cost, Benefit/Alignment, and Probability of Success—
how that was detailed differed between the two. For example, historical value was often a
benefit of an academic program but had little meaning for administrative programs,
although administrative programs might have strong alignment to strategic priorities,
such as student diversity. Each team developed a glossary to define the general criteria
for their purposes, then worked with Institutional Research (IR) and the Finance office to
confirm they would be able to obtain the information needed. In some cases, the effort to

185
obtain desired information was too burdensome and they selected proxy information
instead. For example, determining what it cost for each program to use the campus
network was impractical to calculate, so the total cost of network operations was
estimated, then divided and attributed to the program based on headcount.
As the Process Team developed and vetted the process, there were many debates
about the kinds of information needed and the lack of easily-obtained but meaningful
data. Constituents realized that stark decisions would be made based on the data
provided, so the data included became politicized and polarizing. The Chancellor and the
Provost realized that constituents were getting bogged down in data debates and had to
move on, somehow. The Steering Committee suggested consensus ground rules: 1) You
won’t always agree, so 2) Can you support it? Or, 3) Can you live with it? 4) Because, we
have to find a way to live together, inclusive of our disagreements. The ground rules
helped move everyone along.
Finally, the Process Team published the process design and started the academic
and administrative teams down the path.
Discover
As forewarned by IR, the biggest challenge was getting reliable data: the
information system wasn’t designed to keep track of the kind of program-level
information they needed. It became a struggle for the IR office to find and prepare data in
a usable format. The process teams and the IR office lost time in the schedule but
persevered, helped by a few Happy Hours commiserating over the suddenly-legacy

186
information systems and the need for higher education to develop more robust business
intelligence.
To help with the discovery, each program was assigned a program manager to
shepherd the program through the process, someone who was not affiliated with the
program but understood it. The program manager was responsible for keeping the
program information vetted, updated, public, and on track, always working closely with
the program affiliates. For each program they included the current costs, space, and
technologies needed to operate the program, as well as the additional resources needed to
reach goals, if any.
Assess
After six challenging months, the university had an inventory of programs and
information compiled in a web-hosted database constructed by their IT team, on short
notice. Guided by Antonia throughout that time, the Steering Committee monitored and
reported progress to the Chancellor’s cabinet and the Comm Team kept campus updated
on progress.
To start the Assessment phase, the academic and administrative process teams
categorized the programs in investment buckets: Invest, Maintain, Reduce, Eliminate.
The Steering Committee decided that a new team should be created to run the
assessment, also led by faculty with broad representation, but now including some
external stakeholders to give input into regional strategic needs for higher education.
187
The Assessment Team combined the academic and administrative programs and
ran the calculations to find out how much money could be saved by eliminating or
reducing programs. Was it enough to cover maintaining and investing?
Nope. Disappointed that their work would be harder, but not at all surprised, they
belatedly realized that cash flow mattered, that programs couldn’t be eliminated or even
reduced overnight, and that new programs would start up slowly with uneven investment
rates. Following on that thread of hope, the Assessment Team asked the program
managers to develop rudimentary cash-flow statements, after getting the Finance
department to create a simple template for them. They also asked the program managers
to develop a Reduction Plan and an Elimination Plan outlining the steps they would take
if the program was reduced or eliminated, no more than a one-page statement. Maybe that
would inform the cash-flow statements, or indicate something that could be outsourced.
The program managers and program affiliates were not happy with that request, referring
to the plans as the Suffer or Die Plans. Ouch.
Antonia came back onto the frontline, visiting campus for a couple weeks to help
in person. She met with numerous constituents, listening to their concerns, and thinking
about ways to address those concerns and help those constituents through an admittedly
challenging process. She reflected that it was the secret mission of every organizational
unit—corporation, department, troop, or tribe—to preserve the organizational unit. That
proved no different among program units in higher education. Whether strategic or not,
units did not want to lose their unit-hood. How could she help this university overcome
this dilemma?

188
Antonia advised the Assessment Team to create some What-If scenarios,
experimenting with investing in fewer programs, reducing some maintained programs,
eliminating more programs, to come up with a few different scenarios that they thought,
although still painful, would be still reasonable. They did so, and published the scenarios
to campus, then convened multiple campus-wide meetings to explain them.
Following those sessions, they gathered input by holding a charrette, with each
scenario visually and descriptively portrayed on a poster. The campus community was
invited to attend and vote for scenarios with stickers or comment using post-it notes. The
Steering Committee, Discovery and Assessment Teams staffed the charrette for over a
week, answering questions and collecting feedback. They summarized and published the
feedback, and made adjustments to the scenarios based on the information collected.
Then they held ANOTHER charrette and did the same all over again, this time
with fewer scenarios. One of the scenarios was “Do-Nothing”, eliminating no programs
but also making no new investments. The campus seemed pretty evenly divided among
the three remaining scenarios.
Reallocate
The Steering Committee convened and realized they needed a way to make the
final call. After much discussion and several meetings, they convenee a campus town-hall
session and explained the dilemma and the need for a decision strategy to choose the final
path. They offered three general decision strategies: 1) The Chancellor and his cabinet
could choose the scenario; 2) The campus could vote on the scenario with the decision
189
going to a probable plurality rather than a majority; 3) they could bring outside
stakeholders, such as legislators, board members, or consultants, to make the decision.
At this moment, Faculty Senate leader Mark Sparks jumped up to make an
impassioned speech, saying in sum: external parties don’t understand higher education
and should not control our destiny; and a campus vote will result in only a plurality and
not a majority, meaning the majority will be dissatisfied. Then, as uncharacteristic as it
was for Dr. Sparks, he pointed out that we hired the Chancellor to lead us through
difficult times. The Chancellor has executed an unusually participatory and evidence-
based decision process, for which he should be commended. We have gone through a
comprehensive strategic planning process to take us into the future, grim as it financially
may be. We have no choice but to make cuts and at least through this process we have all
had a voice in the decisions. There is no ideal scenario acceptable to all until the
legislature turns over (get your vote out!) but at least each scenario is acceptable to many.
It’s the Chancellor’s job to make the final decision with the advice of his trusted
colleagues. With that, the campus town hall ended, and Antonia wondered intensely what
the final decision would be.
Deeply concerned with the weight of the pending decision, the Chancellor spoke
with each of his cabinet members in private to get their input; like the campus
community, they also disagreed on the best scenario. Seeking counsel, the Chancellor
called his old friend and mentor Akeem Bashar. Wisely, Akeem does not give him
answers but asks him question after question. Finally, he says, “Trust in the process, my
friend. You have done well to reach this point. Because of the process, any decision you
make is as good as a decision can be.”

190
With renewed confidence, the Chancellor announced his decision the following
day. The Finance department began the tedious process of redesigning budgets in
response; the Facilities and IT departments stared at their previous strategic plans and
accepted that they must change their entire orientation from expense categories to
program alignment; while the program managers looked glumly at their Reduction and
Elimination Plans, filled with self-doubt over their previous assertions that seemed so
hypothetical at the time but now were reality. In spite of the exhaustively inclusive and
transparent process, surprised constituents, who somehow thought it could not possibly
apply to them, flooded the Chancellor’s office and inbox with their concerns. The Comm
Team, with Marcomm advice and support, jumped into action with messaging both
internal and external.
Evaluate
Over the din of reaction to the Chancellor’s decision, the Steering Committee
convened an Evaluation Team to design and execute evaluation of the process and the
outcomes, which Antonia stressed were two different things. The Evaluation Team
developed a survey to assess constituent satisfaction with the process and their perception
of its effectiveness. The team then developed a plan for recurring review and
recalibration of the portfolio of programs, in a scaled-down process that would update the
program information, goals, and requirements, as well as the budget, technology, and
space plans. They asked Finance, IT and Facilities to develop their strategic plans
oriented to the portfolio of programs and the evaluation schedule, which was likewise
aligned with the strategic plan. As part of the evaluation plan, they incorporated annual

191
review of the institutional performance metrics selected at the beginning of the process.
As was now customary on campus, they vetted and published the annual evaluation plan.
The wheels were now in motion for ongoing evaluation and management of the
institutional portfolio.
Reflections
Some months later at a national conference, over dinner with the Chancellor and
his friend Akeem Bashar, Antonia reflected on the process and all that she had learned
from it, noting the adaptations that the team had developed to make it work for their
culture. She thanked Anthony for the opportunity to work with Shields University as her
case study. Anthony, in turn, was delighted with the outcome and shared his hopes that
The Process, as they had come to call it, would help institutions of higher education break
the iron triangle with intention and positive effect. Said Akeem, raising his glass with a
smile, “That’s right, my friends. Trust in the process.”
Conclusion
Pressure to demonstrate improved institutional performance will not decrease
anytime soon. Other industries face similar constraints and pressures and have taken
dramatic steps to address performance and satisfy stakeholders. The stakeholders of
higher education may not be satisfied until they see similar transformative change in our
institutions. Simply demonstrating intentional improvement management enables
institutions of higher education to better articulate their mission and demonstrate value
and better management.

192
But the objectives demanded—improved, access, cost, and quality—are in
conflict with one another. To increase one requires a reciprocal decrease in another. The
best strategy is to recognize the competing objectives, choose the right balance for the
institution, and manage resources accordingly. Institutional portfolio management is a
framework that could facilitate that endeavor as an effective strategy to address
immediate expectations and break the cycle of fragmentation and realignment that
heretofore has been seemingly beyond control of institutional leadership. Setting goals in
the context of public expectations and demonstrating effective management toward those
goals will illustrate both the constraints and the performance of the institution within
those constraints. Technology leaders who understand the challenges facing institutions
of higher education, who recognize the confluence of portfolio management and program
prioritization, and who understand how to apply the best practices of each, can support
their institution in demonstration of continuous performance improvement.

193
APPENDIX A: Business Case Template

194
APPENDIX B: Scoring Rubric Template

195
CHAPTER SEVEN
CONCLUSION
“…Therefore my merchandise makes me not sad.”
(William Shakespeare, Merchant of Venice,
Act I, Scene I)
The Merchant of Venice was astutely managing his portfolio of goods to prevent
a crisis and weather a storm. As a result, when stormy seas reduced his means, he was not
saddened—he knew the secrets of portfolio management. Institutions of higher education
also face stormy seas, and have throughout history, perhaps now more than ever. I submit
to my colleagues and the body of knowledge that the best practices of program
prioritization and the best practices of portfolio management, when combined in a
blended framework of institutional portfolio management, will enable institutions to
escape the reactive cycle of fragmentation and contraction. It is a transformative change
that can demonstrate and support continual improvement of institutional performance in
ways heretofore not seen.
Unique Contributions
This dissertation offers multiple unique contributions to the study of higher
education:
1. Application of Structural Contingency Theory to explain the pattern and pace
of change in higher education.
Structural Contingency Theory spans a range of sociological theories and
studies of organizational change in higher education that ground it in extant

196
literature, as presented here. It explains how organizational managers
“satisfice” with incremental change rather than undertake a larger-scale effort
of transformative change, allowing institutional performance to degrade.
This contribution builds on the work of numerous scholars studying the
sociology of change in higher education, namely researchers Tierney
(Tierney, 2008) and Kezar, by illustrating how that sociology both improves
and impedes institutional performance. It improves, by preserving the values
and durability of academic freedom and quality; it impedes, by slowing the
sometimes-needed transformative change. Structural contingency theory
applied to higher education, as I have done with this contribution, helps
practitioners both leverage and overcome those sociologies.
It also builds on the work of scholars studying the economics of higher
education, through the development and study of resource dependence theory
(Burton R. Clark, 2008; Burton R. Clark, 2008/1966; Pfeffer & Salancik,
2003), revenue theory (Bowen, 1980), and cost disease theory (Archibald &
Feldman, 2008a, 2008b, 2010), by pulling those theories together to explain
the entire cycle through structural contingency theory.
And perhaps most importantly, it extends the work of the venerable Alfred
Chandler (A. D. J. Chandler, 1977) who developed Structural Contingency
Theory in the context of strategic business management, by applying it to the
new context of higher education.
197
2. Empirically-based insight into the institutional characteristics and the drivers,
process, and outcomes of program prioritization from the perspectives of
institutional leaders.
This insight informs scholars of the characteristics of institutions that initiate
program prioritization at greater frequency than the general population. It also
informs practitioners of the relationship between a strategic approach, a
transparent and inclusive process, and positive outcomes.
This contribution builds on the work of scholars and practitioners in the field
of program prioritization. It provides empirical support for the work of
Dickeson’s original development of program prioritization (Dickeson, 1999,
2010) by empirically demonstrating that process has an effect on outcome. It
also builds on my earlier development of the theory of mission fragmentation,
by demonstrating that institutions with a broad and comprehensive mission are
more prone to the undertaking of a dramatic intervention such as program
prioritization to provide a solution (Milkovich, 2015).
3. Illustration of parallel challenges and practices in higher education and
private-sector industry.
Teaching and research are not manufacturing and a university is not a
business. However, the administration of an institution of higher education
bears similarity to the management of a large industrial organization. Lessons
from either sector can inform the other. The iron triangle and the triple
constraint both illustrate the conflicting demands for improvement wherein a
change to one of the corners causes an inverse reaction in another. Program

198
prioritization and portfolio management are solutions that evolved in parallel,
each bringing unique strengths.
This contribution extends the understanding of the performance limitation of
the iron triangle (Immerwahr et al., 2008) by comparing it to the business
limitation of the triple constraint (Project Management Institute, 2008; Rad &
Levin, 2006). Although the sectors of private industry and higher education
are very different, they both face the realities of physical law. Better, faster,
cheaper—choose two out of three, because each change in one creates an
inverse change in another. Recognizing that this applies to all industries helps
each industry cope and prevail.
4. Development of an improved framework of institutional portfolio
management that combines the best practices of program prioritization and
portfolio management.
Combining the strengths of these two practices creates a framework of
integrated planning that institutional leaders can use to navigate the shifting
winds of public expectations and the ebbing tide of societal support.
This contribution builds on the development by Dickeson of program
prioritization in higher education (Dickeson, 2010, 2013) as well as the
development of portfolio management in private industry (Project
Management Institute, 2008, 2013; Rad & Levin, 2006; Reginato, 2005) by
illustrating how we can extrapolate lessons learned from each to be applied to
a different sector.

199
And not the least of these, I offer the illumination of references to portfolio theory
by William Shakespeare in The Merchant of Venice, nearly 400 years before Harry M.
Markowitz formally published the theory. Markowitz knew full well that Shakespeare
predated him and even credited him accordingly in his work (Markowitz, 1999) so this
contribution is not unique, but still a noteworthy addition.
Implications and Recommendations
With transformation comes power over one’s destiny, but the change is not easy.
Structural contingency theory illustrates the difficulty of making any transformative
endogenous change and the slow adaptation of institutions of higher education to any
exogenous change. Our stakeholders simply may not be satisfied until they see large-
scale change in the administration of higher education. For an institution to take control
of the cycle of fragmentation and achieve the transformative change currently demanded
requires institutional leaders to chart new courses. For that they need a map, and I
propose that institutional portfolio management is that map.
The contributions of this map present positive implications for institutional
leaders and practitioners:
Institutional leaders can demonstrate they are implementing transformative
change to expectant stakeholders. Even though results will take time to
emerge, leaders can communicate to their boards, legislatures, and the general
public that they are taking dramatic steps to better administer institutional
resources in alignment with strategic objectives, with the specific intent of
improving institutional performance. Although dramatic, the steps they are

200
taking are based on rational processes that incorporate the strengths of both
academia and private-sector management.
Institutional leaders can recognize barriers to change through the lens of
structural contingency theory. Structural contingency theory ties together a
number of sociological and organizational theories and presents a complete
visual picture to help institutional leaders and practitioners understand the
complex interplay of change and culture. Understanding the natural tendency
for unit leaders to satisfice can help institutional leaders overcome that
paradoxical obstacle.
Unit leaders can recognize when they are satisficing and understand the
paradox of incremental success. Unit leaders are focused on survival of the
unit and the delivery of its mission. It’s not an easy message to hear that your
unit’s success and survival is not paramount. Knowing that this is a studied
phenomenon and not an arbitrary whim or pop management du jour will help.
Although the prospect of program reduction or elimination still looms, faculty
may take some comfort in the emphasis on academic quality, institutional
values, and other qualitative factors beyond simply cost or graduation rates.
They may also appreciate the participatory nature of the process, the emphasis
on balance and continuity, and the reliance on faculty leadership.
Practitioners, whether institutional leaders, faculty and staff, or consulting
practitioners, have a practical roadmap to follow. Running an organizational
intervention such as institutional portfolio management is typically not an
arrow in the skillset quiver of most faculty or staff. Practical guidance, tools

201
and techniques can lend valuable support to the effort, whether or not
professional expertise is brought in.
The pilot study presented in Chapter Three illustrates in more detail the
implications of certain approaches and practices and their relationship with successful
outcomes, as reported by institutional leaders who have undertaken academic program
prioritization. The manuscript in Chapter Six also elaborates practical guidelines or
recommendations. Some high-level recommendations that are evident or deducible from
those manuscripts or the above implications bear emphasizing:
Begin the initiative before you reach crisis point. True, a real and present
danger will create a valuable sense of urgency, without which it may be
difficult to galvanize action sufficient to overcome the inevitable resistance.
While imminent danger is useful, waiting until you’re in the thick of a crisis
will not allow time for the process to be inclusive and transparent.
The process must be inclusive and transparent. Inclusive and transparent are
not the same. Inclusive means that a wide array and large contingent of faculty
and staff engage in the process from beginning to end. Transparent means that
everyone knows what the process is, where they’re at in the process, where to
find information, how decisions will be made (before they are made) and what
the final decisions are. Many a failed effort was transparent after-the-fact,
sharing decisions that had been made. Not good enough.
Faculty and staff, and shared governance where appropriate, must have
leadership roles in the process. One of the great powers of higher education
202
over corporate management is the collective esprit de corps of the community,
of all-for-one and one-for-all. Administrators might facilitate and shepherd the
process, but should be recognized in that role and not as decision leaders.
Consider professional support. The process takes work: organizing,
coordinating, scheduling, note-taking, summarizing, programming and other
administrative chores. Where administrators, faculty, or staff do not have time
or expertise, or where administrators cannot easily take a back-seat to the
process, a contracted professional with experience in the process can provide
valuable support from an indisputably neutral position.
Limitations
The work of this dissertation builds on extant literature in the study of higher
education but otherwise embarks into relatively uncharted territory. Little research to date
has been done specifically on the application of portfolio management and program
prioritization in higher education. With broadly new horizons also comes several
limitations of the present work.
First, the findings of the study and analysis contained in this dissertation are
largely theory building that need to be sea-tested. I have pulled pieces together from
literature and primary research, as well as first-hand experience as a practitioner, but the
culminating framework needs to be further studied to provide empirical support for its
efficacy. That is the nature of theory building and a solid starting point for further study.
Second, we don't know how different institutional cultures or characteristics
might influence the outcomes. In the pilot study, characteristics did not emerge as a

203
theme from the interviews of institutional leaders, and a variety of institutional types
were included. However, one pilot study with an n of 20 is not very conclusive.
Relationships likely exist between characteristics such as control and qualities such as
top-down culture that could influence outcomes.
Third, without some kind of pre- and post-test analysis, either through a within-
subjects design or ideally a difference-in-differences design, we really can't demonstrate
efficacy. We can extrapolate probable efficacy from the standards and practices in
private industry but that does not constitute empirical support in higher education.
Finally, every situation an institution of higher education faces is unique. No two
sets of characteristics or circumstances are exactly alike. Only through further research
can we develop more robust navigational guides on which institutions may rely.
Future Research
In addition to the recommendations of practical application, and
acknowledgement of the limitations of this work, I suggest opportunities for future
research. A wealth of opportunity exists to study the application of institutional portfolio
management in higher education. Further research is needed to examine, validate, or
refute these claims and to continually refine the framework.
Suggested research includes:
Qualitative studies of organizational change through the lens of structural
contingency theory.
Cross case studies of real institutions applying the framework.
Action research to test and improve the tools and techniques.
204
Quantitative within-sample pre- and post-tests comparing institutional
performance metrics of institutions that have applied the framework.
Quantitative difference-in-differences tests comparing institutional
performance metrics of institutions that have applied the framework to
institutions of like characteristics and contexts that have not.
Study of the theory and framework applied to new institutions in developing
countries to evaluate efficacy of the framework if it is implemented from the
nascence of an institution rather than as a latent sea change.
A Voyage Just Beginning
Portfolio theory, structural contingency theory, portfolio management, and
program prioritization have been around for centuries or decades and now are pulled
together. The voyage is just beginning as we study application of institutional portfolio
management in higher education and its efficacy in planning and executing the
performance improvement that our stakeholders demand. A single institution cannot
break the iron triangle and yet individual institutions are expected to do so. The solution
is to find the right balance of angles and demonstrate effective management overall.
Institutional portfolio management is a model to achieve that. I call upon my colleagues
to join with me in pursuing greater empirical and practical knowledge to this theoretical
foundation.
“Go, presently inquire, and so will I.”
—The Merchant

205
REFERENCES CITED
Alexander, F. K. (2000). The changing face of accountability: monitoring and assessing
institutional performance in higher education. Journal of Higher Education,
71(4), 411-431.
Alfred, R. L. (2011). The future of institutional effectiveness. New Directions for
Community Colleges, 153(Spring 2011), 103-113.
Archibald, R. B., & Feldman, D. H. (2008a). Explaining increases in higher education
costs. Journal of Higher Education, 79(3), 268-295.
Archibald, R. B., & Feldman, D. H. (2008b). Graduation Rates and Accountability:
Regressions versus Production Frontiers. Research in Higher Education, 49(1),
80-100.
Archibald, R. B., & Feldman, D. H. (2010). Why does college cost so much?
Asmussen, J. (2010). Why does the graduation rate producitivity of U.S. public
universities vary? Looking outside their boundaries for answers. (Dissertation),
University of Minnesota.
Bailey, B. L. (2006). Let the data talk: Developing models to explain IPEDS graduation
rates. New directions for institutional research, 2006(131), 101-115.
Bailey, T. R., & Averianova, I. E. (1998). Multiple missions of community colleges:
conflicting or complementary?
Baird, L. L. (1991). Publication Productivity in Doctoral Research Departments:
Interdisciplinary and Intradisciplinary Factors. Research in Higher Education,
32(3), 303-318.
Barak, R. J., & Sweeney, J. D. (1995). Academic Program Review in Planning,
Budgeting, and Assessment. New directions for institutional research(86), 3-17.
Barnetson, B., & Cutright, M. (2000). Performance indicators as conceptual technologies.
Higher Education, 40(3), 277-292.
Battilana, J. (2006). Agency and institutions: the enabling role of individuals' social
position. Organization, 13(5).
Bentley, R., & Blackburn, R. (1990). Changes in Academic Research Performance over
Time: A Study of Institutional Accumulative Advantage. Research in Higher
Education, 31(4), 327-353.
206
Birnbaum, R. (1988). How Colleges Work: . San Francisco, CA: Jossey-Bass.
Blau, P. M. (1973). The organization of academic work. New York: John Wiley & Sons.
Bowen, H. R. (1980). The costs of higher education: How much do colleges and
universities spend per student and how much should they spend? San Francisco,
CA: Jossey-Bass, Inc.
Brooks, R. (2005). Measuring University Quality. Review of Higher Education, 29(1), 1-
21.
Bryk, A. S., Lee, V. E., & Holland, P. B. (1993). Catholic schools and the common good.
Cambridge, MA: Harvard University Press.
Burke, J. C. (1998). Performance funding indicators: Concerns, values, and models for
state colleges and universities. New directions for institutional research,
1998(97), 49.
Burke, J. C. (2005). Closing the accountability gap for public universities: Putting
academic departments in the performance loop. Planning for higher education,
34(1), 19-028.
Burke, J. C., & Minassians, H. (2002). Reporting indicators: what do they indicate? New
directions for institutional research, 2002(116), 33.
Burke, J. C., Minassians, H., & Yang, P. (2002). State performance indicators: what do
they indicate? Planning for higher education, 31(1), 15-29.
Cameron, K. (1978). Measuring organizational effectiveness in institutions of higher
education. Administrative Science Quarterly, 23(4), 604-632.
Cameron, K. (1984). Organizational adaptation and higher education. The Journal of
Higher Education, 55(2), 122-144.
Chandler, A. D. (2013). Structure and strategy: chapters in the history of the industrial
enterprise. Mansfield Centre, CT: Martino Publishing.
Chandler, A. D. J. (1977). The visible hand: the managerial revolution in American
business. Cambridge, MA: The Belknap Press of Harvard University Press.
Clark, B. R. (2008). On higher education: selected writings, 1956-2006. Baltimore, MD:
The Johns Hopkins University Press.
Clark, B. R. (2008/1966). Organizational adaptation to professionals On higher
education: Selected writings 1956-2006. Baltimore: The Johns Hopkins
University Press.

207
Cope, R., & Delaney, G. (1991). Academic program review: a market strategy
perspective. Journal of marketing for higher education, 3(2), 63-86.
Cunningham, A. F., & Merisotis, J. P. (2002). National models for college costs and
prices. Planning for higher education, 30(3), 15-26.
Cunningham, A. F., Wellman, J. V., Clinedinst, M. E., & Merisotis, J. P. (2001). Study of
college costs and prices, 1988-89 to 1997-98. (NCES 2002-157). Washington,
D.C.: U.S. Department of Education National Center for Educational Statistics.
Daigneau, W. A. (2010). Portfolio Based Management. Facilities Manager,
November/December.
Daniel, J., Kanwar, A., & Uvalic-Trumbic, S. (2009). Breaking higher education's iron
triangle: access, cost, and quality. Change, 41(2), 30-35.
de Zilwa, D. (2007). Organisational culture and values and the adaptation of academic
units in Australian universities. Higher Education, 54(4), 557-574.
Deer, S. D. (2006). The evaluation of a shared governance model of academic program
prioritization at the community college level: A delphi study. (3226193 Ph.D.),
Capella University, Ann Arbor.
Dickeson, R. C. (1999). Prioritizing academic programs and services: reallocating
resources to achieve strategic balance. San Francisco: Jossey-Bass Publishers.
Dickeson, R. C. (2010). Prioritizing Academic Programs and Services: Reallocating
Resources to Achieve Strategic Balance. San Francisco, CA: Jossey-Bass.
Dickeson, R. C. (2013). Unbundling the issue of faculty productivity. Planning for higher
education, 41(2), 75+.
Dickeson, R. C. (2015). Placing academics at the heart of higher education planning.
Planning for higher education, 43(2), 6.
Donaldson, L. (2000). Organizational portfolio theory: performance-driven
organizational change. Contemporary economic policy, 18(4), 386-396.
Donaldson, L. (2001). The contingency theory of organizations. Thousand Oaks, CA:
Sage Publications, Inc.
Dougherty, K. J., Natow, R. S., Bork, R. H., Jones, S. M., & Vega, B. E. (2013).
Accounting for higher education accountability: political origins of state
performance funding for higher education. Teachers College Record, 115(1), 1-
51.

208
Duderstadt, J. J., & Womack, F. W. (2003). The Future of the Public University in
America: Beyond the Crossroads. Baltimore, MD: Johns Hopkins University
Press.
Dundar, H., & Lewis, D. R. (1998). Determinants of Research Productivity in Higher
Education. Research in Higher Education, 39(6), 607-631.
Eckel, P. D. (2002). Decision Rules Used in Academic Program Closure: Where the
Rubber Meets the Road. The Journal of higher education (Columbus), 73(2), 237-
262.
El-Khawas, E. (1994). Restructuring Initiatives in Public Higher Education: Institutional
Response to Financial Constraints.
El-Khawas, E. (2011). The Impact of Economic Crises on American Universities:
Lessons from the Past. Higher Education Management and Policy, 23(2).
Fox, M. F. (1992). Research, Teaching, and Publication Productivity: Mutuality Versus
Competition in Academia. Sociology of Education, 65(4), 293-305.
Fung, T. Y.-h. (2010). Analysis of Graduation Rates for Four-Year Colleges: A Model of
Institutional Performance Using IPEDS. ProQuest LLC.
Geiger, R. L. (2007) Research, graduate education, and the ecology of American
universities: an interpretive history. In H. S. G. Wechsler, Lester F.; Eisenmann,
Linda (Series Ed.), ASHE Reader Series. ASHE Reader Series (3rd Edition ed.,
pp. pp 237-248). Boston, MA: Pearson Publishing.
Goodchild, L. F. (2007) History of higher education in the United States. In H. S. G.
Wechsler, Lester F.; Eisenmann, Linda (Series Ed.), ASHE Reader Series. ASHE
Reader Series (3rd Edition ed., pp. pp 36-52). Boston, MA: Pearson Publishing.
Gornitzka, Å. (1999). Governmental policies and organisational change in higher
education. Higher Education, 38(1), 5-31.
Gumport, P. J. (1993). The contested terrain of academic program reduction. Journal of
Higher Education, 64(3), 283-311.
Gumport, P. J. (2000). Academic restructuring: organizational change and institutional
imperatives. Higher Education, 39(1), 67-91.
Gumport, P. J. (2003). The demand-response scenario: Perspectives of community
college presidents. Annals of the American Academy of Political and Social
Science, 586, 38-61.

209
Gumport, P. J. (2005). The organisation of knowledge: imperatives for continuity and
change in higher education. In I. Bleiklie & M. Henkel (Eds.), Governing
Knowledge: A Study of Continuity and Change in Higher Education - a
Festschrift in Honour of Maurice Kogan (Vol. 9, pp. 113-132). Dordrecht: The
Netherlands: Springer.
Gumport, P. J. (2007). Sociology of higher education : contributions and their contexts.
Baltimore: Johns Hopkins University Press.
Hamrick, F. A., Schuh, J. H., & Shelley, M. C. I. (2004). Predicting higher education
graduation rates from institutional characteristics and resource allocation.
Educational Policy Analysis Archives, 12(19), 1-24.
Harper, V. B., Jr. (2011). Program portfolio analysis: evaluating academic program
viability and mix. Assessment Update, 23(3), 5.
Harper, V. B., Jr. (2013). Strategic management of college resources: a hypothetical
walkthrough. Planning for higher education, 41(2).
Hermes, J. (2012). States trend toward performance funding. Community College
Journal, 82(4), 26-29.
Hillman, A. J., Withers, M. C., & Collins, B. J. (2009). Resource dependence theory: a
review. Journal of management, 35(1404), 25.
Hillman, N. W., Tandberg, D. A., & Gross, J. P. K. (2014). Performance funding in
higher education: Do financial incentives impact college completions? The
Journal of Higher Education, 85(6 (November/December)), 33.
Hodgkinson, H. L. (1971). Institutions in transition: A profile of change in higher
education (incorporating the 1970 statistical report). New York: Mcgraw-Hill.
Hossenlopp, R. (2010). Organizational project management: linking strategy and
projects. Vienna, VA: Management Concepts, Inc.
Immerwahr, J., Johnson, J., & Gasbarra, P. (2008). The iron triangle: College presidents
talk about costs, access and quality (National Center Report #08-2).
ISACA. (2012). COBIT 5. Rolling Meadows, IL: Author.
Kezar, A. (2004). Obtaining integrity? Reviewing and examining the charter between
higher education and society. Review of Higher Education, 27(4), 429-+.
Kezar, A. (2014). How colleges change. New York: Taylor & Francis.

210
Kezar, A., & Eckel, P. D. (2002). The effect of institutional culture on change strategies
in higher education. Journal of Higher Education, 73(4), 435-460.
Knott, J. H., & Payne, A. A. (2004). The impact of state governance structures on
management and performance of public organizations: a study of higher education
institutions. Journal of policy analysis and management, 23(1), 17.
Kotter, J. P. (1998). Leading change: why transformation efforts fail Harvard Business
Review on Change (pp. 1-20). Boston, MA: Harvard Business School Publishing.
Kotter, J. P. (2008). A sense of urgency. Boston, MA: Harvard Business School
Publishing.
Kumar, R., Haya, A., & Niu, Y. (2008). Information technology portfolio management:
Literature review, framework, and research issues. Information Resources
Management Journal, 21(3).
Lawrence, P. R., & Lorsch, J. W. (1986). Organization and environment. Boston, MA:
Harvard Business School Press.
Layzell, D. T., & Caruthers, J. K. (2002). Higher Education Costs: Concepts,
Measurement Issues, Data Sources, and Uses. Planning for higher education,
30(3), 6-14.
Markowitz, H. M. (1990). Foundations of portfolio theory The founders of modern
finance: Their prize-winning concepts and 1990 Nobel lectures: The Research
Foundation of the Institute of Chartered Financial Analysts.
Markowitz, H. M. (1999). The Early History of Portfolio Theory: 1600-1960. Financial
Analysts Journal, 55(4), 5-16.
Mattingly, P. H. (2007) The political culture of America's Antebellum Colleges. In H. S.
G. Wechsler, Lester F.; Eisenmann, Linda (Series Ed.), ASHE Reader Series.
ASHE Reader Series (3rd Edition ed., pp. pp 237-248). Boston, MA: Pearson
Publishing.
McKeown-Moak, M. P. (2013). The new performance funding in higher education.
Educational Considerations, 40(2), 3-12.
McPherson, P., & Shulenburger, D. (2006). Elements of accountabiity for public
universities and colleges (0736-0983).
McPherson, P., & Shulenburger, D. (2010). Understanding the cost of public higher
education. Planning for higher education, 38(3), 15-24.

211
Middaugh, M. F. (2002). Faculty productivity: different strategies for different audiences.
Planning for higher education, 30(3), 34-43.
Middaugh, M. F. (2005). Understanding higher education costs. Planning for higher
education, 33(3), 5-18.
Middaugh, M. F. (2010). Planning and Assessment in Higher Education. San Francisco,
CA: John Wiley & Sons.
Middaugh, M. F., Graham, R., & Shahid, A. (2003). A study of higher education
instructional expenditures: the Delaware study of instructional costs and
productivity. (NCES-2203-161). Washington, DC: ED Pubs.
Miljkovic, D. (2006). Organizational portfolio theory and international not-for-profit
organizations. Journal of Socio-Economics, 35(1), 142-150.
Milkovich, A. (2013). Academic program prioritization among institutions of higher
education. Paper presented at the Association for the Study of Higher Education,
St. Louis, MO.
Milkovich, A. (2015). Organizational portfolio management and institutions of higher
education. Planning for higher education, 43N2 (January-March 2015), 9.
Milkovich, A. (2016). How incremental success slows transformative change and
integrated planning achieves it. Manuscript submitted for publication.
Modern Portfolio Theory. (2009). The SAGE Glossary of the Social and Behavioral
Sciences. Retrieved from
http://proxybz.lib.montana.edu/login?qurl=http%3A%2F%2Fwww.credoreferenc
e.com/entry/sagegsbs/modern_portfolio_theory
National Center for Public Policy and Higher Education, T. (2008). Measuring up, 2008:
the national report card on higher education.
National Research Council, T. (2012). Improving measurement of productivity in higher
education. Washington, D.C.: The National Academies Press.
Oliver, C. (1991). Strategic responses to institutional processes. Academy of Management
review, 16(1), 145-179.
Pfeffer, J., & Salancik, G. R. (2003). The external control of organizations: A resource
dependence perspective: Stanford University Press.
Porter, M. (1980). Competitive Strategy: Techniques for Analyzing Industries and
Competitors. New York: Simon & Schuster, Inc.

212
Porter, S. R., & Toutkoushian, R. K. (2006). Institutional research productivity and the
connection to average student quality and overall reputation. Economics of
Education Review, 25, 605-617.
Porter, S. R., & Umbach, P. D. (2001). Analyzing faculty workload data using multilevel
modeling. Research in Higher Education, 42(2), 171-196.
Powell, B. A., Gilleland, D. S., & Pearson, L. C. (2012). Expenditures, Efficiency, and
Effectiveness in U.S. Undergraduate Higher Education: A National Benchmark
Model. Journal of Higher Education, 83(1), 25.
Project Management Institute, T. (2008). The Standard for Portfolio Management.
Newtown Square, PA: Author.
Project Management Institute, T. (2013). The Standard for Portfolio Management Third
Edition
Rad, P. F., & Levin, G. (2006). Project Portfolio Management Tools and Techniques.
New York: International Institute for Learning.
Reginato, J. M. (2005). Project and portfolio management in dynamic environments:
Theory and evidence from the biopharmaceutical industry. (3190854 Ph.D.),
University of California, Berkeley, Ann Arbor.
Revelle, J. B. (2004). Quality Essentials: A Reference Guide from A to Z. Milwaukee,
WI: American Society for Quality, Quality Press.
Richardson, R. C. (2009). Policy and performance in American higher education: an
examination of cases across state systems. Baltimore, MD: The Johns Hopkins
University Press.
Schofer, E., & Meyer, J. W. (2005). The worldwide expansion of higher education in the
twentieth century. American Sociological Review, 70(6), 898-920.
Scott, M., Bailey, T., & Kienzl, G. (2006). Relative Success? Determinants of College
Graduation Rates in Public and Private Colleges in the U.S. Research in Higher
Education, 47(3), 249-279.
Scott, W. R. (1987). The adolescence of institutional theory. Administrative Science
Quarterly, 493-511.
Scott, W. R. (2008). Approaching adulthood: the maturing of institutional theory. Theory
and Society, 37(5), 427-442.

213
Serna, G. R. (2013). Understanding the effects of state oversight and fiscal policy on
university revenues: considerations for financial planning. Planning for higher
education, 41(2), 93+.
Shin, J. C. (2010). Impacts of performance-based accountability on institutional
performance in the U.S. Higher Education, 60, 19.
Shirley, R. C., & Volkwein, J. F. (1978). Establishing academic program priorities.
Journal of Higher Education, 49(5), 472-488.
Sporn, B. (1999). Adaptive university structures. London: Jessica Kingsley.
Stummer, C., & Heidenberger, K. (2003). Interactive R&D Portfolio Analysis With
Project Interdependencies and Time Profiles of Multiple Objectives. IEEE
Transactions on Engineering Management, 50(2), 175.
Thelin, J. R. (2011). A History of American Higher Education. Baltimore: Johns Hopkins
University Press.
Tierney, W. G. (2008). The impact of culture on organizational decision making: theory
and practice in higher education. Sterling, VA: Stylus.
Toutkoushian, R. K., Dundar, H., & Becker, W. E. (1998). The National Research
Council graduate program ratings: what are they measuring? Review of Higher
Education, 21(4), 427-443.
Toutkoushian, R. K., Porter, S. R., Danielson, C., & Hollis, P. R. (2003). Using
Publications Counts To Measure an Institution's Research Productivity. Research
in Higher Education, 44(2), 121-148.
United States Department of Education, T. (2006). A test of leadership: charting the
future of U.S. higher education.
United States Government Accountability Office, T. (2007). Higher education: tuition
continues to rise, but patterns vary by institution type, enrollment, and
educational expenditures (GAO 08-245).
Volkwein, J. F., & Tandberg, D. (2008). Measuring Up: Examining the Connections
among State Structural Characteristics, Regulatory Practices, and Performance.
Research in Higher Education, 49(2), 180-197.
Wellman, J. V. (2006). Costs, Prices, Affordability. Washington, D.C.
Wellman, J. V. (2010). Improving data to tackle the higher education "cost disease".
Planning for higher education, 38(3), 25+.
Recommended