INSTITUTIONAL EQUITY RESEARCH
Page | 1 | PHILLIPCAPITAL INDIA RESEARCH
Nestle India (NEST IN) Altius, Citius, Fortius INDIA | FMCG | Company Update
22 August 2018
We attended Nestle analyst meet yesterday and came pretty impressed with 1) management agility on doing required (innovation, focus on new channels, withdrawing new products if not getting traction) for driving growth within existing categories, 2) foray into fast‐growing new categories (breakfast cereals, nutrition supplement category) and satisfactory reply from management as why Pet care business has been launched thorough Nestle SA (Parent), which had been concern area for us and 3) adopting cluster based approach for driving distribution related efficiencies. We upgrade to BUY from Neutral with revised TP of Rs 12,000 (55x Sept‐20 EPS) vs Rs 10,875 (50x Sept‐20 EPS) earlier Core categories – NPD / channel expansion to continue: Management highlighted core categories continue to see healthy traction owing to market share gains (in noodles, beverages category), new product launches (65% of the launches got decent traction) and further expansion into newer channels (e‐commerce, out of home market). Nestle has withdrawn 11 new launches out of 39 launches made so far (which were introduced post new MD’s induction in August,2015) from the market, as the products were either ahead of time or there was miscommunication from the company’s side on actual purpose/intend of the product. Contribution of NPD to total sales has increased from 2.8% in 1HCY17 to 3% in 1HCY18. Foray into fast growing new categories: Nestle entry into breakfast cereals (market size expected to reach Rs 32 bn in 2020 from Rs 21 bn in 2017) and health/nutrition supplements category (market size of Rs 150‐200 bn) seems to be encouraging as it has “right to win” in these categories. We were fully satisfied with management’s reply ‐ capabilities/skills, nature of business and route to market are completely different for Pet care business from core FMCG business and therefore launched thorough Nestle SA (parent) ; not thorough listed Indian arm. Nesplus breakfast cereals (customized product/formulation), despite being product of global JV between Nestle SA and General Mills has been incubated in Nestle India as local management has required expertise in this line of business Cluster based distribution approach to unleash next leg of growth – Nestle has decided to create 15 distribution clusters within India (something similar HUL did in 2014 thorough “Winning In Many India” approach). HUL saw healthy traction (gross sales grew 9.4% Cagr over FY14‐16) post it transformed from four branch structure to 14 cluster approach. We believe Nestle is also likely to follow the suit as granular understanding of customer profile, competitors and products will enable local management to devise strategy which could drive growth in semi‐urban/ rural areas (Nestle Rural contribution is only c15‐20% vs Industry contribution of c35‐40%). Scarcity Premium within F&B space to support rich valuations : We had got too bogged down by rich valuations despite strong business outlook and downgraded our rating to Neutral from BUY post 2QCY18 results and we believe post analyst meet, it is too difficult to pin down the impact of fresh qualitative factors into financials nos; although we have tried our level best – 1) management new found aggression with regards to foray into newer categories 2) re‐jigging distribution structure, thereby empowering local team to take required action to combat competition and 3) success of new product launches in existing categories. Hence, we increased our PE multiple from 50x to 55x to incorporate the above mentioned observations and upgrade our rating to BUY from Neutral with revised TP of Rs 12,000 vs 10,875 (50x Sept ‐20 EPS) earlier. Risks to our call – 1) Sharper than expected inflation in RM index 2) Nestle not getting desired traction as far as new launches / foray into new categories is concerned.
BUY (Upgrade) CMP RS 10,888 TARGET RS 12,000 (10%) COMPANY DATA O/S SHARES (MN) : 96MARKET CAP (RSBN) : 1037MARKET CAP (USDBN) : 1552 ‐ WK HI/LO (RS) : 10888/6401LIQUIDITY 3M (USDMN) : 8.3PAR VALUE (RS) : 10 SHARE HOLDING PATTERN, % Jun 18 Mar 18 Dec 17PROMOTERS : 62.8 62.8 62.8FII / NRI : 12.4 12.1 11.9FI / MF : 7.9 8.1 8.1NON PRO : 5.0 5.1 4.8PUBLIC & OTHERS : 12.0 12.0 12.4 KEY FINANCIALS Rs mn CY18E CY19E CY20ENet Sales 114,213 129,651 147,547EBIDTA 26,009 30,639 35,811Net Profit 15,431 18,438 21,810EPS, Rs 160 191 226PER, x 64.5 54.0 45.7EV/EBIDTA, x 36.8 31.0 26.3ROE, % 39.9 46.1 52.0Debt/Equity (%) 0.9 0.9 0.8 Vishal Gutka (+91 22 6246 4118) [email protected] Naveen Kulkarni (+91 22 6246 4122) [email protected] Preeyam Tolia (+91 22 6246 4129) [email protected]
Page | 2 | PHILLIPCAPITAL INDIA RESEARCH
NESTLE INDIA COMPANY UPDATE
Volume growth momentum continues
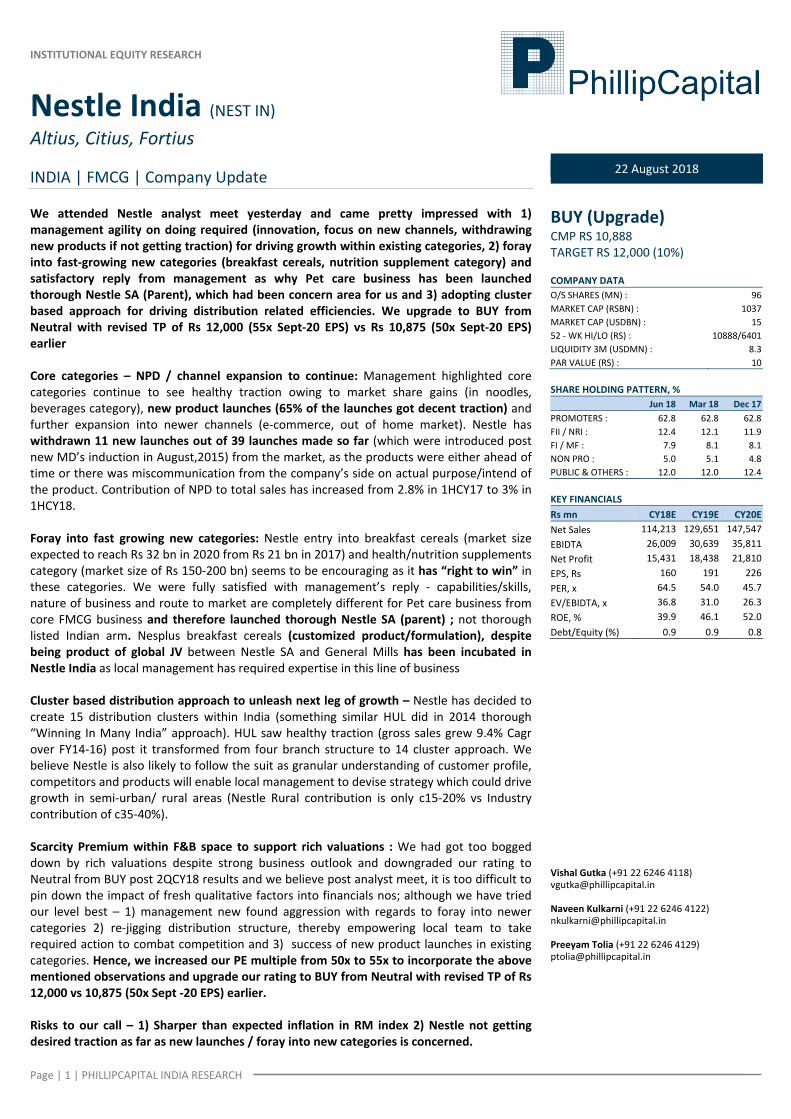
Source: Company, PhillipCapital India Research Nestle makes healthy gains in Noodles, Pasta and Beverages categories
Category Brand MAT
(Jul 16‐Jun 17)MAT
(Jul 17‐Jun 18) Change (yoy)Instant Noodles Maggi 58.7 59.7 100 bpsKetchups & Sauces Maggi 24.4 22.3 ‐210 bpsInstant Pasta Maggi 61.4 67.6 620 bpsInfant Formula Lactogen & NAN 40.9 40.6 ‐30 bpsInfant Cereals Nestle Cerelac 96.4 96.3 ‐10 bpsTea Creamer Every Day 45.7 45.3 ‐40 bpsChocolates Nestle 14.5 14.2 ‐30 bpsWhite & Wafers Kitkat, Munch, Milky Bar 62.5 61.4 ‐110 bpsInstant Coffee Nescafe 47.2 49.4 220 bps
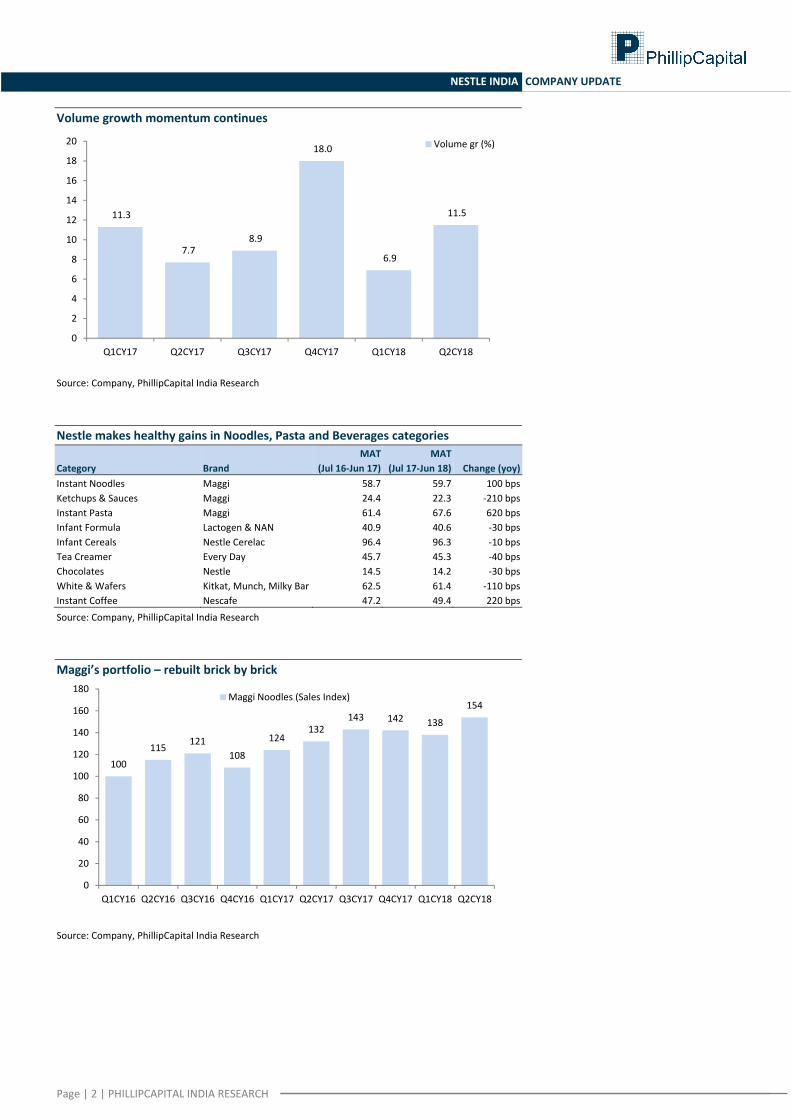
Source: Company, PhillipCapital India Research Maggi’s portfolio – rebuilt brick by brick
Source: Company, PhillipCapital India Research
11.3
7.7 8.9
18.0
6.9
11.5
0
2
4
6
8
10
12
14
16
18
20
Q1CY17 Q2CY17 Q3CY17 Q4CY17 Q1CY18 Q2CY18
Volume gr (%)
100115 121
108
124132
143 142 138
154
0
20
40
60
80
100
120
140
160
180
Q1CY16 Q2CY16 Q3CY16 Q4CY16 Q1CY17 Q2CY17 Q3CY17 Q4CY17 Q1CY18 Q2CY18
Maggi Noodles (Sales Index)
Page | 3 | PHILLIPCAPITAL INDIA RESEARCH
NESTLE INDIA COMPANY UPDATE
Prepared dishes, beverages saw healthy volume growth Category Volume growth (%) Contribution (%)Milk Products & Nutrition 4.6 48 Prepared Dishes 12.8 28 Confectionery 6.1 13 Powdered & Liquid Beverages 9.2 11
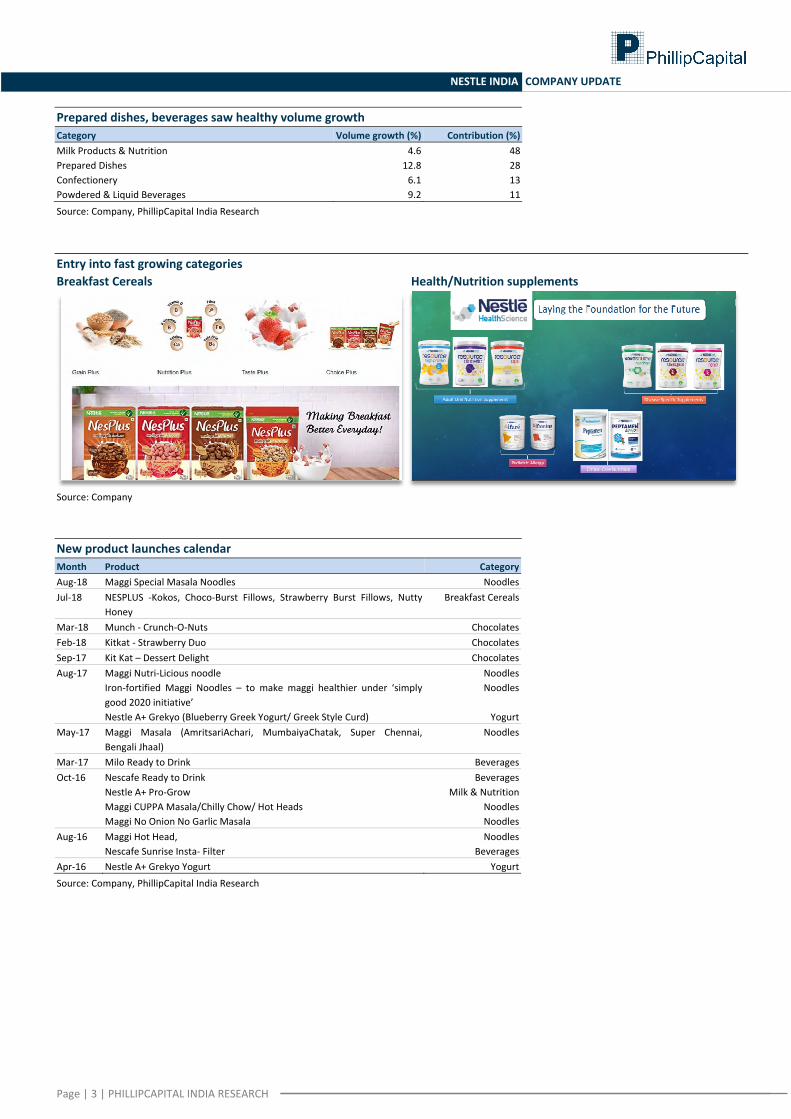
Source: Company, PhillipCapital India Research Entry into fast growing categories Breakfast Cereals Health/Nutrition supplements
Source: Company New product launches calendar Month Product CategoryAug‐18 Maggi Special Masala Noodles NoodlesJul‐18 NESPLUS ‐Kokos, Choco‐Burst Fillows, Strawberry Burst Fillows, Nutty
Honey Breakfast Cereals
Mar‐18 Munch ‐ Crunch‐O‐Nuts ChocolatesFeb‐18 Kitkat ‐ Strawberry Duo ChocolatesSep‐17 Kit Kat – Dessert Delight ChocolatesAug‐17 Maggi Nutri‐Licious noodle Noodles Iron‐fortified Maggi Noodles – to make maggi healthier under ‘simply
good 2020 initiative’ Noodles
Nestle A+ Grekyo (Blueberry Greek Yogurt/ Greek Style Curd) YogurtMay‐17 Maggi Masala (AmritsariAchari, MumbaiyaChatak, Super Chennai,
Bengali Jhaal) Noodles
Mar‐17 Milo Ready to Drink BeveragesOct‐16 Nescafe Ready to Drink Beverages Nestle A+ Pro‐Grow Milk & Nutrition Maggi CUPPA Masala/Chilly Chow/ Hot Heads Noodles Maggi No Onion No Garlic Masala NoodlesAug‐16 Maggi Hot Head, Noodles Nescafe Sunrise Insta‐ Filter BeveragesApr‐16 Nestle A+ Grekyo Yogurt Yogurt
Source: Company, PhillipCapital India Research
Page | 4 | PHILLIPCAPITAL INDIA RESEARCH
NESTLE INDIA COMPANY UPDATE
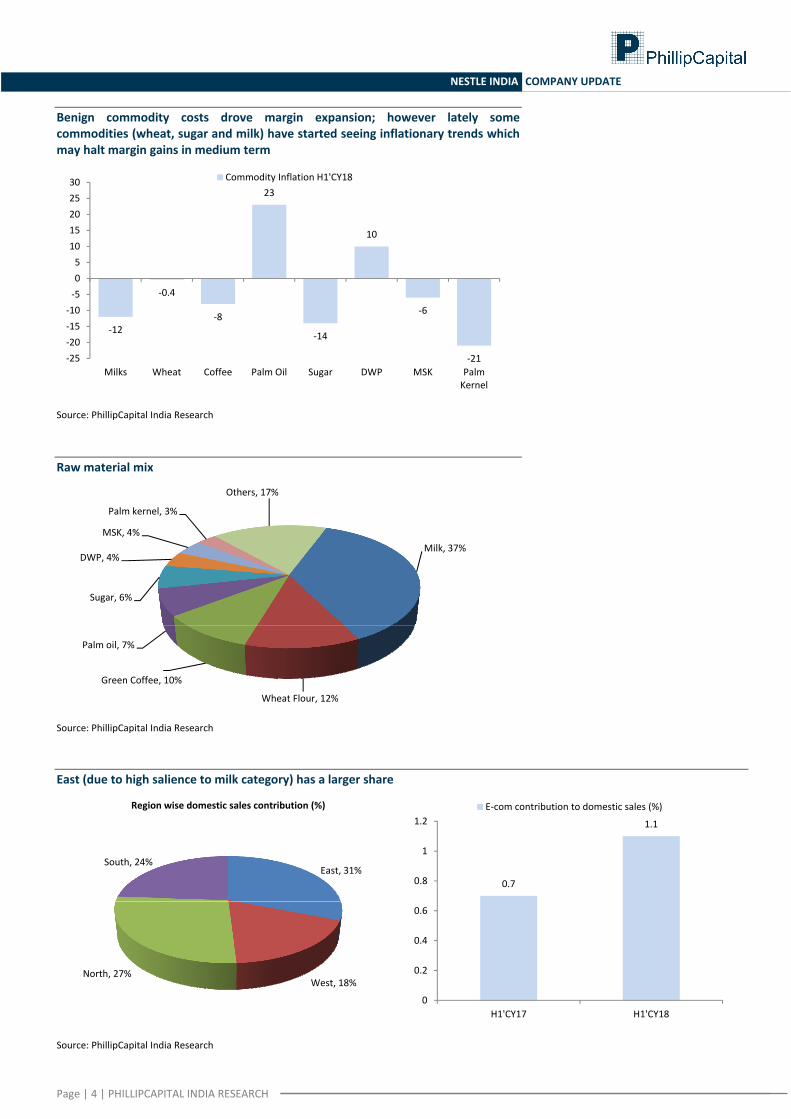
Benign commodity costs drove margin expansion; however lately some commodities (wheat, sugar and milk) have started seeing inflationary trends which may halt margin gains in medium term
Source: PhillipCapital India Research Raw material mix
Source: PhillipCapital India Research East (due to high salience to milk category) has a larger share
Source: PhillipCapital India Research
‐12
‐0.4
‐8
23
‐14
10
‐6
‐21‐25‐20‐15‐10‐505
1015202530
Milks Wheat Coffee Palm Oil Sugar DWP MSK Palm Kernel
Commodity Inflation H1'CY18
Milk, 37%
Wheat Flour, 12%
Green Coffee, 10%
Palm oil, 7%
Sugar, 6%
DWP, 4%
MSK, 4%
Palm kernel, 3%
Others, 17%
East, 31%
West, 18%North, 27%
South, 24%
Region wise domestic sales contribution (%)
0.7
1.1
0
0.2
0.4
0.6
0.8
1
1.2
H1'CY17 H1'CY18
E‐com contribution to domestic sales (%)
Page | 5 | PHILLIPCAPITAL INDIA RESEARCH
NESTLE INDIA COMPANY UPDATE
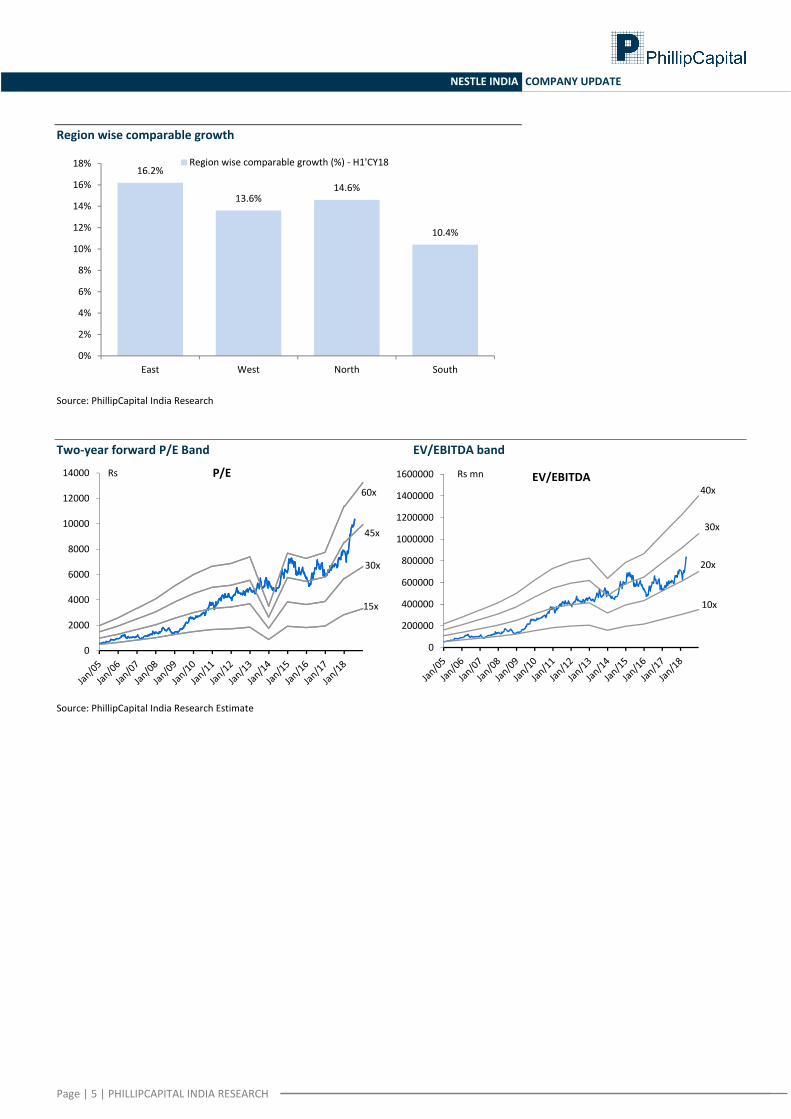
Region wise comparable growth
Source: PhillipCapital India Research Two‐year forward P/E Band EV/EBITDA band
Source: PhillipCapital India Research Estimate
16.2%
13.6%14.6%
10.4%
0%
2%
4%
6%
8%
10%
12%
14%
16%
18%
East West North South
Region wise comparable growth (%) ‐ H1'CY18
15x
30x
45x
60x
0
2000
4000
6000
8000
10000
12000
14000 Rs P/E
10x
20x
30x
40x
0
200000
400000
600000
800000
1000000
1200000
1400000
1600000 Rs mn EV/EBITDA
Page | 6 | PHILLIPCAPITAL INDIA RESEARCH
NESTLE INDIA COMPANY UPDATE
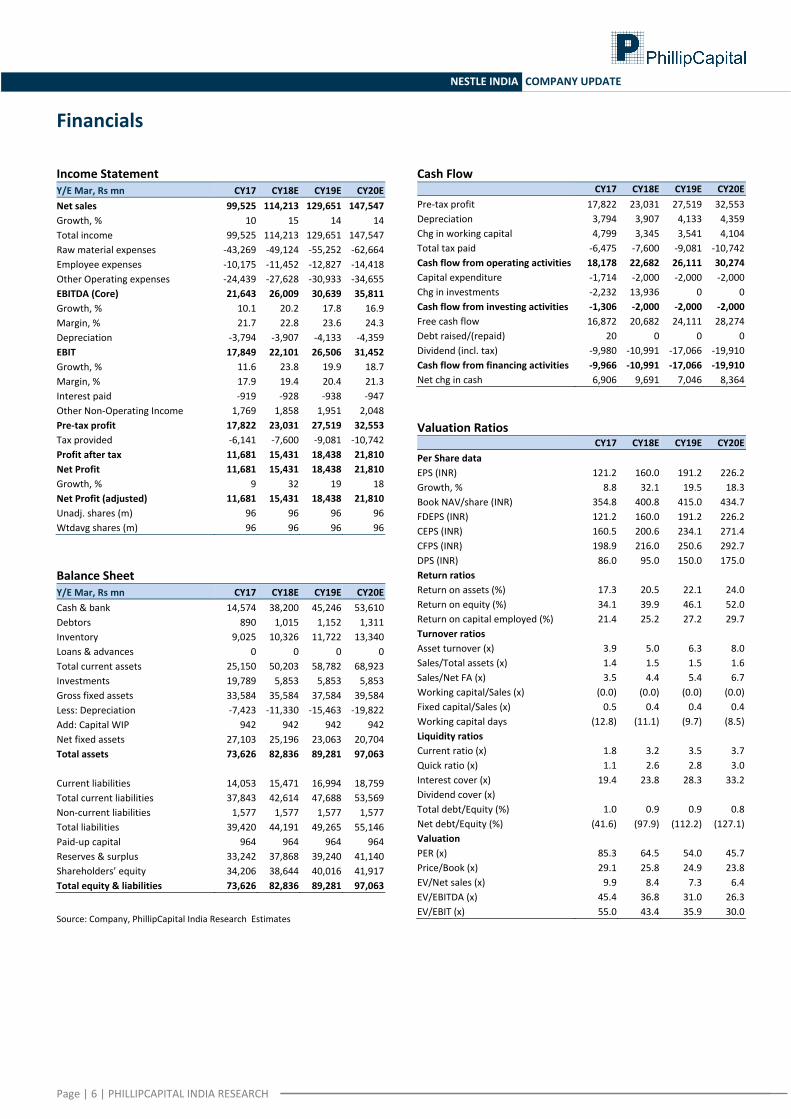
Financials
Income Statement Y/E Mar, Rs mn CY17 CY18E CY19E CY20ENet sales 99,525 114,213 129,651 147,547Growth, % 10 15 14 14Total income 99,525 114,213 129,651 147,547Raw material expenses ‐43,269 ‐49,124 ‐55,252 ‐62,664Employee expenses ‐10,175 ‐11,452 ‐12,827 ‐14,418Other Operating expenses ‐24,439 ‐27,628 ‐30,933 ‐34,655EBITDA (Core) 21,643 26,009 30,639 35,811Growth, % 10.1 20.2 17.8 16.9Margin, % 21.7 22.8 23.6 24.3Depreciation ‐3,794 ‐3,907 ‐4,133 ‐4,359EBIT 17,849 22,101 26,506 31,452Growth, % 11.6 23.8 19.9 18.7Margin, % 17.9 19.4 20.4 21.3Interest paid ‐919 ‐928 ‐938 ‐947Other Non‐Operating Income 1,769 1,858 1,951 2,048Pre‐tax profit 17,822 23,031 27,519 32,553Tax provided ‐6,141 ‐7,600 ‐9,081 ‐10,742Profit after tax 11,681 15,431 18,438 21,810Net Profit 11,681 15,431 18,438 21,810Growth, % 9 32 19 18Net Profit (adjusted) 11,681 15,431 18,438 21,810Unadj. shares (m) 96 96 96 96Wtdavg shares (m) 96 96 96 96 Balance Sheet Y/E Mar, Rs mn CY17 CY18E CY19E CY20ECash & bank 14,574 38,200 45,246 53,610Debtors 890 1,015 1,152 1,311Inventory 9,025 10,326 11,722 13,340Loans & advances 0 0 0 0Total current assets 25,150 50,203 58,782 68,923Investments 19,789 5,853 5,853 5,853Gross fixed assets 33,584 35,584 37,584 39,584Less: Depreciation ‐7,423 ‐11,330 ‐15,463 ‐19,822Add: Capital WIP 942 942 942 942Net fixed assets 27,103 25,196 23,063 20,704Total assets 73,626 82,836 89,281 97,063 Current liabilities 14,053 15,471 16,994 18,759Total current liabilities 37,843 42,614 47,688 53,569Non‐current liabilities 1,577 1,577 1,577 1,577Total liabilities 39,420 44,191 49,265 55,146Paid‐up capital 964 964 964 964Reserves & surplus 33,242 37,868 39,240 41,140Shareholders’ equity 34,206 38,644 40,016 41,917Total equity & liabilities 73,626 82,836 89,281 97,063 Source: Company, PhillipCapital India Research Estimates
Cash Flow CY17 CY18E CY19E CY20E
Pre‐tax profit 17,822 23,031 27,519 32,553Depreciation 3,794 3,907 4,133 4,359Chg in working capital 4,799 3,345 3,541 4,104Total tax paid ‐6,475 ‐7,600 ‐9,081 ‐10,742Cash flow from operating activities 18,178 22,682 26,111 30,274Capital expenditure ‐1,714 ‐2,000 ‐2,000 ‐2,000Chg in investments ‐2,232 13,936 0 0Cash flow from investing activities ‐1,306 ‐2,000 ‐2,000 ‐2,000Free cash flow 16,872 20,682 24,111 28,274Debt raised/(repaid) 20 0 0 0Dividend (incl. tax) ‐9,980 ‐10,991 ‐17,066 ‐19,910Cash flow from financing activities ‐9,966 ‐10,991 ‐17,066 ‐19,910Net chg in cash 6,906 9,691 7,046 8,364 Valuation Ratios
CY17 CY18E CY19E CY20EPer Share data EPS (INR) 121.2 160.0 191.2 226.2Growth, % 8.8 32.1 19.5 18.3Book NAV/share (INR) 354.8 400.8 415.0 434.7FDEPS (INR) 121.2 160.0 191.2 226.2CEPS (INR) 160.5 200.6 234.1 271.4CFPS (INR) 198.9 216.0 250.6 292.7DPS (INR) 86.0 95.0 150.0 175.0Return ratios Return on assets (%) 17.3 20.5 22.1 24.0Return on equity (%) 34.1 39.9 46.1 52.0Return on capital employed (%) 21.4 25.2 27.2 29.7Turnover ratios Asset turnover (x) 3.9 5.0 6.3 8.0Sales/Total assets (x) 1.4 1.5 1.5 1.6Sales/Net FA (x) 3.5 4.4 5.4 6.7Working capital/Sales (x) (0.0) (0.0) (0.0) (0.0)Fixed capital/Sales (x) 0.5 0.4 0.4 0.4Working capital days (12.8) (11.1) (9.7) (8.5)Liquidity ratios Current ratio (x) 1.8 3.2 3.5 3.7Quick ratio (x) 1.1 2.6 2.8 3.0Interest cover (x) 19.4 23.8 28.3 33.2Dividend cover (x) Total debt/Equity (%) 1.0 0.9 0.9 0.8Net debt/Equity (%) (41.6) (97.9) (112.2) (127.1)Valuation PER (x) 85.3 64.5 54.0 45.7Price/Book (x) 29.1 25.8 24.9 23.8EV/Net sales (x) 9.9 8.4 7.3 6.4EV/EBITDA (x) 45.4 36.8 31.0 26.3EV/EBIT (x) 55.0 43.4 35.9 30.0
Page | 7 | PHILLIPCAPITAL INDIA RESEARCH
NESTLE INDIA COMPANY UPDATE
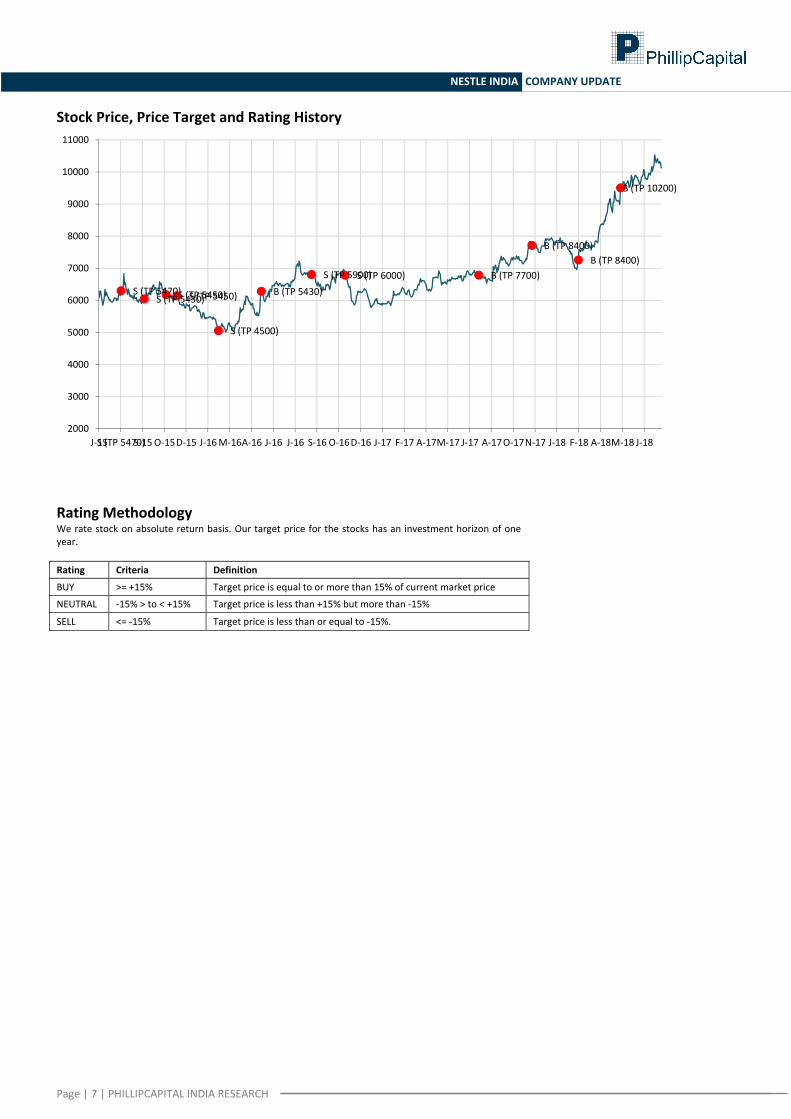
Stock Price, Price Target and Rating History
Rating Methodology We rate stock on absolute return basis. Our target price for the stocks has an investment horizon of one year. Rating Criteria Definition
BUY >= +15% Target price is equal to or more than 15% of current market price
NEUTRAL ‐15% > to < +15% Target price is less than +15% but more than ‐15%
SELL <= ‐15% Target price is less than or equal to ‐15%.
S (TP 5470)S (TP 5430)S (TP 5450)S (TP 5450)
S (TP 4500)
B (TP 5430)
S (TP 5900)S (TP 6000) B (TP 7700)
B (TP 8400)B (TP 8400)
B (TP 10200)
2000
3000
4000
5000
6000
7000
8000
9000
10000
11000
J‐15S (TP 5470)S‐15O‐15D‐15 J‐16M‐16A‐16 J‐16 J‐16 S‐16 O‐16D‐16 J‐17 F‐17 A‐17M‐17 J‐17 A‐17O‐17N‐17 J‐18 F‐18 A‐18M‐18 J‐18
Page | 8 | PHILLIPCAPITAL INDIA RESEARCH
NESTLE INDIA COMPANY UPDATE
Disclosures and Disclaimers PhillipCapital (India) Pvt. Ltd. has three independent equity research groups: Institutional Equities, Institutional Equity Derivatives, and Private Client Group. This report has been prepared by Institutional Equities Group. The views and opinions expressed in this document may, may not match, or may be contrary at times with the views, estimates, rating, and target price of the other equity research groups of PhillipCapital (India) Pvt. Ltd.
This report is issued by PhillipCapital (India) Pvt. Ltd., which is regulated by the SEBI. PhillipCapital (India) Pvt. Ltd. is a subsidiary of Phillip (Mauritius) Pvt. Ltd. References to "PCIPL" in this report shall mean PhillipCapital (India) Pvt. Ltd unless otherwise stated. This report is prepared and distributed by PCIPL for information purposes only, and neither the information contained herein, nor any opinion expressed should be construed or deemed to be construed as solicitation or as offering advice for the purposes of the purchase or sale of any security, investment, or derivatives. The information and opinions contained in the report were considered by PCIPL to be valid when published. The report also contains information provided to PCIPL by third parties. The source of such information will usually be disclosed in the report. Whilst PCIPL has taken all reasonable steps to ensure that this information is correct, PCIPL does not offer any warranty as to the accuracy or completeness of such information. Any person placing reliance on the report to undertake trading does so entirely at his or her own risk and PCIPL does not accept any liability as a result. Securities and Derivatives markets may be subject to rapid and unexpected price movements and past performance is not necessarily an indication of future performance.
This report does not regard the specific investment objectives, financial situation, and the particular needs of any specific person who may receive this report. Investors must undertake independent analysis with their own legal, tax, and financial advisors and reach their own conclusions regarding the appropriateness of investing in any securities or investment strategies discussed or recommended in this report and should understand that statements regarding future prospects may not be realised. Under no circumstances can it be used or considered as an offer to sell or as a solicitation of any offer to buy or sell the securities mentioned within it. The information contained in the research reports may have been taken from trade and statistical services and other sources, which PCIL believe is reliable. PhillipCapital (India) Pvt. Ltd. or any of its group/associate/affiliate companies do not guarantee that such information is accurate or complete and it should not be relied upon as such. Any opinions expressed reflect judgments at this date and are subject to change without notice.
Important: These disclosures and disclaimers must be read in conjunction with the research report of which it forms part. Receipt and use of the research report is subject to all aspects of these disclosures and disclaimers. Additional information about the issuers and securities discussed in this research report is available on request.
Certifications: The research analyst(s) who prepared this research report hereby certifies that the views expressed in this research report accurately reflect the research analyst’s personal views about all of the subject issuers and/or securities, that the analyst(s) have no known conflict of interest and no part of the research analyst’s compensation was, is, or will be, directly or indirectly, related to the specific views or recommendations contained in this research report.
Additional Disclosures of Interest: Unless specifically mentioned in Point No. 9 below: 1. The Research Analyst(s), PCIL, or its associates or relatives of the Research Analyst does not have any financial interest in the company(ies) covered in
this report. 2. The Research Analyst, PCIL or its associates or relatives of the Research Analyst affiliates collectively do not hold more than 1% of the securities of the
company (ies)covered in this report as of the end of the month immediately preceding the distribution of the research report. 3. The Research Analyst, his/her associate, his/her relative, and PCIL, do not have any other material conflict of interest at the time of publication of this
research report. 4. The Research Analyst, PCIL, and its associates have not received compensation for investment banking or merchant banking or brokerage services or for
any other products or services from the company(ies) covered in this report, in the past twelve months. 5. The Research Analyst, PCIL or its associates have not managed or co‐managed in the previous twelve months, a private or public offering of securities for
the company (ies) covered in this report. 6. PCIL or its associates have not received compensation or other benefits from the company(ies) covered in this report or from any third party, in
connection with the research report. 7. The Research Analyst has not served as an Officer, Director, or employee of the company (ies) covered in the Research report. 8. The Research Analyst and PCIL has not been engaged in market making activity for the company(ies) covered in the Research report. 9. Details of PCIL, Research Analyst and its associates pertaining to the companies covered in the Research report: Sr. no. Particulars Yes/No
1 Whether compensation has been received from the company(ies) covered in the Research report in the past 12 months for investment banking transaction by PCIL
No
2 Whether Research Analyst, PCIL or its associates or relatives of the Research Analyst affiliates collectively hold more than 1% of the company(ies) covered in the Research report
No
3 Whether compensation has been received by PCIL or its associates from the company(ies) covered in the Research report No4 PCIL or its affiliates have managed or co‐managed in the previous twelve months a private or public offering of securities for the
company(ies) covered in the Research report No
5 Research Analyst, his associate, PCIL or its associates have received compensation for investment banking or merchant banking or brokerage services or for any other products or services from the company(ies) covered in the Research report, in the last twelve months
No
Independence: PhillipCapital (India) Pvt. Ltd. has not had an investment banking relationship with, and has not received any compensation for investment banking services from, the subject issuers in the past twelve (12) months, and PhillipCapital (India) Pvt. Ltd does not anticipate receiving or intend to seek compensation for investment banking services from the subject issuers in the next three (3) months. PhillipCapital (India) Pvt. Ltd is not a market maker in the securities mentioned in this research report, although it, or its affiliates/employees, may have positions in, purchase or sell, or be materially interested in any of the securities covered in the report.
Suitability and Risks: This research report is for informational purposes only and is not tailored to the specific investment objectives, financial situation or particular requirements of any individual recipient hereof. Certain securities may give rise to substantial risks and may not be suitable for certain investors. Each investor must make its own determination as to the appropriateness of any securities referred to in this research report based upon the legal, tax and accounting considerations applicable to such investor and its own investment objectives or strategy, its financial situation and its investing experience. The value of any security may be positively or adversely affected by changes in foreign exchange or interest rates, as well as by other financial, economic, or political factors. Past performance is not necessarily indicative of future performance or results.
Page | 9 | PHILLIPCAPITAL INDIA RESEARCH
NESTLE INDIA COMPANY UPDATE
Sources, Completeness and Accuracy: The material herein is based upon information obtained from sources that PCIPL and the research analyst believe to be reliable, but neither PCIPL nor the research analyst represents or guarantees that the information contained herein is accurate or complete and it should not be relied upon as such. Opinions expressed herein are current opinions as of the date appearing on this material, and are subject to change without notice. Furthermore, PCIPL is under no obligation to update or keep the information current. Without limiting any of the foregoing, in no event shall PCIL, any of its affiliates/employees or any third party involved in, or related to computing or compiling the information have any liability for any damages of any kind including but not limited to any direct or consequential loss or damage, however arising, from the use of this document.
Copyright: The copyright in this research report belongs exclusively to PCIPL. All rights are reserved. Any unauthorised use or disclosure is prohibited. No reprinting or reproduction, in whole or in part, is permitted without the PCIPL’s prior consent, except that a recipient may reprint it for internal circulation only and only if it is reprinted in its entirety.
Caution: Risk of loss in trading/investment can be substantial and even more than the amount / margin given by you. Investment in securities market are subject to market risks, you are requested to read all the related documents carefully before investing. You should carefully consider whether trading/investment is appropriate for you in light of your experience, objectives, financial resources and other relevant circumstances. PhillipCapital and any of its employees, directors, associates, group entities, or affiliates shall not be liable for losses, if any, incurred by you. You are further cautioned that trading/investments in financial markets are subject to market risks and are advised to seek independent third party trading/investment advice outside PhillipCapital/group/associates/affiliates/directors/employees before and during your trading/investment. There is no guarantee/assurance as to returns or profits or capital protection or appreciation. PhillipCapital and any of its employees, directors, associates, and/or employees, directors, associates of PhillipCapital’s group entities or affiliates is not inducing you for trading/investing in the financial market(s). Trading/Investment decision is your sole responsibility. You must also read the Risk Disclosure Document and Do’s and Don’ts before investing.
Kindly note that past performance is not necessarily a guide to future performance.
For Detailed Disclaimer: Please visit our website www.phillipcapital.in
For U.S. persons only: This research report is a product of PhillipCapital (India) Pvt Ltd., which is the employer of the research analyst(s) who has prepared the research report. The research analyst(s) preparing the research report is/are resident outside the United States (U.S.) and are not associated persons of any U.S.‐regulated broker‐dealer and therefore the analyst(s) is/are not subject to supervision by a U.S. broker‐dealer, and is/are not required to satisfy the regulatory licensing requirements of FINRA or required to otherwise comply with U.S. rules or regulations regarding, among other things, communications with a subject company, public appearances, and trading securities held by a research analyst account.
This report is intended for distribution by PhillipCapital (India) Pvt Ltd. only to "Major Institutional Investors" as defined by Rule 15a‐6(b)(4) of the U.S. Securities and Exchange Act, 1934 (the Exchange Act) and interpretations thereof by the U.S. Securities and Exchange Commission (SEC) in reliance on Rule 15a 6(a)(2). If the recipient of this report is not a Major Institutional Investor as specified above, then it should not act upon this report and return the same to the sender. Further, this report may not be copied, duplicated, and/or transmitted onward to any U.S. person, which is not a Major Institutional Investor. In reliance on the exemption from registration provided by Rule 15a‐6 of the Exchange Act and interpretations thereof by the SEC in order to conduct certain business with Major Institutional Investors, PhillipCapital (India) Pvt Ltd. has entered into an agreement with a U.S. registered broker‐dealer, Decker & Co, LLC. Transactions in securities discussed in this research report should be effected through Decker & Co, LLC or another U.S. registered broker dealer. If Distribution is to Australian Investors This report is produced by PhillipCapital (India) Pvt Ltd and is being distributed in Australia by Phillip Capital Limited (Australian Financial Services Licence No. 246827). This report contains general securities advice and does not take into account your personal objectives, situation and needs. Please read the Disclosures and Disclaimers set out above. By receiving or reading this report, you agree to be bound by the terms and limitations set out above. Any failure to comply with these terms and limitations may constitute a violation of law. This report has been provided to you for personal use only and shall not be reproduced, distributed or published by you in whole or in part, for any purpose. If you have received this report by mistake, please delete or destroy it, and notify the sender immediately. PhillipCapital (India) Pvt. Ltd. Registered office: No. 1, 18th Floor, Urmi Estate, 95 Ganpatrao Kadam Marg, Lower Parel West, Mumbai 400013
Recommended