IMES DISCUSSION PAPER SERIES
INSTITUTE FOR MONETARY AND ECONOMIC STUDIES
BANK OF JAPAN
2-1-1 NIHONBASHI-HONGOKUCHO
CHUO-KU, TOKYO 103-8660
JAPAN
You can download this and other papers at the IMES Web site:
https://www.imes.boj.or.jp
Do not reprint or reproduce without permission.
Does Sovereign Risk in Local and Foreign Currency Differ?
Marlene Amstad, Frank Packer, and Jimmy Shek
Discussion Paper No. 2018-E-1
NOTE: IMES Discussion Paper Series is circulated in
order to stimulate discussion and comments. Views
expressed in Discussion Paper Series are those of
authors and do not necessarily reflect those of
the Bank of Japan or the Institute for Monetary
and Economic Studies.

IMES Discussion Paper Series 2018-E-1 March 2018
Does Sovereign Risk in Local and Foreign Currency Differ?
Marlene Amstad*, Frank Packer**, and Jimmy Shek***
Abstract
Historically, sovereign debt in local currency has been considered safer than debt in foreign currency. The literature offers scant theoretical or empirical guidance as to why such a gap has existed or why it appears to have slowly and steadily diminished for all regions over the past two decades, as expressed in the credit ratings widely used by global investors and regulators to assess credit risk. We suggest and empirically test five hypotheses. We find the assessed differences between local and foreign currency credit risk to not be driven by changes in inflation. The banking sector’s vulnerability to sovereign debt problems is a significant determinant of the gap, but does not account for the declining spread over time. Instead, the surge in global reserves, and to lesser extent the declining dependence on foreign currency borrowing overseas (decline of original sin), as well as lower global volatility, appear to have diminished the gap. In case of a trend reversal of these variables, there could be a widening of the gap going forward.
Keywords: Sovereign risk; local currency debt; foreign currency debt; credit
ratings JEL classification: F31, F33, F34, F41, H63
*The Chinese University of Hong Kong, Shenzhen (E-mail: [email protected]) **Bank for International Settlements, Hong Kong (E-mail: [email protected]) ***Bank for International Settlements, Hong Kong (E-mail: [email protected])
This paper was prepared in part while Marlene Amstad was a visiting scholar at the Institute for Monetary and Economic Studies, Bank of Japan. The authors appreciate comments from Claudio Borio, William Coen, Torsten Ehlers, Leonardo Gambacorta, Ko Nakayama, Ugo Panizza, Toshitaka Sekine, Andrew Rose, Shigenori Shiratsuka, Hyun Shin, Christian Upper, Charles Wyplosz and other participants in seminars at the Bank of Japan, the Reserve Bank of Australia, the Bank for International Settlements and an anonymous referee. This research was supported with a research fellowship by BIS. The views expressed in this paper are those of the authors and do not necessarily reflect the official views of the Bank for International Settlements and the Bank of Japan.

1
1. Introduction
This paper asks whether the sovereign risk in domestic currency differs in level and underlying
determinants from its counterpart in foreign currency. The answers have wide-ranging
consequences for regulators4 and investors. With financial markets that are more and more
global, and local and foreign currency instruments at times trading on the same platforms in
any market, the distinction between local and foreign currency credit risk can be seen as
increasingly important.
Sovereign debt in local currency has historically been considered safer than sovereign debt
in foreign currency. Bonds issued by the same emerging market (EM) sovereign were almost
always rated higher when denominated in the sovereign’s own domestic currency rather than
a foreign currency, reflecting the view that sovereigns are much less likely to default on local
currency obligations as they can always tax their subjects or print their own currency to service
the debt.
And yet, the view that local currency debt is safer has diminished over the past few decades.
Graph 1 illustrates for a broad sample of 73 emerging economies5 that the average difference
in the average local currency rating minus its foreign counterpart used to be as large as three
notches in 1996 but had almost fully closed by 2015. In part this may be due to the increased
recognition that sovereigns do default in local currency: the seminal work of Reinhart and
4 The practice of using credit ratings for regulatory purposes has a long tradition starting in the 1930’s. While alternatives to ratings are part of the framework, the standardised approach of the Basel III accord incorporates credit ratings in its calculation of minimum capital standards and liquidity ratios (BIS, 2013). The regulatory treatment of sovereign exposures remains under review by the Basel Committee on Banking Supervision, which put out a discussion paper in late 2017 (BCBS, 2017). 5 In the definition of emerging economies we follow the categorization as given by the MSCI Emerging Market Index in 2015.
2
Rogoff (2009) documents that de jure defaults of sovereigns in their own currency have been
rather common since 1800.
The earlier broad consensus concerning the higher relative creditworthiness of sovereign
debt in local currency contrasts with a paucity of analyses that explain it. This paper
contributes to the literature in several ways. First, we develop five hypotheses why currency
denomination might matter for sovereign credit risk. Inflation or the option to monetize is the
most prominent and often the only one cited in the literature. The additional factors we identify
as potential determinants of the gap are the availability of foreign currency in form of foreign
exchange (FX) reserves, the ability to borrow in international markets in domestic currency,
the vulnerability of the banking system to sovereign debt problems, and – as a common global
factor - the level of global volatility.
Second, we document a slow and steady convergence of sovereign risk in local and foreign
currency over the past 20 years. The proportion of sovereigns without any gap has risen
steadily, while gaps larger than one rating notch is now extremely rare. Third, we analyse the
determinants of the difference in local versus foreign sovereign risk, and their statistical and
economic significance. We do so first by estimating separate panel regressions for foreign and
local currency sovereign risk between 1996 and 2015. Then we estimate the probability and
extent of a gap in local and foreign currency risk using a panel trinominal ordered logistic
regression. We also approximate the empirical relevance of different factors in explaining the
observed closing of the gap over the past twenty years.

3
For measures of sovereign risk in both foreign and local currency, we take the average of
credit ratings provided by the three major global agencies, Standard and Poor’s, Moody’s and
Fitch. This is motivated by several considerations. First, global investors routinely reference
credit ratings when measuring credit risk.6 Second, while there have been international efforts
to reduce the reliance on ratings (FSB, 2014), sovereign ratings remain a tool in many
regulatory frameworks, e.g. to weigh the bank capital requirements for sovereign exposure.7
Third, rating agencies provide assessments of both local and foreign credit risk across a very
large number of countries; by contrast market-based measures of sovereign risk like sovereign
CDS are for the most part available only for foreign currency obligations. Further, market-
based measures are impacted by various capital market frictions and near-term market
conditions (including the pricing of liquidity and counterparty risk), while ratings are by
construction aiming to abstract from these and focusing on credit risk over the medium to
longer-term.8 In addition, compared to ex-post realisations of credit risk, i.e. defaults, ratings
are available over a much wider array of countries, and at regular frequencies.
We find limited evidence of sovereigns’ willingness to inflate away their local debt in our
measures of credit risk. Thus, declining trend inflation has little to do with a diminishing
distinction between foreign and local currency sovereign risk. Instead, higher FX reserves,
lesser dependence on foreign currency borrowing (decline of original sin), and lower global
volatility better account for the observed narrowing of the gap. In particular, our results point
6 This is particularly the case for institutional investors, which are of increased importance in financial markets. For governance reasons, they need to strictly follow investment guidelines in which ratings often play a key role. 7 See BIS (2013), BCBS (2017). 8 Ratings are intended to look “through the cycle” and capture the relative risk of default. For an overview on differences in ratings and market credit spreads see Amstad and Packer (2015).

4
towards the role of an unprecedented two-decade long surge in FX reserves9 in lifting the
relative creditworthiness of foreign currency debt. If FX reserves should drain, ability to
borrow in local currency decline and global volatility further increase, more significant gaps in
local and foreign currency sovereign risk may re-emerge.
The paper is organised as follows. Section 2 reviews the literature and develops five
hypotheses about what might justify a gap between local and foreign currency sovereign risk.
Section 3 introduces the data used to test the hypotheses as well as the empirical methodology.
Section 4 reports the results, and section 5 summarises and draws some policy conclusions.
2. What might justify a gap?
The literature on the factors determining sovereign credit risk is large. However, sovereign risk
has almost always been discussed in the context of external debt.10 As exceptions, Reinhart
and Rogoff (2009, 2011) turned their attention to the so-called “forgotten history” of domestic
debt and related defaults. Many models assume that domestic debt is always honoured, not
least because governments could simply print money and inflate the problem away. In fact,
Reinhart and Rogoff document that while domestic default has been somewhat less frequent
than for external debt, it has not been rare; there have been nearly 70 cases since 1800 vs.
around 250 defaults on external debt.
Instead of focusing only on inflation, we propose five hypotheses why the credit risk
entailed in local currency debt might differ from that of foreign currency sovereign debt. All of
9 The total level of FX reserves in our EME sample rose from US$476 billion to US$7.378 trillion between 1995 and 2015, moving from 11.2% to 20.8% of GDP. 10 We use external debt and debt in foreign currency as well as domestic debt and debt in local currency interchangeably.

5
these hypotheses presume that local currency is more creditworthy, but that the degree of the
difference depends on several factors. Section 2.1 presents the five hypotheses and related
explanatory variables. Section 2.2 reviews commonly used control variables that are commonly
related to sovereign creditworthiness in the literature, but for which we have no strong prior
of a differential effect across local vs. foreign currency obligations.
2.1. Five hypotheses
The creditworthiness of domestic currency sovereign obligations is often viewed as higher than
that of foreign currency debt, reflecting the presumed greater ability and willingness of
sovereigns to service debt in their own currency. The empirical literature to date has generally
focused exclusively on the determinants of sovereign risk in foreign currency, rather than on
whether and how the determinants might differ between foreign and local currency sovereign
risk. Below, we suggest five hypotheses for how the gap between foreign and local currency risk
might be related to observable factors. Our paper empirically estimates the influence and
significance of the factors. To the best of our knowledge, we are the first to propose and test
these hypotheses.
(1) Inflation hypothesis (H1): Higher inflation lowers sovereign creditworthiness but less
so for domestic currency debt - thus increasing the gap. The first factor we focus on is inflation.
Most models of sovereign risk posit a negative relationship between a sovereign’s inflation and
the creditworthiness of its external debt. This is because high inflation is a good proxy for
problems in the government’s finances as well as political and other forms of institutional

6
instability (Cantor and Packer, 1996). Such problems should negatively affect the
creditworthiness of domestic debt as well.
However, the relationship between inflation and domestic currency debt has another
dimension: namely, to the extent that printing currency is inflationary, the sovereign has the
ability to generate inflation to reduce the real burden of local currency debt. 11 This
consideration suggests that inflation has a positive aspect in the case of local currency debt,
since the ability of sovereigns to repay may be positively affected by inflation in a fashion that
is not the case with foreign currency debt. By this logic the gap between domestic and foreign
currency risk should widen for high inflation countries.
A competing hypothesis with opposite implications should be kept in mind. Reinhart and
Rogoff (2011) note high inflation episodes tend to go “hand in hand” with domestic default.
This suggests that the sovereign’s willingness to monetise rather than default on domestic debt
may in fact be diminished in times of high inflation, perhaps because of increased awareness
of the costs of hyperinflation and political resistance to further inflation at high levels.
(2) Reserves hypothesis (H2): High FX reserves (over GDP) increases creditworthiness,
but more so for foreign currency obligations – thus diminishing the gap.
The second major factor we focus on is the sovereign’s accumulation of FX reserves. All models
of sovereign risk posit a positive relationship between foreign exchange reserves and external
debt creditworthiness. The more readily available foreign currency is for a sovereign in the
11 For a model in which less disciplined countries in terms of monetary policy tend to have less access to local currency debt due to the risk of currency debasement that inflates away the debt, see Engel and Park (2017). The rating agencies eliminated the distinction between local and foreign currency debt in euro area countries once they came under the framework of the common currency (see e.g., Fitch (1998)). Our sample does include only emerging markets and no sovereign that transitioned to a common currency or vice versa.
7
form of reserves, then the more a sovereign should be able to avoid default on foreign currency
obligations. If they are first exchanged into domestic currency, FX reserves can also be used
for domestic currency debt repayment, but this requires liquid FX markets and sterilisation of
the side-effects on money supply. Due to fluctuating exchange rates, they are also not a natural
hedge for those obligations. For these reasons, it might be expected that FX reserves would
have a larger positive impact on the foreign currency creditworthiness of the sovereign than on
domestic currency creditworthiness.
The importance of reserves to creditworthiness was taken to heart by many nations in the
wake of the Asian financial crisis of the late 1990s, as illustrated by the massive build-up of
reserves by central banks in the region over the past few decades. The Asian financial crisis was
triggered by the inability of many countries in the region to service their foreign currency debts.
(3) Original sin hypothesis (H3): Lower original sin (greater international debt
financing in local currency) raises sovereign creditworthiness and more so for foreign
currency obligations – thus diminishing the gap.
Here we use the term “original sin” as short-hand for the lack of development of the local
currency international debt markets relative to those in foreign currency.12 The ability to raise
funds internationally in local currency has been shown to be a general positive for the
creditworthiness of external sovereign debt in many empirical models, though it may have lost
some explanatory power since the global financial crisis (Amstad and Packer, 2015). There are
12 When first introduced by Eichengreen and Hausman (1999), the term referred to the difficulty many emerging market sovereigns have had in borrowing overseas in their own currency and in borrowing domestically at long-term maturities. In later work (Eichengreen et al (2007)), the authors chose to focus more on a narrow definition associated with the lack of overseas borrowing in domestic currency. Indeed, the past few 15 years have seen a considerable increase in bond issuance in domestic (local) currency markets (Du and Schreger (2016); Amstad et al (2016)).

8
many possible reasons for this importance, including the fact that the ability of a nation’s
borrowers to raise local currency funds in overseas markets may proxy for other aspects of
financial, social and economic development. However, the reason we focus on here is that
having large local currency borrowing in international markets is likely to be highly correlated
for the degree to which the sovereign as well as large corporate borrowers in the country have
debt burdens that are hedged against movements in the FX value of the currency, and thus less
risky.13
To the extent that the lesser dependence on foreign currency debt improves sovereign
creditworthiness through the currency risk hedging channel, we would expect the positive
impact to be much more pronounced in the case of the creditworthiness of foreign currency
liabilities. Local currency debt is already likely to be supported by local currency revenue,
whereas foreign currency debt can be influenced by the risks of currency mismatch.
(4) Banking sector exposure hypothesis (H4): Greater exposure of the banking sector to
government bonds decreases sovereign creditworthiness, because of the mutual
reinforcement of sovereign and financial system risk (the “doom loop”). Since this influence
is expected to affect local currency obligations more strongly – banking sector exposure to
sovereign risk will decrease the gap.
Another factor we concentrate on is the exposure of the banking sector to sovereign bonds.
While it has been known for some time that the fiscal costs of banking crises are immense
13 It is also possible to estimate the degree to which a countries’ overall structure of assets and liabilities is subject to currency risk, one example of this is the aggregate effective currency mismatch measure proposed by Goldstein and Turner (2004). These measures are highly correlated with the so-called “original sin” measures used here, but are not available for the full sample.
9
(Bordo et al, 2001), and thus banking system problems can threaten the creditworthiness of
the sovereign, more recently there has been recognition of the damage that declines in
sovereign creditworthiness can themselves impose on the banking sector. This suggests a
reinforcing negative feedback loop.14 In the well-known model of Acharya et al (2014), the
channel for this is the sovereign debt owned by the bank, and the potential for collateral
damage on the bank balance sheet. Gennaioli et al (2014) document how the decline in lending
following a sovereign default is larger in those countries where financial institutions are more
developed and banks hold more sovereign bonds, which in turn implies an even greater
vulnerability for the sovereign.
Given that the domestic banking sector tends to hold domestic rather than foreign
currency government debt, the domestic banking sector will be more damaged by defaults on
domestic currency debt, and the “doom loop” will be more likely to operate through that
channel. Thus, ceteris paribus, we would expect any advantage to local currency debt to be
reduced in countries where banks have greater exposure to the sovereign, and for the gap
between domestic and foreign currency sovereign obligations to be smaller.
Similar to the effects of inflation earlier, an alternative hypotheses with opposite
implications should be kept in mind. Due to knowledge of the damage that banking sector
crises can cause, the sovereign’s willingness to pay can possibly be improved by banks’
holdings of government bonds. Once again, this effect can be viewed to act more strongly on
the local currency obligations more likely to reside on banks’ balance sheets. The ultimate sign
14 Bank for International Settlements (2016) documents a greater correlation of sovereign and banking spreads when banking system exposure to sovereign debt is predominant.
10
of the influence of bank holdings of sovereign debt on overall creditworthiness as well as the
gap thus depends on the relative importance of its impact on the sovereign’s ability versus
willingness to pay.15
(5) Global Volatility Hypothesis (H5): High global volatility (as measured by VIX) lowers
sovereign creditworthiness and more so for foreign currency obligations – thus increasing
the gap.
Our final hypothesis focuses on the impact of global market volatility and risk aversion, as
measured by VIX. The VIX is widely used as a proxy metric for the level of risk and
uncertainty in global financial markets. It also has been shown to be inversely related to
global capital flows (Forbes and Warnock, 2012). Particularly for emerging market
sovereigns integrated into the global financial system, greater global volatility and risk-
aversion can threaten the availability of credit as well as trade flows financed by trade credit.16
We thus would expect measures of creditworthiness to be negatively affected by times of high
global volatility.17
It is likely that the impact from any shift in global market volatility would have more
impact on foreign than local currency credit risk. For one, VIX measures implied volatility for
a US dollar-based index, and thus should correlate more with the risks of foreign currency
15 Gennaoili et al (2014) also find that in countries where banks hold more government bonds, government defaults are less likely. However, in deriving this finding, they use a specification which focuses on unexpected defaults, while we are interested in anticipated risk which should generally be reflected in ratings. 16 Another potential channel with similar implications is that ratings tend to be inflated relative to fundamentals during times of market exuberance and high issuance activity – likely to be periods of low global volatility - because of incentive conflicts at the rating agencies (Dilly and Mahlmann, 2016; Bar-Isaac and Shapiro, 2013). 17 That VIX can be a significant determinant of US dollar-denominated market measures of sovereign risk such as sovereign CDS is well established (Pan and Singleton (2008), Amstad, Remolona and Shek (2016)). To some extent, this also reflects the general phenomenon that the price of risk frequently fluctuates more than the fundamental underlying sources of risk (Cochrane, 2011 AFA).
11
sovereign debt obligations, usually also denominated in US dollars. In addition, global credit
markets respond to swings in the risk appetite of global investors, who trade more in foreign
than local currency securities. Local currency debt should be more naturally sheltered from the
spill-overs of global volatility. Indeed, Du and Schreger (2016) report the pass-through of VIX
into their measure of the local currency credit spread as small and not statistically different
from zero for most of the sample countries. In stark contrast they find the pass-through of VIX
into the foreign currency credit spread as statistically significant and positive in most countries.
2.2. Control variables
With the above five hypotheses, we have proposed five variables that might influence sovereign
risk in domestic debt differently from that of foreign debt. Needless to say, the literature
suggests that many other variables that might influence sovereign credit risk more generally;
but these do not necessarily have a differential effect. As control variables, we take measures
of economic, fiscal and institutional strength as well as the default history. These variables
include log per capita GDP, public debt/GDP, interest/revenue, short-term external debt over
GDP, the exchange rate regime, corruption perceptions (See Table 2a and 2b for a description
of all variables used in the analysis).
2.3. Related Literature
Compared to research on foreign currency sovereign risk, the literature on the determinants of
local currency sovereign risk measured by ratings, or more specifically, the distinction between
local and foreign currency sovereign ratings, is relatively sparse. Packer (2003) provides an
early overview of the sovereign ratings “gap”, noting the discrepancy between the higher

12
sovereign ratings for local versus foreign currency, and the lack of a uniform relationship
between the denomination of debt and the likelihood of default.18 As for the determinants of
local versus foreign currency ratings, Kisselev and Packer (2006) undertake an analysis of the
gap between local and foreign currency ratings for 101 countries. In contrast to our first
hypothesis above, they found that higher inflation diminished local currency ratings more than
foreign ratings and thus led to a smaller gap. The authors did not explore dependence on
foreign currency borrowing, banks’ holding of government debt and global volatility as possible
determinants, however.19 They also estimated regressions only over the period 1995-2003,
when domestic currency ratings were still a relatively recent product of the ratings agencies.
Another related strand of literature uses foreign versus domestic currency defaults as the
dependent variable. As noted earlier, Reinhart and Rogoff document the frequency of the two
types of sovereign default, but in terms of assessing the determinants of the two types, the
principal reference is now the recently published work of Jeanneret and Souissi (2016). They
find evidence consistent with some of the above-mentioned hypotheses: ie, a larger banking
sector would make a sovereign less likely to default on domestic debt. But they find that high
levels of inflation make a sovereign more likely to default on local currency obligations not less.
Further, they do not find evidence that global factors – as proxied by VIX and other metrics –
make a difference for either local or foreign currency defaults.
18 He also documents considerably more disagreement among the agencies for domestic than foreign ratings, suggesting the agencies were much less likely to agree on the local currency risk than foreign currency sovereign risk. 19 FX reserves were only used in the denominator of some explanatory variables.

13
3. Data and Methodology
3.1. Foreign and Local Currency Credit Ratings
We follow the practice of many global investors and regulators and measure sovereign
creditworthiness in foreign and local currency using the sovereign credit ratings of the three
major global rating agencies, Fitch, Moody’s and Standard and Poor’s. Our sample comprises
73 emerging market economies for which we are able to obtain both foreign and local currency
sovereign ratings from at least one of the three major rating agencies at some point between
1996 and 2015 (Table 1). We take year-end ratings, as these are most likely to reflect economic
developments of the year as captured in the annual data.
For some of the quantitative analysis, we transform the ratings data, drawing upon the
method for estimating the determinants of sovereign ratings used by Cantor and Packer (1996).
Namely, we convert ratings, averaged across the major agencies, into a linear variable, with
AA+/Aa1=19, AA/AA2=18 and so forth.20 For the most part, we rely on multinomial ordered
logistic regressions where the average rating is treated as a qualitative dependent variable.
While non-linearity may well characterise certain relationships between indicators and ratings,
the alternative linear regression approximation has been fruitful in a wide array of empirical
investigations, for use of ratings as both explanatory and dependent variables.21 Therefore we
also report OLS specifications, where ratings are measured numerically, as a sensitivity test.
20 Because countries with a AAA foreign currency rating, by definition, cannot be observed to have a local currency ratings higher than the foreign currency ratings, we do not include AAA-rated sovereigns in the sample. It is important to realise this reflects a limitation of the ratings symbols themselves, rather than an inability of AAA-foreign currency rated sovereigns to have less local than foreign currency credit risk. 21 For example, see Eichengreen and Mody (2000), Ferri et al (2001), Borio and Packer (2004), Ratha et al (2010), Becker and Milbourn (2011), Amstad and Packer (2015), and Dilly and Mahlmann (2016).

14
Similarly, for our base case analysis of the ratings gap, we rely on trinomial ordered logistic
regressions that only distinguish between the existence of a gap and no gap, as well as the
existence of a large gap of two notches or more. But as a sensitivity test, we run linear
regressions where the “gap” is calculated as the numeric difference between the numeric values
of the local and foreign currency ratings (Annex Table 2).
Local currency sovereign ratings are a relatively recent product of the major rating
agencies. The sovereign ratings given by the major rating agencies when they first entered the
business in the early 2oth century were ratings on foreign currency obligations, as sovereigns
needed these to access international bond markets (Flandreau et al, 2011). However, starting
in the 1990s, in part reflecting efforts to increase investor participation in domestic currency
bonds, an increasing percentage of sovereigns obtained local currency ratings as well. From 5%
of our EME sample in 1995, more than one-half had a local currency rating by 2000, and the
share had steadily increased to include all EMEs in our sample from 2013 onwards (Graph 2).22
This rapid increase in the provision of local currency ratings has been broadly shared among
the regions of Emerging Asia, Latin America, Emerging Europe, and the Middle East and North
Africa.
As mentioned in the introduction, the difference between local and foreign currency
ratings for the same sovereign – or the “ratings gap” – has steadily declined over the sample
period. The average ratings gap started at 3 notches in 1995, had fallen to 1 notch in 2005 and
has been close to zero from 2013. Encompassing all regions, the gap has narrowed as a result
22 By contrast, more than half of the 27 advanced economies with local currency ratings had ratings by 1995, and 100% by 2003.
15
of the foreign currency rating increasing towards a more stable local currency rating. In terms
of frequencies, while a two or more notch gap existed for nearly four-fifth the sample in 1996,
it had declined to 5% by 2015 (Graph 3). By contrast, the percent of sovereigns with no gap
had risen from less than 20% in 1996 to 75% in 2015. In advanced economies, the decline in
the ratings gaps occurred more rapidly and from a lower starting level.23,24
3.2. Explanatory variables
The explanatory variables we use to test our main hypothesis described in the previous chapter
are inflation, foreign reserves, international debt securities and loans issued in domestic versus
foreign currencies (“original sin”), banking sector exposure to government debt, and VIX. The
measurement for all variables except “original sin” is straightforward. As a robustness test, we
include a narrow and a broad measure for original sin, whereby the narrow version includes
only international debt securities, while the broad version also includes bank debt. The
definitions and sources for the explanatory and control variables are provided in Tables 2a and
23 For advanced economies, from 1 notch in 1996, the average gap had closed by 2005. In 1996 50% of advanced economies showed “no gap”; the share had risen to 95% by 2015. In AEs, the tendency was for local ratings to be lowered toward a more stable foreign currency rating. The collective action clause (CAC) became more commonly used in international bond contracts subsequent to the default of Argentina on its sovereign obligations in the early 2000s. In theory, CAC can facilitate restructuring of international bonds, lowering a potential disadvantage relative to domestic bonds with a more concentrated ownership structure. However, the evidence is that CACs have increased borrowing costs for borrowers of lower creditworthiness, likely due to the moral hazard of easier restructuring provisions (Eichengreen and Modi (2004)). At the same time, the decline in the absolute ratings gap since 2000 is not clearly greater for less creditworthy sovereigns in our sample. These two findings suggest that CAC is unlikely to materially account for the decline in the ratings gap among the sovereigns investigated in this study, though further examination may be warranted in future research. 24 As mentioned in the introduction, the local-foreign currency ratings gap can be expected to only loosely coincide with market-based measures derived from CDS and FX swap markets. Du and Schreger (2016), who construct such market measures over a much limited time period and many fewer sovereigns, note several major sources of differentials between foreign and local currency credit spreads. These include factors that are not directly related to underlying sovereign credit risk per se, such as positively correlated credit and currency risk, counterparty as well as liquidity risks in currency swap markets, and incomplete integration between domestic and external debt markets. The same holds true for CDS Quanto spreads (see e.g. Chernov et al. (2017)) that are available from around 2010 and are mostly limited to European countries.

16
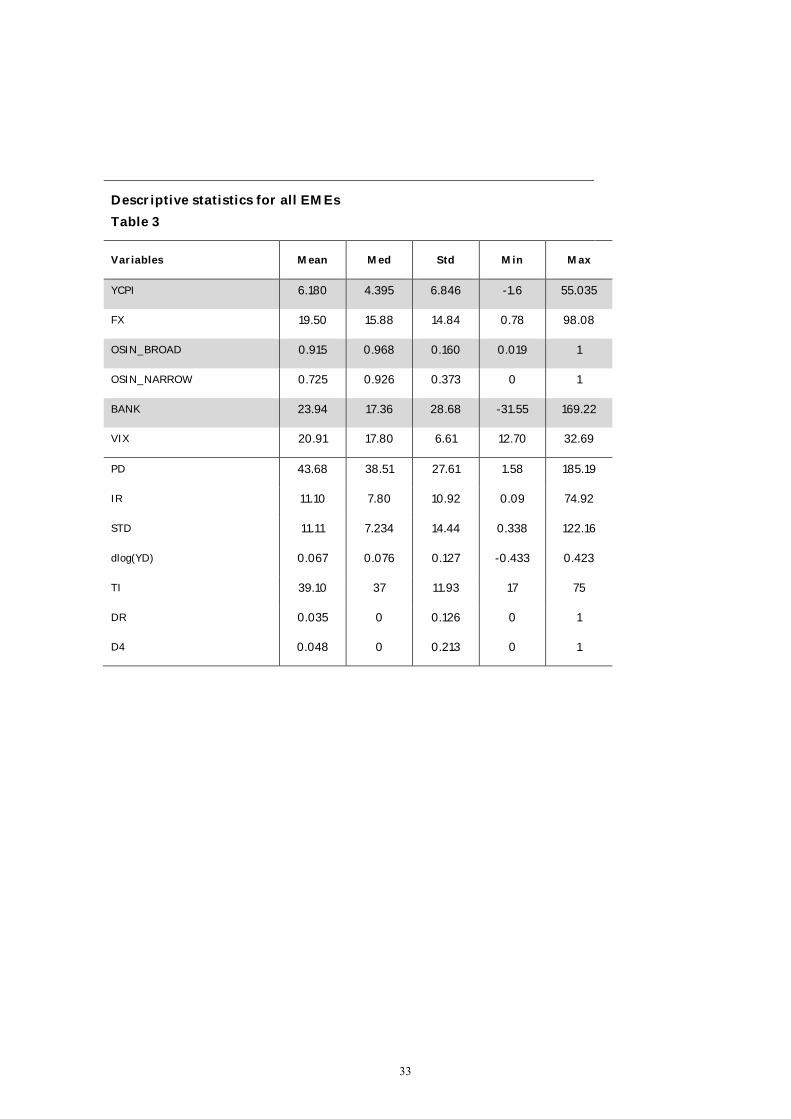
2b, and some summary statistics in Table 3. We also include country and/or time fixed effects
in all specifications.
3.3. Methodology
We proceed to test the five main hypotheses using two complimentary methods.25 First, we
estimate two regressions, of foreign and local currency ratings, respectively, on the same set of
explanatory variables and compare the sign, size and significance of the corresponding
coefficients. Specifically, we run panel multinomial ordered logistic regressions separately for
foreign and local currency ratings, where we estimate the probability of the ratings being in
one of 19 categories between Ca/CC and AA+/Aa1. yF,Li,t represents the rating of each
sovereign i at time t, indexed to be either foreign or local:
Pr (( y Fi,t ) in each of 19 foreign rating categories) = F (Xi,thypothesis , Xi,tcontrol )
Pr (( y,Li,t ) in each of 19 local rating categories) = F (Xi,thypothesis , Xi,tcontrol )
We employ variables related to the main hypotheses (Xi,thypothesis) as well as the control
variables (Xi,tcontrol) introduced above. We run statistical significance tests comparing the sign
of the coefficient on the local and foreign currency rating regressions.26 As another robustness
check, we also report in the annex the result of the OLS regression, in which the same
explanatory variables are used to estimate the average of the numerical value of the ratings, as
25 For both methods we use a country fixed effect panel as the base case model and provide results in the Annex tables for models that include time fixed effects both separately and jointly with country fixed effects. 26 The significance test for the difference of the coefficients is taken to be whether the coefficient of the variable in a multinominal ordered logit in which the dependent variable is the gap in terms of notches is statistically significant.

17
calculated according the linear transformation described earlier: AA+/Aa1=19, AA/Aa2=18,
and so forth.
Secondly, we focus on the gap itself, and estimate trinomial ordered logit models where we
estimate the probability of the ratings gap being in one of three categories - less than or equal
to zero; between zero and 2 notches, and 2 notches or greater - to be a function of the above
explanatory variables, ie:
Pr (( yLi,t - y Fi,t ) <= 0) = F (Xi,thypothesis , Xi,tcontrol )
Pr (( yLi,t - y Fi,t ) >0) and Pr (( yL
i,t - y Fi,t ) < 2 notches
= F (Xi,thypothesis , Xi,tcontrol )
Pr (( yLi,t - y Fi,t ) >= 2 notches = F (Xi,thypothesis , Xi,tcontrol )
Although this second exercise does take into account the degree of the ratings gap, it is
much less granular than the earlier multinomial logits. Rather, the question asked is simply
whether the existence or non-existence of a ratings gap, as well as the existence of a very large
ratings gap, is consistent with the main hypotheses. Once again, we run robustness checks on
the statistical significance of the estimates, reporting different definitions of the original sin
variable, and reporting in the annex the result of OLS regressions of the same explanatory
variables on the numerical value of the average gap in terms of notches.
4. Results
We now turn to regression models of foreign and local currency ratings that include variables
that are directly related to our hypotheses introduced in section 2, and yet at the same time
18
control for a number of key factors. In 4.1., referring to different specifications of an ordered
logistic regression and checking against an OLS regression, we report whether the sign and
relative size of the coefficients in local and foreign currency risk regressions are consistent with
our five hypotheses. In 4.2, focusing on regressions where the likelihood and extent of the gap
is the dependent variable, we test which drivers of the gap are statistically significant, and in
4.3 we explore their quantitative contribution to the decline of the gap over the past two
decades.
4.1. The drivers of foreign versus local currency sovereign risk
The separate ordered logistic regression samples for foreign currency ratings in columns (i)
and (ii) comprise 56 EM sovereigns; the sample for local currency ratings in columns (iii) and
(iv) comprise 47. Results from the base specification of the multinomial logit with country fixed
effects are shown in Table 4 (results from alternative specifications using OLS are shown in
Annex Table 1; results from logit models using different combinations of country and time fixed
effects are shown in Annex Tables 3a and 3b). As in other work, we find that ratings both
foreign and local are well explained by a relatively parsimonious set of variables, with adjusted
R-squared of more than 44% for logit and around 90% in all reported OLS specifications. The
control variables related to government debt, international short-term debt burden, economic
development (per capita GDP), institutional development (corruption), default history and
exchange rate regimes generally have the expected sign and the coefficients are usually at levels

19
of statistical significance. In those few cases where the sign is not as expected, the coefficient
is with only one exception insignificant.27
Inflation is a highly significant (negative) driver of credit risk in both regressions, however
there is little evidence for a lesser impact on local currency credit risk as predicted by H1.
Indeed, comparing Table 4’s specification (i) with (iii), as well as (ii) with (iv), we see that the
estimated negative impact of inflation is actually greater for local currency ratings than foreign,
which goes against hypothesis H1. This latter outcome is consistent with the view that at high
levels of inflation, the negative impact on local currency creditworthiness can be greater due
to the increased costs of monetization and increased incentives to default on local currency
debt. In fact, test statistics suggest that in the case of at least one specification, the impact of
local currency creditworthiness is significantly more negative, in a statistical sense, than that
on foreign creditworthiness. Similar to the findings of Jeanneret and Souissi (2016) with
regard to default, we find that despite the sovereign’s often cited ability to turn on the printing
press and inflate out of local currency obligations, the relative benefits to local currency
obligations from a high inflation environment are limited. The alternative specifications using
OLS (Annex table 1) or time fixed effects (Annex tables 3a and 3b) shows also an estimated
impact of inflation on local currency creditworthiness that is more negative than that on
foreign currency creditworthiness.
One possible reason that inflation does equal or more damage to the ratings of local
currency obligations may be the fact that some sovereigns issue inflation-indexed bonds. In
27 The only exception is short-term debt over gdp, the coefficient for which is unexpectedly positive in the rating regressions. This finding is likely due to a selection bias whereby less creditworthy sovereigns face difficulties in funding short term debt.

20
those cases, any incentive to tolerate higher inflation for the sake of relieving the burden of
local currency obligations would presumably be reduced. We report in the Annex estimations
where a variable has been added which interacts inflation with a dummy variable which is 1 in
a given year when the share of inflation-indexed bonds of overall sovereign debt is higher than
5% and zero otherwise. In two of four specifications, the negative impact of inflation on both
local and foreign ratings is reduced when the sovereign issues indexed bonds (Annex Table 4).
However, for those sovereigns without indexing, the greater negative impact on local currency
obligations relative to foreign currency obligations is maintained in all specifications.
As anticipated by H2, FX reserves have a positive impact of much higher economic and
statistical significance for the assessed creditworthiness of foreign currency debt. The
difference in coefficients is statistically significant regardless of which definition of the original
sin variable is used in Table 4. For a rough estimate of their economic impact, we refer to the
coefficients of the OLS specification of Annex Table 1, where an increase in the ratio of FX
reserves to GDP by 10 percentage points will raise the foreign currency rating between 0.3-0.5
notches and local currency rating around 0.2 notches. This is consistent with the well-
established view that reserves should help to protect against a shortage of foreign currency,
and thus should improve foreign currency creditworthiness. The time fixed effect models in
Annex Tables 3a and 3b also show FX reserves as expected to be positively related to
creditworthiness but does not show as clear a difference between the coefficients on FX
reserves in the foreign versus local currency equations.
So-called original sin, which reflects the degree to which a country’s borrowers are
dependent on foreign currency denominated debt to raise overseas funds, is also a significant
21
determinant of sovereign creditworthiness, and consistent with H3, it has a disproportionate
impact on foreign currency obligations. While less original sin improves the credit ratings of
both local and foreign currency obligations, it does more so for foreign currency ratings (Table
4). When using the broad definition of original sin in the OLS regressions (i) and (iii) of Annex
Table 1, a 10 percentage point decline in original sin corresponds to around a 0.4 notch increase
in the foreign currency rating, as opposed to a 0.1 notch increase in the local rating. Similarly,
when using the specifications with the narrower measure for original sin ((ii) and (iv) of Annex
Table 1), the impact of a 10 percentage point decline in original sin corresponds to a 0.15 notch
increase in the foreign currency rating, as opposed to an increase of 0.03 notch in the local
rating, which is also of much lower statistical significance. In fact, test statistics suggest that in
the case of both pairs of specifications reported in Table 4, the impact of original sin on foreign
currency creditworthiness is significantly more negative, in a statistical sense, than that on
local creditworthiness. Similarly, the time fixed effects model documents a greater negative
impact of original sin on foreign currency obligations.
The results also support H4, as banking sector exposure to government debt is
significantly negatively related to sovereign creditworthiness in all specifications in Table 4.
The negative relation is also stronger for local currency debt, indicating that the bank holdings
of sovereign debt are associated with a narrower gap. In equations (i) and (ii) of Annex Table
1, a 10 percentage point increase in bank holdings of sovereign debt leads to a drop in foreign
currency ratings of 0.08 notches and 0.11 notches, respectively, and 0.16 and 0.19 in local
currency. That bank holdings of government debt are associated with a decline in the
sovereign’s creditworthiness strongly suggests that the increased risks of a feedback loop

22
between financial institutions and sovereign debt, resulting from greater bank exposure to the
sovereign, dominate any potential positives from increased willingness to pay on the part of
the sovereign.28
Consistent with H5, global volatility does reduce creditworthiness, and much more so for
foreign currency obligations in both an economic and a statistical sense (Table 4). This is
consistent with the view that the risk on foreign - mostly USD denominated - currency
obligations is more vulnerable to swings in USD referenced global factors such as VIX.
Estimating the economic impact from the OLS regression result (i) reported in Annex Table 1,
an increase of VIX by 10 percentage points lowers the foreign currency rating by more than 0.2
notches, and statistically significantly so, versus a much smaller and insignificant effect on the
domestic currency rating.29
4.2. Predicting the gap
This section explores the determinants of the difference in credit risk from a different
perspective, asking whether the same explanatory variables examined earlier affect the
probability and extent of a gap in local and foreign currency sovereign risk for any single
sovereign. To some extent, we have already done this when comparing the size of coefficients
in the local and foreign currency regressions, though now we will estimate regressions where
the gap itself is the dependent variable. We run a trinomial logistic regression on the same
28We found the level of bank exposure to government debt, measured as a percent of total bank assets, provided more consistent results than an interactive term which multiplied this exposure times the overall level of credit. This variable is also used in Gennaioli et al (2014). 29 This result contrasts with that of Jeanneret and Souissi (2016), who provide evidence that global volatility does not help to explain the frequency of sovereign defaults in either local or foreign currency.

23
variables as before, distinguishing between the three categories of no gap, a small gap above
zero up to two notches, and a large gap that rounds to two notches or more. We include country
fixed effects.30
The explanatory power of Table 5’s specifications is greater than that reported in the earlier
regressions of Table 4. The pseudo R-squared measure suggests that between 60-70% of the
variation in outcomes can be explained by the variables.31
Despite the marked difference in empirical approach, there remains a lack of support for
H1; rather, the contrary hypothesis that high levels of inflation might hurt local currency
ratings more than foreign currency ratings, and thus reduce the gap is supported in one of the
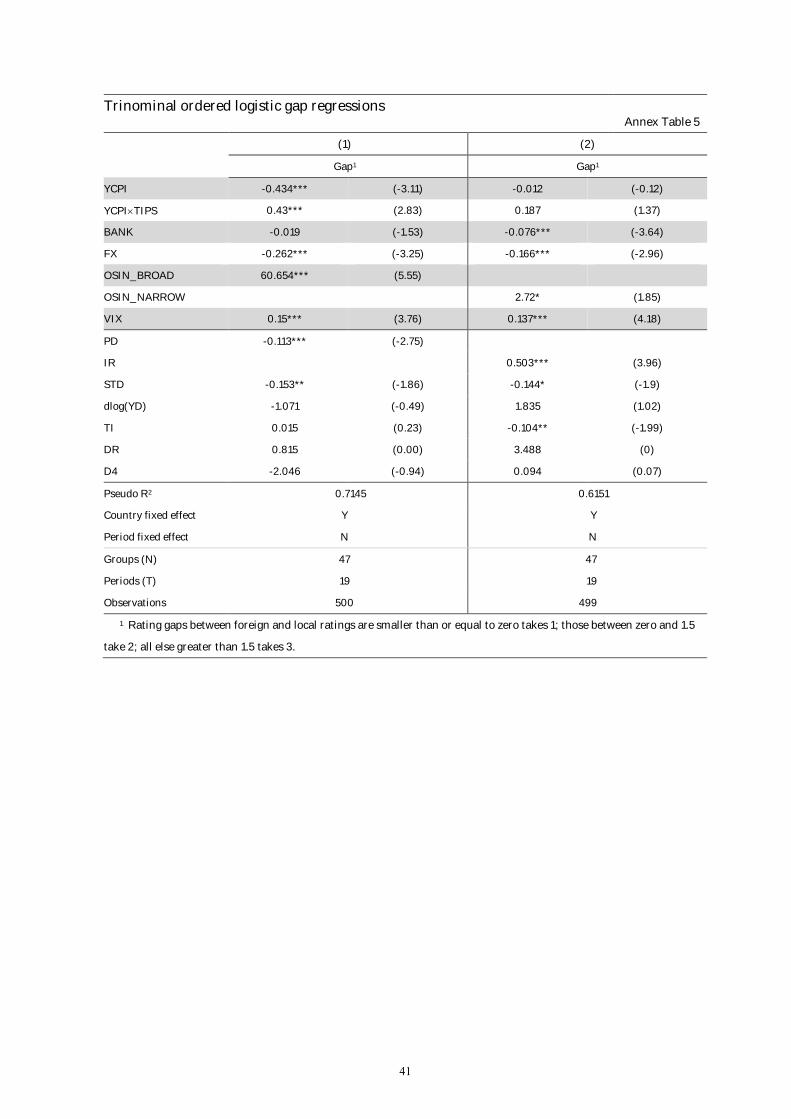
two specifications in Table 5. When the variable that interacts inflation with the existence of
inflation-indexed bonds is added to that specification, the negative association of inflation with
the gap is eliminated when there in indexing (Annex Table 5). However, in no case is a
significant positive relationship between the gap and inflation uncovered. Conceivably, at high
levels of inflation the risks of hyperinflation are too great to avoid default via the printing press.
On the other hand, the support in Table 5 for hypotheses (2), (3), (4) and (5) is quite solid.
FX reserves are negatively associated with the difference between local and foreign currency
creditworthiness, and the variable is highly significant independent of the specification. The
hypothesised original sin effect, or the tendency of greater dependence on foreign currency
borrowing to have a disproportionately negative impact on foreign currency risk, is supported
by a positive sign for the coefficient on the gap in both specifications of Table 5, and is highly
30 Estimations of logit trinomial gap regressions including both country and time fixed effects did not converge. 31 The adjusted R-square of an OLS regression for the determinants of the gap (Annex Table 2) ranges between 55 and 60%.
24
statistically significant for the broad definition (p=.0001) and only slightly less so for the
narrow definition of original sin (p=.0561). Bank ownership of sovereign debt is negatively
associated with the gaps between local and foreign currency creditworthiness, consistent with
a stronger “doom loop” disproportionately reducing the local currency rating. The p-values for
the statistical significance of the coefficients in the two specifications are 0.0891 and 0.0001,
respectively.
The coefficients on global volatility, as represented by VIX, also support hypothesis (5).
Global volatility tends to be associated with an increase in the gap between foreign and local
currency credit risk. The earlier regressions of Table 4 suggest this is because foreign currency
creditworthiness is more negatively impacted than local currency creditworthiness by global
volatility.
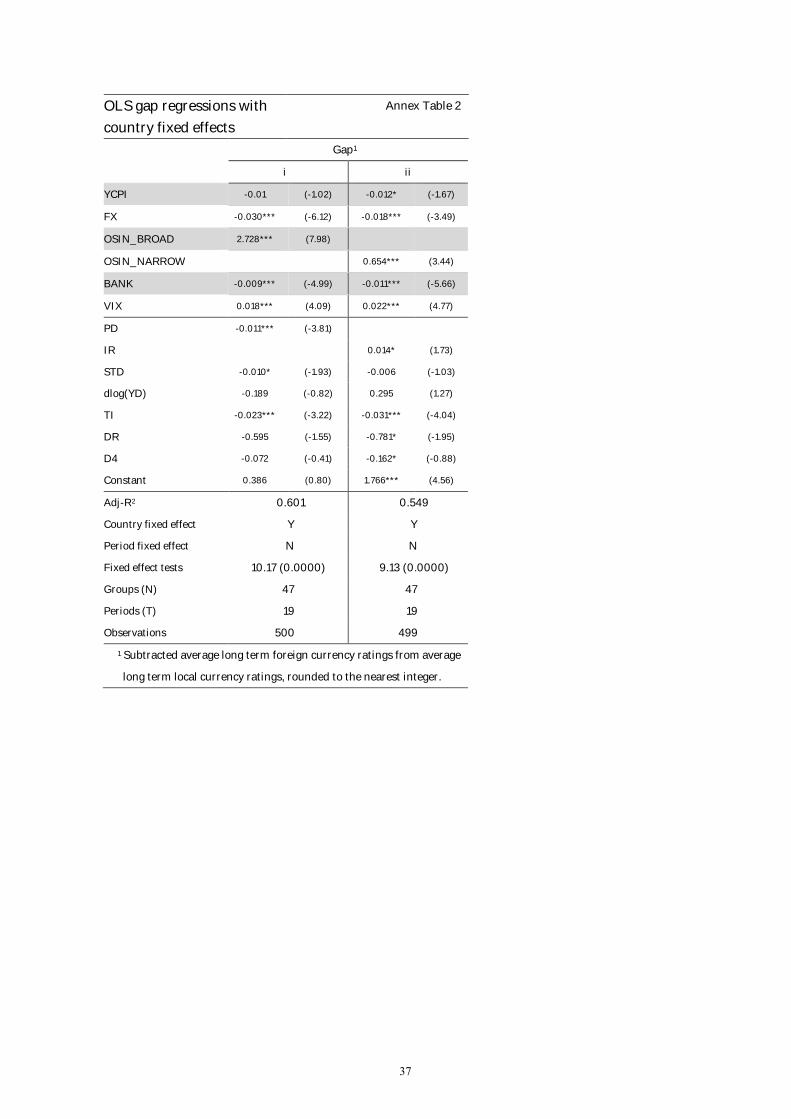
Finally, all the main findings are robust to a transformation to a linear model. The OLS
regression estimations in Annex Table 2, where the dependent variable is defined simply as the
average notch difference in local and foreign currency ratings, reports similar results,
supportive of the hypotheses on reserves (H2), original sin (H3), banking sector exposure (H4)
and volatility (H5).32
32 It has been suggested that because the local currency ratings were effectively not available for all sovereigns before 1999, sample selection may be playing some role in our results. However, estimating the regressions from 1999 on (the point at which virtually every sovereign with a foreign currency rating also had a local currency rating) does not the change the results in a material fashion. We have also estimated the ratings and gap regressions weighting the observations by the country’s outstanding foreign currency debt, in case estimation of the gap is more uncertain in for countries with less foreign currency debt: though this also does not change the results.

25
4.3. Accounting for the gap’s decline
At the outset of this paper, we noted that the gap between local and foreign currency ratings
had declined over the last two decades. What light do the above results shed on the reasons for
this? We focus on FX reserves, original sin, and global market volatility: three variables that
the regression analysis suggests drive the gap. FX reserves has increased over the sample, while
both reliance on foreign currency debt and VIX has declined. Combined with the signs on the
coefficients in the ratings regressions, this implies that each of these three variables could have
accounted for some of the declining gap over the sample period. (The measure of banking
sector exposure, although a significant determinant in the panel regression and volatile over
the period, was little changed at the end of the sample period from the beginning, which
suggests it would not account for the declining gap.)
As an indicative exercise, we take a three-year rolling average of these three explanatory
variables and multiply the change from the first to the last observations (2015 value-1997 value)
by the different coefficients for the variables in the ratings gap OLS regressions, and reported
in column (i) of Annex Table 2. The results indicate the movement of the gap that is consistent
with the change of each explanatory variable over the sample period.
FX reserves, which on average more than doubled as percent of GDP over the sample
period, stand out in importance among the country variables in terms of explaining the decline
in the gap over the entire sample period. The increase in foreign reserves alone in our sample
of emerging market economies over the period corresponds with 0.4 notch decline in the gap.
Smaller is the impact of diminishing original sin, which corresponds with a declining gap of

26
around 0.3, slightly less than one-third of a notch. The increase in VIX over the sample period
corresponds with a relatively small 0.1 notch decline in the gap between foreign and domestic
currency ratings. This exercise, while rough, suggests that among our explanatory variables, it
was the increase in FX reserves that most accounts for the decline in the gap between the
perceived risk of foreign and local currency debt over the sample period.
5. Conclusions
Differences in sovereign risk denominated in local versus foreign currency matter for investors
and regulators alike. Despite frequent reference to the greater creditworthiness of domestic
currency obligations, a consistent theoretical framework has been so far missing in the
literature. Often a remark that sovereigns can simply “inflate” their way out of domestic
obligations is all that is provided.
This paper contributes to the literature in several ways. First, we document that the
difference in the level of local versus foreign currency risk has steadily decreased over time for
all regions. Second, we develop five hypotheses why the currency of denomination might
matter for credit risk, and why there may be a gap between domestic and foreign currency
creditworthiness. Four hypotheses result in implications for the relation of the gap to
observable country-level variables - inflation, FX reserves, reliance on foreign currency debt
markets, and banking sector ownership of government debt. Another hypothesis relates the
gap to global risk and volatility, as proxied by VIX.
Based on our analysis of a panel of 73 emerging market rated sovereigns between 1995 and
2015, we find no support for the often cited hypothesis that high inflation might increase the
27
relative creditworthiness of local currency obligations. Consistent with the default evidence
found in other studies, sovereigns’ willingness to inflate away their local debt appears to be
limited, and higher inflation can even diminish the relative standing of local currency
obligations.
At the same time, we find support for the hypotheses that higher FX reserves, lesser
reliance on foreign currency borrowing (declining original sin), greater banking sector
exposure to government debt and lower global risk and volatility can narrow the gap. Among
the explanatory variables, it is higher FX reserves that appears to have the most power to
explain the trend decline of the gap among EMEs.
The analysis of this paper has focused on emerging markets, but it would be of interest to
extend the analysis to advanced economies. In many such jurisdictions, government debt
burdens have been growing inexorably, and the value of the monetization option is more
frequently entering public discourse.
Our results suggest there is little reason to think that the convergence of foreign and local
currency risks is necessarily a permanent phenomenon. Particularly if FX reserves start to
drain, foreign currency borrowing rebounds, and global volatility rises further, the distinction
between local and foreign currency credits risks might once again grow in importance.

28
References
Acharya, Viral, Itamar Drechsler and Philipp Schnabl, 2014, “A Pyrrhic Victory? Bank Bailouts
and Sovereign Credit Risk”, Journal of Finance, vol. 69, pp. 2689-2739.
Amstad, Marlene and Frank Packer, 2015, “Sovereign ratings of Advanced and Emerging
Economies after the crisis,” BIS Quarterly Review, December.
Amstad, Marlene, Eli Remolona and Jimmy Shek, 2016, “How do Global Investors
Differentiate Between Sovereign Risks? The New Normal versus the Old,” Journal of
International Money and Finance, vol. 66 (September).
Amstad, Marlene, Steven Kong, Frank Packer and Eli Remolona, 2016, “A spare tire for capital
markets: Fostering corporate bond markets in Asia.” BIS Papers, No. 85.
Augustin, Patrick, Michael Chernov and Dongho Song, 2017, “Sovereign Credit Risk and
Exchange Rates: Evidence from CDS Quanto Spreads”, Technical Report, McGill University.
Bank for International Settlements,2013, ‘Treatment of sovereign risk in the Basel capital
framework”, BIS Quarterly Review, December.
Bank for International Settlements,2016, 86th Annual Report.
Bar-Isaac, Heski and Joel Shapiro, 2013, “Ratings quality over the business cycle”, Journal of
Financial Economics, vol. 108, pp. 62–78.
Basel Committee on Banking Supervision (BCBS), 2017, “The regulatory treatment of
sovereign exposures,” BCBS Discussion Paper, December.
Bordo, Michael, Barry Eichengreen, Daniella Klingebiel, Maria Soledad Martinez-Peria and
Andrew Rose, 2001, “Is the Crisis Problem Growing More Severe?” Economic Policy, April,
pp 52-82.
Becker, Bo, and Todd Milbourn, 2011, “How Did Increased Competition Affect Credit Ratings.”
Journal of Financial Economics 101 (3): 493–514.
Borio, Claudio and Frank Packer, 2004, “Assessing new perspectives on country risk,” BIS
Quarterly Review, December.
Cantor, Richard and Frank Packer, 1996, “Determinants and impact of sovereign credit ratings,”
FRBNY Economic Policy Review, October.
29
Cochrane, John, 2011, “Presidential Address: Discount Rates”, Journal of Finance, Volume 66
(August), pp. 1047–1108
Cosset, Jean-Claude, and Jeanneret, Alexandre, 2014, “Sovereign credit risk and government
effectiveness”, Working Paper, HEC, Montreal.
Dilly, Mark and Thomas Mahlmann, 2016, “Is there a ‘Boom Bias’ in Agency Ratings?” Review
of Finance, 20 (May), 979-1011.
Du, Wenxin and Jesse Schreger, 2016, “Local Currency Sovereign Risk”, Journal of Finance,
71 (June), 1027-1070.
Eichengreen, Barry and Ricardo Haussman, 1999, “Exchange Rates and Financial Fragility”,
New Challenges for Monetary Policy. Federal Reserve Bank of Kansas City.
Eichengreen, Barry, Ricardo Hausman and Ugo Panizza, 2007, “Currency mismatches, debt
intolerance and original sin: why they are not the same and why it matters,” in Capital Controls
and Capital Flows in Emerging Economies: Policies, Practices and Consequences, NBER
Volume, University of Chicago Press.
Eichengreen, Barry and Ashoka Mody, 2000,"What Explains Changing Spreads on Emerging
Market Debt?", in Capital Flows and the Emerging Economies: Theory, Evidence, and
Controversies, National Bureau of Economic Research, pp. 107-134.
Eichengreen, Barry and Ashoka Mody, 2004, “Do Collective Action Clauses Raise Borrowing
Costs?” The Economic Journal, 114 (April), 247-264.
Engel, Charles and JungJae Park, 2017, “Debauchery and Original Sin: The Currency
Composition of Sovereign Debt”, mimeo.
Ferri, G., Liu, L.G. and G. Majnoni, 2001, “The role of rating agency assessments in less
developed countries: Impact of the proposed Basel guidelines”, Journal of Banking and
Finance, vol. 25 (1), pp. 115-148.
Financial Stability Board (FSB), 2014, “Thematic Review on FSB principles for reducing
reliance on CRA ratings,” May.
FitchRatings, 1998, “The rating impact of the euro”, Sovereign comment, June.
Flandreau, Marc, Gaillard, Norbert, and Frank Packer, 2011, “To err is human: credit rating
agencies and the interwar foreign government debt crisis", European Review of Economic
History, vol 15 (3), pp 495-538.
Forbes, Kristin J. and Francis Warnock, 2012, “Capital flow waves: Surges, stops, flight, and
retrenchment”, Journal of International Economics, vol. 88 (2), pp. 235-251.

30
Gennaioli, Nicola, Alberto Martin and Stefano Rossi, 2014, “Sovereign default, domestic banks,
and financial institutions”, Journal of Finance vol. 69, pp. 819-866.
Goldstein, Morris and Philip Turner, 2004, Controlling currency mismatches in emerging
markets, Institute for International Economics, Washington.
Jeanneret, Alexandre and Slim Souissi, 2016, “Sovereign defaults by currency denomination”,
Journal of International Money and Finance, 60: 197-222.
Kisselev, Kate and Frank Packer, 2006, “Mind the gap in Asia,” BIS Papers No.30, 174-199.
Kumhof, Michael, and Evan Tanner, 2008, “Government debt: A key role in financial
intermediation”, in Carmen M. Reinhart, Carlos Vegh, and Andres Velasco, eds.: Money, Crises
and Transition, Essays in Honor of Guillermo A. Calvo.MIT press, Cambridge, MA.
Packer, Frank, 2003, “Mind the gap: domestic versus foreign currency sovereign ratings”, BIS
Quarterly Review, September, 55-63.
Pan, Jun and Kenneth Singleton, 2008, "Default and Recovery Implicit in the Term Structure
of Sovereign CDS Spreads”, Journal of Finance, vol 63, pp. 2345—2384.
Ratha, Dilip, Prabal K. De and Sanket Mohapatra, 2010, “Shadow sovereign ratings for unrated
developing countries”, World Development 39 (3), 295-307.
Reinhart, Carmen and Kenneth Rogoff, 2009, This Time is Different: Eight Centuries of
Financial Folly, Princeton University Press, Princeton.
Reinhart, Carmen and Kenneth Rogoff, 2011, “The forgotten history of domestic debt”,
Economic Journal, vol 121.

31
TABLES
Emerging economies (73)1 Table 1
Emerging Asia (13) Bangladesh, China, Chinese Taipei, Fiji, India, Indonesia, Korea,
Malaysia, Pakistan, Philippines, Sri Lanka, Thailand, Vietnam
Latin America (20) Argentina, Bahamas, Barbados, Belize, Bolivia, Brazil, Chile, Colombia,
Costa Rica, Dominican Republic, Ecuador, Guatemala, Jamaica, Mexico,
Panama, Paraguay, Peru, Trinidad and Tobago, Uruguay, Venezuela
Emerging Europe (22) Albania, Belarus, Bosnia & Herzegovina, Bulgaria, Croatia,
Czech Republic, Estonia, Hungary, Georgia, Kazakhstan, Latvia,
Lithuania, Macedonia, Montenegro, Poland, Romania, Russia, Serbia,
Slovakia, Slovenia, Turkey, Ukraine
Middle East and N. Africa (9) Bahrain, Egypt, Jordan, Kuwait, Lebanon, Morocco, Oman, Qatar, Saudi
Arabia
Sub-Sahara Africa (9) Botswana, Democratic Republic of Congo, Gabon, Ghana, Kenya,
Nigeria, Senegal, South Africa, Uganda
1 MSCI classification excluding AAA

32
Variables related to hypotheses (1)-(5) Table 2a
Definitions
YCPI Inflation, average consumer prices (In per cent)
FX International reserves excl gold (As a percentage of GDP)
OSIN_NARROW Max (1 – (securities in currency i / securities issued by country i), 0)
OSIN_BROAD Max (securities and loans issued by country i in five major currencies /
all securities and loans issued by country i, OSIN_NARROW)
BANK Domestic banks’ holdings of public debt using financial institutions’
net claims to the government relative to their total assets, following
Gennaioli et al (2014) and Kumhof and Tanner (2008):
Sum of net claims minus liabilities on (central govt, local govt and
public non-financial) / sum of net claims minus liabilities on (public
and private sector (excluding claims on depository corporations by
other financial corporations) by i) other depository corporations
(excluding central banks) and ii) other financial corporations
VIX Chicago Board Options Exchange S&P 500 implied volatility index;
standard deviation (In percentage points per annum)
Control variables Table 2b
Definitions
PD General government gross debt (As a percentage of GDP)
IR General government expense, interest (As a percentage of general
government revenue)
STD Consolidated cross-border claims of all BIS reporting banks on countries
outside the reporting area with a maturity of up to one year plus
international debt securities outstanding with a remaining maturity of
up to one year (As a percentage of GDP)
dlog(YD) Gross domestic product per capita, constant prices, changes in logarithm
TI Corruption perception index (0-100) from Transparency International,
which scores and ranks countries/territories based on how corrupt a
country’s public sector is perceived to be. It is a composite index, a
combination of surveys and assessments of corruption, collected by a
variety of reputable institutions.
DR 1/number of years since latest default
D4 Exchange rate regime: free floating = 1; otherwise = 0
33
Descriptive statistics for all EMEs
Table 3
Variables Mean Med Std Min Max
YCPI 6.180 4.395 6.846 -1.6 55.035
FX 19.50 15.88 14.84 0.78 98.08
OSIN_BROAD 0.915 0.968 0.160 0.019 1
OSIN_NARROW 0.725 0.926 0.373 0 1
BANK 23.94 17.36 28.68 -31.55 169.22
VIX 20.91 17.80 6.61 12.70 32.69
PD 43.68 38.51 27.61 1.58 185.19
IR 11.10 7.80 10.92 0.09 74.92
STD 11.11 7.234 14.44 0.338 122.16
dlog(YD) 0.067 0.076 0.127 -0.433 0.423
TI 39.10 37 11.93 17 75
DR 0.035 0 0.126 0 1
D4 0.048 0 0.213 0 1

34
Multinomial ordered logistic regressions for EME economies (19 rating
categories) with country fixed effects Table 4
Foreign1, 2 Local1, 3
i ii iii iv
YCPI -0.103*** (-5.64) -0.056*** (-3.72) -0.134*** + (-5.21) -0.103*** (-3.75)
FX 0.058*** (4.30) 0.072*** (6.22) 0.026 + (1.49) 0.052*** + (3.15)
OSIN_BROAD -8.563*** (-7.79) -2.444** + (-2.10)
OSIN_NARROW -2.888*** (-5.98) -1.067* + (-1.87)
BANK -0.012** (-2.05) -0.024*** (-4.24) -0.023*** + (-3.42) -0.033*** + (-4.38)
VIX -0.051*** (-4.25) -0.028** (-2.55) -0.024* + (-1.70) 0.003 + (0.21)
PD -0.105*** (-11.02) -0.131*** + (-10.62)
IR -0.136*** (-6.31) -0.088*** + (-3.21)
STD 0.031** (2.35) 0.030** (2.23) 0.011 + (0.70) 0.040** + (2.49)
dlog(YD) -0.117 (-0.17) 1.631*** (2.62) -0.186 (-0.23) 1.956*** (2.63)
TI 0.096*** (4.76) 0.078*** (3.93) 0.082*** (3.30) 0.041* + (1.68)
DR -3.068*** (-3.80) -3.052*** (-3.68) -5.135*** (-3.29) -7.606*** (-4.53)
D4 -0.079 (-0.14) -0.211 (-0.38) -0.920 (-1.63) -1.111** (-2.11)
Pseudo R2 0.4806 0.4403 0.5010 0.4554
Country fixed effect Y Y Y Y
Period fixed effect N N N N
Groups (N) 56 56 47 47
Periods (T) 21 21 19 19
Observations 673 683 500 499
+ indicates coefficients that are significantly different (at 10 % level) from the parallel regressions with foreign currency rating.
1 The average of Moody’s, Standard & Poor’s and Fitch ratings. Numerical values for ratings are attached to ratings as follows:
Ca/CC = 1, Caa3/CCC– = 2, Caa2/CCC = 3, Caa1/CCC+= 4, B3/B– = 5 and so on up to Aa1/AA+ = 19. 2 Long term foreign
currency rating. 3 Long term local currency rating.

35
Trinominal ordered logistic gap regressions with country fixed effects Table 5
(1) (2)
Gap1 Gap1
YCPI -0.154* (-1.66) 0.055 (0.64)
FX -0.229*** (-3.13) -0.164*** (-2.93)
OSIN_BROAD 55.94*** (5.65)
OSIN_NARROW 2.838* (1.91)
BANK -0.022* (-1.70) -0.080*** (-3.89)
VIX 0.157*** (4.14) 0.140*** (4.33)
PD -0.092** (-2.41)
IR 0.521*** (4.16)
STD -0.156* (-1.86) -0.154** (-2.06)
dlog(YD) -0.972 (-0.48) 1.392 (0.79)
TI -0.027 (-0.43) -0.104** (-1.97)
DR -1.145 (-0.00) -3.968 (-0.00)
D4 -1.309 (-0.55) 0.124 (0.09)
Pseudo R2 0.6943 0.6107
Country fixed effect Y Y
Period fixed effect N N
Groups (N) 47 47
Periods (T) 19 19
Observations 500 499
1 Rating gaps between foreign and local ratings are smaller than or equal to zero takes 1; those between zero and 1.5
take 2; all else greater than 1.5 takes 3.

36
ANNEX
OLS rating regressions for EME economies with country fixed effects Annex Table 1
Foreign1, 2 Local1, 3
i ii iii iv
YCPI -0.049*** (-6.25) -0.019*** (-3.22) -0.054*** (-5.14) -0.040*** (-3.03)
FX 0.034*** (5.37) 0.045*** (6.52) 0.016** (1.98) 0.023** (2.44)
OSIN_BROAD -4.007*** (-7.81) -1.038* (-1.81)
OSIN_NARROW -1.452*** (-5.01) -0.315 (-0.92)
BANK -0.008*** (-2.94) -0.011*** (-3.97) -0.016*** (-5.48) -0.019*** (-5.35)
VIX -0.020*** (-3.20) -0.010 (-1.36) -0.005 (-0.63) 0.011 (1.39)
PD -0.047*** (-11.22) -0.059*** (-11.98)
IR -0.075*** (-6.83) -0.062*** (-4.13)
STD 0.021*** (2.83) 0.019** (2.28) 0.007 (0.84) 0.021** (2.16)
Dlog(YD) 0.159 (0.46) 1.232*** (3.57) 0.067 (0.17) 1.258*** (3.00)
TI 0.047*** (4.53) 0.048*** (4.35) 0.043*** (3.56) 0.031** (2.31)
DR -1.595*** (-3.83) -1.849*** (-4.00) -2.325*** (-3.63) -4.119*** (-5.72)
D4 -0.024 (-0.08) -0.091 (-0.27) -0.305 (-1.04) -0.474 (-1.43)
Constant 14.671*** (19.66) 10.222*** (17.76) 14.339*** (17.64) 11.549*** (16.56)
Adj-R2 0.916 0.895 0.915 0.890
Country fixed effect Y Y Y Y
Period fixed effect N N N N
Fixed effect tests 36.48 (0.0000) 35.50 (0.0000) 34.33 (0.0000) 30.33 (0.0000)
Groups (N) 56 56 47 47
Periods (T) 21 21 19 19
Observations 673 683 500 499
1 The average of Moody’s, Standard & Poor’s and Fitch ratings. Numerical values for ratings are attached to ratings as
follows: Ca/CC = 1, Caa3/CCC– = 2, Caa2/CCC = 3, Caa1/CCC+= 4, B3/B– = 5 and so on up to Aaa/AAA = 20.
2 Long term foreign currency rating. 3 Long term local currency rating.
37
OLS gap regressions with
country fixed effects
Annex Table 2
Gap1
i ii
YCPI -0.01 (-1.02) -0.012* (-1.67)
FX -0.030*** (-6.12) -0.018*** (-3.49)
OSIN_BROAD 2.728*** (7.98)
OSIN_NARROW 0.654*** (3.44)
BANK -0.009*** (-4.99) -0.011*** (-5.66)
VIX 0.018*** (4.09) 0.022*** (4.77)
PD -0.011*** (-3.81)
IR 0.014* (1.73)
STD -0.010* (-1.93) -0.006 (-1.03)
dlog(YD) -0.189 (-0.82) 0.295 (1.27)
TI -0.023*** (-3.22) -0.031*** (-4.04)
DR -0.595 (-1.55) -0.781* (-1.95)
D4 -0.072 (-0.41) -0.162* (-0.88)
Constant 0.386 (0.80) 1.766*** (4.56)
Adj-R2 0.601 0.549
Country fixed effect Y Y
Period fixed effect N N
Fixed effect tests 10.17 (0.0000) 9.13 (0.0000)
Groups (N) 47 47
Periods (T) 19 19
Observations 500 499
1 Subtracted average long term foreign currency ratings from average
long term local currency ratings, rounded to the nearest integer.

38
Multinomial ordered logistic regressions for EME economies (19 rating
categories) with both country and time fixed effects Annex Table 3a
Foreign1, 2 Local1, 3
i Ii iii iv
YCPI -0.081*** (-4.14) -0.037** (-2.17) -0.119*** (-4.32) -0.098*** (-3.31)
FX 0.022 (1.59) 0.060*** (4.94) 0.036* (1.86) 0.064*** (3.64)
OSIN_BROAD -5.998*** (-5.09) -3.439*** (-2.60)
OSIN_NARROW -2.146*** (-4.21) -1.587*** (-2.59)
BANK -0.010* (-1.72) -0.029*** (-4.71) -0.028*** (-3.97) -0.033*** (-4.20)
PD -0.116*** (-11.47) -0.144*** (-11.16)
IR -0.088*** (-3.73) -0.119*** (-3.73)
STD 0.046*** (3.21) 0.039*** (2.63) 0.025 (1.49) 0.046*** (2.71)
dlog(YD) 0.241 (0.26) 2.768*** (3.38) 0.272 (0.25) 2.621** (2.51)
TI 0.069*** (3.17) 0.056*** (2.58) 0.074*** (2.69) 0.046* (1.73)
DR -2.500*** (-2.96) -2.375*** (-2.78) -5.623*** (-3.54) -8.803*** (-4.84)
D4 -0.656 (-1.16) -0.544 (-1.01) -0.939* (-1.67) -1.005* (-1.88)
Pseudo R2 0.5022 0.4540 0.5089 0.4596
Country fixed effect Y Y Y Y
Period fixed effect Y Y Y Y
Groups (N) 56 56 47 47
Periods (T) 21 21 19 19
Observations 673 683 500 499
1 The average of Moody’s, Standard & Poor’s and Fitch ratings. Numerical values for ratings are attached to ratings as follows:
Ca/CC = 1, Caa3/CCC– = 2, Caa2/CCC = 3, Caa1/CCC+= 4, B3/B– = 5 and so on up to Aaa/AAA = 20. 2 Long term foreign
currency rating. 3 Long term local currency rating.

39
Multinomial ordered logistic regressions for EME economies (19 rating
categories) with time fixed effects Annex Table 3b
Foreign1, 2 Local1, 3
i Ii iii iv
YCPI -0.083*** (-6.63) -0.050*** (-4.39) -0.135*** (-7.24) -0.113*** (-6.01)
FX 0.048*** (8.91) 0.031*** (6.04) 0.057*** (6.24) 0.028*** (3.21)
OSIN_BROAD -5.248*** (-10.16) -4.487*** (-8.12)
OSIN_NARROW -0.453** (-2.26) -0.446* (-1.79)
BANK 0.003 (0.96) 0.005 (1.53) -0.0001 (-0.02) 0.005 (1.06)
PD -0.046*** (-12.52) -0.044*** (-9.19)
IR -0.104*** (-11.07) -0.108*** (-7.93)
STD 0.008 (1.64) -0.035 (-0.75) -0.024*** (-3.22) -0.034*** (-4.21)
dlog(YD) -0.062 (-0.08) 0.471 (0.65) -1.190 (-1.24) -0.192 (-0.21)
TI 0.090*** (12.00) 0.100*** (13.42) 0.111*** (11.16) 0.113*** (11.56)
DR -5.289*** (-7.14) -6.228*** (-8.52) -6.850*** (-5.19) -9.078*** (-7.07)
D4 0.250 (0.77) 0.359 (1.15) 0.556 (1.61) 0.532 (1.57)
Pseudo R2 0.2183 0.1826 0.2410 0.2101
Country fixed effect N N N N
Period fixed effect Y Y Y Y
Groups (N) 56 56 47 47
Periods (T) 21 21 19 19
Observations 673 683 500 499
1 The average of Moody’s, Standard & Poor’s and Fitch ratings. Numerical values for ratings are attached to ratings as follows:
Ca/CC = 1, Caa3/CCC– = 2, Caa2/CCC = 3, Caa1/CCC+= 4, B3/B– = 5 and so on up to Aaa/AAA = 20. 2 Long term foreign
currency rating. 3 Long term local currency rating.

40
Multinomial ordered logistic regressions for EME economies (19 rating
categories) Annex Table 4
Foreign1, 2 Local1, 3
i ii iii iv
YCPI -0.1*** (-4.71) -0.064*** (-4.22) -0.147*** (-4.87) -0.146*** (-4.93)
YCPITIPS -0.007 (-0.23) 0.061** (2.13) 0.029 (0.82) 0.13*** (3.19)
BANK -0.012** (-2.04) -0.022*** (-3.68) -0.024*** (-3.48) -0.031*** (-4.05)
FX 0.057*** (4.3) 0.07*** (6.02) 0.026 (1.48) 0.047*** (2.79)
OSIN_BROAD -8.562*** (-7.79) -2.422** (-2.08)
OSIN_NARROW -2.832*** (-5.86) -0.849 (-1.47)
VIX -0.051*** (-4.26) -0.027** (-2.44) -0.023* (-1.65) 0.005 (0.37)
PD -0.105*** (-11.02) -0.131*** (-10.6)
IR -0.156*** (-6.53) -0.135*** (-4.33)
STD 0.031** (2.34) 0.031** (2.27) 0.012 (0.74) 0.042*** (2.62)
dlog(YD) -0.129 (-0.18) 1.617*** (2.59) -0.117 (-0.15) 2.191*** (2.89)
TI 0.096*** (4.76) 0.077*** (3.89) 0.081*** (3.29) 0.04 (1.64)
DR -3.063*** (-3.79) -3.178*** (-3.79) -5.118*** (-3.31) -7.998*** (-4.94)
D4 -0.086 (-0.15) -0.141 (-0.26) -0.888 (-1.57) -1.009* (-1.91)
Pseudo R2 0.4806 0.4415 0.5012 0.4595
Country fixed effect Y Y Y Y
Period fixed effect N N N N
Groups (N) 56 56 47 47
Periods (T) 21 21 19 19
Observations 673 683 500 499
+ indicates coefficients that are significantly different (at 10 % level) from the parallel regressions with foreign currency rating.
1 The average of Moody’s, Standard & Poor’s and Fitch ratings. Numerical values for ratings are attached to ratings as follows:
Ca/CC = 1, Caa3/CCC– = 2, Caa2/CCC = 3, Caa1/CCC+= 4, B3/B– = 5 and so on up to Aa1/AA+ = 19. 2 Long term foreign
currency rating. 3 Long term local currency rating.
41
Trinominal ordered logistic gap regressions Annex Table 5
(1) (2)
Gap1 Gap1
YCPI -0.434*** (-3.11) -0.012 (-0.12)
YCPITIPS 0.43*** (2.83) 0.187 (1.37)
BANK -0.019 (-1.53) -0.076*** (-3.64)
FX -0.262*** (-3.25) -0.166*** (-2.96)
OSIN_BROAD 60.654*** (5.55)
OSIN_NARROW 2.72* (1.85)
VIX 0.15*** (3.76) 0.137*** (4.18)
PD -0.113*** (-2.75)
IR 0.503*** (3.96)
STD -0.153** (-1.86) -0.144* (-1.9)
dlog(YD) -1.071 (-0.49) 1.835 (1.02)
TI 0.015 (0.23) -0.104** (-1.99)
DR 0.815 (0.00) 3.488 (0)
D4 -2.046 (-0.94) 0.094 (0.07)
Pseudo R2 0.7145 0.6151
Country fixed effect Y Y
Period fixed effect N N
Groups (N) 47 47
Periods (T) 19 19
Observations 500 499
1 Rating gaps between foreign and local ratings are smaller than or equal to zero takes 1; those between zero and 1.5
take 2; all else greater than 1.5 takes 3.
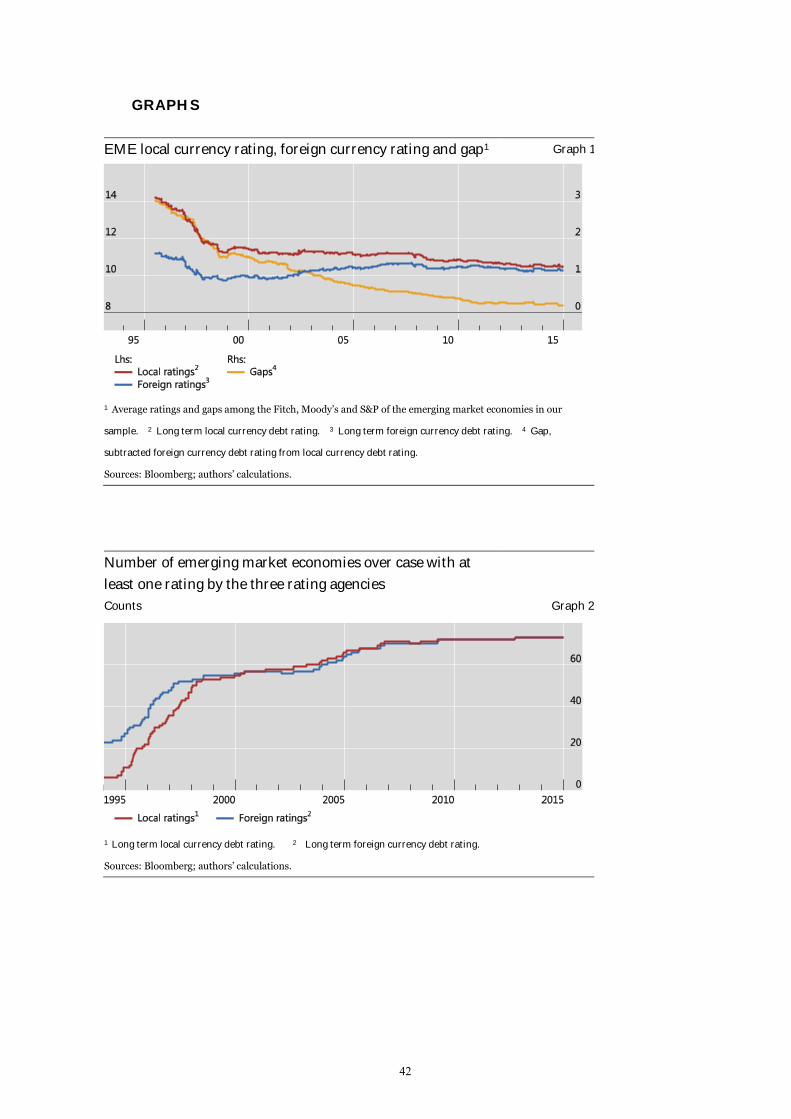
42
GRAPHS
EME local currency rating, foreign currency rating and gap1 Graph 1
1 Average ratings and gaps among the Fitch, Moody’s and S&P of the emerging market economies in our
sample. 2 Long term local currency debt rating. 3 Long term foreign currency debt rating. 4 Gap,
subtracted foreign currency debt rating from local currency debt rating.
Sources: Bloomberg; authors’ calculations.
Number of emerging market economies over case with at
least one rating by the three rating agencies
Counts Graph 2
1 Long term local currency debt rating. 2 Long term foreign currency debt rating.
Sources: Bloomberg; authors’ calculations.

43
Rating gaps between local and foreign ratings1: frequency of
outcome
In per cent Graph 3
1 Number of absolute difference between the local and foreign ratings for each rating agency. 2 Greater
than or equal to one notch but smaller than two notches; as a percentage of all ratings. 3 Greater than two
notches; as a percentage of all ratings.
Sources: Bloomberg; authors’ calculations.
Recommended