Quarterly Real Estate Analysis for DELHI NCRInsite
Price TrendsGrowth Drivers
Supply Analysis
October-December 2014
32
INTRODUCTION
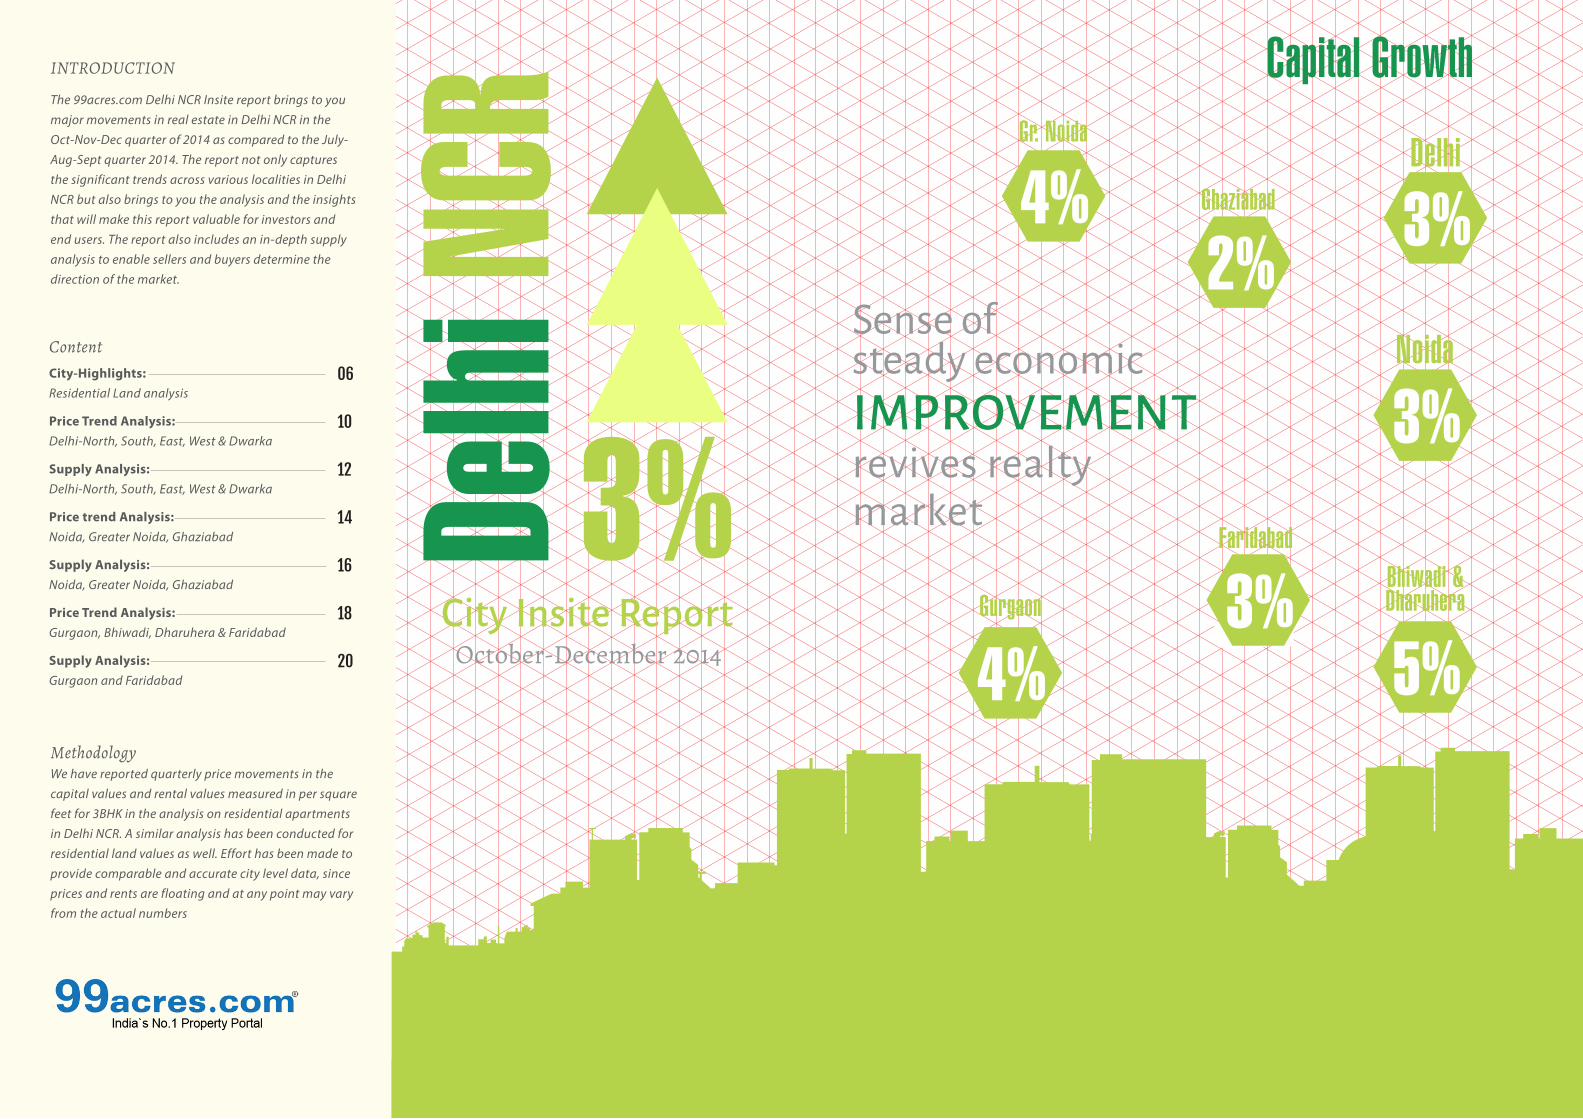
The 99acres.com Delhi NCR Insite report brings to you major movements in real estate in Delhi NCR in the Oct-Nov-Dec quarter of 2014 as compared to the July-Aug-Sept quarter 2014. The report not only captures the significant trends across various localities in Delhi NCR but also brings to you the analysis and the insights that will make this report valuable for investors and end users. The report also includes an in-depth supply analysis to enable sellers and buyers determine the direction of the market.
MethodologyWe have reported quarterly price movements in the capital values and rental values measured in per square feet for 3BHK in the analysis on residential apartments in Delhi NCR. A similar analysis has been conducted for residential land values as well. Effort has been made to provide comparable and accurate city level data, since prices and rents are floating and at any point may vary from the actual numbers
Sense of steady economic IMPROVEMENT revives realty market
City Insite ReportOctober-December 2014
Delhi
NCR
3%
3%Delhi
ContentCity-Highlights: Residential Land analysis
Price Trend Analysis: Delhi-North, South, East, West & Dwarka
Supply Analysis: Delhi-North, South, East, West & Dwarka
Price trend Analysis: Noida, Greater Noida, Ghaziabad
Supply Analysis: Noida, Greater Noida, Ghaziabad
Price Trend Analysis: Gurgaon, Bhiwadi, Dharuhera & Faridabad
Supply Analysis: Gurgaon and Faridabad
06
10
12
14
16
18
203%Faridabad
3%
Ghaziabad
2%
Gr. Noida
4%
Noida
3%
Gurgaon
4%
Bhiwadi & Dharuhera
5%
Capital Growth
54
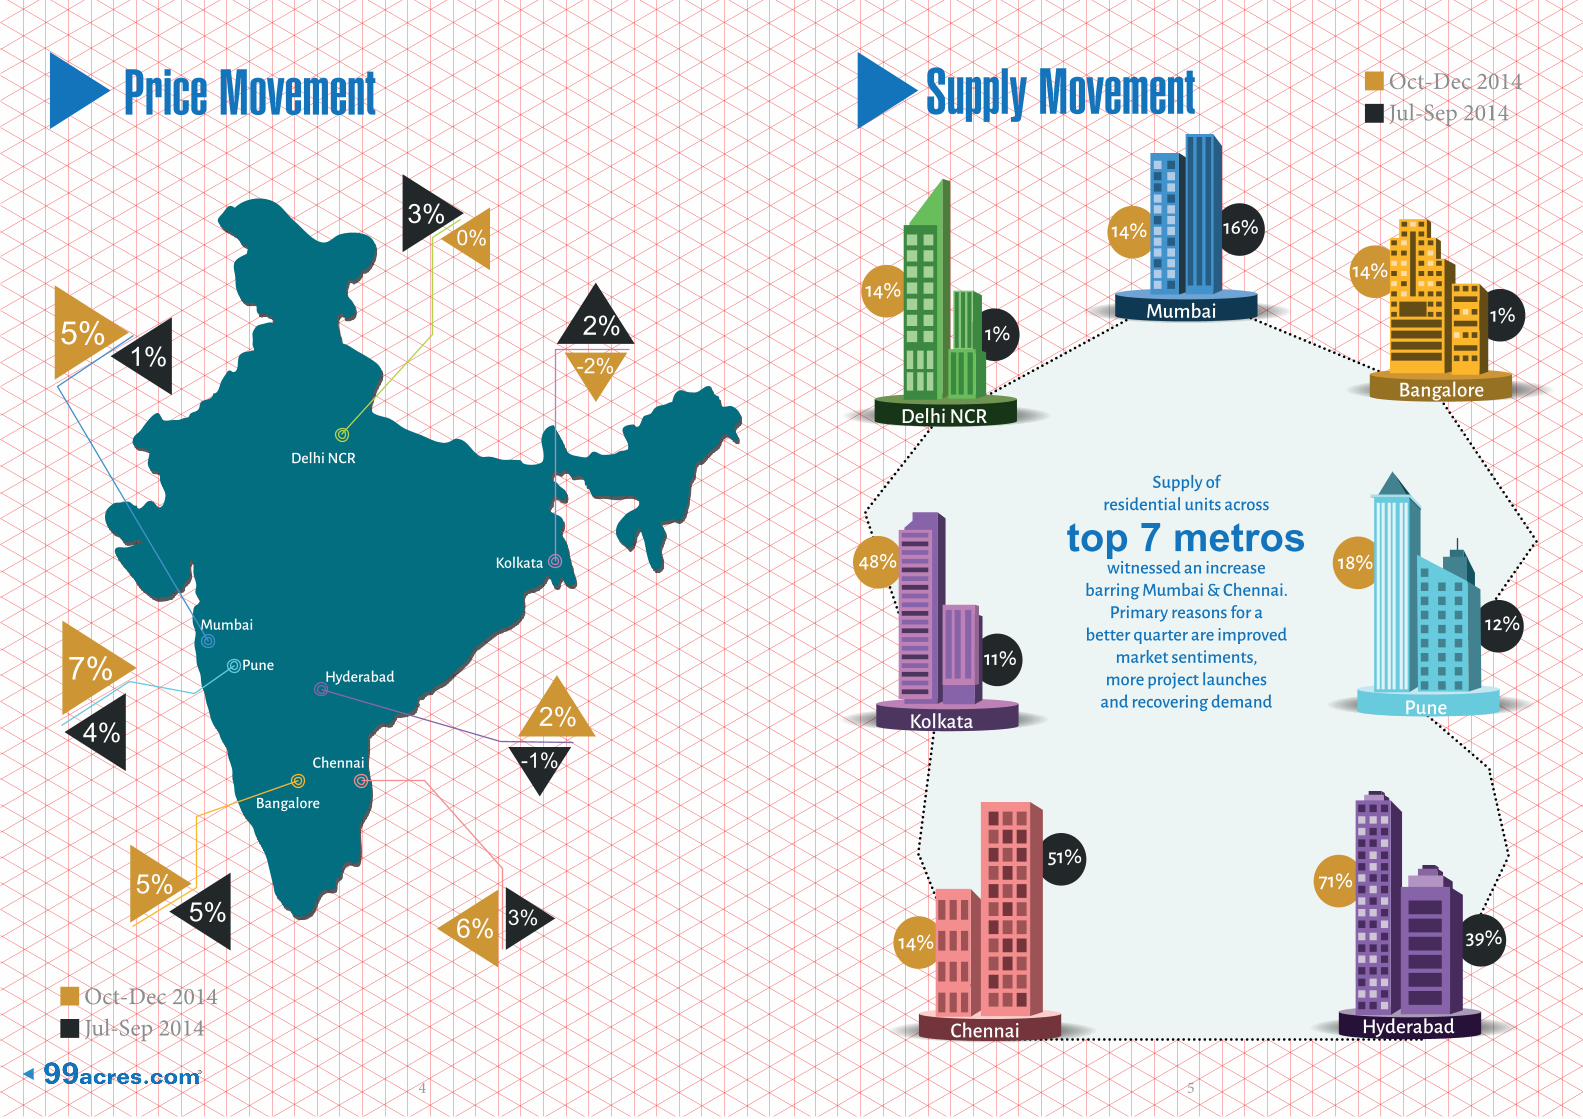
Price Movement Supply Movement
Supply of residential units across
top 7 metros witnessed an increase
barring Mumbai & Chennai. Primary reasons for a
better quarter are improved market sentiments,
more project launches and recovering demand
3%
3%
-1%
-2%
0%
6%
2%
2%
5%
4%
1%
5%
7%
5%
Delhi NCR
Mumbai
Bangalore
Hyderabad
Kolkata
Chennai
Pune
Kolkata
48%
11%
Mumbai
14% 16%
Delhi NCR
14%
1%
Pune
18%
12%
14%
1%
Bangalore
14%
51%
Chennai
71%
39%
Hyderabad
Oct-Dec 2014Jul-Sep 2014
Oct-Dec 2014Jul-Sep 2014
76
Delhi NCR
Ghaziabad
Noida
Faridabad
Gurgaon
Faridabad
Delhi North 2%Absence of new launches plague growth
Delhi West 5%Huge supply for ready to move inventory
Delhi East 3%
Subdued owing to depleting infrastructure
Delhi South 2%High-end inventory and limited buyer-baseGurgaon
4%High prices keep volumes low
Noida 3%Banking on Noida-Greater Noida Expressway
Faridabad 3%Sectors in Nehar Par on a growth spree
Ghaziabad 2%Trans-hindon localities recovering from last quarter's dip
Greater Noida 4%Metro link to Noida a major growth driver
Map 1: Average Price
Movements for different
zones in Delhi NCR
DELHI NCRCity Highlights
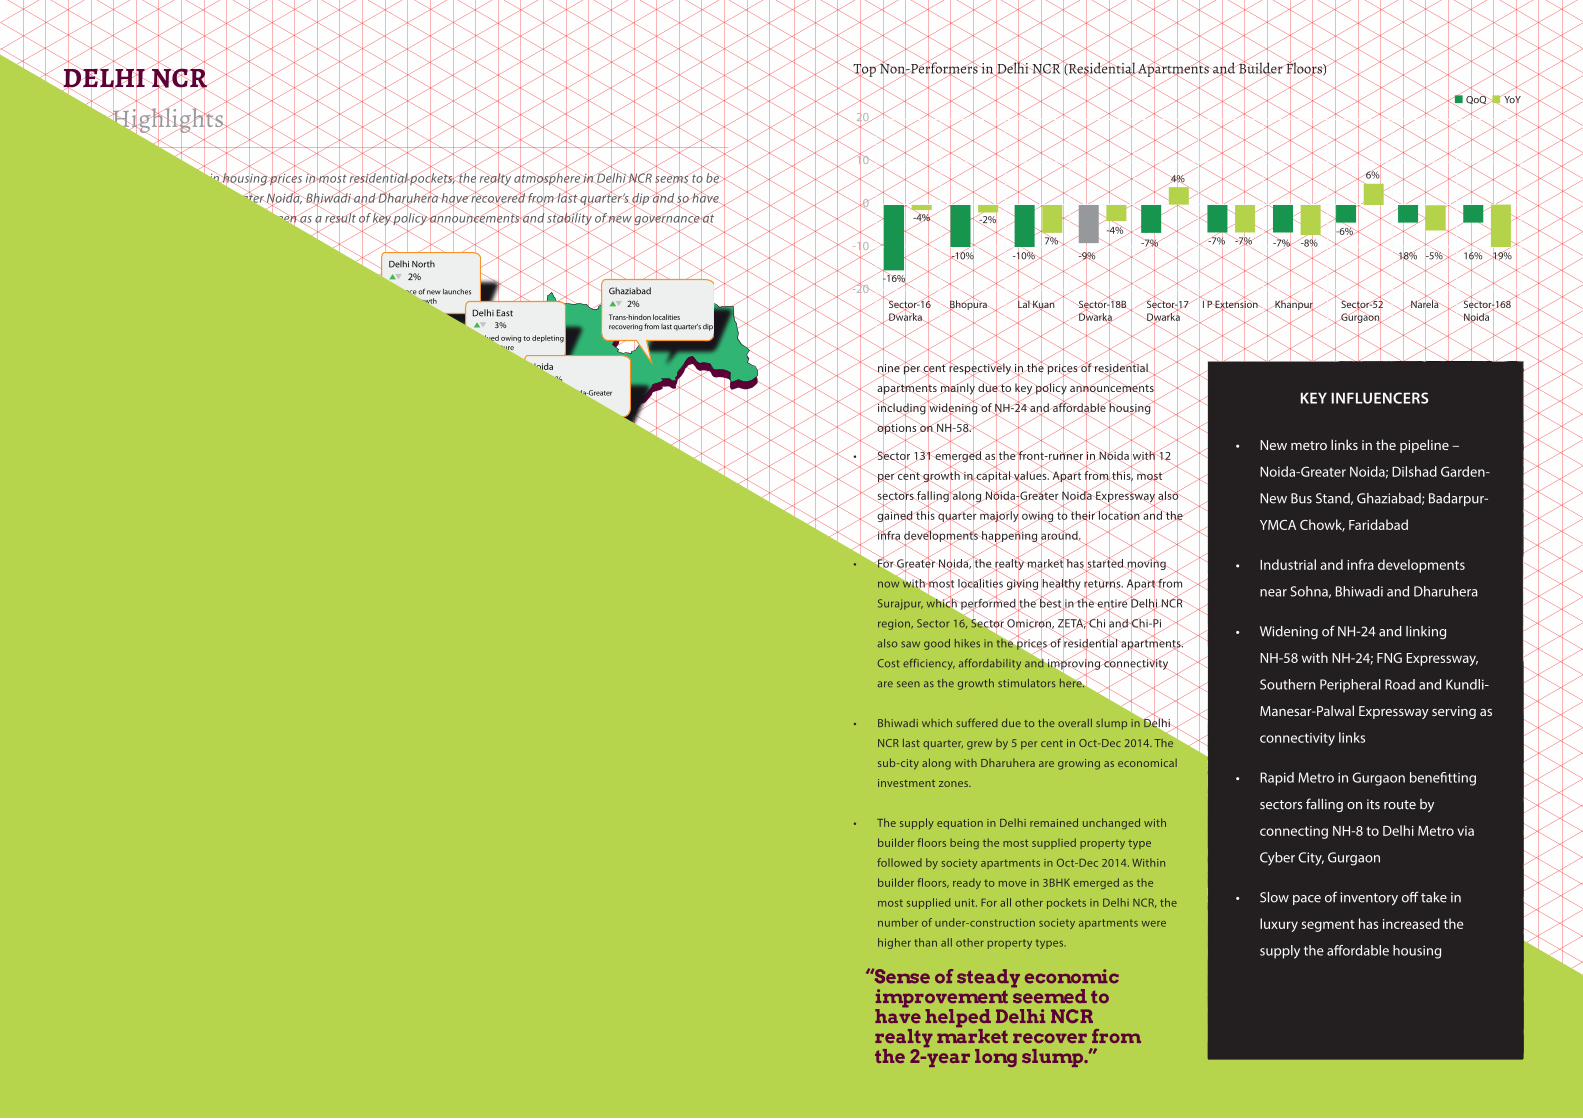
With healthy appreciation in housing prices in most residential pockets, the realty atmosphere in Delhi NCR seems to be improving. Micro-markets of Greater Noida, Bhiwadi and Dharuhera have recovered from last quarter’s dip and so have most localities in Delhi. This growth is seen as a result of key policy announcements and stability of new governance at the Center.
• SurajpurinGreaterNoidatoppedtheROI
chartsforDelhiNCRinOct-Dec2014with
20percentincreaseinthecapitalvalue
ofresidentialapartments.Thiswas
followedbySector31inGurgaon
andMayurViharIIIinEastDelhi
withanappreciationof18per
centeach.Someotherlocalities
inGurgaonthatfaredhighon
theROIchartincludeSushantLok
Phase-I(16percent),Sector-68and
59thatroseby15percenteachand
Sohnathatroseby13percent.
• Interestingly,inDelhi,alotof
localitiesrecoveredfromlastquarter’s
dipandshowedgoodgrowth.Some
ofthemincludePaschimVihar,Chattarpur,
VasantKunj,UttamNagar,RohiniandGreaterKailash.
Despitebeingsecondarymarkets,theselocalitiesrevived
duetobetterinvestorsentimentinOct-Dec2014in
comparisontothelastquarter.
• ForGhaziabadwhereeventhepopulartrans-hindon
localitiessawafallinpropertypriceslastquarter,this
quarterwasrewarding.WhilebothKaushambiand
Vasundharawitnessedsevenpercentcapitalappreciation,
housingpricesinVaishaliandIndirapuramjumpedupby
fiveandfourpercentrespectively.Thepresenceofgrowth
driverssuchasmetroandproximitytoNH24and
AnandViharISBTcanbeattributedtothepopularity
oftheselocalitiesamongbothendusersaswellas
investors.
• ThetwonationalhighwayscrossingGhaziabad,NH-
24andNH-58witnessedajumpofalmostsevenand
Top Performers in Delhi NCR (Residential Apartments and Builder Floors)
Top Non -Performers in Delhi NCR (Residential Apartments and Builder Floors)
KEY INFLUENCERS
• Newmetrolinksinthepipeline–
Noida-GreaterNoida;DilshadGarden-
NewBusStand,Ghaziabad;Badarpur-
YMCAChowk,Faridabad
• Industrialandinfradevelopments
nearSohna,BhiwadiandDharuhera
• WideningofNH-24andlinking
NH-58withNH-24;FNGExpressway,
SouthernPeripheralRoadandKundli-
Manesar-PalwalExpresswayservingas
connectivitylinks
• RapidMetroinGurgaonbenefitting
sectorsfallingonitsrouteby
connectingNH-8toDelhiMetrovia
CyberCity,Gurgaon
• Slowpaceofinventoryofftakein
luxurysegmenthasincreasedthe
supplytheaffordablehousing
“Sense of steady economic improvement seemed to have helped Delhi NCR realty market recover from the 2-year long slump.”
ninepercentrespectivelyinthepricesofresidential
apartmentsmainlyduetokeypolicyannouncements
includingwideningofNH-24andaffordablehousing
optionsonNH-58.
• Sector131emergedasthefront-runnerinNoidawith12
percentgrowthincapitalvalues.Apartfromthis,most
sectorsfallingalongNoida-GreaterNoidaExpresswayalso
gainedthisquartermajorlyowingtotheirlocationandthe
infradevelopmentshappeningaround.
• ForGreaterNoida,therealtymarkethasstartedmoving
nowwithmostlocalitiesgivinghealthyreturns.Apartfrom
Surajpur,whichperformedthebestintheentireDelhiNCR
region,Sector16,SectorOmicron,ZETA,ChiandChi-Pi
alsosawgoodhikesinthepricesofresidentialapartments.
Costefficiency,affordabilityandimprovingconnectivity
areseenasthegrowthstimulatorshere.
• BhiwadiwhichsufferedduetotheoverallslumpinDelhi
NCRlastquarter,grewby5percentinOct-Dec2014.The
sub-cityalongwithDharuheraaregrowingaseconomical
investmentzones.
• ThesupplyequationinDelhiremainedunchangedwith
builderfloorsbeingthemostsuppliedpropertytype
followedbysocietyapartmentsinOct-Dec2014.Within
builderfloors,readytomovein3BHKemergedasthe
mostsuppliedunit.ForallotherpocketsinDelhiNCR,the
numberofunder-constructionsocietyapartmentswere
higherthanallotherpropertytypes.
98
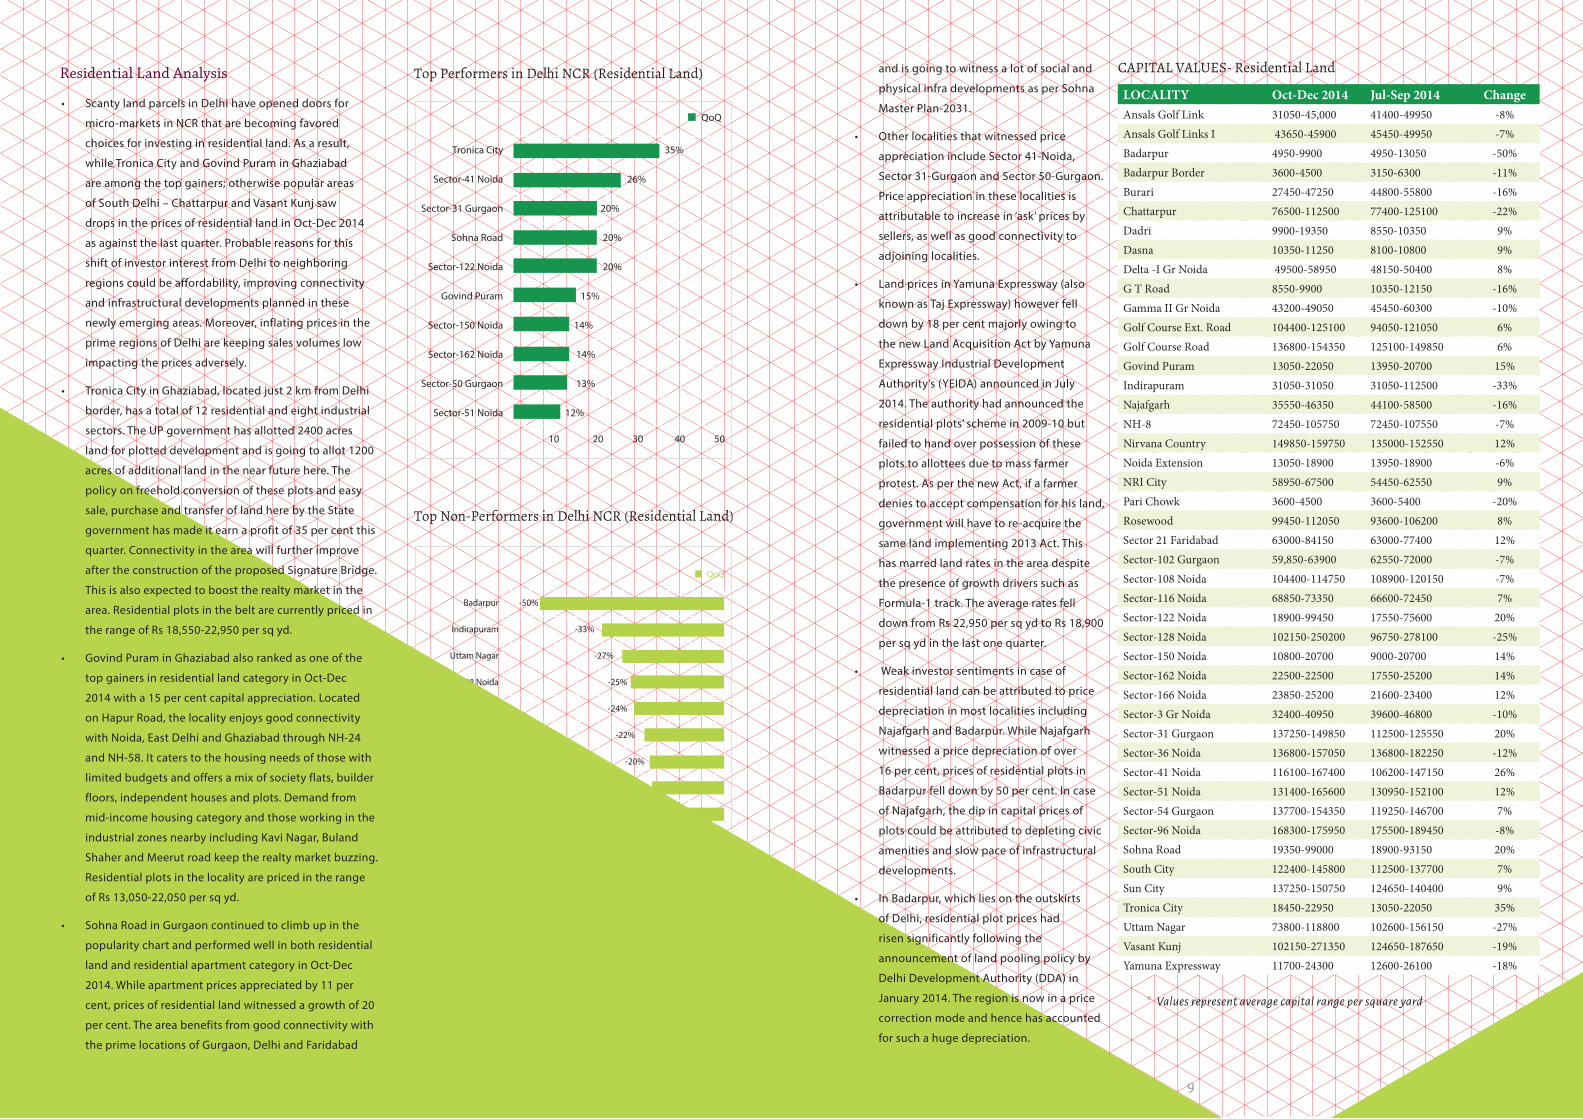
Top Performers in Delhi NCR (Residential Land)
Top Non-Performers in Delhi NCR (Residential Land)
“Availability of land parcels at economical rates and new policy on freehold plots has benefited Tronica City and Govind Puram in Ghaziabad.”
Residential Land Analysis
• ScantylandparcelsinDelhihaveopeneddoorsfor
micro-marketsinNCRthatarebecomingfavored
choicesforinvestinginresidentialland.Asaresult,
whileTronicaCityandGovindPuraminGhaziabad
areamongthetopgainers;otherwisepopularareas
ofSouthDelhi–ChattarpurandVasantKunjsaw
dropsinthepricesofresidentiallandinOct-Dec2014
asagainstthelastquarter.Probablereasonsforthis
shiftofinvestorinterestfromDelhitoneighboring
regionscouldbeaffordability,improvingconnectivity
andinfrastructuraldevelopmentsplannedinthese
newlyemergingareas.Moreover,inflatingpricesinthe
primeregionsofDelhiarekeepingsalesvolumeslow
impactingthepricesadversely.
• TronicaCityinGhaziabad,locatedjust2kmfromDelhi
border,hasatotalof12residentialandeightindustrial
sectors.TheUPgovernmenthasallotted2400acres
landforplotteddevelopmentandisgoingtoallot1200
acresofadditionallandinthenearfuturehere.The
policyonfreeholdconversionoftheseplotsandeasy
sale,purchaseandtransferoflandherebytheState
governmenthasmadeitearnaprofitof35percentthis
quarter.Connectivityintheareawillfurtherimprove
aftertheconstructionoftheproposedSignatureBridge.
Thisisalsoexpectedtoboosttherealtymarketinthe
area.Residentialplotsinthebeltarecurrentlypricedin
therangeofRs18,550-22,950persqyd.
• GovindPuraminGhaziabadalsorankedasoneofthe
topgainersinresidentiallandcategoryinOct-Dec
2014witha15percentcapitalappreciation.Located
onHapurRoad,thelocalityenjoysgoodconnectivity
withNoida,EastDelhiandGhaziabadthroughNH-24
andNH-58.Itcaterstothehousingneedsofthosewith
limitedbudgetsandoffersamixofsocietyflats,builder
floors,independenthousesandplots.Demandfrom
mid-incomehousingcategoryandthoseworkinginthe
industrialzonesnearbyincludingKaviNagar,Buland
ShaherandMeerutroadkeeptherealtymarketbuzzing.
Residentialplotsinthelocalityarepricedintherange
ofRs13,050-22,050persqyd.
• SohnaRoadinGurgaoncontinuedtoclimbupinthe
popularitychartandperformedwellinbothresidential
landandresidentialapartmentcategoryinOct-Dec
2014.Whileapartmentpricesappreciatedby11per
cent,pricesofresidentiallandwitnessedagrowthof20
percent.Theareabenefitsfromgoodconnectivitywith
theprimelocationsofGurgaon,DelhiandFaridabad
andisgoingtowitnessalotofsocialand
physicalinfradevelopmentsasperSohna
MasterPlan-2031.
• Otherlocalitiesthatwitnessedprice
appreciationincludeSector41-Noida,
Sector31-GurgaonandSector50-Gurgaon.
Priceappreciationintheselocalitiesis
attributabletoincreasein‘ask’pricesby
sellers,aswellasgoodconnectivityto
adjoininglocalities.
• LandpricesinYamunaExpressway(also
knownasTajExpressway)howeverfell
downby18percentmajorlyowingto
thenewLandAcquisitionActbyYamuna
ExpresswayIndustrialDevelopment
Authority’s(YEIDA)announcedinJuly
2014.Theauthorityhadannouncedthe
residentialplots’schemein2009-10but
failedtohandoverpossessionofthese
plotstoallotteesduetomassfarmer
protest.AsperthenewAct,ifafarmer
deniestoacceptcompensationforhisland,
governmentwillhavetore-acquirethe
samelandimplementing2013Act.This
hasmarredlandratesintheareadespite
thepresenceofgrowthdriverssuchas
Formula-1track.Theaverageratesfell
downfromRs22,950persqydtoRs18,900
persqydinthelastonequarter.
• Weakinvestorsentimentsincaseof
residentiallandcanbeattributedtoprice
depreciationinmostlocalitiesincluding
NajafgarhandBadarpur.WhileNajafgarh
witnessedapricedepreciationofover
16percent,pricesofresidentialplotsin
Badarpurfelldownby50percent.Incase
ofNajafgarh,thedipincapitalpricesof
plotscouldbeattributedtodepletingcivic
amenitiesandslowpaceofinfrastructural
developments.
• InBadarpur,whichliesontheoutskirts
ofDelhi,residentialplotpriceshad
risensignificantlyfollowingthe
announcementoflandpoolingpolicyby
DelhiDevelopmentAuthority(DDA)in
January2014.Theregionisnowinaprice
correctionmodeandhencehasaccounted
forsuchahugedepreciation.
LOCALITY Oct-Dec 2014 Jul-Sep 2014 ChangeAnsals Golf Link 31050-45,000 41400-49950 -8%Ansals Golf Links I 43650-45900 45450-49950 -7%Badarpur 4950-9900 4950-13050 -50%Badarpur Border 3600-4500 3150-6300 -11%Burari 27450-47250 44800-55800 -16%Chattarpur 76500-112500 77400-125100 -22%Dadri 9900-19350 8550-10350 9%Dasna 10350-11250 8100-10800 9%Delta -I Gr Noida 49500-58950 48150-50400 8%G T Road 8550-9900 10350-12150 -16%Gamma II Gr Noida 43200-49050 45450-60300 -10%Golf Course Ext. Road 104400-125100 94050-121050 6%Golf Course Road 136800-154350 125100-149850 6%Govind Puram 13050-22050 13950-20700 15%Indirapuram 31050-31050 31050-112500 -33%Najafgarh 35550-46350 44100-58500 -16%NH-8 72450-105750 72450-107550 -7%Nirvana Country 149850-159750 135000-152550 12%Noida Extension 13050-18900 13950-18900 -6%NRI City 58950-67500 54450-62550 9%Pari Chowk 3600-4500 3600-5400 -20%Rosewood 99450-112050 93600-106200 8%Sector 21 Faridabad 63000-84150 63000-77400 12%Sector-102 Gurgaon 59,850-63900 62550-72000 -7%Sector-108 Noida 104400-114750 108900-120150 -7%Sector-116 Noida 68850-73350 66600-72450 7%Sector-122 Noida 18900-99450 17550-75600 20%Sector-128 Noida 102150-250200 96750-278100 -25%Sector-150 Noida 10800-20700 9000-20700 14%Sector-162 Noida 22500-22500 17550-25200 14%Sector-166 Noida 23850-25200 21600-23400 12%Sector-3 Gr Noida 32400-40950 39600-46800 -10%Sector-31 Gurgaon 137250-149850 112500-125550 20%Sector-36 Noida 136800-157050 136800-182250 -12%Sector-41 Noida 116100-167400 106200-147150 26%Sector-51 Noida 131400-165600 130950-152100 12%Sector-54 Gurgaon 137700-154350 119250-146700 7%Sector-96 Noida 168300-175950 175500-189450 -8%Sohna Road 19350-99000 18900-93150 20%South City 122400-145800 112500-137700 7%Sun City 137250-150750 124650-140400 9%Tronica City 18450-22950 13050-22050 35%Uttam Nagar 73800-118800 102600-156150 -27%Vasant Kunj 102150-271350 124650-187650 -19%Yamuna Expressway 11700-24300 12600-26100 -18%
* Values represent average capital range per square yard
CAPITAL VALUES- Residential Land
1110
CAPITAL VALUES
RENTAL VALUES
* Values represent average capital and rental per sq ft rates
• TherentalmarketsofSaketinSouth
Delhi,PaschimViharinNorth-West
DelhiandmostsectorsintheDwarka
sub-citysawdecenttransactionsthis
quarter(Oct-DecvsJul-Sep2014).
• WhilerentalsinSaketclimbedby19
percent,thoseinPaschimViharrose
by18percent.Sectors13,18and19
inDwarkasawanincreaseofnineper
centeachintherentalrates.Presence
ofcivicamenitiesandmetroinallthese
localitiesmakethempopularamong
themassesforrentedaccommodations.
• TheuptrendinrentalratesinDwarka
canbeattributedtothepresenceofas
manyas10metrostationsandprice
competitivenessincomparisontoother
establishedlocalitiesinDelhi.
• InEastDelhi,MayurViharPhase1
witnesseda10percentincreasein
rentalrates.Thelocalityisamong
oneofthefavoredonesforrental
accommodationsduetoitsproximity
toNoidaandGhaziabadandalsodue
tothepresenceofsoundsocialaswell
asphysicalinfrastructure.Thesector
mostlyconsistsofDDAapartmentsand
hasasoundsecuritysysteminplace.
Amenitieslikemarkets,schoolsand
publicparksareample.
• KirtiNagarinWestDelhialsosawan
11percenthikeintherentalrates.The
localityconstitutesbuilderfloorsand
independenthousesandispopular
amongmigrantstudentsandworking
individualsasithasametrostationof
itsown.
• LocalitiesinDelhithatsawafallinthe
rentalratesincludeVasantViharand
HauzKhasinSouthDelhiandPitampura
andRohiniinNorth-WestDelhi.The
dropmaybeattributedtocorrections
inpreviouslyinflatedrentalratesin
theseareas.
Rental Analysis
LOCALITY Oct-Dec 2014 Jul-Sep 2014 ChangeAaya Nagar 3600 3500 3%Chattarpur 4900 4500 9%Greater Kailash 18500 18200 2%Greater Kailash II 21500 20000 8%I P Extension 11100 11900 -7%Janakpuri 12100 10950 11%Khanpur 3500 3750 -7%Lajpat Nagar 14450 14200 2%Mayur Vihar - I 13500 12850 5%Mayur Vihar - II 12000 12500 -4%Mayur Vihar - III 9000 7650 18%Mehrauli 4100 4000 3%Narela 4600 4900 -6%Paschim Vihar 10900 10000 9%Patparganj 11500 11650 -1%Pitampura 11250 11100 1%Rohini 11200 10800 4%Saket 15650 16150 -3%Sector-12 Dwarka 9550 9100 5%Sector-13 Dwarka 8600 8650 -1%Sector-13 Rohini 12950 11850 9%Sector-14 Dwarka 9050 8400 8%Sector-16 Dwarka 6650 7900 -16%Sector-17 Dwarka 8100 8700 -7%Sector-18A Dwarka 9250 9300 -1%Sector-18B Dwarka 7950 8700 -9%Sector-22 Dwarka 9250 9350 -1%Sector-4 Dwarka 8950 8600 4%Sector-5 Dwarka 8950 8650 3%Sector-9 Rohini 14300 13750 4%Sheikh Sarai 16100 14700 10%Vasant Kunj 15350 14400 7%
LOCALITY Oct-Dec 2014 Jul-Sep 2014 ChangeAnand Niketan 55 48 15%Hauz Khas 27 33 -18%Kirti Nagar 20 18 11%Lajpat Nagar 30 33 -9%Malviya Nagar 26 25 4%Mayur Vihar - I 23 21 10%Saket 31 26 19%Sarvodaya Enclave 27 31 -13%Sarvpriya Vihar 30 26 15%Shivalik 28 24 17%Vasant Vihar 35 44 -20%
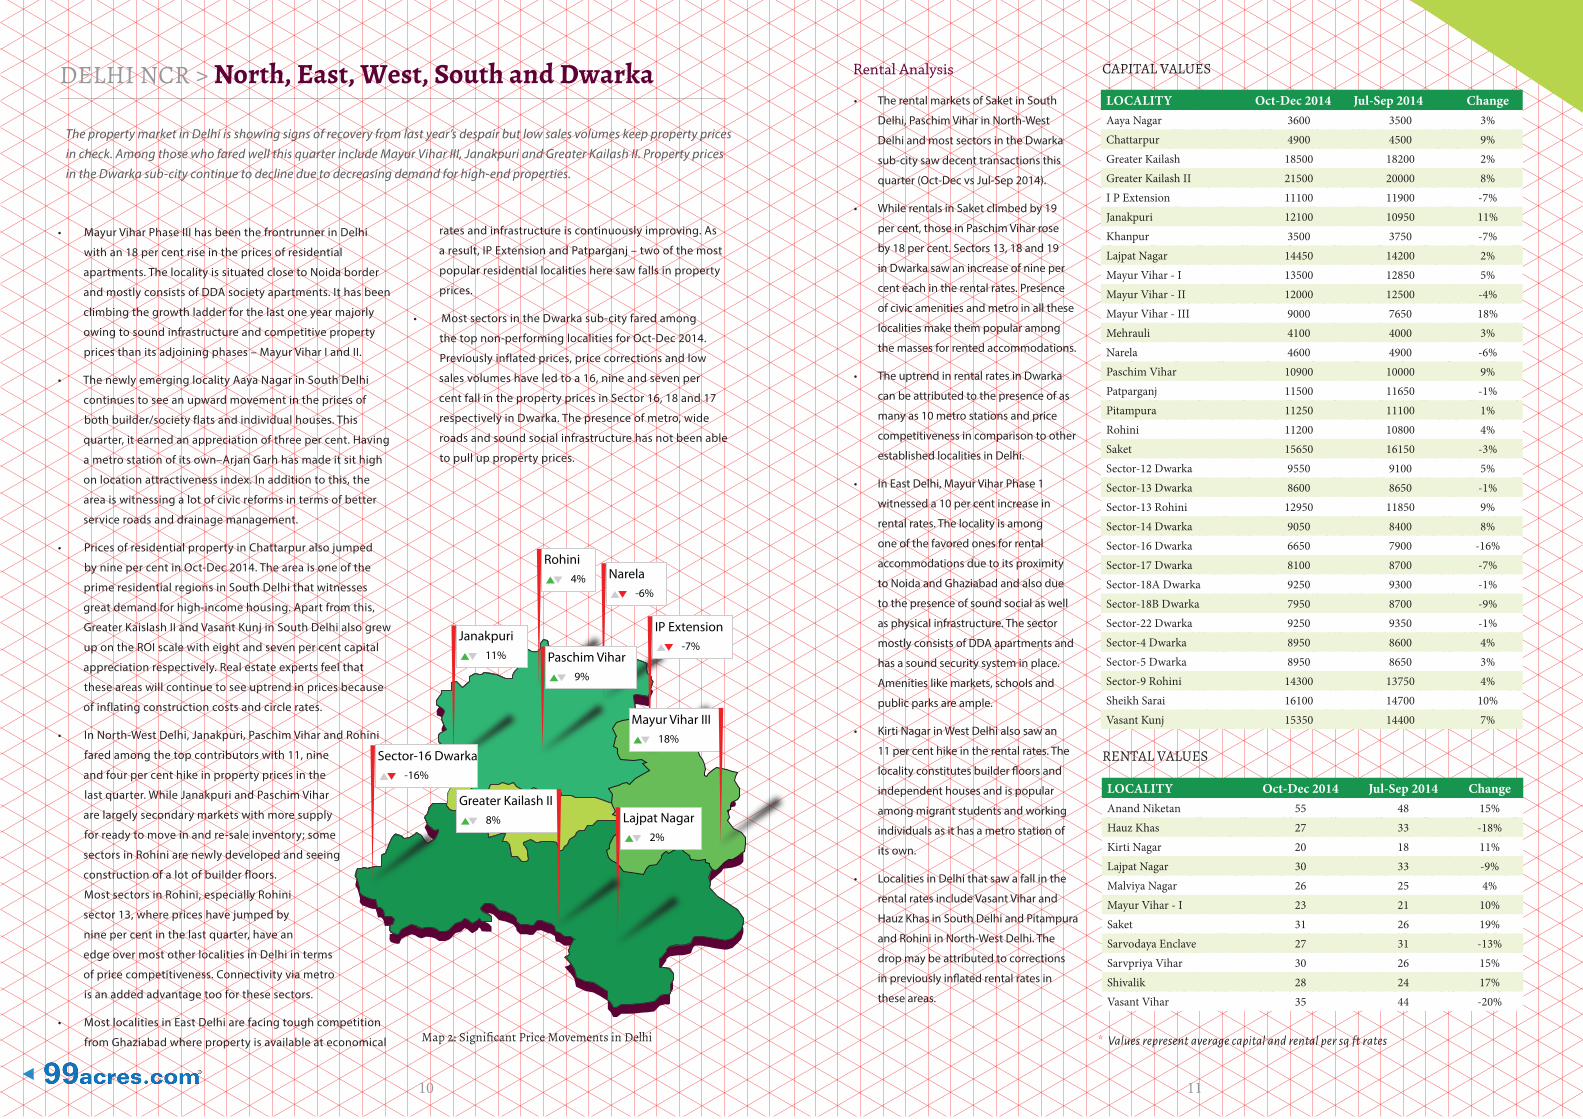
Janakpuri 11%
Rohini 4% Narela
-6%
IP Extension -7%
Paschim Vihar 9%
Lajpat Nagar 2%
Greater Kailash II 8%
Mayur Vihar III 18%
Sector-16 Dwarka -16%
DELHI NCR > North, East, West, South and Dwarka
The property market in Delhi is showing signs of recovery from last year’s despair but low sales volumes keep property prices in check. Among those who fared well this quarter include Mayur Vihar III, Janakpuri and Greater Kailash II. Property prices in the Dwarka sub-city continue to decline due to decreasing demand for high-end properties.
• MayurViharPhaseIIIhasbeenthefrontrunnerinDelhi
withan18percentriseinthepricesofresidential
apartments.ThelocalityissituatedclosetoNoidaborder
andmostlyconsistsofDDAsocietyapartments.Ithasbeen
climbingthegrowthladderforthelastoneyearmajorly
owingtosoundinfrastructureandcompetitiveproperty
pricesthanitsadjoiningphases–MayurViharIandII.
• ThenewlyemerginglocalityAayaNagarinSouthDelhi
continuestoseeanupwardmovementinthepricesof
bothbuilder/societyflatsandindividualhouses.This
quarter,itearnedanappreciationofthreepercent.Having
ametrostationofitsown–ArjanGarhhasmadeitsithigh
onlocationattractivenessindex.Inadditiontothis,the
areaiswitnessingalotofcivicreformsintermsofbetter
serviceroadsanddrainagemanagement.
• PricesofresidentialpropertyinChattarpuralsojumped
byninepercentinOct-Dec2014.Theareaisoneofthe
primeresidentialregionsinSouthDelhithatwitnesses
greatdemandforhigh-incomehousing.Apartfromthis,
GreaterKaislashIIandVasantKunjinSouthDelhialsogrew
upontheROIscalewitheightandsevenpercentcapital
appreciationrespectively.Realestateexpertsfeelthat
theseareaswillcontinuetoseeuptrendinpricesbecause
ofinflatingconstructioncostsandcirclerates.
• InNorth-WestDelhi,Janakpuri,PaschimViharandRohini
faredamongthetopcontributorswith11,nine
andfourpercenthikeinpropertypricesinthe
lastquarter.WhileJanakpuriandPaschimVihar
arelargelysecondarymarketswithmoresupply
forreadytomoveinandre-saleinventory;some
sectorsinRohiniarenewlydevelopedandseeing
constructionofalotofbuilderfloors.
MostsectorsinRohini,especiallyRohini
sector13,wherepriceshavejumpedby
ninepercentinthelastquarter,havean
edgeovermostotherlocalitiesinDelhiinterms
ofpricecompetitiveness.Connectivityviametro
isanaddedadvantagetooforthesesectors.
• MostlocalitiesinEastDelhiarefacingtoughcompetition
fromGhaziabadwherepropertyisavailableateconomical
ratesandinfrastructureiscontinuouslyimproving.As
aresult,IPExtensionandPatparganj–twoofthemost
popularresidentiallocalitiesheresawfallsinproperty
prices.
• MostsectorsintheDwarkasub-cityfaredamong
thetopnon-performinglocalitiesforOct-Dec2014.
Previouslyinflatedprices,pricecorrectionsandlow
salesvolumeshaveledtoa16,nineandsevenper
centfallinthepropertypricesinSector16,18and17
respectivelyinDwarka.Thepresenceofmetro,wide
roadsandsoundsocialinfrastructurehasnotbeenable
topulluppropertyprices.
Map 2: Significant Price Movements in Delhi
1312
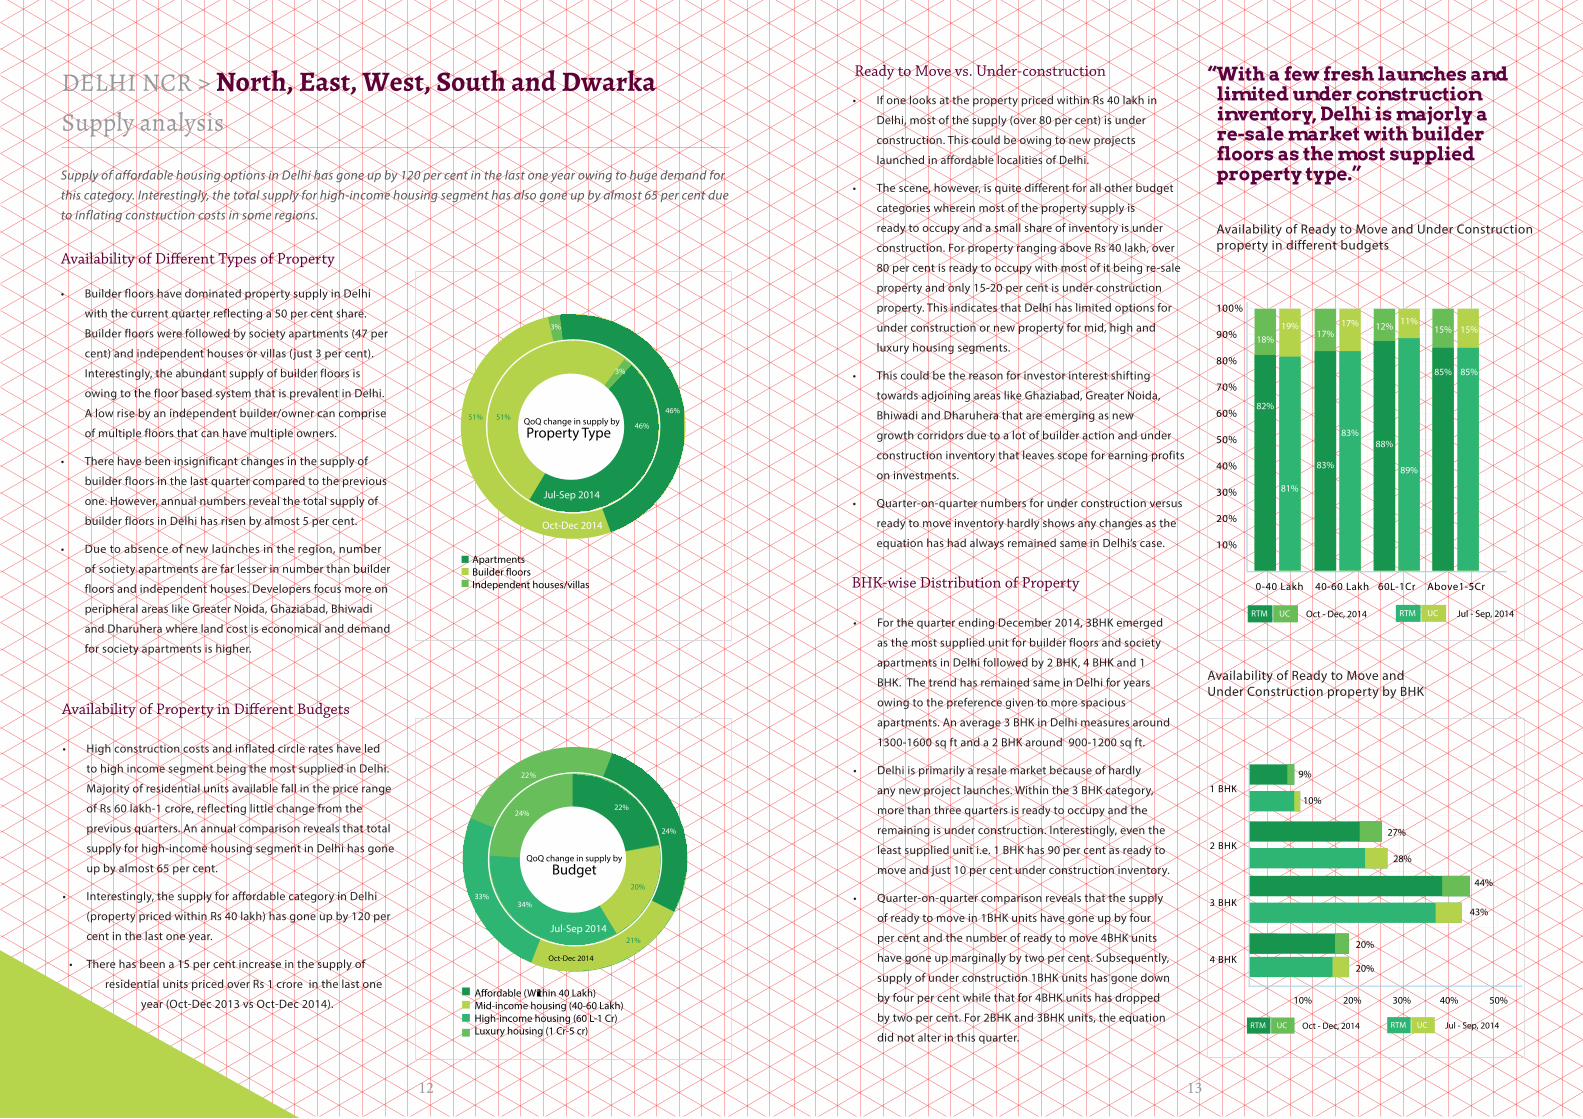
DELHI NCR > North, East, West, South and DwarkaSupply analysis
• BuilderfloorshavedominatedpropertysupplyinDelhi
withthecurrentquarterreflectinga50percentshare.
Builderfloorswerefollowedbysocietyapartments(47per
cent)andindependenthousesorvillas(just3percent).
Interestingly,theabundantsupplyofbuilderfloorsis
owingtothefloorbasedsystemthatisprevalentinDelhi.
Alowrisebyanindependentbuilder/ownercancomprise
ofmultiplefloorsthatcanhavemultipleowners.
• Therehavebeeninsignificantchangesinthesupplyof
builderfloorsinthelastquartercomparedtotheprevious
one.However,annualnumbersrevealthetotalsupplyof
builderfloorsinDelhihasrisenbyalmost5percent.
• Duetoabsenceofnewlaunchesintheregion,number
ofsocietyapartmentsarefarlesserinnumberthanbuilder
floorsandindependenthouses.Developersfocusmoreon
peripheralareaslikeGreaterNoida,Ghaziabad,Bhiwadi
andDharuherawherelandcostiseconomicalanddemand
forsocietyapartmentsishigher.
• Highconstructioncostsandinflatedcirclerateshaveled
tohighincomesegmentbeingthemostsuppliedinDelhi.
Majorityofresidentialunitsavailablefallinthepricerange
ofRs60lakh-1crore,reflectinglittlechangefromthe
previousquarters.Anannualcomparisonrevealsthattotal
supplyforhigh-incomehousingsegmentinDelhihasgone
upbyalmost65percent.
• Interestingly,thesupplyforaffordablecategoryinDelhi
(propertypricedwithinRs40lakh)hasgoneupby120per
centinthelastoneyear.
• Therehasbeena15percentincreaseinthesupplyof
residentialunitspricedoverRs1croreinthelastone
year(Oct-Dec2013vsOct-Dec2014).
Availability of Different Types of Property
Availability of Property in Different Budgets
Supply of affordable housing options in Delhi has gone up by 120 per cent in the last one year owing to huge demand for this category. Interestingly, the total supply for high-income housing segment has also gone up by almost 65 per cent due to inflating construction costs in some regions.
AvailabilityofReadytoMoveandUnderConstructionpropertyindifferentbudgets
AvailabilityofReadytoMoveandUnderConstructionpropertybyBHK
“With a few fresh launches and limited under construction inventory, Delhi is majorly a re-sale market with builder floors as the most supplied property type.”
• IfonelooksatthepropertypricedwithinRs40lakhin
Delhi,mostofthesupply(over80percent)isunder
construction.Thiscouldbeowingtonewprojects
launchedinaffordablelocalitiesofDelhi.
• Thescene,however,isquitedifferentforallotherbudget
categorieswhereinmostofthepropertysupplyis
readytooccupyandasmallshareofinventoryisunder
construction.ForpropertyrangingaboveRs40lakh,over
80percentisreadytooccupywithmostofitbeingre-sale
propertyandonly15-20percentisunderconstruction
property.ThisindicatesthatDelhihaslimitedoptionsfor
underconstructionornewpropertyformid,highand
luxuryhousingsegments.
• Thiscouldbethereasonforinvestorinterestshifting
towardsadjoiningareaslikeGhaziabad,GreaterNoida,
BhiwadiandDharuherathatareemergingasnew
growthcorridorsduetoalotofbuilderactionandunder
constructioninventorythatleavesscopeforearningprofits
oninvestments.
• Quarter-on-quarternumbersforunderconstructionversus
readytomoveinventoryhardlyshowsanychangesasthe
equationhashadalwaysremainedsameinDelhi’scase.
Ready to Move vs. Under-construction
• ForthequarterendingDecember2014,3BHKemerged
asthemostsuppliedunitforbuilderfloorsandsociety
apartmentsinDelhifollowedby2BHK,4BHKand1
BHK.ThetrendhasremainedsameinDelhiforyears
owingtothepreferencegiventomorespacious
apartments.Anaverage3BHKinDelhimeasuresaround
1300-1600sqftanda2BHKaround900-1200sqft.
• Delhiisprimarilyaresalemarketbecauseofhardly
anynewprojectlaunches.Withinthe3BHKcategory,
morethanthreequartersisreadytooccupyandthe
remainingisunderconstruction.Interestingly,eventhe
leastsupplieduniti.e.1BHKhas90percentasreadyto
moveandjust10percentunderconstructioninventory.
• Quarter-on-quartercomparisonrevealsthatthesupply
ofreadytomovein1BHKunitshavegoneupbyfour
percentandthenumberofreadytomove4BHKunits
havegoneupmarginallybytwopercent.Subsequently,
supplyofunderconstruction1BHKunitshasgonedown
byfourpercentwhilethatfor4BHKunitshasdropped
bytwopercent.For2BHKand3BHKunits,theequation
didnotalterinthisquarter.
BHK-wise Distribution of Property
1514
Greater Noida
Noida
Ghaziabad
Surajpur 20%
Chi - Phi 6%
NH-24 Higway 7%
Noida-Greater Noida Expressway 7%
Pari Chowk 3%
KAUSHAMBI 7%
GOVINDPURAM 8%
NOIDA EXT 5%
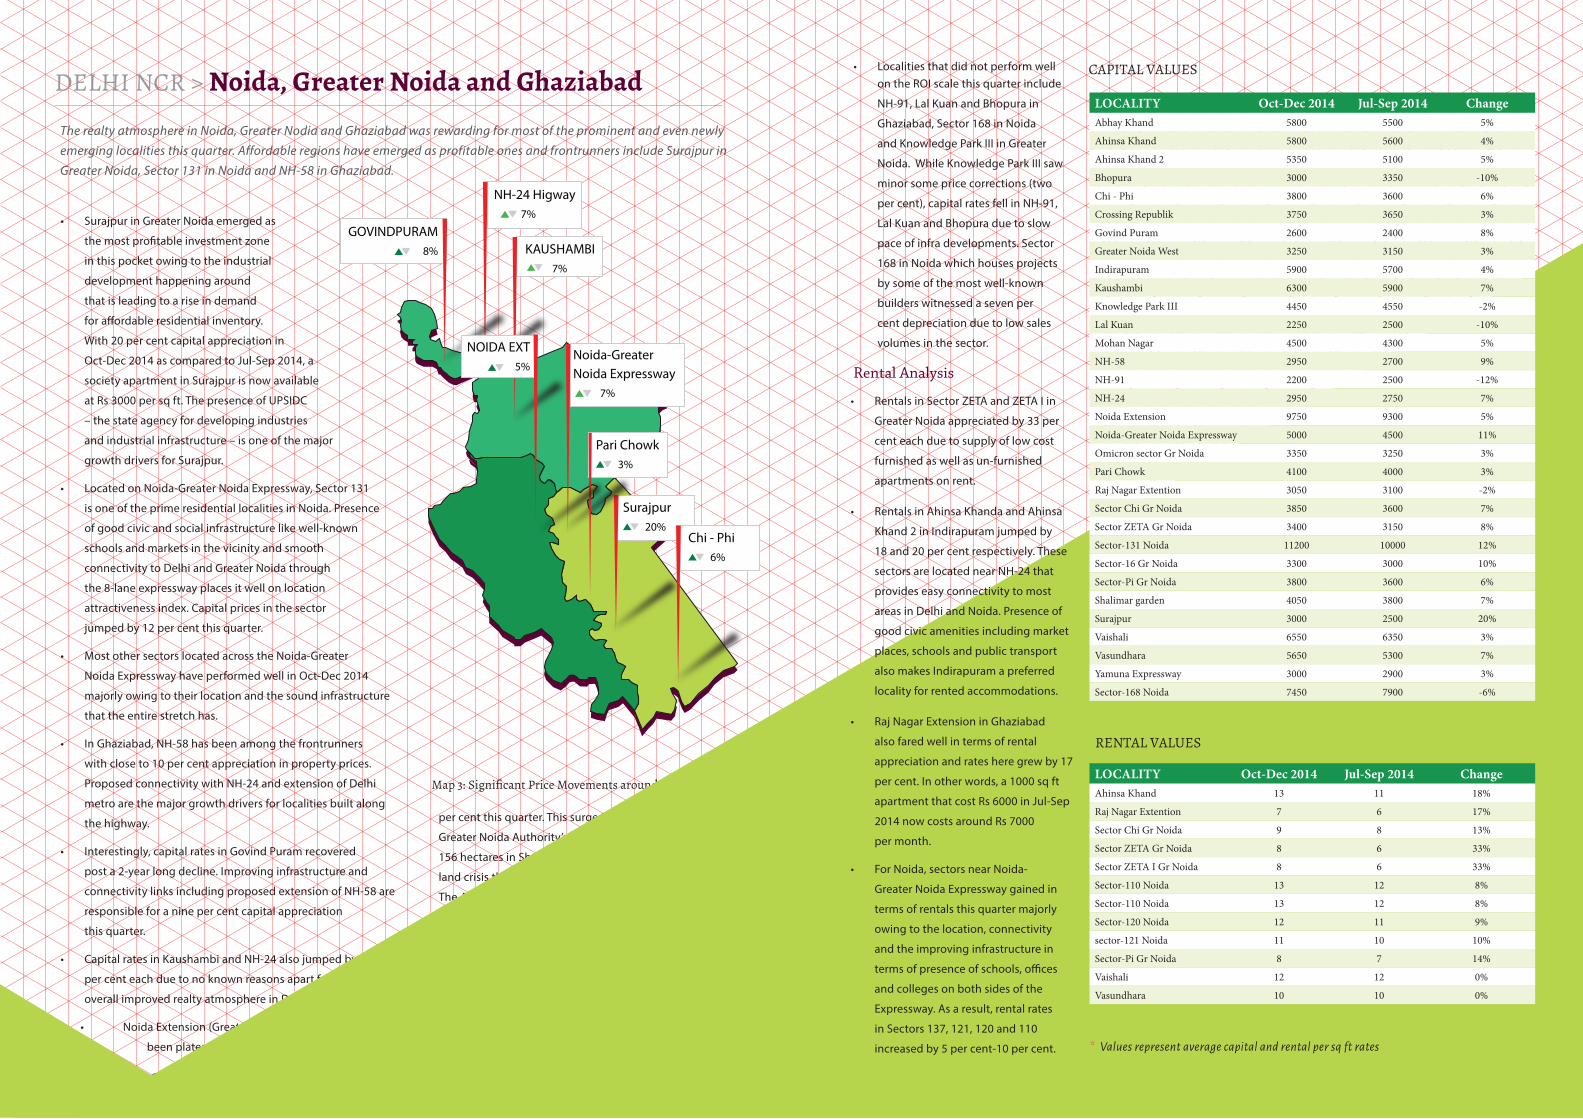
DELHI NCR > Noida, Greater Noida and Ghaziabad
• SurajpurinGreaterNoidaemergedas
themostprofitableinvestmentzone
inthispocketowingtotheindustrial
developmenthappeningaround
thatisleadingtoariseindemand
foraffordableresidentialinventory.
With20percentcapitalappreciationin
Oct-Dec2014ascomparedtoJul-Sep2014,a
societyapartmentinSurajpurisnowavailable
atRs3000persqft.ThepresenceofUPSIDC
–thestateagencyfordevelopingindustries
andindustrialinfrastructure–isoneofthemajor
growthdriversforSurajpur.
• LocatedonNoida-GreaterNoidaExpressway,Sector131
isoneoftheprimeresidentiallocalitiesinNoida.Presence
ofgoodcivicandsocialinfrastructurelikewell-known
schoolsandmarketsinthevicinityandsmooth
connectivitytoDelhiandGreaterNoidathrough
the8-laneexpresswayplacesitwellonlocation
attractivenessindex.Capitalpricesinthesector
jumpedby12percentthisquarter.
• MostothersectorslocatedacrosstheNoida-Greater
NoidaExpresswayhaveperformedwellinOct-Dec2014
majorlyowingtotheirlocationandthesoundinfrastructure
thattheentirestretchhas.
• InGhaziabad,NH-58hasbeenamongthefrontrunners
withcloseto10percentappreciationinpropertyprices.
ProposedconnectivitywithNH-24andextensionofDelhi
metroarethemajorgrowthdriversforlocalitiesbuiltalong
thehighway.
• Interestingly,capitalratesinGovindPuramrecovered
posta2-yearlongdecline.Improvinginfrastructureand
connectivitylinksincludingproposedextensionofNH-58are
responsibleforaninepercentcapitalappreciation
thisquarter.
• CapitalratesinKaushambiandNH-24alsojumpedbyseven
percenteachduetonoknownreasonsapartfromthe
overallimprovedrealtyatmosphereinDelhiNCR.
• NoidaExtension(GreaterNoidaWest)thathad
beenplateauingforoverayearjumpedbyfive
The realty atmosphere in Noida, Greater Nodia and Ghaziabad was rewarding for most of the prominent and even newly emerging localities this quarter. Affordable regions have emerged as profitable ones and frontrunners include Surajpur in Greater Noida, Sector 131 in Noida and NH-58 in Ghaziabad.
percentthisquarter.Thissurgeisseenastheresultof
GreaterNoidaAuthority’sannouncementofacquiring
156hectaresinShahberi-thevillageattheheartofthe
landcrisisthatgrippedNoidaExtensionthreeyearsago.
TheAuthorityislikelytocompletethere-acquisition
withintwomonths.
Map 3: Significant Price Movements around Noida
“Major highways including NH-24 and NH-58 in Ghaziabad and the Noida-Greater Noida Expressway are emerging as growth corridors. ”
CAPITAL VALUES• LocalitiesthatdidnotperformwellontheROIscalethisquarterinclude
NH-91,LalKuanandBhopurain
Ghaziabad,Sector168inNoida
andKnowledgeParkIIIinGreater
Noida.WhileKnowledgeParkIIIsaw
minorsomepricecorrections(two
percent),capitalratesfellinNH-91,
LalKuanandBhopuraduetoslow
paceofinfradevelopments.Sector
168inNoidawhichhousesprojects
bysomeofthemostwell-known
builderswitnessedasevenper
centdepreciationduetolowsales
volumesinthesector.
• RentalsinSectorZETAandZETAIin
GreaterNoidaappreciatedby33per
centeachduetosupplyoflowcost
furnishedaswellasun-furnished
apartmentsonrent.
• RentalsinAhinsaKhandaandAhinsa
Khand2inIndirapuramjumpedby
18and20percentrespectively.These
sectorsarelocatednearNH-24that
provideseasyconnectivitytomost
areasinDelhiandNoida.Presenceof
goodcivicamenitiesincludingmarket
places,schoolsandpublictransport
alsomakesIndirapuramapreferred
localityforrentedaccommodations.
• RajNagarExtensioninGhaziabad
alsofaredwellintermsofrental
appreciationandratesheregrewby17
percent.Inotherwords,a1000sqft
apartmentthatcostRs6000inJul-Sep
2014nowcostsaroundRs7000
permonth.
• ForNoida,sectorsnearNoida-
GreaterNoidaExpresswaygainedin
termsofrentalsthisquartermajorly
owingtothelocation,connectivity
andtheimprovinginfrastructurein
termsofpresenceofschools,offices
andcollegesonbothsidesofthe
Expressway.Asaresult,rentalrates
inSectors137,121,120and110
increasedby5percent-10percent.
Rental Analysis
RENTAL VALUES
LOCALITY Oct-Dec 2014 Jul-Sep 2014 ChangeAbhay Khand 5800 5500 5%
Ahinsa Khand 5800 5600 4%
Ahinsa Khand 2 5350 5100 5%
Bhopura 3000 3350 -10%
Chi - Phi 3800 3600 6%
Crossing Republik 3750 3650 3%
Govind Puram 2600 2400 8%
Greater Noida West 3250 3150 3%
Indirapuram 5900 5700 4%
Kaushambi 6300 5900 7%
Knowledge Park III 4450 4550 -2%
Lal Kuan 2250 2500 -10%
Mohan Nagar 4500 4300 5%
NH-58 2950 2700 9%
NH-91 2200 2500 -12%
NH-24 2950 2750 7%
Noida Extension 9750 9300 5%
Noida-Greater Noida Expressway 5000 4500 11%
Omicron sector Gr Noida 3350 3250 3%
Pari Chowk 4100 4000 3%
Raj Nagar Extention 3050 3100 -2%
Sector Chi Gr Noida 3850 3600 7%
Sector ZETA Gr Noida 3400 3150 8%
Sector-131 Noida 11200 10000 12%
Sector-16 Gr Noida 3300 3000 10%
Sector-Pi Gr Noida 3800 3600 6%
Shalimar garden 4050 3800 7%
Surajpur 3000 2500 20%
Vaishali 6550 6350 3%
Vasundhara 5650 5300 7%
Yamuna Expressway 3000 2900 3%
Sector-168 Noida 7450 7900 -6%
LOCALITY Oct-Dec 2014 Jul-Sep 2014 ChangeAhinsa Khand 13 11 18%
Raj Nagar Extention 7 6 17%
Sector Chi Gr Noida 9 8 13%
Sector ZETA Gr Noida 8 6 33%
Sector ZETA I Gr Noida 8 6 33%
Sector-110 Noida 13 12 8%
Sector-110 Noida 13 12 8%
Sector-120 Noida 12 11 9%
sector-121 Noida 11 10 10%
Sector-Pi Gr Noida 8 7 14%
Vaishali 12 12 0%
Vasundhara 10 10 0%
* Values represent average capital and rental per sq ft rates
1716
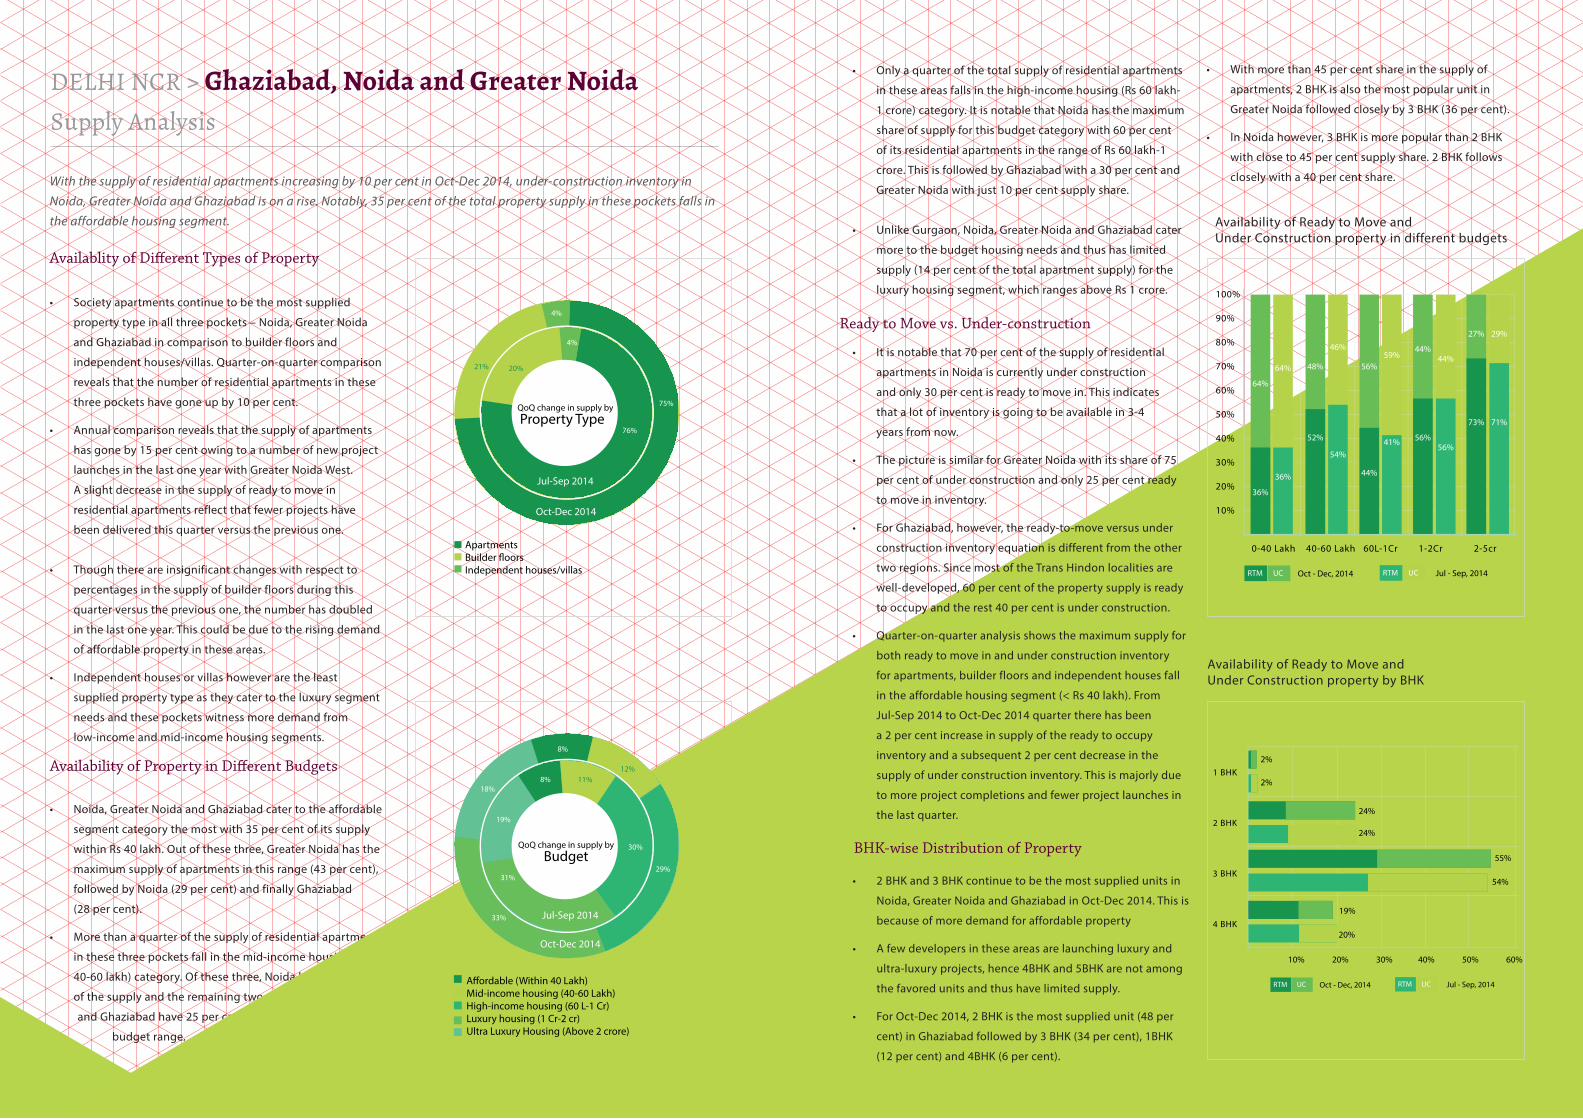
• Societyapartmentscontinuetobethemostsupplied
propertytypeinallthreepockets–Noida,GreaterNoida
andGhaziabadincomparisontobuilderfloorsand
independenthouses/villas.Quarter-on-quartercomparison
revealsthatthenumberofresidentialapartmentsinthese
threepocketshavegoneupby10percent.
• Annualcomparisonrevealsthatthesupplyofapartments
hasgoneby15percentowingtoanumberofnewproject
launchesinthelastoneyearwithGreaterNoidaWest.
Aslightdecreaseinthesupplyofreadytomovein
residentialapartmentsreflectthatfewerprojectshave
beendeliveredthisquarterversusthepreviousone.
• Thoughthereareinsignificantchangeswithrespectto
percentagesinthesupplyofbuilderfloorsduringthis
quarterversusthepreviousone,thenumberhasdoubled
inthelastoneyear.Thiscouldbeduetotherisingdemand
ofaffordablepropertyintheseareas.
• Independenthousesorvillashoweveraretheleast
suppliedpropertytypeastheycatertotheluxurysegment
needsandthesepocketswitnessmoredemandfrom
low-incomeandmid-incomehousingsegments.
• Noida,GreaterNoidaandGhaziabadcatertotheaffordable
segmentcategorythemostwith35percentofitssupply
withinRs40lakh.Outofthesethree,GreaterNoidahasthe
maximumsupplyofapartmentsinthisrange(43percent),
followedbyNoida(29percent)andfinallyGhaziabad
(28percent).
• Morethanaquarterofthesupplyofresidentialapartments
inthesethreepocketsfallinthemid-incomehousing(Rs
40-60lakh)category.Ofthesethree,Noidahasalmosthalf
ofthesupplyandtheremainingtwoareas-GreaterNoida
andGhaziabadhave25percentsupplyeachforthis
budgetrange.
Availablity of Different Types of Property
Availability of Property in Different Budgets
DELHI NCR > Ghaziabad, Noida and Greater NoidaSupply Analysis
With the supply of residential apartments increasing by 10 per cent in Oct-Dec 2014, under-construction inventory in Noida, Greater Noida and Ghaziabad is on a rise. Notably, 35 per cent of the total property supply in these pockets falls in the affordable housing segment. AvailabilityofReadytoMoveand
UnderConstructionpropertyindifferentbudgets
• Itisnotablethat70percentofthesupplyofresidential
apartmentsinNoidaiscurrentlyunderconstruction
andonly30percentisreadytomovein.Thisindicates
thatalotofinventoryisgoingtobeavailablein3-4
yearsfromnow.
• ThepictureissimilarforGreaterNoidawithitsshareof75
percentofunderconstructionandonly25percentready
tomoveininventory.
• ForGhaziabad,however,theready-to-moveversusunder
constructioninventoryequationisdifferentfromtheother
tworegions.SincemostoftheTransHindonlocalitiesare
well-developed,60percentofthepropertysupplyisready
tooccupyandtherest40percentisunderconstruction.
• Quarter-on-quarteranalysisshowsthemaximumsupplyfor
bothreadytomoveinandunderconstructioninventory
forapartments,builderfloorsandindependenthousesfall
intheaffordablehousingsegment(<Rs40lakh).From
Jul-Sep2014toOct-Dec2014quartertherehasbeen
a2percentincreaseinsupplyofthereadytooccupy
inventoryandasubsequent2percentdecreaseinthe
supplyofunderconstructioninventory.Thisismajorlydue
tomoreprojectcompletionsandfewerprojectlaunchesin
thelastquarter.
Ready to Move vs. Under-construction
• 2BHKand3BHKcontinuetobethemostsuppliedunitsin
Noida,GreaterNoidaandGhaziabadinOct-Dec2014.Thisis
becauseofmoredemandforaffordableproperty
• Afewdevelopersintheseareasarelaunchingluxuryand
ultra-luxuryprojects,hence4BHKand5BHKarenotamong
thefavoredunitsandthushavelimitedsupply.
• ForOct-Dec2014,2BHKisthemostsuppliedunit(48per
cent)inGhaziabadfollowedby3BHK(34percent),1BHK
(12percent)and4BHK(6percent).
BHK-wise Distribution of Property
• Withmorethan45percentshareinthesupplyof
apartments,2BHKisalsothemostpopularunitin
GreaterNoidafollowedcloselyby3BHK(36percent).
• InNoidahowever,3BHKismorepopularthan2BHK
withcloseto45percentsupplyshare.2BHKfollows
closelywitha40percentshare.
• Onlyaquarterofthetotalsupplyofresidentialapartments
intheseareasfallsinthehigh-incomehousing(Rs60lakh-
1crore)category.ItisnotablethatNoidahasthemaximum
shareofsupplyforthisbudgetcategorywith60percent
ofitsresidentialapartmentsintherangeofRs60lakh-1
crore.ThisisfollowedbyGhaziabadwitha30percentand
GreaterNoidawithjust10percentsupplyshare.
• UnlikeGurgaon,Noida,GreaterNoidaandGhaziabadcater
moretothebudgethousingneedsandthushaslimited
supply(14percentofthetotalapartmentsupply)forthe
luxuryhousingsegment,whichrangesaboveRs1crore.
AvailabilityofReadytoMoveandUnderConstructionpropertybyBHK
1918
Faridabad
GurgaonGurgaon
Sector-31 Gurgaon 18%
Dwarka Expressway Gurgaon 3%
IMT Manesar -4%
Dharuheda 9%
Sushant Lok Phase - I 16%
Nehar Par 5%
Bhiwadi 5%
Sec 85 10%
Sohna 13%
Manesar 0%
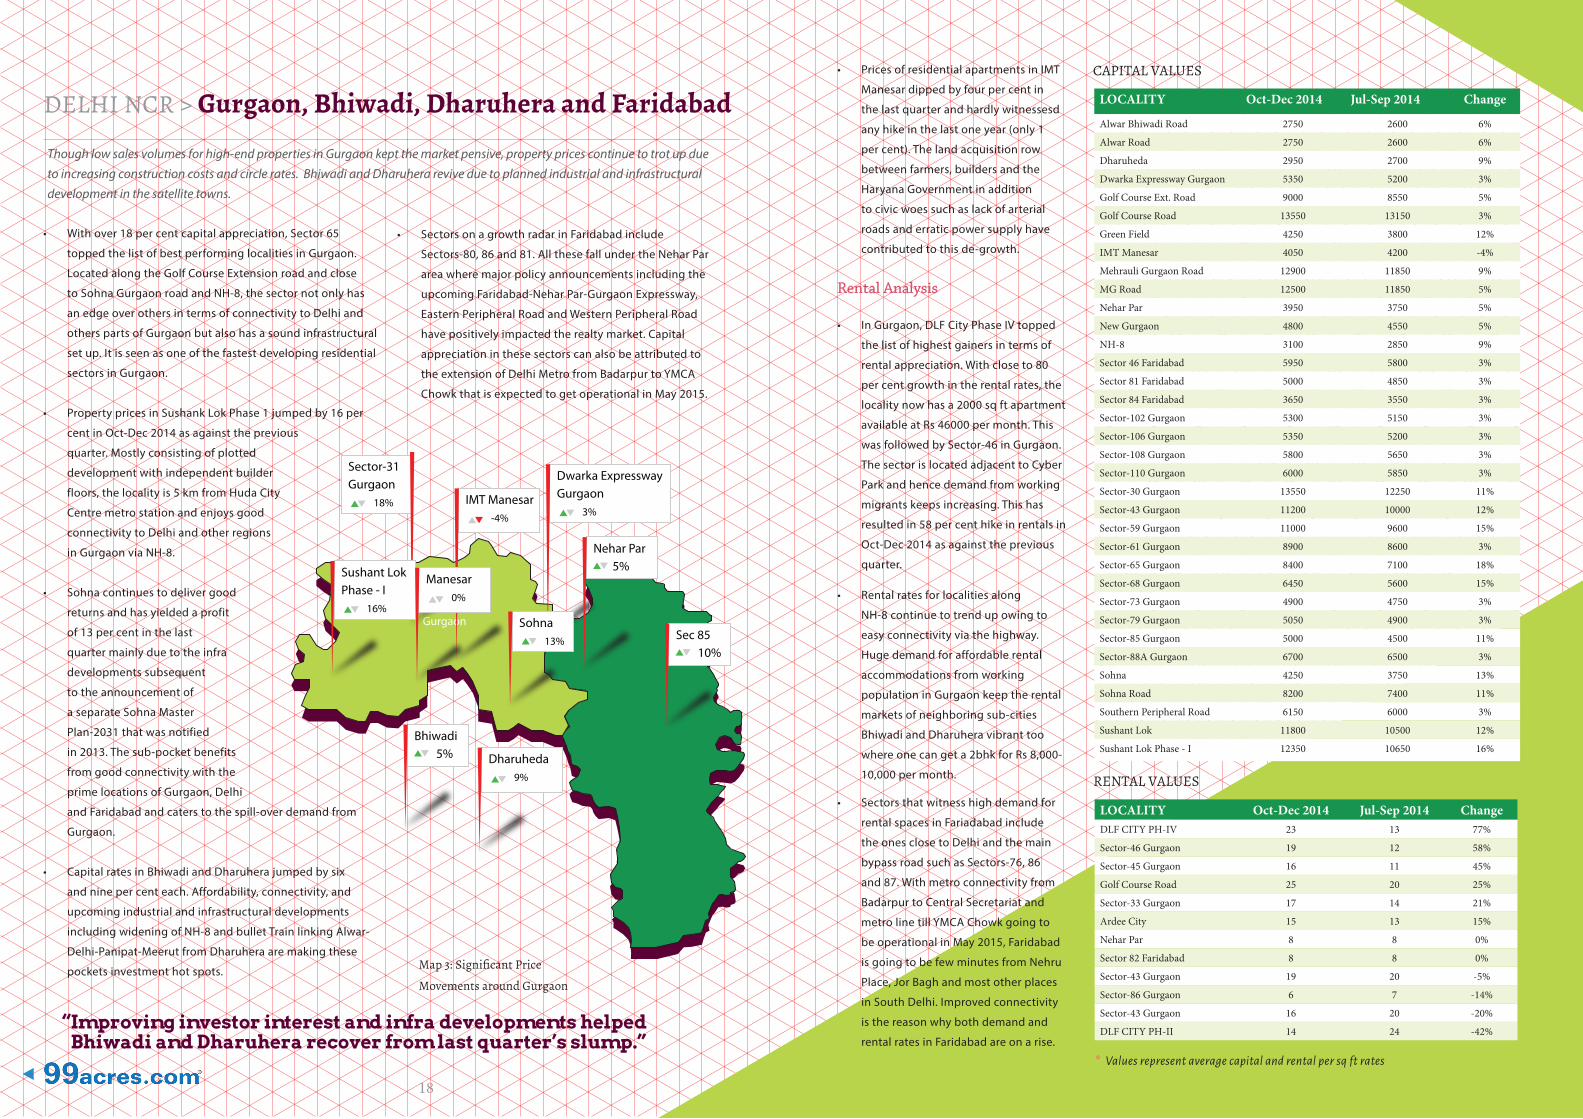
DELHI NCR > Gurgaon, Bhiwadi, Dharuhera and Faridabad
Though low sales volumes for high-end properties in Gurgaon kept the market pensive, property prices continue to trot up due to increasing construction costs and circle rates. Bhiwadi and Dharuhera revive due to planned industrial and infrastructural development in the satellite towns.
• Withover18percentcapitalappreciation,Sector65
toppedthelistofbestperforminglocalitiesinGurgaon.
LocatedalongtheGolfCourseExtensionroadandclose
toSohnaGurgaonroadandNH-8,thesectornotonlyhas
anedgeoverothersintermsofconnectivitytoDelhiand
otherspartsofGurgaonbutalsohasasoundinfrastructural
setup.Itisseenasoneofthefastestdevelopingresidential
sectorsinGurgaon.
• PropertypricesinSushankLokPhase1jumpedby16per
centinOct-Dec2014asagainsttheprevious
quarter.Mostlyconsistingofplotted
developmentwithindependentbuilder
floors,thelocalityis5kmfromHudaCity
Centremetrostationandenjoysgood
connectivitytoDelhiandotherregions
inGurgaonviaNH-8.
• Sohnacontinuestodelivergood
returnsandhasyieldedaprofit
of13percentinthelast
quartermainlyduetotheinfra
developmentssubsequent
totheannouncementof
aseparateSohnaMaster
Plan-2031thatwasnotified
in2013.Thesub-pocketbenefits
fromgoodconnectivitywiththe
primelocationsofGurgaon,Delhi
andFaridabadandcaterstothespill-overdemandfrom
Gurgaon.
• CapitalratesinBhiwadiandDharuherajumpedbysix
andninepercenteach.Affordability,connectivity,and
upcomingindustrialandinfrastructuraldevelopments
includingwideningofNH-8andbulletTrainlinkingAlwar-
Delhi-Panipat-MeerutfromDharuheraaremakingthese
pocketsinvestmenthotspots.
• SectorsonagrowthradarinFaridabadinclude
Sectors-80,86and81.AllthesefallundertheNeharPar
areawheremajorpolicyannouncementsincludingthe
upcomingFaridabad-NeharPar-GurgaonExpressway,
EasternPeripheralRoadandWesternPeripheralRoad
havepositivelyimpactedtherealtymarket.Capital
appreciationinthesesectorscanalsobeattributedto
theextensionofDelhiMetrofromBadarpurtoYMCA
ChowkthatisexpectedtogetoperationalinMay2015.
“Improving investor interest and infra developments helped Bhiwadi and Dharuhera recover from last quarter’s slump.”
Map 3: Significant Price
Movements around Gurgaon
• PricesofresidentialapartmentsinIMT
Manesardippedbyfourpercentin
thelastquarterandhardlywitnessesd
anyhikeinthelastoneyear(only1
percent).Thelandacquisitionrow
betweenfarmers,buildersandthe
HaryanaGovernmentinaddition
tocivicwoessuchaslackofarterial
roadsanderraticpowersupplyhave
contributedtothisde-growth.
• InGurgaon,DLFCityPhaseIVtopped
thelistofhighestgainersintermsof
rentalappreciation.Withcloseto80
percentgrowthintherentalrates,the
localitynowhasa2000sqftapartment
availableatRs46000permonth.This
wasfollowedbySector-46inGurgaon.
ThesectorislocatedadjacenttoCyber
Parkandhencedemandfromworking
migrantskeepsincreasing.Thishas
resultedin58percenthikeinrentalsin
Oct-Dec2014asagainsttheprevious
quarter.
• Rentalratesforlocalitiesalong
NH-8continuetotrendupowingto
easyconnectivityviathehighway.
Hugedemandforaffordablerental
accommodationsfromworking
populationinGurgaonkeeptherental
marketsofneighboringsub-cities
BhiwadiandDharuheravibranttoo
whereonecangeta2bhkforRs8,000-
10,000permonth.
• Sectorsthatwitnesshighdemandfor
rentalspacesinFariadabadinclude
theonesclosetoDelhiandthemain
bypassroadsuchasSectors-76,86
and87.Withmetroconnectivityfrom
BadarpurtoCentralSecretariatand
metrolinetillYMCAChowkgoingto
beoperationalinMay2015,Faridabad
isgoingtobefewminutesfromNehru
Place,JorBaghandmostotherplaces
inSouthDelhi.Improvedconnectivity
isthereasonwhybothdemandand
rentalratesinFaridabadareonarise.
Rental Analysis
CAPITAL VALUES
* Values represent average capital and rental per sq ft rates
RENTAL VALUES
LOCALITY Oct-Dec 2014 Jul-Sep 2014 Change
Alwar Bhiwadi Road 2750 2600 6%
Alwar Road 2750 2600 6%
Dharuheda 2950 2700 9%
Dwarka Expressway Gurgaon 5350 5200 3%
Golf Course Ext. Road 9000 8550 5%
Golf Course Road 13550 13150 3%
Green Field 4250 3800 12%
IMT Manesar 4050 4200 -4%
Mehrauli Gurgaon Road 12900 11850 9%
MG Road 12500 11850 5%
Nehar Par 3950 3750 5%
New Gurgaon 4800 4550 5%
NH-8 3100 2850 9%
Sector 46 Faridabad 5950 5800 3%
Sector 81 Faridabad 5000 4850 3%
Sector 84 Faridabad 3650 3550 3%
Sector-102 Gurgaon 5300 5150 3%
Sector-106 Gurgaon 5350 5200 3%
Sector-108 Gurgaon 5800 5650 3%
Sector-110 Gurgaon 6000 5850 3%
Sector-30 Gurgaon 13550 12250 11%
Sector-43 Gurgaon 11200 10000 12%
Sector-59 Gurgaon 11000 9600 15%
Sector-61 Gurgaon 8900 8600 3%
Sector-65 Gurgaon 8400 7100 18%
Sector-68 Gurgaon 6450 5600 15%
Sector-73 Gurgaon 4900 4750 3%
Sector-79 Gurgaon 5050 4900 3%
Sector-85 Gurgaon 5000 4500 11%
Sector-88A Gurgaon 6700 6500 3%
Sohna 4250 3750 13%
Sohna Road 8200 7400 11%
Southern Peripheral Road 6150 6000 3%
Sushant Lok 11800 10500 12%
Sushant Lok Phase - I 12350 10650 16%
LOCALITY Oct-Dec 2014 Jul-Sep 2014 ChangeDLF CITY PH-IV 23 13 77%
Sector-46 Gurgaon 19 12 58%
Sector-45 Gurgaon 16 11 45%
Golf Course Road 25 20 25%
Sector-33 Gurgaon 17 14 21%
Ardee City 15 13 15%
Nehar Par 8 8 0%
Sector 82 Faridabad 8 8 0%
Sector-43 Gurgaon 19 20 -5%
Sector-86 Gurgaon 6 7 -14%
Sector-43 Gurgaon 16 20 -20%
DLF CITY PH-II 14 24 -42%
2120
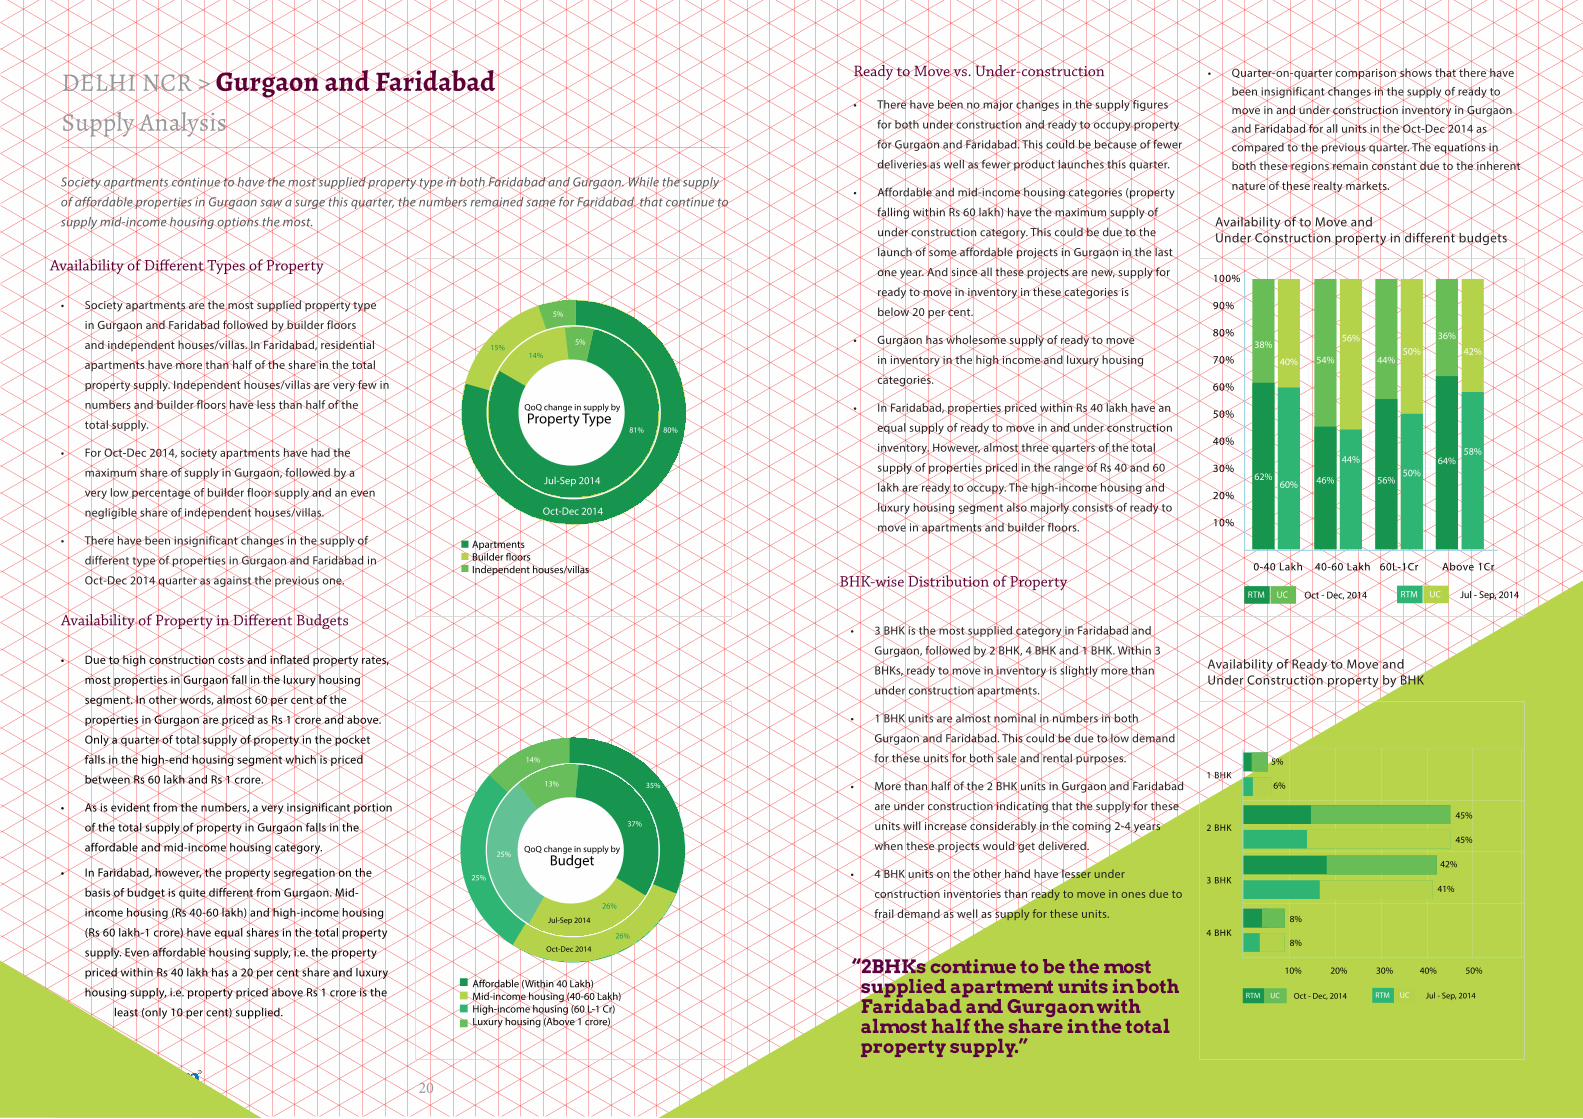
• Societyapartmentsarethemostsuppliedpropertytype
inGurgaonandFaridabadfollowedbybuilderfloors
andindependenthouses/villas.InFaridabad,residential
apartmentshavemorethanhalfoftheshareinthetotal
propertysupply.Independenthouses/villasareveryfewin
numbersandbuilderfloorshavelessthanhalfofthe
totalsupply.
• ForOct-Dec2014,societyapartmentshavehadthe
maximumshareofsupplyinGurgaon,followedbya
verylowpercentageofbuilderfloorsupplyandaneven
negligibleshareofindependenthouses/villas.
• Therehavebeeninsignificantchangesinthesupplyof
differenttypeofpropertiesinGurgaonandFaridabadin
Oct-Dec2014quarterasagainstthepreviousone.
• Duetohighconstructioncostsandinflatedpropertyrates,
mostpropertiesinGurgaonfallintheluxuryhousing
segment.Inotherwords,almost60percentofthe
propertiesinGurgaonarepricedasRs1croreandabove.
Onlyaquarteroftotalsupplyofpropertyinthepocket
fallsinthehigh-endhousingsegmentwhichispriced
betweenRs60lakhandRs1crore.
• Asisevidentfromthenumbers,averyinsignificantportion
ofthetotalsupplyofpropertyinGurgaonfallsinthe
affordableandmid-incomehousingcategory.
• InFaridabad,however,thepropertysegregationonthe
basisofbudgetisquitedifferentfromGurgaon.Mid-
incomehousing(Rs40-60lakh)andhigh-incomehousing
(Rs60lakh-1crore)haveequalsharesinthetotalproperty
supply.Evenaffordablehousingsupply,i.e.theproperty
pricedwithinRs40lakhhasa20percentshareandluxury
housingsupply,i.e.propertypricedaboveRs1croreisthe
least(only10percent)supplied.
Availability of Different Types of Property
Availability of Property in Different Budgets
DELHI NCR > Gurgaon and FaridabadSupply Analysis
Society apartments continue to have the most supplied property type in both Faridabad and Gurgaon. While the supply of affordable properties in Gurgaon saw a surge this quarter, the numbers remained same for Faridabad that continue to supply mid-income housing options the most.
Ready to Move vs. Under-construction
• 3BHKisthemostsuppliedcategoryinFaridabadand
Gurgaon,followedby2BHK,4BHKand1BHK.Within3
BHKs,readytomoveininventoryisslightlymorethan
underconstructionapartments.
• 1BHKunitsarealmostnominalinnumbersinboth
GurgaonandFaridabad.Thiscouldbeduetolowdemand
fortheseunitsforbothsaleandrentalpurposes.
• Morethanhalfofthe2BHKunitsinGurgaonandFaridabad
areunderconstructionindicatingthatthesupplyforthese
unitswillincreaseconsiderablyinthecoming2-4years
whentheseprojectswouldgetdelivered.
• 4BHKunitsontheotherhandhavelesserunder
constructioninventoriesthanreadytomoveinonesdueto
fraildemandaswellassupplyfortheseunits.
BHK-wise Distribution of Property
“2BHKs continue to be the most supplied apartment units in both Faridabad and Gurgaon with almost half the share in the total property supply.”
• Therehavebeennomajorchangesinthesupplyfigures
forbothunderconstructionandreadytooccupyproperty
forGurgaonandFaridabad.Thiscouldbebecauseoffewer
deliveriesaswellasfewerproductlaunchesthisquarter.
• Affordableandmid-incomehousingcategories(property
fallingwithinRs60lakh)havethemaximumsupplyof
underconstructioncategory.Thiscouldbeduetothe
launchofsomeaffordableprojectsinGurgaoninthelast
oneyear.Andsincealltheseprojectsarenew,supplyfor
readytomoveininventoryinthesecategoriesis
below20percent.
• Gurgaonhaswholesomesupplyofreadytomove
ininventoryinthehighincomeandluxuryhousing
categories.
• InFaridabad,propertiespricedwithinRs40lakhhavean
equalsupplyofreadytomoveinandunderconstruction
inventory.However,almostthreequartersofthetotal
supplyofpropertiespricedintherangeofRs40and60
lakharereadytooccupy.Thehigh-incomehousingand
luxuryhousingsegmentalsomajorlyconsistsofreadyto
moveinapartmentsandbuilderfloors.
• Quarter-on-quartercomparisonshowsthattherehave
beeninsignificantchangesinthesupplyofreadyto
moveinandunderconstructioninventoryinGurgaon
andFaridabadforallunitsintheOct-Dec2014as
comparedtothepreviousquarter.Theequationsin
boththeseregionsremainconstantduetotheinherent
natureoftheserealtymarkets.
AvailabilityoftoMoveandUnderConstructionpropertyindifferentbudgets
AvailabilityofReadytoMoveandUnderConstructionpropertybyBHK

Our Heritage
First Internet Company to be Listed
Info Edge (India) Ltd is India’s premier on-line classifieds company in recruitment, real estate, matrimony and education
a USD 1.84 Billion listed Indian Internet Conglomerate
Credentials of www.99acres.com
5 Million9 Million6 lac2.5 lac15,000+20% 2.5 million
Unique Visitors a month
Visitors a month
Residential and Commercial Properties
Searches everyday
New Projects
NRI Visitors
Registered Database
OFFICES
CITIES
India’s No.1 Property Portal
Recommended