
INOX WIND LIMITED Q2FY18 INVESTOR UPDATE

DISCLAIMER
2
This presentation and the following discussion may contain “forward looking statements” by Inox Wind Limited (“IWL” or “the
Company”) that are not historical in nature. These forward looking statements, which may include statements relating to
future state of affairs, results of operations, financial condition, business prospects, plans and objectives, are based on the
current beliefs, assumptions, expectations, estimates, and projections of the management of IWL about the business, industry
and markets in which IWL operates.
These statements are not guarantees of future performance, and are subject to known and unknown risks, uncertainties, and
other factors, some of which are beyond IWL’s control and difficult to predict, that could cause actual results, performance or
achievements to differ materially from those in the forward looking statements.
Such statements are not, and should not be construed, as a representation as to future performance or achievements of IWL.
In particular, such statements should not be regarded as a projection of future performance of IWL. It should be noted that the
actual performance or achievements of IWL may vary significantly from such statements.

DISCUSSION SUMMARY
3
AUCTION MARKET PICKING PACE
INOX WINS ROBUST MARKET SHARE IN SECI AUCTIONS
INOX WIND – THE PATH AHEAD
Q2 HIGHLIGHTS
Q2 RESULT ANALYSIS
H1 RESULT ANALYSIS
SALES & COMMISSIONING
WORKING CAPITAL ANALYSIS
CASH FLOW AND DEBT ANALYSIS
ORDER BOOK
MANUFACTURING CAPACITY
PROJECT SITES
TECHNOLOGY
O&M – ANNUITY BUSINESS
SHAREHOLDING STRUCTURE
DETAILED FINANCIALS
FINANCIAL SUMMARY
INDUSTRY SECTION – EXPLAINING THE AUCTION
REGIME

4
AUCTION MARKET PICKING PACE
Central Auctions – SECI
SECI 1 – Held in February, 17. Inox Wind won orders of 300MW translating into ~30% market share.
SECI 2 – Held in October, 17. Inox wind won orders of 250MW translating into 25% market share
Government looking to conduct wind power auctions of 4500MW by February, 2018 via 3 tranches of 1500MW
each by SECI *.
State Auctions
Gujarat – 500MW auction to be concluded in November. Bid documents already submitted.
Rajasthan – Has announced 250MW wind auctions. Would follow up with tender documents and guidelines.
In addition, Madhya Pradesh is working on their tender document which should be released soon. We expect all
other wind states to come out with their auction guidelines within FY18 itself.
PSU/Captives
Over 700MW of PSU tenders in the public domain from NTPC, GIPCL, TDHC, SJVNL, REMCL etc.
*https://economictimes.indiatimes.com/industry/energy/power/wind-power-capacity-addition-put-on-fast-track-4500mw-up-for-auction/articleshow/61094453.cms
We anticipate FY19 as the beginning of a phase of robust growth for the wind industry having auctions of 6GW+ on a sustainable basis.
5
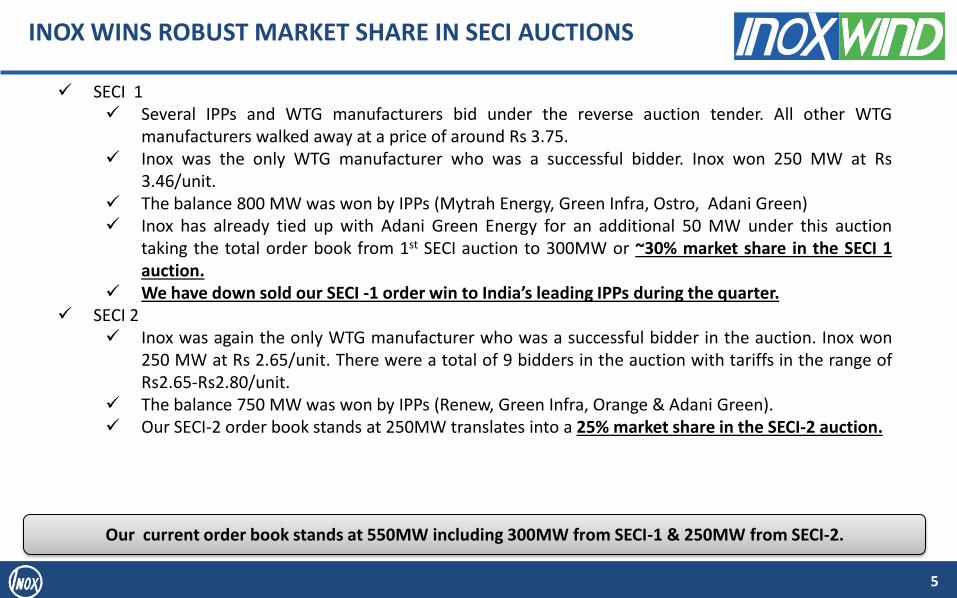
INOX WINS ROBUST MARKET SHARE IN SECI AUCTIONS
SECI 1 Several IPPs and WTG manufacturers bid under the reverse auction tender. All other WTG
manufacturers walked away at a price of around Rs 3.75. Inox was the only WTG manufacturer who was a successful bidder. Inox won 250 MW at Rs
3.46/unit. The balance 800 MW was won by IPPs (Mytrah Energy, Green Infra, Ostro, Adani Green) Inox has already tied up with Adani Green Energy for an additional 50 MW under this auction
taking the total order book from 1st SECI auction to 300MW or ~30% market share in the SECI 1 auction.
We have down sold our SECI -1 order win to India’s leading IPPs during the quarter. SECI 2
Inox was again the only WTG manufacturer who was a successful bidder in the auction. Inox won 250 MW at Rs 2.65/unit. There were a total of 9 bidders in the auction with tariffs in the range of Rs2.65-Rs2.80/unit.
The balance 750 MW was won by IPPs (Renew, Green Infra, Orange & Adani Green). Our SECI-2 order book stands at 250MW translates into a 25% market share in the SECI-2 auction.
Our current order book stands at 550MW including 300MW from SECI-1 & 250MW from SECI-2.

6
INOX WIND – THE PATH AHEAD
• Auction regime is expected to increase the WTG market to over 6GW annually. The cost of wind power is now lower than even conventional sources of power.
• Market expected to be as follows-:
• 4GW+ from SECI auctions,
• 2GW+ from state auctions,
• 1GW+ from PSU/captive orders.
Indian WTG market expected to reach 6GW+ per annum vs.
average historic levels of 3GW+ p.a.
• We have captured 30% market share in SECI-1 and 25% in SECI-2 auctions vs. our historic market share of 15-20%.
• Our cost competitiveness gives us an edge in winning market share from incumbents. In the auction regime, we are gaining market share and maintaining healthy profitability at the same time.
• SECI 1 – Inox wind won an order book of 300MW from SECI 1 auctions showing ~30% market share.
• SECI 2 – Inox wind won an order book of 250MW from SECI 2 auctions showing 25% market share. We are in discussions with other winning IPPs and our market share could be higher if we win orders from them.
Inox Wind market share increasing with sustainable
profits
• With the nature of business changing in the auction regime vs. FIT regime, we are looking at lower levels of investments in working capital and inventory since the wind business would not be a “4th quarter” phenomenon.
• Smoother trajectory of production & execution cycle leading to improved working capital management
• No risk of stuck assets due to non signing of PPAs.
Working capital & inventory levels to come down under the
auction regime
Our cost focus and competiveness leads us to focus on growth while maintaining healthy profitability levels.

Down sold 250MW from our SECI-1 order win to some of the largest IPPs in the country.
SECI conducted the 2nd wind auction of 1000MW. Besides other players in the fray, Inox was again the only
WTG manufacturer to become successful in the auction winning 250MW at a quote of Rs 2.65/unit.
The CERC order clarifying on connectivity issues was finally released on September 29th which paved the
way for SECI-2 auctions.
Karnataka government overrules Karnataka Electricity Regulatory Commission (KERC) order and confirms
that PPA signed till March 2017 will have tariff of Rs4.5/unit and not Rs3.74/unit as per KERC order. The
state govt. invoked special provisions under Section 108 of the Electricity Act to veto the decision of KERC.*
Net receivables reduced by Rs326cr to Rs1,658cr (vs Rs 1,984cr in June 17) in Q2FY18 and by Rs724cr in
1HFY18 (Rs 2,382cr in March, 17).
Commissioned 40MW during the quarter taking H1FY18 commissioning to 86MW. The industry added
421MW in H1FY18 leading to installation market share of 20% for Inox Wind. **
Q2 HIGHLIGHTS
7
* https://economictimes.indiatimes.com/industry/energy/power/karnataka-overrules-order-to-reduce-discom-tariff/articleshow/61348882.cms ** http://mnre.gov.in/mission-and-vision-2/achievements/

Q2 RESULT ANALYSIS
8
In Rs. Cr. REVENUES EBITDA & EBITDA MARGIN (%)
PAT & PAT MARGIN (%)
800
80
Q2 FY17 Q2 FY18
REVENUES
56
(46)
7.1%
-57.6%
Q2FY17 Q2FY18
PAT PAT %
101
(20)
12.6%
-25.5% Q2 FY17 Q2 FY18
EBIDTA EBIDTA %
Consolidated Financials as per IND AS Q2 results reflect the ongoing transition to the auction regime in the Indian Wind Power sector

H1 RESULT ANALYSIS
9
In Rs. Cr. REVENUES EBITDA & EBITDA MARGIN (%)
PAT & PAT MARGIN (%)
1,235
186
H1 FY17 H1 FY18
REVENUES
68
(85)
5.5%
-45.8%
H1FY17 H1FY18
PAT PAT % Revenues
147
(34)
11.9%
-18.1%
H1FY17 H1FY18
EBIDTA EBIDTA %
Consolidated Financials as per IND AS H1 results reflect the ongoing transition to the auction regime in the Indian Wind Power sector

10
SALES & COMMISSIONING
122
168
138 146
0 0 0
40
Nacelles & Hubs Blades Towers Commissioning
Q2 FY17 (MW) Q2 FY18 (MW)
The sales & commissioning data reflects the ongoing transition to the auction regime in the Indian Wind Power sector during H1FY18
162
366
286
194
0 20
2
86
Nacelles & Hubs Blades Towers Commissioning
H1 FY17 (MW) H1 FY18 (MW)

WORKING CAPITAL ANALYSIS
11
Particulars (Rs Cr) Sept 2016 March 2017 June 2017 Sept 2017
Inventory 672.7 690.4 866.5 955.4
Receivables 2418.2 2382.3 1984.3 1658.3
Payables 887.7 968.7 628.8 506.0
Others 177.4 300.1 142.2 180.8
Net Working Capital
2025.9 1803.9 2079.8 1926.9
Net receivables reduced by Rs326cr to Rs1,658cr (vs. Rs 1,984cr in June 17) in Q2FY18 and by Rs724cr in 1HFY18 (Rs 2,382cr in March, 17).

12
CASH FLOW AND DEBT ANALYSIS
Net D/E ratio of 0.49x

ORDER BOOK
13
Current order book of the company stands at 550MW based on SECI-1 & SECI-2 auctions.
We anticipate FY19 as the beginning of a phase of robust growth for the wind industry. We believe that Inox
Wind, on the back of its cost-competitive advantage of being amongst the lowest cost producer of wind
turbines globally, would be a major beneficiary in the auctioning regime.
*** https://economictimes.indiatimes.com/industry/energy/power/wind-power-capacity-addition-put-on-fast-track-4500mw-up-for-auction/articleshow/61094453.cms

14
CURRENT CAPACITY (MW)
Plant Location Una,
Himachal Pradesh
Rohika, Gujarat
Barwani, Madhya Pradesh
Total
Nacelles & Hubs 1,100 - - 1,100
Blades - 800 800 1,600
Towers - 300 300 600
MANUFACTURING CAPACITY
Well positioned to take advantage of the growing market.
Potential to debottleneck our nacelle and tower capacity with minor capex.
Tower capacity can also be outsourced depending on project location.

15
PROJECT SITES
Amongst the largest project site allottees in
Gujarat, Rajasthan and Madhya Pradesh
Expanded presence in Andhra Pradesh and
Karnataka and Kerala
Sufficient project site inventory for installation
of an aggregate capacity of more than 5,000
MW
Rajasthan
Gujarat
Maharashtra
Madhya Pradesh
Andhra Pradesh
Tamil Nadu
Karnataka
LEADERSHIP ACROSS WIND RICH STATES Kerala
TECHNOLOGY
16
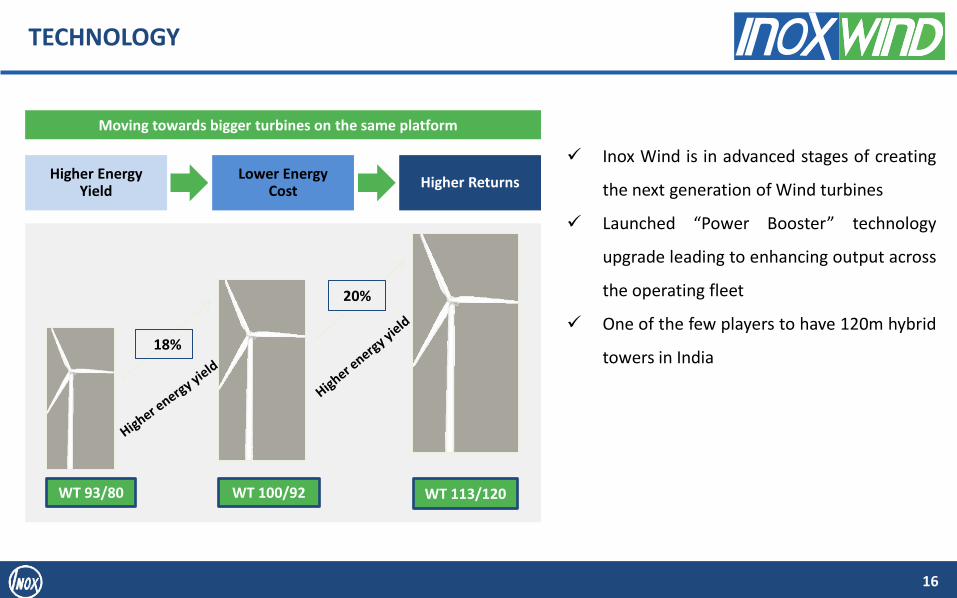
Higher Energy Yield
Lower Energy Cost
Higher Returns
18%
20%
WT 93/80 WT 100/92 WT 113/120
Moving towards bigger turbines on the same platform
Inox Wind is in advanced stages of creating
the next generation of Wind turbines
Launched “Power Booster” technology
upgrade leading to enhancing output across
the operating fleet
One of the few players to have 120m hybrid
towers in India
O&M – ANNUITY BUSINESS
17
Inox Wind has an installed wind turbine base of 2.2GW in India with multi year O&M agreements
In FY17, O&M revenues are ~3% of our revenues but we expect this revenue stream to pick up strongly in
the coming years as the fleet size increases
O&M revenues are noncyclical in nature, have steady cash flow generation and higher margins

SHAREHOLDING STRUCTURE
18
% Shareholding – 30th Sept2017
Source - BSE
Source – Company
Promoter & Promoter
Group, 85.62
FII, 1.50 DII, 5.07
Public, 7.81
Source - BSE
Source - Company
Key Institutional Investors as of 30th Sept2017 % Holding
Reliance Mutual Fund 1.4%
Aadi Financial Advisors 0.7%
Reliance Life Insurance 0.3%
Indiaman Fund (Mauritius) 0.2%
MV SCIF Mauritius 0.2%
HSBC Mutual Fund 0.1%
Market Data As on 03.11.17 (BSE)
Market capitalization (Rs. Cr) 2815
Price (Rs.) 127
No. of shares outstanding (Cr) 22
Face Value (Rs.) 10.0 100
150
200
250 N
ov-
16
Dec
-16
Jan
-17
Feb
-17
Mar
-17
Ap
r-1
7
May
-17
Jun
-17
Jul-
17
Au
g-1
7
Sep
-17
Oct
-17
No
v-1
7
Share Price (Rs)

DETAILED FINANCIALS CONSOLIDATED P&L STATEMENT
19

DETAILED FINANCIALS CONSOLIDATED BALANCE SHEET STATEMENT
20

FINANCIAL SUMMARY
21
ROE: PAT/Avg. Equity, ROCE: EBIT/Avg. Capital Employed [(Capital Employed = Equity + Total Debt)
In Rs. Cr
150 132
296
461
303
14.2% 8.4% 10.9% 10.3% 8.7%
FY13 FY14 FY15 FY16 FY17
PAT (cr) PAT Margin %
201 185
472
783 626
19.0% 11.8%
17.4% 17.6% 18.3%
FY13 FY14 FY15 FY16 FY17
EBITDA (cr) EBITDA Margin %
1,059 1,567
2,709
4,451
3,415
FY13 FY14 FY15 FY16 FY17
Revenue from Operations EBIDTA (Inc OI) & EBIDTA Margin % PAT & PAT Margin %
Return Ratios
CAGR – 34% CAGR – 33% CAGR – 21%
41%
21% 28% 27%
16%
70%
37% 33% 28%
15%
FY13 FY14 FY15 FY16 FY17
ROCE % ROE % Consolidated financials, FY13-15 as per IGAAP, FY16-17 as per Ind AS
Net Debt/Equity
296 428
1,392
1,844
2,190
273 448
5
641 779
0.92 1.05
0.00 0.35 0.36
FY13 FY14 FY15 FY16 FY17 Equity Net Debt Net D/E

22
INDUSTRY SECTION – EXPLAINING THE AUCTION REGIME
MARKET OUTLOOK – STRONG EXPANSION AHEAD
23
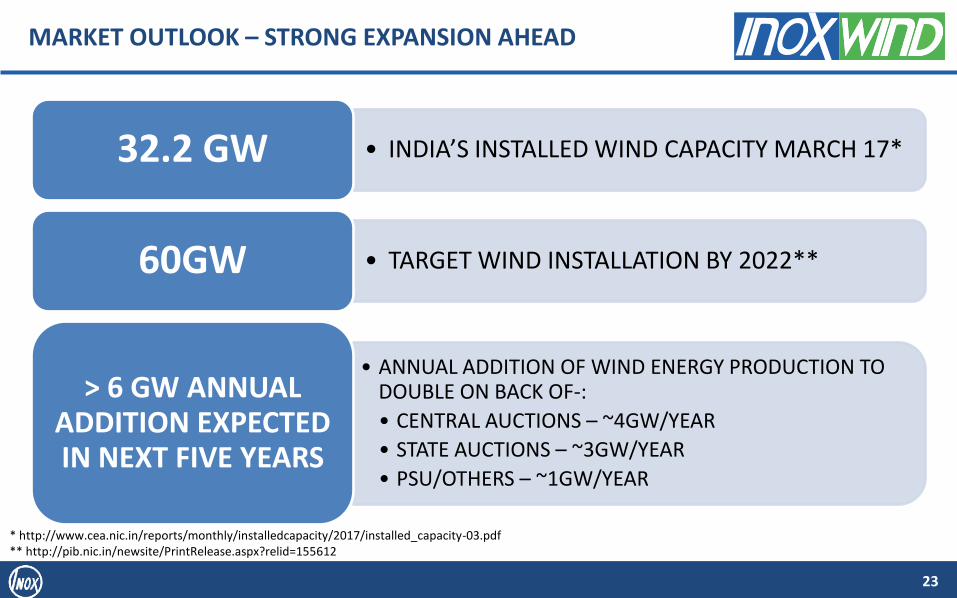
• INDIA’S INSTALLED WIND CAPACITY MARCH 17* 32.2 GW
• TARGET WIND INSTALLATION BY 2022** 60GW
• ANNUAL ADDITION OF WIND ENERGY PRODUCTION TO DOUBLE ON BACK OF-:
• CENTRAL AUCTIONS – ~4GW/YEAR
• STATE AUCTIONS – ~3GW/YEAR
• PSU/OTHERS – ~1GW/YEAR
> 6 GW ANNUAL ADDITION EXPECTED IN NEXT FIVE YEARS
* http://www.cea.nic.in/reports/monthly/installedcapacity/2017/installed_capacity-03.pdf ** http://pib.nic.in/newsite/PrintRelease.aspx?relid=155612

HOW AUCTIONS BENEFIT THE SECTOR
24
LOWER REGULATORY RISK
LONG TERM (~25 YRS) PPA SIGNED UPFRONT
ASSURANCE OF GRID CONNECTIVITY TO BE DONE WITH CENTRAL TRANMISSION UTILTY
LOWER FINANCIAL RISK
LOWER COST OF DEBT TO BE AVAILABLE
HIGHER DURATION LOANS AVAILABLE
LOWER INVESTOR RETURN EXPECTATION
OTHERS
INDUSTRY TO MOVE AWAY FROM “4TH
QUARTER/MARCH” DEPENDENCE
STABLE SET OF “LONG ONLY” INVESTORS TO
ENTER THE SPACE
Lower power cost Market expansion

WHY IS INOX WIND A WINNER IN THE AUCTION REGIME?
25
LARGER MARKET – The overall size of the market is expected to grow from FY2019 onwards
LARGER MARKET SHARE – Inox could gain market share
due to its cost competitiveness
HIGHER ABSOLUTE PROFITABILITY – due to low
cost manufacturing
MORE EFFICIENT WORKING CAPITAL – smoother and
better planned production cycle
LOWER REGULATORY RISK – Due to upfront signing of PPAs
LOWER CREDIT RISK – Payments to come from PTC,
instead of directly from discoms

26
THANK YOU
Mr. Atul Soni Head - Investor Relations- Inox Wind Contact No: 0120 6149881 Email : [email protected]
FOR FURTHER QUERIES :
Recommended


![Inox Wind Bags 100 MW Repeat Order from Tata Power Renewable Energy Limited [Company Update]](https://img.pdfslide.us/doc/110x75/577c98671a28ab163a8b5e62/inox-wind-bags-100-mw-repeat-order-from-tata-power-renewable-energy-limited.jpg)