CIGRE US National Committee
2014 Grid of the Future Symposium
Initial Field Trials of Distributed Series Reactors and Implications for Future Applications
Ian Grant Tennessee Valley Authority
Presented by: BRUCE ROGERS, Director, Technology Innovation, TVA CHIFONG THOMAS, Director, Transmission Planning and Strategy, SWG Inc.
I GRANT Tennessee Valley Authority
USA
J COUILLARD Smart Wire Grid Inc.
USA J SHULTZ
Tennessee Valley Authority USA
F KREIKEBAUM Smart Wire Grid Inc.
USA S OMRAN
Virginia Tech USA
R BROADWATER Electrical Distribution Design (EDD)
USA
Managing Overload and Congestion
2
Transmission Lines are becoming more overloaded and congested as loads and generation move or increase • Typical solutions
– Switching (but this places increased burden on equipment) – Reconductoring – New Line Construction
• Other Lines are Underutilized • Current Power Flow Methods
– Expensive and/or need frequent operations • Older Technologies such as air-core reactors or FACTS are:
– Centralized – All or Nothing – Take up Substation Space
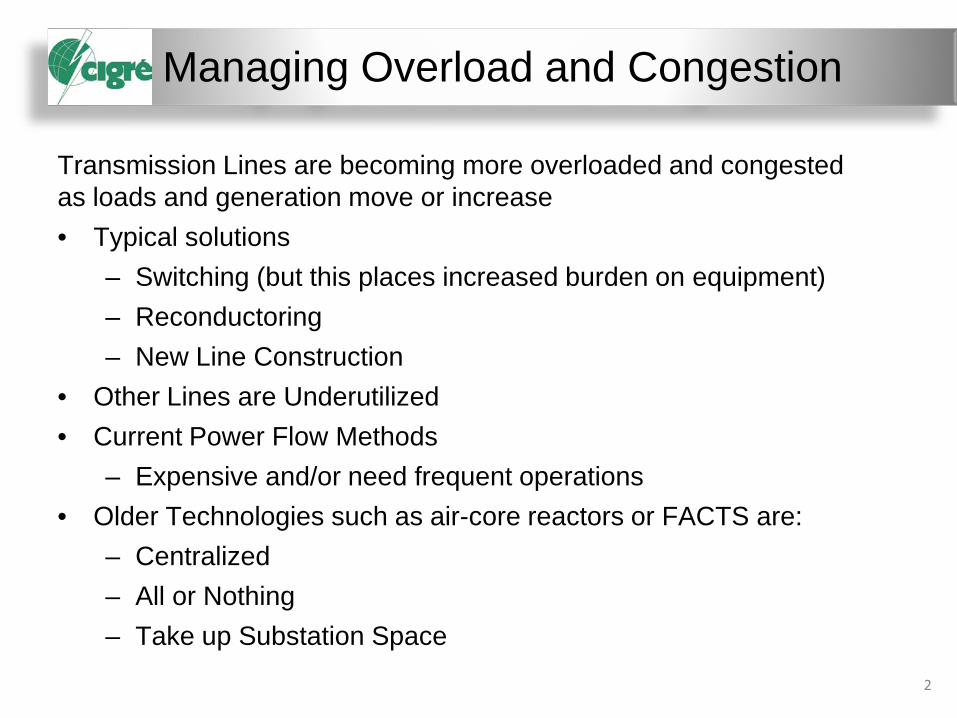
Background
• Rapidly deployable distributed power flow control for existing transmission lines
• Diverts current from the overloaded lines to underutilized ones • Concept was first demonstrated in 2002-03 and has since
been demonstrated in pilot installations on HV transmission lines.
3
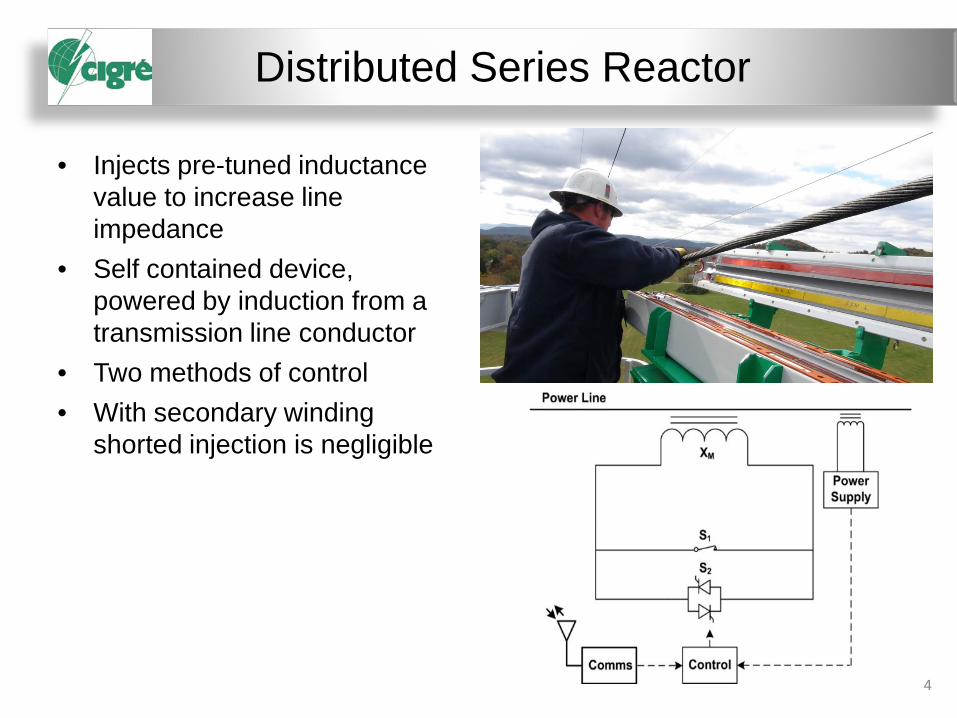
Distributed Series Reactor
• Injects pre-tuned inductance value to increase line impedance
• Self contained device, powered by induction from a transmission line conductor
• Two methods of control • With secondary winding
shorted injection is negligible
4
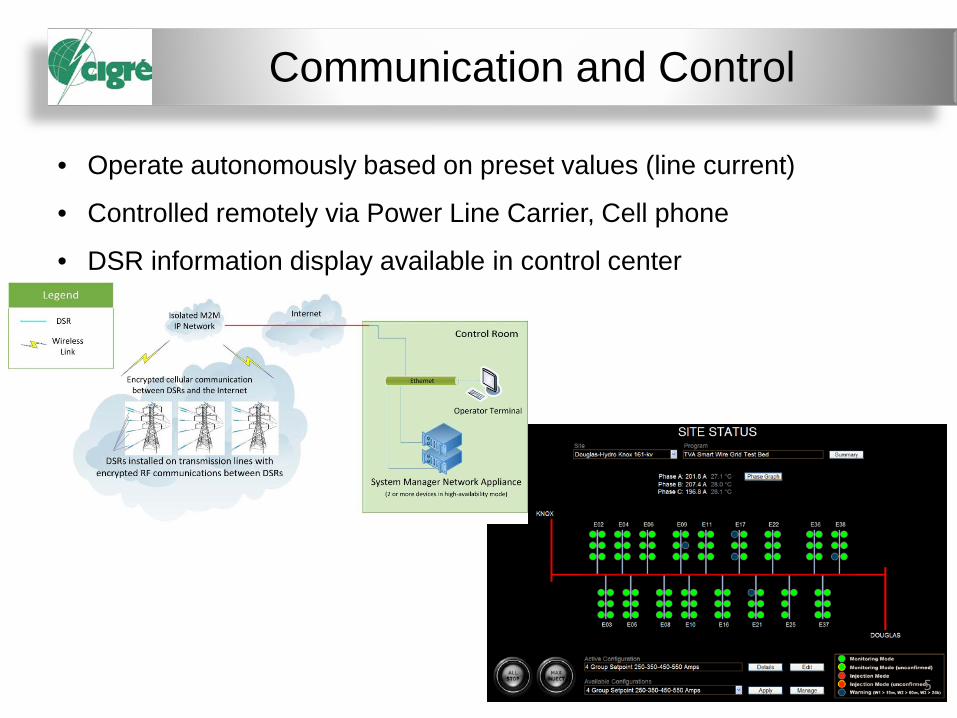
Communication and Control
• Operate autonomously based on preset values (line current)
• Controlled remotely via Power Line Carrier, Cell phone
• DSR information display available in control center
5

Example Application in Meshed Grid
39 BUS SYSTEM • Baseline MW: 1904 MW • Increase in transfer
capability of 638 MW (33.5%)
• Increase in line availability from 59% to 93%
G1
G8
G10
230
1
G2
G3
G9
G4G5
G6
G7
39
9
8 7
5
4
3
18
37
25
17
26 28 29
38
24
27
15
14
12
13
1011
32 34
20
19
21 2235
23
36
16
6
31
6

Prototype DSR Installation at TVA
TVA - 14.5 Miles of ACSR 795.0-26/7
7
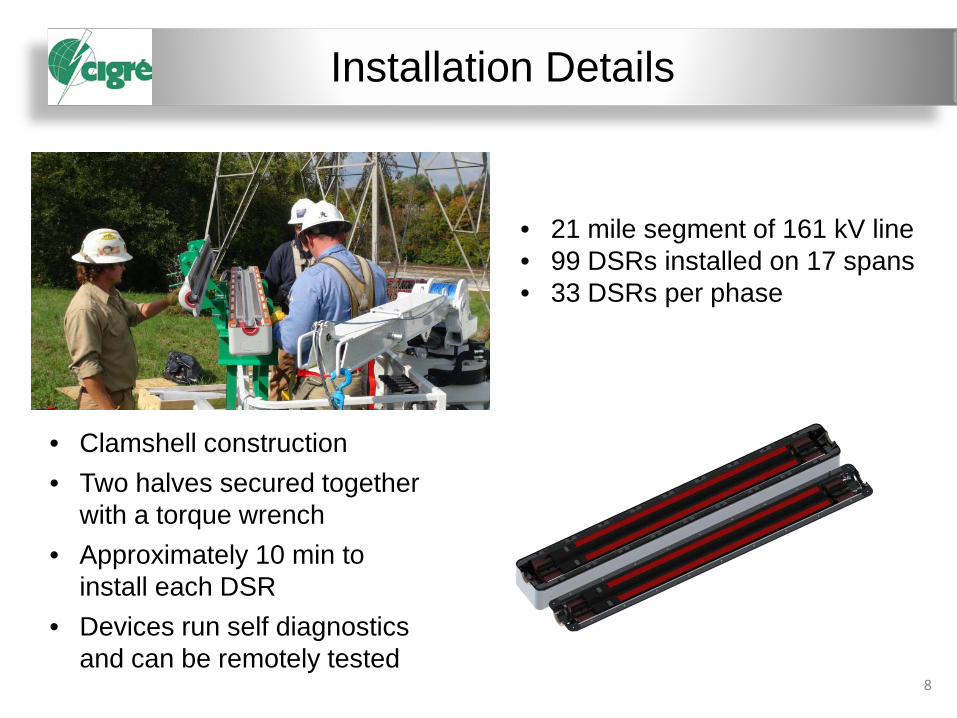
Installation Details
• 21 mile segment of 161 kV line • 99 DSRs installed on 17 spans • 33 DSRs per phase
• Clamshell construction • Two halves secured together
with a torque wrench • Approximately 10 min to
install each DSR • Devices run self diagnostics
and can be remotely tested 8

Pilot Test Results
• Total Impedance Increase (33 DSRs / Phase @ 47 µH / DSR): .226 % (control limited by number of available devices and a test line that was longer than optimal for the demonstration)
• Devices performed as expected over 4-step range (see below) • Devices successfully adjusted phase imbalance • Single point failure of communication system identified for
necessary design upgrade • DSRs presently considered unsuitable for bundled conductor use
9

Future Applications
• Success of pilot opens path to more critical applications • Simplest application is reduction of maximum contingency load
for postponement of line uprate • Ability to quickly relocate DSRs reduces cost to individual
projects • Extreme case for portion of HV grid to have dynamically
assigned line loading for selected goals, e.g. minimize system losses
• Future designs may provide capacitive injection to reduce reactive impedance
• Future designs with high speed controls may be low cost alternative to FACTS
10

The IEEE 39 bus standard test system converted to a three phase system with 345kV lines
11
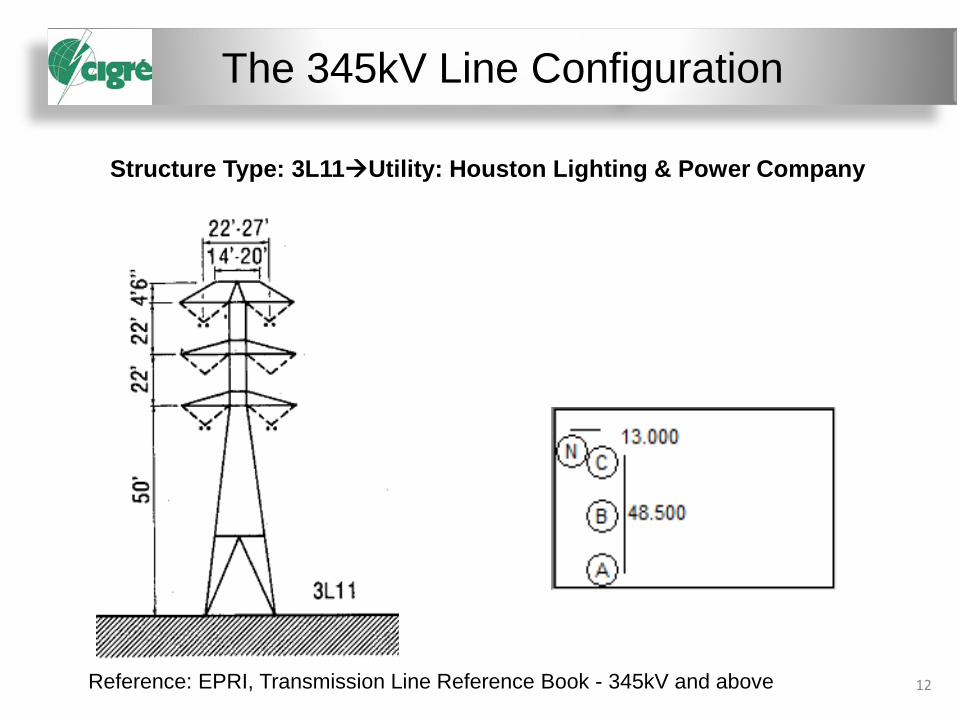
Structure Type: 3L11Utility: Houston Lighting & Power Company
Reference: EPRI, Transmission Line Reference Book - 345kV and above
The 345kV Line Configuration
12

Unbalanced:
Positive Sequence:
Positive Sequence Z is derived from the Unbalanced Model Z using the symmetrical components transformation
Line Impedance Models
13

75
900
1950
3525
5550
675
1650
3750
0
1000
2000
3000
4000
5000
6000
141% 143% 145% 147% 149% 141% 143% 145% 147% 149%
Positive Sequence Unbalanced
No.
of D
SRs d
eplo
yed
System Loading (%)
Line5-6 Line6-7 Line13-14 Total
DSR Design for Load Growth
14
0
5
10
15
20
25
30
35
40
141% 143% 145% 147% 149%
Slop
e (M
W/D
SR)
System Loading (%)
Positive Sequence Unbalanced
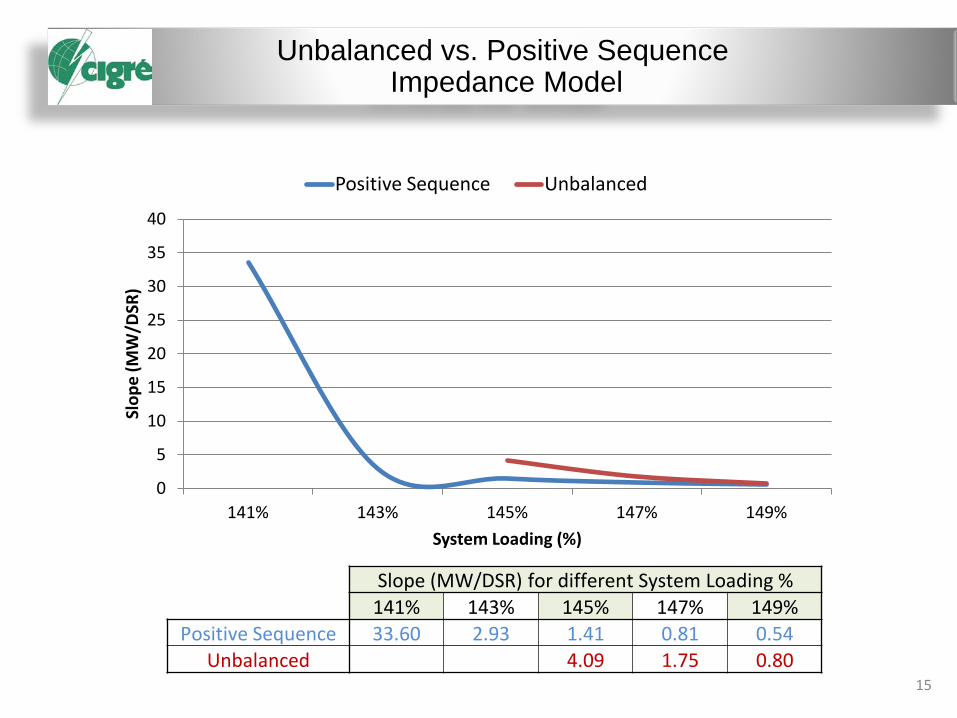
Slope (MW/DSR) for different System Loading % 141% 143% 145% 147% 149%
Positive Sequence 33.60 2.93 1.41 0.81 0.54 Unbalanced 4.09 1.75 0.80
Unbalanced vs. Positive Sequence Impedance Model
15

DSR Design for Single Contingency: Unbalanced Impedance Model
16

DSRs Deployed and Load Supplied
17

Lines with DSRs Reinforced Lines
1500 DSR on line5-6 75 DSR on
line13-14
The Selected Design at 140% System Loading
18

DSR Design vs. Line Reinforcement for Single Contingency and Load
Growth: Economic Evaluation
19
• Determine the maximum MW supplied to load while handling all single contingencies – Case1: Three Lines Reinforced with No DSR – Case2: Three Lines Reinforced with DSR
• Economic assessment of both cases
Economic Evaluation
20

• Case1: With Three Lines Reinforced • 125% loading is reached
• Case2: With Three Lines Reinforced and DSRs Deployed
• 140% loading is reached and selected as a desired DSR Design due to its technical merits
– Fewer number of DSRs deployed. – Least % change in lines impedance.
Economic Evaluation Results
21

Reinforced Line Length (miles) Line2-3 37 Line6-7 29
Line15-16 29
• Cost of 345 kV, single circuit = 1298 $k /mile
• Total length of the reinforced lines = 95 miles.
Case % Loading Max MW supplied
MW increase
Base 100% 6309.4 Case1 125% 7886.6 1577.2 Case2 140% 8833.1 946.5
• Max MW supplied at different % loading:
Data for the Economic Study
22

• Cost of 95 miles of line = 95 x 1298 k$ = 123.31 $M • Cost for 1577.2 MW of load increase =
123.31 $M • Cost per MW of load increase for
reinforcing lines = 123.31 $M/1577.2 MW = 78,182 $/MW
Line Reinforcement Cost
23

• For the selected DSR design, a loading of 140% is achieved using 1575 DSR modules.
• DSR worth in terms of transmission line value: – Cost of 946.5 MW of load increase =
946.5 MW x 78,182.8 $/MW = 74 $M – Thus the equivalent value of 1 DSR =
74 $M/1575 DSRs = 46,984 $/DSR
DSR Design Cost: Unbalanced Model
24

Questions
25
Recommended