Infosys Limited and Subsidiaries
Unaudited Condensed Consolidated Balance Sheet as at
(Dollars in millions except equity share data)
Note December 31, 2017 March 31, 2017
ASSETS
Current assets
Cash and cash equivalents 2.1 3,226 3,489
Current investments 2.2 389 1,538
Trade receivables 2,057 1,900
Unbilled revenue 573 562
Prepayments and other current assets 2.4 891 749
Income tax assets 84
Derivative financial instruments 2.3 13 44
Total current assets 7,233 8,282
Non-current assets
Property, plant and equipment 2.7 1,853 1,807
Goodwill 2.8 583 563
Intangible assets 94 120
Investment in associate - 11
Non-current investments 2.2 957 984
Deferred income tax assets 184 83
Income tax assets 863 881
Other non-current assets 2.4 122 123
Total Non-current assets 4,656 4,572
Total assets 11,889 12,854
LIABILITIES AND EQUITY
Current liabilities
Trade payables 79 57
Derivative financial instruments 2.3 1 -
Current income tax liabilities 397 599
Client deposits 24 5
Unearned revenue 362 274
Employee benefit obligations 227 209
Provisions 2.6 71 63
Other current liabilities 2.5 1,040 954
Total current liabilities 2,201 2,161
Non-current liabilities
Deferred income tax liabilities 100 32
Employee benefit obligations 8 -
Other non-current liabilities 2.5 36 24
Total liabilities 2,345 2,217
Equity
Share premium 243 587
Retained earnings 11,099 12,190
Cash flow hedge reserve - 6
Other reserves 161 -
Capital redemption reserve 9 -
Other components of equity (2,158) (2,345)
Total equity attributable to equity holders of the company 9,544 10,637
Non-controlling interests - -
Total equity 9,544 10,637
Total liabilities and equity 11,889 12,854
The accompanying notes form an integral part of the unaudited interim condensed consolidated financial statements.
for and on behalf of the Board of Directors of Infosys Limited
Nandan M. Nilekani Salil Parekh U. B. Pravin Rao
Chairman Chief Executive officer Chief Operating Officer
and Managing Director and Whole-time Director
Bengaluru D. Sundaram M. D. Ranganath A. G. S. Manikantha
January 12, 2018 Director Chief Financial Officer Company Secretary
Share capital - `5 ($0.16) par value 2,400,000,000 (2,400,000,000) equity shares authorized, issued
and outstanding 2,173,143,893 (2,285,655,150) net of 10,805,896 (11,289,514) treasury shares, as at
December 31, 2017 (March 31, 2017), respectively
190 199

Infosys Limited and Subsidiaries
Unaudited Condensed Consolidated Statements of Comprehensive Income
(Dollars in millions except equity share and per equity share data)
Note
2017 2016 2017 2016
Revenues 2,755 2,551 8,134 7,639
Cost of sales 2.15 1,773 1,601 5,208 4,832
Gross profit 982 950 2,926 2,807
Operating expenses:
Selling and marketing expenses 2.15 136 131 405 402
Administrative expenses 2.15 177 179 555 519
Total operating expenses 313 310 960 921
Operating profit 669 640 1,966 1,886
Other income, net 149 121 413 347
Share in associate's profit / (loss) - - - (1)
Write-down of investment in associate - - (11) -
Profit before income taxes 818 761 2,368 2,232
Income tax expense 2.11 22 214 453 635
Net profit 796 547 1,915 1,597
Other comprehensive income
Items that will not be reclassified subsequently to profit or loss:
Re-measurements of the net defined benefit liability/asset 2 (1) 3 (10)
Cumulative impact on reversal of unrealized gain on quoted debt
securities on adoption of IFRS 92.2
- - - (5)
Equity instruments through other comprehensive income, net - - - -
2 (1) 3 (15)
Items that will be reclassified subsequently to profit or loss:
Fair valuation of investments, net 2.2 (4) - 2 -
Fair value changes on derivatives designated as cash flow hedge,
net
1 4 (6) 4
Foreign currency translation 229 (189) 182 (243)
226 (185) 178 (239)
Total other comprehensive income/(loss), net of tax 228 (186) 181 (254)
Total comprehensive income 1,024 361 2,096 1,343
Profit attributable to:
Owners of the company 796 547 1,915 1,597
Non-controlling interests - - - -
796 547 1,915 1,597
Total comprehensive income attributable to:
Owners of the company 1,024 361 2,096 1,343
Non-controlling interests - - - -
1,024 361 2,096 1,343
Earnings per equity share
Basic ($) 0.35 0.24 0.84 0.70
Diluted ($) 0.35 0.24 0.84 0.70
Weighted average equity shares used in computing earnings
per equity share2.12
Basic 2,275,074,804 2,285,651,730 2,282,186,771 2,285,638,678
Diluted 2,276,381,570 2,286,229,042 2,284,287,492 2,286,076,462
The accompanying notes form an integral part of the unaudited interim condensed consolidated financial statements.
for and on behalf of the Board of Directors of Infosys Limited
Nandan M. Nilekani Salil Parekh U. B. Pravin Rao
Chairman Chief Executive officer Chief Operating Officer
and Managing Director and Whole-time Director
Bengaluru D. Sundaram M. D. Ranganath A. G. S. Manikantha
January 12, 2018 Director Chief Financial Officer Company Secretary
Three months ended December 31, Nine months ended December 31,

Infosys Limited and Subsidiaries
Unaudited Condensed Consolidated Statements of Changes in Equity
Shares(1) Share
capital
Share
premium
Retained
earnings
Other
reserves (2)
Capital
redemption
reserve
Cash flow
hedge
reserve
Other
components
of equity
Total equity attributable
to equity holders of the
company
2,285,621,088 199 570 11,083 - - - (2,528) 9,324
- - - - - - - (5) (5)
Shares issued on exercise of employee stock options (refer to note 2.10) 30,642 - - - - - - - -
Transfer to other reserves - - - (122) 122 - - - -
Transfer from other reserves on utilization - - - 122 (122) - - - -
Employee stock compensation expense (refer to note 2.10) - - 10 - - - - - 10
Fair value changes on derivatives designated as cash flow hedge, net - - - - - - 4 - 4
- - - - - - - (10) (10)
- - - (1,033) - - - - (1,033)
Net profit - - - 1,597 - - - - 1,597
- - - - - - - (243) (243)
2,285,651,730 199 580 11,647 - - 4 (2,786) 9,644
2,285,655,150 199 587 12,190 - - 6 (2,345) 10,637
532,221 - - - - - - - -
Transfer to other reserves - - - (227) 227 - - -
Transfer from other reserves on utilization - - - 66 (66) - - - -
Employee stock compensation expense (Refer to note 2.10) - - 9 - - - - - 9
Transfer on account of options not exercised - - - - - - - - -
(113,043,478) (9) (346) (1,680) - - - - (2,035)
- - (7) - - - - - (7)
- - - (9) - 9 -
- -
- - - - - - (6) - (6)
- - - - - - - - -
- - - - - - - 2 2
- - - - - - - 3 3
- - - (1,156) - - - - (1,156)
Net profit - - - 1,915 - - - - 1,915
- - - - - - - 182 182
2,173,143,893 190 243 11,099 161 9 - (2,158) 9,544
Nandan M. Nilekani Salil Parekh U. B. Pravin Rao
Chairman Chief Executive officer Chief Operating Officer
and Managing Director and Whole-time Director
Bengaluru D. Sundaram M. D. Ranganath A. G. S. Manikantha
January 12, 2018 Director Chief Financial Officer Company Secretary
Equity instruments through other comprehensive income, net of taxes (Refer
to note 2.2)
Fair value changes on investments, net of taxes (Refer to note 2.2)
(1) excludes treasury shares of 10,805,896 as at December 31, 2017, 11,289,514 as at April 1, 2017, 11,292,934 as at December 31, 2016 and 11,323,576 as at April 1, 2016, held by consolidated trust.
(Dollars in millions except equity share data)
Changes in equity for the nine months ended December 31, 2016
Remeasurement of the net defined benefit liability/asset, net of taxes
Dividends (including corporate dividend tax)
Balance as at April 1, 2016
Cumulative impact on reversal of unrealized gain on quoted debt securities
on adoption of IFRS 9 (3)
Amount paid upon buyback (refer note 2.16)
Transaction costs related to buyback (refer note 2.16)
Amount transferred to capital redemption reserve upon Buyback (refer note
2.16)
Exchange differences on translation of foreign operations
Balance as at December 31, 2016
Balance as at December 31, 2017
Remeasurement of the net defined benefit liability/asset, net of taxes
(2)Represents the Special Economic Zone Re-investment reserve created out of the profit of the eligible SEZ unit in terms of the provisions of Sec 10AA(1)(ii) of Income Tax Act,1961. The reserve should be utilized by
the Company for acquiring new plant and machinery for the purpose of its business in terms of the provisions of the Sec 10AA(2) of the Income Tax Act, 1961.(3)
Represents cumulative impact on account of adoption of IFRS 9, recorded in other comprehensive income during the year ended March 31, 2017. The adoption of IFRS 9 did not have a material impact on the
financial statements.
The accompanying notes form an integral part of the unaudited condensed consolidated interim financial statements.
Changes in equity for the nine months ended December 31, 2017
Dividends (including corporate dividend tax)
Foreign currency translation
Balance as at April 1, 2017
Shares issued on exercise of employee stock options (refer to note 2.10)
for and on behalf of the Board of Directors of Infosys Limited
Fair value changes on derivatives designated as cash flow hedge, net of taxes
(Refer to note 2.3)

Infosys Limited and Subsidiaries
Unaudited Condensed Consolidated Statements of Cash Flows(Dollars in millions)
Note
2017 2016
Operating activities:
Net Profit 1,915 1,597
Depreciation and amortization 2.15 218 187
Interest and dividend income (104) (23)
Income tax expense 2.11 453 635
Effect of exchange rate changes on assets and liabilities 2 6
Impairment loss on financial assets 10 11
Other adjustments 3 24
Changes in working capital
Trade receivables and unbilled revenue (138) (308) Prepayments and other assets (94) (137) Trade payables 20 (8) Client deposits 18 - Unearned revenue 83 73 Other liabilities and provisions 102 93 Cash generated from operations 2,488 2,150
Income taxes paid (746) (598) Net cash provided by operating activities 1,742 1,552
Investing activities:
(213) (311)
Loans to employees 3 8 Deposits placed with corporation (5) (22) Interest and dividend received 50 20 Payment for acquisition of business, net of cash acquired 2.9 (4) - Payment of contingent consideration pertaining to acquisition of business (5) (5) Investment in equity and preference securities (4) (8) Investment in others (2) (3) Proceeds from sale of equity and preference securities 4 - Investment in quoted debt securities (16) (536) Redemption of quoted debt securities 2 1 Investment in certificate of deposits (352) - Redemption of certificate of deposits 1,504 - Investment in liquid mutual fund units and fixed maturity plan securities (7,431) (5,541) Redemption of liquid mutual fund units and fixed maturity plan securities 7,592 4,911 Net cash used in investing activities 1,123 (1,486)
Financing activities:
Payment of dividend (including corporate dividend tax) (1,156) (1,032) Buy back of shares including transaction costs (2,042) - Net cash used in financing activities (3,198) (1,032)
Effect of exchange rate changes on cash and cash equivalents 70 (125) Net increase / (decrease) in cash and cash equivalents (333) (966)
Cash and cash equivalents at the beginning of the period 2.1 3,489 4,935
Cash and cash equivalents at the end of the period 2.1 3,226 3,844
Supplementary information:
Restricted cash balance 2.1 87 76
The accompanying notes form an integral part of the unaudited interim condensed consolidated financial statements
for and on behalf of the Board of Directors of Infosys Limited
Nandan M. Nilekani Salil Parekh U. B. Pravin Rao
Chairman Chief Executive officer Chief Operating Officer
and Managing Director and Whole-time Director
Bengaluru D. Sundaram M. D. Ranganath A. G. S. Manikantha
January 12, 2018 Director Chief Financial Officer Company Secretary
Nine months ended December 31,
Adjustments to reconcile net profit to net cash provided by operating
activities :
Expenditure on property, plant and equipment, net of sale proceeds

Notes to the Unaudited Condensed Consolidated Interim Financial Statements
1. Company Overview and Significant Accounting Policies
1.1 Company overview
Infosys Limited ('the Company' or Infosys) is a leading provider of consulting, technology, outsourcing and next-generation services and software. Along with its
subsidiaries, Infosys provides Business IT services (comprising application development and maintenance, independent validation, infrastructure management, engineering
services comprising product engineering and life cycle solutions and business process management); Consulting and systems integration services (comprising consulting,
enterprise solutions, systems integration and advanced technologies); Products, business platforms and solutions to accelerate intellectual property-led innovation. Its new
offerings span areas like digital, big data and analytics, cloud, data and mainframe modernization, cyber security, IoT engineering Services and API & micro services.
Infosys together with its subsidiaries and controlled trusts is herein after referred to as the "Group".
The company is a public limited company incorporated and domiciled in India and has its registered office at Bengaluru, Karnataka, India. The company has its primary
listings on the BSE Ltd. and National Stock Exchange in India. The company’s American Depositary Shares representing equity shares are also listed on the New York
Stock Exchange (NYSE), Euronext London and Euronext Paris.
The Group's unaudited condensed consolidated interim financial statements are authorized for issue by the company's Board of Directors on January 12, 2018.
1.2 Basis of preparation of financial statements
These interim condensed consolidated financial statements have been prepared in accordance with IAS 34, Interim Financial Reporting, as issued by the International
Accounting Standards Board (IASB), under the historical cost convention on the accrual basis except for certain financial instruments which have been measured at fair
values. Accordingly, these condensed consolidated interim financial statements do not include all the information required for a complete set of financial statements. These
condensed consolidated interim financial statements should be read in conjunction with the consolidated financial statements and related notes included in the company’s
Annual Report on Form 20-F for the year ended March 31, 2017. Accounting policies have been applied consistently to all periods presented in these unaudited interim
condensed consolidated financial statements.
As the quarter and period-to-date figures are taken from the source and rounded to the nearest digits, the quarter figures in this statement added up to the figures reported
for the previous quarters might not always add up to the period-to-date figures reported in this statement.
1.3 Basis of consolidation
Infosys consolidates entities which it owns or controls. The consolidated interim financial statements comprise the financial statements of the company, its controlled
trusts, its subsidiaries and associate. Control exists when the parent has power over the entity, is exposed, or has rights, to variable returns from its involvement with the
entity and has the ability to affect those returns by using its power over the entity. Power is demonstrated through existing rights that give the ability to direct relevant
activities, those which significantly affect the entity's returns. Subsidiaries are consolidated from the date control commences until the date control ceases.
The financial statements of the Group companies are consolidated on a line-by-line basis and intra-group balances and transactions including unrealized gain / loss from
such transactions are eliminated upon consolidation. These financial statements are prepared by applying uniform accounting policies in use at the Group. Non-controlling
interests which represent part of the net profit or loss and net assets of subsidiaries that are not, directly or indirectly, owned or controlled by the company, are excluded.
Associates are entities over which the group has significant influence but not control. Investments in associates are accounted for using the equity method of accounting.
The investment is initially recognized at cost, and the carrying amount is increased or decreased to recognize the investor’s share of the profit or loss of the investee after
the acquisition date. The group’s investment in associates includes goodwill identified on acquisition.
1.4 Use of estimates
The preparation of the financial statements in conformity with IFRS requires management to make estimates, judgments and assumptions. These estimates, judgments and
assumptions affect the application of accounting policies and the reported amounts of assets and liabilities, the disclosures of contingent assets and liabilities at the date of
the financial statements and reported amounts of revenues and expenses during the period. Application of accounting policies that require critical accounting estimates
involving complex and subjective judgments and the use of assumptions in these financial statements have been disclosed in Note 1.5. Accounting estimates could change
from period to period. Actual results could differ from those estimates. Appropriate changes in estimates are made as management becomes aware of changes in
circumstances surrounding the estimates. Changes in estimates are reflected in the financial statements in the period in which changes are made and, if material, their
effects are disclosed in the notes to the interim condensed consolidated financial statements.
1.5 Critical accounting estimates
a. Revenue recognition
The group uses the percentage-of-completion method in accounting for its fixed-price contracts. Use of the percentage-of-completion method requires the group to
estimate the efforts or costs expended to date as a proportion of the total efforts or costs to be expended. Efforts or costs expended have been used to measure progress
towards completion as there is a direct relationship between input and productivity. Provisions for estimated losses, if any, on uncompleted contracts are recorded in the
period in which such losses become probable based on the expected contract estimates at the reporting date.
b. Income taxes
The company's two major tax jurisdictions are India and the U.S., though the company also files tax returns in other overseas jurisdictions. Significant judgments are
involved in determining the provision for income taxes, including amount expected to be paid/recovered for uncertain tax positions (also refer to note 2.11).
c. Business combinations and intangible assets
Business combinations are accounted for using IFRS 3 (Revised), Business Combinations. IFRS 3 requires the identifiable intangible assets and contingent consideration
to be fair valued in order to ascertain the net fair value of identifiable assets, liabilities and contingent liabilities of the acquiree. Significant estimates are required to be
made in determining the value of contingent consideration and intangible assets. These valuations are conducted by independent valuation experts.
d. Property, plant and equipment
Property, plant and equipment represent a significant proportion of the asset base of the Group. The charge in respect of periodic depreciation is derived after determining
an estimate of an asset’s expected useful life and the expected residual value at the end of its life. The useful lives and residual values of Group's assets are determined by
management at the time the asset is acquired and reviewed periodically, including at each financial year end. The lives are based on historical experience with similar
assets as well as anticipation of future events, which may impact their life, such as changes in technology.
e. Impairment of Goodwill
Goodwill is tested for impairment on an annual basis and whenever there is an indication that the recoverable amount of a cash generating unit is less than its carrying
amount based on a number of factors including operating results, business plans, future cash flows and economic conditions. The recoverable amount of cash generating
units is determined based on higher of value-in-use and fair value less cost to sell. The goodwill impairment test is performed at the level of the cash-generating unit or
groups of cash-generating units which are benefitting from the synergies of the acquisition and which represents the lowest level at which goodwill is monitored for
internal management purposes.
Market related information and estimates are used to determine the recoverable amount. Key assumptions on which management has based its determination of
recoverable amount include estimated long term growth rates, weighted average cost of capital and estimated operating margins. Cash flow projections take into account
past experience and represent management’s best estimate about future developments.
1.6 Revenue recognition
The company derives revenues primarily from software development and related services and from the licensing of software products. Arrangements with customers for
software related services are either on a fixed-price, fixed-timeframe or on a time-and-material basis.
Revenue on time-and-material contracts are recognized as the related services are performed and revenue from the end of the last billing to the balance sheet date is
recognized as unbilled revenues. Revenue from fixed-price, fixed-timeframe contracts, where there is no uncertainty as to measurement or collectability of consideration, is
recognized as per the percentage-of-completion method. When there is uncertainty as to measurement or ultimate collectability, revenue recognition is postponed until
such uncertainty is resolved. Efforts or costs expended have been used to measure progress towards completion as there is a direct relationship between input and
productivity. Provisions for estimated losses, if any, on uncompleted contracts are recorded in the period in which such losses become probable based on the current
contract estimates. Costs and earnings in excess of billings are classified as unbilled revenue while billings in excess of costs and earnings are classified as unearned
revenue. Deferred contract costs are amortized over the term of the contract. Maintenance revenue is recognized ratably over the term of the underlying maintenance
arrangement.
In arrangements for software development and related services and maintenance services, the company has applied the guidance in IAS 18, Revenue, by applying the
revenue recognition criteria for each separately identifiable component of a single transaction. The arrangements generally meet the criteria for considering software
development and related services as separately identifiable components. For allocating the consideration, the company has measured the revenue in respect of each
separable component of a transaction at its fair value, in accordance with principles given in IAS 18. The price that is regularly charged for an item when sold separately is
the best evidence of its fair value. In cases where the company is unable to establish objective and reliable evidence of fair value for the software development and related
services, the company has used a residual method to allocate the arrangement consideration. In these cases the balance of the consideration, after allocating the fair values
of undelivered components of a transaction has been allocated to the delivered components for which specific fair values do not exist.
License fee revenues are recognized when the general revenue recognition criteria given in IAS 18 are met. Arrangements to deliver software products generally have three
elements: license, implementation and Annual Technical Services (ATS). The company has applied the principles given in IAS 18 to account for revenues from these
multiple element arrangements. Objective and reliable evidence of fair value has been established for ATS. Objective and reliable evidence of fair value is the price
charged when the element is sold separately. When other services are provided in conjunction with the licensing arrangement and objective and reliable evidence of their
fair values have been established, the revenue from such contracts are allocated to each component of the contract in a manner, whereby revenue is deferred for the
undelivered services and the residual amounts are recognized as revenue for delivered elements. In the absence of objective and reliable evidence of fair value for
implementation, the entire arrangement fee for license and implementation is recognized using the percentage-of-completion method as the implementation is performed.
Revenue from client training, support and other services arising due to the sale of software products is recognized as the services are performed. ATS revenue is
recognized ratably over the period in which the services are rendered.
Advances received for services and products are reported as client deposits until all conditions for revenue recognition are met.
The company accounts for volume discounts and pricing incentives to customers as a reduction of revenue based on the ratable allocation of the discounts/ incentives
amount to each of the underlying revenue transaction that results in progress by the customer towards earning the discount/ incentive. Also, when the level of discount
varies with increases in levels of revenue transactions, the company recognizes the liability based on its estimate of the customer's future purchases. If it is probable that
the criteria for the discount will not be met, or if the amount thereof cannot be estimated reliably, then discount is not recognized until the payment is probable and the
amount can be estimated reliably. The company recognizes changes in the estimated amount of obligations for discounts in the period in which the change occurs. The
discounts are passed on to the customer either as direct payments or as a reduction of payments due from the customer.
The Group presents revenues net of indirect taxes in its statement of comprehensive income.
1.7 Property, plant and equipment
Property, plant and equipment are stated at cost, less accumulated depreciation and impairment, if any. Costs directly attributable to acquisition are capitalized until the
property, plant and equipment are ready for use, as intended by management. The group depreciates property, plant and equipment over their estimated useful lives using
the straight-line method. The estimated useful lives of assets are as follows:
Building 22-25 years
Plant and machinery 5 years
Computer equipment 3-5 years
Furniture and fixtures 5 years
Vehicles 5 years
Leasehold improvements Over lease term
Depreciation methods, useful lives and residual values are reviewed periodically, including at each financial year end. (Refer to note 2.7)
Advances paid towards the acquisition of property, plant and equipment outstanding at each balance sheet date and the cost of assets not put to use before such date are
disclosed under ‘Capital work-in-progress’. Subsequent expenditures relating to property, plant and equipment is capitalized only when it is probable that future economic
benefits associated with these will flow to the Group and the cost of the item can be measured reliably. Repairs and maintenance costs are recognized in net profit in the
statement of comprehensive income when incurred. The cost and related accumulated depreciation are eliminated from the financial statements upon sale or retirement of
the asset and the resultant gains or losses are recognized in net profit in the statement of comprehensive income. Assets to be disposed off are reported at the lower of the
carrying value or the fair value less cost to sell.

1.8 Business combinations
Business combinations have been accounted for using the acquisition method under the provisions of IFRS 3 (Revised), Business Combinations.
The cost of an acquisition is measured at the fair value of the assets transferred, equity instruments issued and liabilities incurred or assumed at the date of acquisition,
which is the date on which control is transferred to the Group. The cost of acquisition also includes the fair value of any contingent consideration. Identifiable assets
acquired and liabilities and contingent liabilities assumed in a business combination are measured initially at their fair value on the date of acquisition.
Business combinations between entities under common control is outside the scope of IFRS 3 (Revised), Business Combinations and is accounted for at carrying value.
Transaction costs that the Group incurs in connection with a business combination such as finders’ fees, legal fees, due diligence fees, and other professional and
consulting fees are expensed as incurred.
1.9 Financial instruments
Effective April 1, 2016, the group has elected to early adopt IFRS 9 - Financial Instruments considering April 1, 2015 as the date of initial application of the standard even
though the stipulated effective date for adoption is April 1, 2018.
As per IFRS 9, the group has classified its financial assets into the following categories based on the business model for managing those assets and the contractual cash
flow characteristics:
- Financial assets carried at amortized cost
- Financial assets fair valued through other comprehensive income
- Financial assets fair valued through profit and loss
The adoption of IFRS 9 did not have any other material impact on the consolidated financial statements.
1.9.1 Initial recognition
The group recognizes financial assets and financial liabilities when it becomes a party to the contractual provisions of the instrument. All financial assets and liabilities are
recognized at fair value on initial recognition, except for trade receivables which are initially measured at transaction price. Transaction costs that are directly attributable
to the acquisition or issue of financial assets and financial liabilities, that are not at fair value through profit or loss, are added to the fair value on initial recognition.
Regular way purchase and sale of financial assets are accounted for at trade date.
1.9.2 Subsequent measurement
a. Non-derivative financial instruments
(i) Financial assets carried at amortized cost
A financial asset is subsequently measured at amortized cost if it is held within a business model whose objective is to hold the asset in order to collect contractual cash
flows and the contractual terms of the financial asset give rise on specified dates to cash flows that are solely payments of principal and interest on the principal amount
outstanding.
(ii) Financial assets at fair value through other comprehensive income(FVOCI)
A financial asset is subsequently measured at fair value through other comprehensive income if it is held within a business model whose objective is achieved by both
collecting contractual cash flows and selling financial assets and the contractual terms of the financial asset give rise on specified dates to cash flows that are solely
payments of principal and interest on the principal amount outstanding. The Company has made an irrevocable election for its investments which are classified as equity
instruments to present the subsequent changes in fair value in other comprehensive income based on its business model. Further, in cases where the Group has made an
irrevocable election based on its business model, for its investments which are classified as equity instruments, the subsequent changes in fair value are recognized in
other comprehensive income(OCI).
(iii) Financial assets at fair value through profit or loss(FVTPL)
A financial asset which is not classified in any of the above categories are subsequently fair valued through profit or loss.
(iv) Financial liabilities
Financial liabilities are subsequently carried at amortized cost using the effective interest method, except for contingent consideration recognized in a business combination
which is subsequently measured at fair value through profit and loss. For trade and other payables maturing within one year from the balance sheet date, the carrying
amounts approximate fair value due to the short maturity of these instruments.
b. Derivative financial instruments
The group holds derivative financial instruments such as foreign exchange forward and option contracts to mitigate the risk of changes in exchange rates on foreign
currency exposures. The counterparty for these contracts is generally a bank.
(i) Financial assets or financial liabilities, at fair value through profit or loss.
This category has derivative financial assets or liabilities which are not designated as hedges.
Although the group believes that these derivatives constitute hedges from an economic perspective, they may not qualify for hedge accounting under IFRS 9, Financial
Instruments. Any derivative that is either not designated as hedge, or is so designated but is ineffective as per IFRS 9, is categorized as a financial asset or financial
liability, at fair value through profit or loss.
Derivatives not designated as hedges are recognized initially at fair value and attributable transaction costs are recognized in net profit in the statement of comprehensive
income when incurred. Subsequent to initial recognition, these derivatives are measured at fair value through profit or loss and the resulting exchange gains or losses are
included in other income. Assets/ liabilities in this category are presented as current assets/current liabilities if they are either held for trading or are expected to be realized
within 12 months after the balance sheet date.

(ii) Cash flow hedge
The group designates certain foreign exchange forward and options contracts as cash flow hedges to mitigate the risk of foreign exchange exposure on highly probable
forecast cash transactions.
When a derivative is designated as a cash flow hedging instrument, the effective portion of changes in the fair value of the derivative is recognized in other comprehensive
income and accumulated in the cash flow hedging reserve. Any ineffective portion of changes in the fair value of the derivative is recognized immediately in the net profit
in the statement of comprehensive income. If the hedging instrument no longer meets the criteria for hedge accounting, then hedge accounting is discontinued
prospectively. If the hedging instrument expires or is sold, terminated or exercised, the cumulative gain or loss on the hedging instrument recognized in cash flow hedging
reserve till the period the hedge was effective remains in cash flow hedging reserve until the forecasted transaction occurs. The cumulative gain or loss previously
recognized in the cash flow hedging reserve is transferred to the net profit in the statement of comprehensive income upon the occurrence of the related forecasted
transaction. If the forecasted transaction is no longer expected to occur, then the amount accumulated in cash flow hedging reserve is reclassified to net profit in the
statement of comprehensive income.
c. Share capital and treasury shares
(i) Ordinary Shares
Ordinary shares are classified as equity. Incremental costs directly attributable to the issuance of new ordinary shares and share options are recognized as a deduction from
equity, net of any tax effects.
(ii) Treasury Shares
When any entity within the Group purchases the company's ordinary shares, the consideration paid including any directly attributable incremental cost is presented as a
deduction from total equity, until they are cancelled, sold or reissued. When treasury shares are sold or reissued subsequently, the amount received is recognized as an
increase in equity, and the resulting surplus or deficit on the transaction is transferred to/ from share premium.
1.9.3 Derecognition of financial instruments
The group derecognizes a financial asset when the contractual rights to the cash flows from the financial asset expire or it transfers the financial asset and the transfer
qualifies for derecognition under IFRS 9. A financial liability (or a part of a financial liability) is derecognized from the group's balance sheet when the obligation specified
in the contract is discharged or cancelled or expires.
1.10 Fair value of financial instruments
In determining the fair value of its financial instruments, the group uses a variety of methods and assumptions that are based on market conditions and risks existing at each
reporting date. The methods used to determine fair value include discounted cash flow analysis, available quoted market prices and dealer quotes. All methods of assessing
fair value result in general approximation of value, and such value may never actually be realized.
Refer to Note 2.3 for the disclosure on carrying value and fair value of financial assets and liabilities. For financial assets and liabilities maturing within one year from the
Balance Sheet date and which are not carried at fair value, the carrying amounts approximate fair value due to the short maturity of these instruments.
1.11 Impairment
a. Financial assets
The Group recognizes loss allowances using the expected credit loss (ECL) model for the financial assets which are not fair valued through profit or loss. Loss allowance
for trade receivables with no significant financing component is measured at an amount equal to lifetime ECL. For all other financial assets, expected credit losses are
measured at an amount equal to the 12-month ECL, unless there has been a significant increase in credit risk from initial recognition in which case those are measured at
lifetime ECL. The amount of expected credit losses (or reversal) that is required to adjust the loss allowance at the reporting date to the amount that is required to be
recognized is recognized as an impairment gain or loss in statement of profit or loss.
b. Non-financial assets
(i) Goodwill
Goodwill is tested for impairment on an annual basis and whenever there is an indication that goodwill may be impaired, relying on a number of factors including operating
results, business plans and future cash flows. For the purpose of impairment testing, goodwill acquired in a business combination is allocated to the Group's cash
generating units (CGU) or groups of CGU’s expected to benefit from the synergies arising from the business combination. A CGU is the smallest identifiable group of
assets that generates cash inflows that are largely independent of the cash inflows from other assets or group of assets. Impairment occurs when the carrying amount of a
CGU including the goodwill, exceeds the estimated recoverable amount of the CGU. The recoverable amount of a CGU is the higher of its fair value less cost to sell and
its value-in-use. Value-in-use is the present value of future cash flows expected to be derived from the CGU.
Total impairment loss of a CGU is allocated first to reduce the carrying amount of goodwill allocated to the CGU and then to the other assets of the CGU pro-rata on the
basis of the carrying amount of each asset in the CGU. An impairment loss on goodwill is recognized in net profit in the statement of comprehensive income and is not
reversed in the subsequent period.
(ii) Intangible assets and property, plant and equipment
Intangible assets and property, plant and equipment are evaluated for recoverability whenever events or changes in circumstances indicate that their carrying amounts may
not be recoverable. For the purpose of impairment testing, the recoverable amount (i.e. the higher of the fair value less cost to sell and the value-in-use) is determined on an
individual asset basis unless the asset does not generate cash flows that are largely independent of those from other assets. In such cases, the recoverable amount is
determined for the CGU to which the asset belongs.
If such assets are considered to be impaired, the impairment to be recognized in net profit in the statement of comprehensive income is measured by the amount by which
the carrying value of the assets exceeds the estimated recoverable amount of the asset. An impairment loss is reversed in net profit in the statement of comprehensive
income if there has been a change in the estimates used to determine the recoverable amount. The carrying amount of the asset is increased to its revised recoverable
amount, provided that this amount does not exceed the carrying amount that would have been determined (net of any accumulated amortization or depreciation) had no
impairment loss been recognized for the asset in prior years.

1.12 Employee benefits
1.12.1 Gratuity
The Group provides for gratuity, a defined benefit retirement plan ('the Gratuity Plan') covering eligible employees of Infosys and its Indian subsidiaries. The Gratuity Plan
provides a lump-sum payment to vested employees at retirement, death, incapacitation or termination of employment, of an amount based on the respective employee's
salary and the tenure of employment with the group.
Liabilities with regard to the Gratuity Plan are determined by actuarial valuation, performed by an independent actuary, at each balance sheet date using the projected unit
credit method. The company fully contributes all ascertained liabilities to the Infosys Limited Employees' Gratuity Fund Trust (the Trust). In case of Infosys BPM
(formerly Infosys BPO) and EdgeVerve, contributions are made to the Infosys BPO's Employees' Gratuity Fund Trust and EdgeVerve Systems Limited Employees'
Gratuity Fund Trust, respectively. Trustees administer contributions made to the Trusts and contributions are invested in a scheme with Life Insurance Corporation of India
as permitted by law of India.
The Group recognizes the net obligation of a defined benefit plan in its balance sheet as an asset or liability. Gains and losses through re-measurements of the net defined
benefit liability / asset are recognized in other comprehensive income and not reclassified to profit and loss in subsequent period. The actual return of the portfolio of plan
assets, in excess of the yields computed by applying the discount rate used to measure the defined benefit obligation is recognized in other comprehensive income. The
effect of any plan amendments are recognized in net profits in the statement of comprehensive income.
1.12.2 Superannuation
Certain employees of Infosys, Infosys BPM (formerly Infosys BPO) and EdgeVerve are participants in a defined contribution plan. The Group has no further obligations to
the Plan beyond its monthly contributions which are periodically contributed to a trust fund, the corpus of which is invested with the Life Insurance Corporation of India.
1.12.3 Provident fund
Eligible employees of Infosys receive benefits from a provident fund, which is a defined benefit plan. Both the eligible employee and the company make monthly
contributions to the provident fund plan equal to a specified percentage of the covered employee's salary. The company contributes a portion of the contributions to the
Infosys Limited Employees' Provident Fund Trust. The trust invests in specific designated instruments as permitted by Indian law. The remaining portion is contributed to
the government administered pension fund. The rate at which the annual interest is payable to the beneficiaries by the trust is being administered by the government. The
company has an obligation to make good the shortfall, if any, between the return from the investments of the Trust and the notified interest rate.
In respect of Indian subsidiaries, eligible employees receive benefits from a provident fund, which is a defined contribution plan. Both the eligible employee and the
respective companies make monthly contributions to this provident fund plan equal to a specified percentage of the covered employee's salary. Amounts collected under
the provident fund plan are deposited in a government administered provident fund. The companies have no further obligation to the plan beyond its monthly contributions.
1.12.4 Compensated absences
The Group has a policy on compensated absences which are both accumulating and non-accumulating in nature. The expected cost of accumulating compensated absences
is determined by actuarial valuation performed by an independent actuary at each balance sheet date using projected unit credit method on the additional amount expected
to be paid/availed as a result of the unused entitlement that has accumulated at the balance sheet date. Expense on non-accumulating compensated absences is recognized
in the period in which the absences occur.
1.13 Share - based compensation
The Group recognizes compensation expense relating to share-based payments in net profit using fair-value in accordance with IFRS 2, Share-Based Payment. The
estimated fair value of awards is charged to income on a straight-line basis over the requisite service period for each separately vesting portion of the award as if the award
was in-substance, multiple awards with a corresponding increase to share premium.
Amendment to IFRS 2:
Effective April 1, 2017, the company has early adopted amendment to IFRS 2 which provides specific guidance to measurement of cash-settled awards, modification of
cash-settled awards and awards that include a net settlement feature in respect of withholding taxes. The adoption of the amendment did not have any material effect on the
consolidated financial statements.
1.14 Earnings per equity share
Basic earnings per equity share is computed by dividing the net profit attributable to the equity holders of the company by the weighted average number of equity shares
outstanding during the period. Diluted earnings per equity share is computed by dividing the net profit attributable to the equity holders of the company by the weighted
average number of equity shares considered for deriving basic earnings per equity share and also the weighted average number of equity shares that could have been issued
upon conversion of all dilutive potential equity shares. The dilutive potential equity shares are adjusted for the proceeds receivable had the equity shares been actually
issued at fair value (i.e. the average market value of the outstanding equity shares). Dilutive potential equity shares are deemed converted as of the beginning of the period,
unless issued at a later date. Dilutive potential equity shares are determined independently for each period presented.
The number of equity shares and potentially dilutive equity shares are adjusted retrospectively for all periods presented for any share splits and bonus shares issues
including for changes effected prior to the approval of the financial statements by the Board of Directors.
1.15 Cash Flow Statement
Cash flows are reported using the indirect method, whereby profit for the period is adjusted for the effects of transactions of a non-cash nature, any deferrals or accruals of
past or future operating cash receipts or payments and item of income or expenses associated with investing or financing cash flows. The cash flows from operating,
investing and financing activities of the Company are segregated.
Amendment to IAS 7:
Effective April 1, 2017, the company adopted the amendment to IAS 7, which require the entities to provide disclosures that enable users of financial statements to
evaluate changes in liabilities arising from financing activities, including both changes arising from cash flows and non-cash changes, suggesting inclusion of a
reconciliation between the opening and closing balances in the Balance Sheet for liabilities arising from financing activities, to meet the disclosure requirement. The
adoption of amendment did not have any material effect on the consolidated financial statements.
1.16 Recent accounting pronouncements
1.16.1 Standards issued but not yet effective
IFRS 15 Revenue from Contract with Customers: In May 2014, the International Accounting Standards Board (IASB) issued IFRS 15, Revenue from Contract with
Customers. The core principle of the new standard is that an entity should recognize revenue to depict the transfer of promised goods or services to customers in an
amount that reflects the consideration to which the entity expects to be entitled in exchange for those goods or services. Further the new standard requires enhanced
disclosures about the nature, amount, timing and uncertainty of revenue and cash flows arising from the entity’s contracts with customers.
The standard permits two possible methods of transition:
• Retrospective approach - Under this approach the standard will be applied retrospectively to each prior reporting period presented in accordance with IAS 8- Accounting
Policies, Changes in Accounting Estimates and Errors
• Retrospectively with cumulative effect of initially applying the standard recognized at the date of initial application (Cumulative catch - up approach)
The effective date for adoption of IFRS 15 is annual periods beginning on or after January 1, 2018, though early adoption is permitted.
The Group does not plan to early adopt IFRS 15 and will adopt the same on April 1, 2018 by using the full retrospective transition method to restate each prior reporting
period presented. The group derives revenues primarily from software development and related services and from the licensing of software products and is currently
evaluating the effect of IFRS 15 on its consolidated financial statements and related disclosures.
IFRS 16 Leases : On January 13, 2016, the International Accounting Standards Board issued the final version of IFRS 16, Leases. IFRS 16 will replace the existing
leases Standard, IAS 17 Leases, and related Interpretations. The Standard sets out the principles for the recognition, measurement, presentation and disclosure of leases for
both parties to a contract i.e., the lessee and the lessor. IFRS 16 introduces a single lessee accounting model and requires a lessee to recognize assets and liabilities for all
leases with a term of more than 12 months, unless the underlying asset is of low value. Currently, operating lease expenses are charged to the statement of comprehensive
income. The Standard also contains enhanced disclosure requirements for lessees. IFRS 16 substantially carries forward the lessor accounting requirements in IAS 17.
The effective date for adoption of IFRS 16 is annual periods beginning on or after January 1, 2019, though early adoption is permitted for companies applying IFRS 15
Revenue from Contracts with Customers. The Group is yet to evaluate the requirements of IFRS 16 and the impact on the consolidated financial statements.
IFRIC 22, Foreign currency transactions and Advance consideration: On December 8, 2016, the IFRS interpretations committee of the International Accounting
Standards Board (IASB) issued IFRS interpretation, IFRIC 22, Foreign currency transactions and Advance consideration which clarifies the date of the transaction for the
purpose of determining the exchange rate to use on initial recognition of the related asset, expense or income, when an entity has received or paid advance consideration in
a foreign currency. The effective date for adoption of IFRIC 22 is annual reporting periods beginning on or after January 1, 2018, though early adoption is permitted. The
Group is currently evaluating the effect of IFRIC 22 on the consolidated financial statements.
IFRIC 23, Uncertainty over Income Tax Treatments: In June 2017, the International Accounting Standards Board (IASB) issued IFRS interpretation IFRIC 23
Uncertainty over Income Tax Treatments which is to be applied while performing the determination of taxable profit (or loss), tax bases, unused tax losses, unused tax
credits and tax rates, when there is uncertainty over income tax treatments under IAS 12. According to IFRIC 23, companies need to determine the probability of the
relevant tax authority accepting each tax treatment, or group of tax treatments, that the companies have used or plan to use in their income tax filing which has to be
considered to compute the most likely amount or the expected value of the tax treatment when determining taxable profit (tax loss), tax bases, unused tax losses, unused
tax credits and tax rates.
The standard permits two possible methods of transition:
Full retrospective approach – Under this approach, IFRIC 23 will be applied retrospectively to each prior reporting period presented in accordance with IAS 8 –
Accounting Policies, Changes in Accounting Estimates and Errors.
Retrospectively with cumulative effect of initially applying IFRIC 23 recognized by adjusting equity on initial application, without adjusting comparatives
The effective date for adoption of IFRIC 23 is annual periods beginning on or after January 1, 2019, though early adoption is permitted. The Group is yet to evaluate the
effect of IFRIC 23 on the consolidated financial statements.

2. Notes to the Condensed Consolidated Interim Financial Statements
2.1 Cash and cash equivalents
Cash and cash equivalents consist of the following:
(Dollars in millions)
December 31, 2017 March 31, 2017
Cash and bank deposits 1,857 2,296
Deposits with financial institutions 1,369 1,193
3,226 3,489
The table below provides details of cash and cash equivalents :
(Dollars in millions)
December 31, 2017 March 31, 2017
Current accounts
ANZ Bank, Taiwan 2 -
Banamex Bank, Mexico 1 -
Banamex Bank, Mexico (U.S. Dollar account) 2 1
Bank of America, Mexico 9 8
Bank of America, USA 147 159
Bank Leumi, Israel (US Dollar account) 1 -
Bank Leumi, Israel 2 2
Bank Zachodni WBK S.A, Poland 2 1
Barclays Bank, UK 5 -
BNP Paribas Bank, Norway 5 3
China Merchants Bank, China 1 1
Citibank N.A., Australia 13 3
Citibank N.A., Brazil 2 5
Citibank N.A., China 18 10
Citibank N.A., China (U.S. Dollar account) 4 2
Citibank N.A., Costa Rica - 1
Citibank N.A., Dubai 1 -
Citibank N.A., Hungary 1 -
Citibank N.A., Japan 5 2
Citibank N.A., New Zealand 2 2
Citibank N.A., Portugal 1 -
Citibank N.A., South Africa 4 2
Citibank N.A., USA 9 12
Commerzbank, Germany 1 3
Deutsche Bank, Belgium 1 2
Deutsche Bank, Czech Republic 3 1
Deutsche Bank, Czech Republic (Euro account) 1 1
Deutsche Bank, Czech Republic (U.S. Dollar account) 4 5
Deutsche Bank, EEFC (Australian Dollar account) 2 6
Deutsche Bank, EEFC (Euro account) 4 4
Deutsche Bank, EEFC (U.S. Dollar account) 10 12
Deutsche Bank, EEFC (United Kingdom Pound Sterling account) 1 2
Deutsche Bank, France 2 1
Deutsche Bank, Germany 14 8
Deutsche Bank, India 1 2
Deutsche Bank, Malaysia - 1
Deutsche Bank, Netherlands 1 -
Deutsche Bank, Philippines 3 1
Deutsche Bank, Philippines (U.S. Dollar account) 1 1
Deutsche Bank, Poland 3 2
Deutsche Bank, Poland (Euro account) - 1
Deutsche Bank, Singapore - 1
Deutsche Bank, Switzerland 2 1
Deutsche Bank, United Kingdom 8 4
Deutsche Bank, USA 1 2
ICICI Bank, EEFC (U.S. Dollar account) 15 1
ICICI Bank, India 8 8
ICICI Bank - Unpaid dividend account 2 2
Nordbanken, Sweden 5 5
Punjab National Bank, India 1 1
Raiffeisen Bank, Czech Republic 1 1
Raiffeisen Bank, Romania 1 1
Royal Bank of Canada, Canada 25 13
As at
Cash and cash equivalents as at December 31, 2017 and March 31, 2017 include restricted cash and bank balances of $87 million and $88 million,
respectively. The restrictions are primarily on account of cash and bank balances held by irrevocable trusts controlled by the company, bank balances held
as margin money deposits against guarantees and balances held in unpaid dividend bank accounts.
The deposits maintained by the Group with banks and financial institutions comprise of time deposits, which can be withdrawn by the Group at any point
without prior notice or penalty on the principal.
As at
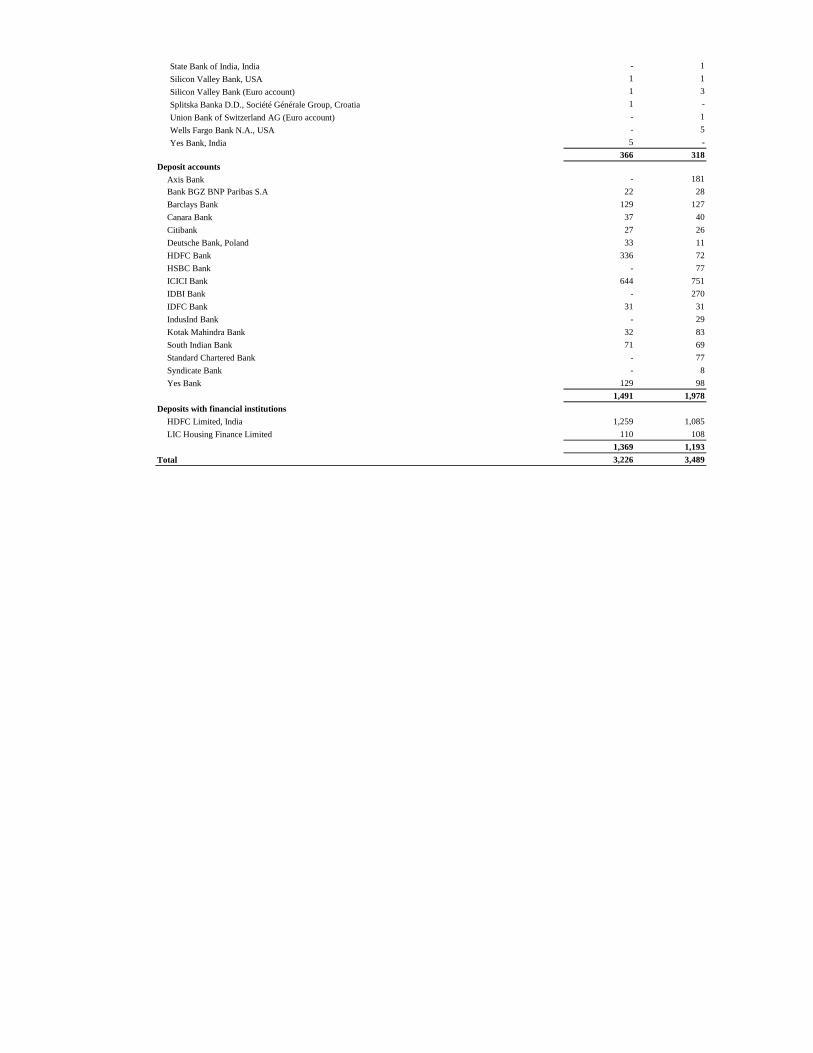
State Bank of India, India - 1
Silicon Valley Bank, USA 1 1
Silicon Valley Bank (Euro account) 1 3
Splitska Banka D.D., Société Générale Group, Croatia 1 -
Union Bank of Switzerland AG (Euro account) - 1
Wells Fargo Bank N.A., USA - 5
Yes Bank, India 5 -
366 318
Deposit accounts
Axis Bank - 181
Bank BGZ BNP Paribas S.A 22 28
Barclays Bank 129 127
Canara Bank 37 40
Citibank 27 26
Deutsche Bank, Poland 33 11
HDFC Bank 336 72
HSBC Bank - 77
ICICI Bank 644 751
IDBI Bank - 270
IDFC Bank 31 31
IndusInd Bank - 29
Kotak Mahindra Bank 32 83
South Indian Bank 71 69
Standard Chartered Bank - 77
Syndicate Bank - 8
Yes Bank 129 98
1,491 1,978
Deposits with financial institutions
HDFC Limited, India 1,259 1,085
LIC Housing Finance Limited 110 108
1,369 1,193
Total 3,226 3,489

2.2 Investments
(Dollars in millions)
December 31, 2017 March 31, 2017
(i) Current
Amortized cost
Quoted debt securities:
Cost 1 2
Fair value through profit and loss
Liquid Mutual funds
Fair value 150 278
Fixed maturity plan securities
Fair Value 25 23
Quoted debt securities
Fair value 85 16
Certificate of deposits
Fair value 128 1,219
Unquoted equity and preference securities
Fair value - -
389 1,538
(ii) Non-current
Amortized cost
Quoted debt securities
Cost 297 293
Fair value through Other comprehensive income
Quoted debt securities
Fair value 560 597
Unquoted equity and preference securities
Fair value 24 25
Fair value through profit and loss
Unquoted convertible promissory note
Fair value 2 1
Fixed maturity plan securities
Fair Value 66 63
Others
Fair value 8 5
957 984
Total investments 1,346 2,522
298 295
Investments carried at fair value through other comprehensive income 797 1,857
Investments carried at fair value through profit and loss 251 370
Investment carried at amortized cost
Fair Value through Other comprehensive income
As at
The carrying value of investments are as follows:

Liquid Mutual fund:
Fixed maturity plan securities:
Quoted debt securities carried at amortized cost:
Quoted debt securities fair valued through other comprehensive income:
Unquoted equity, preference and other investments
The fair value is determined using Level 3 inputs like Discounted cash flows method, Market multiples method, Option pricing model, etc.
Investment in quoted debt securities represents investments made in non-convertible debentures issued by government aided institutions. The fair value of
non-convertible debentures (including interest accrued) as at December 31, 2017 was $645 million and as at March 31, 2017 was $613 million. The fair
value is based on quoted prices and market observable inputs. The unrealized loss of then $4 million, net of taxes of less than $1 million has been
recognized in other comprehensive income for the three months ended December 31, 2017. The unrealized gain of $2 million, net of taxes of less than $1
million has been recognized in other comprehensive income for the nine months ended December 31, 2017.
The fair value of certificate of deposits as at December 31, 2017 was $127 million and as at March 31, 2017 was $1,219 million. The fair value is based on
market observable inputs. The unrealized loss of less than $1 million, net of taxes of less than $1 million, has been recognized in other comprehensive
income for the three months ended December 31, 2017. The unrealized gain of less then $1 million, net of taxes of less than $1 million has been
recognized in other comprehensive income for the nine months ended December 31, 2017.
Certificate of deposits:
The fair value of liquid mutual funds as at December 31, 2017 was $150 million and as at March 31, 2017 was $278 million. The fair value is based on
quoted prices.
Investment in quoted debt securities represents the investments made in debt securities issued by government and quasi government organizations. The fair
value of quoted debt securities (including interest accrued) as on December 31, 2017 and March 31, 2017 was $338 million and $334 million, respectively.
The fair value is based on the quoted prices and market observable inputs.
The fair value of fixed maturity plan securities as at December 31, 2017 is $91 million and as at March 31, 2017 was $86 million. The fair value is based on
market observable inputs.

2.3 Financial instruments
Financial instruments by category
(Dollars in millions)
Amortized cost Total carrying value Total fair value
Designated upon
initial recognitionMandatory
Equity instruments
designated upon
initial recognition
Mandatory
Assets:
Cash and cash equivalents (Refer to Note 2.1) 3,226 - - - - 3,226 3,226
Investments (Refer to Note 2.2)
Liquid mutual funds - - 150 - - 150 150
Fixed maturity plan securities - - 91 - - 91 91
Quoted debt securities 298 - - - 645 943 983 (1)
Certificate of deposits - - - - 128 128 128
Unquoted equity and preference securities: - - - 24 - 24 24
Unquoted investment others - - 8 - - 8 8
Unquoted convertible promissory note - - 2 - - 2 2
Trade receivables 2,057 - - - - 2,057 2,057
Unbilled revenue 573 - - - - 573 573
Prepayments and other assets (Refer to Note 2.4) 482 - - - - 482 473 (2)
Derivative financial instruments - - 10 - 3 13 13
Total 6,636 - 261 24 776 7,697 7,728
Liabilities:
Trade payables 79 - - - - 79 79
Derivative financial instruments - - - - 1 1 1
Client deposits 24 - - - - 24 24
Other liabilities including contingent consideration
(Refer to note 2.5)838
- 10 - - 848 848
Total 941 - 10 - 1 952 952 (1)
On account of fair value changes including interest accrued(2)
Excludes interest accrued on quoted debt securities carried at amortized cost
(Dollars in millions)
Amortized cost Total carrying value Total fair value
Designated upon
initial recognitionMandatory
Equity instruments
designated upon
initial recognition
Mandatory
Assets:
Cash and cash equivalents (Refer to Note 2.1) 3,489 - - - - 3,489 3,489
Investments (Refer to Note 2.2)
Liquid mutual funds - - 278 - - 278 278
Fixed maturity plan securities - - 86 - - 86 86
Quoted debt securities 295 - - - 613 908 947 (1)
Certificate of deposits - - - - 1,219 1,219 1,219
Unquoted equity and preference securities - - - 25 - 25 25
Unquoted investment others - - 5 - - 5 5
Unquoted convertible promissory note - - 1 - - 1 1
Trade receivables 1,900 - - - - 1,900 1,900
Unbilled revenue 562 - - - - 562 562
Prepayments and other assets (Refer to Note 2.4) 410 - - - - 410 397 (2)
Derivative financial instruments - - 36 - 8 44 44
Total 6,656 - 406 25 1,840 8,927 8,953
Liabilities:
Trade payables 57 - - - - 57 57
Derivative financial instruments - - - - - - -
Client deposits 5 - - - - 5 5
Other liabilities including contingent consideration
(Refer to note 2.5)763
- 13 - - 776
776
Total 825 - 13 - - 838 838
(1) On account of fair value changes including interest accrued
(2) Excludes interest accrued on quoted debt securities carried at amortized cost
The carrying value and fair value of financial instruments by categories as at December 31, 2017 were as follows:
The carrying value and fair value of financial instruments by categories as at March 31, 2017 were as follows:
Financial assets/ liabilities at fair
value through profit or loss
Financial assets/liabilities at fair value
through OCI
Financial assets/ liabilities at fair
value through profit or loss
Financial assets/liabilities at fair value
through OCI

Fair value hierarchy
(Dollars in millions)
As at December 31,
2017
Level 1 Level 2 Level 3
Assets
150 150 - -
91 - 91
983 793 190 -
128 - 128
24 - - 24
8 - - 8
2 - - 2
13 - 13 -
Liabilities -
1 - 1 -
10 - - 10
(Dollars in millions)
As at March 31,
2017
Level 1 Level 2 Level 3
Assets
278 278 - -
86 - 86
947 565 382 -
1,219 - 1,219 -
25 - - 25
5 - - 5
1 - - 1
44 - 44 -
Liabilities
- - - -
13 - - 13
*Discounted $14 million at 14.2%.
A one percentage point change in the unobservable inputs used in fair valuation of the contingent consideration does not have a significant impact in its value.
(Dollars in millions)
2017 2016 2017 2016
Interest income on financial assets carried at amortized cost 71 92 200 285
Interest income on financial assets fair valued through other comprehensive income 23 4 85 4
Dividend income on investments carried at fair value through profit or loss - - 4
Gain / (loss) on investments carried at fair value through profit or loss 10 5 33 8
104 101 318 301
Derivative financial instruments- gain on outstanding foreign exchange forward and option contracts
Derivative financial instruments - gain on outstanding foreign exchange forward and option contracts
During the nine months ended December 31, 2017, quoted debt securities of $61 million were transferred from Level 2 to Level 1 of fair value hierarchy, since these were valued based on Quoted price
and $67 million were transferred from Level 1 to Level 2 of fair value hierarchy, since these were valued based on market observable inputs.
Income from financial assets or liabilities is as follows:
Three months ended December 31, Nine months ended December 31,
Derivative financial instruments- loss on outstanding foreign exchange forward and option contracts
Investments in equity and preference securities (Refer to Note 2.2)
The movement in contingent consideration as at December 31, 2017 from March 31, 2017 is on account of settlement of contingent consideration of $7 million pertaining to Kallidus acquisition, and
change in discount rate and passage of time. Additionally during the three months ended September 30, 2017, contingent consideration of $3 million was included in relation to acquisition of Brilliant
Basics Holdings Limited. (Refer to note no. 2.9)
Derivative financial instruments - loss on outstanding foreign exchange forward and option contracts
Investments in fixed maturity plan securities (Refer to Note 2.2)
Investments in certificate of deposit (Refer to Note 2.2)
Investments in unquoted investments others (Refer to Note 2.2)
Investments in unquoted convertible promissory note (Refer to Note 2.2)
Investments in fixed maturity plan securities (Refer to Note 2.2)
Investments in certificate of deposit (Refer to Note 2.2)
Investments in unquoted investments others (Refer to Note 2.2)
Investments in unquoted convertible promissory note (Refer to Note 2.2)
Investments in liquid mutual fund units (Refer to Note 2.2)
Investments in quoted debt securities (Refer to Note 2.2)
Fair value measurement at end of the reporting period / year
using
Level 2 – Inputs other than quoted prices included within Level 1 that are observable for the asset or liability, either directly (i.e. as prices) or indirectly (i.e. derived from prices).
Investments in quoted debt securities (Refer to Note 2.2)
Fair value measurement at end of the reporting period / year
using
Investments in liquid mutual fund units (Refer to Note 2.2)
The following table presents fair value hierarchy of assets and liabilities measured at fair value on a recurring basis as at March 31, 2017:
The following table presents fair value hierarchy of assets and liabilities measured at fair value on a recurring basis as at December 31, 2017:
* Discounted $7 million at 13.9% and $3 million at 10%.
Level 1 - Quoted prices (unadjusted) in active markets for identical assets or liabilities.
Liability towards contingent consideration (Refer to note 2.5)*
Investments in unquoted equity and preference securities (Refer to Note 2.2)
Level 3 - Inputs for the assets or liabilities that are not based on observable market data (unobservable inputs).
Liability towards contingent consideration (Refer to Note 2.5)*

Financial risk management
Financial risk factors
Market risk
(Dollars in millions)
U.S. dollars EuroUnited Kingdom
Pound SterlingAustralian dollars Other currencies Total
Cash and cash equivalents 198 27 14 31 160 430
Trade receivables 1,335 268 128 91 124 1,946
Unbilled revenue 297 75 46 29 50 497
Other assets 57 4 6 2 14 83
Trade payables (35) (10) (9) (4) (7) (65)
Client deposits (23) (1) - - - (24)
Accrued expenses (171) (35) (22) (7) (16) (251)
Employee benefit obligation (92) (11) (6) (31) (22) (162)
Other liabilities (136) (17) (9) (4) (51) (217)
Net assets / (liabilities) 1,430 300 148 107 252 2,237
(Dollars in millions)
U.S. dollars EuroUnited Kingdom
Pound SterlingAustralian dollars Other currencies Total
Cash and cash equivalents 206 20 6 28 108 368
Trade receivables 1,287 192 119 87 108 1,793
Unbilled revenue 376 68 50 19 47 560
Other assets 65 15 7 6 15 108
Trade payables (18) (5) (2) (1) (24) (50)
Client deposits (2) - (2) - (1) (5)
Accrued expenses (147) (33) (22) (6) (23) (231)
Employee benefit obligation (86) (13) (3) (23) (19) (144)
Other liabilities (94) (17) (5) (3) (42) (161)
Net assets / (liabilities) 1,587 227 148 107 169 2,238
Derivative financial instruments
(In millions)
December 31, 2017 March 31, 2017
Derivatives designated as cash flow hedges
Forward contracts
In Australian dollars - 130
In Euro - 95
In United Kingdom Pound Sterling - 40
Options contracts
In Australian dollars 130 -
In Euro 130 40
In United Kingdom Pound Sterling 40 -
Other derivatives
Forward contracts
In Australian dollars 43 35
In Canadian dollars 19 -
In Euro 109 114
In Japanese Yen 550 -
In New Zealand dollars 21 -
In Norwegian Krone 4 -
In Singapore dollars 5 5
In South African Rand 26 -
In Swedish Krona 50 50
In Swiss Franc 22 10
In U.S. Dollars 628 526
In United Kingdom Pound Sterling 80 75
Options contracts
In Australian dollars 30 -
In Canadian dollars - 13
In Euro 50 25
In Swiss Franc 5 -
In U.S. Dollars 165 195
In United Kingdom Pound Sterling 20 30
The following table analyses foreign currency risk from financial instruments as at December 31, 2017:
The following table analyses foreign currency risk from financial instruments as at March 31, 2017:
For the three months ended December 31, 2017 and December 31, 2016, every percentage point depreciation / appreciation in the exchange rate between the Indian rupee and the U.S. dollar has
affected the Group's incremental operating margins by approximately 0.50%, each.
For the nine months ended December 31, 2017 and December 31, 2016, every percentage point depreciation / appreciation in the exchange rate between the Indian rupee and the U.S. dollar has affected
the Group's incremental operating margins by approximately 0.50%, each.
Sensitivity analysis is computed based on the changes in the income and expenses in foreign currency upon conversion into functional currency, due to exchange rate fluctuations between the previous
reporting period and the current reporting period.
The Group's holds derivative financial instruments such as foreign exchange forward and option contracts to mitigate the risk of changes in exchange rates on foreign currency exposures. The
counterparty for these contracts is generally a bank. These derivative financial instruments are valued based on quoted prices for similar assets and liabilities in active markets or inputs that are directly
or indirectly observable in the marketplace.
The following table gives details in respect of outstanding foreign exchange forward and options contracts:
As at
The Group operates internationally and a major portion of the business is transacted in several currencies and consequently the Group is exposed to foreign exchange risk through its sales and services
in the United States and elsewhere, and purchases from overseas suppliers in various foreign currencies. The Group holds derivative financial instruments such as foreign exchange forward and option
contracts to mitigate the risk of changes in exchange rates on foreign currency exposures. The exchange rate between the rupee and foreign currencies has changed substantially in recent years and may
fluctuate substantially in the future. Consequently, the results of the Group’s operations are adversely affected as the Indian rupee appreciates / depreciates against these currencies.
The Group's activities expose it to a variety of financial risks - market risk, credit risk and liquidity risk. The Group's primary focus is to foresee the unpredictability of financial markets and seek to
minimize potential adverse effects on its financial performance. The primary market risk to the Group is foreign exchange risk. The Group uses derivative financial instruments to mitigate foreign
exchange related risk exposures. The Group's exposure to credit risk is influenced mainly by the individual characteristic of each customer and the concentration of risk from the top few customers.

(Dollars in millions)
December 31, 2017 March 31, 2017
Not later than one month 471 355
Later than one month and not later than three months 864 666
Later than three months and not later than one year 227 329
1,562 1,350
(Dollars in millions)
2017 2016 2017 2016
Balance at the beginning of the period (1) - 6 -
Gain / (Loss) recognized in other comprehensive income during the period 1 8 (13) 8
Amount reclassified to revenue during the period (2) (2) 3 (2)
Amount reclassified to other income during the period 2 - 2 -
Tax impact on above - (2) 2 (2)
Balance at the end of the period - 4 - 4
The following table provides quantitative information about offsetting of derivative financial assets and derivative financial liabilities:
(Dollars in millions)
Derivative financial
asset
Derivative
financial liability
Derivative
financial asset
Derivative
financial liability
Gross amount of recognized financial asset/liability 16 (4) 44 -
Amount set off (3) 3 - -
Net amount presented in balance sheet 13 (1) 44 -
Credit risk
(In %)
2017 2016 2017 2016
Revenue from top customer 3.4 3.1 3.4 3.4
Revenue from top ten customers 19.2 20.1 19.4 21.3
Credit risk exposure
Movement in credit loss allowance (Dollars in millions)
2017 2016 2017 2016
Balance at the beginning 69 49 63 44
Translation differences 1 (1) 2 (2)
Impairment loss recognized/(reversed) 4 5 10 11
Write offs - - (1) -
Balance at the end 74 53 74 53
- -
Credit exposure (Dollars in millions except otherwise stated)
December 31, 2017 March 31, 2017
Trade receivables 2,057 1,900
Unbilled revenues 573 562
Days Sales Outstanding- DSO (days) 70 68
As at
The allowance for lifetime expected credit loss on customer balances for the three months ended December 31, 2017 and December 31, 2016 was $4 million and $5 million respectively. The allowance
for lifetime expected credit loss on customer balances for the nine months ended December 31, 2017 and December 31, 2016 was $10 million and $11 million.
The Company’s credit period generally ranges from 30-60 days.
Nine months ended December 31,
As at
Three months ended December 31,
March 31, 2017
Credit risk refers to the risk of default on its obligation by the counterparty resulting in a financial loss. The maximum exposure to the credit risk at the reporting date is primarily from trade receivables
amounting to $2,057 million and $1,900 million as at December 31, 2017 and March 31, 2017, respectively and unbilled revenue amounting to $573 million and $562 million as at December 31, 2017
and March 31, 2017, respectively. Trade receivables and unbilled revenue are typically unsecured and are derived from revenue earned from customers primarily located in the United States. Credit risk
is managed through credit approvals, establishing credit limits and continuously monitoring the creditworthiness of customers to which the Group grants credit terms in the normal course of business.
On account of adoption of IFRS 9, the Group uses expected credit loss model to assess the impairment loss or gain. The group uses a provision matrix to compute the expected credit loss allowance for
trade receivables and unbilled revenues. The provision matrix takes into account available external and internal credit risk factors such as credit default swap quotes, credit ratings from international
credit rating agencies and the Group's historical experience for customers.
Credit risk on cash and cash equivalents is limited as we generally invest in deposits with banks and financial institutions with high credit ratings assigned by international and domestic credit rating
agencies. Investments primarily include investment in liquid mutual fund units, fixed maturity plan securities, quoted bonds issued by government and quasi government organizations, non convertible
debentures and certificates of deposits.
The following table gives details in respect of percentage of revenues generated from top customer and top ten customers:
Three months ended December 31,
December 31, 2017
Nine months ended December 31,
During the nine months ended December 31, 2017 and December 31 2016, the Group has designated certain foreign exchange forward and option contracts as cash flow hedges to mitigate the risk of
foreign exchange exposure on highly probable forecast cash transactions. The related hedge transactions for balance in cash flow hedging reserve are expected to occur and reclassified to profit or loss
within 3 months.
The group offsets a financial asset and a financial liability when it currently has a legally enforceable right to set off the recognized amounts and the group intends either to settle on a net basis, or to
realize the asset and settle the liability simultaneously.
The foreign exchange forward and option contracts mature within twelve months. The table below analyses the derivative financial instruments into relevant maturity groupings based on the remaining
period as at the balance sheet date:
As at
The Group recognized a net gain of $28 million and $12 million for the three months ended December 31, 2017 and December 31, 2016, respectively on derivative financial instruments, which are
included in other income.. The group recognized a net gain of $20 million and $45 million for the nine months ended December 31, 2017 and December 31, 2016, respectively on derivative financial
instruments, which are included in other income.
Hedge effectiveness is determined at the inception of the hedge relationship, and through periodic prospective effectiveness assessments to ensure that an economic relationship exists between the
hedged item and hedging instrument, including whether the hedging instrument is expected to offset changes in cash flows of hedged items.
If the hedge ratio for risk management purposes is no longer optimal but the risk management objective remains unchanged and the hedge continues to qualify for hedge accounting, the hedge
relationship will be rebalanced by adjusting either the volume of the hedging instrument or the volume of the hedged item so that the hedge ratio aligns with the ratio used for risk management purposes.
Any hedge ineffectiveness is calculated and accounted for in profit or loss at the time of the hedge relationship rebalancing
The following table provides the reconciliation of cash flow hedge reserve for the three months and nine months ended December 31, 2017:
Three months ended December 31, Nine months ended December 31,

Liquidity risk
(Dollars in millions)
Particulars Less than 1 year 1-2 years 2-4 years 4-7 years Total
Trade payables 79 - - - 79
Client deposits 24 - - - 24
838 - - - 838
8 1 1 - 10
(Dollars in millions)
Particulars Less than 1 year 1-2 years 2-4 years 4-7 years Total
Trade payables 57 - - - 57
Client deposits 5 - - - 5
758 5 - - 763
7 7 - - 14
2.4 Prepayments and other assets
Prepayments and other assets consist of the following:
(Dollars in millions)
December 31, 2017 March 31, 2017
Current
Rental deposits 3 1
Security deposits 2 2
Loans to employees 37 42
Prepaid expenses (1) 80 68
Interest accrued and not due 152 89
Withholding taxes and others(1) 364 291
Advance payments to vendors for supply of goods (1) 11 20
Deposit with corporations 226 218
Deferred contract cost(1) 9 12
Other assets 7 6
891 749
Non-current
Loans to employees 6 5
Security deposits 14 13
Deposit with corporations 8 7
Prepaid gratuity (1) 5 12
Prepaid expenses (1) 21 15
Deferred contract cost (1) 41 44
Rental Deposits 27 27
122 123
1,013 872
482 410
(1) Non
financial assets
The Group's principal sources of liquidity are cash and cash equivalents and the cash flow that is generated from operations. The Group has no outstanding bank borrowings. The Group believes that the
working capital is sufficient to meet its current requirements.
The table below provides details regarding the contractual maturities of significant financial liabilities as at December 31, 2017:
The table below provides details regarding the contractual maturities of significant financial liabilities as at March 31, 2017 :
As at December 31, 2017 and March 31, 2017, the outstanding employee benefit obligations were $235 million and $209 million, respectively, which have been substantially funded. Accordingly, no
liquidity risk is perceived.
As at December 31, 2017, the Group had a working capital of $5,032 million including cash and cash equivalents of $3,226 million and current investments of $388 million. As at March 31, 2017, the
Group had a working capital of $6,121 million including cash and cash equivalents of $3,489 million and current investments of $1,538 million.
Other liabilities (excluding liability towards contingent consideration - Refer to Note 2.5)
Financial assets in prepayments and other assets
Liability towards contingent consideration on an undiscounted basis -Refer to Note 2.5
Other liabilities (excluding liability towards acquisition - Refer to Note 2.5)
Liability towards acquisitions on an undiscounted basis (Refer to Note 2.5)
As at

2.5 Other liabilities
Other liabilities comprise the following:
(Dollars in millions)
December 31, 2017 March 31, 2017
Current
Accrued compensation to employees 384 290
Accrued expenses 395 399
Withholding taxes and others (1) 192 189
Retainage 23 34
Liabilities of controlled trusts 21 22
Liability towards contingent consideration (Refer to note 2.9) 8 7
Deferred rent (1) 2 -
Others 15 13
1,040 954
Non-Current
Liability towards contingent consideration (Refer to note 2.9) 2 6
Accrued compensation to employees - 5
Deferred income - government grant on land use rights (1) 6 6
Deferred income (1) 6 7
Deferred rent (1) 22 -
36 24
1,076 978
848 776
10 14
2.6 Provisions
Provisions comprise the following:
(Dollars in millions)
December 31, 2017 March 31, 2017
71 63
71 63
(Dollars in millions)
Three months ended
December 31, 2017
Nine months ended
December 31, 2017
Balance at the beginning 64 63
Translation differences - -
Provision recognized/(reversed) 8 14
Provision utilized (1) (6)
Balance at the end 71 71
Financial liabilities included in other liabilities
Provision for post sales client support and other provisions represents costs associated with providing sales support services which are accrued at the time of recognition of revenues and are expected to
be utilized over a period of 6 months to 1 year. The movement in the provision for post sales client support and other provisions is as follows:
As at
As at
Withholding taxes and others primarily consist of input tax credits. Security deposits relate principally to leased telephone lines and electricity supplies. Deferred contract costs are upfront costs incurred
for the contract and are amortized over the term of the contract.
Financial liability towards contingent consideration on an undiscounted basis (Refer to Note 2.9)
Deposit with corporation represents amounts deposited to settle certain employee-related obligations as and when they arise during the normal course of business.
The company is subject to legal proceedings and claims, which have arisen in the ordinary course of business. The company’s management does not reasonably expect that these legal actions, when
ultimately concluded and determined, will have a material and adverse effect on the company’s results of operations or financial condition.
As at December 31, 2017 and March 31, 2017, claims against the company, not acknowledged as debts, (excluding demands from income tax authorities- Refer to Note 2.11) amounted to `336 crore
($53 million) and `301 crore ($46 million), respectively.
(1) Non financial liabilities
Provision for post sales client support and other provisions
Accrued expenses primarily relate to cost of technical sub-contractors, telecommunication charges, legal and professional charges, brand building expenses, overseas travel expenses and office
maintenance. Others include unpaid dividend balances and capital creditors.
Provision for post sales client support and other provisions is included in cost of sales in the condensed consolidated statement of comprehensive income.

2.7 Property, plant and equipment
Following are the changes in the carrying value of property, plant and equipment for the three months ended December 31, 2017:
(Dollars in millions)
Land Buildings Plant and
machinery
Computer
equipment
Furniture
and
fixtures
Vehicles Total
Gross carrying value as at October 1, 2017 271 1,134 480 724 270 5 2,884
Additions 7 42 19 18 9 - 95
Deletions - - - (3) (1) (1) (5)
Translation difference 5 26 10 15 7 1 64
Gross carrying value as at December 31, 2017 283 1,202 509 754 285 5 3,038
Accumulated depreciation as at October 1, 2017 (4) (395) (328) (513) (185) (3) (1,428)
Depreciation - (12) (15) (27) (10) - (64)
Accumulated depreciation on deletions - - - 3 1 1 5
Translation difference (1) (7) (8) (11) (5) - (32)
Accumulated depreciation as at December 31, 2017 (5) (414) (351) (548) (199) (2) (1,519)
Capital work-in progress as at December 31, 2017 334
Carrying value as at December 31, 2017 278 788 158 206 86 3 1,853
Capital work-in progress as at October 1, 2017 358
Carrying value as at October 1, 2017 267 739 152 211 85 2 1,814
Following are the changes in the carrying value of property, plant and equipment for the three months ended December 31, 2016:
(Dollars in millions)
Land Buildings Plant and
machinery
Computer
equipment
Furniture
and
fixtures
Vehicles Total
Gross carrying value as at October 1, 2016 246 965 431 674 237 5 2,558
Additions 6 72 16 30 23 - 147
Deletions - - (5) (32) (5) (1) (43)
Translation difference (5) (20) (9) (14) (6) 1 (53)
Gross carrying value as at December 31, 2016 247 1,017 433 658 249 5 2,609
Accumulated depreciation as at October 1, 2016 (4) (348) (267) (439) (161) (3) (1,222)
Depreciation (1) (9) (14) (24) (8) (1) (57)
Accumulated depreciation on deletions - - 2 20 2 1 25
Translation difference 1 7 5 8 4 1 26
Accumulated depreciation as at December 31, 2016 (4) (350) (274) (435) (163) (2) (1,228)
Capital work-in progress as at December 31, 2016 299
Carrying value as at December 31, 2016 243 667 159 223 86 3 1,680
Capital work-in progress as at October 1, 2016 345
Carrying value as at October 1, 2016 242 617 164 235 76 2 1,681
Following are the changes in the carrying value of property, plant and equipment for the nine months ended December 31, 2017:
(Dollars in millions)
Land Buildings Plant and
machinery
Computer
equipment
Furniture
and
fixtures
Vehicles Total
Gross carrying value as at April 1, 2017 272 1,123 466 700 261 5 2,827
Additions 7 58 37 54 21 - 177
Deletions - - (2) (12) (3) (1) (18)
Translation difference 4 21 8 12 6 1 52
Gross carrying value as at December 31, 2017 283 1,202 509 754 285 5 3,038
Accumulated depreciation as at April 1, 2017 (4) (376) (301) (471) (168) (3) (1,323)
Depreciation - (33) (46) (81) (29) - (189)
Accumulated depreciation on deletions - - 2 12 3 1 18
Translation difference (1) (5) (6) (8) (5) - (25)
Accumulated depreciation as at December 31, 2017 (5) (414) (351) (548) (199) (2) (1,519)
Capital work-in progress as at December 31, 2017 334
Carrying value as at December 31, 2017 278 788 158 206 86 3 1,853
Capital work-in progress as at April 1, 2017 303
Carrying value as at April 1, 2017 268 747 165 229 93 2 1,807

Following are the changes in the carrying value of property, plant and equipment for the nine months ended December 31, 2016:
(Dollars in millions)
Land Buildings Plant and
machinery
Computer
equipment
Furniture
and
fixtures
Vehicles Total
Gross carrying value as at April 1, 2016 244 955 392 615 218 4 2,428
Additions 9 87 59 98 44 1 298
Deletions - - (7) (37) (6) (1) (51)
Translation difference (6) (25) (11) (18) (7) 1 (66)
Gross carrying value as at December 31, 2016 247 1,017 433 658 249 5 2,609
Accumulated depreciation as at April 1, 2016 (3) (332) (243) (395) (149) (3) (1,125)
Depreciation (1) (26) (42) (75) (22) (1) (167)
Accumulated depreciation on deletions - - 4 25 3 1 33
Translation difference - 8 7 10 5 1 31
Accumulated depreciation as at December 31, 2016 (4) (350) (274) (435) (163) (2) (1,228)
Capital work-in progress as at December 31, 2016 299
Carrying value as at December 31, 2016 243 667 159 223 86 3 1,680
Capital work-in progress as at April 1, 2016 286
Carrying value as at April 1, 2016 241 623 149 220 69 1 1,589
Following are the changes in the carrying value of property, plant and equipment for the year ended March 31, 2017:
(Dollars in millions)
Land Buildings Plant and
machinery
Computer
equipment
Furniture
and
fixtures
Vehicles Total
Gross carrying value as at April 1, 2016 244 955 392 615 218 4 2,428
Additions 22 147 73 120 57 1 420
Deletions - - (8) (47) (17) (1) (73)
Translation difference 6 21 9 12 3 1 52
Gross carrying value as at March 31, 2017 272 1,123 466 700 261 5 2,827
Accumulated depreciation as at April 1, 2016 (3) (332) (243) (395) (149) (3) (1,125)
Depreciation (1) (35) (57) (101) (31) (1) (226)
Accumulated depreciation on deletions - - 5 34 14 1 54
Translation difference - (9) (6) (9) (2) - (26)
Accumulated depreciation as at March 31, 2017 (4) (376) (301) (471) (168) (3) (1,323)
Capital work-in progress as at March 31, 2017 303
Carrying value as at March 31, 2017 268 747 165 229 93 2 1,807
Capital work-in progress as at April 1, 2016 286
Carrying value as at April 1, 2016 241 623 149 220 69 1 1,589
2.8 Goodwill
Following is a summary of changes in the carrying amount of goodwill:
(Dollars in millions)
December 31, 2017 March 31, 2017
Carrying value at the beginning 563 568
Goodwill on Brilliant Basics acquisition (Refer to note 2.9) 5 -
Translation differences 15 (5)
Carrying value at the end 583 563
The contractual commitments for capital expenditure were $111 million and $177 million as at December 31, 2017 and March 31, 2017, respectively.
As at
The depreciation expense is included in cost of sales in the condensed consolidated statement of comprehensive income.
Carrying value of land includes $100 million and $99 million as at December 31, 2017 and March 31, 2017, respectively, towards amounts paid under certain lease-cum-sale
agreements to acquire land, including agreements where the company has an option to purchase or renew the properties on expiry of the lease period.
For the purpose of impairment testing, goodwill acquired in a business combination is allocated to the cash generating units (CGU) or groups of CGU’s, which benefit from the
synergies of the acquisition. The chief operating decision maker reviews the goodwill for any impairment at the operating segment level, which is represented through groups of
CGU’s.

(Dollars in millions)
Segment As at
March 31, 2017
Financial services 127
Manufacturing 63
Retail, Consumer packaged goods and Logistics 86
Life Sciences, Healthcare and Insurance 98
Energy & utilities, Communication and Services 118
492
Operating segments without significant goodwill 71
Total 563
In %
As at March 31, 2017
Long term growth rate 8-10
Operating margins 17-20
Discount rate 14.4
The above discount rate is based on the Weighted Average Cost of Capital (WACC) of the Company. These estimates are likely to differ from future actual results of operations and
cash flows.
The following table presents the allocation of goodwill to operating segments as at March 31, 2017:
The recoverable amount of a CGU is the higher of its fair value less cost to sell and its value-in-use. The fair value of a CGU is determined based on the market capitalization. The
value-in-use is determined based on specific calculations. These calculations use pre-tax cash flow projections over a period of five years. An average of the range of each
assumption used is mentioned below. As at March 31, 2017, the estimated recoverable amount of the CGU exceeded its carrying amount. The recoverable amount was computed
based on the fair value less cost to sell being higher than value-in-use and the carrying amount of the CGU was computed by allocating the net assets to operating segments for the
purpose of impairment testing. The key assumptions used for the calculations are as follows:
The entire goodwill relating to Infosys BPM's (formerly Infosys BPO) acquisition of McCamish has been allocated to the group of CGU’s which is represented by the Life Sciences,
Healthcare and Insurance segment.
The goodwill relating to Infosys BPM (formerly Infosys BPO), Infosys Lodestone, Portland, Panaya, Kallidus d.b.a Skava and Brilliant Basics acquisitions has been allocated to the
groups of CGU’s which are represented by a majority of the entity’s operating segment.
The entire goodwill relating to Noah acquisition has been allocated to the group of CGU's which is represented by the Energy & utilities, Communication and Services segment.

2.9 Business combination
Noah Consulting LLC
Business transfer
Kallidus Inc. (d.b.a Skava)
The excess of the purchase consideration paid over the fair value of assets acquired has been attributed to goodwill.
(Dollars in millions)
Purchase price
allocated
Net assets(*) – – –
Intangible assets - customer relationships – 2 2
Deferred tax liabilities on intangible assets – – –
- 2 2
Goodwill 5
Total purchase price 7
(Dollars in millions)
ComponentConsideration
settled
Cash paid 4
Fair value of contingent consideration 3
Total purchase price 7
The payment of contingent consideration to sellers of Brilliant Basics is dependent upon the achievement of certain financial targets by Brilliant Basics over a period of 3
years ending on March, 2020.
The fair value of contingent consideration is determined by discounting the estimated amount payable to the sellers of Brilliant Basics on achievement of certain financial
targets. The key inputs used in determination of the fair value of contingent consideration are the discount rate of 10% and the probabilities of achievement of the
financial targets.
The transaction costs of less than $1 million related to the acquisition have been included under administrative expenses in the statement of comprehensive income for
the three months ended September 30, 2017.
The fair value of contingent consideration is determined by discounting the estimated amount payable to the sellers of Kallidus on achievement of certain financial
targets. At the acquisition date, the key inputs used in determination of the fair value of contingent consideration are the discount rate of 14% and the probabilities of
achievement of the financial targets.
During the nine months ended December 31, 2017 contingent consideration of $7 million was paid to the sellers of Kallidus on the achievement of certain financial
targets. The balance contingent consideration as at December 31, 2017 and March 31, 2017 is $7 million and $14 million on an undiscounted basis.
*Includes cash and cash equivalents acquired of less than $1 million
The goodwill is not tax deductible.
The gross amount of trade receivables acquired and its fair value is less than $1 million and the amounts are expected to be fully recoverable.
The acquisition date fair value of each major class of consideration as of the acquisition date is as follows:
On September 8, 2017, Infosys acquired 100% of the voting interests in Brilliant Basics Holdings Limited., UK, (Brilliant Basics) a product design and customer
experience innovator with experience in executing global programs. The business acquisition was conducted by entering into a share purchase agreement for cash
consideration of $4 million, contingent consideration of up to $3 million and an additional consideration of $2 million, referred to as retention bonus, payable to the
employees of Brilliant Basics at each anniversary year over the next two years, subject to their continuous employment with the group at each anniversary
The purchase price has been allocated based on management’s estimates and independent appraisal of fair values as follows:
ComponentAcquiree's
carrying amount
Fair value
adjustments
The payment of contingent consideration to sellers of Kallidus is dependent upon the achievement of certain financial targets by Kallidus over a period of 3 years ending
on December 31, 2017.
Brilliant Basics Holdings Limited.
On November 16, 2015, Infosys acquired 100% membership interest in Noah Consulting, LLC (Noah), a leading provider of advanced information management
consulting services for the oil and gas industry. The business acquisition was conducted by entering into a share purchase agreement for cash consideration of $33
million, contingent consideration of upto $5 million and an additional consideration of upto $32 million, referred to as retention bonus payable to the employees of Noah
at each anniversary year following the acquisition date for the next three years, subject to their continuous employment with the group at each anniversary. The retention
bonus is treated as a post-acquisition employee remuneration expense as per IFRS 3. During the year ended March 31, 2016 based on an assessment of Noah achieving
the targets for the year ended December 31, 2015 and year ended December 31, 2016, the entire contingent consideration has been reversed in the consolidated statement
of comprehensive income.
On July 14, 2017, the Board of Directors of Infosys authorized the Company to execute a Business Transfer Agreement and related documents with Noah Consulting
LLC, a wholly owned subsidiary, to transfer the business of Noah Consulting LLC to Infosys Limited, subject to securing the requisite regulatory approvals for a
consideration based on an independent valuation. Subsequently on October 17, 2017 , the company entered into a business transfer agreement to transfer the business for
a consideration of $41 million (approximately `266 crore) and the transfer was with effect from October 25, 2017. The transaction was between a holding company and a
wholly owned subsidiary and therefore was accounted for at carrying values and did not have any impact on the consolidated financial statements. Subsequently in
November 2017, Noah Consulting LLC has been liquidated.
On June 2, 2015, Infosys acquired 100% of the voting interests in Kallidus Inc., US (Kallidus), a leading provider of digital experience solutions, including mobile
commerce and in-store shopping experiences to large retail clients and 100% of the voting interests of Skava Systems Private Limited, an affiliate of Kallidus. The
business acquisition was conducted by entering into a share purchase agreement for cash consideration of $91 million and a contingent consideration of up to $20
million.

2.10 Employees' Stock Option Plans (ESOP)
Stock incentives granted to COO:
Stock incentives granted to KMPs (other than Dr. Vishal Sikka and COO)
KMP stock compensation expense
Total stock compensation expense
Particulars
Shares arising
out of options
Weighted average
exercise price ($)
Shares arising
out of options
Weighted average
exercise price ($)
2015 Plan: RSU
Outstanding at the beginning 2,239,841 0.08 2,961,373 0.08
Granted - 0.08 392,714 0.08
Exercised 100,177 0.08 532,221 0.08
Forfeited and expired 55,380 0.08 737,582 0.08
Outstanding at the end 2,084,284 0.08 2,084,284 0.08
Exercisable at the end 142,419 0.08 142,419 0.08
2015 Plan: Employee Stock Options (ESOPs)
Outstanding at the beginning 1,190,950 15 1,197,650 15
Granted - - 491,575 -
Exercised - - - -
Forfeited and expired 32,550 15 530,825 15
Outstanding at the end 1,158,400 15 1,158,400 15
Exercisable at the end 249,324 15 249,324 15
2015 Stock Incentive Compensation Plan (the 2015 Plan) (formerly 2011 RSU Plan): On March 31, 2016, pursuant to the approval by the shareholders through postal ballot, the Board has
been authorized to introduce, offer, issue and allot share-based incentives to eligible employees of the Company and its subsidiaries under the 2015 Stock Incentive Compensation Plan (the
2015 Plan). The maximum number of shares under the 2015 plan shall not exceed 24,038,883 equity shares (this includes 1,12,23,576 equity shares which are held by the trust towards the
2011 Plan as at March 31, 2016). Out of this 17,038,883 equity shares will be issued as RSUs at par value and 7,000,000 equity shares will be issued as stock options at market price on the
date of the grant. These instruments will vest over a period of 4 years and the Company expects to grant the instruments under the 2015 Plan over the period of 4 to 7 years.
Controlled trust holds 10,805,896 and 11,289,514 shares as at December 31, 2017 and March 31, 2017, respectively under the 2015 plan, out of which 1,00,000 equity shares have been
earmarked for welfare activities of the employees.
The activity in the 2015 Plan (formerly 2011 RSU Plan) for equity-settled share based payment transactions during the three months and nine months ended December 31, 2017 is set out
below:
Stock incentives granted to Dr. Vishal Sikka
Consequent to Dr. Vishal Sikka's resignation from the Company on August 24, 2017, the unvested stock incentives (time-based and performance based awards) granted to him were forfeited
during the three months ended September 30, 2017. Accordingly, the Company recorded a reversal of $5 million to stock compensation cost during the three months ended September 30,
2017.
The company recorded a employee stock compensation expense of $3 million for the three months ended December 31, 2017 and recorded an employee stock compensation cost of $9
million for the nine months ended December 31, 2017 (employee stock compensation cost of $6 million and $10 million for the three months and nine months ended December 31, 2016).
This comprises expense pertaining to all employees including KMPs.
Further, the cash settled stock compensation expense (included above) for the three months and nine months ended December 31, 2017 are less than $1 million and $1 million for the and
three months and nine months ended December 31, 2016 was less than $1 million.
As at December 31, 2017 and March 31, 2017 74,753 and 106,845 incentive units were outstanding (net of forfeitures).
The Nomination and Remuneration Committee ('Committee') in its meeting held on October 14, 2016 recommended a grant of 27,250 RSUs and 43,000 ESOPs to U. B. Pravin Rao, under
the 2015 Plan and the same was approved by the shareholders through postal ballot on March 31, 2017. These RSUs and ESOPs have been granted effective May 2, 2017. These RSUs and
stock options would vest over a period of 4 years and shall be exercisable within the period as approved by the Committee. The exercise price of the RSUs will be equal to the par value of
the shares and the exercise price of the stock options would be the market price as on the date of grant, as approved by the shareholders.
Stock incentive granted to other employees:
During fiscal 2017, the company granted 2,506,740 RSUs and 7,03,300 ESOPs and 112,210 incentive units (cash settled) to certain eligible employees at mid and senior levels under the
2015 plan. Further, on May 2, 2017, the company granted 37,090 RSUs (includes equity shares and equity shares represented by ADS) at par value, 73,600 employee stock options (ESOPs)
(including equity shares and equity shares represented by ADS) to be exercised at market price at the time of grant, to certain employees at the senior management level. On August 1, 2017,
7,450 incentive units (cash settled) were granted to employees at the senior management level. These instruments will vest over a period of 4 years and are subject to continued service.
On November 1, 2016, 247,250 RSUs and 502,550 stock options were granted under the 2015 plan, to key management personnel, other than Dr. Vishal Sikka and COO, based on fiscal
2016 performance. On August 1, 2017 58,150 RSUs and 44,450 ESOPs were granted to the General Counsel. These RSUs and stock options will vest within a period of 4 years and shall be
exercisable within the period as approved by the Committee. The exercise price of the RSUs will be equal to the par value of the shares and the exercise price of the stock options would be
the market price as on the date of grant.
During the nine months ended December 31, 2017, two of the KMPs have resigned (Refer to note 2.13 Related party transactions for further details) and hence the RSUs and stock options
granted to them were forfeited.
The Company has recorded an employee stock compensation expense of $2 million and $10 million, respectively during the three months and nine months ended December 31, 2017 towards
employees other than KMPs (employee stock compensation cost of $4 million and $6 million for the three months and nine months ended December 31, 2016 respectively).
The Company has recorded an employee stock compensation expense of $1 million and a reversal of employee stock compensation expense of $2 million, respectively, towards KMPs during
the three months and nine months ended December 31, 2017. The employee stock compensation expense recorded was $2 million and $4 million during the three months and nine months
ended December 31, 2016 respectively.
Three months ended
December 31, 2017
Nine months ended
December 31, 2017

Particulars
Shares arising
out of options
Weighted average
exercise price ($)
Shares arising
out of options
Weighted average
exercise price ($)
2015 Plan: RSU
Outstanding at the beginning 2,072,408 0.07 221,505 0.07
Granted 970,375 0.07 2,874,690 0.07
Forfeited and expired 36,895 0.07 59,665 0.07
Exercised - 0.07 30,642 0.07
Outstanding at the end 3,005,888 0.07 3,005,888 0.07
Exercisable at the end - - - -
2015 Plan: Employee Stock Options (ESOPs)
Outstanding at the beginning - - - -
Granted 1,205,850 15.26 1,205,850 15.26
Forfeited and expired - - - -
Exercised - - - -
Outstanding at the end 1,205,850 15.26 1,205,850 15.26
Exercisable at the end - - - -
The following table summarizes information about equity settled RSUs and ESOPs outstanding as at December 31, 2017:
No. of shares arising
out of options
Weighted
average
remaining
contractual life
Weighted average
exercise price ($)
2015 Plan:
0 - 0.08 (RSU) 2,084,284 1.67 0.08
13 - 17 (ESOP) 1,158,400 6.85 15
3,242,684 3.32 5
The following table summarizes information about equity settled RSUs and ESOPs outstanding as at March 31, 2017:
No. of shares arising
out of options
Weighted
average
remaining
contractual life
Weighted average
exercise price ($)
2015 Plan:
0 - 0.07 (RSU) 2,961,373 1.88 0.07
13 - 17 (ESOP) 1,197,650 7.09 15.83
4,159,023 3.38 4.61
The fair value of each equity settled RSU is estimated on the date of grant using the Black-Scholes-Merton model with the following assumptions:
Particulars
Fiscal 2018-
Equity Shares-
RSU
Fiscal 2018-
Equity shares ESOP
Fiscal 2018-
ADS-RSU
Fiscal 2018-
ADS- ESOP
Weighted average share price (`) / ($- ADS) 923 923 14.73 14.65
Exercise price (`)/ ($- ADS) 5.00 919 0.08 14.67
Expected volatility (%) 21-25 25-28 21-26 25-31
Expected life of the option (years) 1 - 4 3 - 7 1 - 4 3 - 7
Expected dividends (%) 2.78 2.78 2.74 2.74
Risk-free interest rate (%) 6 - 7 6 - 7 1 - 2 1 - 2
Weighted average fair value as on grant date (`) / ($- ADS) 857 254 13.73 2.93
Particulars
Fiscal 2017-
Equity Shares-
RSU
Fiscal 2017-
Equity shares ESOP
Fiscal 2017-
ADS-RSU
Fiscal 2017-
ADS- ESOP
Weighted average share price (`) / ($- ADS) 1,067 989 15.77 15.26
Exercise price (`)/ ($- ADS) 5.00 998 0.07 15.26Expected volatility (%) 24-29 27-29 26-29 27-31
Expected life of the option (years) 1 - 4 3 - 7 1 - 4 3 - 7
Expected dividends (%) 2.37 2.37 2.29 2.29 Risk-free interest rate (%) 6- 7 6- 7 1 - 2 1 - 2
Weighted average fair value as on grant date (`) / ($- ADS) 1,002 285 14.84 3.46
The expected life of the RSU / ESOP is estimated based on the vesting term and contractual term of the RSU / ESOP, as well as expected exercise behavior of the employee who receives the
RSU / ESOP. Expected volatility during the expected term of the RSU / ESOP is based on historical volatility of the observed market prices of the Company's publicly traded equity shares
during a period equivalent to the expected term of the RSU / ESOP.
Options outstanding
For options granted in
For options granted in
Three months ended
December 31, 2016
Nine months ended
December 31, 2016
The activity in the 2015 Plan (formerly 2011 RSU Plan) for equity-settled share based payment transactions during the three months and nine months ended December 31, 2016 is set out
below:
During the nine months ended December 31, 2016, the weighted average share price of options exercised under the 2015 Plan on the date of exercise was $16.
During the three months and nine months ended December 31, 2017, the weighted average share price of options exercised under the 2015 Plan on the date of exercise was $15 each.
Range of exercise prices per share ($)
Options outstanding
Range of exercise prices per share ($)

2.11 Income taxes
(Dollars in millions)
2017 2016 2017 2016
Current taxes
Domestic taxes 202 159 542 487
Foreign taxes (181) 58 (59) 168
21 217 483 655
Deferred taxes
Domestic taxes (42) (2) (63) (6)
Foreign taxes 43 (1) 33 (14)
1 (3) (30) (20)
Income tax expense 22 214 453 635
Advance Pricing Agreement (“APA”)
(Dollars in millions)
2017 2016 2017 2016
Profit before income taxes 818 761 2,368 2,232
Enacted tax rates in India 34.61% 34.61% 34.61% 34.61%
Computed expected tax expense 283 264 820 773
Tax effect due to non-taxable income for Indian tax purposes (48) (80) (223) (230)
Overseas taxes 3 29 70 91
Tax provision (reversals) (228) (8) (235) (9)
Effect of differential overseas tax rates 3 2 4 4
Effect of exempt non operating income (4) (1) (9) (8)
Effect of unrecognized deferred tax assets 5 1 22 9
Effect of non-deductible expenses (8) 7 3 11
Branch profit tax (net of credits) (24) - (24) -
Subsidiary dividend distribution tax 27 - 27 -
Others 13 - (2) (6)
Income tax expense 22 214 453 635
Nine months ended December 31,
A reconciliation of the income tax provision to the amount computed by applying the statutory income tax rate to the income before income taxes is summarized below:
Three months ended December 31,
Infosys is subject to a 15% Branch Profit Tax (BPT) in the U.S. to the extent its U.S. branch's net profit during the year is greater than the increase in the net assets of the U.S. branch during
the year, computed in accordance with the Internal Revenue Code. As of December 31, 2017, Infosys' U.S. branch net assets amounted to approximately $734 million. As of December 31,
2017, the Company has provided for branch profit tax of $34 million (net of credits) for its U.S branch, as the Company estimates that these branch profits are expected to be distributed in
the foreseeable future. An additional deferred tax liability has been created for branch profit tax amounting to $7 million for the three months and nine months ended December 31, 2017
respectively on account of conclusion of APA explained above. Further, on account of US tax Reforms, the company has a credit of $24 million pertaining to Branch Profit Tax for each of
the three months and nine months ended December 31, 2017.
Entire deferred income tax, except for a credit of $24 million (on account of US Tax Reforms explained above),each for the three months and nine months ended December 31, 2017
respectively, relates to origination and reversal of temporary differences.
The applicable Indian statutory tax rates for fiscal 2018 and fiscal 2017 is 34.61%, respectively.
Income tax expense in the consolidated statement of comprehensive income comprises:
Nine months ended December 31, Three months ended December 31,
The Company has concluded an Advance Pricing Agreement (“APA”) with the US Internal Revenue Service ("IRS") for the US branch covering the years ending March 2011 to March
2021. Under the APA, the Company and the IRS have agreed on the methodology to allocate revenues and compute the taxable income of the Company’s US Branch operations.
During the three months ended December 31,2017, in accordance with the APA , the company has reversed income tax expense provision of $225 million which pertains to previous
periods. This comprises of current tax expense of $253 million, reversal of $21 million on account of deferred tax assets pertaining to the temporary differences which are no longer
required and a deferred tax liability of $7 million pertaining to Branch profit tax for the three months ended December 31, 2017 on account of conclusion of APA. In line with the APA, the
Company expects to pay an amount of approximately $233 million due to the difference between the taxes payable for prior periods as per the APA and the actual taxes paid for such
periods. This amount is expected to be paid over the next few quarters. Additionally, income tax expense for the three months and nine months ended December 31, 2017 includes reversal
(net of provisions) of $3 million and $ 27 million, respectively, pertaining to prior periods on account of adjudication of certain disputed matters in favor of the company across various
jurisdictions.
Income tax expense for the three months and nine months ended December 31, 2016 includes reversal (net of provisions) of $8 million and $9 million, respectively, pertaining to prior
periods on account of adjudication of certain disputed matters in favor of the company across various jurisdictions.
The “Tax Cuts and Jobs Act (H.R. 1)” was signed into law on December 22, 2017 (“US Tax Reforms”). The US tax reforms has reduced federal tax rates from 35% to 21% effective January
1, 2018 amongst other measures. During the three months ended December 31, 2017 , the US tax reforms has resulted in a positive impact of $24 million on account of credits pertaining to
deferred tax liabilities on branch profit. The impact of US tax reforms is expected to be not significant for future periods.
During the three months ended December 31, 2017, the Company received $130 million as dividend from its majority owned subsidiary. Dividend distribution tax paid by the subsidiary on
such dividend has been reduced as credit against dividend distribution tax payable by Infosys. Accordingly, the group has recorded a charge of $27 million as income tax expense during the
three months and nine months ended December 31, 2017.
Other income for three months and nine months ended December 31, 2017, includes interest on income tax refund of $ 31 million and $ 41 million respectively

2017 2016 2017 2016
Basic earnings per equity share - weighted average number of equity shares outstanding(1) 2,275,074,804 2,285,651,730 2,282,186,771 2,285,638,678
Effect of dilutive common equivalent shares - share options outstanding 1,306,766 577,312 2,100,721 437,784
2,276,381,570 2,286,229,042 2,284,287,492 2,286,076,462
(1) excludes treasury shares
For the three months and nine months ended December 31, 2017, 1,48,399 and 1,55,186 number of options to purchase equity shares had an anti-dilutive effect respectively.
For the three months and nine months ended December 31, 2016, 216,477 and 72,422 number of options to purchase equity shares had an anti-dilutive effect.
The following is a reconciliation of the equity shares used in the computation of basic and diluted earnings per equity share:
Nine months ended December 31,
Diluted earnings per equity share - weighted average number of equity shares and common equivalent shares
outstanding
The foreign tax expense is due to income taxes payable overseas, principally in the United States. In India, the Company has benefited from certain tax incentives that the Government of
India had provided for export of software from the units registered under the Special Economic Zones Act (SEZs), 2005. SEZ units which began the provision of services on or after April 1,
2005 are eligible for a deduction of 100% of profits or gains derived from the export of services for the first five years from the financial year in which the unit commenced the provision of
services and 50% of such profits or gains for further five years. Up to 50% of such profits or gains is also available for a further five years subject to creation of a Special Economic Zone re-
investment Reserve out of the profit for the eligible SEZ units and utilization of such reserve by the Company for acquiring new plant and machinery for the purpose of its business as per the
provisions of the Income Tax Act, 1961.
As at December 31, 2017, claims against the Group not acknowledged as debts from the Income tax authorities amounted to `4,487 crore ($702 million). These matters are pending before
various Appellate Authorities and the management including its tax advisors expect that its position will likely be upheld on ultimate resolution and will not have a material adverse effect on
the Group's financial position and results of operations.
Income tax claims amounting to `4,565 crore ($715 million) has not been considered as claims not acknowledged as debt because the Company has received favorable decisions on similar
claims and therefore based on its assessment, is of the view that any liability resulting from these claims is remote and will not sustain on ultimate resolution.
Amount paid to statutory authorities against the above tax claims amounted to `5,825 crore ($912 million).
As at March 31, 2017, claims against the Group not acknowledged as debts from the Indian Income tax authorities amounted to `6,378 crore ($984 million). Amount paid to statutory
authorities against this amounted to `4,682 crore ($722 million).
Three months ended December 31,
2.12 Reconciliation of basic and diluted shares used in computing earnings per share

2.13 Related party transactions
Changes in Subsidiaries and Associates
Changes in Key management personnel
Transactions with key management personnel
(Dollars in millions)
2017 2016 2017 2016
3 5 5 10
Commission and other benefits to non-executive/ independent directors - - 2 1
Total 3 5 7 11
Investment in Associate
2.14
Geographical information on revenue and business segment revenue information is collated based on individual customers invoiced or in relation to which the revenue is otherwise recognized.
Infosys has provided guarantee for performance of certain contracts entered into by its subsidiaries.
Nine months ended December 31,
Segment Reporting
IFRS 8 establishes standards for the way that public business enterprises report information about operating segments and related disclosures about products and services, geographic areas, and
major customers. The group's operations predominantly relate to providing end-to-end business solutions to enable clients to enhance business performance. Based on the "management
approach" as defined in IFRS 8, the Chief Operating Decision Maker (CODM) evaluates the group's performance and allocates resources based on an analysis of various performance indicators
by business segments and geographic segments. Accordingly, information has been presented both along business segments and geographic segments. The accounting principles used in the
preparation of the financial statements are consistently applied to record revenue and expenditure in individual segments, and are as set out in the significant accounting policies.
Business segments of the Group are primarily enterprises in Financial Services (FS), enterprises in Manufacturing (MFG), enterprises in Retail, Consumer packaged goods and Logistics (RCL),
enterprises in the Energy & utilities, Communication and Services (ECS), enterprises in Hi-Tech (Hi-Tech), enterprises in Life Sciences, Healthcare and Insurance (HILIFE) and all other
segments. The FS reportable segments has been aggregated to include the Financial Services operating segment and the Finacle operating segment. All other segments represents the operating
segments of businesses in India, Japan, China and IPS. Geographic segmentation is based on business sourced from that geographic region and delivered from both on-site and off-shore
locations. North America comprises the United States of America, Canada and Mexico, Europe includes continental Europe (both the east and the west), Ireland and the United Kingdom, and
the Rest of the World comprising all other places except those mentioned above and India.
Salaries and other employee benefits to whole-time directors and executive officers(1)(2)(3)
(2)Total employee stock compensation expense for the three months and nine months ended December 31, 2017 includes a charge of $1 million and a reversal of $2 million, respectively
towards key managerial personnel. For the three months and nine months ended December 31, 2016, an employee stock compensation expense of $2 million and $4 million, respectively, was
recorded towards key managerial personnel. (Refer to note 2.10)
The following were the changes in key management personnel:-
• Salil Parekh appointed as Chief Executive Officer and Managing Director effective January 2, 2018. The appointment is for a term of 5 years with effect from January 2, 2018 to January 1,
2023 and the remuneration is subject to shareholders approval through postal ballot which will get concluded on February 20, 2018.
• U. B. Pravin Rao, Chief Operating officer stepped down as the interim CEO and Managing Director effective January 2, 2018 and will continue as Chief Operating Officer and a whole-time
director of the Company.
• Nandan M. Nilekani appointed as Non-Executive, Non-Independent Chairman effective August 24, 2017
• D. Sundaram appointed as Independent director effective July 14, 2017
• R. Seshasayee, Chairman, resigned effective August 24, 2017
• Ravi Venkatesan, resigned from his position as Co-Chairman effective August 24, 2017
• Prof. Jeffrey Lehman, Independent director resigned effective August 24, 2017
• Prof. John Etchemendy, Independent director resigned effective August 24, 2017
• Dr. Vishal Sikka, resigned as Chief Executive Officer and Managing Director effective August 18, 2017 and as Executive Vice Chairman effective August 24, 2017
• Sandeep Dadlani, President, resigned effective July 14, 2017
• Inderpreet Sawhney, Group General Counsel and Chief Compliance Officer, appointed as Executive Officer effective July 14, 2017
• Gopi Krishnan Radhakrishnan, Acting General Counsel, resigned effective June 24, 2017
During the three months ended June 30, 2017, the Company has written down the entire carrying value of the investment in its associate DWA Nova LLC amounting to $11 million.
(1) Included a reversal of stock compensation cost of $5 million towards forfeiture of stock incentives granted to Dr. Vishal Sikka upon his resignation. (Refer to note 2.10)
(3) Includes $0.87 million payable under severance agreement to David Kennedy, General counsel and Chief compliance officer during the three months ended December 31, 2016
During the three months ended December 31, 2017, the following are the changes in the subsidiaries and associate:
- the name of Infosys BPO Ltd has been changed to Infosys BPM Ltd.
- Infosys Chille Spa was incorporated as a wholly owned subsidiary of the Infosys Ltd.
- Noah Consulting LLC, Noah Information Management Consulting Inc. and DWA Nova LLC have been liquidated.
(4)On December 2, 2017, the Board appointed Salil Parekh as the Chief Executive Officer and Managing Director of the Company with effect from January 2, 2018. The appointment is for a
term of 5 years with effect from January 2, 2018 to January 1, 2023 and the remuneration is subject to shareholders approval through postal ballot which will get concluded on February 20,
2018.
Revenue and identifiable operating expenses in relation to segments are categorized based on items that are individually identifiable to that segment. Revenue for “all other segments” represents
revenue generated by IPS and revenue generated from customers located in India, Japan and China. Allocated expenses of segments include expenses incurred for rendering services from the
Company's offshore software development centers and on-site expenses, which are categorized in relation to the associated turnover of the segment. Certain expenses such as depreciation,
which form a significant component of total expenses, are not specifically allocable to specific segments as the underlying assets are used interchangeably. Management believes that it is not
practical to provide segment disclosures relating to those costs and expenses, and accordingly these expenses are separately disclosed as "unallocated" and adjusted against the total income of
the Group.
Assets and liabilities used in the Group's business are not identified to any of the reportable segments, as these are used interchangeably between segments. Management believes that it is
currently not practicable to provide segment disclosures relating to total assets and liabilities since a meaningful segregation of the available data is onerous.
The table below describes the compensation to key management personnel which comprise directors and executive officers:
Three months ended December 31,
(5)U. B. Pravin Rao stepped down as the interim CEO and Managing Director effective January 2, 2018 and will continue as Chief Operating Officer and a whole-time director of the
Company.
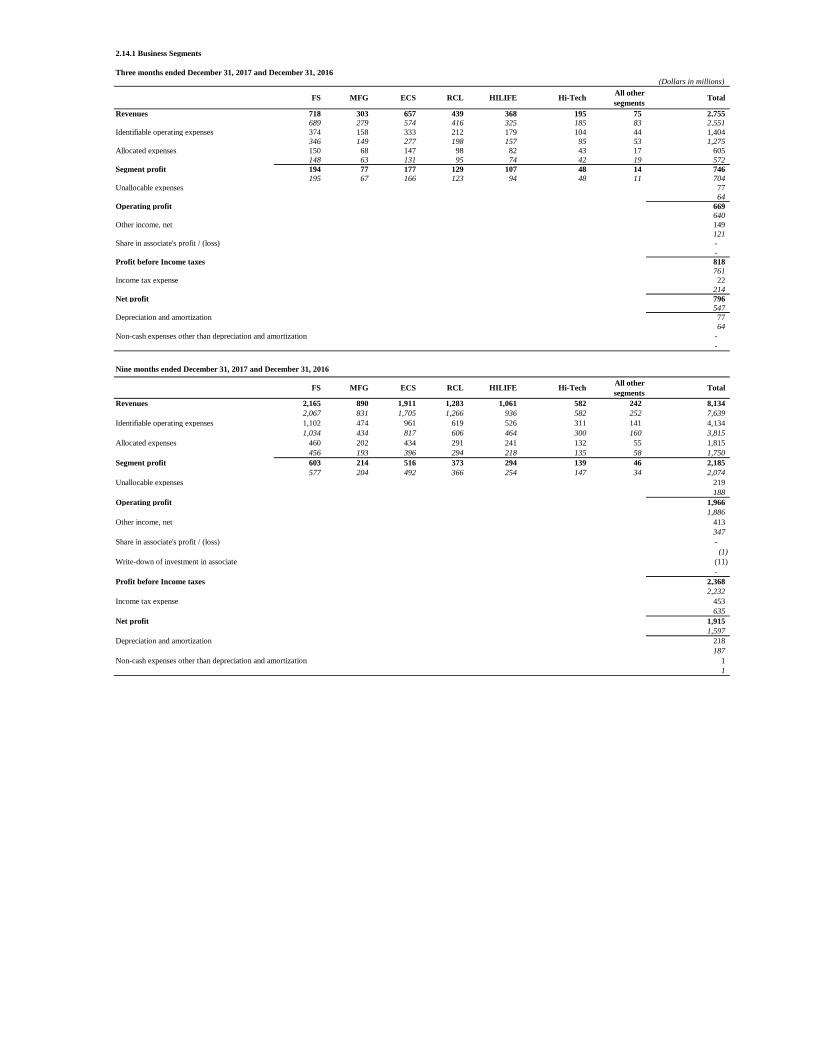
2.14.1 Business Segments
Three months ended December 31, 2017 and December 31, 2016
(Dollars in millions)
FS MFG ECS RCL HILIFE Hi-Tech All other
segments Total
Revenues 718 303 657 439 368 195 75 2,755
689 279 574 416 325 185 83 2,551
Identifiable operating expenses 374 158 333 212 179 104 44 1,404
346 149 277 198 157 95 53 1,275
Allocated expenses 150 68 147 98 82 43 17 605
148 63 131 95 74 42 19 572
Segment profit 194 77 177 129 107 48 14 746
195 67 166 123 94 48 11 704
Unallocable expenses 77
64
Operating profit 669
640
Other income, net 149
121
Share in associate's profit / (loss) -
-
Profit before Income taxes 818
761
Income tax expense 22
214
Net profit 796
547
Depreciation and amortization 77
64
Non-cash expenses other than depreciation and amortization -
-
Nine months ended December 31, 2017 and December 31, 2016
FS MFG ECS RCL HILIFE Hi-Tech All other
segments Total
Revenues 2,165 890 1,911 1,283 1,061 582 242 8,134
2,067 831 1,705 1,266 936 582 252 7,639
Identifiable operating expenses 1,102 474 961 619 526 311 141 4,134
1,034 434 817 606 464 300 160 3,815
Allocated expenses 460 202 434 291 241 132 55 1,815
456 193 396 294 218 135 58 1,750
Segment profit 603 214 516 373 294 139 46 2,185
577 204 492 366 254 147 34 2,074
Unallocable expenses 219
188
Operating profit 1,966
1,886
Other income, net 413
347
Share in associate's profit / (loss) -
(1)
Write-down of investment in associate (11)
-
Profit before Income taxes 2,368
2,232
Income tax expense 453
635
Net profit 1,915
1,597
Depreciation and amortization 218
187
Non-cash expenses other than depreciation and amortization 1
1

2.14.2 Geographic Segments
Three months ended December 31, 2017 and December 31, 2016
(Dollars in millions)
North America Europe India Rest of the
World
Total
Revenues 1,664 671 84 336 2,755
1,580 568 87 316 2,551
869 332 38 165 1,404
794 292 40 149 1,275
370 150 16 69 605
359 129 17 67 572
Segment profit 425 189 30 102 746
427 147 30 100 704
77
64
Operating profit 669
640
149
121
Share in associate's profit / (loss) -
-
Profit before Income taxes 818
761
22
214
Net profit 796
547
77
64
-
-
Nine months ended December 31, 2017 and December 31, 2016
(Dollars in millions)
North America Europe India Rest of the
World
Total
Revenues 4,938 1,901 267 1,028 8,134
4,721 1,726 243 949 7,639
2,566 967 110 491 4,134
2,403 859 114 439 3,815
1,119 430 51 215 1,815
1,095 399 50 206 1,750
Segment profit 1,253 504 106 322 2,185
1,223 468 79 304 2,074
219
188
Operating profit 1,966
1,886
413
347
Share in associate's profit / (loss) -
(1)
Write-down of investment in associate (11)
-
Profit before Income taxes 2,368
2,232
453
635
Net profit 1,915
1,597
218
187
1
1
2.14.3 Significant clients
No client individually accounted for more than 10% of the revenues for the three months and nine months ended December 31, 2017 and December 31, 2016, respectively.
Identifiable operating expenses
Allocated expenses
Unallocable expenses
Other income, net
Income Tax expense
Depreciation and amortization
Non-cash expenses other than depreciation and amortization
Identifiable operating expenses
Allocated expenses
Unallocable expenses
Other income, net
Income Tax expense
Depreciation and amortization
Non-cash expenses other than depreciation and amortization
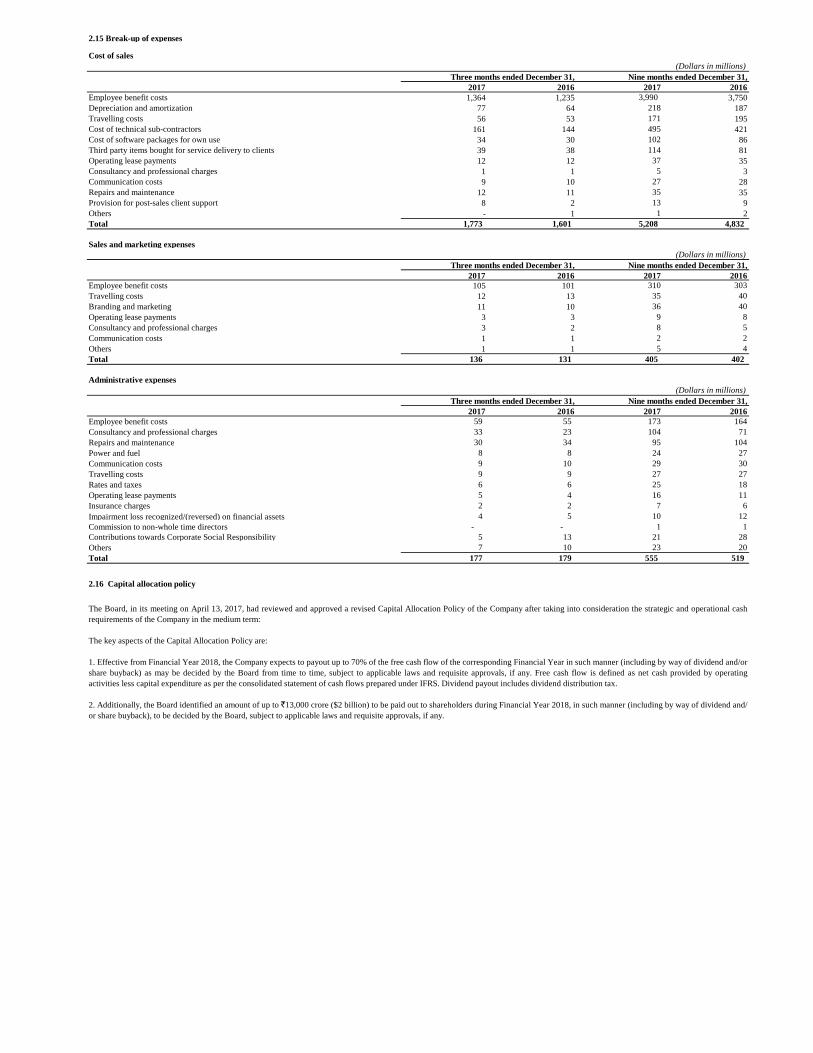
2.15 Break-up of expenses
Cost of sales
(Dollars in millions)
2017 2016 2017 2016
Employee benefit costs 1,364 1,235 3,990 3,750
Depreciation and amortization 77 64 218 187
Travelling costs 56 53 171 195
Cost of technical sub-contractors 161 144 495 421
Cost of software packages for own use 34 30 102 86
Third party items bought for service delivery to clients 39 38 114 81
Operating lease payments 12 12 37 35
Consultancy and professional charges 1 1 5 3
Communication costs 9 10 27 28
Repairs and maintenance 12 11 35 35
Provision for post-sales client support 8 2 13 9
Others - 1 1 2
Total 1,773 1,601 5,208 4,832
Sales and marketing expenses
(Dollars in millions)
2017 2016 2017 2016
Employee benefit costs 105 101 310 303
Travelling costs 12 13 35 40
Branding and marketing 11 10 36 40
Operating lease payments 3 3 9 8
Consultancy and professional charges 3 2 8 5
Communication costs 1 1 2 2
Others 1 1 5 4
Total 136 131 405 402
Administrative expenses
(Dollars in millions)
2017 2016 2017 2016
Employee benefit costs 59 55 173 164
Consultancy and professional charges 33 23 104 71
Repairs and maintenance 30 34 95 104
Power and fuel 8 8 24 27
Communication costs 9 10 29 30
Travelling costs 9 9 27 27
Rates and taxes 6 6 25 18
Operating lease payments 5 4 16 11
Insurance charges 2 2 7 6
Impairment loss recognized/(reversed) on financial assets 4 5 10 12
Commission to non-whole time directors - - 1 1
Contributions towards Corporate Social Responsibility 5 13 21 28
Others 7 10 23 20
Total 177 179 555 519
2.16 Capital allocation policy
The Board, in its meeting on April 13, 2017, had reviewed and approved a revised Capital Allocation Policy of the Company after taking into consideration the strategic and operational cash
requirements of the Company in the medium term:
The key aspects of the Capital Allocation Policy are:
1. Effective from Financial Year 2018, the Company expects to payout up to 70% of the free cash flow of the corresponding Financial Year in such manner (including by way of dividend and/or
share buyback) as may be decided by the Board from time to time, subject to applicable laws and requisite approvals, if any. Free cash flow is defined as net cash provided by operating
activities less capital expenditure as per the consolidated statement of cash flows prepared under IFRS. Dividend payout includes dividend distribution tax.
2. Additionally, the Board identified an amount of up to `13,000 crore ($2 billion) to be paid out to shareholders during Financial Year 2018, in such manner (including by way of dividend and/
or share buyback), to be decided by the Board, subject to applicable laws and requisite approvals, if any.
Three months ended December 31,
Three months ended December 31,
Three months ended December 31,
Nine months ended December 31,
Nine months ended December 31,
Nine months ended December 31,

Dividends
Buyback
2.17 Share capital and share premium
for and on behalf of the Board of Directors of Infosys Limited
Nandan M. Nilekani Salil. Parekh U. B. Pravin Rao
Chairman Chief Executive officer Chief Operating Officer
and Managing Director and Whole-time Director
Bengaluru D. Sundaram M. D. Ranganath A. G. S. Manikantha
January 12, 2018 Director Chief Financial Officer Company Secretary
The Board, at its meeting on August 19, 2017, approved a proposal for the Company to buyback its fully paid-up equity shares of face value of `5/- each from the eligible equity shareholders of
the Company for an amount not exceeding `13,000 crore ($2 billion). The shareholders approved the said proposal of Buyback of Equity Shares through the postal ballot that concluded on
October 7, 2017. The Buyback offer comprised a purchase of 113,043,478 Equity Shares aggregating 4.92% of the paid-up equity share capital of the Company at a price of `1,150 per Equity
share. The buyback was offered to all eligible equity shareholders (including those who became equity shareholders as on the Record date by cancelling American Depository Shares and
withdrawing underlying Equity shares) of the Company as on the Record Date (i.e. November 1, 2017) on a proportionate basis through the "Tender offer" route. The Company concluded the
buyback procedures on December 27, 2017 and 113,043,478 shares were extinguished. The company has funded the buyback from its securities premium and general reserve. In accordance
with section 69 of the Companies Act, 2013, the company has created ‘Capital Redemption Reserve’ of $9 million equal to the nominal value of the shares bought back as an appropriation from
general reserve.
The Company declares and pays dividends in Indian rupees. The remittance of dividends outside India is governed by Indian law on foreign exchange and is subject to applicable distribution
taxes. Dividend distribution tax paid by subsidiaries may be reduced / available as credit against dividend distribution tax payable by Infosys Limited.
The amount of per share dividend recognized as distributions to equity shareholders for the nine months ended December 31, 2017 includes final dividend of `14.75/- per equity share ($0.23
per equity share) and Interim dividend of `13/- per equity share ( $0.20 per equity share). The amount of per share dividend recognized as distributions to equity shareholders for the nine
months ended December 31, 2016 includes final dividend of `14.25/- per equity share ($0.22 per equity share) and Interim dividend of `11/- per equity share ( $0.17 per equity share).
The amount received in excess of the par value has been classified as share premium. Additionally, share-based compensation recognized in net profit in the consolidated statement of
comprehensive income is credited to share premium. Amounts have been utilized for bonus issue from share premium account.
The Company has only one class of shares referred to as equity shares having a par value of `5/- each. 10,805,896 and 11,289,514 shares were held by controlled trust, as at December 31, 2017
and March 31, 2017, respectively.
The Board of Directors, in their meeting on October 24 2017, declared an interim dividend of approximately $0.20/- per equity share (`13/- per equity share), which resulted in a net cash
outflow of approximately $526 million, (excluding dividend paid on treasury shares) inclusive of corporate dividend tax.
Recommended