UNITED NATIONS CONFERENCE ON TRADE AND DEVELOPMENT
INFORMATION AND COMMUNICATION TECHNOLOGY (ICT) DEVELOPMENT INDICES
World Summit on Information Society
Geneva January 2003
UNCTAD/ITE/TEB/MISC.2 (VOL. III)
Prepared by the UNCTAD Secretariat
ICT Development Indices ____________________________
1 UNCTAD, Geneva
ICT DEVELOPMENT INDICES
CONTENTS
Executive Summary
1. Introduction
2. Theoretical Framework & Literature Review
3. ICT Development Indices:
3.1. ICT Indicators;
3.2. Index Methodology.
4. Discussion of Results
5. The Digital Divide
6. Conclusions & Way Forward
7. Appendices:
Appendix 1 – ICT Development Indices (2001, 2000 and 1999); Appendix 2 – Correlation Tables of component indices;
Appendix 3 – Comparison of Connectivity/Access Indice for 2001;
Appendix 4 – Comparison of Connectivity/Policy Indices for 2001;
Appendix 5 – Digital Divide work;
Appendix 6 – Connectivity Index (2001, 2000 and 1999).
8. Bibliography
ICT Development Indices ____________________________
2 UNCTAD, Geneva
LIST OF ACRONYMS
CEE Central and Eastern Europe
CSTD Commission on Science and Technology for Development
CU 'Catching Up' / Falling Behind ??
EIU Economist Intelligence Unit
EU European Union
FDI Foreign Direct Investment
GA 'Getting Ahead'
GDP Gross Domestic Product
GIT Georgia Institute of Technology
HDI Human Development Index (UNDP)
HDR Human Development Report (UNDP)
HTI High Technology Indicators (GIT)
ICTs Information and Communication Technologies
IP Internet Protocol
ISP Internet Service Providers
IT Information Technology
ITU Information and Telecommunication Union
IX Internet Exchange points
KU 'Keeping Up'
LAC Latin America & Caribbean
MAE Metropolitan Area Exchanges
MNC Multi-National Corporation
NAPs Network Access Points
OECD Organisation for Economic Cooperation and Development
PC Personal Computer
PTO Public Telephone Operator
SSA Sub-Saharan Africa
UNCSTD United Nations Commission on Science and Technology for Development
UNCTAD United Nations Conference on Trade and Development
UNDP United Nations Development Program
UNIDO United Nations Industrial Development Organization
WAP Wireless Access Protocol
ICT Development Indices ____________________________
3 UNCTAD, Geneva
EXECUTIVE SUMMARY BACKGROUND This report has arisen out of work that was first undertaken by the United Nations Conference on Trade and Development (UNCTAD) for the Commission on Science and Technology for Development (CSTD) – [if you consider it to be substantially different]. This report was prepared by the United Nations Conference on Trade and Development (UNCTAD) for the Commission on Science and Technology for Development (CSTD). It was first presented to the CSTD Panel Meeting in Geneva on 22 May - 24 May 2002, as part of the work programme for the inter-sessional period 2001-2003: “Technology development and capacity-building for competitiveness in a digital society”. [WHAT THIS REPORT SETS OUT TO ACHIEVE] This report seeks to analyse and evaluate Information and Communication Technology (ICT) development using indicators of ICT diffusion across countries. It develops a conceptual framework and selects key indicators measuring development in ICTs, with a specific focus on ICTs as pervasive technologies of global impact, wide application and growing potential. This study benchmarks levels of ICT development, in existing infrastructure connectivity, as well as measures of future potential and important determinants affecting countries' abilities to absorb, adopt and make use of these new technologies. The challenges in such a benchmarking exercise are manifold, in the selection of a representative set of indicators measuring the complex concept of technology development; in the trade-off of 'breadth versus depth' in the nature and number of these indicators; and in the integration of the results of benchmarking into policy analysis. And yet, used wisely and with caution, benchmarking can provide useful information and meaningful analysis for policy purposes. Such a cross-country analysis permits comparison between countries and monitoring of progress over time. Comparison with better-performing countries helps identify policies for further improvement and progression. Although benchmarking cannot investigate causation, it nevertheless allows more straightforward identification based on evidence of 'success stories' for closer investigation for policy conclusions. Approached with thought, benchmarking is a useful input to policy analysis in allowing more informed and insightful study into policy and ultimately, in promoting better, faster and more effective ICT development. [WHAT THIS REPORT DOES] In conjunction with CSTD, UNCTAD reviewed and evaluated existing work to measure ICT development from different sources, including academia, the private sector and international organizations (UNDP, UNIDO, OECD and the ITU). On the basis of this work, UNCTAD constructed a theoretical framework to approach ICT measurement, comprising indicators for connectivity, access, usage and policy. UNCTAD benchmarked and analysed the diffusion of ICT capabilities across 160-200 countries for 1995-1002. This cross-country study compiles data and calculates ICT Development Indices for: connectivity (physical infrastructure for ICTs, in penetration rates of Internet hosts, PCs, telephone mainlines, mobile phones per capita); wider access to ICTs (literacy, GDP per capita and cost of local calls, as well as actual number of Internet users); usage of ICTs (incoming and outgoing telecoms traffic, as an alternative to Internet data traffic flows in the absence of publicly available statistics on these); and policy environment
ICT Development Indices ____________________________
4 UNCTAD, Geneva
(a wider policy framework conducive to the adoption and absorption of ICTs, which can be evaluated in terms of the presence of a domestic Internet exchange, as well as competition in the local loop, domestic long distance and ISP markets). This study analysed country and regional rankings based on these index measurements, and reviewed results over time to identify interesting trends. It further sought to evaluate the extent and evolution of the digital divide, using basic measures of hardware equipment and numbers of Internet users in each country, to determine whether and in what way the digital divide is evolving. [CONCLUSIONS] Classification of countries as 'falling behind', 'keeping up' and 'getting ahead' on the basis of country rankings show stable rankings over time, with strong regional influences. As a generalisation, African and South Asian countries were classified as 'falling behind', Latin American and transition economies as 'keeping up' and OECD countries and S.E.Asian Tigers as 'getting ahead'. However, this masks considerable diversity in individual country experience, with Arab and 'island states' as notable successes having good connectivity despite less competitive policy measures. Strong positive correlations are observed between connectivity and access and, to a lesser extent, connectivity and competitive telecoms policy. Country rankings are stable and consistent over time, and in line with expectations based on income. Such stability is consistent with long-term time horizons required for telecommunications investment. It also implies that these Indices are based on indicators measuring central ICT development. UNCTAD further analysed and measured the international digital divide in inequality in distributions of hardware equipment and Internet users across countries, using Gini measures of inequality. Trends in connectivity over time suggest that, despite stable country rankings, there is reducing inequality and potential convergence in the distributions of hardware across countries, yielding the intriguing result of a diminishing digital divide. Gini analysis reveals some small change in inequality, with only small, incremental reductions from highly unequal levels. Our results show that more recent technologies such as the Internet (as measured by Internet hosts and Internet users) are more unevenly distributed relative to older technologies, such as fixed line telephony. Our findings demonstrate 'leapfrogging' in mobile telephony (with lower levels of inequality, which reduce the fastest), suggesting greater potential for mobiles as more equally distributed technologies in bridging the digital divide. However, Gini coefficients as relative measures across the whole distribution do not identify the origins of reducing inequality. UNCTAD therefore analysed relative movements in rankings to identify how countries and regions are faring in basic connectivity, to see which countries are contributing to reducing inequality, increasing inequality, or preserving the status quo. Based on a regional analysis of relative rankings, we find evidence that OECD countries are becoming more tightly bunched in the upper 'tail' of the distribution. Sub-Saharan African countries continue to occupy the lower tail of the distribution. The incremental reductions in Gini coefficient likely derive from the middle of the distribution of hardware equipment across countries. China in particular has a steady and substantial rise in relative rankings that influences the Gini coefficient strongly, since China is host to one fifth of the world's population. Taken together, it is envisaged that these relative measures of the digital divide and the insights derived from benchmarking, provide a more detailed picture of developments in the evolution in countries' ICT development. Overall, these reductions represent only small, incremental reductions in inequality from their high levels of inequality. There is still considerable work to be done in bringing the
ICT Development Indices ____________________________
5 UNCTAD, Geneva
large majority of the world's population within reach of modern communications. And yet, the benefits of extending ICTs to the world's rural and poorer populations may be enormous. For then, truly, their voices may be heard.
1. INTRODUCTION
This report seeks to analyse and evaluate Information and Communication Technology (ICT) development using indicators of ICT diffusion across countries. It develops a conceptual framework and selects key indicators measuring development in ICTs, with a specific focus on ICTs as pervasive technologies of global impact, wide application and growing potential. This study benchmarks levels of ICT development, in extant infrastructure connectivity, as well as measures of future potential and important determinants affecting countries' abilities to absorb, adopt and make use of these new technologies. In keeping with their complex nature and multiple applications, Information and Communication Technologies (ICTs) may be viewed in different ways. The World Bank defines ICTs as "the set of activities which facilitate by electronic means the processing, transmission and display of information" (Rodriguez & Wilson, 2000). ICTs "refer to technologies people use to share, distribute, gather information and to communicate, through computers and computer networks" (ESCAP, 2001). "ICTs are a complex and varied set of goods, applications and services used for producing, distributing, processing, transforming information – [including] telecoms, TV and radio broadcasting, hardware and software, computer services and electronic media" (Marcelle, 2000). ICTs represent a cluster of associated technologies defined by their functional usage in information access and communication, of which one embodiment is the Internet. Hargittai (1999) defines the Internet techically and functionally: "The Internet is a worldwide network of computers, but sociologically it is also important to consider it as a network of people using computers that make vast amounts of information available. Given the two [basic] services of the system – communication and information retrieval – the multitude of services allowed… is unprecedented". ICTs, represented by the Internet, deliver "at once a worldwide broadcasting capability, a mechanism for information dissemination, a medium for interaction between individuals and a marketplace for goods and services" [Kiiski & Pohjola (2001)]. ICTs have been in use for some time, for example, in voice communications technology. However, recent advances such as the Internet are breaking new ground (and introducing new divisions) in the achievements and potential they offer. Cukier (1998) notes that definition of the Internet "is very relevant to the peering debate [about the exchange of data traffic and interconnection agreements] as well as whether regulators [have] a role to play in Net matters". He points out that "the voice telecoms network is founded upon the principle of universal connectivity… The Internet, however, lacks a specific definition and it is uncertain whether the telephony model applies to it". In this view, [spread of] the Internet has unique important characteristics differentiating it from older technologies, such as telephony. This view has important implications for countries' policy approaches and the way in which they seek to encourage, monitor and regulate ICT adoption, interconnection and, ultimately, access.
ICT Development Indices ____________________________
6 UNCTAD, Geneva
It may be easier to define what ICTs are not: ICTs are not a panacea for development or replacement for real world processes. If real world processes are flawed, deficient or absent, ICTs cannot make good these flaws or make up for these deficiencies. If a government process is bureaucratic, convoluted and subject to delays, moving it online may not make it any more efficient; and instant transmission may not necessarily make it any faster. If controls over financial systems are inadequate or missing, making systems electronic will not make them effective; and may in fact make it more difficult to trace the audit trail. This emphasizes the importance of having well-thought out, well-established, clear real world processes, before moving them online. In this view, ICTs can be an effective 'AND', rather than a substitute 'OR'. ICTs may, however, reshape, re-organize and fundamentally restructure working methods, and ultimately, the sectors in which they are used. ICTs offer generic advantages of: efficiency and productivity gains; information-sharing, storage, and communication; faster knowledge-accumulation, dissemination and application; in support of the specific purposes for which they are used. ICTs also permit new, collaborative work methods, with their potential for networking. Communication and interaction between previously isolated agents pool their individually isolated resources, knowledge and experience to build a common knowledge base that all members can draw upon. ICTs can transform work and research methods by enabling group interactions based on central reserves of shared knowledge. The evidence suggests that we still stand at the threshold of what ICTs may achieve, and that collaborative networking methods will evolve further, as people learn to communicate, interact and work in new ways. This makes ICTs a very exciting 'AND', and one that may change the equation altogether. Despite the undoubted benefits offered by ICTs, substantial barriers to the effective use of ICTs also exist, in both developed and developing countries. These barriers must be addressed to allow realisation of ICTs' full potential. Some barriers may be endemic (e.g. the generation gap, learning processes, and gaining experience in ICTs). Developing countries face additional barriers to effective ICT usage. In the E-Commerce Report (2001), UNCTAD notes that "in developing countries, [government agencies] will have to deal with problems of telecoms infrastructure, poor computer and general literacy, lack of awareness of the Internet and regulatory inadequacy, that also hinder other applications of the Internet there". (These obstacles are not uncommon in developed countries, with the European Union seeking to address some of these challenges). Technological gaps and uneven diffusion in technology are not new – "older" innovations such as telephony and electricity are still far from evenly diffused – but what may be unprecendented is the potential size of the opportunity costs and benefits foregone by failure to participate in the new "digital society". Growth in the use of ICTs is highly uneven. There are significant disparities in access to and use of ICTs in developing countries, which risk being left behind in the digital revolution. Developing countries risk being left further behind in terms of income, equality, development, voice and presence on an increasingly digitalised world stage. They must look forward prospectively, and participate actively in building technological capabilities to suit their needs. Technology itself also has a roleto play in this. Just as technologies create them, new innovations offer ways of bridging technological divides. Connectivity can build on existing infrastructure or bypass traditional means with technologies such as wireless. The availability of free software is transforming the IT industry. This report seeks to benchmark the extent of ICT development, as an important contribution and input to policy-making. Benchmarking is important in measuring outcomes (but not
ICT Development Indices ____________________________
7 UNCTAD, Geneva
causation) from policies, and in monitoring progress in ICT connectivity and access. Benchmarking allows comparisons between countries and indicates how well countries are doing compared to others in terms of their adaptation, mastery and development in ICTs. A standard selection of indicators against which countries are measured allows comparisons and initial policy conclusions, between countries and over time. Comparison with better-performing countries helps identify policies for further improvement and progression. Although benchmarking cannot investigate causation, it nevertheless allows more straightforward identification based on evidence of 'success stories' and 'laggards' for closer investigation, as an essential input to policy analysis. ITU (2002) notes in its 2002 World Telecommunications Development Report that "over the last few decades, virtually every country has succeeded in improving its telecommunications sector. Thus, every country can show that its particular blend of policies has been successful. It is only by making international comparisons that it is possible to show which policies have been more successful than others… For this reason, an approach based on comparative rankings may be more meaningful than one that uses absolute growth rates". UNCTAD therefore uses a methodology based on relative rankings, rather than absolute scores. Indeed, with respect to ICTs, it is unclear what the reference points for absolute scores would be. In this paper, we adopt a comparative approach based on relative country rankings to identify countries that are making progress in ICT uptake, and those which are being left behind in the digital divide.
2. THEORETICAL FRAMEWORK & LITERATURE REVIEW
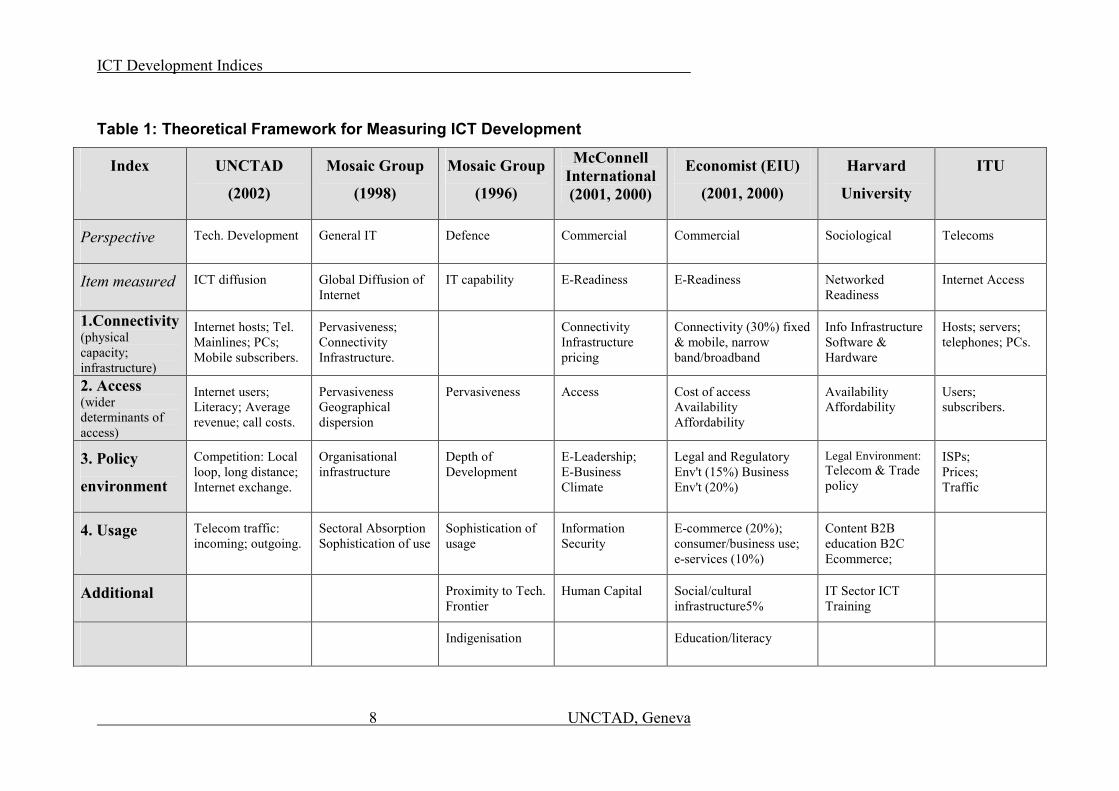
In conjunction with the United Nations Commission on Science and Technology for Development (UNCSTD), UNCTAD reviewed and evaluated existing work to measure ICTs from different sources, including academia, the private sector and international organizations (UNDP, UNIDO, OECD and the ITU). Our review of existing work carried out to date to evaluate countries' ICT capabilities reveals a consistent underlying theoretical framework of indicators of connectivity, access, policy and usage across most studies, irrespective of the viewpoint from which they are written, as illustrated in Table 1 below. UNCTAD uses this theoretical framework, shown in Table 1, to approach the measurement of ICT development and adopts this framework in the formulation of the ICT Development Indices. This section provides a brief discussion of some of the main conceptual issues arising from a review of the literature on approaches towards the measurement of ICT development.
ICT Development Indices
8 UNCTAD, Geneva
Table 1: Theoretical Framework for Measuring ICT Development
Index UNCTAD
(2002)
Mosaic Group
(1998)
Mosaic Group
(1996)
McConnell International(2001, 2000)
Economist (EIU)
(2001, 2000)
Harvard
University
ITU
Perspective Tech. Development General IT Defence Commercial Commercial Sociological Telecoms
Item measured ICT diffusion Global Diffusion of Internet
IT capability E-Readiness E-Readiness Networked Readiness
Internet Access
1.Connectivity (physical capacity; infrastructure)
Internet hosts; Tel. Mainlines; PCs; Mobile subscribers.
Pervasiveness; Connectivity Infrastructure.
Connectivity Infrastructure pricing
Connectivity (30%) fixed & mobile, narrow band/broadband
Info Infrastructure Software & Hardware
Hosts; servers; telephones; PCs.
2. Access (wider determinants of access)
Internet users; Literacy; Average revenue; call costs.
Pervasiveness Geographical dispersion
Pervasiveness Access Cost of access Availability Affordability
Availability Affordability
Users; subscribers.
3. Policy
environment
Competition: Local loop, long distance; Internet exchange.
Organisational infrastructure
Depth of Development
E-Leadership; E-Business Climate
Legal and Regulatory Env't (15%) Business Env't (20%)
Legal Environment: Telecom & Trade policy
ISPs; Prices; Traffic
4. Usage Telecom traffic: incoming; outgoing.
Sectoral Absorption Sophistication of use
Sophistication of usage
Information Security
E-commerce (20%); consumer/business use; e-services (10%)
Content B2B education B2C Ecommerce;
Additional Proximity to Tech. Frontier
Human Capital Social/cultural infrastructure5%
IT Sector ICT Training
Indigenisation Education/literacy
ICT Development Indices
7 UNCTAD, Geneva
Conceptual Issues relating to ICT Indices The theoretical model and selection of indicators determines the quality and predictive power of Indices. A good example of a comprehensive, well thought-out model embodying views on causation in Internet indices is the United Nation's Industrial Development Organization (UNIDO)'s Industrial Performance Scoreboard (2002). Conversely, the absence of, or deficiencies in, a model constrains and limits the scope of observations possible (e.g. Economic Intelligence Unit's E-Readiness indicators, which yield only limited policy insights, following the lack of a coherent theoretical framework). The selection of indicators has important consequences for the study's results and conlusions. The United Nations Development Progam (UNDP) use a broad selection of technological indicators in their Technological Achievement Index (2001). UNDP's index for agriculture and manufacturing technologies has the advantage of enabling UNDP to characterise developing countries by technological criteria relevant to developing countries' industrial achievements. Inclusion of older innovations permits longitudinal comparisons over time back to 1970. In this study, we opt for a more narrow, focused subset of ICT indicators. This has the effect of restricting the time period (from 1995 onwards; following Hargittai (1999), who notes that usage of the Internet only really became widespread after 1993). It also has the effect of restricting our country sample, depending upon the indicator. For connectivity, 200 countries have been assessed. For more advanced data, notably on usage of ICTs, sample is restricted to mostly OECD and South Asian countries. Standardised data for several regions are not available, with individual case studies detailing usage for different countries. Selection of indicators also describes the 'breadth versus depth' trade-off. This trade-off describes how standardised data is not available in detail for a large number of countries. Press (1999) observes that "in tracking diffusion of the Internet, one must choose a balance between breadth and depth". He concludes that with a complex concept as the Internet, "an index may be more robust than a [single] indicator in measuring a qualitative concept" (Press, 1999, p.5). From a practical perspective, if a wide sample coverage is sought, then basic, standardised indictors must be chosen for the index. For more detailed indicators such as usage and ICT take-up statistics, specialised data is only available for a smaller subset of countries. Furthermore, this type of data is most likely to come from country case studies, rather than the high level, standardised data we present here. In the trade-off between 'breadth versus depth', this study opts necessarily for breadth in pursuit of its cross-country benchmarking exercise. UNCTAD (1991) distinguishes between input, output and performance-related indicators for technology indicators as a whole. However, it is becoming increasingly unclear as to what extent this distinction still applies in respect of ICT indicators. Is a Personal Computer to be viewed as an input (e.g. as a necessary piece of equipment for dial-up Internet access), as an output (e.g. in regression analysis, which has sought to explain the diffusion of PCs, as in Caselli & Coleman, 2001), or as part of the phenomenon to be studied? The distinction between input and output indicators (e.g. UNDP, 2001) finds a parallel in similar distinctions between ex ante and ex post indicators (e.g. World Economic Forum, 2001), and determinants and performance indicators (e.g. UNIDO, 2002). It also partly relates to views of technologies, including ICTs, as sequential, in which one technology forms a basis or input to another in predefined steps. For example, UNDP (2001) justifies
ICT Development Indices
8 UNCTAD, Geneva
including telephones and electricity per capita as indicators in its Technological Achievement Index since “they are needed to use newer technologies and are pervasive inputs to a multitude of activities”. Alternatively, views of technologies may be synergistic, in which a cluster or spectrum of technologies is necessary as simultaneous inputs to an outcome technology e.g., electricity, laser technology, digital code, PC, modem for Internet access. The question of whether inputs into the process of technology development are considered sequential, as with UNDP (2001), or synergistic, as in the 'cluster' approach of McConnell International (2001), determines the form of index adopted – See 'Index Methodology' in the next Section. Views of sequential and synergistic technologies also partly reflect views of causation. Indices are not capable of determining or quantifying causation, for which more sophisticated statistical techniques are required. These may be conceptually embodied in the theoretical framework, e.g. the UNIDO (2002) distinguishes between 'Determinants' and indicators of 'Industrial Performance' and investigates causation by methods including cluster analysis and regressions. Indices provide a ready means of measuring a standardised predetermined set of 'symptoms', rather than their wider 'causes'. There is likely to be significant endogeneity within this model, which indices are not equipped to analyse. Furthermore, the indigenous nature of technology is a consideration for some studies. In Porter et al (1999)'s original Capacity for Innovation Index, the highest scores in its qualitative variable were assigned to countries where "companies obtain technology by pioneering their own new products and processes", whereas countries where "companies obtain technology exclusively from foreign countries" received less credit. This method values domestic innovation as more valuable than imported technology and diminishes the value of international technology transfer (TT), despite substantial evidence to the contrary, for the potential success of these channels (notably Asian NIEs, such as Korea). The World Economic Forum also distinguishes between domestic and foreign technology in its study of national competitiveness, on the basis that "evidence suggests that without strong domestic technological activity, heavy dependence on foreign technologies leads to limited and shallow technology transfer" (World Economic Forum, 2000). The Mosaic Group (1996) assesses 'indigenisation' in its IT Capacity Framework, defined as the national origins and staffing of technology with indigenous personnel. However, subsequently the Mosaic Group (1998) assesses worldwide diffusion of technology in its 'Global Diffusion' of the Internet framework as a stand-alone, independent package that countries can import and apply, and no longer considers the national origins of technology, R&D or human capital. The question as to what extent it is still relevant to talk of the national origins of a global technology such as the Internet, is intriguing. The Economist Intelligence Unit notes that "the Internet is global, but local conditions matter" (EIU, 2001). "National" and cultural influences are apparent in the readiness with which consumers adopt new technology and issues of MNC operations and FDI in technology transfer. There is an important role for the state in the development of policy and the telecoms and business environment. Governments can influence access to technology (connectivity, control over access, censorship). Important policies include telecoms policy and regulation, import policy, FDI, MNCs and technology transfer, political openness/censorship, e-governance, E-Leadership, education, research, stable macro-fundamentals and the legal environment. This academic question finds its practical correlation in the adoption of national economies as the basic unit of analysis (see the next section: ICT Development Indices).
ICT Development Indices
9 UNCTAD, Geneva
3. ICT DEVELOPMENT INDICES
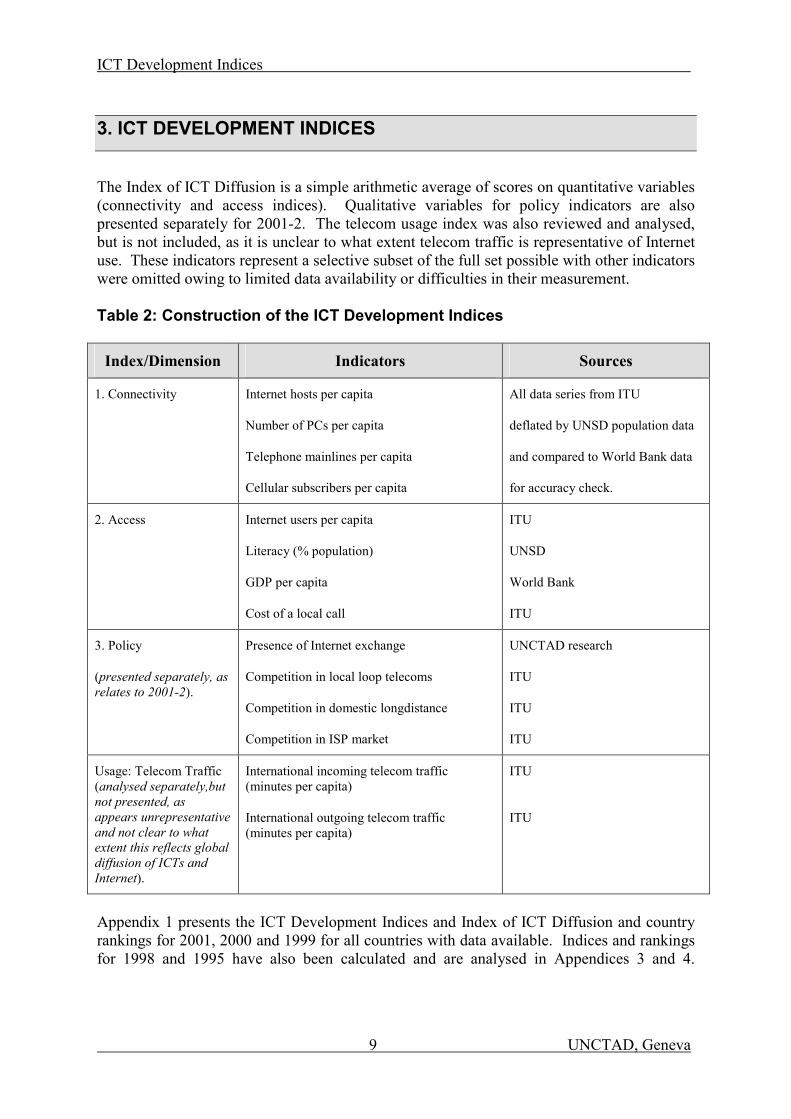
The Index of ICT Diffusion is a simple arithmetic average of scores on quantitative variables (connectivity and access indices). Qualitative variables for policy indicators are also presented separately for 2001-2. The telecom usage index was also reviewed and analysed, but is not included, as it is unclear to what extent telecom traffic is representative of Internet use. These indicators represent a selective subset of the full set possible with other indicators were omitted owing to limited data availability or difficulties in their measurement. Table 2: Construction of the ICT Development Indices
Index/Dimension Indicators Sources
1. Connectivity Internet hosts per capita
Number of PCs per capita
Telephone mainlines per capita
Cellular subscribers per capita
All data series from ITU
deflated by UNSD population data
and compared to World Bank data
for accuracy check.
2. Access Internet users per capita
Literacy (% population)
GDP per capita
Cost of a local call
ITU
UNSD
World Bank
ITU
3. Policy
(presented separately, as relates to 2001-2).
Presence of Internet exchange
Competition in local loop telecoms
Competition in domestic longdistance
Competition in ISP market
UNCTAD research
ITU
ITU
ITU
Usage: Telecom Traffic (analysed separately,but not presented, as appears unrepresentative and not clear to what extent this reflects global diffusion of ICTs and Internet).
International incoming telecom traffic (minutes per capita)
International outgoing telecom traffic (minutes per capita)
ITU
ITU
Appendix 1 presents the ICT Development Indices and Index of ICT Diffusion and country rankings for 2001, 2000 and 1999 for all countries with data available. Indices and rankings for 1998 and 1995 have also been calculated and are analysed in Appendices 3 and 4.
ICT Development Indices
10 UNCTAD, Geneva
3.1. ICT INDICATORS: 1. Connectivity
Connectivity is narrowly defined as the physical infrastructure available to a country, as distinct from broader factors determining access (e.g. literacy, cost). Connectivity represents the basic 'limiting factor' on access to and use of ICTs – without the essential physical hardware, ICT use is not possible. We defined the narrow 'connectivity' as the minimum set of measures necessary for ICT access as comprising: Internet hosts per capita; PCs per capita; telephone mainlines per capita; and mobile subscribers per capita. This excludes supporting infrastructure (such as electrical supply and transport), affordability and broadband access, which may be currently more relevant to developed countries, but is expected to become increasingly important to all countries in the future. McConnell International note that "a multitude of factors must be in place… a weakness in any one can degrade a country's ability to take advantage of the economic potential of the Internet". This view sees connectivity as a cluster of technologies with synergies, rather than precedence, between different types of physical infrastructure. This is in contrast to UNDP's sequential logic of 'old' (telephony and electricity) as opposed to 'new' innovations (hosts, PCs) and "leapfrogging" between stages with a sequential order. 1. Internet hosts per capita Number of internet hosts has been taken as a measure of the Internet penetration of a country, and the degree of national "connectivity". Network Wizards (NW) define a host as: "A domain name that has an IP address (A) record associated with it. This would be any computer system connected to the Internet (via full or part-time, direct or dialup connections) ie. nw.com, www.nw.com". OECD (1998a) considers that "host count is the most precise available data on the presence of Internet in a country". Cross-country regression work has mainly used this variable as the most representative variable of Internet diffusion e.g. Hargittai (1999), Kiiski & Pohjola (2001), Robinson & Crenshaw (2001). Increasing number of Internet hosts implies increased ability to handle, service and store large amounts of data. However, difficulties include:
• ambiguity/overlap in definition with Internet server functions - Hosts may include name servers, mail servers and file servers;
• measurement methods and difficulties in allocating hosts to nations:
Hosts are assumed to be in the country shown by their country code (e.g. .nl for Netherlands). However, "there is not necessarily any correlation between a host's domain name and its location. A host with a .NL domain name could easily be located in the U.S. or any other country. Hosts under domains EDU/ORG/NET/COM/INT could be located anywhere. There is no way to determine where a host is without asking its administrator" (Network Wizards). This is a major problem, giving anomalous results e.g. the top country for Internet host penetration at July 1999 was the Pacific island Niue (Minges, 2001). The Solomon Islands had no hosts according to the July 1999 Networks Wizards survey, but has been connected to the Internet since 1996. The U.S. ranks 44th in Internet penetration based on the .us code. Most hosts in US use .com, .net or domains other than .us (Minges, 2001).
ICT Development Indices
11 UNCTAD, Geneva
A single computer may host several domain names and a single domain name might be hosted by a group of computers (Minges, 2001). These figures have been adjusted for physical location of the hosts by ISC. Data are subject to revision and there are often discrepancies between surveys. In July 1999, OECD nations owned 93% hosts (Press, 1999). 2. PCs per capita Telephone lines and personal computers are key components for Internet access before 3Generation and WAP mobile access become widely available, with significant implications for ICT adoption. Current access methods include dial-up access, using a telephone line, PC and modem. PCs therefore represent an upper limit for Internet access. Caselli & Coleman (2001) use number of computer imports as a measure of "computer technology adoption". PC estimates are available for developed countries, but measurement may not be reliable. Most ITU data are estimates of PC stocks from sales or import data. This is inaccurate for developing countries, where shipment data are scarce and significant channels for PC imports are omitted (e.g., smuggling, grey market, local assembly). Increased PC penetration rates should increase ICT connectivity. This is purely a numerical count and gives no indication of the power or quality of PCs, usage made of them, or method (e.g. shared Internet access). 3. Telephone mainlines per capita This is a relatively reliable, basic 'limiting factor' of connectivity and representative of potential, if not actual, levels of 'dial-up' access. ITU statistics include telephone subscribers plus the number of pay phones (data from telecom authorities or operators). Increased availability of telephone mainlines should increase connectivity, assuming dial-up access is available. However, this does not give an indication of the speed, reliability or cost of the connection, which are important considerations. It is important to be aware of the proxy variables that may be implicit in this measure. Telephone networks typically require large investments, so average national income and the public resources available play a large role in determining connectivity on a national basis. Population distribution, urban/rural dispersion and underlying geographical factors are important determinants of the extent of telephone networks e.g. Nepal and Cambodia have relatively limited mainline networks, while Turkey's is widely distributed. 4. Mobile subscribers per capita This measure of mobile connectivity will become increasingly important in the future. Current methods of Internet access emphasise PC-based applications, with 3G and WAP less widely adopted. Inclusion of mobiles allows leapfrogging in e.g. Cambodia (ITU case study, 2002) to be counted. However, ITU notes that the Cambodian government has neglected fixed lines, which are "more important for Internet access at this time". Inclusion of both fixed and mobile telephones reflects forms of ICT access which are important both now and in the future.
ICT Development Indices
12 UNCTAD, Geneva
2. Access
Jensen (2000) considers Internet connectivity from a more technical telecommunications perspective, noting that it "requires more than simply installing phone cables… the Internet is dependent on the telephone network ([comprising] cost of the line and cost of local and long-distance charges), availability and affordability of access equipment… and pervasiveness of telematics (mix of hard/software with human/organisational skills and knowledge transfer)". This introduces a broader definition of access and the factors determining use of ICTs, beyond narrow connectivity. 1. Number of Internet users This is an ex post measure of the level of Internet usage achieved by a nation in realised access to the Internet. However, Nua surveys and Minges (2001) point out different survey methods and definitions of Internet 'users': Inhabitants > awareness > ICT access > users > subscribers Number of subscribers paying for Internet access is more precise than users and implies a certain degree of usage in terms of realised actual users. It is also more measurable, but may not reflect full usage as it omits free or shared access. For developing countries, subscribers may constitute 'elite' consumers and fail to include common types of usage (e.g. shared access and cybercafes). Nua collects its data from national surveys that do not use consistent methodology, reducing their comparability. For consistency, we used ITU estimates of Internet users, weighted by population to yield Internet users per capita. ITU surveys were observed to be consistently lower than SangoNet surveys (Nua). However, to test how representative ITU surveys are, countries were scored and ranked according to Nua and ITU user estimates. Comparison of these rankings revealed relatively similar country profiles. 2. Literacy In the absence of widely available voice protocols, text-based protocols remain the most widely used Internet applications. Language barriers and illiteracy have been identified as common obstacles to Internet access. Language has been modelled using dummy variables for English-speaking former colonies (Robinson & Crenshaw, 2001). However, the rapid growth of other languages on the Internet means that the importance of this obstacle to access is diminishing all the time. According to GlobalReach, 43% of online users and 68.4% Web content use English, down from 80% web-pages in English in the late 1990s. Literacy remains a pervasive barrier to access, particularly for developing countries. Basic literacy represents an important ex ante capability for Internet access, of which only a small subset may be realised as the proportion of Internet users. 'Depth' measures of human capital, such as tertiary education, are considered less relevant for basic Internet access. We have therefore included basic literacy in our index.
ICT Development Indices
13 UNCTAD, Geneva
3. Cost of a local call Prices are an important measure and determinant of access, since people will not use the Internet if they cannot afford it. In Europe, the practice of per minute billing has been considered a major obstacle to Internet adoption (Center for Democracy & Technology, 2002). Some countries may have high Internet connectivity (e.g. high telephone and PC penetration) but relatively low user levels. The most heavily used Internet access method is dial-up (U.S. Internet Council, 2000), which entails the following main charges:
1. telephone charges (line rental/call charges to PTO); 2. Internet access charges (paid to the ISP).
Internet pricing comparisons are complex (depending upon method of access, time and frequency of usage), change rapidly and are often only available for developed countries. Given data constraints for developing countries, we adopted cost of a local call as the most representative indicator of cost of access. However, issues with telephone charges include:
• local call charges: some telephone operators do not charge directly for local calls (includes operators in N. America and New Zealand) – this has been considered an integral factor in and key to the expansion of ICTs in North America (Information Society, quoted in Center for Democracy and Technology, 2002);
• operators may include a proportion of "free" local calls in subscription charges; • charges may be fixed regardless of call duration;
• local call charges may differ depending on the time of day, day of week, or whether
the call is for Internet access;
• operators may provide discounted calls to user-specified numbers. Reduced cost of calls should facilitate the expansion of access to ICTs. 4. GDP per capita Income is another key determinant of access and people's ability to afford hardware investment and ongoing call costs (that are often a significant proportion of the cost in accessing the Internet). $1 an hour charged by a cybercafe is unaffordable for people whose average income is $2 per day. Average national income is also a proxy variable for a country's level of development, often implicitly related to a country's level of investment and thus its connectivity and infrastructure. Kedzie (1997) notes that "economic development is a leading candidate for a compounding factor that affects both democracy and electronic communication networks simultaneously". However, in his study of democracy and interconnectivity based on simultaneous equations analysis growth in Internet nodes, "statistical test results do not support… economic development as a confounding third variable… neither democracy nor GDP proves to influence interconnectivity strongly".
ICT Development Indices
14 UNCTAD, Geneva
3. Policy Index
The Policy Index relates to 2001-2, as this data is current and ITU gives 'realtime' data. Retrospective comparison is made with the other indices for 1995-2000. However, the stability of the rankings emerging (see section 4: Discussion of Results) give us confidence that these are valid comparisons to make. 1. Presence of Internet Exchanges Abramson (2000) defines Internet exchange (IX) points – also called network access points (NAPs) or metropolitan area exchanges (MAEs) – as physical installations created by third parties to facilitate traffic exchange between ISPs. Telegeography defines IX as "services created to facilitate on-site interconnections between independent or third-party Internet networks". This definition can be ambiguous: ITU considers Egypt has access to the functions of an IX (ITU, 2001) but Egypt is not listed as having an IX (Telegeography). Internet exchanges are important to permit domestic exchange of within-country traffic, without using valuable international bandwidth. Abramson (2000) notes that IX "provide focal points for local traffic exchange, enhancing local Internet infrastructure and reducing dependence on international links". Establishing an Internet exchange is an important policy decision in the allocation of resources for developing countries, keeping domestic Internet traffic within the country and saving international bandwidth for other uses. For the majority of developing countries, Internet exchanges are nationally based i.e. one per country (e.g. Kenya IX, Indonesia IX). Some countries have multiple exchanges serving major urban centres [Capetown IX (CINX), Johannesburg IX (JINX)]. In U.S., IX operate primarily at the State level or serve major urban centres (MAE may be an appropriate name). Our policy variable is a dichotomous variable (1 for an IX, 0 for its absence) since, for the majority of developing countries, presence of an IX is a major step. The additional benefits arising from further exchanges at the urban level may be considered marginal. The establishment of an IX may also be indicative of a proactive ICT policy outlook. 2. & 3. Competition in the local loop/domestic long distance Competition in a country's telecoms sector is an important policy choice. Current thinking holds that monopolies may hinder rapid development and advocates liberalisation of the telecoms sector in promoting competition, lowering prices and expanding access. OECD (2001) concludes "countries that moved early to liberalise telecoms have much lower telecoms costs and a wider diffusion of ICTs than countries that were late to take action" (p.9). They recommend that countries "facilitate the diffusion of ICT, by increasing competition in telecoms and technology (p.22)… [with] policies to unbundle the local loop and improve interconnection frameworks" (p.24). The structure and policy developments in the telecoms market affect the diffusion and absorption of ICTs within a country. Gorman & Malecki (2000) observe that "regulation and lack of telecommunication competition make it more expensive to operate through Asian and European providers
ICT Development Indices
15 UNCTAD, Geneva
(Bond, 1997; Cukier, 1998). The high cost of infrastructure and connections in Europe makes a circuit from Washington DC to Paris, London or Stockholm cost less than direct lines (Paltridge, 1999). Although prices are dropping as competition increases, leasing capacity on many intra-European leased lines remains more expensive than trans-Atlantic routes (Paltridge, 1999)". However, evidence from the cross-country regression studies is conflicting. Kiiski & Pohjola (2001) found that Internet access cost best explained growth in computer hosts per capita, however, competition (lack of monopoly) in telecoms markets proved insignificant. This is in sharp contrast with Hargittai (1999), who found that monopoly in the telecoms sector had a considerable negative impact on Internet connectivity in OECD countries (but not via reduced prices in access costs, which proved statistically insignificant). Competition in the local loop describes a country's telecoms market structure and government policy towards telecoms, irrespective of whether competition actually results in reduced prices. Based on data from ITU T-Reg Unit, our index scores competition in the local loop as 1, partial competition 0.5, duopoly 0.25 and monopoly 0. It is important to be aware of the implicit value judgments inherent in this scoring system. The 'monopoly' score of 0 does not recognise the potentially beneficial effects conferred by a "benign monopoly". SingTel is widely recognised to have been an efficient, proactive incumbent in Singapore's telecoms sector, with important benefits for the adoption of ICTs in Singapore (ITU, 2001). This contrasts with Nepal Telecommunications Company in Nepal, which "was not customer-orientated in pricing, bandwidth or service" (ITU, 2000). In future work, the blunt monopoly/ competition distinction could be replaced by country analysis of actual effects in practice. 4. Competition in the ISP market ITU defines web servers as installations that provide end-user access to the Internet, disseminate information and sell products and services (Minges, 2001). However, Cukier (1998) identifies four different types of ISP (backbone, downstream, webhosting and online service providers). Competition in a country's ISP market is important for the domestic diffusion of ICTs. Competition in Internet service provision may reduce prices and installation time, improve quality and availability of different services and customer care, thereby enhancing access. The importance of a vibrant ISP market is illustrated by Indonesia and Egypt, each with in excess of 60 ISPs, as opposed to Cambodia and Vietnam, where a limited number of ISPs and higher market concentration arguably result in higher prices and reduced customer service (ITU case studies). Number of ISPs in a country has been used as an indicator of market liberalisation. However, there are at least four different types of ISP [Cukier (1998)], markets may be fast-changing and there may be no legal requirement for ISPs to register. It is also necessary to distinguish between licensed ISPs and operational ISPs. This makes ISP counts inaccurate in large, liberalised markets. Number of ISPs has not been used in our index. We used ITU's T-Reg unit data to define this variable as a simple dichotomous variable (competitive scored as 1, monopoly as 0), rather than the continuous number of ISPs.
ICT Development Indices
16 UNCTAD, Geneva
4. Usage: Telecom Traffic (omitted from the Index of ICT Diffusion)
We investigated Internet traffic data. However, this data is commercially sensitive for Internet Service Providers (ISPs), who did not respond positively to our data requests. This is consistent with OECD (1998), who note an "absence of data on Internet traffic flows between countries". Abramson (2000) notes "meaningful Internet traffic statistics do not yet exist", despite widespread use of telephone traffic data. Minges (2001) notes that "Internet traffic data are scarce. Where available, they are compiled by telecom operators, ISPs, and some government agencies. Internet average daily usage in minutes reveal wide variations in average usage times across countries". We investigated existing data on telecom traffic as an indicator of usage. Telephone technologies form part of the ICT technological cluster. They are however mature technologies with established uses and may not be representative of usage patterns for more recent Internet technologies. Our telecom index is calculated as the average of incoming/outgoing telecoms traffic (minutes per capita population):
Telecom traffic index = (incoming traffic + outgoing traffic)/2
The results from our telecom index reveal the interesting phenomenon of 'offshore islands'. There is a small, but important, sub-category of 'island states' (such as Cayman Islands, Bahamas, Bermuda) specialised in service industries such as offshore banking/financial services, which require and are highly intensive in the use of ICTs. Renata Lebre La Rovere (1996) points out in her excellent review of Brazilian banking that "a bank's production process is particularly suited to benefit from IT diffusion, since it is organised around the storage and transfer of information". Banking particularly lends itself to automation and computerisation due to the high volume of repeat transactions involved. These economies have high PC and telephone penetration rates. However, their importance is apparent in the telecom usage statistics, where they have highest average incoming/outgoing telephone traffic. Please see discussion of results. The extent to which this usage phenomenon is representative of Internet data traffic flows is questionable. Comparison of country rankings in telecom traffic with total Internet users (regardless of type of usage) reveals little similarity in country rankings. We have therefore kept this index separate and not included it in the Index of ICT Diffusion. However, current telecom traffic may demonstrate future patterns of usage of ICTs as these more recent technologies mature.
ICT Development Indices
17 UNCTAD, Geneva
3.2. INDEX METHODOLOGY
Index Methodology Edgeworth (1925) defines an index number as "a number [that] shows by its variations the changes in a magnitude which is not susceptible either [to] accurate measurement itself or [to] direct valuation in practice". Press (1999) observes that "in tracking diffusion of the Internet, one must choose a balance between breadth and depth" and concludes that "an index may be more robust than a [single] indicator in measuring a qualitative concept" (Press, 1999, p.5). The Mosaic Group suggests that individual technologies need to be evaluated, since countries seldom exhibit uniform capabilities across the broad spectrum of ICTs. Measures of breadth and depth are needed; a dilemma which the Mosaic Group resolves by the use of Kiriat or 'wheel and spoke' diagrams [Kiriat, 1973] to reflect technology as a 'multi-faceted concept'. UNCTAD has reflected this balance between breadth and depth through use of an aggregate index with component sub-indices. However, there are dangers inherent in the use of a disaggregated index. The Mosaic Group observes in their 'Framework Analysis' paper (1997) that "while it is tempting to derive a single index to reflect a country's IT capability, such an approach is unlikely to provide the depth of understanding needed for policy decision-making". Press (1997) explicitly warns against the dangers of averaging, or "reducing a [multi-faceted] capability diagram down to a single number" (i.e. area), since capability diagrams with the same total area may have very different shapes i.e. countries exhibit different profiles across the spectrum of ICT technological capabilities. Press (1999) notes further challenges for Internet indices: [they] "should be orthogonal, each measuring an independent aspect of the state of the Internet in a nation, but it is difficult to define indices that are both comprehensive and uncorrelated". Simple averaging of indicators in an index implicitly assumes equal weighting of indicators and the possibility of offset of one indicator by another (i.e. connectivity is assumed equivalent to access and policy). GIT (2000) note that an "additive model implies that strength on any one of these dimensions could compensate for weakness on another". The question of whether inputs into the process of technology development are considered sequential, as with UNDP (2001), or synergistic, as in the 'cluster' approach of McConnell International (2001), determines the form of index adopted. A sequential concept of technological inputs implies an additive model in which factors with implied equivalence may offset each other. In other words, strength on one aspect can compensate for weakness on another (GIT 2000). This is also the perspective within which the idea of 'leapfrogging' fits in. For instance, Cambodia's lack of fixed mainlines may not matter, as its high mobile penetration rate is likely to offset this, implying 'leapfrogging' by 'skipping a step' in the sequence. Conversely, a synergistic view of a critical mass of associated technologies essential for a country's advancement in technology implies a multiplicative model in which weakness in any one input may hinder and impede effective development on the basis of non-equivalent inputs. This is the view put forward by McConnell International (2001) in the context of the Internet, in stating that a multitude of factors must be in place to take full advantage of the
ICT Development Indices
18 UNCTAD, Geneva
economic potential of the Internet, and that the weakness in one area can seriously obstruct the realisation of potential benefits. GIT (2000) also subscribe to a synergistic view by highlighting that all four dimensions in their model, namely national orientation, socio-economic infrastructure, technological infrastructure and productive capacity, have to be strengthened in order for a nation to enhance its technology-based export competitiveness. Despite these two differing views and methodologies, indices have usually followed simple additive averaging models. We also opt for such a model for mainly two reasons. First, our review of existing work to date indicated that results calculated using both methodologies do not differ significantly from each other. Second, the additive model is more widely used due to its relative simplicity. In fact, determinants do not have the same or equivalent influence over IT capability. Connectivity is a limiting factor, while government policy may result in lower IT capability for a well-connected nation or different consequences for IT capability of equivalently connected nations following different policy paths (e.g. Pakistan/India: positive impact of early liberalisation of telecoms licenses for Internet growth in Pakistan, compared to slower growth under public monopoly, private monopoly and finally liberal privatisation in India). We have used the aggregated index approach, with component indices (similar to UNDP's HDI). Countries' overall scores may be disaggregated into component indices of interest, permitting finer discernment between nations with different profiles across the spectrum of ICT capabilities. Attention should not focus on final index scores, but on scores across country profiles.
Relative or Absolute Indices ITU (2002) notes in its 2002 World Telecommunications Development Report that "over the last few decades, virtually every country has succeeded in improving its telecommunications sector.Thus, every country can show that its particular blend of policies has been successful". In absolute scores, therefore, nearly all countries will show increases in telecommunications connectivity. ITU concludes "it is only by making international comparisons that it is possible to show which policies have been more successful than others… For this reason, an approach based on comparative rankings may be more meaningful than one that uses absolute growth rates". ITU argues that relative growth rates are more insightful for policy analysis than absolute growth rates. UNCTAD therefore uses a methodology based on relative rankings, rather than absolute scores. Using relative rankings, countries' index scores are calculated as a proportion of the maximum score achieved by any country in any one year (see next Section). This method has the advantage that reference points derive from real-world achievements realised by any country (listed in Appendix 5). However, it has the drawback that reference countries change year on year, reducing inter-year comparability. Only country rankings can be compared between years, consistent with the ITU's recommendations, rather than direct comparisons of countries' scores (since the reference points are changing). In this paper, we adopt a comparative approach based on comparisons of relative country rankings between years to identify countries that are making progress in ICT uptake, and those which are being left behind in the digital divide.
ICT Development Indices
19 UNCTAD, Geneva
Evidence from other studies illustrates some issues that may arise using relative indices. GIT (2000) notes that relative indexing "is a relative scaling so that an apparent 'decline' over time or low score is only relative to other countries". GIT's HTI "are relative indicators. Hence, a 'decline' on an indicator does not imply an actual drop, just that competing countries have advanced faster". Thus, "Germany is considerably closer to other leading nations than to the U.S. and Japan… this distancing is not due to any decline in Germany, but rather to the remarkable gains by the U.S." (GIT 2000). UNIDO (2002) also notes that: "movements in rankings are relative, not absolute. Many [countries] like Kenya are not particularly technology-intensive exporters – they move up the scale because their exports are more complex than their other measures relative to other countries in their vicinity". These observations support the idea that in general, it is more meaningful to talk about countries' rankings, rather than a country's index score. Countries tend to group or 'bunch' together (particularly around the centre of the index distribution), where a score interval of 0.1 may be equivalent to several places in the rankings. Conversely, countries that stand out in the lead or fall behind in the tails of the distribution may have relatively large gaps between country scores, such that a significant improvement in index score is necessary to catch up leaders, or for those behind to catch other countries up. In general, it will thus be more meaningful to talk about countries' rankings, rather than their absolute index scores. Reference Points The question of approach in using relative versus absolute indices is closely connected to the issue of reference points. Indices with absolute scores are calculated as a proportion of fixed reference points. This has the advantage of permitting direct year on year comparability of scores (although, for the reasons cited above, the significance of a country's score depends upon its place in the index distribution), but it is unclear what these reference points should be for ICT achievements. With some indicators, maximum achievements are relatively straightforward: for example, 100% literacy rate, 100% Internet user rate. For other indicators, maximum achievements are less obvious. Mobile penetration may reach over 100% (e.g. for subscribers with more than one phone, or two SIM cards per phone). There are no established a priori ceiling limits for Internet host penetration. The problem of an outlying 'star performer' is also illustrated in GIT's work, where the country with the maximum reference value forges ahead. "The U.S. increased [its electronics production] by $71B from 1996 to 1999. The U.S. position is so strong that even China's remarkable doubling of electronics production from $33B to $65B increases its score only from 12 to 19" (out of 100). This is partly apparent from Appendix 5, where the maximum reference values for ICT parameters are increasing at very rapid rates. The use of fixed reference values, as happened with UNDP's HDI could resolve this problem. However, with fast-changing ICT indicators, it is not evident what these fixed reference values should be (compared to life expectancy/literacy, where well-established upper ceiling values exist).
ICT Development Indices
20 UNCTAD, Geneva
Indicator Scores Methodology Scores are derived as an index relative to the maximum and minimum achieved in any indicator by countries:
Index score = (Value – Minimum)/(Maximum – Minimum)
Since the minimum value achieved is zero1 for most indicators, scores amount to a percentage of maximum values:
Index score: = (Value – 0)/(Maximum – 0) = Value / Maximum Maximum reference values are given in Appendix 5 for connectivity. Indicators for which minimum values were not zero were telecoms traffic and telephone mainlines. However, these scores were calculated as a percentage of maximum values for consistency. Appendix 1 presents the Index of ICT Diffusion calculated on the basis of the Connectivity and Access Indices for 2001, 2000 and 1999. On the basis of these rankings, countries are classified as 'falling behind' (FB), 'keeping up' (KU) and 'getting ahead' (GA) corresponding to first, second and last thirds in rankings. To analyse trends in movements between 1995-2001, segmental analysis was carried out. Appendices 3 and 4 present the results for 2001, dividing countries into these categories on the basis of rankings for study of trends over time. This permits categorical analysis of results, by income level, region or culture. It also allows analysis of the scatter of observations, with frequency given in brackets after the title. Additive Model and Averaging There is no a priori logic for weighting indicators in their aggregation into the index. Simple averaging of indicators in an index implicitly assumes equal weighting of indicators and the possibility of offset of one indicator by another (i.e. mobiles are assumed to have equal importance to telephones, PCs and Internet hosts; connectivity is assumed equivalent to access and policy). GIT (2000) note that an "additive model implies that strength on any one of these dimensions could compensate for weakness on another". This is consistent with a sequential view of ICTs, rather than a synergistic one (where any weakness in the cluster reduces overall technological capabilities i.e. a multiplicative model as discussed previously). Furthermore, use of simple averages across scores results in averaging effects. GIT (2000) recognises that "a given indicator combines several scores [so] typically no country will score 100 on the resulting indicators". In general, distributions are averaged into the centre of the scoring range. Averaging effects are noted by UNIDO (2002), which recognises the possibility of "offset… at least for some countries [where] use of two benchmarks together biases the results against them in that their average capabilities appear lower".
1 Irving Fisher (1922)'s statistically desirable property of 'reversibility' (i.e. that the index calculated forwards and the index calculated backwards should be reciprocals of each other) is not fulfilled due to use of arithmetic averages in the indices. Use of 'zero' minimum values means that this 'reversible property' yields mathematically undefined answers (reciprocals of zero). However, this does not have any significant consequences for this index.
ICT Development Indices
21 UNCTAD, Geneva
Time Period Hargittai (1999) notes that "the World Wide Web was invented only in 1990 and web browser in 1993, [which] significantly accelerated [the Internet's] spread both in U.S. and internationally. Significant Internet diffusion is observed worldwide only in the past few years". We therefore compiled indicators and calculated indices for 1995, 1998, 1999, 2000 and 2001. Appendix 1 presents ICT Development Indices for 2001, 2000 and 1999. The Policy Index relates to 2001-2, since ITU's data is constantly updated. This makes comparisons with the Policy Index retrospective. Unit of analysis Our units of analysis are nation states, countries or territories defined by national boundaries. Technological hubs, or "centres of excellence" with extensive hinterlands [Telegeography survey, quoted in UNDP's HDR (2001)] are aggregated into national level statistics and it is important to be aware of the significant averaging effect this has on our results. Adoption of nations and territories as our unit of analysis gives added pre-eminence to Singapore, as both a nation state and a "large city" (ITU, 2000), compared to e.g. a lower ranking for India, comprising Bangalore as a technological hub. Were New York or Bangalore to be separated out from their hinterlands, very different results would emerge. New York has more Internet hosts available to it than the whole of Sub-Saharan Africa which means that a city ranking, or ranking of nations by cities, would yield different results. Telegeography (2001)'s survey gives some indication of what a ranking by cities looks like. Bridges.org observes that international digital divides have been assessed by comparisons of connectivity hardware between countries (PCs, hosts, servers, telephones), whereas domestic digital divides are assessed by measures of access by different groups (ethnicity, gender, age, income). The concept of disparities in access to ICTs is the same in both cases, but the level of analysis determines the choice of variables and method. The Mosaic Group (1996) measured the 'indigenisation' of IT capability, or "involvement by nationals… in installation, use, operation, maintenance, management and adaptation of technology… performed by indigenous personnel" [Mosaic 1996]. The Mosaic Group (1998)'s later theoretical framework assesses absorption of ICT technologies as independent, stand-alone technologies. National origin of technology is not considered. Analysis of technology along national lines measures "national differences" in the adoption and absorption of IT. However, whether such differences are national or cultural may be indeterminate (boundaries of nation states and culture may coincide, but this is not always the case). Expatriate communities are often important in promoting technological adoption in their homelands (e.g. communication needs of overseas Vietnamese; the accumulated human capital of Indian software specialists in US).
ICT Development Indices
22 UNCTAD, Geneva
National Size Effects GIT (2000) note that Porter et al (1999)'s Innovation Index "is normalised (per capita measures), whereas [GIT's] is not (most of the statistical components reflect national totals). HTI address national technological competitiveness without particular concern for an economy's size". However, they do not explore the consequences of this for their results. In fact, this may introduce bias into results. UNIDO (2002) notes that "the use of a population deflator works against large countries, but remains a good way to adjust for country size". This may be particularly true for infrastructure, where a certain minimum threshold infrastructure in the network may be required, irrespective of the size of country. Further expansion of the network may benefit from economies of scale in larger countries, resulting in proportionately reduced levels of infrastructure per capita. Country size is intimately related to population dispersion and geographical dispersion of the network. It is unlikely that we will be able to correct for these effects; however, it is important to remain aware of their existence and the fact that averaging measures across per capita population may implicitly work against larger countries, lowering their relative rankings. Data Omission Effects The treatment of data omissions is central in determining the results of an index. In calculating the indices, final scores must be adjusted for the number of data observations and weighted, to eliminate the impact of data omissions. Failure to do so effectively 'dilutes' the final index score by the number of omissions. However, data omissions are more likely for poorer countries. This poses a problem for our results, the extent of which is unclear. For some indicators (e.g. telephone mainlines and mobiles, in the Connectivity Index), 201 countries have been covered to a reasonable extent. However, some indicators (e.g. local call costs, in the Access Index) have more limited data availability which varies from year to year. Rodriguez & Wilson (2000) note that their "results almost surely err on the side of optimism, as countries with poor or no available data are most likely to be the same countries that are being left behind by the information revolution". This caution also applies to our study. The omission of primarily poorer countries with low data availability means that absent or negligible observations are omitted. Our sample essentially comprises those countries with a degree of connectivity infrastructure in the first instance. This introduces bias from sample truncation into our findings, but it is difficult to establish the extent of this bias, or how to correct it.
ICT Development Indices
23 UNCTAD, Geneva
4. DISCUSSION OF RESULTS
Results in this section are discussed by:
1. Income (UNDP codes of high-, middle- and low-income, others); 2. Regional groupings (UNDP codes of E. Europe and CIS, OECD, Arab states, E.Asia,
S.Asia, Latin America & Caribbean, Sub-Saharan Africa, others);
3. Other regions, where geographical factors are important (e.g. 'island states'). Comparisons are also made between:
4. Connectivity and Access Indices and their relation in Appendix 3; 5. Policy and Connectivity Indices to study the impact of policy in enhancing ultimate
connectivity in Appendix 4;
6. Evolution of indices over time; with particular attention paid to
7. Evolution of connectivity indicators over time, as representative of the digital divide. as important comparisons within the ICT Development Indices. Telecoms policy is expected to impact mainly upon user numbers and cost variables in the Access Index, and less so on other variables of literacy and income, so this comparison was not analysed in detail. Positive correlations between sub-indices in Appendix 2 are illustrated by overweight positive diagonals. Random scatters of observations would yield equal weightings across boxes. However, frequency of observations (given by the figures in brackets) illustrates a positive correlation in weightings. The high correlations in our results may suggest that we are measuring consistent indicators of central 'technological development'. However, indices do not address the question of causation. These indicators may also represent proxy variables for key drivers underlying technological development (e.g. average income and/or level of development, levels of investment). Causation cannot be determined by correlations and it is proposed to investigate causation by regression work at a later date. 1. Income UNDP codes were used to classify up to 171 countries into four categories of high-/middle-/low-income and 'others' for ICT Indices. To some extent, this analysis is partly dependent upon these classifications. Analysis of ICT rankings reveals that: Table 3: Analysis of the Index of ICT Diffusion by Income
ICT Development Indices
24 UNCTAD, Geneva
Index of ICT
Diffusion
2001 2000 1999 1998 1995
High: Best Worst
Average
U.S. 1 Qatar 45
18.6
U.S. 1 Bahamas 48
18.7
Norway 1 Qatar 37
17
Norway 1 Bahamas 55
18
Finland 1 Bahamas 46
17
Middle: Best Worst
Average
Korea, Rep. 23 Albania 161
77
Korea, Rep. 23 Albania 176
82
Korea, Rep. 21 Eq. Guinea 144
73
Korea, Rep. 26 Gabon 142
74
Korea, Rep. 26 Egypt 154
78
Low: Best Worst
Average
Armenia 62 Eritrea 171
132
Indonesia 72 Eritrea 180
137.6
Tajikistan 50 Central Af. Rep 159
126
Ukraine 66 Niger 159
128
Vietnam 61 Central Af. Rep 156
120
Others: Best Worst
Average
Macao 31 Sol. Islands 167
109.4
Guam 25 Sol. Islands 174
106
Greenland 27 Vanuatu 148
84
Greenland 25 Sol. Islands 141
76
Macao 28 St Lucia 143
70
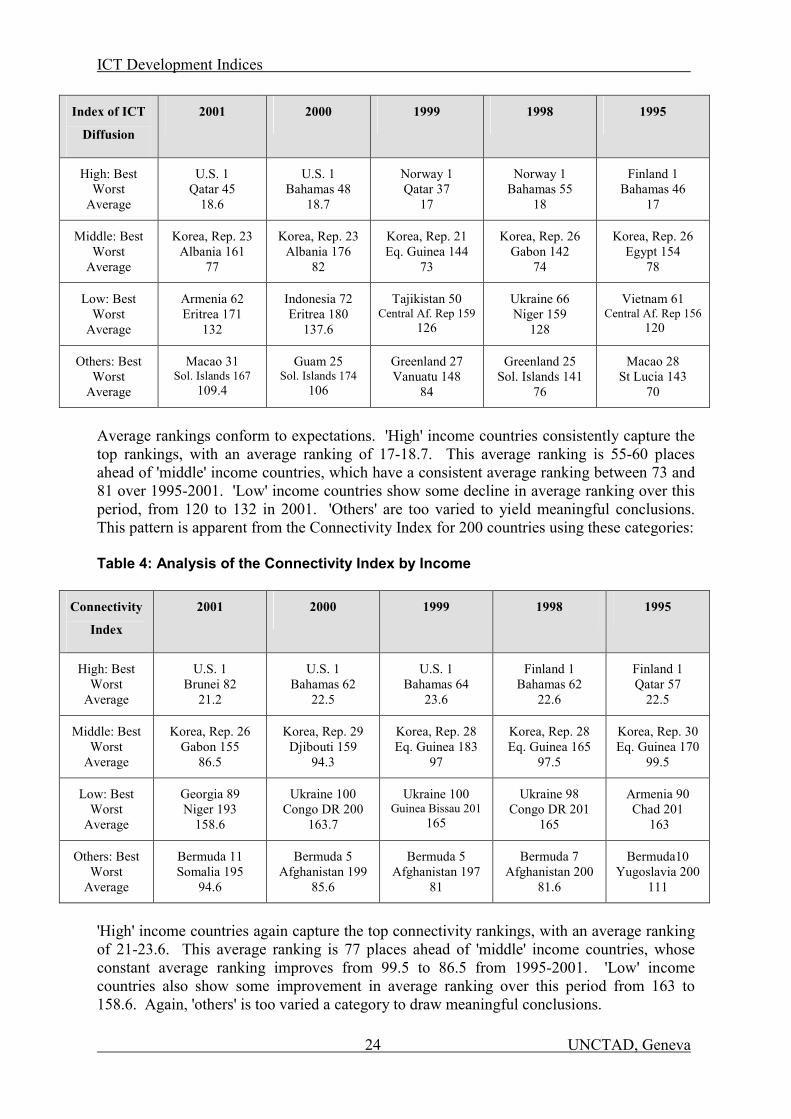
Average rankings conform to expectations. 'High' income countries consistently capture the top rankings, with an average ranking of 17-18.7. This average ranking is 55-60 places ahead of 'middle' income countries, which have a consistent average ranking between 73 and 81 over 1995-2001. 'Low' income countries show some decline in average ranking over this period, from 120 to 132 in 2001. 'Others' are too varied to yield meaningful conclusions. This pattern is apparent from the Connectivity Index for 200 countries using these categories: Table 4: Analysis of the Connectivity Index by Income
Connectivity
Index
2001 2000 1999 1998 1995
High: Best Worst
Average
U.S. 1 Brunei 82
21.2
U.S. 1 Bahamas 62
22.5
U.S. 1 Bahamas 64
23.6
Finland 1 Bahamas 62
22.6
Finland 1 Qatar 57
22.5
Middle: Best Worst
Average
Korea, Rep. 26 Gabon 155
86.5
Korea, Rep. 29 Djibouti 159
94.3
Korea, Rep. 28 Eq. Guinea 183
97
Korea, Rep. 28 Eq. Guinea 165
97.5
Korea, Rep. 30Eq. Guinea 170
99.5
Low: Best Worst
Average
Georgia 89 Niger 193
158.6
Ukraine 100 Congo DR 200
163.7
Ukraine 100 Guinea Bissau 201
165
Ukraine 98 Congo DR 201
165
Armenia 90 Chad 201
163
Others: Best Worst
Average
Bermuda 11 Somalia 195
94.6
Bermuda 5 Afghanistan 199
85.6
Bermuda 5 Afghanistan 197
81
Bermuda 7 Afghanistan 200
81.6
Bermuda10 Yugoslavia 200
111
'High' income countries again capture the top connectivity rankings, with an average ranking of 21-23.6. This average ranking is 77 places ahead of 'middle' income countries, whose constant average ranking improves from 99.5 to 86.5 from 1995-2001. 'Low' income countries also show some improvement in average ranking over this period from 163 to 158.6. Again, 'others' is too varied a category to draw meaningful conclusions.
ICT Development Indices
25 UNCTAD, Geneva
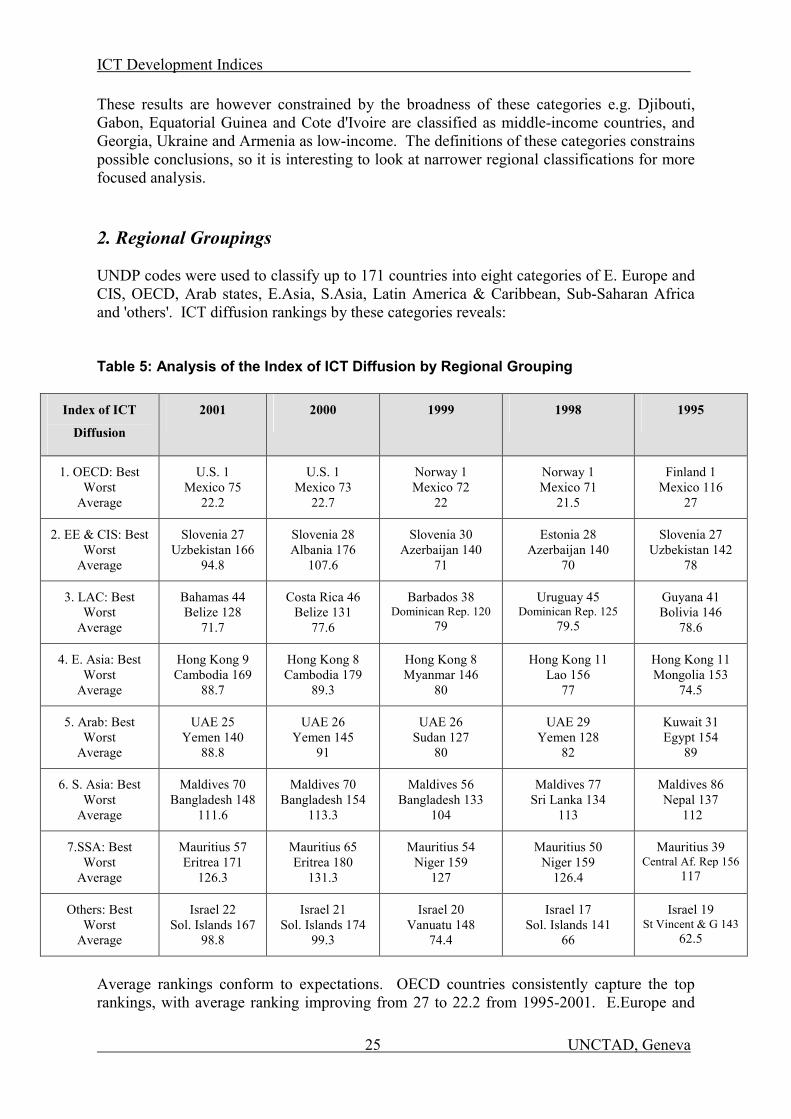
These results are however constrained by the broadness of these categories e.g. Djibouti, Gabon, Equatorial Guinea and Cote d'Ivoire are classified as middle-income countries, and Georgia, Ukraine and Armenia as low-income. The definitions of these categories constrains possible conclusions, so it is interesting to look at narrower regional classifications for more focused analysis. 2. Regional Groupings UNDP codes were used to classify up to 171 countries into eight categories of E. Europe and CIS, OECD, Arab states, E.Asia, S.Asia, Latin America & Caribbean, Sub-Saharan Africa and 'others'. ICT diffusion rankings by these categories reveals: Table 5: Analysis of the Index of ICT Diffusion by Regional Grouping
Index of ICT
Diffusion
2001 2000 1999 1998 1995
1. OECD: Best Worst
Average
U.S. 1 Mexico 75
22.2
U.S. 1 Mexico 73
22.7
Norway 1 Mexico 72
22
Norway 1 Mexico 71
21.5
Finland 1 Mexico 116
27
2. EE & CIS: Best Worst
Average
Slovenia 27 Uzbekistan 166
94.8
Slovenia 28 Albania 176
107.6
Slovenia 30 Azerbaijan 140
71
Estonia 28 Azerbaijan 140
70
Slovenia 27 Uzbekistan 142
78
3. LAC: Best Worst
Average
Bahamas 44 Belize 128
71.7
Costa Rica 46 Belize 131
77.6
Barbados 38 Dominican Rep. 120
79
Uruguay 45 Dominican Rep. 125
79.5
Guyana 41 Bolivia 146
78.6
4. E. Asia: Best Worst
Average
Hong Kong 9 Cambodia 169
88.7
Hong Kong 8 Cambodia 179
89.3
Hong Kong 8 Myanmar 146
80
Hong Kong 11 Lao 156
77
Hong Kong 11 Mongolia 153
74.5
5. Arab: Best Worst
Average
UAE 25 Yemen 140
88.8
UAE 26 Yemen 145
91
UAE 26 Sudan 127
80
UAE 29 Yemen 128
82
Kuwait 31 Egypt 154
89
6. S. Asia: Best Worst
Average
Maldives 70 Bangladesh 148
111.6
Maldives 70 Bangladesh 154
113.3
Maldives 56 Bangladesh 133
104
Maldives 77 Sri Lanka 134
113
Maldives 86 Nepal 137
112
7.SSA: Best Worst
Average
Mauritius 57 Eritrea 171
126.3
Mauritius 65 Eritrea 180
131.3
Mauritius 54 Niger 159
127
Mauritius 50 Niger 159
126.4
Mauritius 39 Central Af. Rep 156
117
Others: Best Worst
Average
Israel 22 Sol. Islands 167
98.8
Israel 21 Sol. Islands 174
99.3
Israel 20 Vanuatu 148
74.4
Israel 17 Sol. Islands 141
66
Israel 19 St Vincent & G 143
62.5
Average rankings conform to expectations. OECD countries consistently capture the top rankings, with average ranking improving from 27 to 22.2 from 1995-2001. E.Europe and
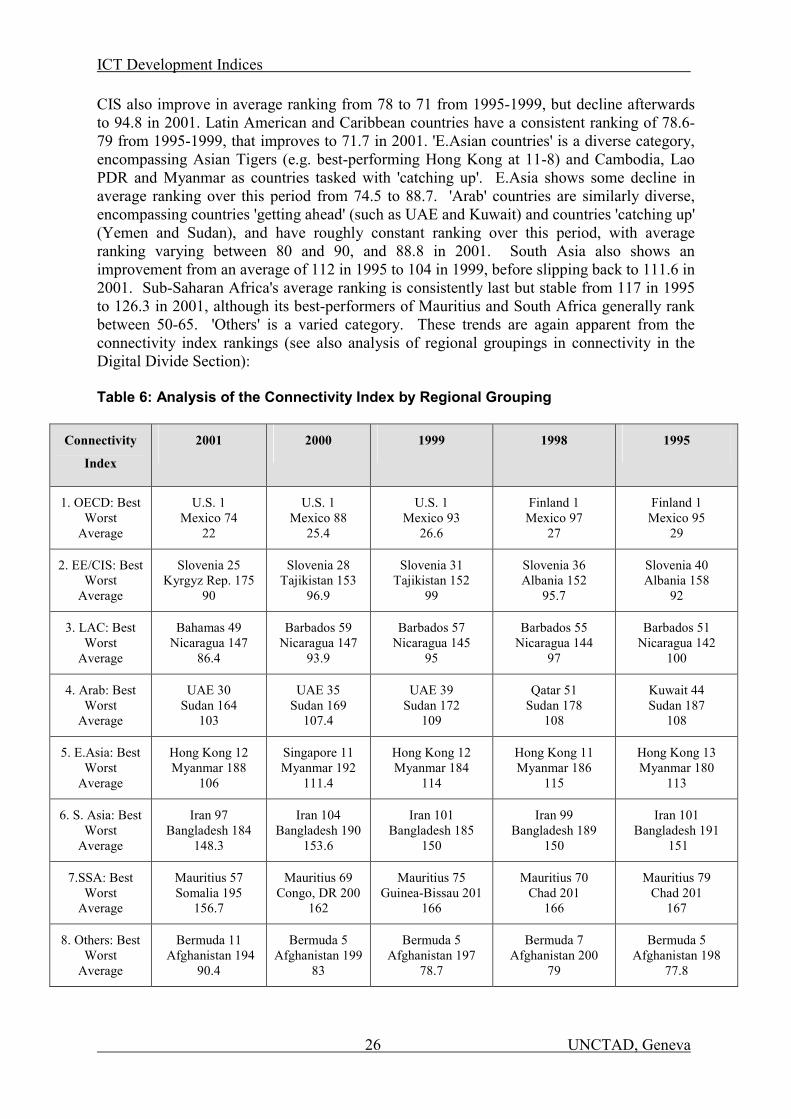
ICT Development Indices
26 UNCTAD, Geneva
CIS also improve in average ranking from 78 to 71 from 1995-1999, but decline afterwards to 94.8 in 2001. Latin American and Caribbean countries have a consistent ranking of 78.6-79 from 1995-1999, that improves to 71.7 in 2001. 'E.Asian countries' is a diverse category, encompassing Asian Tigers (e.g. best-performing Hong Kong at 11-8) and Cambodia, Lao PDR and Myanmar as countries tasked with 'catching up'. E.Asia shows some decline in average ranking over this period from 74.5 to 88.7. 'Arab' countries are similarly diverse, encompassing countries 'getting ahead' (such as UAE and Kuwait) and countries 'catching up' (Yemen and Sudan), and have roughly constant ranking over this period, with average ranking varying between 80 and 90, and 88.8 in 2001. South Asia also shows an improvement from an average of 112 in 1995 to 104 in 1999, before slipping back to 111.6 in 2001. Sub-Saharan Africa's average ranking is consistently last but stable from 117 in 1995 to 126.3 in 2001, although its best-performers of Mauritius and South Africa generally rank between 50-65. 'Others' is a varied category. These trends are again apparent from the connectivity index rankings (see also analysis of regional groupings in connectivity in the Digital Divide Section): Table 6: Analysis of the Connectivity Index by Regional Grouping
Connectivity
Index
2001 2000 1999 1998 1995
1. OECD: Best Worst
Average
U.S. 1 Mexico 74
22
U.S. 1 Mexico 88
25.4
U.S. 1 Mexico 93
26.6
Finland 1 Mexico 97
27
Finland 1 Mexico 95
29
2. EE/CIS: Best Worst
Average
Slovenia 25 Kyrgyz Rep. 175
90
Slovenia 28 Tajikistan 153
96.9
Slovenia 31 Tajikistan 152
99
Slovenia 36 Albania 152
95.7
Slovenia 40 Albania 158
92
3. LAC: Best Worst
Average
Bahamas 49 Nicaragua 147
86.4
Barbados 59 Nicaragua 147
93.9
Barbados 57 Nicaragua 145
95
Barbados 55 Nicaragua 144
97
Barbados 51 Nicaragua 142
100
4. Arab: Best Worst
Average
UAE 30 Sudan 164
103
UAE 35 Sudan 169
107.4
UAE 39 Sudan 172
109
Qatar 51 Sudan 178
108
Kuwait 44 Sudan 187
108
5. E.Asia: Best Worst
Average
Hong Kong 12 Myanmar 188
106
Singapore 11 Myanmar 192
111.4
Hong Kong 12 Myanmar 184
114
Hong Kong 11 Myanmar 186
115
Hong Kong 13 Myanmar 180
113
6. S. Asia: Best Worst
Average
Iran 97 Bangladesh 184
148.3
Iran 104 Bangladesh 190
153.6
Iran 101 Bangladesh 185
150
Iran 99 Bangladesh 189
150
Iran 101 Bangladesh 191
151
7.SSA: Best Worst
Average
Mauritius 57 Somalia 195
156.7
Mauritius 69 Congo, DR 200
162
Mauritius 75 Guinea-Bissau 201
166
Mauritius 70 Chad 201
166
Mauritius 79 Chad 201
167
8. Others: Best Worst
Average
Bermuda 11 Afghanistan 194
90.4
Bermuda 5 Afghanistan 199
83
Bermuda 5 Afghanistan 197
78.7
Bermuda 7 Afghanistan 200
79
Bermuda 5 Afghanistan 198
77.8
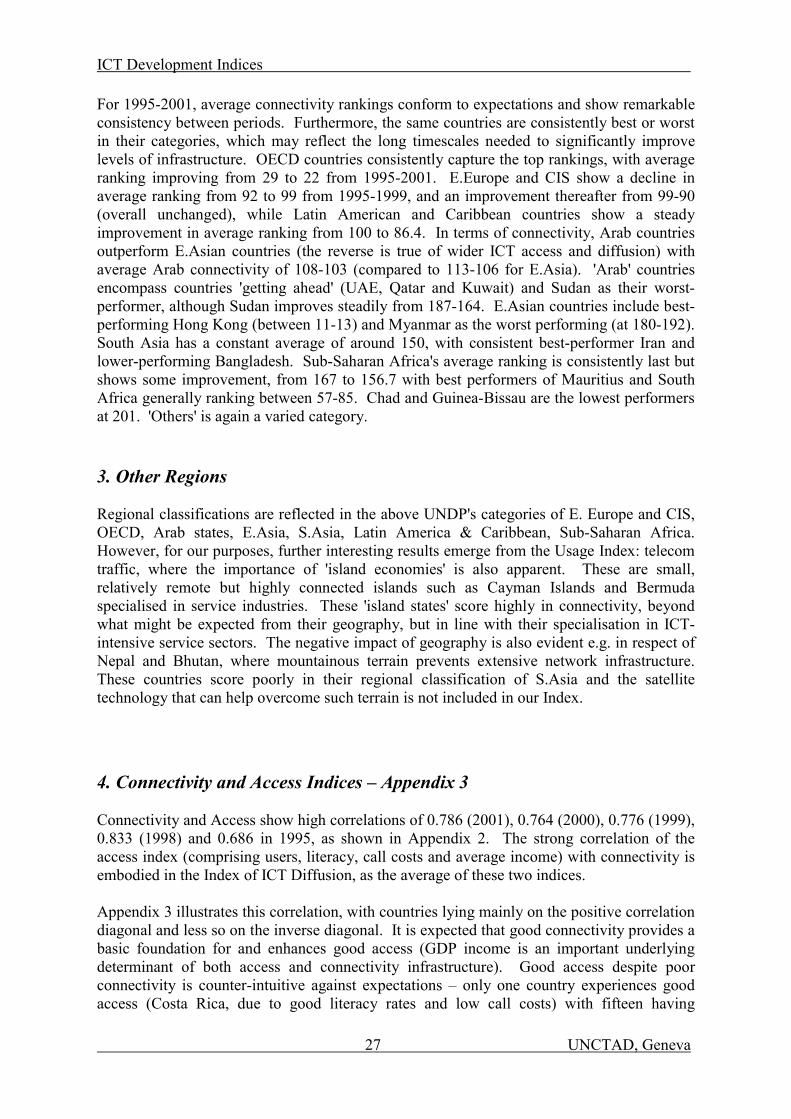
ICT Development Indices
27 UNCTAD, Geneva
For 1995-2001, average connectivity rankings conform to expectations and show remarkable consistency between periods. Furthermore, the same countries are consistently best or worst in their categories, which may reflect the long timescales needed to significantly improve levels of infrastructure. OECD countries consistently capture the top rankings, with average ranking improving from 29 to 22 from 1995-2001. E.Europe and CIS show a decline in average ranking from 92 to 99 from 1995-1999, and an improvement thereafter from 99-90 (overall unchanged), while Latin American and Caribbean countries show a steady improvement in average ranking from 100 to 86.4. In terms of connectivity, Arab countries outperform E.Asian countries (the reverse is true of wider ICT access and diffusion) with average Arab connectivity of 108-103 (compared to 113-106 for E.Asia). 'Arab' countries encompass countries 'getting ahead' (UAE, Qatar and Kuwait) and Sudan as their worst-performer, although Sudan improves steadily from 187-164. E.Asian countries include best-performing Hong Kong (between 11-13) and Myanmar as the worst performing (at 180-192). South Asia has a constant average of around 150, with consistent best-performer Iran and lower-performing Bangladesh. Sub-Saharan Africa's average ranking is consistently last but shows some improvement, from 167 to 156.7 with best performers of Mauritius and South Africa generally ranking between 57-85. Chad and Guinea-Bissau are the lowest performers at 201. 'Others' is again a varied category. 3. Other Regions Regional classifications are reflected in the above UNDP's categories of E. Europe and CIS, OECD, Arab states, E.Asia, S.Asia, Latin America & Caribbean, Sub-Saharan Africa. However, for our purposes, further interesting results emerge from the Usage Index: telecom traffic, where the importance of 'island economies' is also apparent. These are small, relatively remote but highly connected islands such as Cayman Islands and Bermuda specialised in service industries. These 'island states' score highly in connectivity, beyond what might be expected from their geography, but in line with their specialisation in ICT-intensive service sectors. The negative impact of geography is also evident e.g. in respect of Nepal and Bhutan, where mountainous terrain prevents extensive network infrastructure. These countries score poorly in their regional classification of S.Asia and the satellite technology that can help overcome such terrain is not included in our Index. 4. Connectivity and Access Indices – Appendix 3 Connectivity and Access show high correlations of 0.786 (2001), 0.764 (2000), 0.776 (1999), 0.833 (1998) and 0.686 in 1995, as shown in Appendix 2. The strong correlation of the access index (comprising users, literacy, call costs and average income) with connectivity is embodied in the Index of ICT Diffusion, as the average of these two indices. Appendix 3 illustrates this correlation, with countries lying mainly on the positive correlation diagonal and less so on the inverse diagonal. It is expected that good connectivity provides a basic foundation for and enhances good access (GDP income is an important underlying determinant of both access and connectivity infrastructure). Good access despite poor connectivity is counter-intuitive against expectations – only one country experiences good access (Costa Rica, due to good literacy rates and low call costs) with fifteen having
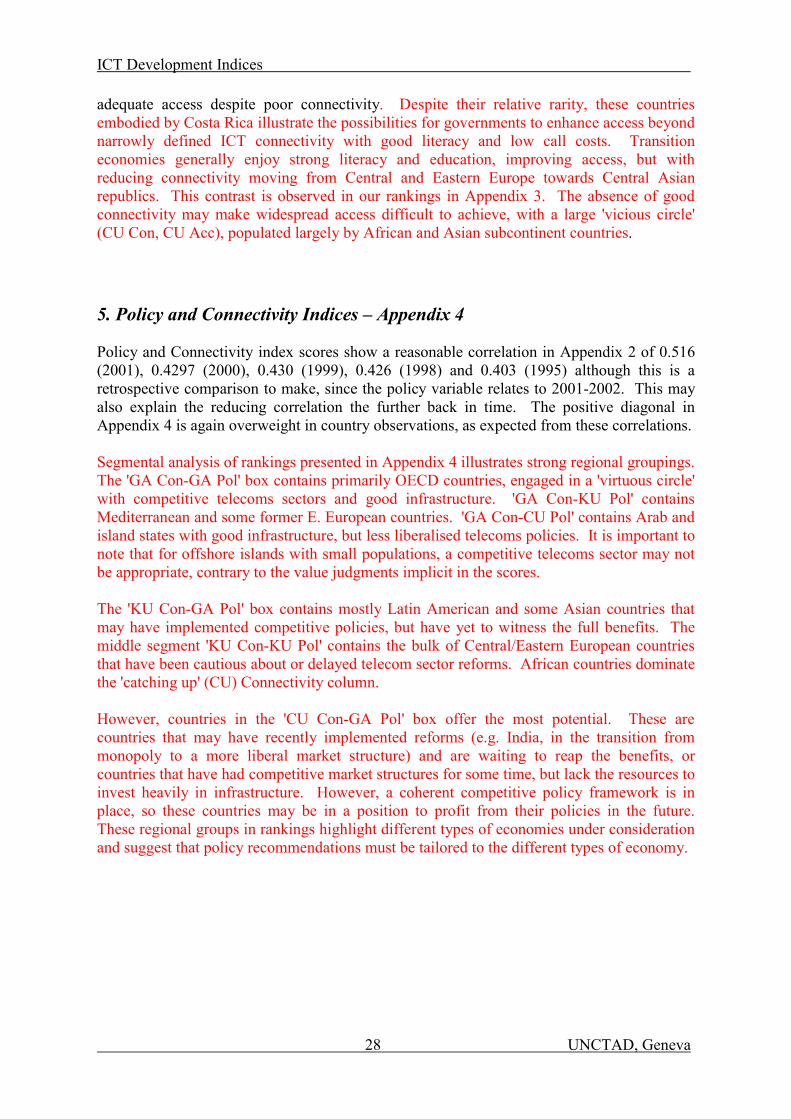
ICT Development Indices
28 UNCTAD, Geneva
adequate access despite poor connectivity. Despite their relative rarity, these countries embodied by Costa Rica illustrate the possibilities for governments to enhance access beyond narrowly defined ICT connectivity with good literacy and low call costs. Transition economies generally enjoy strong literacy and education, improving access, but with reducing connectivity moving from Central and Eastern Europe towards Central Asian republics. This contrast is observed in our rankings in Appendix 3. The absence of good connectivity may make widespread access difficult to achieve, with a large 'vicious circle' (CU Con, CU Acc), populated largely by African and Asian subcontinent countries. 5. Policy and Connectivity Indices – Appendix 4 Policy and Connectivity index scores show a reasonable correlation in Appendix 2 of 0.516 (2001), 0.4297 (2000), 0.430 (1999), 0.426 (1998) and 0.403 (1995) although this is a retrospective comparison to make, since the policy variable relates to 2001-2002. This may also explain the reducing correlation the further back in time. The positive diagonal in Appendix 4 is again overweight in country observations, as expected from these correlations. Segmental analysis of rankings presented in Appendix 4 illustrates strong regional groupings. The 'GA Con-GA Pol' box contains primarily OECD countries, engaged in a 'virtuous circle' with competitive telecoms sectors and good infrastructure. 'GA Con-KU Pol' contains Mediterranean and some former E. European countries. 'GA Con-CU Pol' contains Arab and island states with good infrastructure, but less liberalised telecoms policies. It is important to note that for offshore islands with small populations, a competitive telecoms sector may not be appropriate, contrary to the value judgments implicit in the scores. The 'KU Con-GA Pol' box contains mostly Latin American and some Asian countries that may have implemented competitive policies, but have yet to witness the full benefits. The middle segment 'KU Con-KU Pol' contains the bulk of Central/Eastern European countries that have been cautious about or delayed telecom sector reforms. African countries dominate the 'catching up' (CU) Connectivity column. However, countries in the 'CU Con-GA Pol' box offer the most potential. These are countries that may have recently implemented reforms (e.g. India, in the transition from monopoly to a more liberal market structure) and are waiting to reap the benefits, or countries that have had competitive market structures for some time, but lack the resources to invest heavily in infrastructure. However, a coherent competitive policy framework is in place, so these countries may be in a position to profit from their policies in the future. These regional groups in rankings highlight different types of economies under consideration and suggest that policy recommendations must be tailored to the different types of economy.
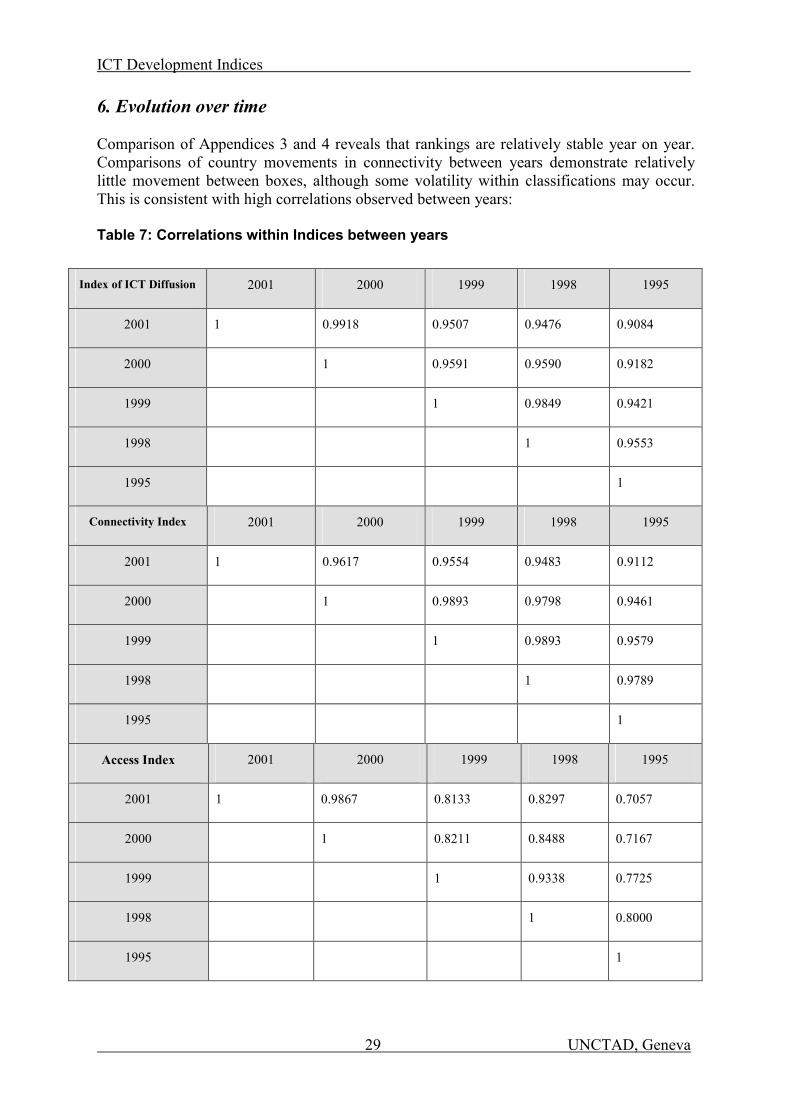
ICT Development Indices
29 UNCTAD, Geneva
6. Evolution over time Comparison of Appendices 3 and 4 reveals that rankings are relatively stable year on year. Comparisons of country movements in connectivity between years demonstrate relatively little movement between boxes, although some volatility within classifications may occur. This is consistent with high correlations observed between years: Table 7: Correlations within Indices between years
Index of ICT Diffusion 2001 2000 1999 1998 1995
2001 1 0.9918 0.9507 0.9476 0.9084
2000 1 0.9591 0.9590 0.9182
1999 1 0.9849 0.9421
1998 1 0.9553
1995 1
Connectivity Index 2001 2000 1999 1998 1995
2001 1 0.9617 0.9554 0.9483 0.9112
2000 1 0.9893 0.9798 0.9461
1999 1 0.9893 0.9579
1998 1 0.9789
1995 1
Access Index 2001 2000 1999 1998 1995
2001 1 0.9867 0.8133 0.8297 0.7057
2000 1 0.8211 0.8488 0.7167
1999 1 0.9338 0.7725
1998 1 0.8000
1995 1
ICT Development Indices
30 UNCTAD, Geneva
These correlations are consistent with UNIDO (2002)'s "considerable stability in Industrial Performance Scoreboard rankings… supporting the argument that capability building is a slow and incremental process". These could thus reflect the long-term nature of investments and prolonged timescales involved in expansion of telephone mainline networks. It also suggests that it may be difficult to break out of a 'vicious circle', but that benefits conferred by establishing a 'virtuous circle' with competitive policies may be long-term. Appendices 3 and 4 provide a segmental analysis of rankings for the year 2001. Only 2001 is presented, but a review of movements from 1995-2001 yields further insights. China moved up the connectivity rankings from CU to KU in 1998, following liberalisation of its telecoms sector to full competition in long-distance and partial competition in its local loop. China also experienced considerable inward investment in this period. India and Pakistan retain CU Connectivity status. "The growth of telecommunications infrastructure in south Asia has not been demand-driven, unlike that of other countries where the infrastructure has been built and services operated by private investors… but almost entirely investment-driven, dependent on priority level… from limited public resources… [In India] connectivity remains low and unevenly distributed" (Indian "Economic and Political Weekly", 1999). However, different policy paths were pursued: "In Pakistan, the private sector dominates; in India the government [was] monopoly service provider [until the end of 1998/early 1999]; in Nepal, high cost of international communications was circumvented by a country-wide Intranet". These different policy paths do not appear to have had a strongly differentiated impact on respective connectivity. (Nb. India subsequently liberalised its telecom sector, accounting for its maximum policy score of 4 in 2001-2). Reforms and subsequent benefits in connectivity are also strongly differentiated in the FUSSR. In keeping with the World Bank and EBRD studies of economies in transition, the sharp contrast between CEE and the Central Asian region is observed in our rankings. For analysis of the evolution of connectivity indicators 1995-2000 which are of particular importance due to their relation to the 'digital divide', please see the next section.
4. THE DIGITAL DIVIDE
In their review of work carried out to assess the digital divide, Bridges.org observes that the digital divide between countries has typically been assessed by counts of hardware and connectivity (such as hosts, PCs, telephones, mobiles). We can analyse the distribution of our data on these variables to investigate their evolution over time, to see whether the "uneven diffusion" of technology (UNDP) is increasing or decreasing over time. Definitions of the 'digital divide' include:
1. absolute measures: the absolute gap between the most advanced country with highest hardware concentrations and the country with the lowest;
2. relative measures: measures of whether the distribution as a whole is growing more or
less convergent with time;
3. categorical measures: whether the group of 'low-income' countries is converging with (relative to) the group of 'high-income' countries.
4. convergence: relative convergence or divergence in rates of growth of hardware,
Rodriguez & Wilson (2000).
ICT Development Indices
31 UNCTAD, Geneva
UNCTAD used the first three of these methods to analyse indicators of hardware connectivity and numbers of Internet users. These are basic indicators of the digital divide, which may be defined with more sophistication as access to and use of ICTs. It may not be the amount of hardware that is most important, but ultimately, the use that is made of this hardware and overall changes in the way the economy works. However, analysis of connectivity as the basic 'limiting factor' to ICT access and of actual numbers of Internet users evaluates bottlenecks and disparity in the first stages of access to ICTs.
1. Absolute Measures In Appendix 5 presenting basic statistics describing the indicator data populations, absolute measures of the digital divide reveals steadily increasing maxima, medians and averages across all populations over the period 1995-2000. These populations indicate rapidly increasing maximum observations as the countries in the lead continue to forge ahead as 'star performers', while in most cases, minimum observations remain at, or close to, zero. (This is explained by these observations describing per capita penetrations. Absolute gains in telecommunications sectors cited by the ITU may thus be negated by gains in populations in some developing countries). It is often this 'absolute perceived gap' that is cited in popular observations about the digital divide - the gap between the most ICT-developed economies and the least ICT- developed appears to be wide, obvious and growing. In terms of relative disparities, the evidence is rather more mixed. The distributions of these indicator populations are highly skewed, as indicated by significant standard deviations (as a percentage of mean) and discrepancies between the median and mean (both measures of central tendency, but the mean is more influenced by outliers). Appendix 5 indicates however that skewness in these distributions of averaged indicator penetrations per capita is decreasing marginally over time. The picture is one of digital leaders forging ahead in their absolute lead; however, newcomers may be catching up in terms of relatively less skewed distributions of hardware across countries, based on average hardware penetrations across countries as the basic unit of analysis. Such average scores are only partially representative, however. These indicators are averages of total hardware equipment divided by total population for each country. They do not take account of the relative proportion of the world's population living in each country. The Gini measure of inequality weights the distribution of hardware equipment or Internet users by the relative proportion of the world's population for each country to produce a relative weighted measure of inequality. 2. Gini Coefficients Preliminary analysis of Gini coefficients of inequality in levels of hardware equipment across nations reveals that levels of inequality in the distribution of hardware equipment are very high at 0.7-0.9, approximately twice the average level of income inequality observed for countries (between 0.3 - 0.4). Inequality in the distribution of technology across countries is undoubtedly high and substantial. Gini coefficients further reflect the relative age of the technologies, with greater inequality observed for more recently introduced technologies, such as Internet hosts (around 0.91) and Internet users (between 0.87 and 0.73). Internet
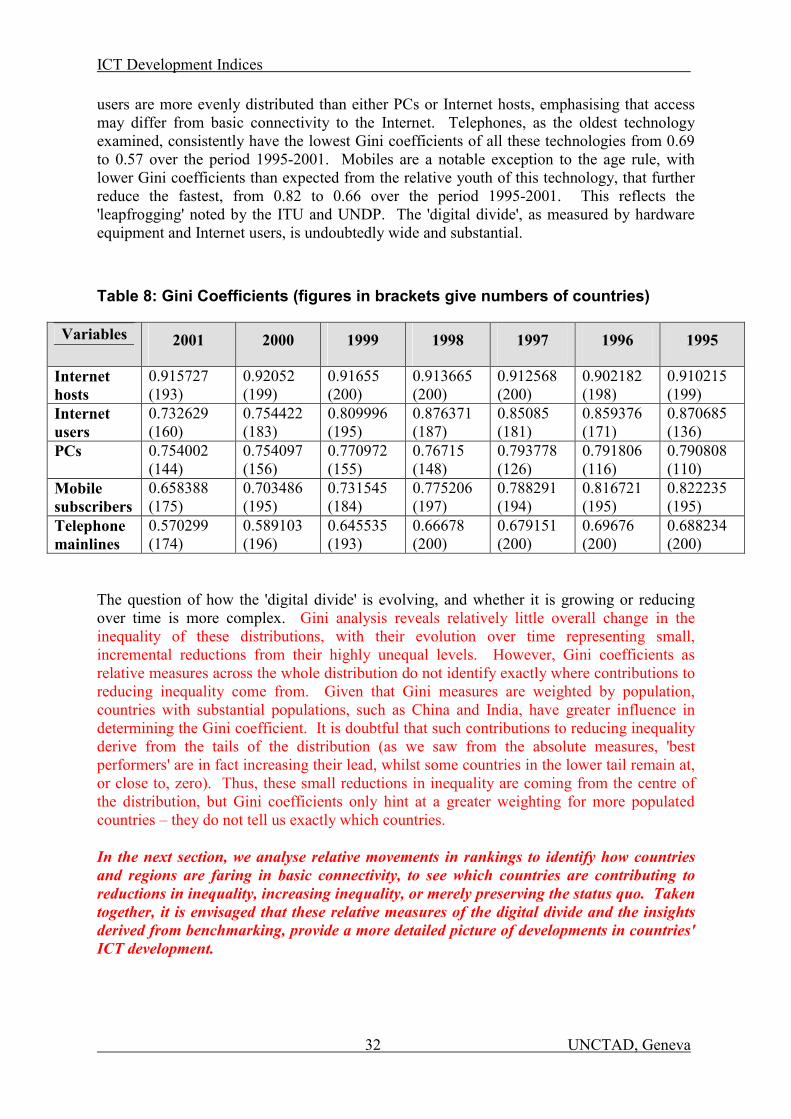
ICT Development Indices
32 UNCTAD, Geneva
users are more evenly distributed than either PCs or Internet hosts, emphasising that access may differ from basic connectivity to the Internet. Telephones, as the oldest technology examined, consistently have the lowest Gini coefficients of all these technologies from 0.69 to 0.57 over the period 1995-2001. Mobiles are a notable exception to the age rule, with lower Gini coefficients than expected from the relative youth of this technology, that further reduce the fastest, from 0.82 to 0.66 over the period 1995-2001. This reflects the 'leapfrogging' noted by the ITU and UNDP. The 'digital divide', as measured by hardware equipment and Internet users, is undoubtedly wide and substantial. Table 8: Gini Coefficients (figures in brackets give numbers of countries)
Variables 2001 2000 1999 1998 1997 1996 1995
Internet hosts
0.915727 (193)
0.92052 (199)
0.91655 (200)
0.913665 (200)
0.912568 (200)
0.902182 (198)
0.910215 (199)
Internet users
0.732629 (160)
0.754422 (183)
0.809996 (195)
0.876371 (187)
0.85085 (181)
0.859376 (171)
0.870685 (136)
PCs 0.754002 (144)
0.754097 (156)
0.770972 (155)
0.76715 (148)
0.793778 (126)
0.791806 (116)
0.790808 (110)
Mobile subscribers
0.658388 (175)
0.703486 (195)
0.731545 (184)
0.775206 (197)
0.788291 (194)
0.816721 (195)
0.822235 (195)
Telephone mainlines
0.570299 (174)
0.589103 (196)
0.645535 (193)
0.66678 (200)
0.679151 (200)
0.69676 (200)
0.688234 (200)
The question of how the 'digital divide' is evolving, and whether it is growing or reducing over time is more complex. Gini analysis reveals relatively little overall change in the inequality of these distributions, with their evolution over time representing small, incremental reductions from their highly unequal levels. However, Gini coefficients as relative measures across the whole distribution do not identify exactly where contributions to reducing inequality come from. Given that Gini measures are weighted by population, countries with substantial populations, such as China and India, have greater influence in determining the Gini coefficient. It is doubtful that such contributions to reducing inequality derive from the tails of the distribution (as we saw from the absolute measures, 'best performers' are in fact increasing their lead, whilst some countries in the lower tail remain at, or close to, zero). Thus, these small reductions in inequality are coming from the centre of the distribution, but Gini coefficients only hint at a greater weighting for more populated countries – they do not tell us exactly which countries. In the next section, we analyse relative movements in rankings to identify how countries and regions are faring in basic connectivity, to see which countries are contributing to reductions in inequality, increasing inequality, or merely preserving the status quo. Taken together, it is envisaged that these relative measures of the digital divide and the insights derived from benchmarking, provide a more detailed picture of developments in countries' ICT development.
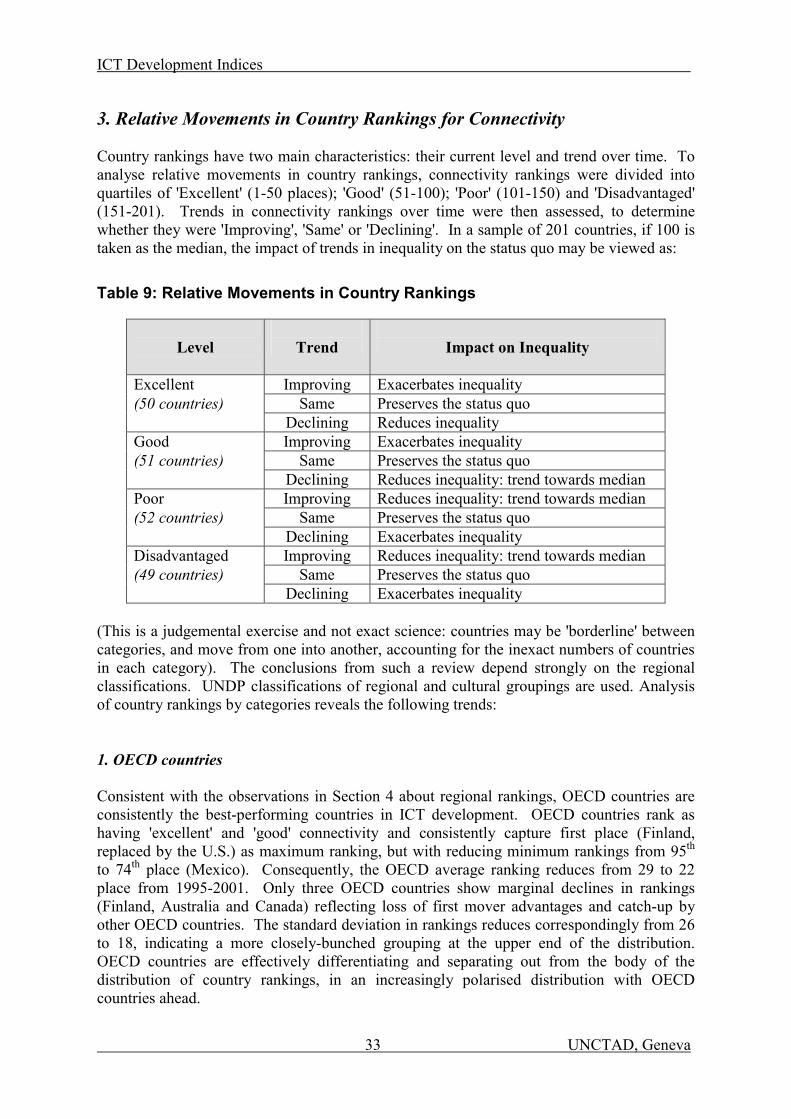
ICT Development Indices
33 UNCTAD, Geneva
3. Relative Movements in Country Rankings for Connectivity Country rankings have two main characteristics: their current level and trend over time. To analyse relative movements in country rankings, connectivity rankings were divided into quartiles of 'Excellent' (1-50 places); 'Good' (51-100); 'Poor' (101-150) and 'Disadvantaged' (151-201). Trends in connectivity rankings over time were then assessed, to determine whether they were 'Improving', 'Same' or 'Declining'. In a sample of 201 countries, if 100 is taken as the median, the impact of trends in inequality on the status quo may be viewed as:
Table 9: Relative Movements in Country Rankings
Level
Trend
Impact on Inequality
Excellent Improving Exacerbates inequality (50 countries) Same Preserves the status quo Declining Reduces inequality Good Improving Exacerbates inequality (51 countries) Same Preserves the status quo Declining Reduces inequality: trend towards median Poor Improving Reduces inequality: trend towards median (52 countries) Same Preserves the status quo Declining Exacerbates inequality Disadvantaged Improving Reduces inequality: trend towards median (49 countries) Same Preserves the status quo Declining Exacerbates inequality
(This is a judgemental exercise and not exact science: countries may be 'borderline' between categories, and move from one into another, accounting for the inexact numbers of countries in each category). The conclusions from such a review depend strongly on the regional classifications. UNDP classifications of regional and cultural groupings are used. Analysis of country rankings by categories reveals the following trends: 1. OECD countries Consistent with the observations in Section 4 about regional rankings, OECD countries are consistently the best-performing countries in ICT development. OECD countries rank as having 'excellent' and 'good' connectivity and consistently capture first place (Finland, replaced by the U.S.) as maximum ranking, but with reducing minimum rankings from 95th to 74th place (Mexico). Consequently, the OECD average ranking reduces from 29 to 22 place from 1995-2001. Only three OECD countries show marginal declines in rankings (Finland, Australia and Canada) reflecting loss of first mover advantages and catch-up by other OECD countries. The standard deviation in rankings reduces correspondingly from 26 to 18, indicating a more closely-bunched grouping at the upper end of the distribution. OECD countries are effectively differentiating and separating out from the body of the distribution of country rankings, in an increasingly polarised distribution with OECD countries ahead.
ICT Development Indices
34 UNCTAD, Geneva
2. EE and CIS Eastern European and the Commonwealth of Independent States demonstrate polarisation within their region. Maximum ranking is improving (Slovenia rockets up the rankings, from 40th place to 25th place from 1995 to 2001). However, minimum rankings slip from 158th place in 1995 (Albania) to 175th place in 2001 (the Kyrgyz Republic). This leaves overall average ranking unchanged, between 92-90 place, but leads to a steady increase in EE and CIS standard deviation in rankings, from 18 to 40. The EE and CIS region demonstrates increasing variation and polarisation, around approximately the same mean. (It is worth noting that variation would be further increased if Poland, Hungary and the Czech Republic were to be included in the CEE region, rather than under the OECD). 3. Latin America and Caribbean Latin American and Caribbean countries show a steady improvement in average ranking from 100 to 86.4. Barbados and Bahamas have rankings around 51-49th place from 1995-2001. The minimum ranking (Nicaragua) declines from 142 to 147th place from 1995-2001. The average ranking improves slightly from 99 to 86, while standard deviation remains the same at 25. Overall, Latin America retains a stable distribution around a slowly improving average. 4. Arab Countries 'Arab' countries encompass best-performing Qatar, Kuwait and the United Arab Emirates (UAE) whose rankings improve from 44 to 30th place, and Sudan with the lowest ICT development, although Sudan improves steadily from 187-164th place from 1995-2001. This does not impact the average ranking and standard deviation, which remain unchanged at around 108 and 41 respectively. Overall, the contribution of Arab countries is therefore to maintain the status quo, with no major contributions to reducing inequality. 5. East Asia E.Asian countries include best-performing Hong Kong and Singapore (between 11-13) and Myanmar as the worst performing, declining from 180 to 192 from 1995-2001. This leaves the overall average unchanged at 113-111 between 1995-2001, although there is some improvement to 106 in 2001, while the standard deviation hovers around 55. From the group regional perspective, there are no major developments. However, the most remarkable individual success story in East Asia is China, which rockets up the rankings in connectivity from 136th place in 1995 to 93rd in 2001. Given that China is host to one fifth of the world's population, China's steady rise in relative ranking is likely contribute substantially to the reduction in inequality showed by the Gini coefficients.
ICT Development Indices
35 UNCTAD, Geneva
6. South Asia South Asia demonstrates no real change overall and essentially preserves the status quo. The best maximum ranking varies between 101 and 97 (Iran) from 1995 to 2001, and the lowest between 191 and 194 (Bangladesh). This leaves overall average ranking preserved at 151-148, while standard deviation remains the same around 30. India, the most populous country with one sixth of the world's population, shows a slight improvement in ranking from 158 to 151 between 1995-2001. This may reinforce the reductions in Gini coefficient, representing a small reduction in inequality, but it seems likely that overall, the South Asian region does not contribute towards any major changes in overall inequality. 7. Sub-Saharan Africa Africa demonstrates a wide variation in performance, between best-performing Mauritius, which improves from 79th place to 57th place from 1995-2001, and the bulk of Sub-Saharan African countries at the lower end of the distribution, including Chad, Guinea-Bissau, Congo and Somalia which occupy last place. The overall average ranking shows a small improvement in rankings, from 167 to 157, while standard deviation in rankings increases to reflect the growing variation from 28 to 32. Overall, there is thus an increasing deviation about a minimally improving average. However, African countries remain clustered towards the bottom of the distribution, so the overall contribution of Sub-Saharan Africa is to maintain the status quo, with no major contributions to reducing inequality.
6. CONCLUSIONS & WAY FORWARD
There are different aspects to 'multi-faceted' technology clusters, and ICTs may be defined and measured from several perspectives. Measurement across multiple aspects is necessary, to give rounded country profiles across the spectrum of ICT capabilities. Based on a review of previous work, we chose the aspects of connectivity, access, usage and policy as key components in the measurement of ICT development across countries. We measured technological profiles using a disaggregated index of ICT Diffusion, with component indices for connectivity, access and policy in the ICT Development Indices. There is a trade-off of 'breadth versus depth' of indicators in such a cross-country analysis of as many countries as possible. It is difficult to achieve depth and complexity in indicators using standardised, cross-country indicators for broad comparability across many countries. The qualitative policy index contains an implicit value judgment in favour of competition in the telecoms sector, which does not allow for 'benign monopolies' or small economies where economies of scale may be appropriate. The policy index is, however, correlated with connectivity, which implies beneficial effects to telecoms liberalisation in terms of improved connectivity. These different aspects are related, with strong positive correlations observed between connectivity and access and, to a lesser extent, competitive telecoms policy and connectivity.
ICT Development Indices
36 UNCTAD, Geneva
This suggests that we are measuring central measures of 'technological development', although causation cannot be addressed with benchmarking indices – for example, we may be implicitly measuring proxy variables of income and/or development. Benchmarking provides useful information and meaningful analysis for policy purposes. Our cross-country analysis allows comparison between countries and monitoring of progress over time. It further allows straightforward identification based on evidence of 'success stories' for closer investigation for policy conclusions. Approached with thought, benchmarking is a useful input to policy analysis in allowing more informed and insightful study into policy and ultimately, in promoting better, faster and more effective ICT development. Classification of countries as 'catching up', 'keeping up' and 'getting ahead' on the basis of rankings in the ICT Development Indices show consistent rankings over time, with high correlations and stable rankings (illustrative of these high correlations) between periods. This may reflect the long-term nature of infrastructure investments and policy reforms. Strong regional influences are apparent. As a broad generalisation, African and South Asian countries are classified as 'catching up', Latin American and transition economies as 'keeping up', and OECD countries and some South East Asian Tigers as 'getting ahead'. However, this masks considerable diversity with individual success stories such as Costa Rica and China, and the notable successes achieved in connectivity by Arab and 'island states', despite less competitive telecom policies. For island states, this may arise however, from their geographical situation and specialisation in service industries. Trends in connectivity over time suggest stable country rankings from 1995 to 2001 and potential convergence in distributions of hardware, yielding the intriguing result of a diminishing digital divide, as defined narrowly by hardware measures. A review of the the digital divide and its evolution, as defined by hardware measures, has been carried out in terms of both absolute measures, Gini coefficients and an analysis of movements in country rankings. Taken together, this review suggests small, incremental reductions in inequality in the distributions of hardware and Internet users across countries, yielding the intriguing result of a diminishing digital divide. Our results show that more recent technologies such as the Internet are more unevenly distributed relative to older technologies, such as fixed line telephony. Our findings also demonstrate 'leapfrogging' in mobile telephony (with lower levels of inequality, which reduce the fastest), suggesting greater potential for mobiles as more equally distributed technologies in bridging the digital divide. Using a regional analysis of relative rankings, we reviewed levels of and trends in connectivity for different regions. Our results show that the 'tails' of the distributions are becoming more polarised, with OECD countries differentiating out from the body of the distribution of countries, and becoming increasingly more tightly bunched at the head of the distribution. Conversely, Sub-Saharan African remain grouped in the lower end of the distribution. These incremental reductions in Gini coefficients derive from the middle of the distribution, and China in particular, which accounts for a fifth of the world's population and shows a steady and substantial rise up the rankings. It would be interesting to compare our indices and the changes in rankings therein with other indices (e.g. UNIDO's Infrastructure Index, McConnell International's and EIU's connectivity rankings). In future work, the challenging question of causation could be addressed to forge a link between the trends in outcomes observed and underlying policy by using more sophisticated statistical techniques. Regression work should include consideration of economies' sectoral composition, as reflected in the technological structure of exports and FDI as important determinants of and influences on countries' uptake and absorption of ICTs.
ICT Development Indices
37 UNCTAD, Geneva
7. APPENDICES
The following appendices are presented:
1. Appendix 1 – ICT Development Indices for 2001, 2000 and 1999 (by country and by ranking);
2. Appendix 2 – Correlations of component indices; 3. Appendix 3 – Comparison of Connectivity/Access Indices for 2001; 4. Appendix 4 – Comparison of Connectivity/Policy Indices for 2001;
5. Appendix 5 – Digital Divide work; 6. Appendix 6 – Connectivity Index (2001, 2000 and 1999).
Appendix 1 presents ICT Development Indices and the Index of ICT Diffusion calculated as discussed above, in the section on Index Methodology for 2001, 2000 and 1999. Appendix 2 presents correlation tables for the three main component indices (Connectivity, Access and Policy Indices) calculated using the correlation function in Excel for the four years 1995, 1998, 1999, 2000 and 2001. Appendices 3 and 4 compare Connectivity/Access Indices and Connectivity/Policy Indices for 2001 by categorising them as 'catching up' (CU), 'keeping up' (KU) and 'getting ahead' (GA). For connectivity, countries were divided into thirds, with the first third (1-67) classified as GA, second third (68-124) classified as KU and the last third (125-201) as CU. For access, countries were also divided into thirds, with the first third (1-53) classified as GA, second third (54-106) classified as KU and the last third (107-156) as CU. For policy, thirds closely corresponded to scores, so first third includes policy scores in excess of 0.5, the second third 0.5>/ x >0 and last third scores of zero. This allows the segmental classification and analysis of Connectivity with Access Index and Connectivity with Policy Index. Appendix 5 presents exploratory data analysis for base data populations of Internet hosts, PCs, telephones and mobiles to present a preliminary analysis of the digital divide. Appendix 6 provides a separate listing of the Connectivity Index, for 2001, 2000 and 1999.
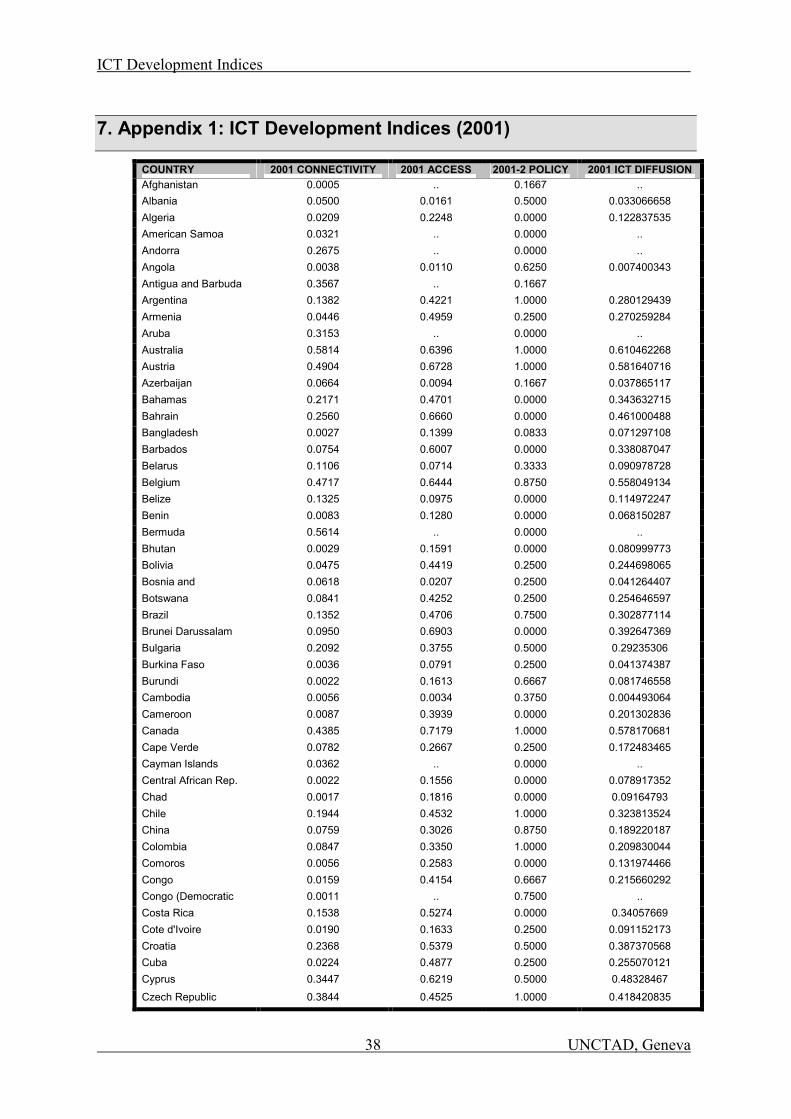
ICT Development Indices
38 UNCTAD, Geneva
7. Appendix 1: ICT Development Indices (2001)
COUNTRY 2001 CONNECTIVITY 2001 ACCESS 2001-2 POLICY 2001 ICT DIFFUSION Afghanistan 0.0005 .. 0.1667 .. Albania 0.0500 0.0161 0.5000 0.033066658 Algeria 0.0209 0.2248 0.0000 0.122837535 American Samoa 0.0321 .. 0.0000 .. Andorra 0.2675 .. 0.0000 .. Angola 0.0038 0.0110 0.6250 0.007400343 Antigua and Barbuda 0.3567 .. 0.1667 Argentina 0.1382 0.4221 1.0000 0.280129439 Armenia 0.0446 0.4959 0.2500 0.270259284 Aruba 0.3153 .. 0.0000 .. Australia 0.5814 0.6396 1.0000 0.610462268 Austria 0.4904 0.6728 1.0000 0.581640716 Azerbaijan 0.0664 0.0094 0.1667 0.037865117 Bahamas 0.2171 0.4701 0.0000 0.343632715 Bahrain 0.2560 0.6660 0.0000 0.461000488 Bangladesh 0.0027 0.1399 0.0833 0.071297108 Barbados 0.0754 0.6007 0.0000 0.338087047 Belarus 0.1106 0.0714 0.3333 0.090978728 Belgium 0.4717 0.6444 0.8750 0.558049134 Belize 0.1325 0.0975 0.0000 0.114972247 Benin 0.0083 0.1280 0.0000 0.068150287 Bermuda 0.5614 .. 0.0000 .. Bhutan 0.0029 0.1591 0.0000 0.080999773 Bolivia 0.0475 0.4419 0.2500 0.244698065 Bosnia and 0.0618 0.0207 0.2500 0.041264407 Botswana 0.0841 0.4252 0.2500 0.254646597 Brazil 0.1352 0.4706 0.7500 0.302877114 Brunei Darussalam 0.0950 0.6903 0.0000 0.392647369 Bulgaria 0.2092 0.3755 0.5000 0.29235306 Burkina Faso 0.0036 0.0791 0.2500 0.041374387 Burundi 0.0022 0.1613 0.6667 0.081746558 Cambodia 0.0056 0.0034 0.3750 0.004493064 Cameroon 0.0087 0.3939 0.0000 0.201302836 Canada 0.4385 0.7179 1.0000 0.578170681 Cape Verde 0.0782 0.2667 0.2500 0.172483465 Cayman Islands 0.0362 .. 0.0000 .. Central African Rep. 0.0022 0.1556 0.0000 0.078917352 Chad 0.0017 0.1816 0.0000 0.09164793 Chile 0.1944 0.4532 1.0000 0.323813524 China 0.0759 0.3026 0.8750 0.189220187 Colombia 0.0847 0.3350 1.0000 0.209830044 Comoros 0.0056 0.2583 0.0000 0.131974466 Congo 0.0159 0.4154 0.6667 0.215660292 Congo (Democratic 0.0011 .. 0.7500 .. Costa Rica 0.1538 0.5274 0.0000 0.34057669 Cote d'Ivoire 0.0190 0.1633 0.2500 0.091152173 Croatia 0.2368 0.5379 0.5000 0.387370568 Cuba 0.0224 0.4877 0.2500 0.255070121 Cyprus 0.3447 0.6219 0.5000 0.48328467 Czech Republic 0.3844 0.4525 1.0000 0.418420835
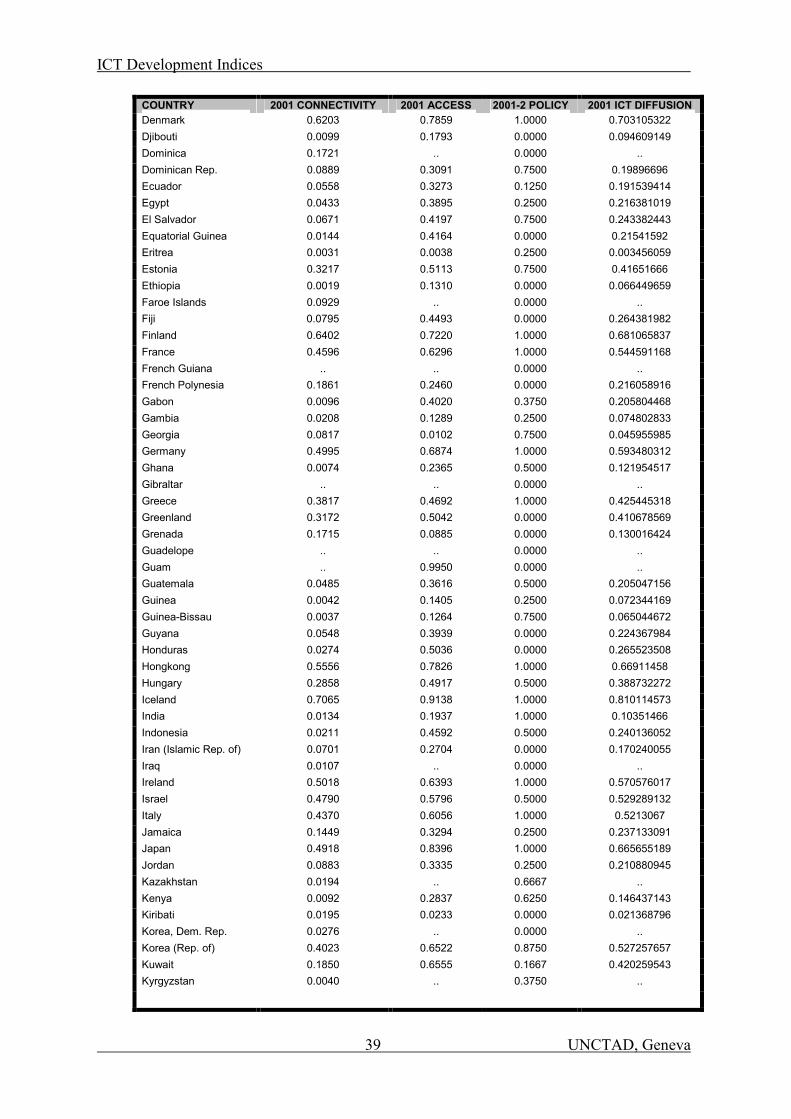
ICT Development Indices
39 UNCTAD, Geneva
COUNTRY 2001 CONNECTIVITY 2001 ACCESS 2001-2 POLICY 2001 ICT DIFFUSION Denmark 0.6203 0.7859 1.0000 0.703105322 Djibouti 0.0099 0.1793 0.0000 0.094609149 Dominica 0.1721 .. 0.0000 .. Dominican Rep. 0.0889 0.3091 0.7500 0.19896696 Ecuador 0.0558 0.3273 0.1250 0.191539414 Egypt 0.0433 0.3895 0.2500 0.216381019 El Salvador 0.0671 0.4197 0.7500 0.243382443 Equatorial Guinea 0.0144 0.4164 0.0000 0.21541592 Eritrea 0.0031 0.0038 0.2500 0.003456059 Estonia 0.3217 0.5113 0.7500 0.41651666 Ethiopia 0.0019 0.1310 0.0000 0.066449659 Faroe Islands 0.0929 .. 0.0000 .. Fiji 0.0795 0.4493 0.0000 0.264381982 Finland 0.6402 0.7220 1.0000 0.681065837 France 0.4596 0.6296 1.0000 0.544591168 French Guiana .. .. 0.0000 .. French Polynesia 0.1861 0.2460 0.0000 0.216058916 Gabon 0.0096 0.4020 0.3750 0.205804468 Gambia 0.0208 0.1289 0.2500 0.074802833 Georgia 0.0817 0.0102 0.7500 0.045955985 Germany 0.4995 0.6874 1.0000 0.593480312 Ghana 0.0074 0.2365 0.5000 0.121954517 Gibraltar .. .. 0.0000 .. Greece 0.3817 0.4692 1.0000 0.425445318 Greenland 0.3172 0.5042 0.0000 0.410678569 Grenada 0.1715 0.0885 0.0000 0.130016424 Guadelope .. .. 0.0000 .. Guam .. 0.9950 0.0000 .. Guatemala 0.0485 0.3616 0.5000 0.205047156 Guinea 0.0042 0.1405 0.2500 0.072344169 Guinea-Bissau 0.0037 0.1264 0.7500 0.065044672 Guyana 0.0548 0.3939 0.0000 0.224367984 Honduras 0.0274 0.5036 0.0000 0.265523508 Hongkong 0.5556 0.7826 1.0000 0.66911458 Hungary 0.2858 0.4917 0.5000 0.388732272 Iceland 0.7065 0.9138 1.0000 0.810114573 India 0.0134 0.1937 1.0000 0.10351466 Indonesia 0.0211 0.4592 0.5000 0.240136052 Iran (Islamic Rep. of) 0.0701 0.2704 0.0000 0.170240055 Iraq 0.0107 .. 0.0000 .. Ireland 0.5018 0.6393 1.0000 0.570576017 Israel 0.4790 0.5796 0.5000 0.529289132 Italy 0.4370 0.6056 1.0000 0.5213067 Jamaica 0.1449 0.3294 0.2500 0.237133091 Japan 0.4918 0.8396 1.0000 0.665655189 Jordan 0.0883 0.3335 0.2500 0.210880945 Kazakhstan 0.0194 .. 0.6667 .. Kenya 0.0092 0.2837 0.6250 0.146437143 Kiribati 0.0195 0.0233 0.0000 0.021368796 Korea, Dem. Rep. 0.0276 .. 0.0000 .. Korea (Rep. of) 0.4023 0.6522 0.8750 0.527257657 Kuwait 0.1850 0.6555 0.1667 0.420259543 Kyrgyzstan 0.0040 .. 0.3750 ..
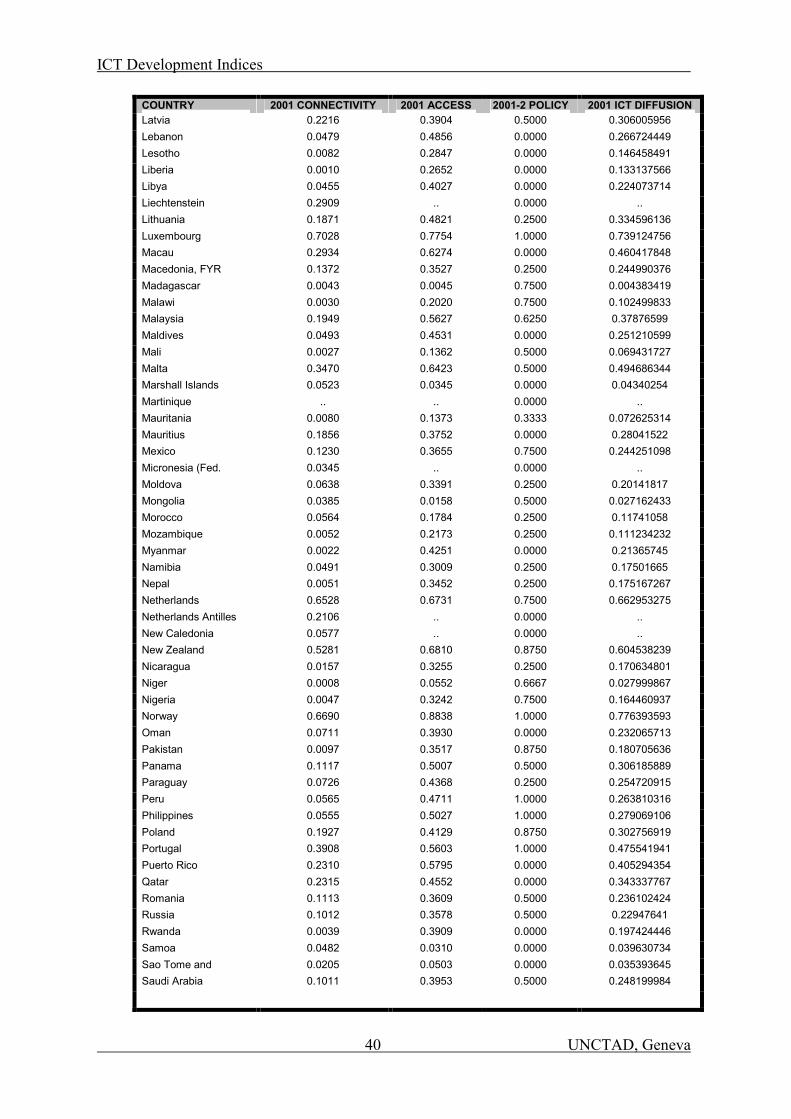
ICT Development Indices
40 UNCTAD, Geneva
COUNTRY 2001 CONNECTIVITY 2001 ACCESS 2001-2 POLICY 2001 ICT DIFFUSION Latvia 0.2216 0.3904 0.5000 0.306005956 Lebanon 0.0479 0.4856 0.0000 0.266724449 Lesotho 0.0082 0.2847 0.0000 0.146458491 Liberia 0.0010 0.2652 0.0000 0.133137566 Libya 0.0455 0.4027 0.0000 0.224073714 Liechtenstein 0.2909 .. 0.0000 .. Lithuania 0.1871 0.4821 0.2500 0.334596136 Luxembourg 0.7028 0.7754 1.0000 0.739124756 Macau 0.2934 0.6274 0.0000 0.460417848 Macedonia, FYR 0.1372 0.3527 0.2500 0.244990376 Madagascar 0.0043 0.0045 0.7500 0.004383419 Malawi 0.0030 0.2020 0.7500 0.102499833 Malaysia 0.1949 0.5627 0.6250 0.37876599 Maldives 0.0493 0.4531 0.0000 0.251210599 Mali 0.0027 0.1362 0.5000 0.069431727 Malta 0.3470 0.6423 0.5000 0.494686344 Marshall Islands 0.0523 0.0345 0.0000 0.04340254 Martinique .. .. 0.0000 .. Mauritania 0.0080 0.1373 0.3333 0.072625314 Mauritius 0.1856 0.3752 0.0000 0.28041522 Mexico 0.1230 0.3655 0.7500 0.244251098 Micronesia (Fed. 0.0345 .. 0.0000 .. Moldova 0.0638 0.3391 0.2500 0.20141817 Mongolia 0.0385 0.0158 0.5000 0.027162433 Morocco 0.0564 0.1784 0.2500 0.11741058 Mozambique 0.0052 0.2173 0.2500 0.111234232 Myanmar 0.0022 0.4251 0.0000 0.21365745 Namibia 0.0491 0.3009 0.2500 0.17501665 Nepal 0.0051 0.3452 0.2500 0.175167267 Netherlands 0.6528 0.6731 0.7500 0.662953275 Netherlands Antilles 0.2106 .. 0.0000 .. New Caledonia 0.0577 .. 0.0000 .. New Zealand 0.5281 0.6810 0.8750 0.604538239 Nicaragua 0.0157 0.3255 0.2500 0.170634801 Niger 0.0008 0.0552 0.6667 0.027999867 Nigeria 0.0047 0.3242 0.7500 0.164460937 Norway 0.6690 0.8838 1.0000 0.776393593 Oman 0.0711 0.3930 0.0000 0.232065713 Pakistan 0.0097 0.3517 0.8750 0.180705636 Panama 0.1117 0.5007 0.5000 0.306185889 Paraguay 0.0726 0.4368 0.2500 0.254720915 Peru 0.0565 0.4711 1.0000 0.263810316 Philippines 0.0555 0.5027 1.0000 0.279069106 Poland 0.1927 0.4129 0.8750 0.302756919 Portugal 0.3908 0.5603 1.0000 0.475541941 Puerto Rico 0.2310 0.5795 0.0000 0.405294354 Qatar 0.2315 0.4552 0.0000 0.343337767 Romania 0.1113 0.3609 0.5000 0.236102424 Russia 0.1012 0.3578 0.5000 0.22947641 Rwanda 0.0039 0.3909 0.0000 0.197424446 Samoa 0.0482 0.0310 0.0000 0.039630734 Sao Tome and 0.0205 0.0503 0.0000 0.035393645 Saudi Arabia 0.1011 0.3953 0.5000 0.248199984
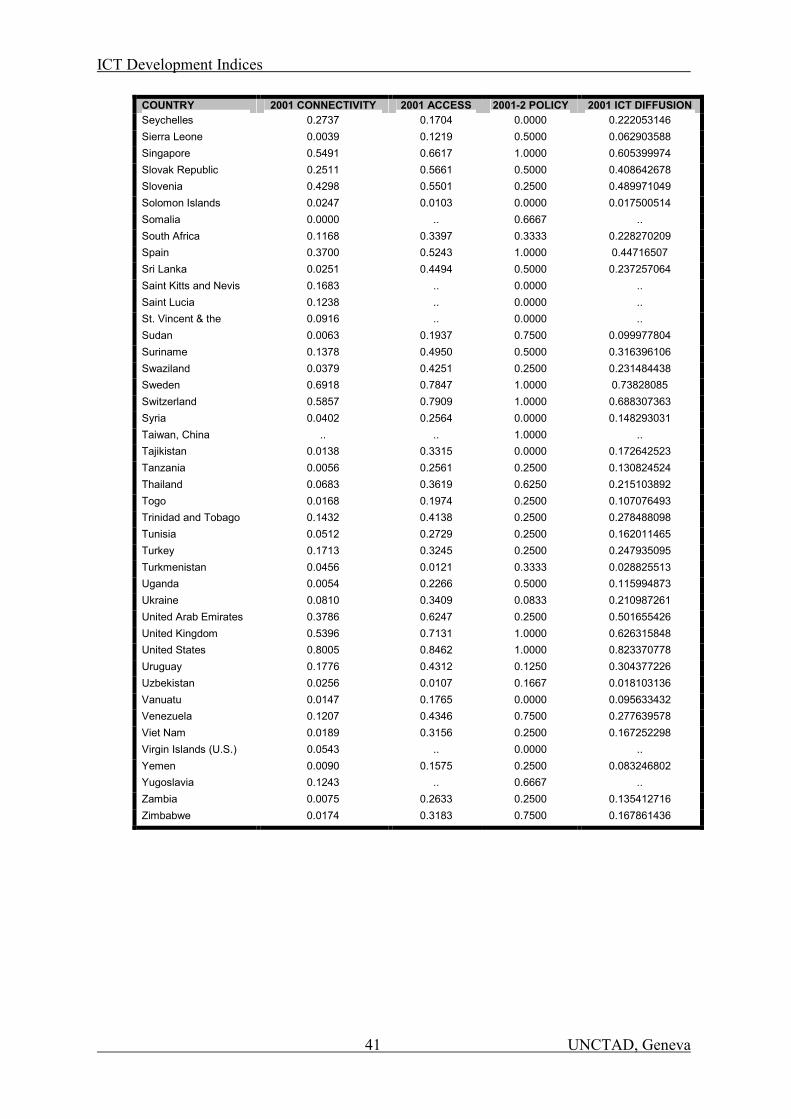
ICT Development Indices
41 UNCTAD, Geneva
COUNTRY 2001 CONNECTIVITY 2001 ACCESS 2001-2 POLICY 2001 ICT DIFFUSION Seychelles 0.2737 0.1704 0.0000 0.222053146 Sierra Leone 0.0039 0.1219 0.5000 0.062903588 Singapore 0.5491 0.6617 1.0000 0.605399974 Slovak Republic 0.2511 0.5661 0.5000 0.408642678 Slovenia 0.4298 0.5501 0.2500 0.489971049 Solomon Islands 0.0247 0.0103 0.0000 0.017500514 Somalia 0.0000 .. 0.6667 .. South Africa 0.1168 0.3397 0.3333 0.228270209 Spain 0.3700 0.5243 1.0000 0.44716507 Sri Lanka 0.0251 0.4494 0.5000 0.237257064 Saint Kitts and Nevis 0.1683 .. 0.0000 .. Saint Lucia 0.1238 .. 0.0000 .. St. Vincent & the 0.0916 .. 0.0000 .. Sudan 0.0063 0.1937 0.7500 0.099977804 Suriname 0.1378 0.4950 0.5000 0.316396106 Swaziland 0.0379 0.4251 0.2500 0.231484438 Sweden 0.6918 0.7847 1.0000 0.73828085 Switzerland 0.5857 0.7909 1.0000 0.688307363 Syria 0.0402 0.2564 0.0000 0.148293031 Taiwan, China .. .. 1.0000 .. Tajikistan 0.0138 0.3315 0.0000 0.172642523 Tanzania 0.0056 0.2561 0.2500 0.130824524 Thailand 0.0683 0.3619 0.6250 0.215103892 Togo 0.0168 0.1974 0.2500 0.107076493 Trinidad and Tobago 0.1432 0.4138 0.2500 0.278488098 Tunisia 0.0512 0.2729 0.2500 0.162011465 Turkey 0.1713 0.3245 0.2500 0.247935095 Turkmenistan 0.0456 0.0121 0.3333 0.028825513 Uganda 0.0054 0.2266 0.5000 0.115994873 Ukraine 0.0810 0.3409 0.0833 0.210987261 United Arab Emirates 0.3786 0.6247 0.2500 0.501655426 United Kingdom 0.5396 0.7131 1.0000 0.626315848 United States 0.8005 0.8462 1.0000 0.823370778 Uruguay 0.1776 0.4312 0.1250 0.304377226 Uzbekistan 0.0256 0.0107 0.1667 0.018103136 Vanuatu 0.0147 0.1765 0.0000 0.095633432 Venezuela 0.1207 0.4346 0.7500 0.277639578 Viet Nam 0.0189 0.3156 0.2500 0.167252298 Virgin Islands (U.S.) 0.0543 .. 0.0000 .. Yemen 0.0090 0.1575 0.2500 0.083246802 Yugoslavia 0.1243 .. 0.6667 .. Zambia 0.0075 0.2633 0.2500 0.135412716 Zimbabwe 0.0174 0.3183 0.7500 0.167861436
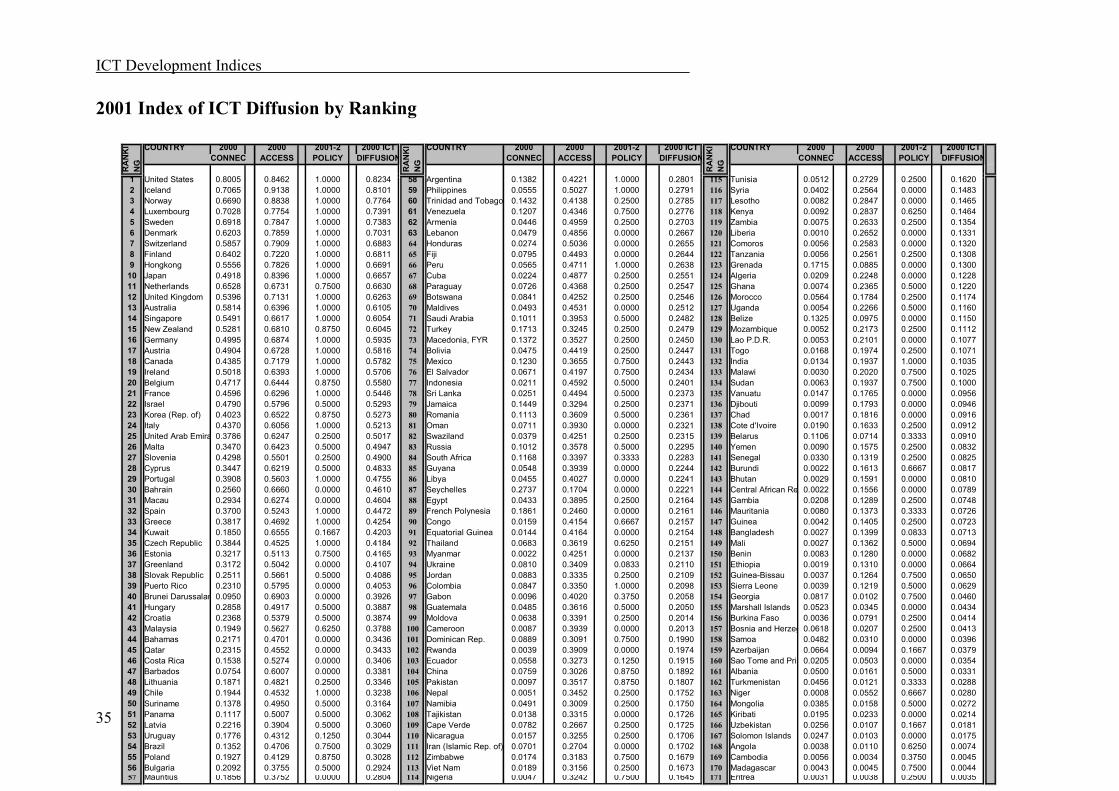
ICT Development Indices
35
2001 Index of ICT Diffusion by Ranking
COUNTRY 2000 2000 2001-2 2000 ICT COUNTRY 2000 2000 2001-2 2000 ICT COUNTRY 2000 2000 2001-2 2000 ICTCONNEC ACCESS POLICY DIFFUSION CONNEC ACCESS POLICY DIFFUSION CONNEC ACCESS POLICY DIFFUSION
1 United States 0.8005 0.8462 1.0000 0.8234 58 Argentina 0.1382 0.4221 1.0000 0.2801 115 Tunisia 0.0512 0.2729 0.2500 0.16202 Iceland 0.7065 0.9138 1.0000 0.8101 59 Philippines 0.0555 0.5027 1.0000 0.2791 116 Syria 0.0402 0.2564 0.0000 0.14833 Norway 0.6690 0.8838 1.0000 0.7764 60 Trinidad and Tobago 0.1432 0.4138 0.2500 0.2785 117 Lesotho 0.0082 0.2847 0.0000 0.14654 Luxembourg 0.7028 0.7754 1.0000 0.7391 61 Venezuela 0.1207 0.4346 0.7500 0.2776 118 Kenya 0.0092 0.2837 0.6250 0.14645 Sweden 0.6918 0.7847 1.0000 0.7383 62 Armenia 0.0446 0.4959 0.2500 0.2703 119 Zambia 0.0075 0.2633 0.2500 0.13546 Denmark 0.6203 0.7859 1.0000 0.7031 63 Lebanon 0.0479 0.4856 0.0000 0.2667 120 Liberia 0.0010 0.2652 0.0000 0.13317 Switzerland 0.5857 0.7909 1.0000 0.6883 64 Honduras 0.0274 0.5036 0.0000 0.2655 121 Comoros 0.0056 0.2583 0.0000 0.13208 Finland 0.6402 0.7220 1.0000 0.6811 65 Fiji 0.0795 0.4493 0.0000 0.2644 122 Tanzania 0.0056 0.2561 0.2500 0.13089 Hongkong 0.5556 0.7826 1.0000 0.6691 66 Peru 0.0565 0.4711 1.0000 0.2638 123 Grenada 0.1715 0.0885 0.0000 0.1300
10 Japan 0.4918 0.8396 1.0000 0.6657 67 Cuba 0.0224 0.4877 0.2500 0.2551 124 Algeria 0.0209 0.2248 0.0000 0.122811 Netherlands 0.6528 0.6731 0.7500 0.6630 68 Paraguay 0.0726 0.4368 0.2500 0.2547 125 Ghana 0.0074 0.2365 0.5000 0.122012 United Kingdom 0.5396 0.7131 1.0000 0.6263 69 Botswana 0.0841 0.4252 0.2500 0.2546 126 Morocco 0.0564 0.1784 0.2500 0.117413 Australia 0.5814 0.6396 1.0000 0.6105 70 Maldives 0.0493 0.4531 0.0000 0.2512 127 Uganda 0.0054 0.2266 0.5000 0.116014 Singapore 0.5491 0.6617 1.0000 0.6054 71 Saudi Arabia 0.1011 0.3953 0.5000 0.2482 128 Belize 0.1325 0.0975 0.0000 0.115015 New Zealand 0.5281 0.6810 0.8750 0.6045 72 Turkey 0.1713 0.3245 0.2500 0.2479 129 Mozambique 0.0052 0.2173 0.2500 0.111216 Germany 0.4995 0.6874 1.0000 0.5935 73 Macedonia, FYR 0.1372 0.3527 0.2500 0.2450 130 Lao P.D.R. 0.0053 0.2101 0.0000 0.107717 Austria 0.4904 0.6728 1.0000 0.5816 74 Bolivia 0.0475 0.4419 0.2500 0.2447 131 Togo 0.0168 0.1974 0.2500 0.107118 Canada 0.4385 0.7179 1.0000 0.5782 75 Mexico 0.1230 0.3655 0.7500 0.2443 132 India 0.0134 0.1937 1.0000 0.103519 Ireland 0.5018 0.6393 1.0000 0.5706 76 El Salvador 0.0671 0.4197 0.7500 0.2434 133 Malawi 0.0030 0.2020 0.7500 0.102520 Belgium 0.4717 0.6444 0.8750 0.5580 77 Indonesia 0.0211 0.4592 0.5000 0.2401 134 Sudan 0.0063 0.1937 0.7500 0.100021 France 0.4596 0.6296 1.0000 0.5446 78 Sri Lanka 0.0251 0.4494 0.5000 0.2373 135 Vanuatu 0.0147 0.1765 0.0000 0.095622 Israel 0.4790 0.5796 0.5000 0.5293 79 Jamaica 0.1449 0.3294 0.2500 0.2371 136 Djibouti 0.0099 0.1793 0.0000 0.094623 Korea (Rep. of) 0.4023 0.6522 0.8750 0.5273 80 Romania 0.1113 0.3609 0.5000 0.2361 137 Chad 0.0017 0.1816 0.0000 0.091624 Italy 0.4370 0.6056 1.0000 0.5213 81 Oman 0.0711 0.3930 0.0000 0.2321 138 Cote d'Ivoire 0.0190 0.1633 0.2500 0.091225 United Arab Emira 0.3786 0.6247 0.2500 0.5017 82 Swaziland 0.0379 0.4251 0.2500 0.2315 139 Belarus 0.1106 0.0714 0.3333 0.091026 Malta 0.3470 0.6423 0.5000 0.4947 83 Russia 0.1012 0.3578 0.5000 0.2295 140 Yemen 0.0090 0.1575 0.2500 0.083227 Slovenia 0.4298 0.5501 0.2500 0.4900 84 South Africa 0.1168 0.3397 0.3333 0.2283 141 Senegal 0.0330 0.1319 0.2500 0.082528 Cyprus 0.3447 0.6219 0.5000 0.4833 85 Guyana 0.0548 0.3939 0.0000 0.2244 142 Burundi 0.0022 0.1613 0.6667 0.081729 Portugal 0.3908 0.5603 1.0000 0.4755 86 Libya 0.0455 0.4027 0.0000 0.2241 143 Bhutan 0.0029 0.1591 0.0000 0.081030 Bahrain 0.2560 0.6660 0.0000 0.4610 87 Seychelles 0.2737 0.1704 0.0000 0.2221 144 Central African Re 0.0022 0.1556 0.0000 0.078931 Macau 0.2934 0.6274 0.0000 0.4604 88 Egypt 0.0433 0.3895 0.2500 0.2164 145 Gambia 0.0208 0.1289 0.2500 0.074832 Spain 0.3700 0.5243 1.0000 0.4472 89 French Polynesia 0.1861 0.2460 0.0000 0.2161 146 Mauritania 0.0080 0.1373 0.3333 0.072633 Greece 0.3817 0.4692 1.0000 0.4254 90 Congo 0.0159 0.4154 0.6667 0.2157 147 Guinea 0.0042 0.1405 0.2500 0.072334 Kuwait 0.1850 0.6555 0.1667 0.4203 91 Equatorial Guinea 0.0144 0.4164 0.0000 0.2154 148 Bangladesh 0.0027 0.1399 0.0833 0.071335 Czech Republic 0.3844 0.4525 1.0000 0.4184 92 Thailand 0.0683 0.3619 0.6250 0.2151 149 Mali 0.0027 0.1362 0.5000 0.069436 Estonia 0.3217 0.5113 0.7500 0.4165 93 Myanmar 0.0022 0.4251 0.0000 0.2137 150 Benin 0.0083 0.1280 0.0000 0.068237 Greenland 0.3172 0.5042 0.0000 0.4107 94 Ukraine 0.0810 0.3409 0.0833 0.2110 151 Ethiopia 0.0019 0.1310 0.0000 0.066438 Slovak Republic 0.2511 0.5661 0.5000 0.4086 95 Jordan 0.0883 0.3335 0.2500 0.2109 152 Guinea-Bissau 0.0037 0.1264 0.7500 0.065039 Puerto Rico 0.2310 0.5795 0.0000 0.4053 96 Colombia 0.0847 0.3350 1.0000 0.2098 153 Sierra Leone 0.0039 0.1219 0.5000 0.062940 Brunei Darussalam0.0950 0.6903 0.0000 0.3926 97 Gabon 0.0096 0.4020 0.3750 0.2058 154 Georgia 0.0817 0.0102 0.7500 0.046041 Hungary 0.2858 0.4917 0.5000 0.3887 98 Guatemala 0.0485 0.3616 0.5000 0.2050 155 Marshall Islands 0.0523 0.0345 0.0000 0.043442 Croatia 0.2368 0.5379 0.5000 0.3874 99 Moldova 0.0638 0.3391 0.2500 0.2014 156 Burkina Faso 0.0036 0.0791 0.2500 0.041443 Malaysia 0.1949 0.5627 0.6250 0.3788 100 Cameroon 0.0087 0.3939 0.0000 0.2013 157 Bosnia and Herzeg 0.0618 0.0207 0.2500 0.041344 Bahamas 0.2171 0.4701 0.0000 0.3436 101 Dominican Rep. 0.0889 0.3091 0.7500 0.1990 158 Samoa 0.0482 0.0310 0.0000 0.039645 Qatar 0.2315 0.4552 0.0000 0.3433 102 Rwanda 0.0039 0.3909 0.0000 0.1974 159 Azerbaijan 0.0664 0.0094 0.1667 0.037946 Costa Rica 0.1538 0.5274 0.0000 0.3406 103 Ecuador 0.0558 0.3273 0.1250 0.1915 160 Sao Tome and Pri 0.0205 0.0503 0.0000 0.035447 Barbados 0.0754 0.6007 0.0000 0.3381 104 China 0.0759 0.3026 0.8750 0.1892 161 Albania 0.0500 0.0161 0.5000 0.033148 Lithuania 0.1871 0.4821 0.2500 0.3346 105 Pakistan 0.0097 0.3517 0.8750 0.1807 162 Turkmenistan 0.0456 0.0121 0.3333 0.028849 Chile 0.1944 0.4532 1.0000 0.3238 106 Nepal 0.0051 0.3452 0.2500 0.1752 163 Niger 0.0008 0.0552 0.6667 0.028050 Suriname 0.1378 0.4950 0.5000 0.3164 107 Namibia 0.0491 0.3009 0.2500 0.1750 164 Mongolia 0.0385 0.0158 0.5000 0.027251 Panama 0.1117 0.5007 0.5000 0.3062 108 Tajikistan 0.0138 0.3315 0.0000 0.1726 165 Kiribati 0.0195 0.0233 0.0000 0.021452 Latvia 0.2216 0.3904 0.5000 0.3060 109 Cape Verde 0.0782 0.2667 0.2500 0.1725 166 Uzbekistan 0.0256 0.0107 0.1667 0.018153 Uruguay 0.1776 0.4312 0.1250 0.3044 110 Nicaragua 0.0157 0.3255 0.2500 0.1706 167 Solomon Islands 0.0247 0.0103 0.0000 0.017554 Brazil 0.1352 0.4706 0.7500 0.3029 111 Iran (Islamic Rep. of) 0.0701 0.2704 0.0000 0.1702 168 Angola 0.0038 0.0110 0.6250 0.007455 Poland 0.1927 0.4129 0.8750 0.3028 112 Zimbabwe 0.0174 0.3183 0.7500 0.1679 169 Cambodia 0.0056 0.0034 0.3750 0.004556 Bulgaria 0.2092 0.3755 0.5000 0.2924 113 Viet Nam 0.0189 0.3156 0.2500 0.1673 170 Madagascar 0.0043 0.0045 0.7500 0.004457 Mauritius 0.1856 0.3752 0.0000 0.2804 114 Nigeria 0.0047 0.3242 0.7500 0.1645 171 Eritrea 0.0031 0.0038 0.2500 0.0035
RA
NK
IN
G
RA
NK
IN
G
RA
NK
IN
G
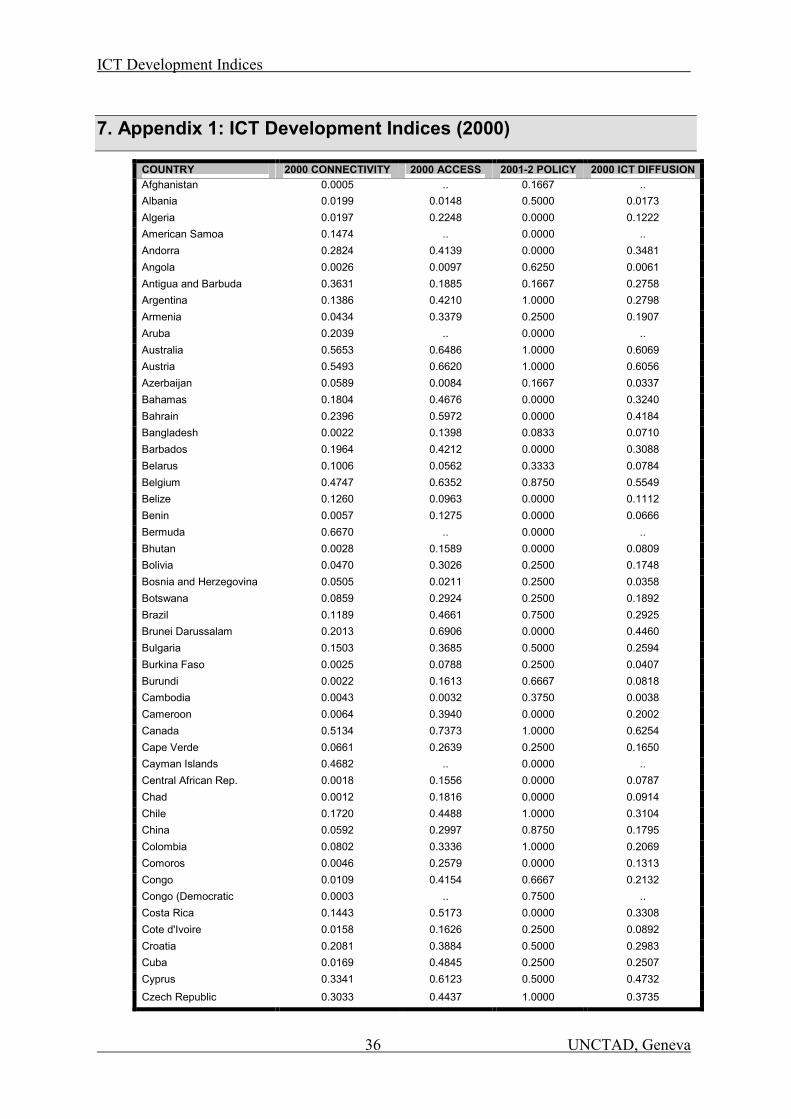
ICT Development Indices
36 UNCTAD, Geneva
7. Appendix 1: ICT Development Indices (2000)
COUNTRY 2000 CONNECTIVITY 2000 ACCESS 2001-2 POLICY 2000 ICT DIFFUSION Afghanistan 0.0005 .. 0.1667 .. Albania 0.0199 0.0148 0.5000 0.0173 Algeria 0.0197 0.2248 0.0000 0.1222 American Samoa 0.1474 .. 0.0000 .. Andorra 0.2824 0.4139 0.0000 0.3481 Angola 0.0026 0.0097 0.6250 0.0061 Antigua and Barbuda 0.3631 0.1885 0.1667 0.2758 Argentina 0.1386 0.4210 1.0000 0.2798 Armenia 0.0434 0.3379 0.2500 0.1907 Aruba 0.2039 .. 0.0000 .. Australia 0.5653 0.6486 1.0000 0.6069 Austria 0.5493 0.6620 1.0000 0.6056 Azerbaijan 0.0589 0.0084 0.1667 0.0337 Bahamas 0.1804 0.4676 0.0000 0.3240 Bahrain 0.2396 0.5972 0.0000 0.4184 Bangladesh 0.0022 0.1398 0.0833 0.0710 Barbados 0.1964 0.4212 0.0000 0.3088 Belarus 0.1006 0.0562 0.3333 0.0784 Belgium 0.4747 0.6352 0.8750 0.5549 Belize 0.1260 0.0963 0.0000 0.1112 Benin 0.0057 0.1275 0.0000 0.0666 Bermuda 0.6670 .. 0.0000 .. Bhutan 0.0028 0.1589 0.0000 0.0809 Bolivia 0.0470 0.3026 0.2500 0.1748 Bosnia and Herzegovina 0.0505 0.0211 0.2500 0.0358 Botswana 0.0859 0.2924 0.2500 0.1892 Brazil 0.1189 0.4661 0.7500 0.2925 Brunei Darussalam 0.2013 0.6906 0.0000 0.4460 Bulgaria 0.1503 0.3685 0.5000 0.2594 Burkina Faso 0.0025 0.0788 0.2500 0.0407 Burundi 0.0022 0.1613 0.6667 0.0818 Cambodia 0.0043 0.0032 0.3750 0.0038 Cameroon 0.0064 0.3940 0.0000 0.2002 Canada 0.5134 0.7373 1.0000 0.6254 Cape Verde 0.0661 0.2639 0.2500 0.1650 Cayman Islands 0.4682 .. 0.0000 .. Central African Rep. 0.0018 0.1556 0.0000 0.0787 Chad 0.0012 0.1816 0.0000 0.0914 Chile 0.1720 0.4488 1.0000 0.3104 China 0.0592 0.2997 0.8750 0.1795 Colombia 0.0802 0.3336 1.0000 0.2069 Comoros 0.0046 0.2579 0.0000 0.1313 Congo 0.0109 0.4154 0.6667 0.2132 Congo (Democratic 0.0003 .. 0.7500 .. Costa Rica 0.1443 0.5173 0.0000 0.3308 Cote d'Ivoire 0.0158 0.1626 0.2500 0.0892 Croatia 0.2081 0.3884 0.5000 0.2983 Cuba 0.0169 0.4845 0.2500 0.2507 Cyprus 0.3341 0.6123 0.5000 0.4732 Czech Republic 0.3033 0.4437 1.0000 0.3735
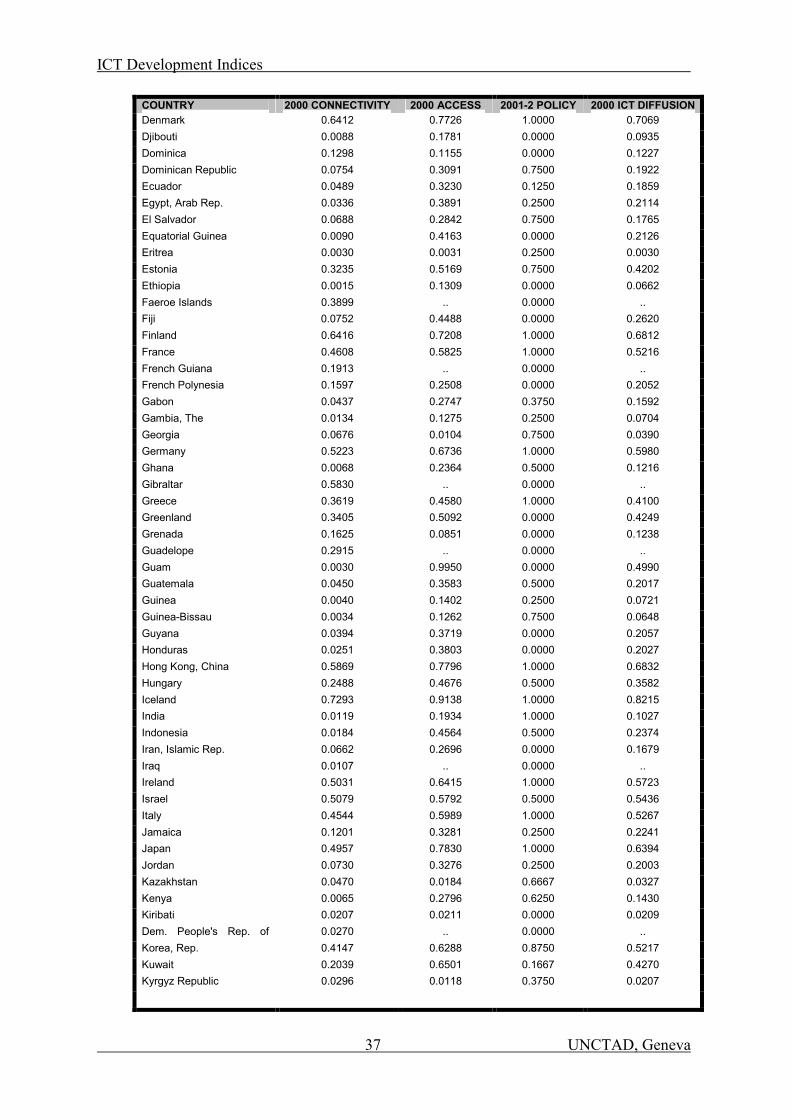
ICT Development Indices
37 UNCTAD, Geneva
COUNTRY 2000 CONNECTIVITY 2000 ACCESS 2001-2 POLICY 2000 ICT DIFFUSION Denmark 0.6412 0.7726 1.0000 0.7069 Djibouti 0.0088 0.1781 0.0000 0.0935 Dominica 0.1298 0.1155 0.0000 0.1227 Dominican Republic 0.0754 0.3091 0.7500 0.1922 Ecuador 0.0489 0.3230 0.1250 0.1859 Egypt, Arab Rep. 0.0336 0.3891 0.2500 0.2114 El Salvador 0.0688 0.2842 0.7500 0.1765 Equatorial Guinea 0.0090 0.4163 0.0000 0.2126 Eritrea 0.0030 0.0031 0.2500 0.0030 Estonia 0.3235 0.5169 0.7500 0.4202 Ethiopia 0.0015 0.1309 0.0000 0.0662 Faeroe Islands 0.3899 .. 0.0000 .. Fiji 0.0752 0.4488 0.0000 0.2620 Finland 0.6416 0.7208 1.0000 0.6812 France 0.4608 0.5825 1.0000 0.5216 French Guiana 0.1913 .. 0.0000 .. French Polynesia 0.1597 0.2508 0.0000 0.2052 Gabon 0.0437 0.2747 0.3750 0.1592 Gambia, The 0.0134 0.1275 0.2500 0.0704 Georgia 0.0676 0.0104 0.7500 0.0390 Germany 0.5223 0.6736 1.0000 0.5980 Ghana 0.0068 0.2364 0.5000 0.1216 Gibraltar 0.5830 .. 0.0000 .. Greece 0.3619 0.4580 1.0000 0.4100 Greenland 0.3405 0.5092 0.0000 0.4249 Grenada 0.1625 0.0851 0.0000 0.1238 Guadelope 0.2915 .. 0.0000 .. Guam 0.0030 0.9950 0.0000 0.4990 Guatemala 0.0450 0.3583 0.5000 0.2017 Guinea 0.0040 0.1402 0.2500 0.0721 Guinea-Bissau 0.0034 0.1262 0.7500 0.0648 Guyana 0.0394 0.3719 0.0000 0.2057 Honduras 0.0251 0.3803 0.0000 0.2027 Hong Kong, China 0.5869 0.7796 1.0000 0.6832 Hungary 0.2488 0.4676 0.5000 0.3582 Iceland 0.7293 0.9138 1.0000 0.8215 India 0.0119 0.1934 1.0000 0.1027 Indonesia 0.0184 0.4564 0.5000 0.2374 Iran, Islamic Rep. 0.0662 0.2696 0.0000 0.1679 Iraq 0.0107 .. 0.0000 .. Ireland 0.5031 0.6415 1.0000 0.5723 Israel 0.5079 0.5792 0.5000 0.5436 Italy 0.4544 0.5989 1.0000 0.5267 Jamaica 0.1201 0.3281 0.2500 0.2241 Japan 0.4957 0.7830 1.0000 0.6394 Jordan 0.0730 0.3276 0.2500 0.2003 Kazakhstan 0.0470 0.0184 0.6667 0.0327 Kenya 0.0065 0.2796 0.6250 0.1430 Kiribati 0.0207 0.0211 0.0000 0.0209 Dem. People's Rep. of 0.0270 .. 0.0000 .. Korea, Rep. 0.4147 0.6288 0.8750 0.5217 Kuwait 0.2039 0.6501 0.1667 0.4270 Kyrgyz Republic 0.0296 0.0118 0.3750 0.0207
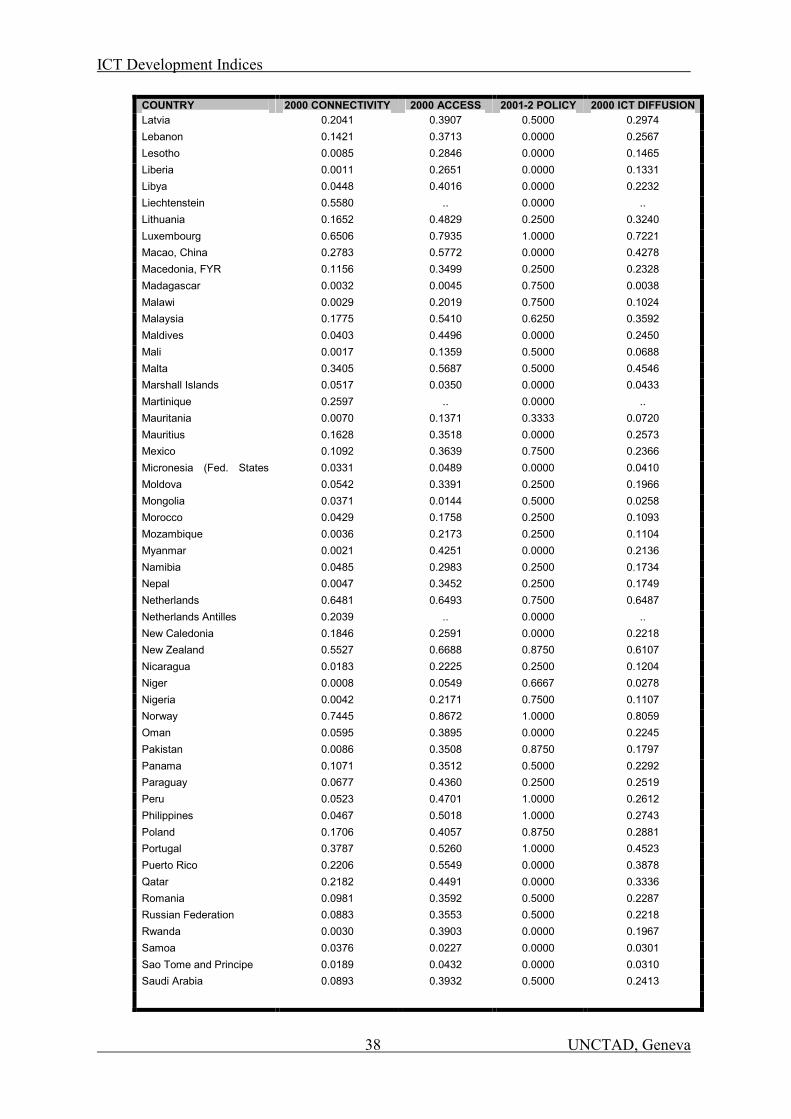
ICT Development Indices
38 UNCTAD, Geneva
COUNTRY 2000 CONNECTIVITY 2000 ACCESS 2001-2 POLICY 2000 ICT DIFFUSION Latvia 0.2041 0.3907 0.5000 0.2974 Lebanon 0.1421 0.3713 0.0000 0.2567 Lesotho 0.0085 0.2846 0.0000 0.1465 Liberia 0.0011 0.2651 0.0000 0.1331 Libya 0.0448 0.4016 0.0000 0.2232 Liechtenstein 0.5580 .. 0.0000 .. Lithuania 0.1652 0.4829 0.2500 0.3240 Luxembourg 0.6506 0.7935 1.0000 0.7221 Macao, China 0.2783 0.5772 0.0000 0.4278 Macedonia, FYR 0.1156 0.3499 0.2500 0.2328 Madagascar 0.0032 0.0045 0.7500 0.0038 Malawi 0.0029 0.2019 0.7500 0.1024 Malaysia 0.1775 0.5410 0.6250 0.3592 Maldives 0.0403 0.4496 0.0000 0.2450 Mali 0.0017 0.1359 0.5000 0.0688 Malta 0.3405 0.5687 0.5000 0.4546 Marshall Islands 0.0517 0.0350 0.0000 0.0433 Martinique 0.2597 .. 0.0000 .. Mauritania 0.0070 0.1371 0.3333 0.0720 Mauritius 0.1628 0.3518 0.0000 0.2573 Mexico 0.1092 0.3639 0.7500 0.2366 Micronesia (Fed. States 0.0331 0.0489 0.0000 0.0410 Moldova 0.0542 0.3391 0.2500 0.1966 Mongolia 0.0371 0.0144 0.5000 0.0258 Morocco 0.0429 0.1758 0.2500 0.1093 Mozambique 0.0036 0.2173 0.2500 0.1104 Myanmar 0.0021 0.4251 0.0000 0.2136 Namibia 0.0485 0.2983 0.2500 0.1734 Nepal 0.0047 0.3452 0.2500 0.1749 Netherlands 0.6481 0.6493 0.7500 0.6487 Netherlands Antilles 0.2039 .. 0.0000 .. New Caledonia 0.1846 0.2591 0.0000 0.2218 New Zealand 0.5527 0.6688 0.8750 0.6107 Nicaragua 0.0183 0.2225 0.2500 0.1204 Niger 0.0008 0.0549 0.6667 0.0278 Nigeria 0.0042 0.2171 0.7500 0.1107 Norway 0.7445 0.8672 1.0000 0.8059 Oman 0.0595 0.3895 0.0000 0.2245 Pakistan 0.0086 0.3508 0.8750 0.1797 Panama 0.1071 0.3512 0.5000 0.2292 Paraguay 0.0677 0.4360 0.2500 0.2519 Peru 0.0523 0.4701 1.0000 0.2612 Philippines 0.0467 0.5018 1.0000 0.2743 Poland 0.1706 0.4057 0.8750 0.2881 Portugal 0.3787 0.5260 1.0000 0.4523 Puerto Rico 0.2206 0.5549 0.0000 0.3878 Qatar 0.2182 0.4491 0.0000 0.3336 Romania 0.0981 0.3592 0.5000 0.2287 Russian Federation 0.0883 0.3553 0.5000 0.2218 Rwanda 0.0030 0.3903 0.0000 0.1967 Samoa 0.0376 0.0227 0.0000 0.0301 Sao Tome and Principe 0.0189 0.0432 0.0000 0.0310 Saudi Arabia 0.0893 0.3932 0.5000 0.2413
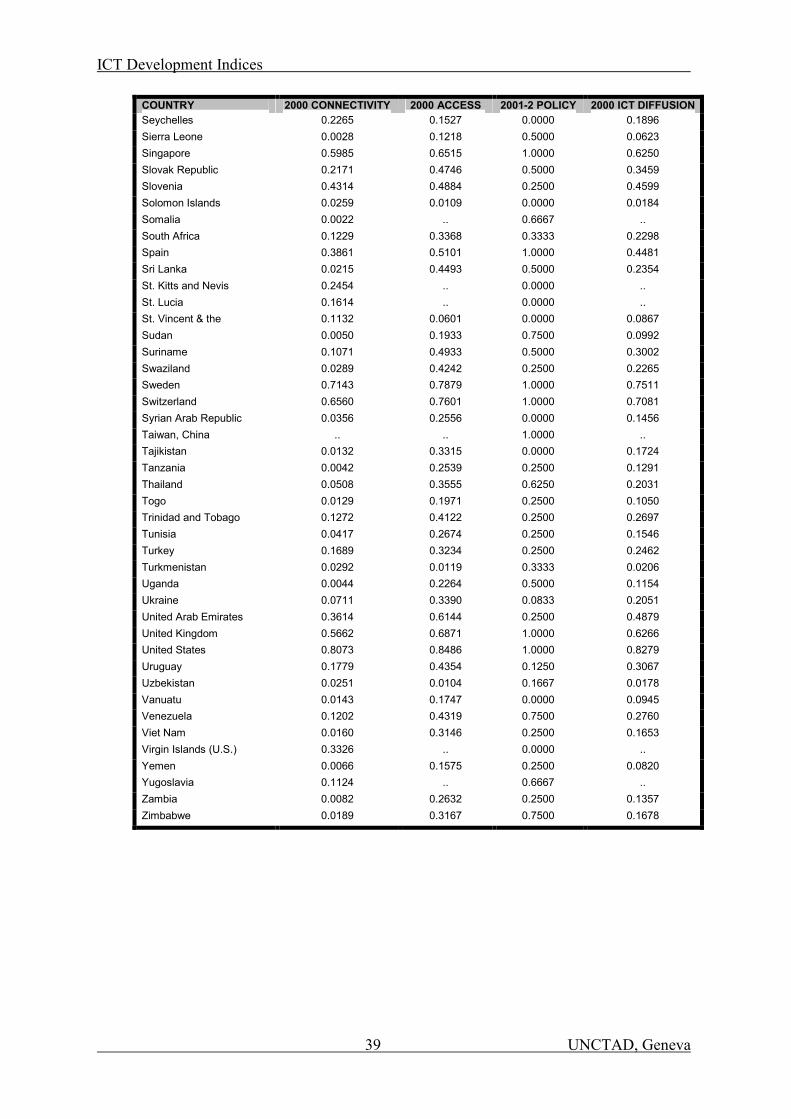
ICT Development Indices
39 UNCTAD, Geneva
COUNTRY 2000 CONNECTIVITY 2000 ACCESS 2001-2 POLICY 2000 ICT DIFFUSION Seychelles 0.2265 0.1527 0.0000 0.1896 Sierra Leone 0.0028 0.1218 0.5000 0.0623 Singapore 0.5985 0.6515 1.0000 0.6250 Slovak Republic 0.2171 0.4746 0.5000 0.3459 Slovenia 0.4314 0.4884 0.2500 0.4599 Solomon Islands 0.0259 0.0109 0.0000 0.0184 Somalia 0.0022 .. 0.6667 .. South Africa 0.1229 0.3368 0.3333 0.2298 Spain 0.3861 0.5101 1.0000 0.4481 Sri Lanka 0.0215 0.4493 0.5000 0.2354 St. Kitts and Nevis 0.2454 .. 0.0000 .. St. Lucia 0.1614 .. 0.0000 .. St. Vincent & the 0.1132 0.0601 0.0000 0.0867 Sudan 0.0050 0.1933 0.7500 0.0992 Suriname 0.1071 0.4933 0.5000 0.3002 Swaziland 0.0289 0.4242 0.2500 0.2265 Sweden 0.7143 0.7879 1.0000 0.7511 Switzerland 0.6560 0.7601 1.0000 0.7081 Syrian Arab Republic 0.0356 0.2556 0.0000 0.1456 Taiwan, China .. .. 1.0000 .. Tajikistan 0.0132 0.3315 0.0000 0.1724 Tanzania 0.0042 0.2539 0.2500 0.1291 Thailand 0.0508 0.3555 0.6250 0.2031 Togo 0.0129 0.1971 0.2500 0.1050 Trinidad and Tobago 0.1272 0.4122 0.2500 0.2697 Tunisia 0.0417 0.2674 0.2500 0.1546 Turkey 0.1689 0.3234 0.2500 0.2462 Turkmenistan 0.0292 0.0119 0.3333 0.0206 Uganda 0.0044 0.2264 0.5000 0.1154 Ukraine 0.0711 0.3390 0.0833 0.2051 United Arab Emirates 0.3614 0.6144 0.2500 0.4879 United Kingdom 0.5662 0.6871 1.0000 0.6266 United States 0.8073 0.8486 1.0000 0.8279 Uruguay 0.1779 0.4354 0.1250 0.3067 Uzbekistan 0.0251 0.0104 0.1667 0.0178 Vanuatu 0.0143 0.1747 0.0000 0.0945 Venezuela 0.1202 0.4319 0.7500 0.2760 Viet Nam 0.0160 0.3146 0.2500 0.1653 Virgin Islands (U.S.) 0.3326 .. 0.0000 .. Yemen 0.0066 0.1575 0.2500 0.0820 Yugoslavia 0.1124 .. 0.6667 .. Zambia 0.0082 0.2632 0.2500 0.1357 Zimbabwe 0.0189 0.3167 0.7500 0.1678
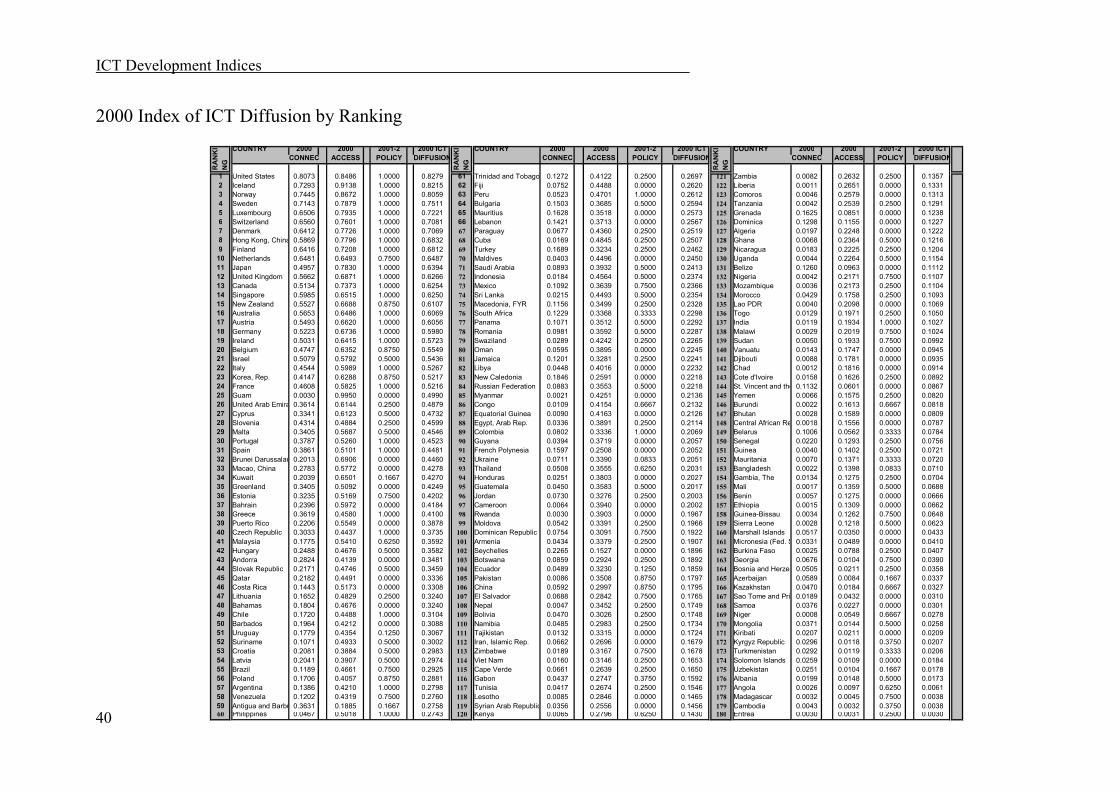
ICT Development Indices
40
2000 Index of ICT Diffusion by Ranking COUNTRY 2000 2000 2001-2 2000 ICT COUNTRY 2000 2000 2001-2 2000 ICT COUNTRY 2000 2000 2001-2 2000 ICT
CONNEC ACCESS POLICY DIFFUSION CONNEC ACCESS POLICY DIFFUSION CONNEC ACCESS POLICY DIFFUSION
1 United States 0.8073 0.8486 1.0000 0.8279 61 Trinidad and Tobago 0.1272 0.4122 0.2500 0.2697 121 Zambia 0.0082 0.2632 0.2500 0.13572 Iceland 0.7293 0.9138 1.0000 0.8215 62 Fiji 0.0752 0.4488 0.0000 0.2620 122 Liberia 0.0011 0.2651 0.0000 0.13313 Norway 0.7445 0.8672 1.0000 0.8059 63 Peru 0.0523 0.4701 1.0000 0.2612 123 Comoros 0.0046 0.2579 0.0000 0.13134 Sweden 0.7143 0.7879 1.0000 0.7511 64 Bulgaria 0.1503 0.3685 0.5000 0.2594 124 Tanzania 0.0042 0.2539 0.2500 0.12915 Luxembourg 0.6506 0.7935 1.0000 0.7221 65 Mauritius 0.1628 0.3518 0.0000 0.2573 125 Grenada 0.1625 0.0851 0.0000 0.12386 Switzerland 0.6560 0.7601 1.0000 0.7081 66 Lebanon 0.1421 0.3713 0.0000 0.2567 126 Dominica 0.1298 0.1155 0.0000 0.12277 Denmark 0.6412 0.7726 1.0000 0.7069 67 Paraguay 0.0677 0.4360 0.2500 0.2519 127 Algeria 0.0197 0.2248 0.0000 0.12228 Hong Kong, China 0.5869 0.7796 1.0000 0.6832 68 Cuba 0.0169 0.4845 0.2500 0.2507 128 Ghana 0.0068 0.2364 0.5000 0.12169 Finland 0.6416 0.7208 1.0000 0.6812 69 Turkey 0.1689 0.3234 0.2500 0.2462 129 Nicaragua 0.0183 0.2225 0.2500 0.1204
10 Netherlands 0.6481 0.6493 0.7500 0.6487 70 Maldives 0.0403 0.4496 0.0000 0.2450 130 Uganda 0.0044 0.2264 0.5000 0.115411 Japan 0.4957 0.7830 1.0000 0.6394 71 Saudi Arabia 0.0893 0.3932 0.5000 0.2413 131 Belize 0.1260 0.0963 0.0000 0.111212 United Kingdom 0.5662 0.6871 1.0000 0.6266 72 Indonesia 0.0184 0.4564 0.5000 0.2374 132 Nigeria 0.0042 0.2171 0.7500 0.110713 Canada 0.5134 0.7373 1.0000 0.6254 73 Mexico 0.1092 0.3639 0.7500 0.2366 133 Mozambique 0.0036 0.2173 0.2500 0.110414 Singapore 0.5985 0.6515 1.0000 0.6250 74 Sri Lanka 0.0215 0.4493 0.5000 0.2354 134 Morocco 0.0429 0.1758 0.2500 0.109315 New Zealand 0.5527 0.6688 0.8750 0.6107 75 Macedonia, FYR 0.1156 0.3499 0.2500 0.2328 135 Lao PDR 0.0040 0.2098 0.0000 0.106916 Australia 0.5653 0.6486 1.0000 0.6069 76 South Africa 0.1229 0.3368 0.3333 0.2298 136 Togo 0.0129 0.1971 0.2500 0.105017 Austria 0.5493 0.6620 1.0000 0.6056 77 Panama 0.1071 0.3512 0.5000 0.2292 137 India 0.0119 0.1934 1.0000 0.102718 Germany 0.5223 0.6736 1.0000 0.5980 78 Romania 0.0981 0.3592 0.5000 0.2287 138 Malawi 0.0029 0.2019 0.7500 0.102419 Ireland 0.5031 0.6415 1.0000 0.5723 79 Swaziland 0.0289 0.4242 0.2500 0.2265 139 Sudan 0.0050 0.1933 0.7500 0.099220 Belgium 0.4747 0.6352 0.8750 0.5549 80 Oman 0.0595 0.3895 0.0000 0.2245 140 Vanuatu 0.0143 0.1747 0.0000 0.094521 Israel 0.5079 0.5792 0.5000 0.5436 81 Jamaica 0.1201 0.3281 0.2500 0.2241 141 Djibouti 0.0088 0.1781 0.0000 0.093522 Italy 0.4544 0.5989 1.0000 0.5267 82 Libya 0.0448 0.4016 0.0000 0.2232 142 Chad 0.0012 0.1816 0.0000 0.091423 Korea, Rep. 0.4147 0.6288 0.8750 0.5217 83 New Caledonia 0.1846 0.2591 0.0000 0.2218 143 Cote d'Ivoire 0.0158 0.1626 0.2500 0.089224 France 0.4608 0.5825 1.0000 0.5216 84 Russian Federation 0.0883 0.3553 0.5000 0.2218 144 St. Vincent and the 0.1132 0.0601 0.0000 0.086725 Guam 0.0030 0.9950 0.0000 0.4990 85 Myanmar 0.0021 0.4251 0.0000 0.2136 145 Yemen 0.0066 0.1575 0.2500 0.082026 United Arab Emira 0.3614 0.6144 0.2500 0.4879 86 Congo 0.0109 0.4154 0.6667 0.2132 146 Burundi 0.0022 0.1613 0.6667 0.081827 Cyprus 0.3341 0.6123 0.5000 0.4732 87 Equatorial Guinea 0.0090 0.4163 0.0000 0.2126 147 Bhutan 0.0028 0.1589 0.0000 0.080928 Slovenia 0.4314 0.4884 0.2500 0.4599 88 Egypt, Arab Rep. 0.0336 0.3891 0.2500 0.2114 148 Central African Re 0.0018 0.1556 0.0000 0.078729 Malta 0.3405 0.5687 0.5000 0.4546 89 Colombia 0.0802 0.3336 1.0000 0.2069 149 Belarus 0.1006 0.0562 0.3333 0.078430 Portugal 0.3787 0.5260 1.0000 0.4523 90 Guyana 0.0394 0.3719 0.0000 0.2057 150 Senegal 0.0220 0.1293 0.2500 0.075631 Spain 0.3861 0.5101 1.0000 0.4481 91 French Polynesia 0.1597 0.2508 0.0000 0.2052 151 Guinea 0.0040 0.1402 0.2500 0.072132 Brunei Darussalam0.2013 0.6906 0.0000 0.4460 92 Ukraine 0.0711 0.3390 0.0833 0.2051 152 Mauritania 0.0070 0.1371 0.3333 0.072033 Macao, China 0.2783 0.5772 0.0000 0.4278 93 Thailand 0.0508 0.3555 0.6250 0.2031 153 Bangladesh 0.0022 0.1398 0.0833 0.071034 Kuwait 0.2039 0.6501 0.1667 0.4270 94 Honduras 0.0251 0.3803 0.0000 0.2027 154 Gambia, The 0.0134 0.1275 0.2500 0.070435 Greenland 0.3405 0.5092 0.0000 0.4249 95 Guatemala 0.0450 0.3583 0.5000 0.2017 155 Mali 0.0017 0.1359 0.5000 0.068836 Estonia 0.3235 0.5169 0.7500 0.4202 96 Jordan 0.0730 0.3276 0.2500 0.2003 156 Benin 0.0057 0.1275 0.0000 0.066637 Bahrain 0.2396 0.5972 0.0000 0.4184 97 Cameroon 0.0064 0.3940 0.0000 0.2002 157 Ethiopia 0.0015 0.1309 0.0000 0.066238 Greece 0.3619 0.4580 1.0000 0.4100 98 Rwanda 0.0030 0.3903 0.0000 0.1967 158 Guinea-Bissau 0.0034 0.1262 0.7500 0.064839 Puerto Rico 0.2206 0.5549 0.0000 0.3878 99 Moldova 0.0542 0.3391 0.2500 0.1966 159 Sierra Leone 0.0028 0.1218 0.5000 0.062340 Czech Republic 0.3033 0.4437 1.0000 0.3735 100 Dominican Republic 0.0754 0.3091 0.7500 0.1922 160 Marshall Islands 0.0517 0.0350 0.0000 0.043341 Malaysia 0.1775 0.5410 0.6250 0.3592 101 Armenia 0.0434 0.3379 0.2500 0.1907 161 Micronesia (Fed. S 0.0331 0.0489 0.0000 0.041042 Hungary 0.2488 0.4676 0.5000 0.3582 102 Seychelles 0.2265 0.1527 0.0000 0.1896 162 Burkina Faso 0.0025 0.0788 0.2500 0.040743 Andorra 0.2824 0.4139 0.0000 0.3481 103 Botswana 0.0859 0.2924 0.2500 0.1892 163 Georgia 0.0676 0.0104 0.7500 0.039044 Slovak Republic 0.2171 0.4746 0.5000 0.3459 104 Ecuador 0.0489 0.3230 0.1250 0.1859 164 Bosnia and Herzeg 0.0505 0.0211 0.2500 0.035845 Qatar 0.2182 0.4491 0.0000 0.3336 105 Pakistan 0.0086 0.3508 0.8750 0.1797 165 Azerbaijan 0.0589 0.0084 0.1667 0.033746 Costa Rica 0.1443 0.5173 0.0000 0.3308 106 China 0.0592 0.2997 0.8750 0.1795 166 Kazakhstan 0.0470 0.0184 0.6667 0.032747 Lithuania 0.1652 0.4829 0.2500 0.3240 107 El Salvador 0.0688 0.2842 0.7500 0.1765 167 Sao Tome and Pri 0.0189 0.0432 0.0000 0.031048 Bahamas 0.1804 0.4676 0.0000 0.3240 108 Nepal 0.0047 0.3452 0.2500 0.1749 168 Samoa 0.0376 0.0227 0.0000 0.030149 Chile 0.1720 0.4488 1.0000 0.3104 109 Bolivia 0.0470 0.3026 0.2500 0.1748 169 Niger 0.0008 0.0549 0.6667 0.027850 Barbados 0.1964 0.4212 0.0000 0.3088 110 Namibia 0.0485 0.2983 0.2500 0.1734 170 Mongolia 0.0371 0.0144 0.5000 0.025851 Uruguay 0.1779 0.4354 0.1250 0.3067 111 Tajikistan 0.0132 0.3315 0.0000 0.1724 171 Kiribati 0.0207 0.0211 0.0000 0.020952 Suriname 0.1071 0.4933 0.5000 0.3002 112 Iran, Islamic Rep. 0.0662 0.2696 0.0000 0.1679 172 Kyrgyz Republic 0.0296 0.0118 0.3750 0.020753 Croatia 0.2081 0.3884 0.5000 0.2983 113 Zimbabwe 0.0189 0.3167 0.7500 0.1678 173 Turkmenistan 0.0292 0.0119 0.3333 0.020654 Latvia 0.2041 0.3907 0.5000 0.2974 114 Viet Nam 0.0160 0.3146 0.2500 0.1653 174 Solomon Islands 0.0259 0.0109 0.0000 0.018455 Brazil 0.1189 0.4661 0.7500 0.2925 115 Cape Verde 0.0661 0.2639 0.2500 0.1650 175 Uzbekistan 0.0251 0.0104 0.1667 0.017856 Poland 0.1706 0.4057 0.8750 0.2881 116 Gabon 0.0437 0.2747 0.3750 0.1592 176 Albania 0.0199 0.0148 0.5000 0.017357 Argentina 0.1386 0.4210 1.0000 0.2798 117 Tunisia 0.0417 0.2674 0.2500 0.1546 177 Angola 0.0026 0.0097 0.6250 0.006158 Venezuela 0.1202 0.4319 0.7500 0.2760 118 Lesotho 0.0085 0.2846 0.0000 0.1465 178 Madagascar 0.0032 0.0045 0.7500 0.003859 Antigua and Barbu 0.3631 0.1885 0.1667 0.2758 119 Syrian Arab Republic 0.0356 0.2556 0.0000 0.1456 179 Cambodia 0.0043 0.0032 0.3750 0.003860 Philippines 0.0467 0.5018 1.0000 0.2743 120 Kenya 0.0065 0.2796 0.6250 0.1430 180 Eritrea 0.0030 0.0031 0.2500 0.0030
RA
NK
IN
G
RA
NK
IN
G
RA
NK
IN
G
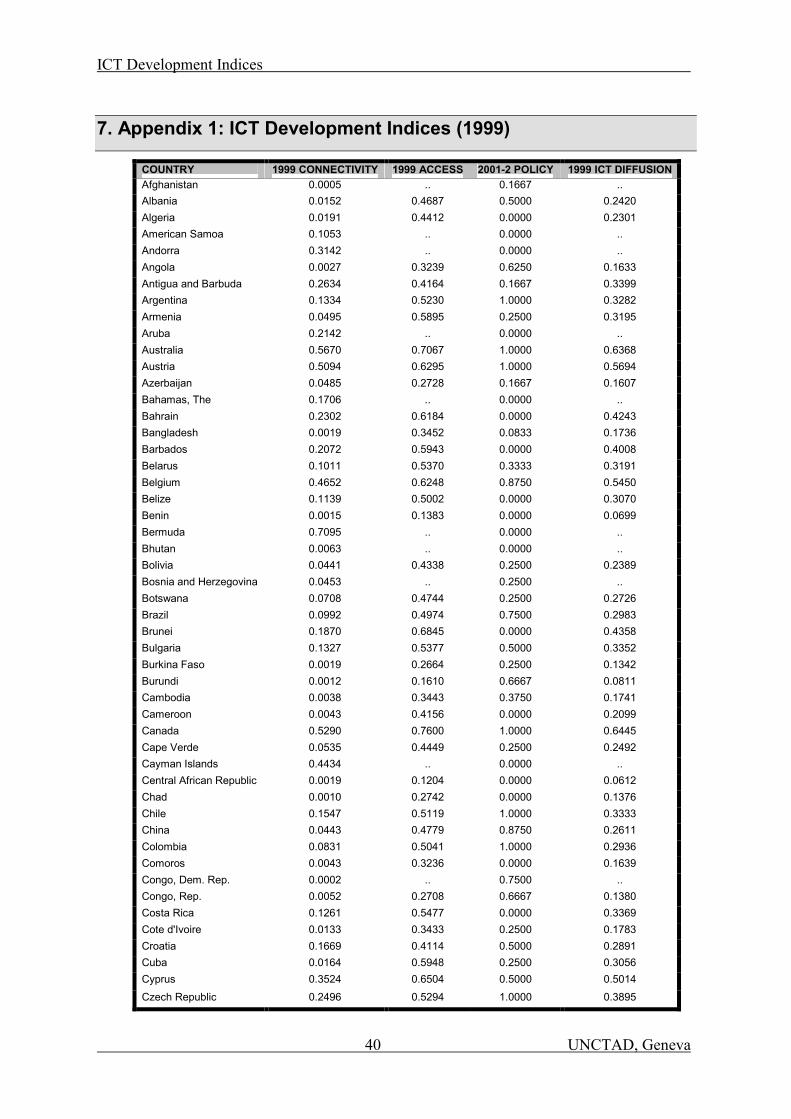
ICT Development Indices
40 UNCTAD, Geneva
7. Appendix 1: ICT Development Indices (1999)
COUNTRY 1999 CONNECTIVITY 1999 ACCESS 2001-2 POLICY 1999 ICT DIFFUSIONAfghanistan 0.0005 .. 0.1667 .. Albania 0.0152 0.4687 0.5000 0.2420 Algeria 0.0191 0.4412 0.0000 0.2301 American Samoa 0.1053 .. 0.0000 .. Andorra 0.3142 .. 0.0000 .. Angola 0.0027 0.3239 0.6250 0.1633 Antigua and Barbuda 0.2634 0.4164 0.1667 0.3399 Argentina 0.1334 0.5230 1.0000 0.3282 Armenia 0.0495 0.5895 0.2500 0.3195 Aruba 0.2142 .. 0.0000 .. Australia 0.5670 0.7067 1.0000 0.6368 Austria 0.5094 0.6295 1.0000 0.5694 Azerbaijan 0.0485 0.2728 0.1667 0.1607 Bahamas, The 0.1706 .. 0.0000 .. Bahrain 0.2302 0.6184 0.0000 0.4243 Bangladesh 0.0019 0.3452 0.0833 0.1736 Barbados 0.2072 0.5943 0.0000 0.4008 Belarus 0.1011 0.5370 0.3333 0.3191 Belgium 0.4652 0.6248 0.8750 0.5450 Belize 0.1139 0.5002 0.0000 0.3070 Benin 0.0015 0.1383 0.0000 0.0699 Bermuda 0.7095 .. 0.0000 .. Bhutan 0.0063 .. 0.0000 .. Bolivia 0.0441 0.4338 0.2500 0.2389 Bosnia and Herzegovina 0.0453 .. 0.2500 .. Botswana 0.0708 0.4744 0.2500 0.2726 Brazil 0.0992 0.4974 0.7500 0.2983 Brunei 0.1870 0.6845 0.0000 0.4358 Bulgaria 0.1327 0.5377 0.5000 0.3352 Burkina Faso 0.0019 0.2664 0.2500 0.1342 Burundi 0.0012 0.1610 0.6667 0.0811 Cambodia 0.0038 0.3443 0.3750 0.1741 Cameroon 0.0043 0.4156 0.0000 0.2099 Canada 0.5290 0.7600 1.0000 0.6445 Cape Verde 0.0535 0.4449 0.2500 0.2492 Cayman Islands 0.4434 .. 0.0000 .. Central African Republic 0.0019 0.1204 0.0000 0.0612 Chad 0.0010 0.2742 0.0000 0.1376 Chile 0.1547 0.5119 1.0000 0.3333 China 0.0443 0.4779 0.8750 0.2611 Colombia 0.0831 0.5041 1.0000 0.2936 Comoros 0.0043 0.3236 0.0000 0.1639 Congo, Dem. Rep. 0.0002 .. 0.7500 .. Congo, Rep. 0.0052 0.2708 0.6667 0.1380 Costa Rica 0.1261 0.5477 0.0000 0.3369 Cote d'Ivoire 0.0133 0.3433 0.2500 0.1783 Croatia 0.1669 0.4114 0.5000 0.2891 Cuba 0.0164 0.5948 0.2500 0.3056 Cyprus 0.3524 0.6504 0.5000 0.5014 Czech Republic 0.2496 0.5294 1.0000 0.3895
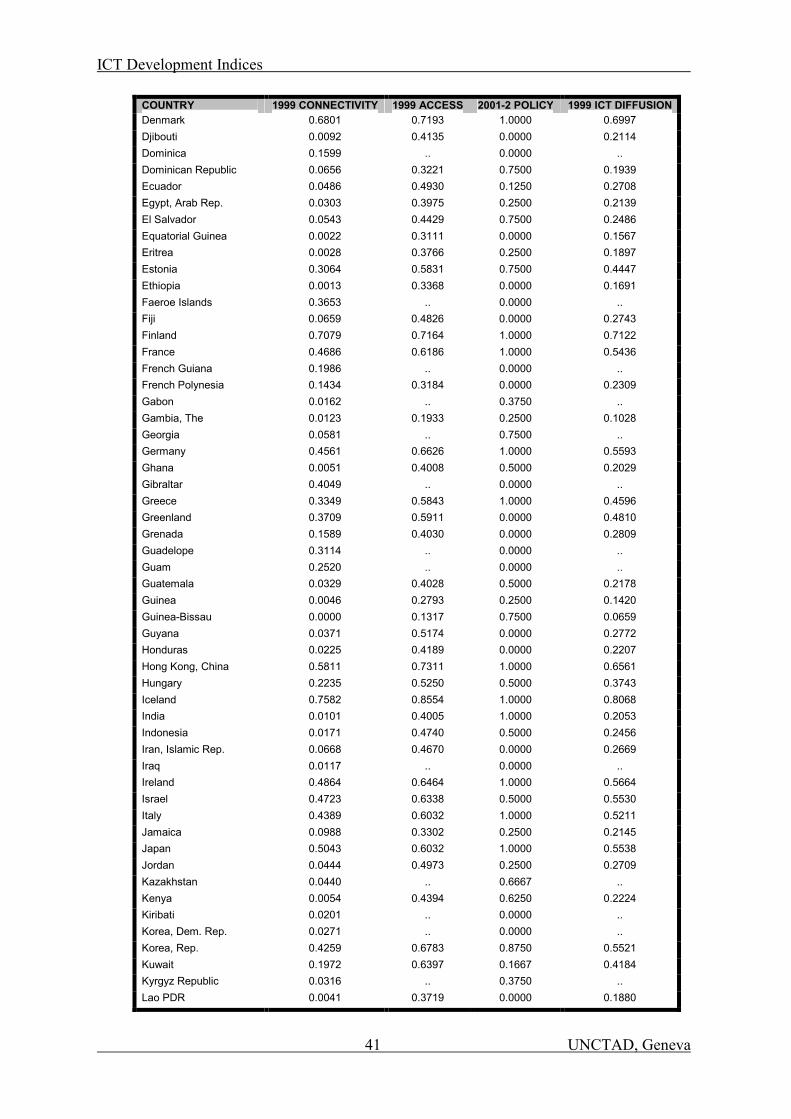
ICT Development Indices
41 UNCTAD, Geneva
COUNTRY 1999 CONNECTIVITY 1999 ACCESS 2001-2 POLICY 1999 ICT DIFFUSIONDenmark 0.6801 0.7193 1.0000 0.6997 Djibouti 0.0092 0.4135 0.0000 0.2114 Dominica 0.1599 .. 0.0000 .. Dominican Republic 0.0656 0.3221 0.7500 0.1939 Ecuador 0.0486 0.4930 0.1250 0.2708 Egypt, Arab Rep. 0.0303 0.3975 0.2500 0.2139 El Salvador 0.0543 0.4429 0.7500 0.2486 Equatorial Guinea 0.0022 0.3111 0.0000 0.1567 Eritrea 0.0028 0.3766 0.2500 0.1897 Estonia 0.3064 0.5831 0.7500 0.4447 Ethiopia 0.0013 0.3368 0.0000 0.1691 Faeroe Islands 0.3653 .. 0.0000 .. Fiji 0.0659 0.4826 0.0000 0.2743 Finland 0.7079 0.7164 1.0000 0.7122 France 0.4686 0.6186 1.0000 0.5436 French Guiana 0.1986 .. 0.0000 .. French Polynesia 0.1434 0.3184 0.0000 0.2309 Gabon 0.0162 .. 0.3750 .. Gambia, The 0.0123 0.1933 0.2500 0.1028 Georgia 0.0581 .. 0.7500 .. Germany 0.4561 0.6626 1.0000 0.5593 Ghana 0.0051 0.4008 0.5000 0.2029 Gibraltar 0.4049 .. 0.0000 .. Greece 0.3349 0.5843 1.0000 0.4596 Greenland 0.3709 0.5911 0.0000 0.4810 Grenada 0.1589 0.4030 0.0000 0.2809 Guadelope 0.3114 .. 0.0000 .. Guam 0.2520 .. 0.0000 .. Guatemala 0.0329 0.4028 0.5000 0.2178 Guinea 0.0046 0.2793 0.2500 0.1420 Guinea-Bissau 0.0000 0.1317 0.7500 0.0659 Guyana 0.0371 0.5174 0.0000 0.2772 Honduras 0.0225 0.4189 0.0000 0.2207 Hong Kong, China 0.5811 0.7311 1.0000 0.6561 Hungary 0.2235 0.5250 0.5000 0.3743 Iceland 0.7582 0.8554 1.0000 0.8068 India 0.0101 0.4005 1.0000 0.2053 Indonesia 0.0171 0.4740 0.5000 0.2456 Iran, Islamic Rep. 0.0668 0.4670 0.0000 0.2669 Iraq 0.0117 .. 0.0000 .. Ireland 0.4864 0.6464 1.0000 0.5664 Israel 0.4723 0.6338 0.5000 0.5530 Italy 0.4389 0.6032 1.0000 0.5211 Jamaica 0.0988 0.3302 0.2500 0.2145 Japan 0.5043 0.6032 1.0000 0.5538 Jordan 0.0444 0.4973 0.2500 0.2709 Kazakhstan 0.0440 .. 0.6667 .. Kenya 0.0054 0.4394 0.6250 0.2224 Kiribati 0.0201 .. 0.0000 .. Korea, Dem. Rep. 0.0271 .. 0.0000 .. Korea, Rep. 0.4259 0.6783 0.8750 0.5521 Kuwait 0.1972 0.6397 0.1667 0.4184 Kyrgyz Republic 0.0316 .. 0.3750 .. Lao PDR 0.0041 0.3719 0.0000 0.1880
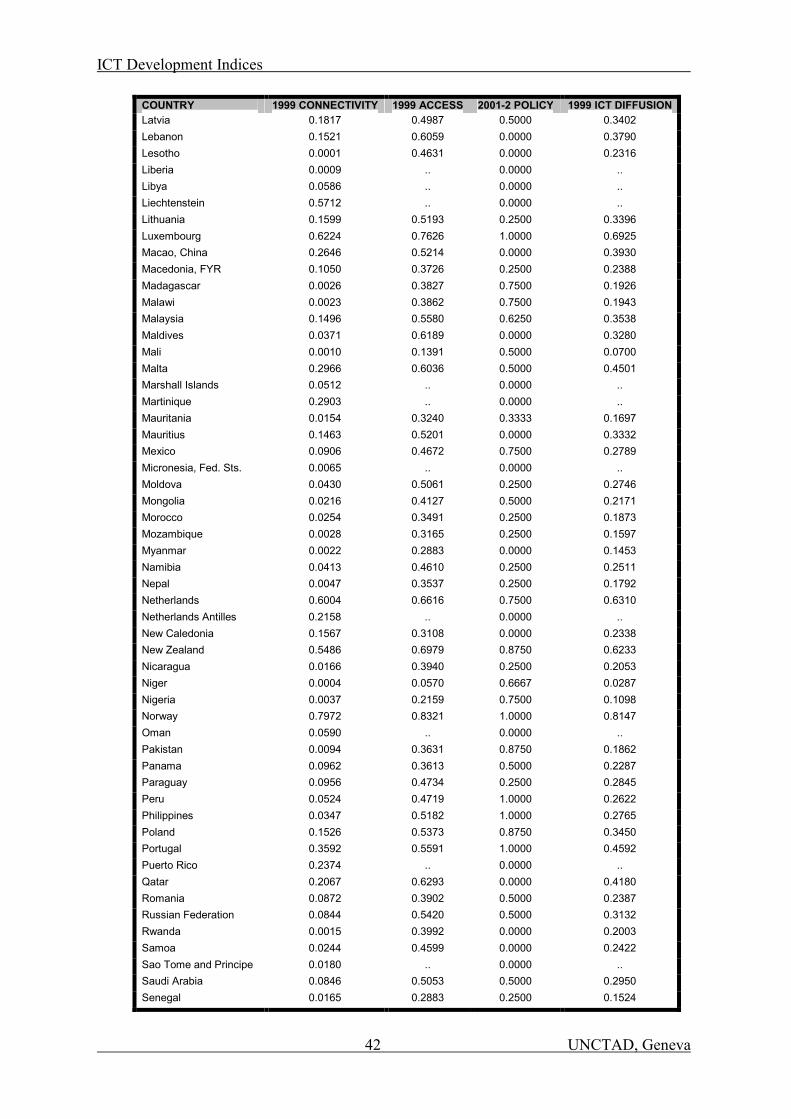
ICT Development Indices
42 UNCTAD, Geneva
COUNTRY 1999 CONNECTIVITY 1999 ACCESS 2001-2 POLICY 1999 ICT DIFFUSIONLatvia 0.1817 0.4987 0.5000 0.3402 Lebanon 0.1521 0.6059 0.0000 0.3790 Lesotho 0.0001 0.4631 0.0000 0.2316 Liberia 0.0009 .. 0.0000 .. Libya 0.0586 .. 0.0000 .. Liechtenstein 0.5712 .. 0.0000 .. Lithuania 0.1599 0.5193 0.2500 0.3396 Luxembourg 0.6224 0.7626 1.0000 0.6925 Macao, China 0.2646 0.5214 0.0000 0.3930 Macedonia, FYR 0.1050 0.3726 0.2500 0.2388 Madagascar 0.0026 0.3827 0.7500 0.1926 Malawi 0.0023 0.3862 0.7500 0.1943 Malaysia 0.1496 0.5580 0.6250 0.3538 Maldives 0.0371 0.6189 0.0000 0.3280 Mali 0.0010 0.1391 0.5000 0.0700 Malta 0.2966 0.6036 0.5000 0.4501 Marshall Islands 0.0512 .. 0.0000 .. Martinique 0.2903 .. 0.0000 .. Mauritania 0.0154 0.3240 0.3333 0.1697 Mauritius 0.1463 0.5201 0.0000 0.3332 Mexico 0.0906 0.4672 0.7500 0.2789 Micronesia, Fed. Sts. 0.0065 .. 0.0000 .. Moldova 0.0430 0.5061 0.2500 0.2746 Mongolia 0.0216 0.4127 0.5000 0.2171 Morocco 0.0254 0.3491 0.2500 0.1873 Mozambique 0.0028 0.3165 0.2500 0.1597 Myanmar 0.0022 0.2883 0.0000 0.1453 Namibia 0.0413 0.4610 0.2500 0.2511 Nepal 0.0047 0.3537 0.2500 0.1792 Netherlands 0.6004 0.6616 0.7500 0.6310 Netherlands Antilles 0.2158 .. 0.0000 .. New Caledonia 0.1567 0.3108 0.0000 0.2338 New Zealand 0.5486 0.6979 0.8750 0.6233 Nicaragua 0.0166 0.3940 0.2500 0.2053 Niger 0.0004 0.0570 0.6667 0.0287 Nigeria 0.0037 0.2159 0.7500 0.1098 Norway 0.7972 0.8321 1.0000 0.8147 Oman 0.0590 .. 0.0000 .. Pakistan 0.0094 0.3631 0.8750 0.1862 Panama 0.0962 0.3613 0.5000 0.2287 Paraguay 0.0956 0.4734 0.2500 0.2845 Peru 0.0524 0.4719 1.0000 0.2622 Philippines 0.0347 0.5182 1.0000 0.2765 Poland 0.1526 0.5373 0.8750 0.3450 Portugal 0.3592 0.5591 1.0000 0.4592 Puerto Rico 0.2374 .. 0.0000 .. Qatar 0.2067 0.6293 0.0000 0.4180 Romania 0.0872 0.3902 0.5000 0.2387 Russian Federation 0.0844 0.5420 0.5000 0.3132 Rwanda 0.0015 0.3992 0.0000 0.2003 Samoa 0.0244 0.4599 0.0000 0.2422 Sao Tome and Principe 0.0180 .. 0.0000 .. Saudi Arabia 0.0846 0.5053 0.5000 0.2950 Senegal 0.0165 0.2883 0.2500 0.1524
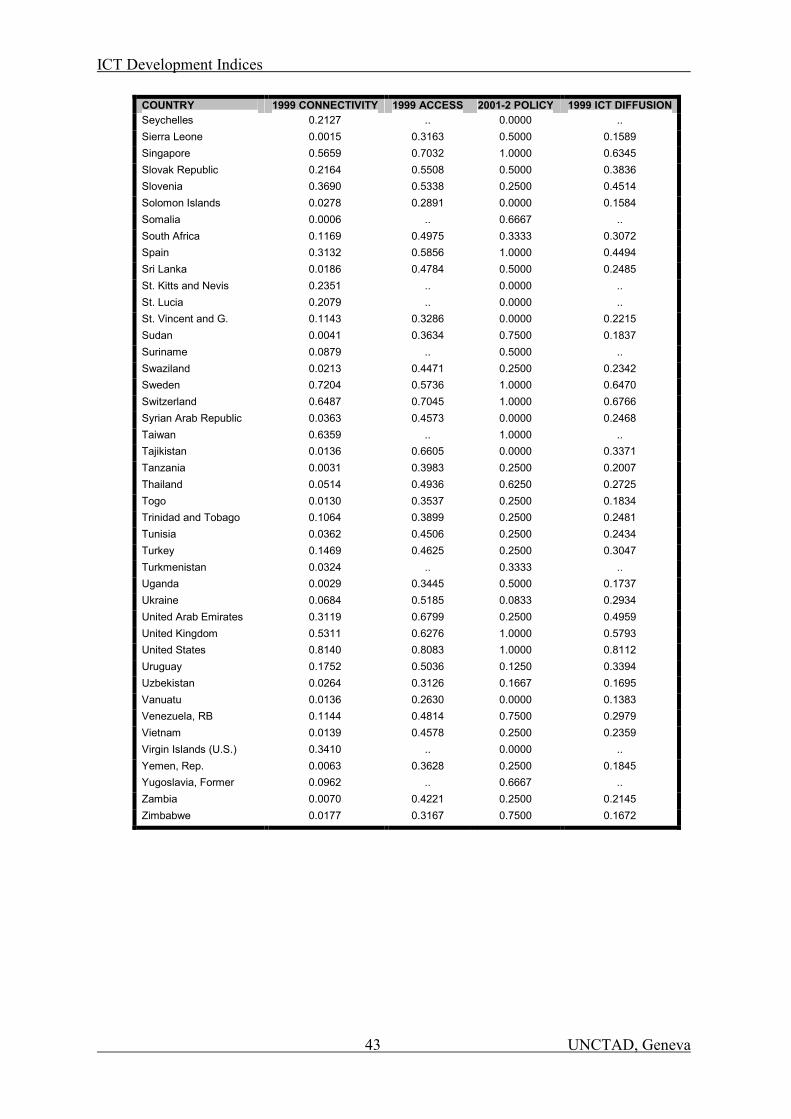
ICT Development Indices
43 UNCTAD, Geneva
COUNTRY 1999 CONNECTIVITY 1999 ACCESS 2001-2 POLICY 1999 ICT DIFFUSIONSeychelles 0.2127 .. 0.0000 .. Sierra Leone 0.0015 0.3163 0.5000 0.1589 Singapore 0.5659 0.7032 1.0000 0.6345 Slovak Republic 0.2164 0.5508 0.5000 0.3836 Slovenia 0.3690 0.5338 0.2500 0.4514 Solomon Islands 0.0278 0.2891 0.0000 0.1584 Somalia 0.0006 .. 0.6667 .. South Africa 0.1169 0.4975 0.3333 0.3072 Spain 0.3132 0.5856 1.0000 0.4494 Sri Lanka 0.0186 0.4784 0.5000 0.2485 St. Kitts and Nevis 0.2351 .. 0.0000 .. St. Lucia 0.2079 .. 0.0000 .. St. Vincent and G. 0.1143 0.3286 0.0000 0.2215 Sudan 0.0041 0.3634 0.7500 0.1837 Suriname 0.0879 .. 0.5000 .. Swaziland 0.0213 0.4471 0.2500 0.2342 Sweden 0.7204 0.5736 1.0000 0.6470 Switzerland 0.6487 0.7045 1.0000 0.6766 Syrian Arab Republic 0.0363 0.4573 0.0000 0.2468 Taiwan 0.6359 .. 1.0000 .. Tajikistan 0.0136 0.6605 0.0000 0.3371 Tanzania 0.0031 0.3983 0.2500 0.2007 Thailand 0.0514 0.4936 0.6250 0.2725 Togo 0.0130 0.3537 0.2500 0.1834 Trinidad and Tobago 0.1064 0.3899 0.2500 0.2481 Tunisia 0.0362 0.4506 0.2500 0.2434 Turkey 0.1469 0.4625 0.2500 0.3047 Turkmenistan 0.0324 .. 0.3333 .. Uganda 0.0029 0.3445 0.5000 0.1737 Ukraine 0.0684 0.5185 0.0833 0.2934 United Arab Emirates 0.3119 0.6799 0.2500 0.4959 United Kingdom 0.5311 0.6276 1.0000 0.5793 United States 0.8140 0.8083 1.0000 0.8112 Uruguay 0.1752 0.5036 0.1250 0.3394 Uzbekistan 0.0264 0.3126 0.1667 0.1695 Vanuatu 0.0136 0.2630 0.0000 0.1383 Venezuela, RB 0.1144 0.4814 0.7500 0.2979 Vietnam 0.0139 0.4578 0.2500 0.2359 Virgin Islands (U.S.) 0.3410 .. 0.0000 .. Yemen, Rep. 0.0063 0.3628 0.2500 0.1845 Yugoslavia, Former 0.0962 .. 0.6667 .. Zambia 0.0070 0.4221 0.2500 0.2145 Zimbabwe 0.0177 0.3167 0.7500 0.1672
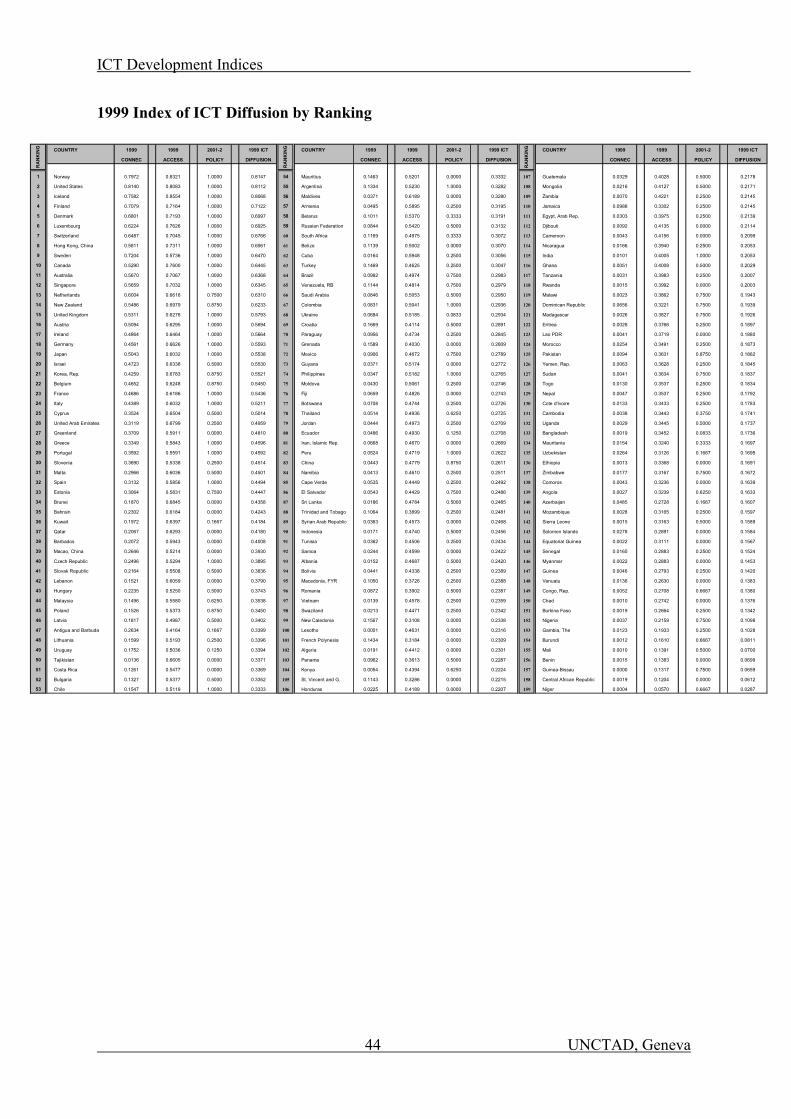
ICT Development Indices
44 UNCTAD, Geneva
1999 Index of ICT Diffusion by Ranking
COUNTRY 1999 1999 2001-2 1999 ICT COUNTRY 1999 1999 2001-2 1999 ICT COUNTRY 1999 1999 2001-2 1999 ICT
CONNEC ACCESS POLICY DIFFUSION CONNEC ACCESS POLICY DIFFUSION CONNEC ACCESS POLICY DIFFUSION
1 Norway 0.7972 0.8321 1.0000 0.8147 54 Mauritius 0.1463 0.5201 0.0000 0.3332 107 Guatemala 0.0329 0.4028 0.5000 0.2178
2 United States 0.8140 0.8083 1.0000 0.8112 55 Argentina 0.1334 0.5230 1.0000 0.3282 108 Mongolia 0.0216 0.4127 0.5000 0.2171
3 Iceland 0.7582 0.8554 1.0000 0.8068 56 Maldives 0.0371 0.6189 0.0000 0.3280 109 Zambia 0.0070 0.4221 0.2500 0.2145
4 Finland 0.7079 0.7164 1.0000 0.7122 57 Armenia 0.0495 0.5895 0.2500 0.3195 110 Jamaica 0.0988 0.3302 0.2500 0.2145
5 Denmark 0.6801 0.7193 1.0000 0.6997 58 Belarus 0.1011 0.5370 0.3333 0.3191 111 Egypt, Arab Rep. 0.0303 0.3975 0.2500 0.2139
6 Luxembourg 0.6224 0.7626 1.0000 0.6925 59 Russian Federation 0.0844 0.5420 0.5000 0.3132 112 Djibouti 0.0092 0.4135 0.0000 0.2114
7 Switzerland 0.6487 0.7045 1.0000 0.6766 60 South Africa 0.1169 0.4975 0.3333 0.3072 113 Cameroon 0.0043 0.4156 0.0000 0.2099
8 Hong Kong, China 0.5811 0.7311 1.0000 0.6561 61 Belize 0.1139 0.5002 0.0000 0.3070 114 Nicaragua 0.0166 0.3940 0.2500 0.2053
9 Sweden 0.7204 0.5736 1.0000 0.6470 62 Cuba 0.0164 0.5948 0.2500 0.3056 115 India 0.0101 0.4005 1.0000 0.2053
10 Canada 0.5290 0.7600 1.0000 0.6445 63 Turkey 0.1469 0.4625 0.2500 0.3047 116 Ghana 0.0051 0.4008 0.5000 0.2029
11 Australia 0.5670 0.7067 1.0000 0.6368 64 Brazil 0.0992 0.4974 0.7500 0.2983 117 Tanzania 0.0031 0.3983 0.2500 0.2007
12 Singapore 0.5659 0.7032 1.0000 0.6345 65 Venezuela, RB 0.1144 0.4814 0.7500 0.2979 118 Rwanda 0.0015 0.3992 0.0000 0.2003
13 Netherlands 0.6004 0.6616 0.7500 0.6310 66 Saudi Arabia 0.0846 0.5053 0.5000 0.2950 119 Malawi 0.0023 0.3862 0.7500 0.1943
14 New Zealand 0.5486 0.6979 0.8750 0.6233 67 Colombia 0.0831 0.5041 1.0000 0.2936 120 Dominican Republic 0.0656 0.3221 0.7500 0.1939
15 United Kingdom 0.5311 0.6276 1.0000 0.5793 68 Ukraine 0.0684 0.5185 0.0833 0.2934 121 Madagascar 0.0026 0.3827 0.7500 0.1926
16 Austria 0.5094 0.6295 1.0000 0.5694 69 Croatia 0.1669 0.4114 0.5000 0.2891 122 Eritrea 0.0028 0.3766 0.2500 0.1897
17 Ireland 0.4864 0.6464 1.0000 0.5664 70 Paraguay 0.0956 0.4734 0.2500 0.2845 123 Lao PDR 0.0041 0.3719 0.0000 0.1880
18 Germany 0.4561 0.6626 1.0000 0.5593 71 Grenada 0.1589 0.4030 0.0000 0.2809 124 Morocco 0.0254 0.3491 0.2500 0.1873
19 Japan 0.5043 0.6032 1.0000 0.5538 72 Mexico 0.0906 0.4672 0.7500 0.2789 125 Pakistan 0.0094 0.3631 0.8750 0.1862
20 Israel 0.4723 0.6338 0.5000 0.5530 73 Guyana 0.0371 0.5174 0.0000 0.2772 126 Yemen, Rep. 0.0063 0.3628 0.2500 0.1845
21 Korea, Rep. 0.4259 0.6783 0.8750 0.5521 74 Philippines 0.0347 0.5182 1.0000 0.2765 127 Sudan 0.0041 0.3634 0.7500 0.1837
22 Belgium 0.4652 0.6248 0.8750 0.5450 75 Moldova 0.0430 0.5061 0.2500 0.2746 128 Togo 0.0130 0.3537 0.2500 0.1834
23 France 0.4686 0.6186 1.0000 0.5436 76 Fiji 0.0659 0.4826 0.0000 0.2743 129 Nepal 0.0047 0.3537 0.2500 0.1792
24 Italy 0.4389 0.6032 1.0000 0.5211 77 Botswana 0.0708 0.4744 0.2500 0.2726 130 Cote d'Ivoire 0.0133 0.3433 0.2500 0.1783
25 Cyprus 0.3524 0.6504 0.5000 0.5014 78 Thailand 0.0514 0.4936 0.6250 0.2725 131 Cambodia 0.0038 0.3443 0.3750 0.1741
26 United Arab Emirates 0.3119 0.6799 0.2500 0.4959 79 Jordan 0.0444 0.4973 0.2500 0.2709 132 Uganda 0.0029 0.3445 0.5000 0.1737
27 Greenland 0.3709 0.5911 0.0000 0.4810 80 Ecuador 0.0486 0.4930 0.1250 0.2708 133 Bangladesh 0.0019 0.3452 0.0833 0.1736
28 Greece 0.3349 0.5843 1.0000 0.4596 81 Iran, Islamic Rep. 0.0668 0.4670 0.0000 0.2669 134 Mauritania 0.0154 0.3240 0.3333 0.1697
29 Portugal 0.3592 0.5591 1.0000 0.4592 82 Peru 0.0524 0.4719 1.0000 0.2622 135 Uzbekistan 0.0264 0.3126 0.1667 0.1695
30 Slovenia 0.3690 0.5338 0.2500 0.4514 83 China 0.0443 0.4779 0.8750 0.2611 136 Ethiopia 0.0013 0.3368 0.0000 0.1691
31 Malta 0.2966 0.6036 0.5000 0.4501 84 Namibia 0.0413 0.4610 0.2500 0.2511 137 Zimbabwe 0.0177 0.3167 0.7500 0.1672
32 Spain 0.3132 0.5856 1.0000 0.4494 85 Cape Verde 0.0535 0.4449 0.2500 0.2492 138 Comoros 0.0043 0.3236 0.0000 0.1639
33 Estonia 0.3064 0.5831 0.7500 0.4447 86 El Salvador 0.0543 0.4429 0.7500 0.2486 139 Angola 0.0027 0.3239 0.6250 0.1633
34 Brunei 0.1870 0.6845 0.0000 0.4358 87 Sri Lanka 0.0186 0.4784 0.5000 0.2485 140 Azerbaijan 0.0485 0.2728 0.1667 0.1607
35 Bahrain 0.2302 0.6184 0.0000 0.4243 88 Trinidad and Tobago 0.1064 0.3899 0.2500 0.2481 141 Mozambique 0.0028 0.3165 0.2500 0.1597
36 Kuwait 0.1972 0.6397 0.1667 0.4184 89 Syrian Arab Republic 0.0363 0.4573 0.0000 0.2468 142 Sierra Leone 0.0015 0.3163 0.5000 0.1589
37 Qatar 0.2067 0.6293 0.0000 0.4180 90 Indonesia 0.0171 0.4740 0.5000 0.2456 143 Solomon Islands 0.0278 0.2891 0.0000 0.1584
38 Barbados 0.2072 0.5943 0.0000 0.4008 91 Tunisia 0.0362 0.4506 0.2500 0.2434 144 Equatorial Guinea 0.0022 0.3111 0.0000 0.1567
39 Macao, China 0.2646 0.5214 0.0000 0.3930 92 Samoa 0.0244 0.4599 0.0000 0.2422 145 Senegal 0.0165 0.2883 0.2500 0.1524
40 Czech Republic 0.2496 0.5294 1.0000 0.3895 93 Albania 0.0152 0.4687 0.5000 0.2420 146 Myanmar 0.0022 0.2883 0.0000 0.1453
41 Slovak Republic 0.2164 0.5508 0.5000 0.3836 94 Bolivia 0.0441 0.4338 0.2500 0.2389 147 Guinea 0.0046 0.2793 0.2500 0.1420
42 Lebanon 0.1521 0.6059 0.0000 0.3790 95 Macedonia, FYR 0.1050 0.3726 0.2500 0.2388 148 Vanuatu 0.0136 0.2630 0.0000 0.1383
43 Hungary 0.2235 0.5250 0.5000 0.3743 96 Romania 0.0872 0.3902 0.5000 0.2387 149 Congo, Rep. 0.0052 0.2708 0.6667 0.1380
44 Malaysia 0.1496 0.5580 0.6250 0.3538 97 Vietnam 0.0139 0.4578 0.2500 0.2359 150 Chad 0.0010 0.2742 0.0000 0.1376
45 Poland 0.1526 0.5373 0.8750 0.3450 98 Swaziland 0.0213 0.4471 0.2500 0.2342 151 Burkina Faso 0.0019 0.2664 0.2500 0.1342
46 Latvia 0.1817 0.4987 0.5000 0.3402 99 New Caledonia 0.1567 0.3108 0.0000 0.2338 152 Nigeria 0.0037 0.2159 0.7500 0.1098
47 Antigua and Barbuda 0.2634 0.4164 0.1667 0.3399 100 Lesotho 0.0001 0.4631 0.0000 0.2316 153 Gambia, The 0.0123 0.1933 0.2500 0.1028
48 Lithuania 0.1599 0.5193 0.2500 0.3396 101 French Polynesia 0.1434 0.3184 0.0000 0.2309 154 Burundi 0.0012 0.1610 0.6667 0.0811
49 Uruguay 0.1752 0.5036 0.1250 0.3394 102 Algeria 0.0191 0.4412 0.0000 0.2301 155 Mali 0.0010 0.1391 0.5000 0.0700
50 Tajikistan 0.0136 0.6605 0.0000 0.3371 103 Panama 0.0962 0.3613 0.5000 0.2287 156 Benin 0.0015 0.1383 0.0000 0.0699
51 Costa Rica 0.1261 0.5477 0.0000 0.3369 104 Kenya 0.0054 0.4394 0.6250 0.2224 157 Guinea-Bissau 0.0000 0.1317 0.7500 0.0659
52 Bulgaria 0.1327 0.5377 0.5000 0.3352 105 St. Vincent and G. 0.1143 0.3286 0.0000 0.2215 158 Central African Republic 0.0019 0.1204 0.0000 0.0612
53 Chile 0.1547 0.5119 1.0000 0.3333 106 Honduras 0.0225 0.4189 0.0000 0.2207 159 Niger 0.0004 0.0570 0.6667 0.0287
RA
NK
ING
RA
NK
ING
RA
NK
ING
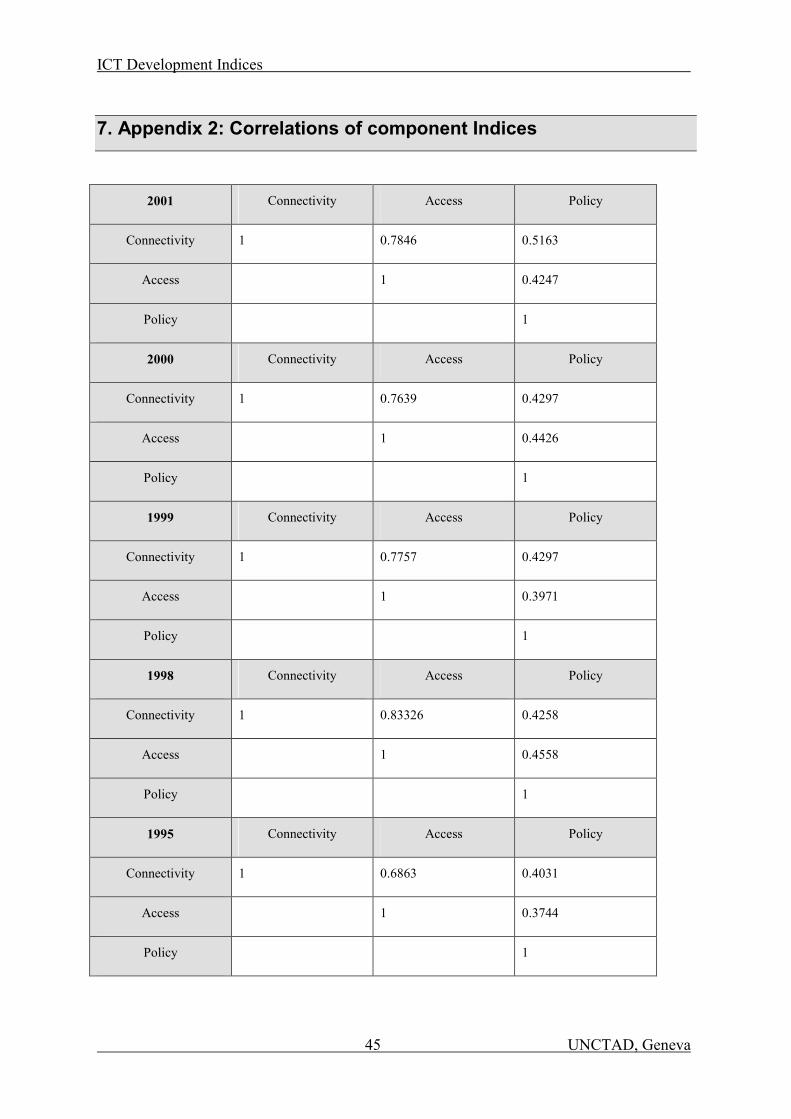
ICT Development Indices
45 UNCTAD, Geneva
7. Appendix 2: Correlations of component Indices
2001 Connectivity Access Policy
Connectivity 1 0.7846 0.5163
Access 1 0.4247
Policy 1
2000 Connectivity Access Policy
Connectivity 1 0.7639 0.4297
Access 1 0.4426
Policy 1
1999 Connectivity Access Policy
Connectivity 1 0.7757 0.4297
Access 1 0.3971
Policy 1
1998 Connectivity Access Policy
Connectivity 1 0.83326 0.4258
Access 1 0.4558
Policy 1
1995 Connectivity Access Policy
Connectivity 1 0.6863 0.4031
Access 1 0.3744
Policy 1
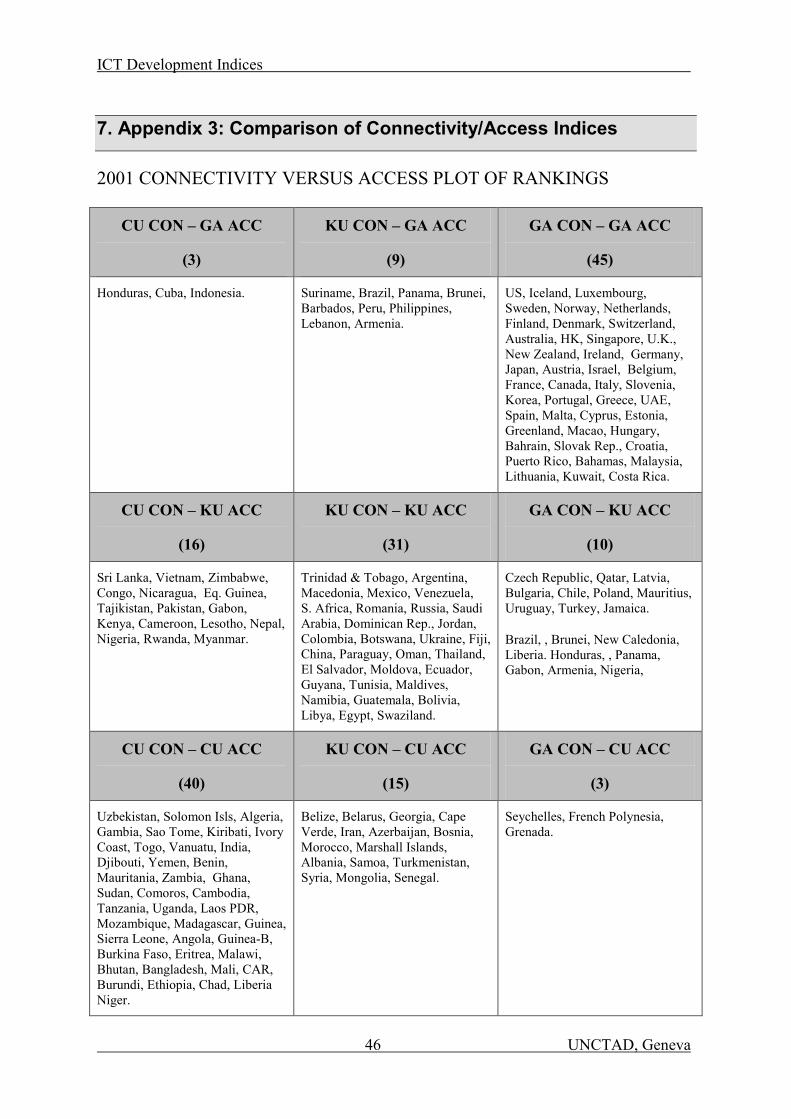
ICT Development Indices
46 UNCTAD, Geneva
7. Appendix 3: Comparison of Connectivity/Access Indices
2001 CONNECTIVITY VERSUS ACCESS PLOT OF RANKINGS
CU CON – GA ACC
(3)
KU CON – GA ACC
(9)
GA CON – GA ACC
(45)
Honduras, Cuba, Indonesia. Suriname, Brazil, Panama, Brunei, Barbados, Peru, Philippines, Lebanon, Armenia.
US, Iceland, Luxembourg, Sweden, Norway, Netherlands, Finland, Denmark, Switzerland, Australia, HK, Singapore, U.K., New Zealand, Ireland, Germany, Japan, Austria, Israel, Belgium, France, Canada, Italy, Slovenia, Korea, Portugal, Greece, UAE, Spain, Malta, Cyprus, Estonia, Greenland, Macao, Hungary, Bahrain, Slovak Rep., Croatia, Puerto Rico, Bahamas, Malaysia, Lithuania, Kuwait, Costa Rica.
CU CON – KU ACC
(16)
KU CON – KU ACC
(31)
GA CON – KU ACC
(10)
Sri Lanka, Vietnam, Zimbabwe, Congo, Nicaragua, Eq. Guinea, Tajikistan, Pakistan, Gabon, Kenya, Cameroon, Lesotho, Nepal, Nigeria, Rwanda, Myanmar.
Trinidad & Tobago, Argentina, Macedonia, Mexico, Venezuela, S. Africa, Romania, Russia, Saudi Arabia, Dominican Rep., Jordan, Colombia, Botswana, Ukraine, Fiji, China, Paraguay, Oman, Thailand, El Salvador, Moldova, Ecuador, Guyana, Tunisia, Maldives, Namibia, Guatemala, Bolivia, Libya, Egypt, Swaziland.
Czech Republic, Qatar, Latvia, Bulgaria, Chile, Poland, Mauritius, Uruguay, Turkey, Jamaica.
Brazil, , Brunei, New Caledonia, Liberia. Honduras, , Panama, Gabon, Armenia, Nigeria,
CU CON – CU ACC
(40)
KU CON – CU ACC
(15)
GA CON – CU ACC
(3)
Uzbekistan, Solomon Isls, Algeria, Gambia, Sao Tome, Kiribati, Ivory Coast, Togo, Vanuatu, India, Djibouti, Yemen, Benin, Mauritania, Zambia, Ghana, Sudan, Comoros, Cambodia, Tanzania, Uganda, Laos PDR, Mozambique, Madagascar, Guinea, Sierra Leone, Angola, Guinea-B, Burkina Faso, Eritrea, Malawi, Bhutan, Bangladesh, Mali, CAR, Burundi, Ethiopia, Chad, Liberia Niger.
Belize, Belarus, Georgia, Cape Verde, Iran, Azerbaijan, Bosnia, Morocco, Marshall Islands, Albania, Samoa, Turkmenistan, Syria, Mongolia, Senegal.
Seychelles, French Polynesia, Grenada.
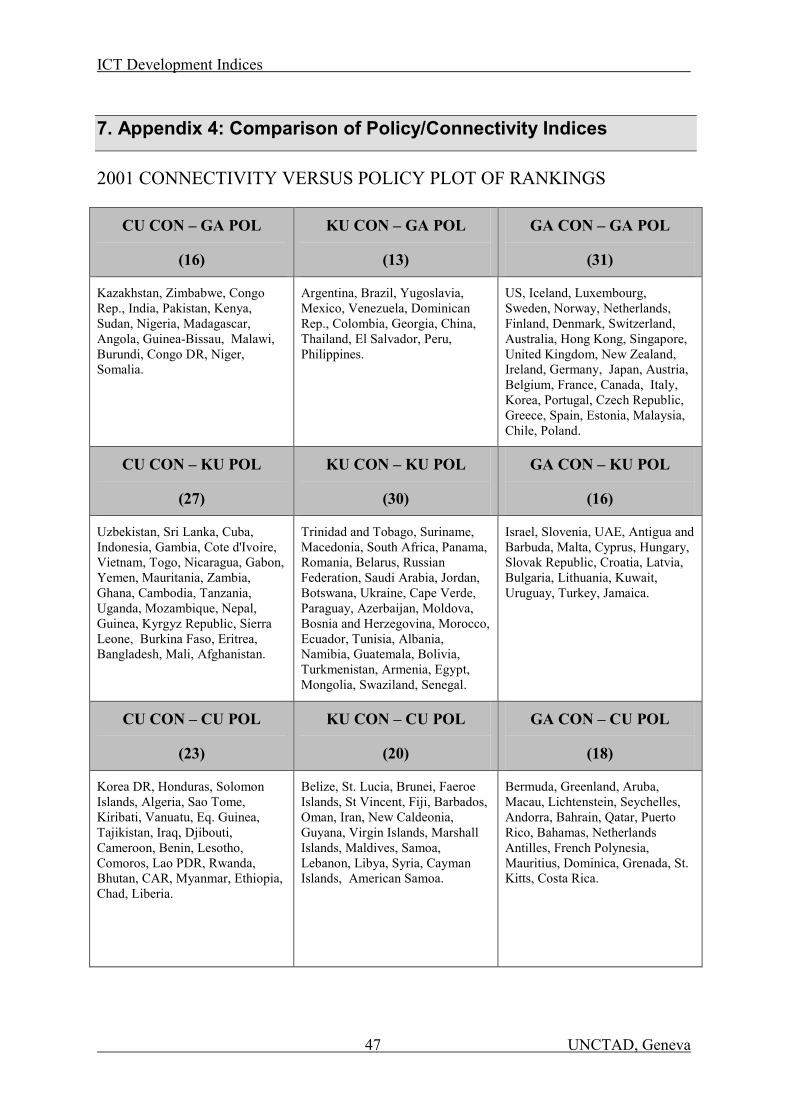
ICT Development Indices
47 UNCTAD, Geneva
7. Appendix 4: Comparison of Policy/Connectivity Indices
2001 CONNECTIVITY VERSUS POLICY PLOT OF RANKINGS
CU CON – GA POL
(16)
KU CON – GA POL
(13)
GA CON – GA POL
(31)
Kazakhstan, Zimbabwe, Congo Rep., India, Pakistan, Kenya, Sudan, Nigeria, Madagascar, Angola, Guinea-Bissau, Malawi, Burundi, Congo DR, Niger, Somalia.
Argentina, Brazil, Yugoslavia, Mexico, Venezuela, Dominican Rep., Colombia, Georgia, China, Thailand, El Salvador, Peru, Philippines.
US, Iceland, Luxembourg, Sweden, Norway, Netherlands, Finland, Denmark, Switzerland, Australia, Hong Kong, Singapore, United Kingdom, New Zealand, Ireland, Germany, Japan, Austria, Belgium, France, Canada, Italy, Korea, Portugal, Czech Republic, Greece, Spain, Estonia, Malaysia, Chile, Poland.
CU CON – KU POL
(27)
KU CON – KU POL
(30)
GA CON – KU POL
(16)
Uzbekistan, Sri Lanka, Cuba, Indonesia, Gambia, Cote d'Ivoire, Vietnam, Togo, Nicaragua, Gabon, Yemen, Mauritania, Zambia, Ghana, Cambodia, Tanzania, Uganda, Mozambique, Nepal, Guinea, Kyrgyz Republic, Sierra Leone, Burkina Faso, Eritrea, Bangladesh, Mali, Afghanistan.
Trinidad and Tobago, Suriname, Macedonia, South Africa, Panama, Romania, Belarus, Russian Federation, Saudi Arabia, Jordan, Botswana, Ukraine, Cape Verde, Paraguay, Azerbaijan, Moldova, Bosnia and Herzegovina, Morocco, Ecuador, Tunisia, Albania, Namibia, Guatemala, Bolivia, Turkmenistan, Armenia, Egypt, Mongolia, Swaziland, Senegal.
Israel, Slovenia, UAE, Antigua and Barbuda, Malta, Cyprus, Hungary, Slovak Republic, Croatia, Latvia, Bulgaria, Lithuania, Kuwait, Uruguay, Turkey, Jamaica.
CU CON – CU POL
(23)
KU CON – CU POL
(20)
GA CON – CU POL
(18)
Korea DR, Honduras, Solomon Islands, Algeria, Sao Tome, Kiribati, Vanuatu, Eq. Guinea, Tajikistan, Iraq, Djibouti, Cameroon, Benin, Lesotho, Comoros, Lao PDR, Rwanda, Bhutan, CAR, Myanmar, Ethiopia, Chad, Liberia.
Belize, St. Lucia, Brunei, Faeroe Islands, St Vincent, Fiji, Barbados, Oman, Iran, New Caldeonia, Guyana, Virgin Islands, Marshall Islands, Maldives, Samoa, Lebanon, Libya, Syria, Cayman Islands, American Samoa.
Bermuda, Greenland, Aruba, Macau, Lichtenstein, Seychelles, Andorra, Bahrain, Qatar, Puerto Rico, Bahamas, Netherlands Antilles, French Polynesia, Mauritius, Dominica, Grenada, St. Kitts, Costa Rica.
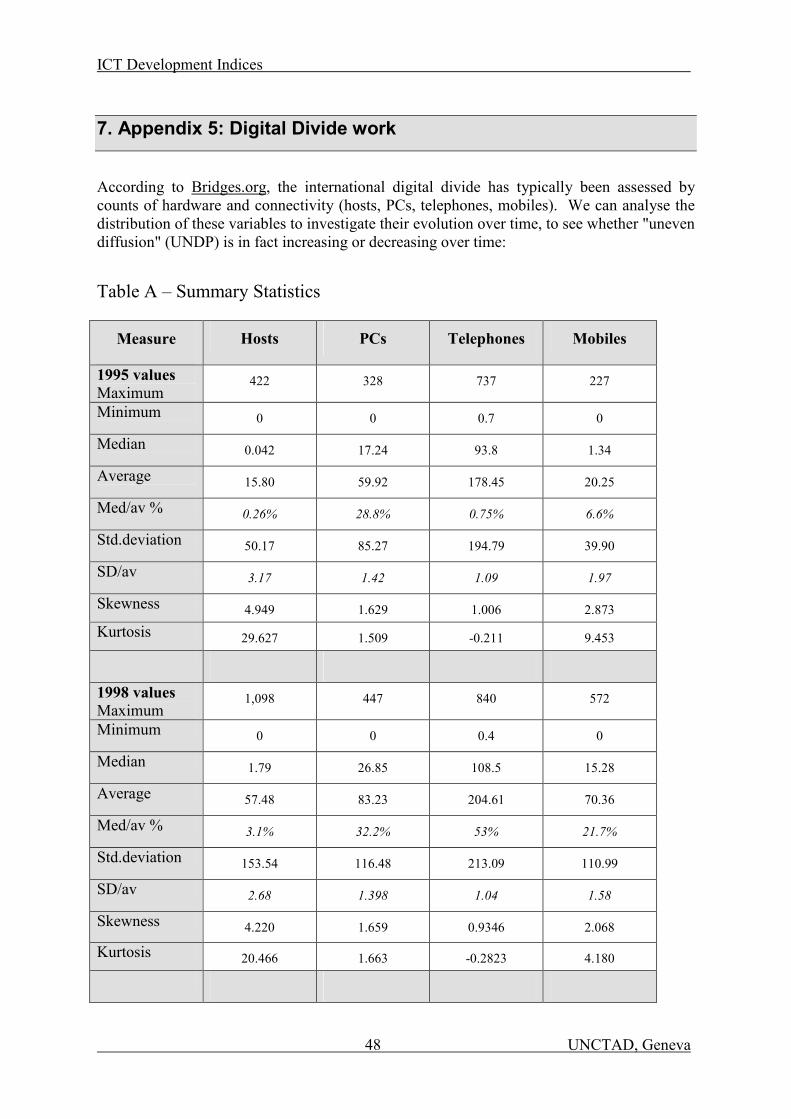
ICT Development Indices
48 UNCTAD, Geneva
7. Appendix 5: Digital Divide work
According to Bridges.org, the international digital divide has typically been assessed by counts of hardware and connectivity (hosts, PCs, telephones, mobiles). We can analyse the distribution of these variables to investigate their evolution over time, to see whether "uneven diffusion" (UNDP) is in fact increasing or decreasing over time: Table A – Summary Statistics
Measure Hosts PCs Telephones Mobiles
1995 values Maximum
422 328 737 227
Minimum 0 0 0.7 0
Median 0.042 17.24 93.8 1.34
Average 15.80 59.92 178.45 20.25
Med/av % 0.26% 28.8% 0.75% 6.6%
Std.deviation 50.17 85.27 194.79 39.90
SD/av 3.17 1.42 1.09 1.97
Skewness 4.949 1.629 1.006 2.873
Kurtosis 29.627 1.509 -0.211 9.453
1998 values Maximum
1,098 447 840 572
Minimum 0 0 0.4 0
Median 1.79 26.85 108.5 15.28
Average 57.48 83.23 204.61 70.36
Med/av % 3.1% 32.2% 53% 21.7%
Std.deviation 153.54 116.48 213.09 110.99
SD/av 2.68 1.398 1.04 1.58
Skewness 4.220 1.659 0.9346 2.068
Kurtosis 20.466 1.663 -0.2823 4.180
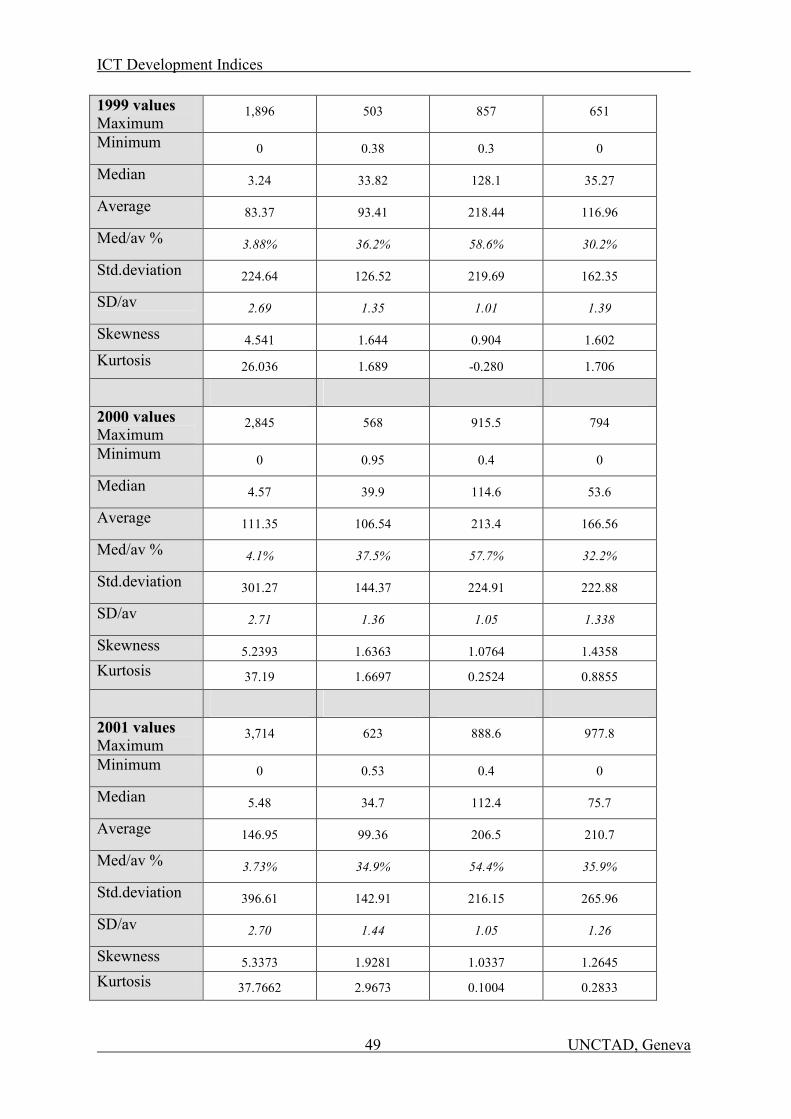
ICT Development Indices
49 UNCTAD, Geneva
1999 values Maximum
1,896 503 857 651
Minimum 0 0.38 0.3 0
Median 3.24 33.82 128.1 35.27
Average 83.37 93.41 218.44 116.96
Med/av % 3.88% 36.2% 58.6% 30.2%
Std.deviation 224.64 126.52 219.69 162.35
SD/av 2.69 1.35 1.01 1.39
Skewness 4.541 1.644 0.904 1.602 Kurtosis 26.036 1.689 -0.280 1.706
2000 values Maximum
2,845 568 915.5 794
Minimum 0 0.95 0.4 0
Median 4.57 39.9 114.6 53.6
Average 111.35 106.54 213.4 166.56
Med/av % 4.1% 37.5% 57.7% 32.2%
Std.deviation 301.27 144.37 224.91 222.88
SD/av 2.71 1.36 1.05 1.338
Skewness 5.2393 1.6363 1.0764 1.4358 Kurtosis 37.19 1.6697 0.2524 0.8855
2001 values Maximum
3,714 623 888.6 977.8
Minimum 0 0.53 0.4 0
Median 5.48 34.7 112.4 75.7
Average 146.95 99.36 206.5 210.7
Med/av % 3.73% 34.9% 54.4% 35.9%
Std.deviation 396.61 142.91 216.15 265.96
SD/av 2.70 1.44 1.05 1.26
Skewness 5.3373 1.9281 1.0337 1.2645 Kurtosis 37.7662 2.9673 0.1004 0.2833
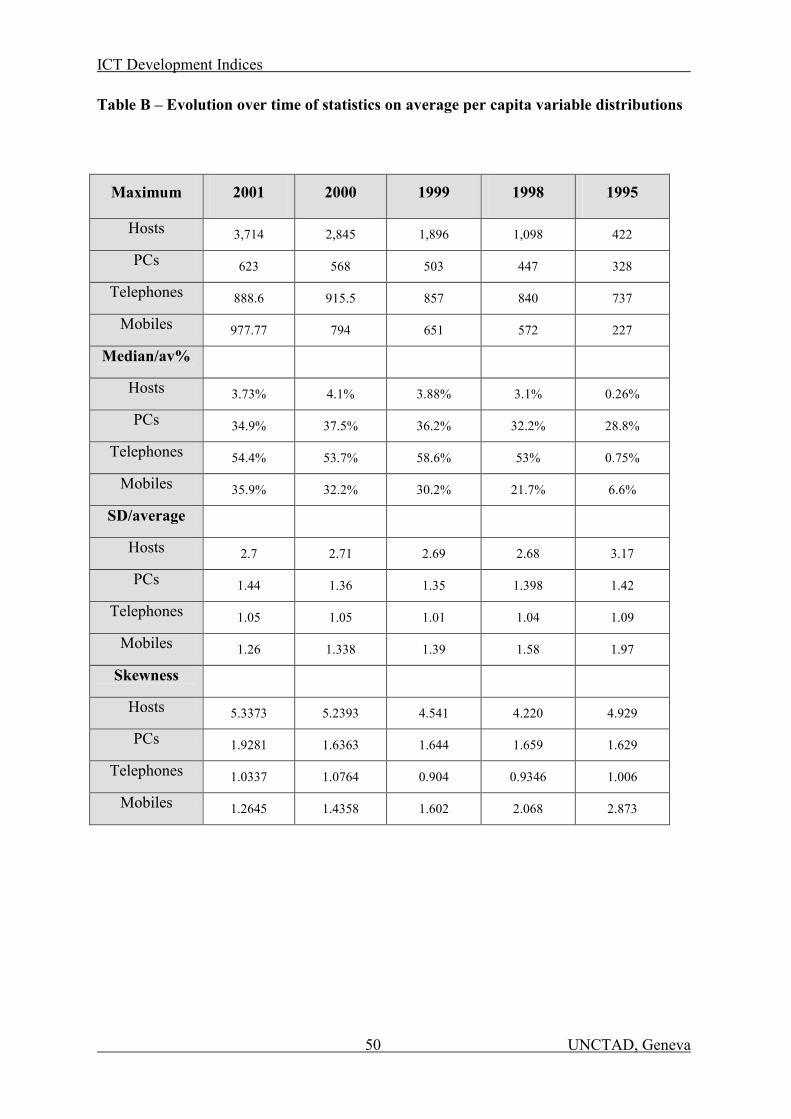
ICT Development Indices
50 UNCTAD, Geneva
Table B – Evolution over time of statistics on average per capita variable distributions
Maximum 2001 2000 1999 1998 1995
Hosts 3,714 2,845 1,896 1,098 422
PCs 623 568 503 447 328
Telephones 888.6 915.5 857 840 737
Mobiles 977.77 794 651 572 227
Median/av%
Hosts 3.73% 4.1% 3.88% 3.1% 0.26%
PCs 34.9% 37.5% 36.2% 32.2% 28.8%
Telephones 54.4% 53.7% 58.6% 53% 0.75%
Mobiles 35.9% 32.2% 30.2% 21.7% 6.6%
SD/average
Hosts 2.7 2.71 2.69 2.68 3.17
PCs 1.44 1.36 1.35 1.398 1.42
Telephones 1.05 1.05 1.01 1.04 1.09
Mobiles 1.26 1.338 1.39 1.58 1.97
Skewness
Hosts 5.3373 5.2393 4.541 4.220 4.929
PCs 1.9281 1.6363 1.644 1.659 1.629
Telephones 1.0337 1.0764 0.904 0.9346 1.006
Mobiles 1.2645 1.4358 1.602 2.068 2.873
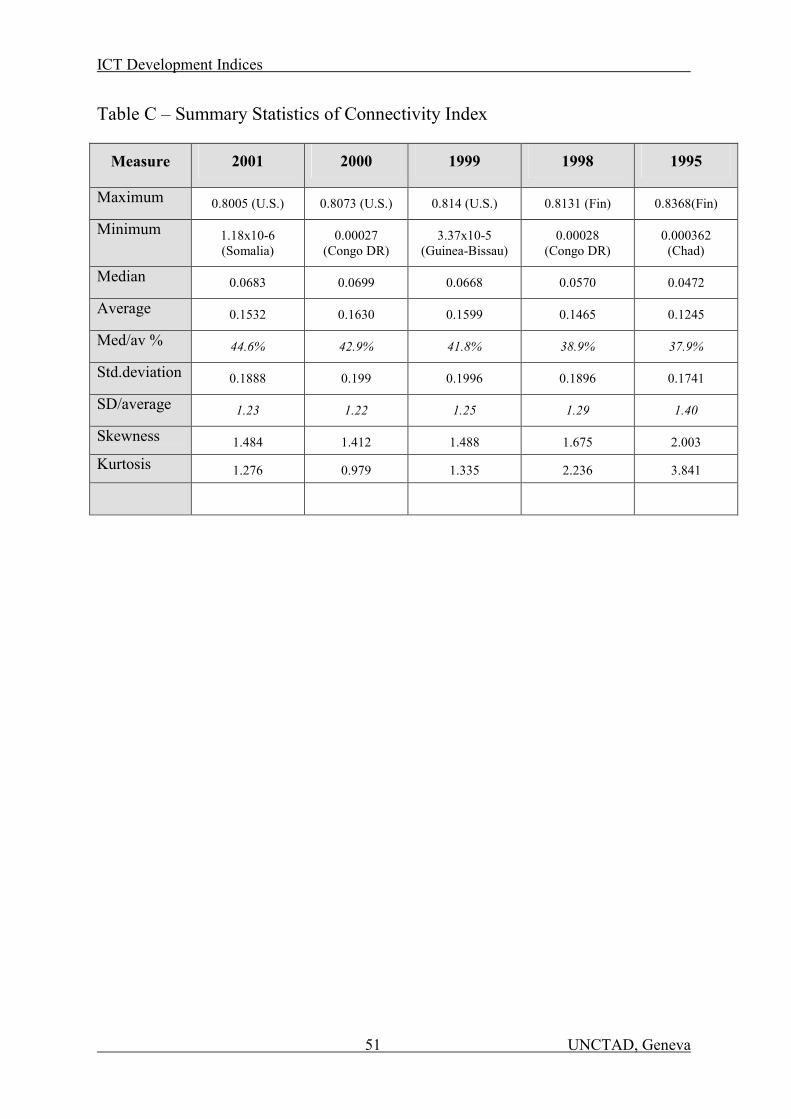
ICT Development Indices
51 UNCTAD, Geneva
Table C – Summary Statistics of Connectivity Index
Measure 2001 2000 1999 1998 1995
Maximum 0.8005 (U.S.) 0.8073 (U.S.) 0.814 (U.S.) 0.8131 (Fin) 0.8368(Fin)
Minimum 1.18x10⁻⁶ (Somalia)
0.00027 (Congo DR)
3.37x10⁻⁵ (Guinea-Bissau)
0.00028 (Congo DR)
0.000362 (Chad)
Median 0.0683 0.0699 0.0668 0.0570 0.0472
Average 0.1532 0.1630 0.1599 0.1465 0.1245
Med/av % 44.6% 42.9% 41.8% 38.9% 37.9%
Std.deviation 0.1888 0.199 0.1996 0.1896 0.1741
SD/average 1.23 1.22 1.25 1.29 1.40
Skewness 1.484 1.412 1.488 1.675 2.003
Kurtosis 1.276 0.979 1.335 2.236 3.841
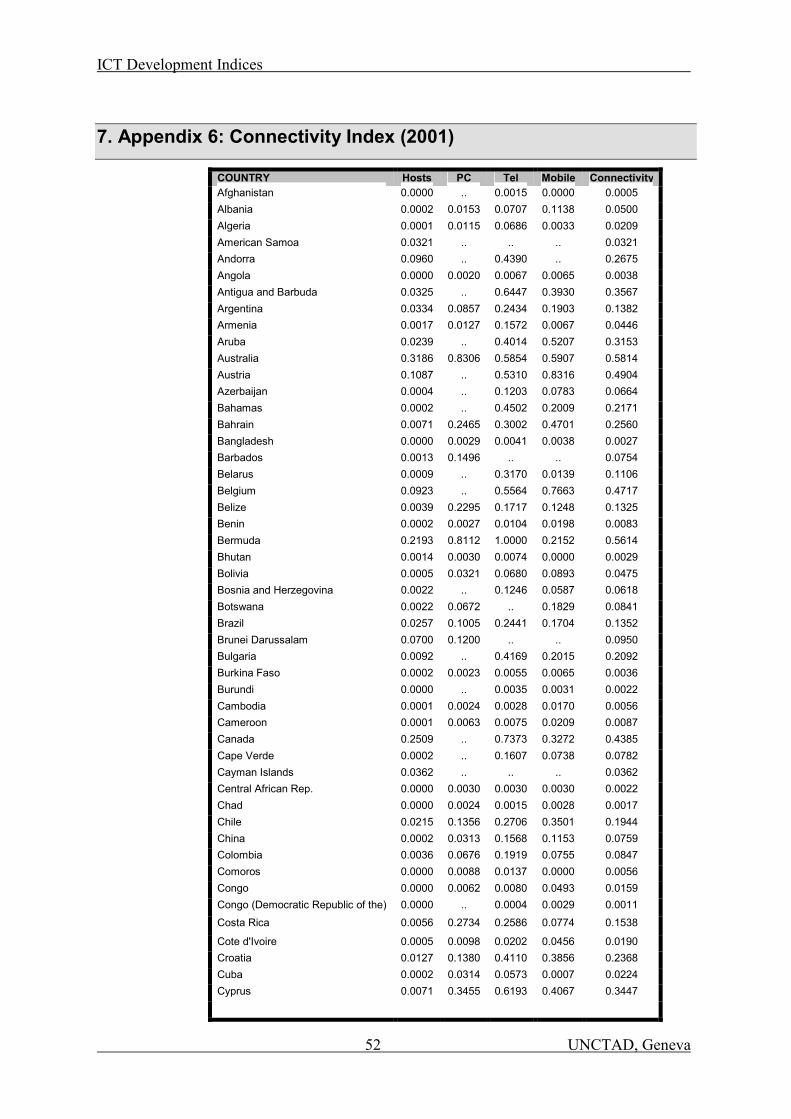
ICT Development Indices
52 UNCTAD, Geneva
7. Appendix 6: Connectivity Index (2001)
COUNTRY Hosts PC Tel Mobile ConnectivityAfghanistan 0.0000 .. 0.0015 0.0000 0.0005 Albania 0.0002 0.0153 0.0707 0.1138 0.0500 Algeria 0.0001 0.0115 0.0686 0.0033 0.0209 American Samoa 0.0321 .. .. .. 0.0321 Andorra 0.0960 .. 0.4390 .. 0.2675 Angola 0.0000 0.0020 0.0067 0.0065 0.0038 Antigua and Barbuda 0.0325 .. 0.6447 0.3930 0.3567 Argentina 0.0334 0.0857 0.2434 0.1903 0.1382 Armenia 0.0017 0.0127 0.1572 0.0067 0.0446 Aruba 0.0239 .. 0.4014 0.5207 0.3153 Australia 0.3186 0.8306 0.5854 0.5907 0.5814 Austria 0.1087 .. 0.5310 0.8316 0.4904 Azerbaijan 0.0004 .. 0.1203 0.0783 0.0664 Bahamas 0.0002 .. 0.4502 0.2009 0.2171 Bahrain 0.0071 0.2465 0.3002 0.4701 0.2560 Bangladesh 0.0000 0.0029 0.0041 0.0038 0.0027 Barbados 0.0013 0.1496 .. .. 0.0754 Belarus 0.0009 .. 0.3170 0.0139 0.1106 Belgium 0.0923 .. 0.5564 0.7663 0.4717 Belize 0.0039 0.2295 0.1717 0.1248 0.1325 Benin 0.0002 0.0027 0.0104 0.0198 0.0083 Bermuda 0.2193 0.8112 1.0000 0.2152 0.5614 Bhutan 0.0014 0.0030 0.0074 0.0000 0.0029 Bolivia 0.0005 0.0321 0.0680 0.0893 0.0475 Bosnia and Herzegovina 0.0022 .. 0.1246 0.0587 0.0618 Botswana 0.0022 0.0672 .. 0.1829 0.0841 Brazil 0.0257 0.1005 0.2441 0.1704 0.1352 Brunei Darussalam 0.0700 0.1200 .. .. 0.0950 Bulgaria 0.0092 .. 0.4169 0.2015 0.2092 Burkina Faso 0.0002 0.0023 0.0055 0.0065 0.0036 Burundi 0.0000 .. 0.0035 0.0031 0.0022 Cambodia 0.0001 0.0024 0.0028 0.0170 0.0056 Cameroon 0.0001 0.0063 0.0075 0.0209 0.0087 Canada 0.2509 .. 0.7373 0.3272 0.4385 Cape Verde 0.0002 .. 0.1607 0.0738 0.0782 Cayman Islands 0.0362 .. .. .. 0.0362 Central African Rep. 0.0000 0.0030 0.0030 0.0030 0.0022 Chad 0.0000 0.0024 0.0015 0.0028 0.0017 Chile 0.0215 0.1356 0.2706 0.3501 0.1944 China 0.0002 0.0313 0.1568 0.1153 0.0759 Colombia 0.0036 0.0676 0.1919 0.0755 0.0847 Comoros 0.0000 0.0088 0.0137 0.0000 0.0056 Congo 0.0000 0.0062 0.0080 0.0493 0.0159 Congo (Democratic Republic of the) 0.0000 .. 0.0004 0.0029 0.0011 Costa Rica 0.0056 0.2734 0.2586 0.0774 0.1538
Cote d'Ivoire 0.0005 0.0098 0.0202 0.0456 0.0190 Croatia 0.0127 0.1380 0.4110 0.3856 0.2368 Cuba 0.0002 0.0314 0.0573 0.0007 0.0224 Cyprus 0.0071 0.3455 0.6193 0.4067 0.3447
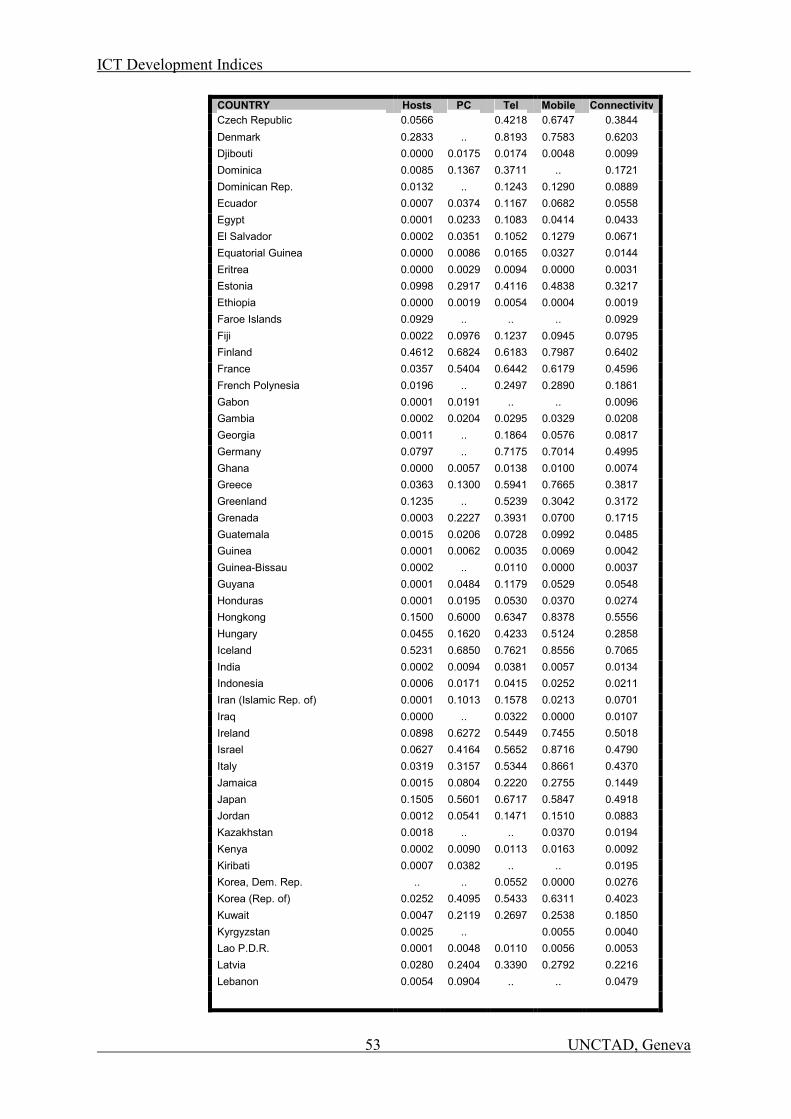
ICT Development Indices
53 UNCTAD, Geneva
COUNTRY Hosts PC Tel Mobile ConnectivityCzech Republic 0.0566 0.4218 0.6747 0.3844 Denmark 0.2833 .. 0.8193 0.7583 0.6203 Djibouti 0.0000 0.0175 0.0174 0.0048 0.0099 Dominica 0.0085 0.1367 0.3711 .. 0.1721 Dominican Rep. 0.0132 .. 0.1243 0.1290 0.0889 Ecuador 0.0007 0.0374 0.1167 0.0682 0.0558 Egypt 0.0001 0.0233 0.1083 0.0414 0.0433 El Salvador 0.0002 0.0351 0.1052 0.1279 0.0671 Equatorial Guinea 0.0000 0.0086 0.0165 0.0327 0.0144 Eritrea 0.0000 0.0029 0.0094 0.0000 0.0031 Estonia 0.0998 0.2917 0.4116 0.4838 0.3217 Ethiopia 0.0000 0.0019 0.0054 0.0004 0.0019 Faroe Islands 0.0929 .. .. .. 0.0929 Fiji 0.0022 0.0976 0.1237 0.0945 0.0795 Finland 0.4612 0.6824 0.6183 0.7987 0.6402 France 0.0357 0.5404 0.6442 0.6179 0.4596 French Polynesia 0.0196 .. 0.2497 0.2890 0.1861 Gabon 0.0001 0.0191 .. .. 0.0096 Gambia 0.0002 0.0204 0.0295 0.0329 0.0208 Georgia 0.0011 .. 0.1864 0.0576 0.0817 Germany 0.0797 .. 0.7175 0.7014 0.4995 Ghana 0.0000 0.0057 0.0138 0.0100 0.0074 Greece 0.0363 0.1300 0.5941 0.7665 0.3817 Greenland 0.1235 .. 0.5239 0.3042 0.3172 Grenada 0.0003 0.2227 0.3931 0.0700 0.1715 Guatemala 0.0015 0.0206 0.0728 0.0992 0.0485 Guinea 0.0001 0.0062 0.0035 0.0069 0.0042 Guinea-Bissau 0.0002 .. 0.0110 0.0000 0.0037 Guyana 0.0001 0.0484 0.1179 0.0529 0.0548 Honduras 0.0001 0.0195 0.0530 0.0370 0.0274 Hongkong 0.1500 0.6000 0.6347 0.8378 0.5556 Hungary 0.0455 0.1620 0.4233 0.5124 0.2858 Iceland 0.5231 0.6850 0.7621 0.8556 0.7065 India 0.0002 0.0094 0.0381 0.0057 0.0134 Indonesia 0.0006 0.0171 0.0415 0.0252 0.0211 Iran (Islamic Rep. of) 0.0001 0.1013 0.1578 0.0213 0.0701 Iraq 0.0000 .. 0.0322 0.0000 0.0107 Ireland 0.0898 0.6272 0.5449 0.7455 0.5018 Israel 0.0627 0.4164 0.5652 0.8716 0.4790 Italy 0.0319 0.3157 0.5344 0.8661 0.4370 Jamaica 0.0015 0.0804 0.2220 0.2755 0.1449 Japan 0.1505 0.5601 0.6717 0.5847 0.4918 Jordan 0.0012 0.0541 0.1471 0.1510 0.0883 Kazakhstan 0.0018 .. .. 0.0370 0.0194 Kenya 0.0002 0.0090 0.0113 0.0163 0.0092 Kiribati 0.0007 0.0382 .. .. 0.0195 Korea, Dem. Rep. .. .. 0.0552 0.0000 0.0276 Korea (Rep. of) 0.0252 0.4095 0.5433 0.6311 0.4023 Kuwait 0.0047 0.2119 0.2697 0.2538 0.1850 Kyrgyzstan 0.0025 .. 0.0055 0.0040 Lao P.D.R. 0.0001 0.0048 0.0110 0.0056 0.0053 Latvia 0.0280 0.2404 0.3390 0.2792 0.2216 Lebanon 0.0054 0.0904 .. .. 0.0479
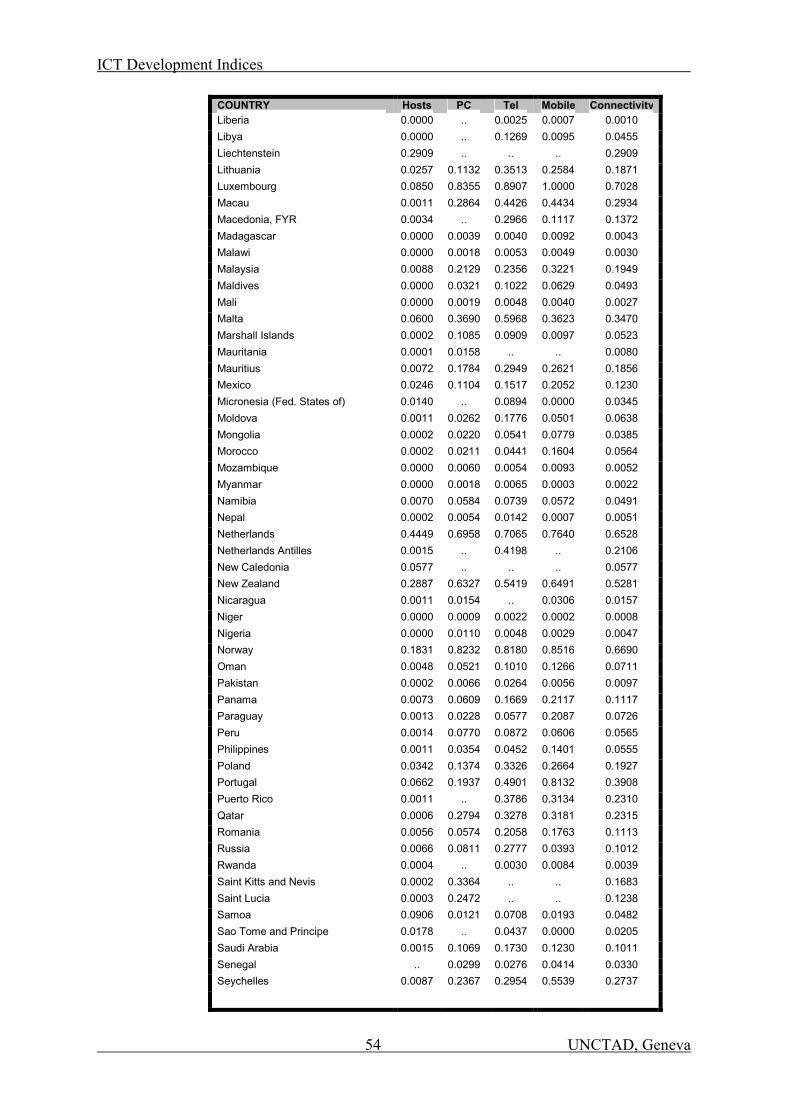
ICT Development Indices
54 UNCTAD, Geneva
COUNTRY Hosts PC Tel Mobile ConnectivityLiberia 0.0000 .. 0.0025 0.0007 0.0010 Libya 0.0000 .. 0.1269 0.0095 0.0455 Liechtenstein 0.2909 .. .. .. 0.2909 Lithuania 0.0257 0.1132 0.3513 0.2584 0.1871 Luxembourg 0.0850 0.8355 0.8907 1.0000 0.7028 Macau 0.0011 0.2864 0.4426 0.4434 0.2934 Macedonia, FYR 0.0034 .. 0.2966 0.1117 0.1372 Madagascar 0.0000 0.0039 0.0040 0.0092 0.0043 Malawi 0.0000 0.0018 0.0053 0.0049 0.0030 Malaysia 0.0088 0.2129 0.2356 0.3221 0.1949 Maldives 0.0000 0.0321 0.1022 0.0629 0.0493 Mali 0.0000 0.0019 0.0048 0.0040 0.0027 Malta 0.0600 0.3690 0.5968 0.3623 0.3470 Marshall Islands 0.0002 0.1085 0.0909 0.0097 0.0523 Mauritania 0.0001 0.0158 .. .. 0.0080 Mauritius 0.0072 0.1784 0.2949 0.2621 0.1856 Mexico 0.0246 0.1104 0.1517 0.2052 0.1230 Micronesia (Fed. States of) 0.0140 .. 0.0894 0.0000 0.0345 Moldova 0.0011 0.0262 0.1776 0.0501 0.0638 Mongolia 0.0002 0.0220 0.0541 0.0779 0.0385 Morocco 0.0002 0.0211 0.0441 0.1604 0.0564 Mozambique 0.0000 0.0060 0.0054 0.0093 0.0052 Myanmar 0.0000 0.0018 0.0065 0.0003 0.0022 Namibia 0.0070 0.0584 0.0739 0.0572 0.0491 Nepal 0.0002 0.0054 0.0142 0.0007 0.0051 Netherlands 0.4449 0.6958 0.7065 0.7640 0.6528 Netherlands Antilles 0.0015 .. 0.4198 .. 0.2106 New Caledonia 0.0577 .. .. .. 0.0577 New Zealand 0.2887 0.6327 0.5419 0.6491 0.5281 Nicaragua 0.0011 0.0154 .. 0.0306 0.0157 Niger 0.0000 0.0009 0.0022 0.0002 0.0008 Nigeria 0.0000 0.0110 0.0048 0.0029 0.0047 Norway 0.1831 0.8232 0.8180 0.8516 0.6690 Oman 0.0048 0.0521 0.1010 0.1266 0.0711 Pakistan 0.0002 0.0066 0.0264 0.0056 0.0097 Panama 0.0073 0.0609 0.1669 0.2117 0.1117 Paraguay 0.0013 0.0228 0.0577 0.2087 0.0726 Peru 0.0014 0.0770 0.0872 0.0606 0.0565 Philippines 0.0011 0.0354 0.0452 0.1401 0.0555 Poland 0.0342 0.1374 0.3326 0.2664 0.1927 Portugal 0.0662 0.1937 0.4901 0.8132 0.3908 Puerto Rico 0.0011 .. 0.3786 0.3134 0.2310 Qatar 0.0006 0.2794 0.3278 0.3181 0.2315 Romania 0.0056 0.0574 0.2058 0.1763 0.1113 Russia 0.0066 0.0811 0.2777 0.0393 0.1012 Rwanda 0.0004 .. 0.0030 0.0084 0.0039 Saint Kitts and Nevis 0.0002 0.3364 .. .. 0.1683 Saint Lucia 0.0003 0.2472 .. .. 0.1238 Samoa 0.0906 0.0121 0.0708 0.0193 0.0482 Sao Tome and Principe 0.0178 .. 0.0437 0.0000 0.0205 Saudi Arabia 0.0015 0.1069 0.1730 0.1230 0.1011 Senegal .. 0.0299 0.0276 0.0414 0.0330 Seychelles 0.0087 0.2367 0.2954 0.5539 0.2737
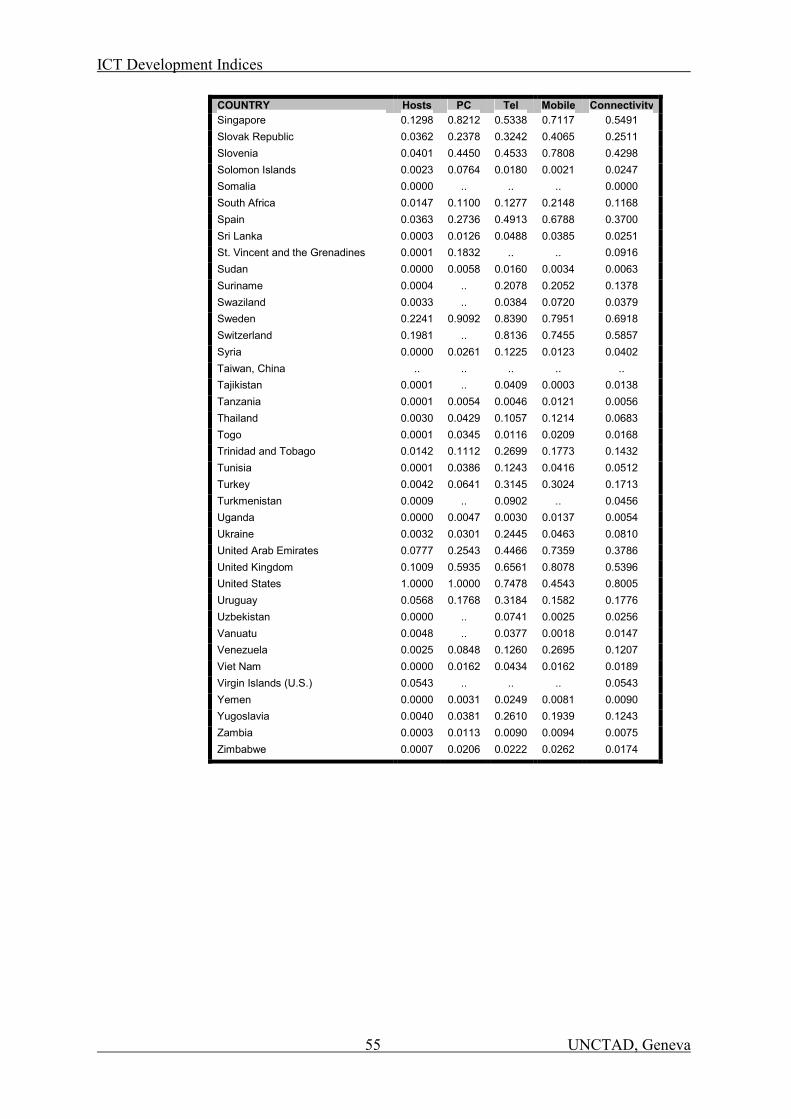
ICT Development Indices
55 UNCTAD, Geneva
COUNTRY Hosts PC Tel Mobile ConnectivitySingapore 0.1298 0.8212 0.5338 0.7117 0.5491 Slovak Republic 0.0362 0.2378 0.3242 0.4065 0.2511 Slovenia 0.0401 0.4450 0.4533 0.7808 0.4298 Solomon Islands 0.0023 0.0764 0.0180 0.0021 0.0247 Somalia 0.0000 .. .. .. 0.0000 South Africa 0.0147 0.1100 0.1277 0.2148 0.1168 Spain 0.0363 0.2736 0.4913 0.6788 0.3700 Sri Lanka 0.0003 0.0126 0.0488 0.0385 0.0251 St. Vincent and the Grenadines 0.0001 0.1832 .. .. 0.0916 Sudan 0.0000 0.0058 0.0160 0.0034 0.0063 Suriname 0.0004 .. 0.2078 0.2052 0.1378 Swaziland 0.0033 .. 0.0384 0.0720 0.0379 Sweden 0.2241 0.9092 0.8390 0.7951 0.6918 Switzerland 0.1981 .. 0.8136 0.7455 0.5857 Syria 0.0000 0.0261 0.1225 0.0123 0.0402 Taiwan, China .. .. .. .. .. Tajikistan 0.0001 .. 0.0409 0.0003 0.0138 Tanzania 0.0001 0.0054 0.0046 0.0121 0.0056 Thailand 0.0030 0.0429 0.1057 0.1214 0.0683 Togo 0.0001 0.0345 0.0116 0.0209 0.0168 Trinidad and Tobago 0.0142 0.1112 0.2699 0.1773 0.1432 Tunisia 0.0001 0.0386 0.1243 0.0416 0.0512 Turkey 0.0042 0.0641 0.3145 0.3024 0.1713 Turkmenistan 0.0009 .. 0.0902 .. 0.0456 Uganda 0.0000 0.0047 0.0030 0.0137 0.0054 Ukraine 0.0032 0.0301 0.2445 0.0463 0.0810 United Arab Emirates 0.0777 0.2543 0.4466 0.7359 0.3786 United Kingdom 0.1009 0.5935 0.6561 0.8078 0.5396 United States 1.0000 1.0000 0.7478 0.4543 0.8005 Uruguay 0.0568 0.1768 0.3184 0.1582 0.1776 Uzbekistan 0.0000 .. 0.0741 0.0025 0.0256 Vanuatu 0.0048 .. 0.0377 0.0018 0.0147 Venezuela 0.0025 0.0848 0.1260 0.2695 0.1207 Viet Nam 0.0000 0.0162 0.0434 0.0162 0.0189 Virgin Islands (U.S.) 0.0543 .. .. .. 0.0543 Yemen 0.0000 0.0031 0.0249 0.0081 0.0090 Yugoslavia 0.0040 0.0381 0.2610 0.1939 0.1243 Zambia 0.0003 0.0113 0.0090 0.0094 0.0075 Zimbabwe 0.0007 0.0206 0.0222 0.0262 0.0174
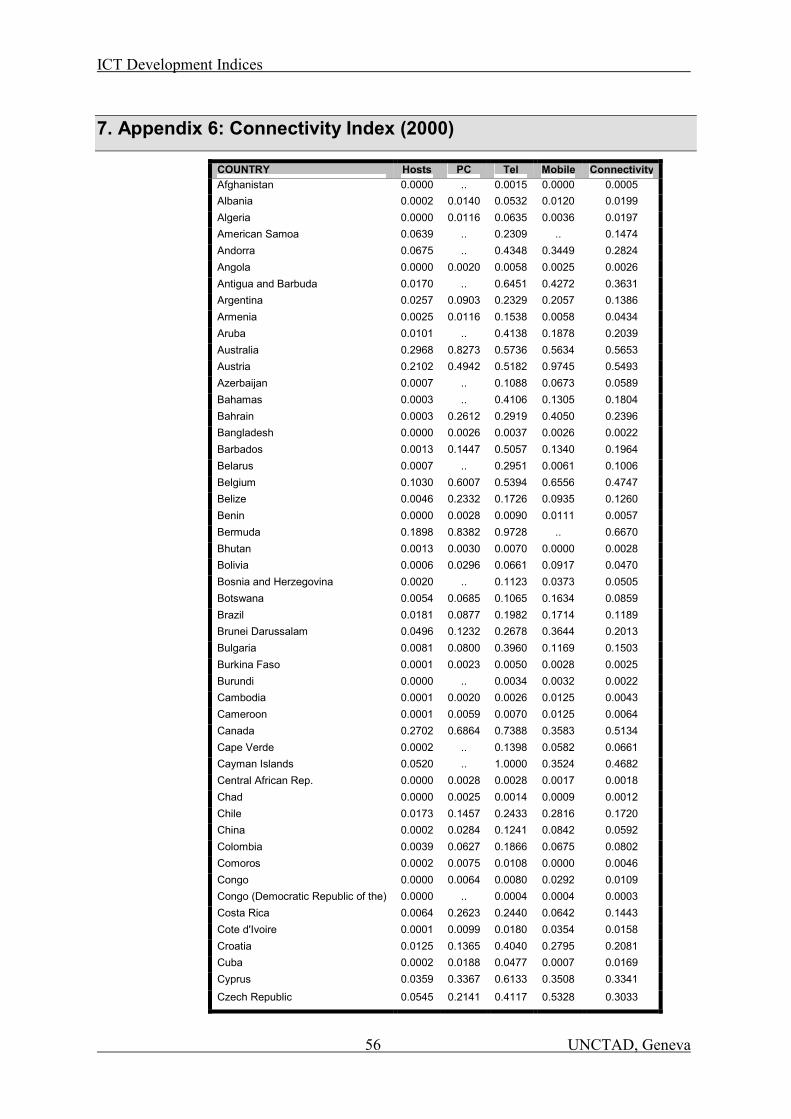
ICT Development Indices
56 UNCTAD, Geneva
7. Appendix 6: Connectivity Index (2000)
COUNTRY Hosts PC Tel Mobile ConnectivityAfghanistan 0.0000 .. 0.0015 0.0000 0.0005 Albania 0.0002 0.0140 0.0532 0.0120 0.0199 Algeria 0.0000 0.0116 0.0635 0.0036 0.0197 American Samoa 0.0639 .. 0.2309 .. 0.1474 Andorra 0.0675 .. 0.4348 0.3449 0.2824 Angola 0.0000 0.0020 0.0058 0.0025 0.0026 Antigua and Barbuda 0.0170 .. 0.6451 0.4272 0.3631 Argentina 0.0257 0.0903 0.2329 0.2057 0.1386 Armenia 0.0025 0.0116 0.1538 0.0058 0.0434 Aruba 0.0101 .. 0.4138 0.1878 0.2039 Australia 0.2968 0.8273 0.5736 0.5634 0.5653 Austria 0.2102 0.4942 0.5182 0.9745 0.5493 Azerbaijan 0.0007 .. 0.1088 0.0673 0.0589 Bahamas 0.0003 .. 0.4106 0.1305 0.1804 Bahrain 0.0003 0.2612 0.2919 0.4050 0.2396 Bangladesh 0.0000 0.0026 0.0037 0.0026 0.0022 Barbados 0.0013 0.1447 0.5057 0.1340 0.1964 Belarus 0.0007 .. 0.2951 0.0061 0.1006 Belgium 0.1030 0.6007 0.5394 0.6556 0.4747 Belize 0.0046 0.2332 0.1726 0.0935 0.1260 Benin 0.0000 0.0028 0.0090 0.0111 0.0057 Bermuda 0.1898 0.8382 0.9728 .. 0.6670 Bhutan 0.0013 0.0030 0.0070 0.0000 0.0028 Bolivia 0.0006 0.0296 0.0661 0.0917 0.0470 Bosnia and Herzegovina 0.0020 .. 0.1123 0.0373 0.0505 Botswana 0.0054 0.0685 0.1065 0.1634 0.0859 Brazil 0.0181 0.0877 0.1982 0.1714 0.1189 Brunei Darussalam 0.0496 0.1232 0.2678 0.3644 0.2013 Bulgaria 0.0081 0.0800 0.3960 0.1169 0.1503 Burkina Faso 0.0001 0.0023 0.0050 0.0028 0.0025 Burundi 0.0000 .. 0.0034 0.0032 0.0022 Cambodia 0.0001 0.0020 0.0026 0.0125 0.0043 Cameroon 0.0001 0.0059 0.0070 0.0125 0.0064 Canada 0.2702 0.6864 0.7388 0.3583 0.5134 Cape Verde 0.0002 .. 0.1398 0.0582 0.0661 Cayman Islands 0.0520 .. 1.0000 0.3524 0.4682 Central African Rep. 0.0000 0.0028 0.0028 0.0017 0.0018 Chad 0.0000 0.0025 0.0014 0.0009 0.0012 Chile 0.0173 0.1457 0.2433 0.2816 0.1720 China 0.0002 0.0284 0.1241 0.0842 0.0592 Colombia 0.0039 0.0627 0.1866 0.0675 0.0802 Comoros 0.0002 0.0075 0.0108 0.0000 0.0046 Congo 0.0000 0.0064 0.0080 0.0292 0.0109 Congo (Democratic Republic of the) 0.0000 .. 0.0004 0.0004 0.0003 Costa Rica 0.0064 0.2623 0.2440 0.0642 0.1443 Cote d'Ivoire 0.0001 0.0099 0.0180 0.0354 0.0158 Croatia 0.0125 0.1365 0.4040 0.2795 0.2081 Cuba 0.0002 0.0188 0.0477 0.0007 0.0169 Cyprus 0.0359 0.3367 0.6133 0.3508 0.3341 Czech Republic 0.0545 0.2141 0.4117 0.5328 0.3033
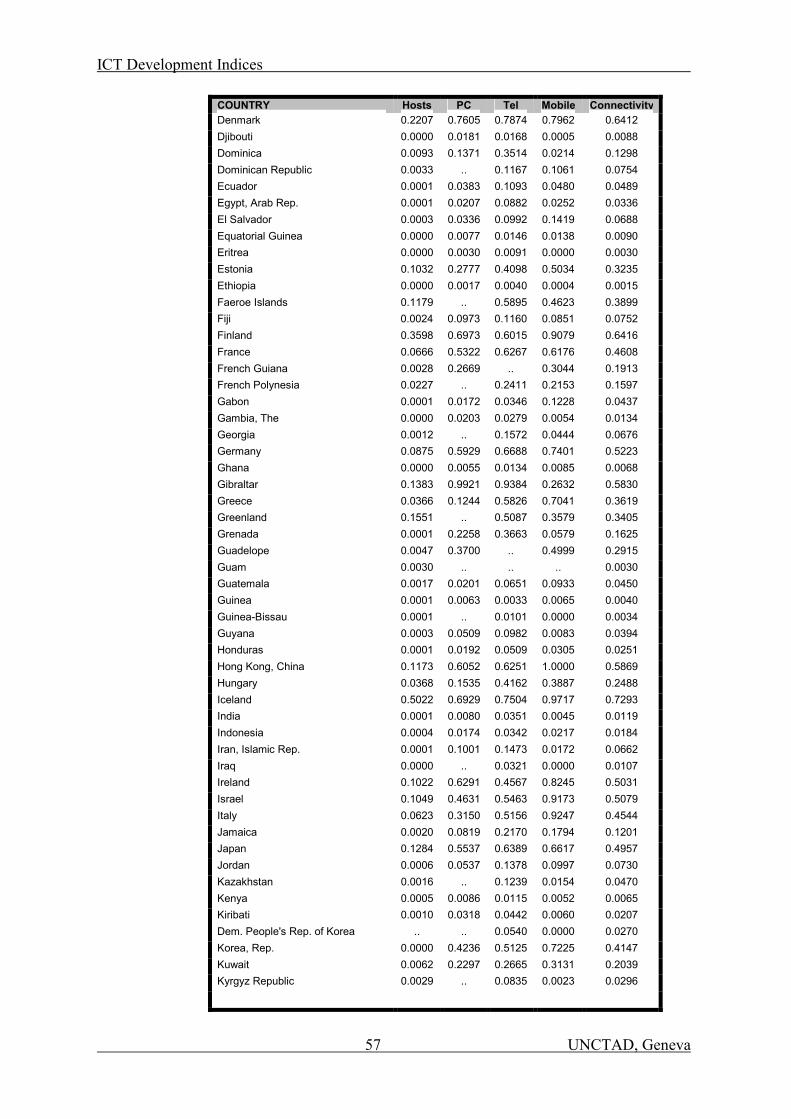
ICT Development Indices
57 UNCTAD, Geneva
COUNTRY Hosts PC Tel Mobile ConnectivityDenmark 0.2207 0.7605 0.7874 0.7962 0.6412 Djibouti 0.0000 0.0181 0.0168 0.0005 0.0088 Dominica 0.0093 0.1371 0.3514 0.0214 0.1298 Dominican Republic 0.0033 .. 0.1167 0.1061 0.0754 Ecuador 0.0001 0.0383 0.1093 0.0480 0.0489 Egypt, Arab Rep. 0.0001 0.0207 0.0882 0.0252 0.0336 El Salvador 0.0003 0.0336 0.0992 0.1419 0.0688 Equatorial Guinea 0.0000 0.0077 0.0146 0.0138 0.0090 Eritrea 0.0000 0.0030 0.0091 0.0000 0.0030 Estonia 0.1032 0.2777 0.4098 0.5034 0.3235 Ethiopia 0.0000 0.0017 0.0040 0.0004 0.0015 Faeroe Islands 0.1179 .. 0.5895 0.4623 0.3899 Fiji 0.0024 0.0973 0.1160 0.0851 0.0752 Finland 0.3598 0.6973 0.6015 0.9079 0.6416 France 0.0666 0.5322 0.6267 0.6176 0.4608 French Guiana 0.0028 0.2669 .. 0.3044 0.1913 French Polynesia 0.0227 .. 0.2411 0.2153 0.1597 Gabon 0.0001 0.0172 0.0346 0.1228 0.0437 Gambia, The 0.0000 0.0203 0.0279 0.0054 0.0134 Georgia 0.0012 .. 0.1572 0.0444 0.0676 Germany 0.0875 0.5929 0.6688 0.7401 0.5223 Ghana 0.0000 0.0055 0.0134 0.0085 0.0068 Gibraltar 0.1383 0.9921 0.9384 0.2632 0.5830 Greece 0.0366 0.1244 0.5826 0.7041 0.3619 Greenland 0.1551 .. 0.5087 0.3579 0.3405 Grenada 0.0001 0.2258 0.3663 0.0579 0.1625 Guadelope 0.0047 0.3700 .. 0.4999 0.2915 Guam 0.0030 .. .. .. 0.0030 Guatemala 0.0017 0.0201 0.0651 0.0933 0.0450 Guinea 0.0001 0.0063 0.0033 0.0065 0.0040 Guinea-Bissau 0.0001 .. 0.0101 0.0000 0.0034 Guyana 0.0003 0.0509 0.0982 0.0083 0.0394 Honduras 0.0001 0.0192 0.0509 0.0305 0.0251 Hong Kong, China 0.1173 0.6052 0.6251 1.0000 0.5869 Hungary 0.0368 0.1535 0.4162 0.3887 0.2488 Iceland 0.5022 0.6929 0.7504 0.9717 0.7293 India 0.0001 0.0080 0.0351 0.0045 0.0119 Indonesia 0.0004 0.0174 0.0342 0.0217 0.0184 Iran, Islamic Rep. 0.0001 0.1001 0.1473 0.0172 0.0662 Iraq 0.0000 .. 0.0321 0.0000 0.0107 Ireland 0.1022 0.6291 0.4567 0.8245 0.5031 Israel 0.1049 0.4631 0.5463 0.9173 0.5079 Italy 0.0623 0.3150 0.5156 0.9247 0.4544 Jamaica 0.0020 0.0819 0.2170 0.1794 0.1201 Japan 0.1284 0.5537 0.6389 0.6617 0.4957 Jordan 0.0006 0.0537 0.1378 0.0997 0.0730 Kazakhstan 0.0016 .. 0.1239 0.0154 0.0470 Kenya 0.0005 0.0086 0.0115 0.0052 0.0065 Kiribati 0.0010 0.0318 0.0442 0.0060 0.0207 Dem. People's Rep. of Korea .. .. 0.0540 0.0000 0.0270 Korea, Rep. 0.0000 0.4236 0.5125 0.7225 0.4147 Kuwait 0.0062 0.2297 0.2665 0.3131 0.2039 Kyrgyz Republic 0.0029 .. 0.0835 0.0023 0.0296
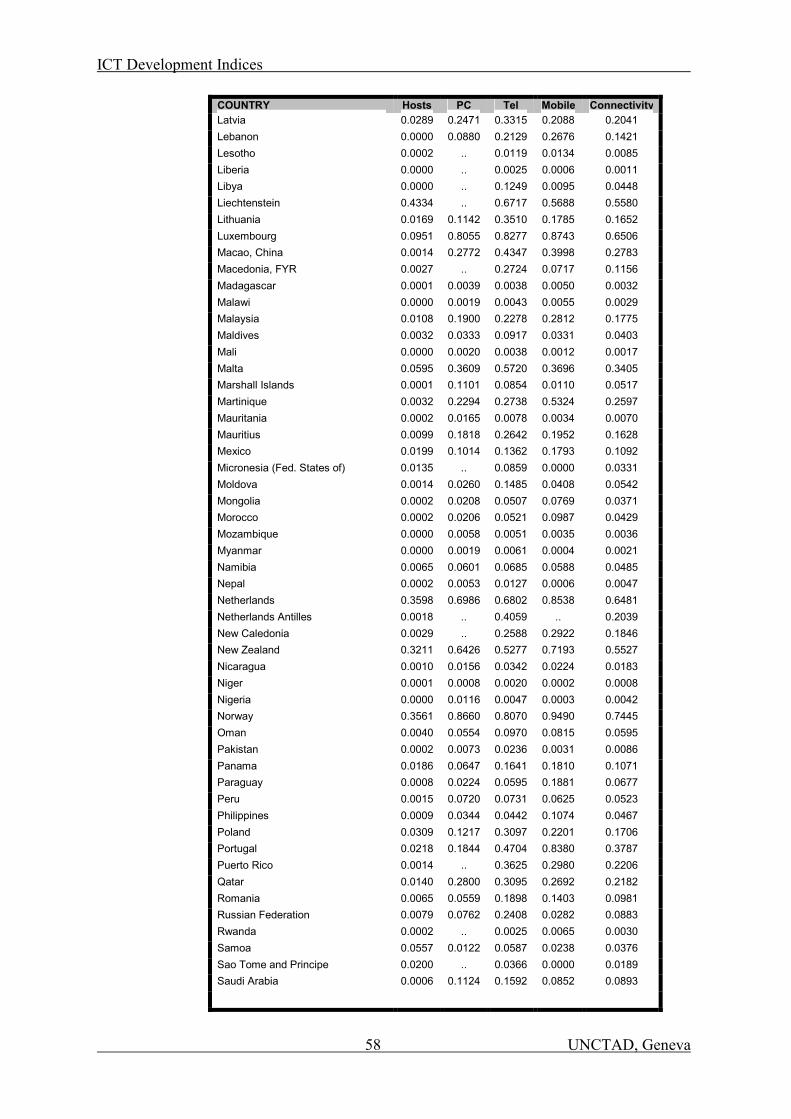
ICT Development Indices
58 UNCTAD, Geneva
COUNTRY Hosts PC Tel Mobile ConnectivityLatvia 0.0289 0.2471 0.3315 0.2088 0.2041 Lebanon 0.0000 0.0880 0.2129 0.2676 0.1421 Lesotho 0.0002 .. 0.0119 0.0134 0.0085 Liberia 0.0000 .. 0.0025 0.0006 0.0011 Libya 0.0000 .. 0.1249 0.0095 0.0448 Liechtenstein 0.4334 .. 0.6717 0.5688 0.5580 Lithuania 0.0169 0.1142 0.3510 0.1785 0.1652 Luxembourg 0.0951 0.8055 0.8277 0.8743 0.6506 Macao, China 0.0014 0.2772 0.4347 0.3998 0.2783 Macedonia, FYR 0.0027 .. 0.2724 0.0717 0.1156 Madagascar 0.0001 0.0039 0.0038 0.0050 0.0032 Malawi 0.0000 0.0019 0.0043 0.0055 0.0029 Malaysia 0.0108 0.1900 0.2278 0.2812 0.1775 Maldives 0.0032 0.0333 0.0917 0.0331 0.0403 Mali 0.0000 0.0020 0.0038 0.0012 0.0017 Malta 0.0595 0.3609 0.5720 0.3696 0.3405 Marshall Islands 0.0001 0.1101 0.0854 0.0110 0.0517 Martinique 0.0032 0.2294 0.2738 0.5324 0.2597 Mauritania 0.0002 0.0165 0.0078 0.0034 0.0070 Mauritius 0.0099 0.1818 0.2642 0.1952 0.1628 Mexico 0.0199 0.1014 0.1362 0.1793 0.1092 Micronesia (Fed. States of) 0.0135 .. 0.0859 0.0000 0.0331 Moldova 0.0014 0.0260 0.1485 0.0408 0.0542 Mongolia 0.0002 0.0208 0.0507 0.0769 0.0371 Morocco 0.0002 0.0206 0.0521 0.0987 0.0429 Mozambique 0.0000 0.0058 0.0051 0.0035 0.0036 Myanmar 0.0000 0.0019 0.0061 0.0004 0.0021 Namibia 0.0065 0.0601 0.0685 0.0588 0.0485 Nepal 0.0002 0.0053 0.0127 0.0006 0.0047 Netherlands 0.3598 0.6986 0.6802 0.8538 0.6481 Netherlands Antilles 0.0018 .. 0.4059 .. 0.2039 New Caledonia 0.0029 .. 0.2588 0.2922 0.1846 New Zealand 0.3211 0.6426 0.5277 0.7193 0.5527 Nicaragua 0.0010 0.0156 0.0342 0.0224 0.0183 Niger 0.0001 0.0008 0.0020 0.0002 0.0008 Nigeria 0.0000 0.0116 0.0047 0.0003 0.0042 Norway 0.3561 0.8660 0.8070 0.9490 0.7445 Oman 0.0040 0.0554 0.0970 0.0815 0.0595 Pakistan 0.0002 0.0073 0.0236 0.0031 0.0086 Panama 0.0186 0.0647 0.1641 0.1810 0.1071 Paraguay 0.0008 0.0224 0.0595 0.1881 0.0677 Peru 0.0015 0.0720 0.0731 0.0625 0.0523 Philippines 0.0009 0.0344 0.0442 0.1074 0.0467 Poland 0.0309 0.1217 0.3097 0.2201 0.1706 Portugal 0.0218 0.1844 0.4704 0.8380 0.3787 Puerto Rico 0.0014 .. 0.3625 0.2980 0.2206 Qatar 0.0140 0.2800 0.3095 0.2692 0.2182 Romania 0.0065 0.0559 0.1898 0.1403 0.0981 Russian Federation 0.0079 0.0762 0.2408 0.0282 0.0883 Rwanda 0.0002 .. 0.0025 0.0065 0.0030 Samoa 0.0557 0.0122 0.0587 0.0238 0.0376 Sao Tome and Principe 0.0200 .. 0.0366 0.0000 0.0189 Saudi Arabia 0.0006 0.1124 0.1592 0.0852 0.0893
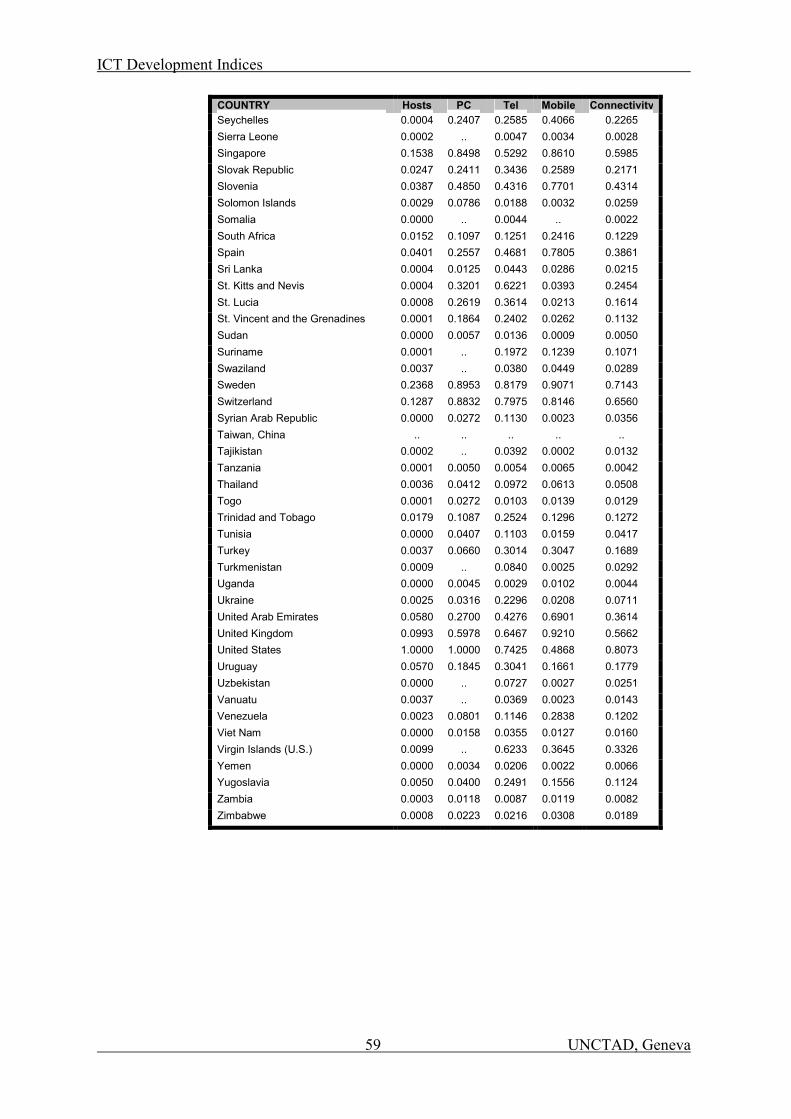
ICT Development Indices
59 UNCTAD, Geneva
COUNTRY Hosts PC Tel Mobile ConnectivitySeychelles 0.0004 0.2407 0.2585 0.4066 0.2265 Sierra Leone 0.0002 .. 0.0047 0.0034 0.0028 Singapore 0.1538 0.8498 0.5292 0.8610 0.5985 Slovak Republic 0.0247 0.2411 0.3436 0.2589 0.2171 Slovenia 0.0387 0.4850 0.4316 0.7701 0.4314 Solomon Islands 0.0029 0.0786 0.0188 0.0032 0.0259 Somalia 0.0000 .. 0.0044 .. 0.0022 South Africa 0.0152 0.1097 0.1251 0.2416 0.1229 Spain 0.0401 0.2557 0.4681 0.7805 0.3861 Sri Lanka 0.0004 0.0125 0.0443 0.0286 0.0215 St. Kitts and Nevis 0.0004 0.3201 0.6221 0.0393 0.2454 St. Lucia 0.0008 0.2619 0.3614 0.0213 0.1614 St. Vincent and the Grenadines 0.0001 0.1864 0.2402 0.0262 0.1132 Sudan 0.0000 0.0057 0.0136 0.0009 0.0050 Suriname 0.0001 .. 0.1972 0.1239 0.1071 Swaziland 0.0037 .. 0.0380 0.0449 0.0289 Sweden 0.2368 0.8953 0.8179 0.9071 0.7143 Switzerland 0.1287 0.8832 0.7975 0.8146 0.6560 Syrian Arab Republic 0.0000 0.0272 0.1130 0.0023 0.0356 Taiwan, China .. .. .. .. .. Tajikistan 0.0002 .. 0.0392 0.0002 0.0132 Tanzania 0.0001 0.0050 0.0054 0.0065 0.0042 Thailand 0.0036 0.0412 0.0972 0.0613 0.0508 Togo 0.0001 0.0272 0.0103 0.0139 0.0129 Trinidad and Tobago 0.0179 0.1087 0.2524 0.1296 0.1272 Tunisia 0.0000 0.0407 0.1103 0.0159 0.0417 Turkey 0.0037 0.0660 0.3014 0.3047 0.1689 Turkmenistan 0.0009 .. 0.0840 0.0025 0.0292 Uganda 0.0000 0.0045 0.0029 0.0102 0.0044 Ukraine 0.0025 0.0316 0.2296 0.0208 0.0711 United Arab Emirates 0.0580 0.2700 0.4276 0.6901 0.3614 United Kingdom 0.0993 0.5978 0.6467 0.9210 0.5662 United States 1.0000 1.0000 0.7425 0.4868 0.8073 Uruguay 0.0570 0.1845 0.3041 0.1661 0.1779 Uzbekistan 0.0000 .. 0.0727 0.0027 0.0251 Vanuatu 0.0037 .. 0.0369 0.0023 0.0143 Venezuela 0.0023 0.0801 0.1146 0.2838 0.1202 Viet Nam 0.0000 0.0158 0.0355 0.0127 0.0160 Virgin Islands (U.S.) 0.0099 .. 0.6233 0.3645 0.3326 Yemen 0.0000 0.0034 0.0206 0.0022 0.0066 Yugoslavia 0.0050 0.0400 0.2491 0.1556 0.1124 Zambia 0.0003 0.0118 0.0087 0.0119 0.0082 Zimbabwe 0.0008 0.0223 0.0216 0.0308 0.0189
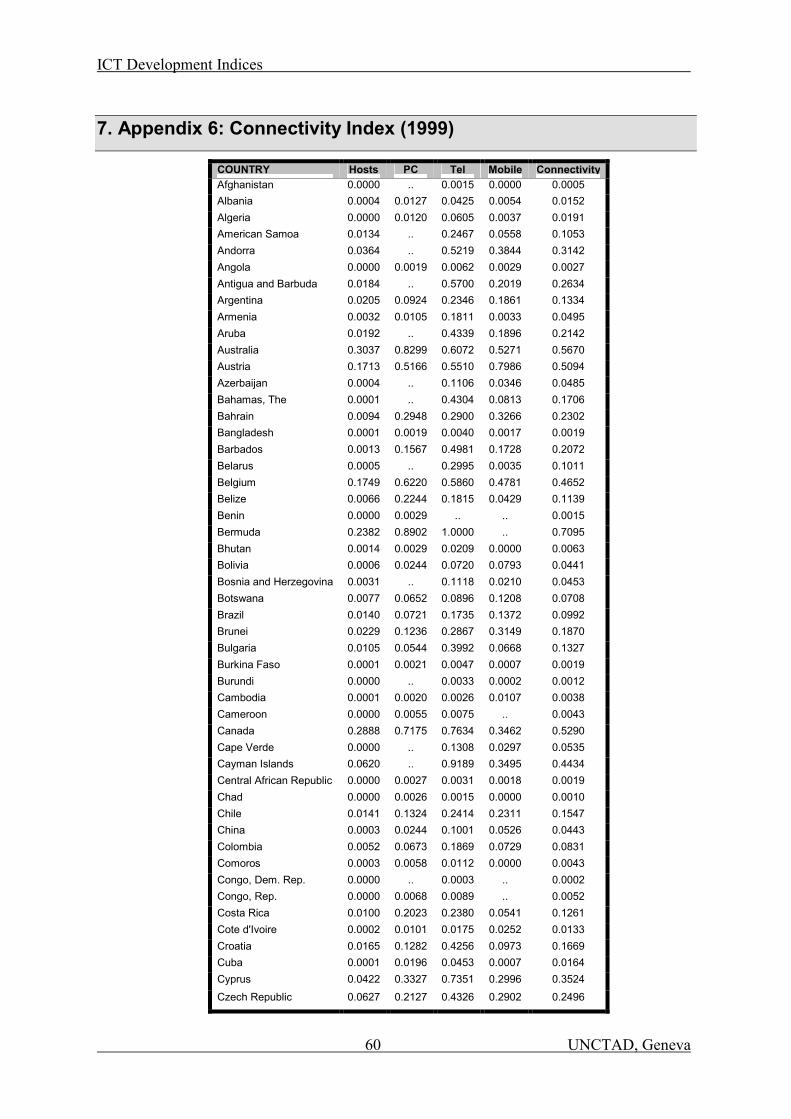
ICT Development Indices
60 UNCTAD, Geneva
7. Appendix 6: Connectivity Index (1999)
COUNTRY Hosts PC Tel Mobile ConnectivityAfghanistan 0.0000 .. 0.0015 0.0000 0.0005 Albania 0.0004 0.0127 0.0425 0.0054 0.0152 Algeria 0.0000 0.0120 0.0605 0.0037 0.0191 American Samoa 0.0134 .. 0.2467 0.0558 0.1053 Andorra 0.0364 .. 0.5219 0.3844 0.3142 Angola 0.0000 0.0019 0.0062 0.0029 0.0027 Antigua and Barbuda 0.0184 .. 0.5700 0.2019 0.2634 Argentina 0.0205 0.0924 0.2346 0.1861 0.1334 Armenia 0.0032 0.0105 0.1811 0.0033 0.0495 Aruba 0.0192 .. 0.4339 0.1896 0.2142 Australia 0.3037 0.8299 0.6072 0.5271 0.5670 Austria 0.1713 0.5166 0.5510 0.7986 0.5094 Azerbaijan 0.0004 .. 0.1106 0.0346 0.0485 Bahamas, The 0.0001 .. 0.4304 0.0813 0.1706 Bahrain 0.0094 0.2948 0.2900 0.3266 0.2302 Bangladesh 0.0001 0.0019 0.0040 0.0017 0.0019 Barbados 0.0013 0.1567 0.4981 0.1728 0.2072 Belarus 0.0005 .. 0.2995 0.0035 0.1011 Belgium 0.1749 0.6220 0.5860 0.4781 0.4652 Belize 0.0066 0.2244 0.1815 0.0429 0.1139 Benin 0.0000 0.0029 .. .. 0.0015 Bermuda 0.2382 0.8902 1.0000 .. 0.7095 Bhutan 0.0014 0.0029 0.0209 0.0000 0.0063 Bolivia 0.0006 0.0244 0.0720 0.0793 0.0441 Bosnia and Herzegovina 0.0031 .. 0.1118 0.0210 0.0453 Botswana 0.0077 0.0652 0.0896 0.1208 0.0708 Brazil 0.0140 0.0721 0.1735 0.1372 0.0992 Brunei 0.0229 0.1236 0.2867 0.3149 0.1870 Bulgaria 0.0105 0.0544 0.3992 0.0668 0.1327 Burkina Faso 0.0001 0.0021 0.0047 0.0007 0.0019 Burundi 0.0000 .. 0.0033 0.0002 0.0012 Cambodia 0.0001 0.0020 0.0026 0.0107 0.0038 Cameroon 0.0000 0.0055 0.0075 .. 0.0043 Canada 0.2888 0.7175 0.7634 0.3462 0.5290 Cape Verde 0.0000 .. 0.1308 0.0297 0.0535 Cayman Islands 0.0620 .. 0.9189 0.3495 0.4434 Central African Republic 0.0000 0.0027 0.0031 0.0018 0.0019 Chad 0.0000 0.0026 0.0015 0.0000 0.0010 Chile 0.0141 0.1324 0.2414 0.2311 0.1547 China 0.0003 0.0244 0.1001 0.0526 0.0443 Colombia 0.0052 0.0673 0.1869 0.0729 0.0831 Comoros 0.0003 0.0058 0.0112 0.0000 0.0043 Congo, Dem. Rep. 0.0000 .. 0.0003 .. 0.0002 Congo, Rep. 0.0000 0.0068 0.0089 .. 0.0052 Costa Rica 0.0100 0.2023 0.2380 0.0541 0.1261 Cote d'Ivoire 0.0002 0.0101 0.0175 0.0252 0.0133 Croatia 0.0165 0.1282 0.4256 0.0973 0.1669 Cuba 0.0001 0.0196 0.0453 0.0007 0.0164 Cyprus 0.0422 0.3327 0.7351 0.2996 0.3524 Czech Republic 0.0627 0.2127 0.4326 0.2902 0.2496
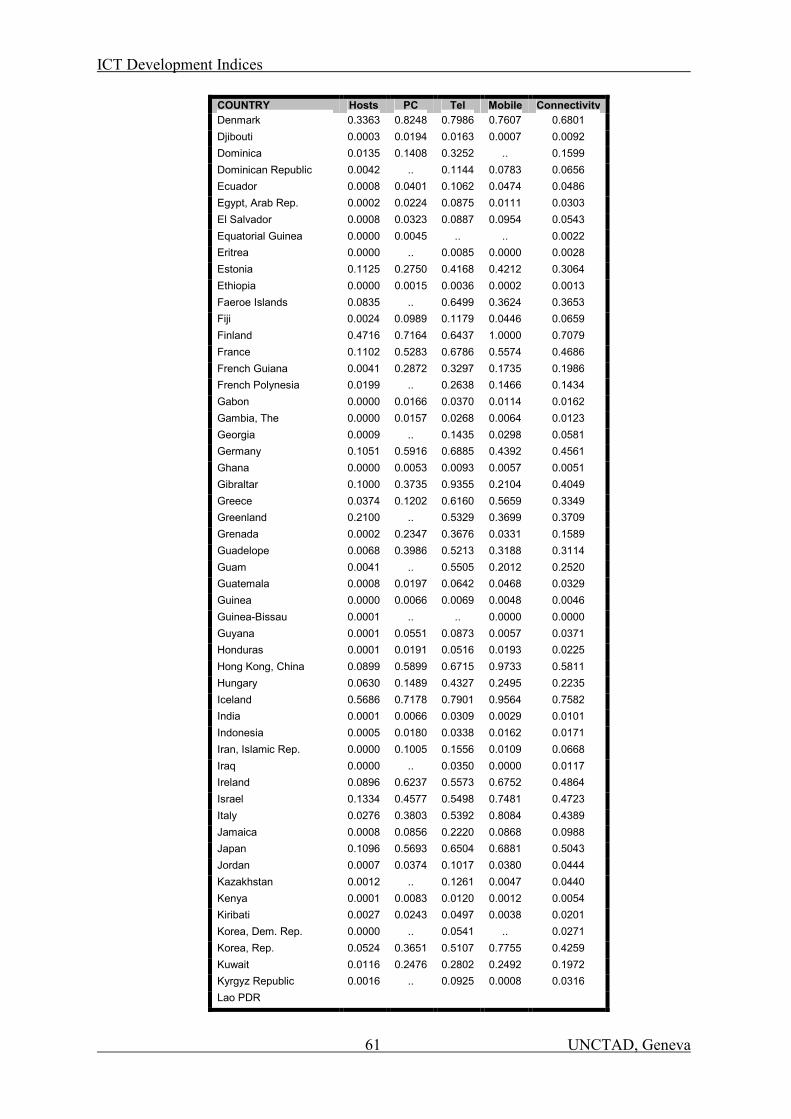
ICT Development Indices
61 UNCTAD, Geneva
COUNTRY Hosts PC Tel Mobile ConnectivityDenmark 0.3363 0.8248 0.7986 0.7607 0.6801 Djibouti 0.0003 0.0194 0.0163 0.0007 0.0092 Dominica 0.0135 0.1408 0.3252 .. 0.1599 Dominican Republic 0.0042 .. 0.1144 0.0783 0.0656 Ecuador 0.0008 0.0401 0.1062 0.0474 0.0486 Egypt, Arab Rep. 0.0002 0.0224 0.0875 0.0111 0.0303 El Salvador 0.0008 0.0323 0.0887 0.0954 0.0543 Equatorial Guinea 0.0000 0.0045 .. .. 0.0022 Eritrea 0.0000 .. 0.0085 0.0000 0.0028 Estonia 0.1125 0.2750 0.4168 0.4212 0.3064 Ethiopia 0.0000 0.0015 0.0036 0.0002 0.0013 Faeroe Islands 0.0835 .. 0.6499 0.3624 0.3653 Fiji 0.0024 0.0989 0.1179 0.0446 0.0659 Finland 0.4716 0.7164 0.6437 1.0000 0.7079 France 0.1102 0.5283 0.6786 0.5574 0.4686 French Guiana 0.0041 0.2872 0.3297 0.1735 0.1986 French Polynesia 0.0199 .. 0.2638 0.1466 0.1434 Gabon 0.0000 0.0166 0.0370 0.0114 0.0162 Gambia, The 0.0000 0.0157 0.0268 0.0064 0.0123 Georgia 0.0009 .. 0.1435 0.0298 0.0581 Germany 0.1051 0.5916 0.6885 0.4392 0.4561 Ghana 0.0000 0.0053 0.0093 0.0057 0.0051 Gibraltar 0.1000 0.3735 0.9355 0.2104 0.4049 Greece 0.0374 0.1202 0.6160 0.5659 0.3349 Greenland 0.2100 .. 0.5329 0.3699 0.3709 Grenada 0.0002 0.2347 0.3676 0.0331 0.1589 Guadelope 0.0068 0.3986 0.5213 0.3188 0.3114 Guam 0.0041 .. 0.5505 0.2012 0.2520 Guatemala 0.0008 0.0197 0.0642 0.0468 0.0329 Guinea 0.0000 0.0066 0.0069 0.0048 0.0046 Guinea-Bissau 0.0001 .. .. 0.0000 0.0000 Guyana 0.0001 0.0551 0.0873 0.0057 0.0371 Honduras 0.0001 0.0191 0.0516 0.0193 0.0225 Hong Kong, China 0.0899 0.5899 0.6715 0.9733 0.5811 Hungary 0.0630 0.1489 0.4327 0.2495 0.2235 Iceland 0.5686 0.7178 0.7901 0.9564 0.7582 India 0.0001 0.0066 0.0309 0.0029 0.0101 Indonesia 0.0005 0.0180 0.0338 0.0162 0.0171 Iran, Islamic Rep. 0.0000 0.1005 0.1556 0.0109 0.0668 Iraq 0.0000 .. 0.0350 0.0000 0.0117 Ireland 0.0896 0.6237 0.5573 0.6752 0.4864 Israel 0.1334 0.4577 0.5498 0.7481 0.4723 Italy 0.0276 0.3803 0.5392 0.8084 0.4389 Jamaica 0.0008 0.0856 0.2220 0.0868 0.0988 Japan 0.1096 0.5693 0.6504 0.6881 0.5043 Jordan 0.0007 0.0374 0.1017 0.0380 0.0444 Kazakhstan 0.0012 .. 0.1261 0.0047 0.0440 Kenya 0.0001 0.0083 0.0120 0.0012 0.0054 Kiribati 0.0027 0.0243 0.0497 0.0038 0.0201 Korea, Dem. Rep. 0.0000 .. 0.0541 .. 0.0271 Korea, Rep. 0.0524 0.3651 0.5107 0.7755 0.4259 Kuwait 0.0116 0.2476 0.2802 0.2492 0.1972 Kyrgyz Republic 0.0016 .. 0.0925 0.0008 0.0316 Lao PDR
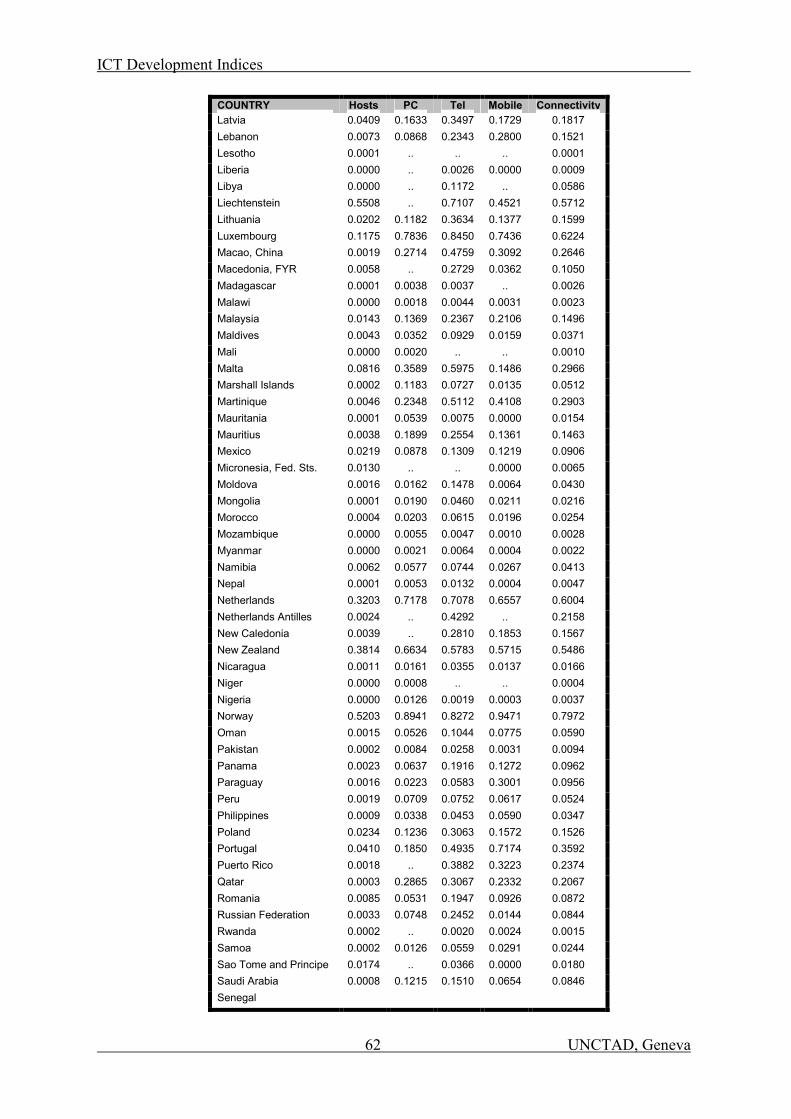
ICT Development Indices
62 UNCTAD, Geneva
COUNTRY Hosts PC Tel Mobile ConnectivityLatvia 0.0409 0.1633 0.3497 0.1729 0.1817 Lebanon 0.0073 0.0868 0.2343 0.2800 0.1521 Lesotho 0.0001 .. .. .. 0.0001 Liberia 0.0000 .. 0.0026 0.0000 0.0009 Libya 0.0000 .. 0.1172 .. 0.0586 Liechtenstein 0.5508 .. 0.7107 0.4521 0.5712 Lithuania 0.0202 0.1182 0.3634 0.1377 0.1599 Luxembourg 0.1175 0.7836 0.8450 0.7436 0.6224 Macao, China 0.0019 0.2714 0.4759 0.3092 0.2646 Macedonia, FYR 0.0058 .. 0.2729 0.0362 0.1050 Madagascar 0.0001 0.0038 0.0037 .. 0.0026 Malawi 0.0000 0.0018 0.0044 0.0031 0.0023 Malaysia 0.0143 0.1369 0.2367 0.2106 0.1496 Maldives 0.0043 0.0352 0.0929 0.0159 0.0371 Mali 0.0000 0.0020 .. .. 0.0010 Malta 0.0816 0.3589 0.5975 0.1486 0.2966 Marshall Islands 0.0002 0.1183 0.0727 0.0135 0.0512 Martinique 0.0046 0.2348 0.5112 0.4108 0.2903 Mauritania 0.0001 0.0539 0.0075 0.0000 0.0154 Mauritius 0.0038 0.1899 0.2554 0.1361 0.1463 Mexico 0.0219 0.0878 0.1309 0.1219 0.0906 Micronesia, Fed. Sts. 0.0130 .. .. 0.0000 0.0065 Moldova 0.0016 0.0162 0.1478 0.0064 0.0430 Mongolia 0.0001 0.0190 0.0460 0.0211 0.0216 Morocco 0.0004 0.0203 0.0615 0.0196 0.0254 Mozambique 0.0000 0.0055 0.0047 0.0010 0.0028 Myanmar 0.0000 0.0021 0.0064 0.0004 0.0022 Namibia 0.0062 0.0577 0.0744 0.0267 0.0413 Nepal 0.0001 0.0053 0.0132 0.0004 0.0047 Netherlands 0.3203 0.7178 0.7078 0.6557 0.6004 Netherlands Antilles 0.0024 .. 0.4292 .. 0.2158 New Caledonia 0.0039 .. 0.2810 0.1853 0.1567 New Zealand 0.3814 0.6634 0.5783 0.5715 0.5486 Nicaragua 0.0011 0.0161 0.0355 0.0137 0.0166 Niger 0.0000 0.0008 .. .. 0.0004 Nigeria 0.0000 0.0126 0.0019 0.0003 0.0037 Norway 0.5203 0.8941 0.8272 0.9471 0.7972 Oman 0.0015 0.0526 0.1044 0.0775 0.0590 Pakistan 0.0002 0.0084 0.0258 0.0031 0.0094 Panama 0.0023 0.0637 0.1916 0.1272 0.0962 Paraguay 0.0016 0.0223 0.0583 0.3001 0.0956 Peru 0.0019 0.0709 0.0752 0.0617 0.0524 Philippines 0.0009 0.0338 0.0453 0.0590 0.0347 Poland 0.0234 0.1236 0.3063 0.1572 0.1526 Portugal 0.0410 0.1850 0.4935 0.7174 0.3592 Puerto Rico 0.0018 .. 0.3882 0.3223 0.2374 Qatar 0.0003 0.2865 0.3067 0.2332 0.2067 Romania 0.0085 0.0531 0.1947 0.0926 0.0872 Russian Federation 0.0033 0.0748 0.2452 0.0144 0.0844 Rwanda 0.0002 .. 0.0020 0.0024 0.0015 Samoa 0.0002 0.0126 0.0559 0.0291 0.0244 Sao Tome and Principe 0.0174 .. 0.0366 0.0000 0.0180 Saudi Arabia 0.0008 0.1215 0.1510 0.0654 0.0846 Senegal
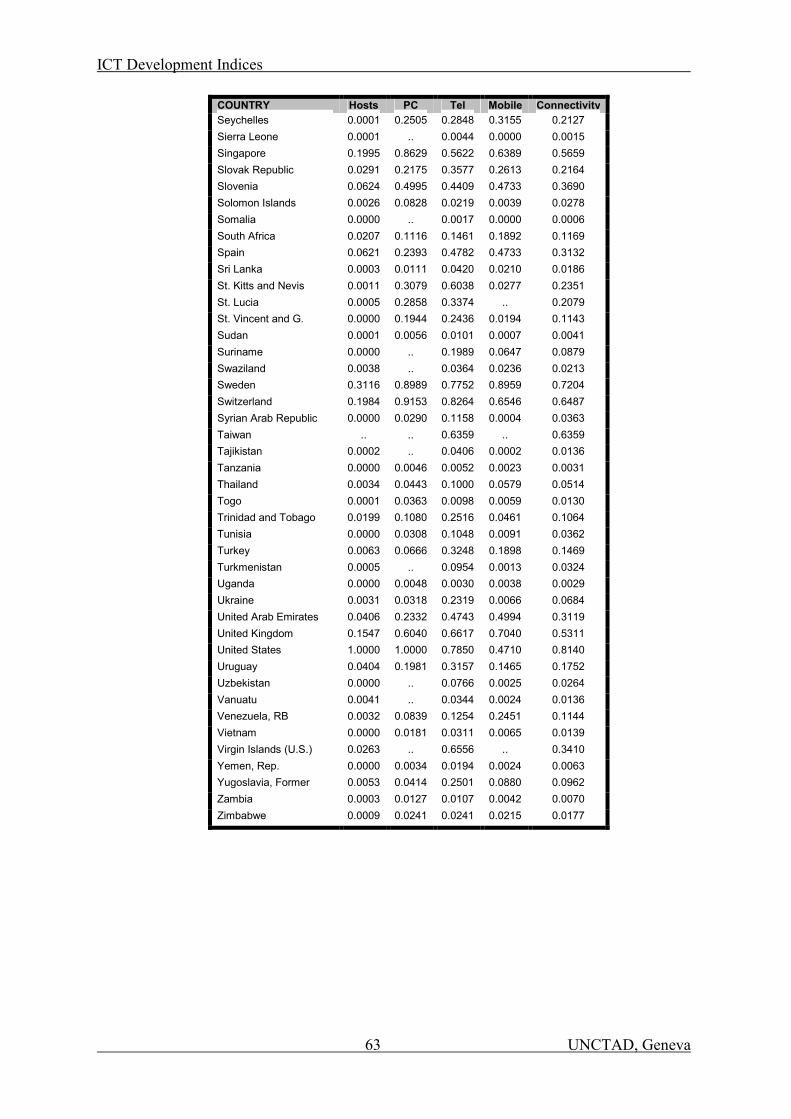
ICT Development Indices
63 UNCTAD, Geneva
COUNTRY Hosts PC Tel Mobile ConnectivitySeychelles 0.0001 0.2505 0.2848 0.3155 0.2127 Sierra Leone 0.0001 .. 0.0044 0.0000 0.0015 Singapore 0.1995 0.8629 0.5622 0.6389 0.5659 Slovak Republic 0.0291 0.2175 0.3577 0.2613 0.2164 Slovenia 0.0624 0.4995 0.4409 0.4733 0.3690 Solomon Islands 0.0026 0.0828 0.0219 0.0039 0.0278 Somalia 0.0000 .. 0.0017 0.0000 0.0006 South Africa 0.0207 0.1116 0.1461 0.1892 0.1169 Spain 0.0621 0.2393 0.4782 0.4733 0.3132 Sri Lanka 0.0003 0.0111 0.0420 0.0210 0.0186 St. Kitts and Nevis 0.0011 0.3079 0.6038 0.0277 0.2351 St. Lucia 0.0005 0.2858 0.3374 .. 0.2079 St. Vincent and G. 0.0000 0.1944 0.2436 0.0194 0.1143 Sudan 0.0001 0.0056 0.0101 0.0007 0.0041 Suriname 0.0000 .. 0.1989 0.0647 0.0879 Swaziland 0.0038 .. 0.0364 0.0236 0.0213 Sweden 0.3116 0.8989 0.7752 0.8959 0.7204 Switzerland 0.1984 0.9153 0.8264 0.6546 0.6487 Syrian Arab Republic 0.0000 0.0290 0.1158 0.0004 0.0363 Taiwan .. .. 0.6359 .. 0.6359 Tajikistan 0.0002 .. 0.0406 0.0002 0.0136 Tanzania 0.0000 0.0046 0.0052 0.0023 0.0031 Thailand 0.0034 0.0443 0.1000 0.0579 0.0514 Togo 0.0001 0.0363 0.0098 0.0059 0.0130 Trinidad and Tobago 0.0199 0.1080 0.2516 0.0461 0.1064 Tunisia 0.0000 0.0308 0.1048 0.0091 0.0362 Turkey 0.0063 0.0666 0.3248 0.1898 0.1469 Turkmenistan 0.0005 .. 0.0954 0.0013 0.0324 Uganda 0.0000 0.0048 0.0030 0.0038 0.0029 Ukraine 0.0031 0.0318 0.2319 0.0066 0.0684 United Arab Emirates 0.0406 0.2332 0.4743 0.4994 0.3119 United Kingdom 0.1547 0.6040 0.6617 0.7040 0.5311 United States 1.0000 1.0000 0.7850 0.4710 0.8140 Uruguay 0.0404 0.1981 0.3157 0.1465 0.1752 Uzbekistan 0.0000 .. 0.0766 0.0025 0.0264 Vanuatu 0.0041 .. 0.0344 0.0024 0.0136 Venezuela, RB 0.0032 0.0839 0.1254 0.2451 0.1144 Vietnam 0.0000 0.0181 0.0311 0.0065 0.0139 Virgin Islands (U.S.) 0.0263 .. 0.6556 .. 0.3410 Yemen, Rep. 0.0000 0.0034 0.0194 0.0024 0.0063 Yugoslavia, Former 0.0053 0.0414 0.2501 0.0880 0.0962 Zambia 0.0003 0.0127 0.0107 0.0042 0.0070 Zimbabwe 0.0009 0.0241 0.0241 0.0215 0.0177
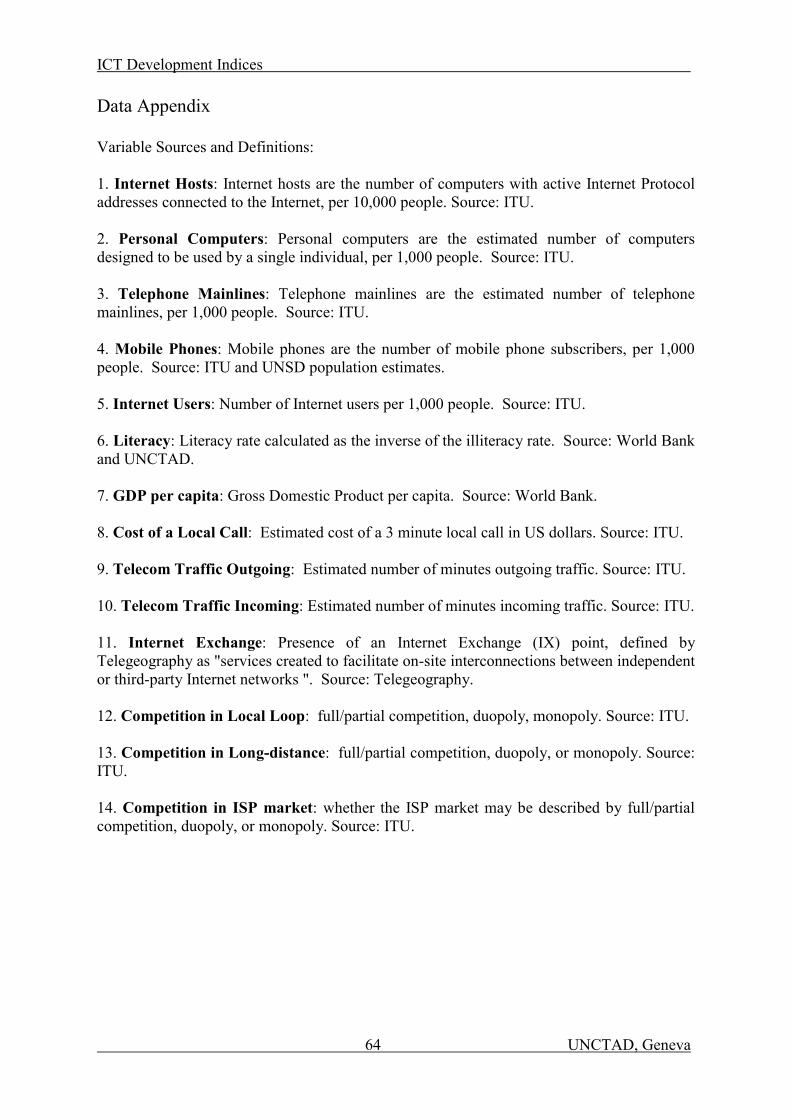
ICT Development Indices
64 UNCTAD, Geneva
Data Appendix Variable Sources and Definitions: 1. Internet Hosts: Internet hosts are the number of computers with active Internet Protocol addresses connected to the Internet, per 10,000 people. Source: ITU. 2. Personal Computers: Personal computers are the estimated number of computers designed to be used by a single individual, per 1,000 people. Source: ITU. 3. Telephone Mainlines: Telephone mainlines are the estimated number of telephone mainlines, per 1,000 people. Source: ITU. 4. Mobile Phones: Mobile phones are the number of mobile phone subscribers, per 1,000 people. Source: ITU and UNSD population estimates. 5. Internet Users: Number of Internet users per 1,000 people. Source: ITU. 6. Literacy: Literacy rate calculated as the inverse of the illiteracy rate. Source: World Bank and UNCTAD. 7. GDP per capita: Gross Domestic Product per capita. Source: World Bank. 8. Cost of a Local Call: Estimated cost of a 3 minute local call in US dollars. Source: ITU. 9. Telecom Traffic Outgoing: Estimated number of minutes outgoing traffic. Source: ITU. 10. Telecom Traffic Incoming: Estimated number of minutes incoming traffic. Source: ITU. 11. Internet Exchange: Presence of an Internet Exchange (IX) point, defined by Telegeography as "services created to facilitate on-site interconnections between independent or third-party Internet networks ". Source: Telegeography. 12. Competition in Local Loop: full/partial competition, duopoly, monopoly. Source: ITU. 13. Competition in Long-distance: full/partial competition, duopoly, or monopoly. Source: ITU. 14. Competition in ISP market: whether the ISP market may be described by full/partial competition, duopoly, or monopoly. Source: ITU.
ICT Development Indices
65 UNCTAD, Geneva
8. BIBLIOGRAPHY
Abramson, B. (2000) "Internet Globalization Indicators", Telecommunications Policy (24), 2000, pp. 69-74. Bridges.org (2001) "Comparison of E-Readiness Assessment Models" (http://www.bridges.org/ereadiness/report.html; current April 26, 2001). Cukier, K. N. (1998) "The global Internet: a primer", Telegeography 1999, Washington, D.C.: Telegeography 1999, pp. 112-145. Cukier, K. N. (1998) "Peering and Fearing: ISP Interconnection and Regulatory Issues", available from http://ksgwww.Harvard.edu/iip/iicompol/Papers/Cukier.html/ Hargittai, E. (1999), "Weaving the Western Web: Explaining Differences in Internet Connectivity Among OECD Countries", Telecommunications Policy (23), 1999, pp.701-718. Kedzie, C. (1997) "Communication and Democracy: Coincident Revolutions and the Emergent Dictator's Dilemma, RGSD-127, The RAND Corporation, Santa Monica CA, 1997 abstract at http://www.rand.org/cgi-bin/Abstracts/ordi/) Lall (2001) reviews the distinctions and evolution of these innovation indices in his article "Competitiveness Indices and Developing Countries: An Economic Evaluation of the GCR", World Development 2001. Lebre La Rovere, Renata (1996): "Diffusion of IT and the competitiveness of Brazilian Banking", in Roche, Edward Mozley and Michael James Blaine, eds. "Information Technology, Development and Policy" (1996). Georgia Institute of Technology High Tech Indicators and associated articles, available from (http://www.gatech.edu/) Goodman, S., Burkhart, G., Foster, W., Press, L., Tan, Z., Woodard, J. (1998) "The Global Diffusion of the Internet Project: An Initial Inductive Study", Fairfax, VA: SAIC 1998b available from http://mosaic.unomaha.edu/GDI1998/GDI1998.html. Gorman, S. P. and Malecki, E. J. (2000) "The Networks of the Internet: an Analysis of Provider Networks in the USA", Telecommunications Policy (24), 2000 pp. 113-134. Harvard University Information Technologies Group. "Readiness for the Networked World: A Guide for Developing Countries", Center for International Development, Harvard University, 2000 (http://www.readinessguide.org/). ITU case studies, Geneva: ITU, available from http://itu.int/ti/casestudies/ Jensen (2000) "The Internet in Africa", presented to the 2000 Conference of International Federation for Information Processing WG9.4 "Social Implications of Computers in Developing Countries".
ICT Development Indices
66 UNCTAD, Geneva
McConnell International, "Risk E-Business: Seizing the Opportunity of Global E-Readiness" (August 2000), subsequently updated: "Ready? Net. Go! Partnerships Leading the Global Economy" (May 2001), available from http://www.mcconnellinternational.com. Mosaic Group "Global Diffusion of the Internet Project Webpage" (2000), homepage at http://mosaic.unomaha.edu/gdi.html Netcraft, "The Netcraft Web Server Survey", 2000, available from http://www. netcraft.com/ Nua Internet Surveys, "How Many Online?", 2001, available from http://www. nua.ie/surveys Nua Internet Surveys, "Methodology", 2000, available from http://www. nua.ie/surveys/ OECD (2001) "The New Economy: Beyond the Hype", Final Report on the OECD Growth Project, 2001. Porter, Michael E. and Stern, Scott (1999) "The New Challenge to America's Prosperity: Findings from the Innovation Index" (Washington, D.C.). Press, L. (1999) "The state of the Internet: Growth and Gaps", available from www.isoc.org/inet2000/cdproceedings/8e/8e_4" Press, L. (1997) "Tracking the Global Diffusion of the Internet", Communications of the ACM (40:11), 1997b, pp. 11-17 Press, L., Burkhart, G., Foster, W., Goodman, S., Wolcott, P., and Woodard, J. (1997) "An Internet Diffusion Framework", Communications of the ACM (41:10), 1997b, pp. 21-26. Rao, Bhandhari, Iqbal, Sinha and Wahaj us Siraj (1999) "Struggling with the Digital Divide: Internet Infrastructure, Policies and Regulations in South Asia". Robinson, K.K., and Crenshaw, E.M. (1999) "Cyber-Space and Post-Industrial Transformations: A Cross-National Analysis of Internet Development", Working Paper, Dept. of Sociology, Ohio State University, December 1999. Rodriguez & Wilson (2000) "Are Poor Countries Losing the Information Revolution?" May 2000, infoDev Working Group, World Bank. UNDP Human Development Report, 2001: Making New Technologies Work For Human Development, UNDP, New York. Van Ryckeghem, Dominique (1996) "Computers and Culture: cases from Kenya" in Roche, Edward Mozley and Michael James Blaine, eds. "Information Technology, Development and Policy" (1996). WEF, The Global Competitiveness Report, 2000: World Economic Forum, Oxford University Press. Wolcott, P., Goodman, S., and Burkhart, G., (1996) "The Information Technology Capability of Nations: A Framework for Analysis", 1996, available at http://mosaic.unomaha.edu/
Recommended