INDICATORS OF THE STRENGTH OF
PUBLIC MANAGEMENT SYSTEMS
JANUARY 29, 2014
GOVNET MEETING, BRUSSELS
Jordan Holt, [email protected]
1

What are we trying to do?
Identify a comprehensive and comprehensible set of
indicators of the strength of public management systems
with the following characteristics:
Governments can improve upon the scores
There is evidence of instrumental value or consensus on
intrinsic value
They should be easy to collect regularly for a large enough
set of countries at reasonable cost
2

Who are the indicators for? 3
Governments
• Set targets for reforms and monitor and evaluate progress
• Strengthen ownership of reform objectives
Donors
•Set targets for projects, track impact, and hold themselves accountable
•Make decisions about using country systems
Researchers
• Build an evidence base of what reforms work in what contexts and what really matters for development outcomes
Citizens and civil society
• Monitor performance
• Hold governments to account and advocate for change
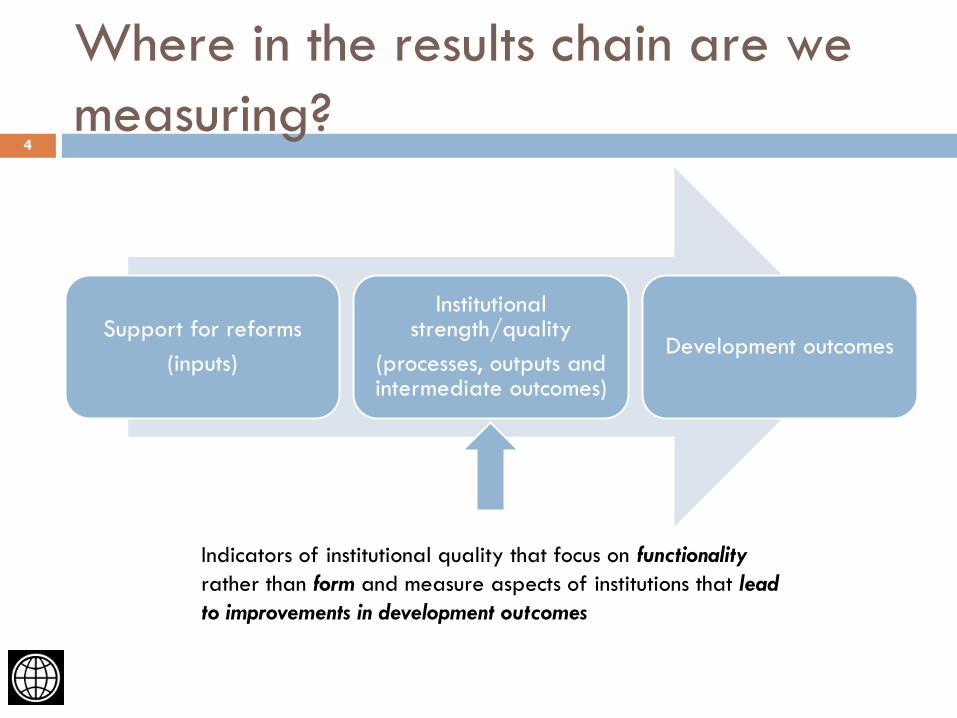
Where in the results chain are we
measuring?
Support for reforms
(inputs)
Institutional strength/quality
(processes, outputs and intermediate outcomes)
Development outcomes
4
Indicators of institutional quality that focus on functionality
rather than form and measure aspects of institutions that lead
to improvements in development outcomes

What public management systems are
we focusing on? 5
The focus is on upstream systems and institutions
Public
Financial
Management
Procurement Tax Admin. Public Admin.
and Civil
Service
Public
Information
Transparency, Accountability & Participation
*The scope of the project may be expanded to cover
more public management systems such as public
investment management, intergovernmental systems,
regulatory management, policy management and
oversight systems

Effective Institutions Platform 6
Ma
king
Refo
rm H
ap
pen
Ind
ica
tors
for
Succ
ess
Dom
est
ic R
eso
urce
Mob
iliza
tion
Use
of
Count
ry S
yst
em
s
Acc
ount
ab
le a
nd
Incl
usive
Inst
itutions
ISPMS is conducted under “Indicators for Success” but can contribute to other
pillars too

What is our approach?
1. Identify a set of “systems”
2. Agree on a set of criteria
3. Apply criteria to available indicators
4. Are there gaps? What stories can
we tell?
5. Identify strategy to fill in
gaps 6. Build consensus
Overarching principle: Draw on existing efforts, avoid duplication
and enable sustainable collection
7
-Effective Institutions Platform
-Steering Group (BMZ, DFID, ADB, DFAT Canada, SIDA,
AusAid, OECD, Global Integrity, IBP,
Transparency International)

What have we done so far?
Launched Secretariat (housed in World Bank)
Set up Steering Group and Technical Expert Groups
3 virtual meetings (May 2013, July 2013, and
November 2013)
1 in-person meeting in Bonn in August 2013
Established set of criteria for a “good” indicator
Completed phase 1: 100 existing indicators meet
criteria, gaps and challenges identified
3 discussion notes describe: how the criteria were
applied, challenges in their application, and gaps
8
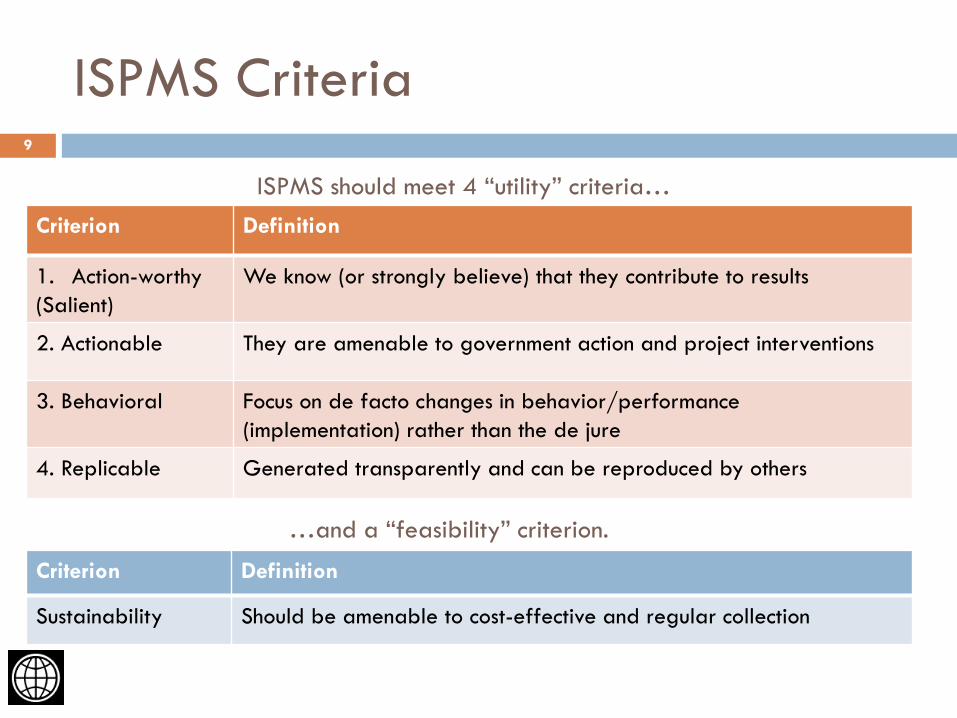
ISPMS Criteria
ISPMS should meet 4 “utility” criteria…
Criterion Definition
1. Action-worthy
(Salient)
We know (or strongly believe) that they contribute to results
2. Actionable They are amenable to government action and project interventions
3. Behavioral Focus on de facto changes in behavior/performance
(implementation) rather than the de jure
4. Replicable Generated transparently and can be reproduced by others
…and a “feasibility” criterion.
Criterion Definition
Sustainability Should be amenable to cost-effective and regular collection
9

Of about 750 existing indicators, only
about 100 meet the criteria
0 5 10 15 20 25
Public Information Systems
Procurement
Tax
Public Adminsitration and CivilService
PFM
Number of indicators that meet ISPMScriteria
Don’t yet
meet
feasibility
criteria
Shortlist of most “action-
worthy”
10
Key challenges in applying
the criteria to existing
indicators:
• How strictly should the action-
worthiness and behavioral
criteria be applied? (For
example, is publication of
information enough or should
we be concerned with how it
is used?)
• Trade-offs among criteria
(e.g. actionable and action-
worthy)
[See discussion notes]
Focus on the public availability
of key pieces of information
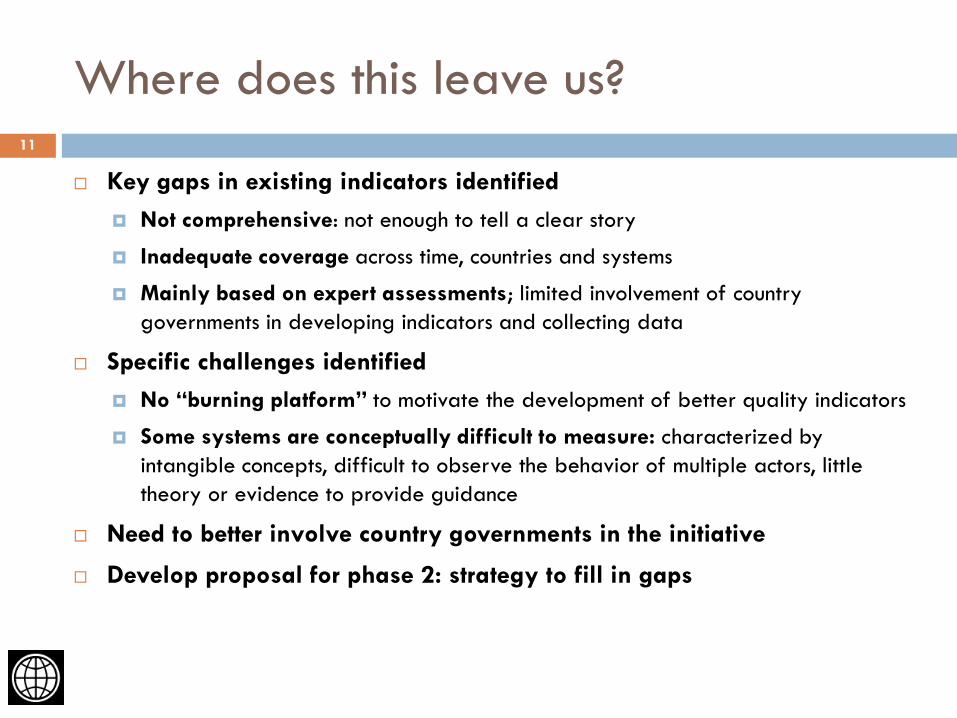
Where does this leave us?
Key gaps in existing indicators identified
Not comprehensive: not enough to tell a clear story
Inadequate coverage across time, countries and systems
Mainly based on expert assessments; limited involvement of country
governments in developing indicators and collecting data
Specific challenges identified
No “burning platform” to motivate the development of better quality indicators
Some systems are conceptually difficult to measure: characterized by
intangible concepts, difficult to observe the behavior of multiple actors, little
theory or evidence to provide guidance
Need to better involve country governments in the initiative
Develop proposal for phase 2: strategy to fill in gaps
11
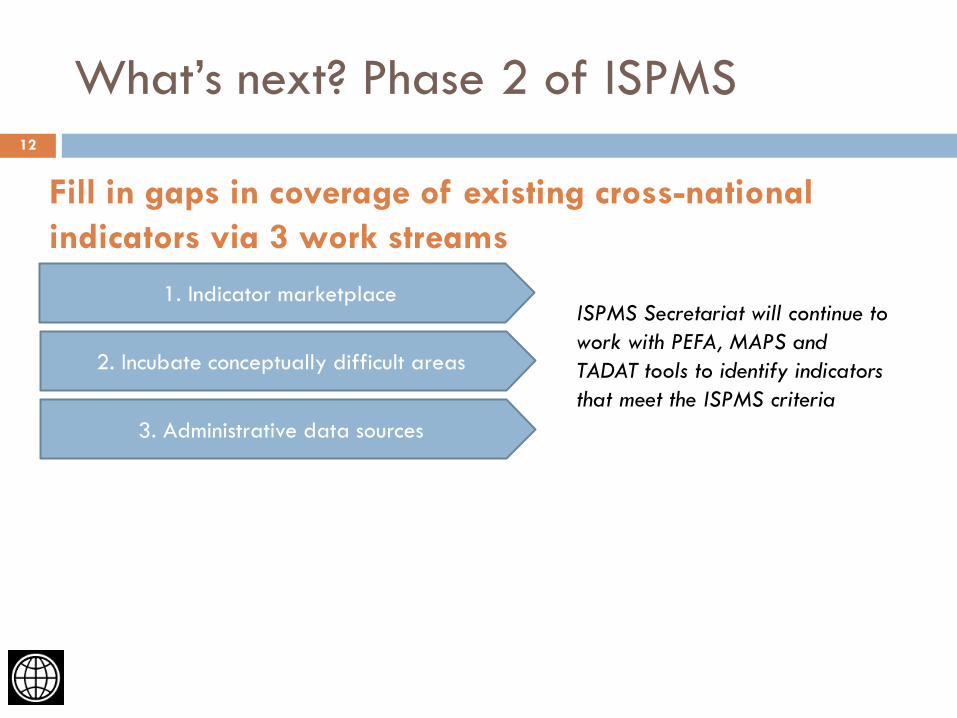
What’s next? Phase 2 of ISPMS
1. Indicator marketplace
2. Incubate conceptually difficult areas
3. Administrative data sources
Fill in gaps in coverage of existing cross-national
indicators via 3 work streams
12
ISPMS Secretariat will continue to
work with PEFA, MAPS and
TADAT tools to identify indicators
that meet the ISPMS criteria

1. Indicator Marketplace 13
Publicize existing indicators
Hold competition for "new" indicators
Launch at April 2014 Global
Partnership Mtg
Connect winners with data
collectors and funding
Approach
Why? Need for more inclusive approach to developing indicators and broader
discussion about what should be measured and how
Targeted participants: both data collectors and idea generators from the
general public, civil society/international NGOs, researchers,
development practitioners/agencies, private entrepreneurs
Financial and reputational incentives to participate will be provided
Focus areas All public management systems; indicators that are either entirely new
(untested) or have been piloted but are worth scaling up

2. Incubating indicators in difficult areas 14
Approach
Public administration & civil service Public information systems
“A PEFA for PACS”: develop
international consensus around a
set of indicators
Focus on right to information
regimes. Test indicators in pilot
countries to learn more about what
is appropriate in different contexts.
Why?
Focus areas
• Limited theory/evidence/consensus connecting “systems” to
development outcomes
• Difficult to operationalize certain concepts for measurement without
relying on “form” (e.g. transparency or meritocracy)
• Difficult to observe the behavior of multiple actors
3. Administrative data sources 15
Approach Take stock of
publicly reported data
Identify potential indicators
(Compare/build on PEFA and
MAPS)
Analyze comparability
Develop mechanism to collect and
report data on a regular basis
Public financial management Procurement
Why?
Focus areas
Most existing indicators are based on expert assessments; data from
administrative sources can be collected more frequently (and sustainably)
and can be better suited for research
Examples:
• Contract management (share of contracts with
schedule delays or cost overruns)
• Data on PEFA indicators (system outturns)

How can you contribute?
Participate in the Steering Group or Technical Expert Groups
Participate in the marketplace: share your indicator ideas!
Promote the marketplace to your networks.
Provide us feedback on what types of data and indicators you need for
your projects.
Help us reach out to your counterparts in country governments.
Country governments are invited to participate in the Steering Group or
individually in various work streams to provide input and feedback on what
indicators are the most useful and feasible in their contexts.
Countries could share ideas for indicators via the marketplace or help pilot new
indicators.
Vietnam, Bangladesh and the Pacific Islands Forum have all expressed interest in
joining the initiative
16

Thank you!
Full set of indicators is available at:
http://go.worldbank.org/99F3LCSFR0
17
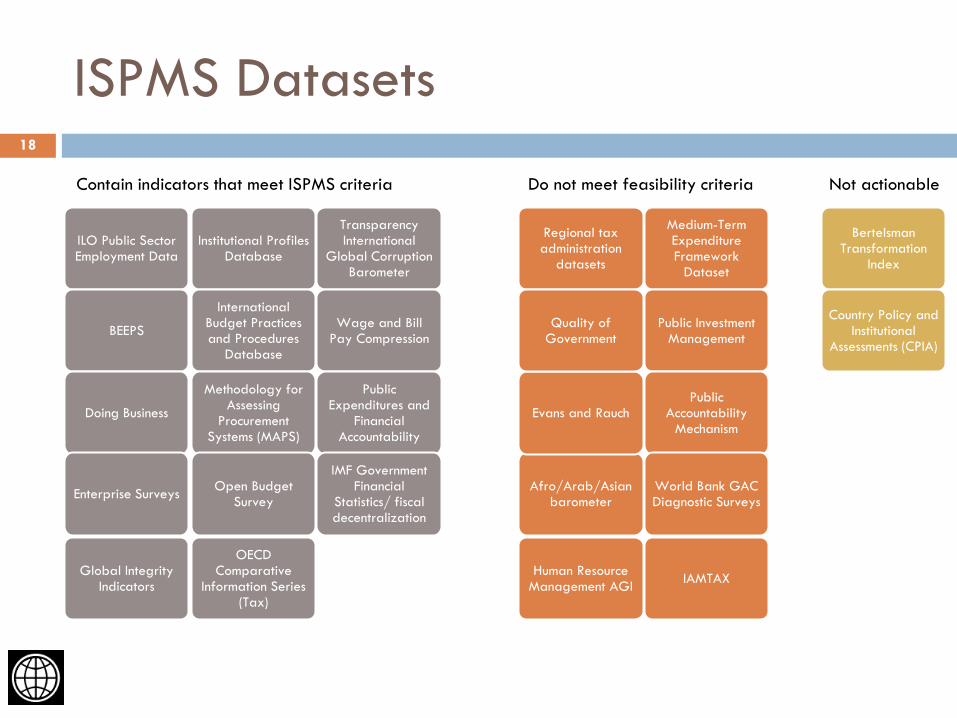
ISPMS Datasets 18
ILO Public Sector Employment Data
BEEPS
Doing Business
Enterprise Surveys
Global Integrity Indicators
Institutional Profiles Database
International Budget Practices and Procedures
Database
Methodology for Assessing
Procurement Systems (MAPS)
Open Budget Survey
Transparency International
Global Corruption Barometer
OECD Comparative
Information Series (Tax)
Wage and Bill Pay Compression
Public Expenditures and
Financial Accountability
IMF Government Financial
Statistics/ fiscal decentralization
Afro/Arab/Asian barometer
Human Resource Management AGI
IAMTAX
Medium-Term Expenditure Framework
Dataset
Public Investment Management
Public Accountability
Mechanism
World Bank GAC Diagnostic Surveys
Regional tax administration
datasets
Evans and Rauch
Quality of Government
Bertelsman Transformation
Index
Country Policy and Institutional
Assessments (CPIA)
Contain indicators that meet ISPMS criteria Do not meet feasibility criteria Not actionable

PACS indicators 19
Subsystem Indicator Value Year Value Year Value Year Value Year Value YearIn practice, civi l servants are appointed and evaluated according to profess ional
cri teria . (Global integri ty 45b) (100 = high, 0 = low) 50 2011 25 2010 50 2010 50 2006 50 2011
In practice, civi l service management actions (e.g. hi ring, fi ring, promotions) are not
based on nepotism, cronyism, or patronage. (Global Integri ty 45c) (100 = high, 0 = low) 50 2011 25 2010 50 2010 50 2006 50 2011
How do graduates of the country's most el i te univers i ty(ies ) view a publ ic sector
career? (Evans and Rauch 19)
(1 = best possible career option, 4 = second best option relative to private sector) 3.25
1970-
1990 4
1970-
1990 3.67
1970-
1990
How do members of the educated middle class who are not in a pos i tion to attend the
most el i te univers i ties view a publ ic sector career? (Evans and Rauch 20)
(1 = best possible career option, 4 = second best option relative to private sector) 3
1970-
1990 2.5
1970-
1990 4
1970-
1990
Senior officia ls have sa laries that are comparable with the sa laries of private sector
managers with roughly s imi lar tra ining and respons ibi l i ties? (Qual i ty of Government 2j)
(1 = hardly ever, 7 = almost always) 3.27
2008-
2012 2.73
2008-
2012 1.5
2008-
2012 3.25
2008-
2012
Wage Compress ion Ratio (the ratio of the highest sa lary to the lowest on the centra l
government's main sa lary sca le) 9.5 2008 4 2003
Centra l government wages as % of expenditures
Centra l government wages as % of GDP 3.55 2008 6.93 2008 7.25 2008
Centra l government wages as % of revenue 31.95 2008 33.51 2008 29.63 2008 32.74 2008
General government wages as % of expenditures 24.02 2005
General government wages as % of GDP 10.08 2005
General government wages as % of revenue 24.09 2005
When deciding how to implement pol icies in individual cases , publ ic sector employees
treat some groups in society unfa irly? (Qual i ty of Government 2h)
(1 = hardly ever, 7 = almost always) 4.47
2008-
2012 4.71
2008-
2012 5.67
2008-
2012 4.50
2008-
2012
How often would you say that publ ic sector employees today act impartia l ly when
deciding how to implement a pol icy in an individual case? (Qual i ty of Government 4)
(1 = not at all, 7 = to a very large extent) 3.67
2008-
2012 3.75
2008-
2012 3.00
2008-
2012 3.80
2008-
2012
Publ ic sector employees s trive to fol low rules . (Qual i ty of Government 8d)
(1 = not at all, 7 = to a very large extent) 4.53
2008-
2012 4.80
2008-
2012 4.33
2008-
2012 5.25
2008-
2012
Publ ic sector employees s trive to help ci tizens . (Qual i ty of Government 8c)
(1 = not at all, 7 = to a very large extent) 4.27
2008-
2012 4.93
2008-
2012 3.50
2008-
2012 5.25
2008-
2012
Publ ic sector employees s trive to implement the pol icies decided upon by the top
pol i tica l leadership. (Qual i ty of Government 8b) (1 = not at all, 7 = to a very large extent) 5.00
2008-
2012 4.73
2008-
2012 3.80
2008-
2012 5.50
2008-
2012
Publ ic sector employees s trive to ful fi l l the ideology of the party/parties in government.
(Qual i ty of Government 8e) (1 = not at all, 7 = to a very large extent) 5.13
2008-
2012 3.53
2008-
2012 5.67
2008-
2012 5.25
2008-
2012
Public Administration and Civil Service
Access on meri t
and competition
Accountabi l i ty
Attractiveness
Affordabi l i ty
Colombia Philippines Bangladesh Congo, DR Kenya
Indicators highlighted in grey do not meet the ISPMS feasibility criteria because time series data are not available.

PFM indicators 20
Subsystem Indicator Value Year Value Year Value Year Value Year Value Year
Aggregate expenditure out-turn compared to origina l approved budget: The di fference between
actual primary expenditure and the origina l ly budgeted primary expenditure (PEFA PI-1)A 2009 NR 2010 B 2010 D 2008 B 2012
Compos ition of expenditure out-turn compared to origina l approved budget: Extent to which
variance in primary expenditure compos ition exceeded overa l l deviation in primary expenditure
(PEFA PI-2)
B 2009 NR 2010 D+ 2010 D 2008 C+ 2012
Stock of expenditure payment arrears (PEFA PI-4i ) C 2009 C 2010 NR 2010 D 2008 C 2012
Avai labi l i ty of data for monitoring the s tock of expenditure payment arrears (PEFA PI-4i i ) D 2009 D 2010 D 2010 D 2008 B 2012
Exis tence of and adherence to a fixed budget ca lendar (PEFA PI-11i ) A 2009 B 2010 B 2010 D 2008 B 2012
Timely budget approval by the legis lature or s imi larly mandated body (during the last three
years ) (PEFA PI-11i i )D 2009 A 2010 C 2010 C 2008 A 2012
Predictabi l i ty in the ava i labi l i ty of funds for commitment of expenditures : Rel iabi l i ty and
horizon of periodic in-year information to MDAs on cei l ings for expenditure commitment (PEFA PI-
16i i )
A 2009 D 2010 B 2010 D 2008 B 2012
Effectiveness of payrol l controls : Personnel database and payrol l are di rectly l inked to ensure
data cons is tency and monthly reconci l iation (PEFA PI-18i )C 2009 C 2010 D 2010 D 2008 A 2012
Extent of consol idation of the government’s cash balances (PEFA PI-17i i ) B 2009 B 2010 B 2010 B 2008 C 2012
Regulari ty of bank reconci l iations (PEFA PI-22i ) B 2009 D 2010 B 2010 B 2008 D 2012
Regulari ty of reconci l iation and clearance of suspense accounts and advances (PEFA PI-22i i ) NR 2009 D 2010 B 2010 D 2008 D 2012
Timel iness of the i ssue of in-year budget reports (PEFA PI-24i i ) A 2009 D 2010 B 2010 C 2008 A 2012
Timel iness of submiss ion of the annual financia l s tatements (PEFA PI-25i i ) A 2009 D 2010 D 2010 B 2008 C 2012
What i s the most deta i l provided by the Ci tizens Budget? (Open Budget Survey 109) D 2012 D 2012 D 2012 D 2012 B 2012
How often does the executive release to the publ ic in-year reports on actual expenditure
(organized by adminis trative unit, economic class i fication and/or function)? (Open Budget Survey
63)
B 2012 A 2012 A 2012 A 2012 B 2012
Does the executive release to the publ ic a Mid-Year Review of the budget that includes updated
expenditure estimates for the budget year underway? (Open Budget Survey 74)D 2012 D 2012 B 2012 D 2012 D 2012
Two years after the end of a fi sca l year, what percentage of annual expenditures has been
audited and included in (except for secret programs) the Audit Report(s ) released to the publ ic?
(Open Budget Survey 88)
A 2012 A 2012 D 2012 D 2012 A 2012
Scope/nature of audit performed (incl . adherence to auditing s tandards). (PEFA PI-26i ) B 2009 A 2010 C 2010 B 2008 C 2012
Timel iness of submiss ion of audit reports to the legis lature (PEFA PI-26i i ) B 2009 NA 2010 D 2010 D 2008 B 2012
Adequacy of time for the legis lature to provide a response to budget proposals (PEFA PI-27i i i ) A 2009 A 2010 D 2010 B 2008 A 2012
Timel iness of examination of audit reports by the legis lature (PEFA PI-28i ) B 2009 D 2010 D 2010 D 2008 C 2012
For in-year reports on actual expenditure released to the publ ic by the executive, how much time
typica l ly elapses between the end of the reporting period and when the report i s released?
(Open Budget Survey 72)
A 2012 A 2012 C 2012 B 2012 B 2012
What level of deta i l i s the focus of the explanation of the di fferences between the enacted
levels and the actual outcome for expenditures presented in the year-end report? (Open Budget
Survey 80)
B 2012 D 2012 D 2012 D 2012 D 2012
Kenya
External scrutiny
and audit
Colombia Philippines Bangladesh Congo, DRPublic Financial Management
Credibi l i ty of the
budget
Predictabi l i ty and
control in budget
execution
Pol icy-based
budgeting
Accounting,
recording and
reporting
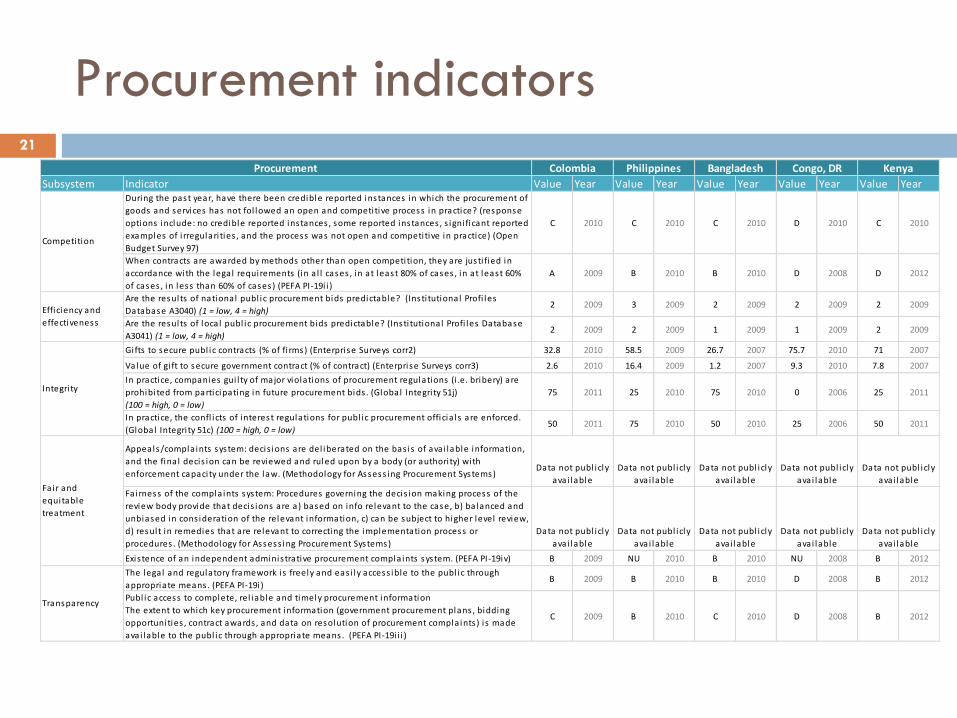
Procurement indicators 21
Subsystem Indicator Value Year Value Year Value Year Value Year Value YearDuring the past year, have there been credible reported instances in which the procurement of
goods and services has not fol lowed an open and competitive process in practice? (response
options include: no credible reported instances , some reported instances , s igni ficant reported
examples of i rregulari ties , and the process was not open and competitive in practice) (Open
Budget Survey 97)
C 2010 C 2010 C 2010 D 2010 C 2010
When contracts are awarded by methods other than open competition, they are justi fied in
accordance with the legal requirements (in a l l cases , in at least 80% of cases , in at least 60%
of cases , in less than 60% of cases) (PEFA PI-19i i )
A 2009 B 2010 B 2010 D 2008 D 2012
Are the results of national publ ic procurement bids predictable? (Insti tutional Profi les
Database A3040) (1 = low, 4 = high)2 2009 3 2009 2 2009 2 2009 2 2009
Are the results of loca l publ ic procurement bids predictable? (Insti tutional Profi les Database
A3041) (1 = low, 4 = high)2 2009 2 2009 1 2009 1 2009 2 2009
Gifts to secure publ ic contracts (% of fi rms) (Enterprise Surveys corr2) 32.8 2010 58.5 2009 26.7 2007 75.7 2010 71 2007
Value of gi ft to secure government contract (% of contract) (Enterprise Surveys corr3) 2.6 2010 16.4 2009 1.2 2007 9.3 2010 7.8 2007
In practice, companies gui l ty of major violations of procurement regulations (i .e. bribery) are
prohibi ted from participating in future procurement bids . (Global Integri ty 51j)
(100 = high, 0 = low)
75 2011 25 2010 75 2010 0 2006 25 2011
In practice, the confl icts of interest regulations for publ ic procurement officia ls are enforced.
(Global Integri ty 51c) (100 = high, 0 = low)50 2011 75 2010 50 2010 25 2006 50 2011
Appeals/compla ints system: decis ions are del iberated on the bas is of ava i lable information,
and the fina l decis ion can be reviewed and ruled upon by a body (or authori ty) with
enforcement capacity under the law. (Methodology for Assess ing Procurement Systems)
Fairness of the compla ints system: Procedures governing the decis ion making process of the
review body provide that decis ions are a) based on info relevant to the case, b) ba lanced and
unbiased in cons ideration of the relevant information, c) can be subject to higher level review,
d) result in remedies that are relevant to correcting the implementation process or
procedures . (Methodology for Assess ing Procurement Systems)
Exis tence of an independent adminis trative procurement compla ints system. (PEFA PI-19iv) B 2009 NU 2010 B 2010 NU 2008 B 2012
The legal and regulatory framework is freely and eas i ly access ible to the publ ic through
appropriate means . (PEFA PI-19i )B 2009 B 2010 B 2010 D 2008 B 2012
Publ ic access to complete, rel iable and timely procurement information
The extent to which key procurement information (government procurement plans , bidding
opportunities , contract awards , and data on resolution of procurement compla ints ) i s made
avai lable to the publ ic through appropriate means . (PEFA PI-19i i i )
C 2009 B 2010 C 2010 D 2008 B 2012
Competition
Efficiency and
effectiveness
Integri ty
Fair and
equitable
treatment
Transparency
Procurement Colombia Philippines Bangladesh Congo, DR Kenya
Data not publ icly
ava i lable
Data not publ icly
ava i lable
Data not publ icly
ava i lable
Data not publ icly
ava i lable
Data not publ icly
ava i lable
Data not publ icly
ava i lable
Data not publ icly
ava i lable
Data not publ icly
ava i lable
Data not publ icly
ava i lable
Data not publ icly
ava i lable

Tax indicators 22
Subsystem Indicator Value Year Value Year Value Year Value Year Value YearTotal time spent to pay taxes (hours )
(Doing Bus iness )203 2013 193 2013 302 2013 336 2013 340 2013
The percentage of ci tizens who have come into contact with tax officia ls over the past year who
have paid bribes . (Transparency International Q7 Global Corruption Barometer)22 2013 12 2013 39 2013 46 2013 70 2013
Percent of Fi rms expected to give gi fts in meetings with tax officia ls . (Enterprise Survey corr 1) 2.8 2010 18.6 2009 85.1 2007 65.7 2010 79.2 2007
The total tax adminis tration cost as a percent of the total revenue col lections (OECD CIS) 0.68 2011
The extent to which taxpayers are regis tered in a complete database system with
comprehens ive direct l inkages to other relevant government regis tration systems and financia l
sector regulations . (PEFA PI-14i )
B 2009 C 2010 C 2010 D 2008 C 2012
Percent of fi rms formal ly regis tered when began operations (Enterprise Survey infor4) 94.3 2010 97.5 2009 61.9 2010
Number of years fi rms operated without formal regis tration (Enterprise Survey infor5) 0.5 2010 0.5 2009 1.9 2010
Clari ty and comprehens iveness of tax l iabi l i ties : The extent to which legis lation and procedures
for a l l major taxes are comprehens ive and clear, with s trictly l imited discretionary powers of a l l
government enti ties involved. (PEFA PI-13i )
D 2009 D 2010 D 2010 D 2008 B 2012
Taxpayer access to information on tax l iabi l i ty: The extent to which taxpayers have easy access
to comprehens ive, user friendly and up-to-date information on tax l iabi l i ties and adminis trative
procedures for a l l major taxes , supplemented with active taxpayer education campaigns .
(PEFA PI-13i i )
A 2009 C 2010 B 2010 C 2008 A 2012
Percentage of fi rms identi fying tax adminis tration as a “major” or “very severe” obstacle
(Enterprise Survey reg 5)28.6 2010 15.2 2009 30 2007 56.8 2010 32 2007
Percentage of establ ishments that cons ider the tax adminis tration to be the biggest obstacle
(Enterprise Survey obst13)0.5 2010 1.6 2009 0.3 2007 6 2010 1.7 2007
Payment gap (proxy): Aggregated revenue outturn compared to budget (PEFA PI-3) A 2009 A 2010 B 2010 D 2008 B 2012
Effectiveness of transfer of tax col lection to the Treasury: The frequency with which a l l tax
revenue is transferred into accounts control led by the Treasury (da i ly, weekly, monthly, etc.)
(PEFA PI-15i i )
A 2009 C 2010 B 2010 B 2008 B 2012
Frequency of complete account reconci l iation between tax assessments , col lections , arrears
records and receipts by the Treasury (monthly, quarterly, annual ly, etc.) (PEFA PI-15i i i )D 2009 D 2010 D 2010 A 2008 A 2012
Arrears
Col lection ratio for gross tax arrears : Percentage of tax arrears at the beginning of a fi sca l year,
which was col lected during that fi sca l year (average of the last two fisca l years ). (PEFA PI-15i )D 2009 A 2010 D 2010 D 2008 D 2012
Appeals
Exis tence and functioning of a tax appeals mechanism: The extent to which the tax appeals
system has transparent adminis trative procedures with appropriate checks and balances ,
implemented through independent insti tutional s tructures and completely set up and
effectively operating with satis factory access and fa i rness , and i ts decis ions are promptly acted
upon. (PEFA PI-13i i i )
B 2009 B 2010 C 2010 D 2008 B 2012
Percent of e-fi led returns - Personal Income Tax (OECD CIS) 6 2011
Percent of e-fi led returns - Corporate Income Tax (OECD CIS) 23 2011
Percent of e-fi led returns - VAT (OECD CIS) 24 2011
Revenue Administration
Strategic
Payment
Return fi l ing
Regis tration
Taxpayer service
Colombia Philippines Bangladesh Congo, DR Kenya
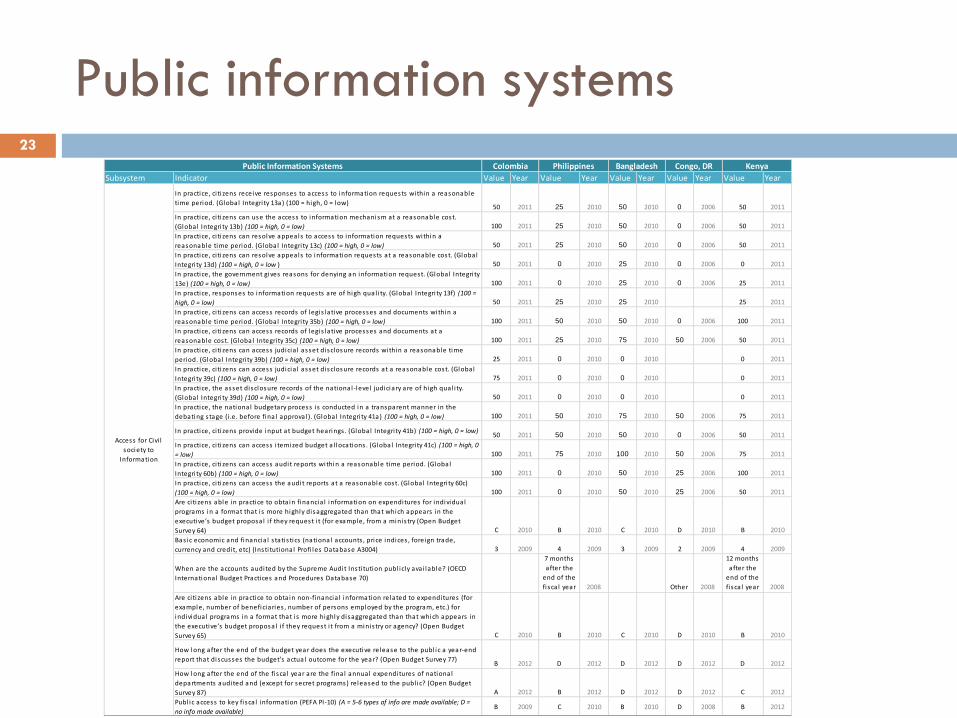
Public information systems 23
Subsystem Indicator Value Year Value Year Value Year Value Year Value Year
In practice, ci ti zens receive responses to access to information requests within a reasonable
time period. (Global Integri ty 13a) (100 = high, 0 = low)50 2011 25 2010 50 2010 0 2006 50 2011
In practice, ci ti zens can use the access to information mechanism at a reasonable cost.
(Global Integri ty 13b) (100 = high, 0 = low) 100 2011 25 2010 50 2010 0 2006 50 2011
In practice, ci ti zens can resolve appeals to access to information requests within a
reasonable time period. (Global Integri ty 13c) (100 = high, 0 = low) 50 2011 25 2010 50 2010 0 2006 50 2011
In practice, ci ti zens can resolve appeals to information requests at a reasonable cost. (Global
Integri ty 13d) (100 = high, 0 = low ) 50 2011 0 2010 25 2010 0 2006 0 2011
In practice, the government gives reasons for denying an information request. (Global Integri ty
13e) (100 = high, 0 = low) 100 2011 0 2010 25 2010 0 2006 25 2011
In practice, responses to information requests are of high qual i ty. (Global Integri ty 13f) (100 =
high, 0 = low) 50 2011 25 2010 25 2010 25 2011
In practice, ci ti zens can access records of legis lative processes and documents within a
reasonable time period. (Global Integri ty 35b) (100 = high, 0 = low) 100 2011 50 2010 50 2010 0 2006 100 2011
In practice, ci ti zens can access records of legis lative processes and documents at a
reasonable cost. (Global Integri ty 35c) (100 = high, 0 = low) 100 2011 25 2010 75 2010 50 2006 50 2011
In practice, ci ti zens can access judicia l asset disclosure records within a reasonable time
period. (Global Integri ty 39b) (100 = high, 0 = low) 25 2011 0 2010 0 2010 0 2011
In practice, ci ti zens can access judicia l asset disclosure records at a reasonable cost. (Global
Integri ty 39c) (100 = high, 0 = low) 75 2011 0 2010 0 2010 0 2011
In practice, the asset disclosure records of the national -level judiciary are of high qual i ty.
(Global Integri ty 39d) (100 = high, 0 = low) 50 2011 0 2010 0 2010 0 2011
In practice, the national budgetary process i s conducted in a transparent manner in the
debating s tage (i .e. before fina l approval ). (Global Integri ty 41a) (100 = high, 0 = low) 100 2011 50 2010 75 2010 50 2006 75 2011
In practice, ci ti zens provide input at budget hearings . (Global Integri ty 41b) (100 = high, 0 = low)50 2011 50 2010 50 2010 0 2006 50 2011
In practice, ci ti zens can access i temized budget a l locations . (Global Integri ty 41c) (100 = high, 0
= low) 100 2011 75 2010 100 2010 50 2006 75 2011
In practice, ci ti zens can access audit reports within a reasonable time period. (Global
Integri ty 60b) (100 = high, 0 = low) 100 2011 0 2010 50 2010 25 2006 100 2011
In practice, ci ti zens can access the audit reports at a reasonable cost. (Global Integri ty 60c)
(100 = high, 0 = low) 100 2011 0 2010 50 2010 25 2006 50 2011
Are ci ti zens able in practice to obta in financia l information on expenditures for individual
programs in a format that i s more highly disaggregated than that which appears in the
executive’s budget proposal i f they request i t (for example, from a minis try (Open Budget
Survey 64) C 2010 B 2010 C 2010 D 2010 B 2010
Bas ic economic and financia l s tatis tics (national accounts , price indices , foreign trade,
currency and credit, etc) (Insti tutional Profi les Database A3004) 3 2009 4 2009 3 2009 2 2009 4 2009
When are the accounts audited by the Supreme Audit Insti tution publ icly ava i lable? (OECD
International Budget Practices and Procedures Database 70)
7 months
after the
end of the
fi sca l year 2008 Other 2008
12 months
after the
end of the
fi sca l year 2008
Are ci ti zens able in practice to obta in non-financia l information related to expenditures (for
example, number of beneficiaries , number of persons employed by the program, etc.) for
individual programs in a format that i s more highly disaggregated than that which appears in
the executive’s budget proposal i f they request i t from a minis try or agency? (Open Budget
Survey 65) C 2010 B 2010 C 2010 D 2010 B 2010
How long after the end of the budget year does the executive release to the publ ic a year-end
report that discusses the budget’s actual outcome for the year? (Open Budget Survey 77)B 2012 D 2012 D 2012 D 2012 D 2012
How long after the end of the fi sca l year are the fina l annual expenditures of national
departments audited and (except for secret programs) released to the publ ic? (Open Budget
Survey 87) A 2012 B 2012 D 2012 D 2012 C 2012
Publ ic access to key fi sca l information (PEFA PI-10) (A = 5-6 types of info are made available; D =
no info made available)B 2009 C 2010 B 2010 D 2008 B 2012
Congo, DR Kenya
Access for Civi l
society to
Information
Public Information Systems Colombia Philippines Bangladesh
Recommended