THIS REPORT CONTAINS ASSESSMENTS OF COMMODITY AND TRADE ISSUES MADE BY
USDA STAFF AND NOT NECESSARILY STATEMENTS OF OFFICIAL U.S. GOVERNMENT
POLICY
Date:
GAIN Report Number:
Approved By:
Prepared By:
Report Highlights:
India’s total oilseed production in marketing year (MY) 2017/18 (Oct-Sept) is forecast to rise seven
percent to 38.6 million metric tons (MMT), derived from 40 million hectares. The forecast assumes a
normal 2017 Southwest monsoon (June-September) season, near-normal oilseed yields (per five-year
average), and adequate market price incentives that encourage farmers to reclaim diverted oilseed acres.
Vegetable (edible) oil imports are forecast to rise five percent to 16.8 MMT. Meal exports will recover
modestly to 2.7 MMT, despite continued strong domestic demand for oilmeals.
Amit Aradhey
Scott Sindelar
2017
Oilseeds and Products Annual
India
IN7039
3/28/2017
Required Report - public distribution
Executive Summary:
India’s total oilseed production in MY 2017/18 is forecast to increase seven percent to 38.6 MMT,
derived from 40 million hectares. Out year oilseed supplies will achieve an all-time high of 40.3 MMT.
The forecast assumes a normal 2017 Southwest monsoon (June-September) season, near-normal oilseed
yields (per five-year average), and market prices above Minimum Support Price (MSP). Over the last
three years, an estimated two million hectares of traditional oilseed area was lost to dry weather
conditions or to competing crops.
Oilmeal production will also rise by 10 percent to 17.2 MMT amid the increase in oilseed supply and
anticipated meal demand. Demand for animal proteins will continue to increase along with India’s
growing economy and socio-economic changes. However, the availability of affordable feeds will
continue to challenge India’s livestock sectors. Assuming normal market conditions, Indian oilmeal
exports in the out year are forecast to recover modestly from 1.4 MMT to 2.7 MMT. Strong domestic
feed demand, international competition, and the rapid expansion of crushing in neighboring countries
(former Indian meal markets) will limit Indian meal exports.
Edible oil imports are forecast to rise by five percent to 16.8 MMT. Despite the forecast production
increase, domestic supplies will not be commensurate with India’s ever-increasing demand for
vegetable oil. India will continue to import vegetable oil to fill its 70-percent demand gap and India will
remain the world’s largest vegetable oil importer. India’s growing population, rising disposable
incomes, demand from an increasingly sophisticated consumer base (more awareness of health, food
safety, hygiene) and institutional buyers will drive vegetable oil consumption.
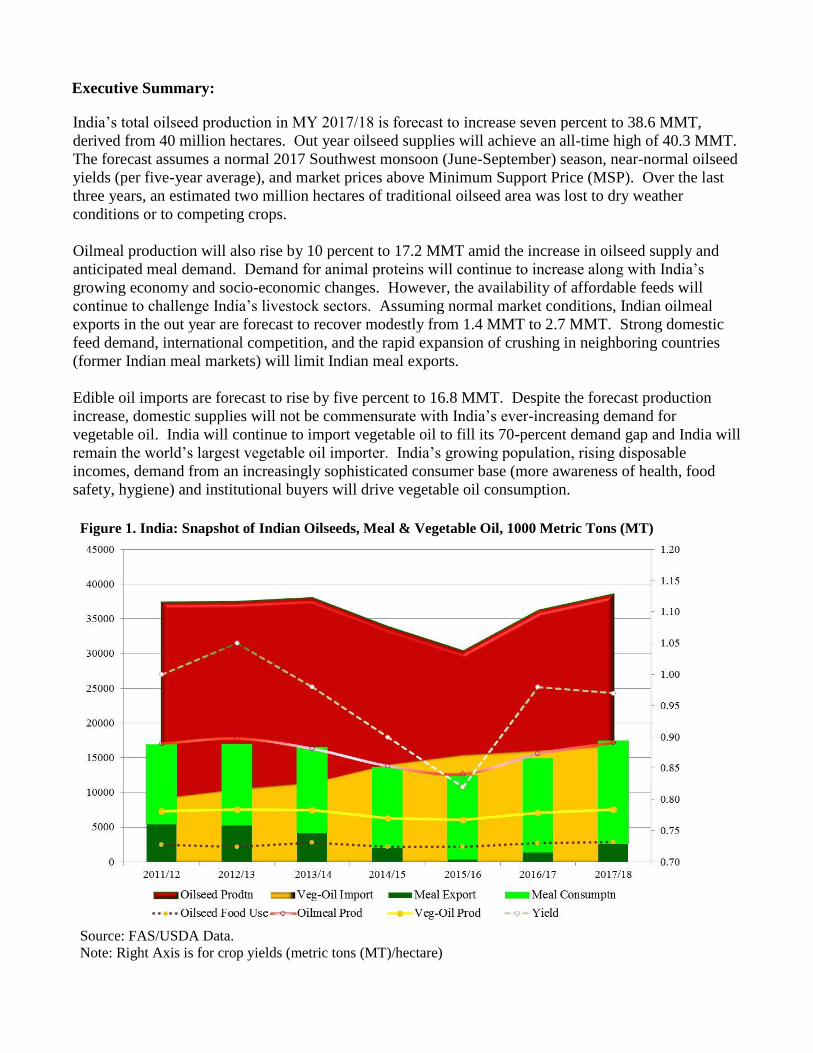
Figure 1. India: Snapshot of Indian Oilseeds, Meal & Vegetable Oil, 1000 Metric Tons (MT)
Source: FAS/USDA Data.
Note: Right Axis is for crop yields (metric tons (MT)/hectare)
Commodities:
Production:
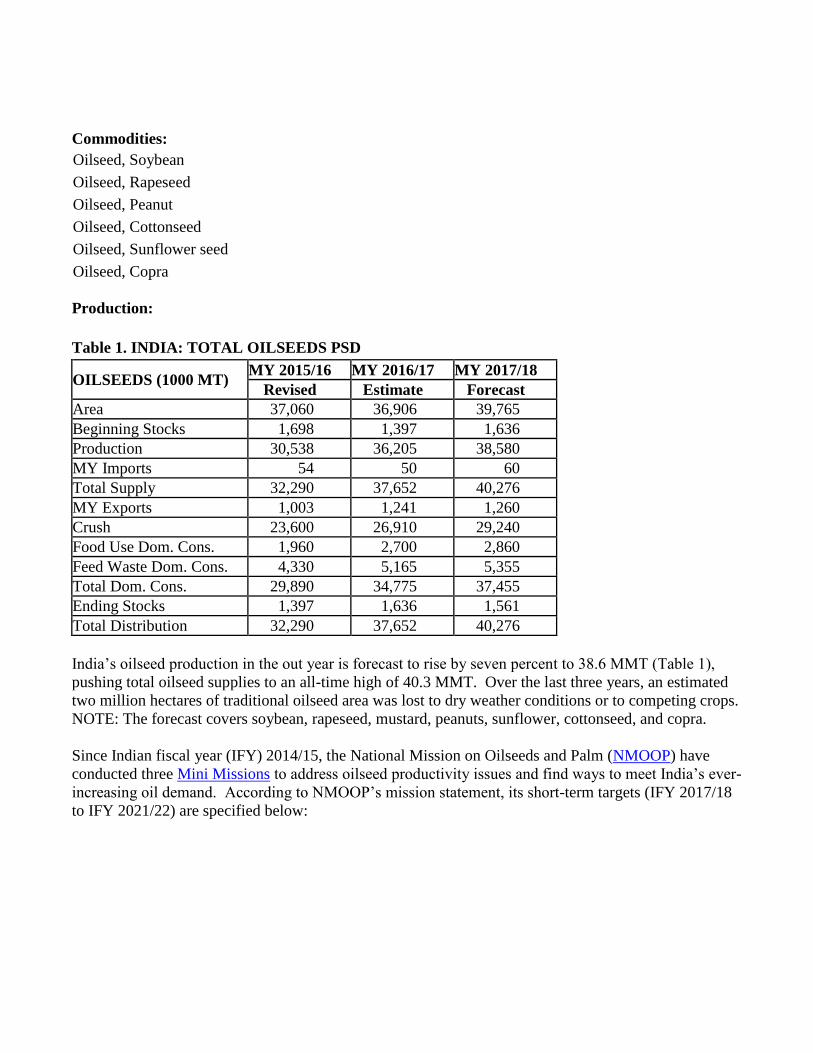
Table 1. INDIA: TOTAL OILSEEDS PSD
OILSEEDS (1000 MT) MY 2015/16 MY 2016/17 MY 2017/18
Revised Estimate Forecast
Area 37,060 36,906 39,765
Beginning Stocks 1,698 1,397 1,636
Production 30,538 36,205 38,580
MY Imports 54 50 60
Total Supply 32,290 37,652 40,276
MY Exports 1,003 1,241 1,260
Crush 23,600 26,910 29,240
Food Use Dom. Cons. 1,960 2,700 2,860
Feed Waste Dom. Cons. 4,330 5,165 5,355
Total Dom. Cons. 29,890 34,775 37,455
Ending Stocks 1,397 1,636 1,561
Total Distribution 32,290 37,652 40,276
India’s oilseed production in the out year is forecast to rise by seven percent to 38.6 MMT (Table 1),
pushing total oilseed supplies to an all-time high of 40.3 MMT. Over the last three years, an estimated
two million hectares of traditional oilseed area was lost to dry weather conditions or to competing crops.
NOTE: The forecast covers soybean, rapeseed, mustard, peanuts, sunflower, cottonseed, and copra.
Since Indian fiscal year (IFY) 2014/15, the National Mission on Oilseeds and Palm (NMOOP) have
conducted three Mini Missions to address oilseed productivity issues and find ways to meet India’s ever-
increasing oil demand. According to NMOOP’s mission statement, its short-term targets (IFY 2017/18
to IFY 2021/22) are specified below:
Oilseed, Copra
Oilseed, Sunflower seed
Oilseed, Cottonseed
Oilseed, Peanut
Oilseed, Rapeseed
Oilseed, Soybean
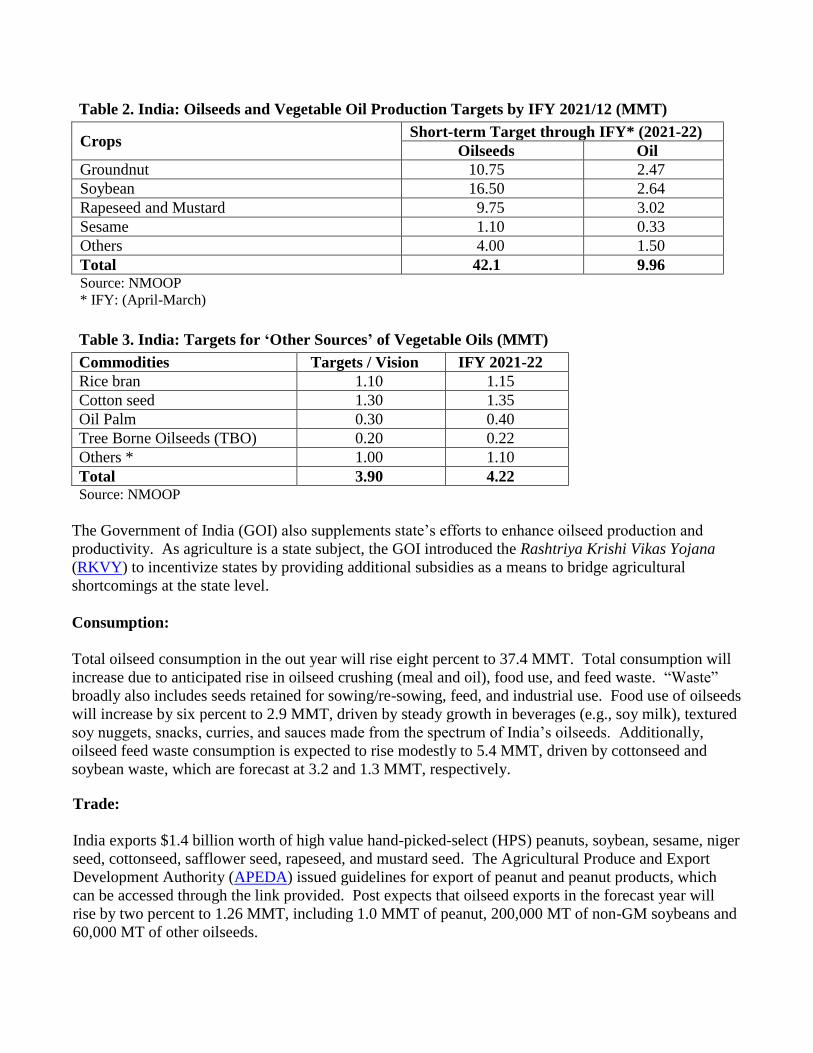
Table 2. India: Oilseeds and Vegetable Oil Production Targets by IFY 2021/12 (MMT)
Crops Short-term Target through IFY* (2021-22)
Oilseeds Oil
Groundnut 10.75 2.47
Soybean 16.50 2.64
Rapeseed and Mustard 9.75 3.02
Sesame 1.10 0.33
Others 4.00 1.50
Total 42.1 9.96 Source: NMOOP
* IFY: (April-March)
Table 3. India: Targets for ‘Other Sources’ of Vegetable Oils (MMT)
Commodities Targets / Vision IFY 2021-22
Rice bran 1.10 1.15
Cotton seed 1.30 1.35
Oil Palm 0.30 0.40
Tree Borne Oilseeds (TBO) 0.20 0.22
Others * 1.00 1.10
Total 3.90 4.22 Source: NMOOP
The Government of India (GOI) also supplements state’s efforts to enhance oilseed production and
productivity. As agriculture is a state subject, the GOI introduced the Rashtriya Krishi Vikas Yojana
(RKVY) to incentivize states by providing additional subsidies as a means to bridge agricultural
shortcomings at the state level.
Consumption:
Total oilseed consumption in the out year will rise eight percent to 37.4 MMT. Total consumption will
increase due to anticipated rise in oilseed crushing (meal and oil), food use, and feed waste. “Waste”
broadly also includes seeds retained for sowing/re-sowing, feed, and industrial use. Food use of oilseeds
will increase by six percent to 2.9 MMT, driven by steady growth in beverages (e.g., soy milk), textured
soy nuggets, snacks, curries, and sauces made from the spectrum of India’s oilseeds. Additionally,
oilseed feed waste consumption is expected to rise modestly to 5.4 MMT, driven by cottonseed and
soybean waste, which are forecast at 3.2 and 1.3 MMT, respectively.
Trade:
India exports $1.4 billion worth of high value hand-picked-select (HPS) peanuts, soybean, sesame, niger
seed, cottonseed, safflower seed, rapeseed, and mustard seed. The Agricultural Produce and Export
Development Authority (APEDA) issued guidelines for export of peanut and peanut products, which
can be accessed through the link provided. Post expects that oilseed exports in the forecast year will
rise by two percent to 1.26 MMT, including 1.0 MMT of peanut, 200,000 MT of non-GM soybeans and
60,000 MT of other oilseeds.
India’s annual peanut exports are valued at $700 million and consistent demand for its Hand Picked
Select (HPS) peanuts from Indonesia, Vietnam, Malaysia, Philippines, and Thailand will keep Indian
peanut exports viable. Lower but consistent demand from regional neighbors, as well as Algeria, Iran,
Ukraine, Russia and UAE will also support Indian peanut exports.
Trade in soybeans is smaller in volume terms, but future growth will be consistent. Per the latest trade
data from the Global Trade Atlas (GTA), soybean imports and exports in MY 2015/16 were valued at
$28 million and $90 million, respectively. Soybean export potential is estimated at $130 million. In
recent years, India imported soybeans from Ethiopia, Benin, Ukraine, the United States, Nigeria, and
Djibouti. Imports were mostly for food use and as also partly for seed. India also exported soybeans
(non-GM) to the United States, Canada, Belgium, France, and Spain. Annual sales in volume terms
average about 190,000 MT.
Policy for soybean import into India: India’s trade policy effectively prohibits import of Genetically
Modified (GM) soybeans. However, soybeans (non-GM) are eligible for import from any country for
consumption and processing, provided additional declarations stating freedom from Bruchidius spp,
weed seed-free certifications and/or zero dockage certifications vis-a-vis weed seeds in the
phytosanitary certificate, heat treatment and logistics management as advised by the Plant Protection
Authority (PPA). Oilseeds can be imported into India without any quantitative restrictions, but typically
face high tariffs (30-percent) and complex phytosanitary requirements (also see policy requirements
under subheading ‘Oils’).
Stocks:
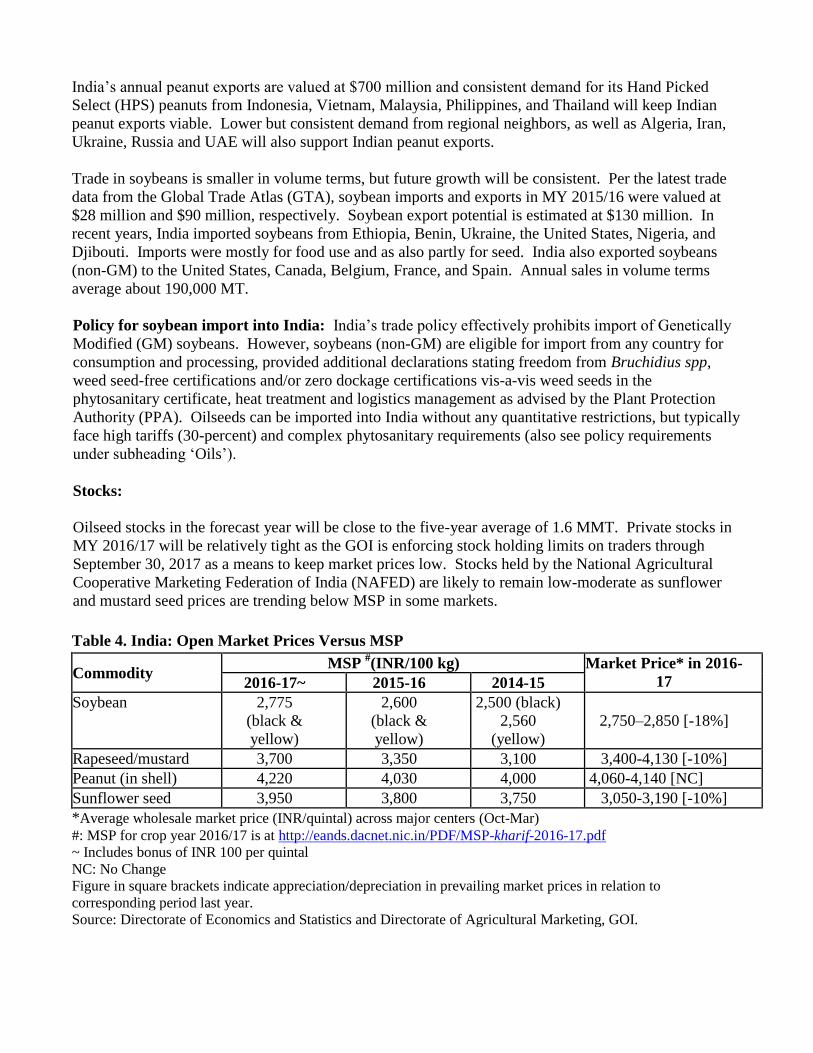
Oilseed stocks in the forecast year will be close to the five-year average of 1.6 MMT. Private stocks in
MY 2016/17 will be relatively tight as the GOI is enforcing stock holding limits on traders through
September 30, 2017 as a means to keep market prices low. Stocks held by the National Agricultural
Cooperative Marketing Federation of India (NAFED) are likely to remain low-moderate as sunflower
and mustard seed prices are trending below MSP in some markets.
Table 4. India: Open Market Prices Versus MSP
Commodity MSP
#(INR/100 kg) Market Price* in 2016-
17 2016-17~ 2015-16 2014-15
Soybean 2,775
(black &
yellow)
2,600
(black &
yellow)
2,500 (black)
2,560
(yellow)
2,750–2,850 [-18%]
Rapeseed/mustard 3,700 3,350 3,100 3,400-4,130 [-10%]
Peanut (in shell) 4,220 4,030 4,000 4,060-4,140 [NC]
Sunflower seed 3,950 3,800 3,750 3,050-3,190 [-10%]
*Average wholesale market price (INR/quintal) across major centers (Oct-Mar)
#: MSP for crop year 2016/17 is at http://eands.dacnet.nic.in/PDF/MSP-kharif-2016-17.pdf
~ Includes bonus of INR 100 per quintal
NC: No Change
Figure in square brackets indicate appreciation/depreciation in prevailing market prices in relation to
corresponding period last year.
Source: Directorate of Economics and Statistics and Directorate of Agricultural Marketing, GOI.
Commodities:
Meal, Soybean
Meal, Rapeseed
Meal, Peanut
Meal, Cottonseed
Meal, Sunflowerseed
Meal, Copra
Production:
Table 5. INDIA: TOTAL OILMEALS PSD
OILMEALS (1000 MT) MY 2015/16 MY 2016/17 MY 2017/18
Revised Estimate Forecast
Crush 23,600 26,910 29,240
Beginning Stocks 701 320 860
Production 13,317 15,607 17,224
MY Imports 393 300 250
Total Supply 14,411 16,227 18,334
MY Exports 690 1,401 2,653
Industrial Dom. Cons. 0 0 0
Food Use Dom. Cons. 175 319 517
Feed Waste Dom. Cons. 13,226 13,217 14,754
Total Dom. Cons. 13,401 13,966 15,732
Ending Stocks 320 860 410
Total Distribution 14,411 16,227 18,334
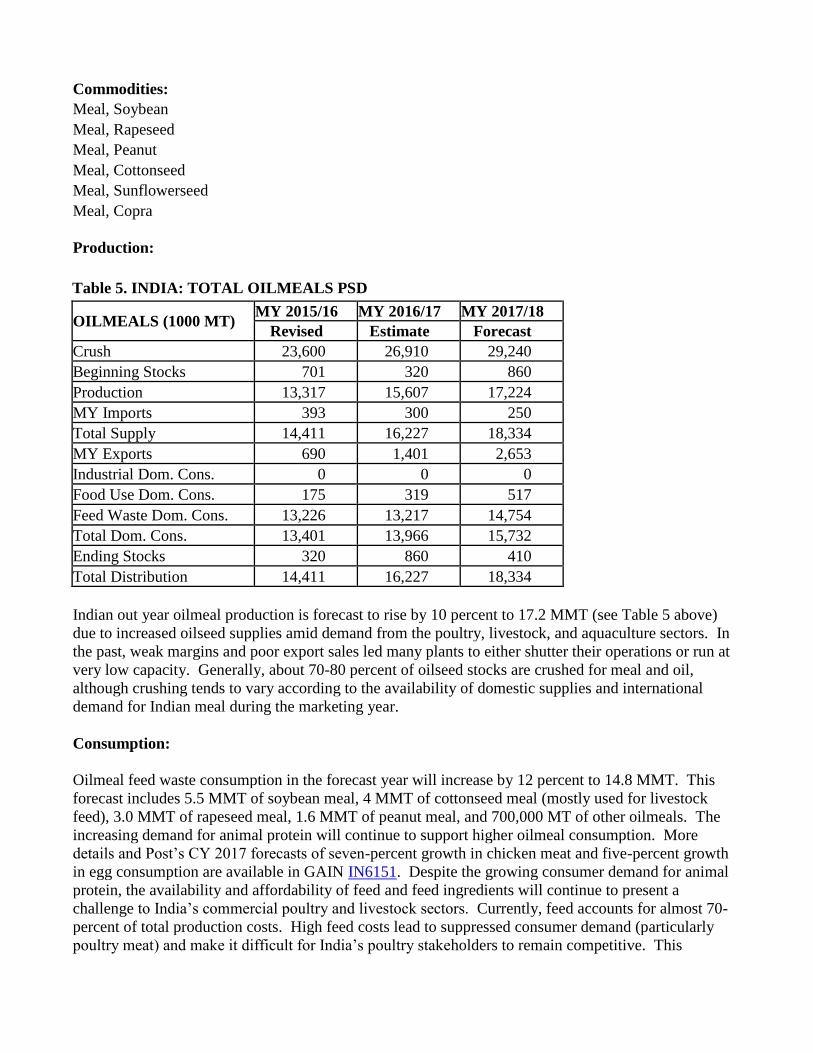
Indian out year oilmeal production is forecast to rise by 10 percent to 17.2 MMT (see Table 5 above)
due to increased oilseed supplies amid demand from the poultry, livestock, and aquaculture sectors. In
the past, weak margins and poor export sales led many plants to either shutter their operations or run at
very low capacity. Generally, about 70-80 percent of oilseed stocks are crushed for meal and oil,
although crushing tends to vary according to the availability of domestic supplies and international
demand for Indian meal during the marketing year.
Consumption:
Oilmeal feed waste consumption in the forecast year will increase by 12 percent to 14.8 MMT. This
forecast includes 5.5 MMT of soybean meal, 4 MMT of cottonseed meal (mostly used for livestock
feed), 3.0 MMT of rapeseed meal, 1.6 MMT of peanut meal, and 700,000 MT of other oilmeals. The
increasing demand for animal protein will continue to support higher oilmeal consumption. More
details and Post’s CY 2017 forecasts of seven-percent growth in chicken meat and five-percent growth
in egg consumption are available in GAIN IN6151. Despite the growing consumer demand for animal
protein, the availability and affordability of feed and feed ingredients will continue to present a
challenge to India’s commercial poultry and livestock sectors. Currently, feed accounts for almost 70-
percent of total production costs. High feed costs lead to suppressed consumer demand (particularly
poultry meat) and make it difficult for India’s poultry stakeholders to remain competitive. This
encourages feed manufacturers to either utilize unconventional feed sources or turn to the international
market for feed ingredients.
India’s organized feed industry uses soybean meal, peanuts, sunflower seed, and rapeseed meal in
various formulations. In addition to animal feed use, oil meals like soymeal are increasingly used in
processed food products, healthcare products, and also as low-cost high-protein supplements. Soymeal
is widely used as textured protein (chunks, flakes, and nuggets), to fortify other food products (wheat
flours, biscuits etc), or for the extraction of protein isolates (with a 90-percent or more protein content, it
is a good substitute for animal protein).
Trade:
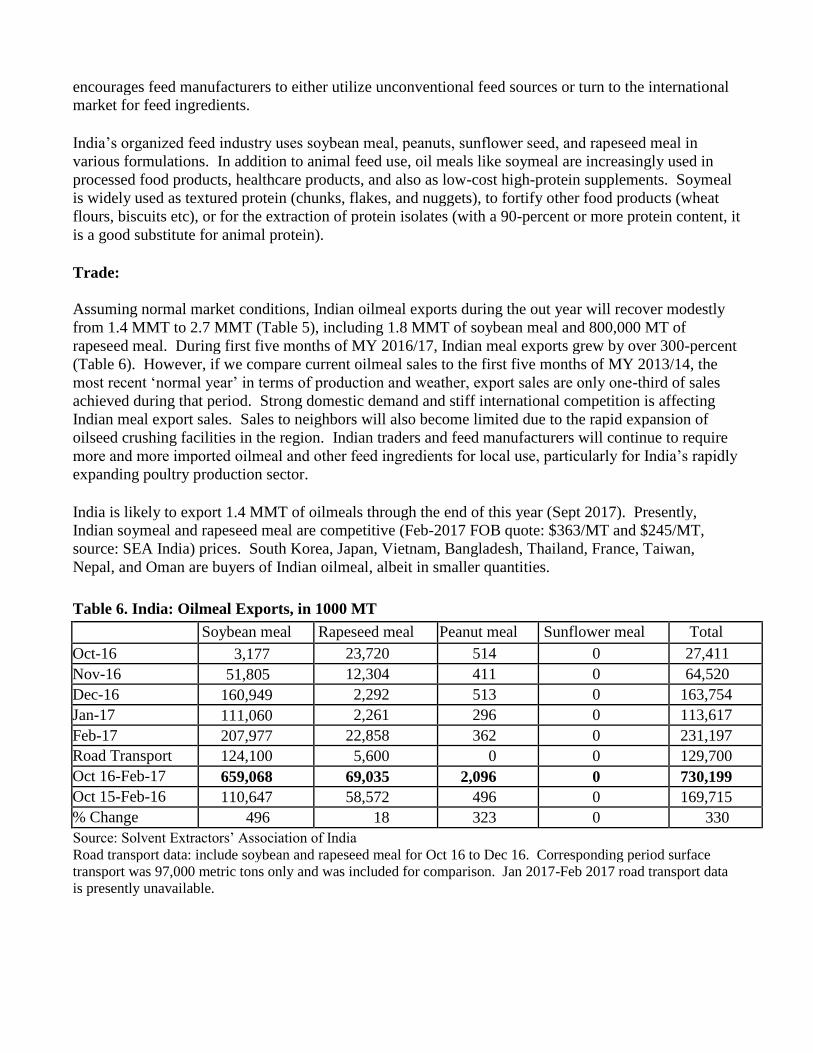
Assuming normal market conditions, Indian oilmeal exports during the out year will recover modestly
from 1.4 MMT to 2.7 MMT (Table 5), including 1.8 MMT of soybean meal and 800,000 MT of
rapeseed meal. During first five months of MY 2016/17, Indian meal exports grew by over 300-percent
(Table 6). However, if we compare current oilmeal sales to the first five months of MY 2013/14, the
most recent ‘normal year’ in terms of production and weather, export sales are only one-third of sales
achieved during that period. Strong domestic demand and stiff international competition is affecting
Indian meal export sales. Sales to neighbors will also become limited due to the rapid expansion of
oilseed crushing facilities in the region. Indian traders and feed manufacturers will continue to require
more and more imported oilmeal and other feed ingredients for local use, particularly for India’s rapidly
expanding poultry production sector.
India is likely to export 1.4 MMT of oilmeals through the end of this year (Sept 2017). Presently,
Indian soymeal and rapeseed meal are competitive (Feb-2017 FOB quote: $363/MT and $245/MT,
source: SEA India) prices. South Korea, Japan, Vietnam, Bangladesh, Thailand, France, Taiwan,
Nepal, and Oman are buyers of Indian oilmeal, albeit in smaller quantities.
Table 6. India: Oilmeal Exports, in 1000 MT
Soybean meal Rapeseed meal Peanut meal Sunflower meal Total
Oct-16 3,177 23,720 514 0 27,411
Nov-16 51,805 12,304 411 0 64,520
Dec-16 160,949 2,292 513 0 163,754
Jan-17 111,060 2,261 296 0 113,617
Feb-17 207,977 22,858 362 0 231,197
Road Transport 124,100 5,600 0 0 129,700
Oct 16-Feb-17 659,068 69,035 2,096 0 730,199
Oct 15-Feb-16 110,647 58,572 496 0 169,715
% Change 496 18 323 0 330
Source: Solvent Extractors’ Association of India
Road transport data: include soybean and rapeseed meal for Oct 16 to Dec 16. Corresponding period surface
transport was 97,000 metric tons only and was included for comparison. Jan 2017-Feb 2017 road transport data
is presently unavailable.
Policy:
Imported items of animal origin, or products intended for animal feed containing animal origin
materials under ITC (HS) code 2309 ‘Preparations of a kind used in animal feed shall be subject
to sanitary import permits issued by the Ministry of Agriculture and Farmer Welfare’s
Department of Animal Husbandry, Dairy, Fishery (DGFT Notification No. 36 dated January 17,
2017.
A 15-percent duty is applicable on import of oilcake and oilcake meal, rice bran, and oil bearing
materials. While there are no quantitative restrictions on imported oilmeal, the availability of
cheap local feed ingredients generally continues to discourage imports, even at zero duty.
The IFY 2017/18 budget allocation for Integrated Child Development Services (ICDS), Mid-Day
Meal (MDM) and Rashtriya Madhyamik Shiksa Abhiyaan (RMSA) has been raised. Core ICDS
has been renamed to Anganwadi Services as of IFY 2017-18. This also includes allocations for
National Nutrition Mission (NNM). The above programs seek to promote nutritious protein rich
foods for the end-beneficiary. Several state governments are also promoting increased use of
low-cost soy protein supplements.
Commodities:
Production:
Table 7. INDIA: TOTAL OILS PSD
OILS (1000 MT) MY 2015/16 MY 2016/17 MY 2017/18
Revised Estimate Forecast
Crush 23,600 26,910 29,240
Beginning Stocks 1,806 1,917 1,877
Production 6,088 7,092 7,550
MY Imports 15,397 16,025 16,800
Total Supply 23,291 25,034 26,227
MY Exports 14 17 32
Industrial Dom. Cons. 950 1,050 1,185
Food Use Dom. Cons. 20,410 22,080 23,280
Feed Waste Dom. Cons. 0 0 0
Total Dom. Cons. 21,360 23,130 24,465
Ending Stocks 1,917 1,877 1,730
Total Distribution 23,291 25,034 26,227
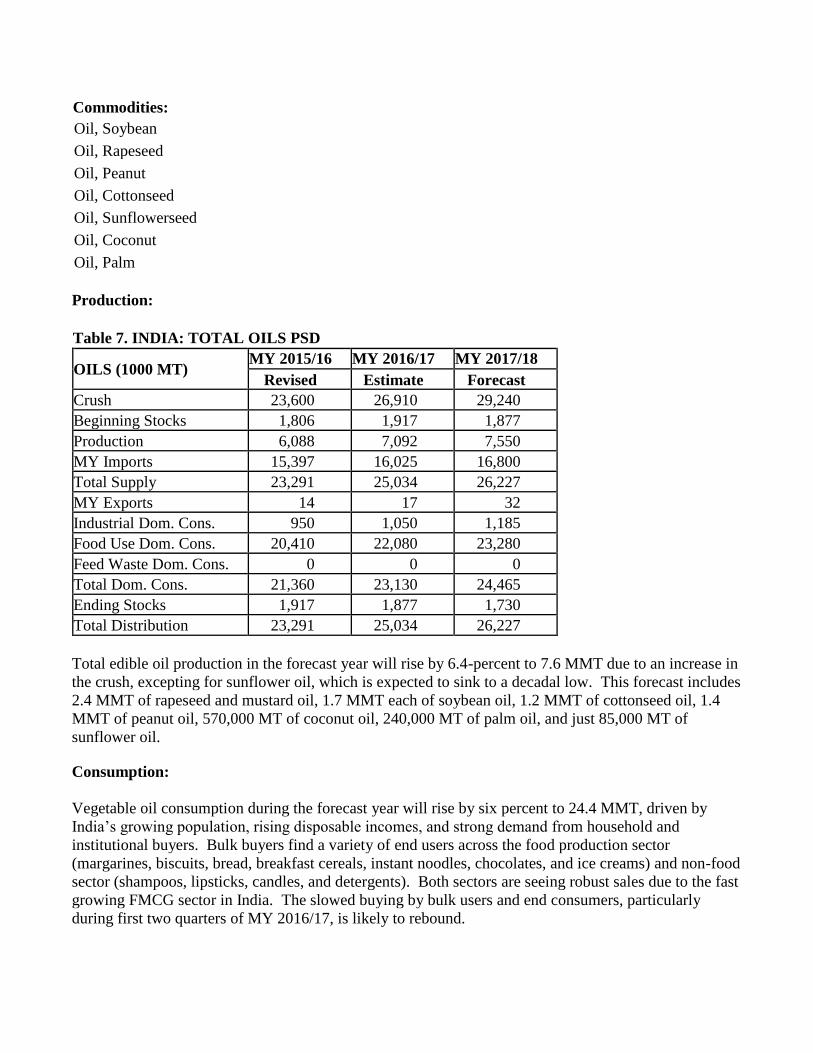
Total edible oil production in the forecast year will rise by 6.4-percent to 7.6 MMT due to an increase in
the crush, excepting for sunflower oil, which is expected to sink to a decadal low. This forecast includes
2.4 MMT of rapeseed and mustard oil, 1.7 MMT each of soybean oil, 1.2 MMT of cottonseed oil, 1.4
MMT of peanut oil, 570,000 MT of coconut oil, 240,000 MT of palm oil, and just 85,000 MT of
sunflower oil.
Consumption:
Vegetable oil consumption during the forecast year will rise by six percent to 24.4 MMT, driven by
India’s growing population, rising disposable incomes, and strong demand from household and
institutional buyers. Bulk buyers find a variety of end users across the food production sector
(margarines, biscuits, bread, breakfast cereals, instant noodles, chocolates, and ice creams) and non-food
sector (shampoos, lipsticks, candles, and detergents). Both sectors are seeing robust sales due to the fast
growing FMCG sector in India. The slowed buying by bulk users and end consumers, particularly
during first two quarters of MY 2016/17, is likely to rebound.
Oil, Palm
Oil, Coconut
Oil, Sunflowerseed
Oil, Cottonseed
Oil, Peanut
Oil, Rapeseed
Oil, Soybean
The per capita edible oil consumption in India is also increasing and is currently estimated 18 kg for
MY 2016/17; however, it’s below the world average per capita consumption of 24.7 kg. Slow growth in
domestic edible oil production and strong consumption demand has further widened the supply deficit;
filled mostly through imports. The deficit has now widened to 70- percent of which palm and soy oil
shares are 65-percent and 25-percent, respectively. Incidentally, palm oil’s share in the consumption
basket has not really changed in recent years. Soy oil’s share has grown along with incremental rises in
demand for other domestic oils.
Health and Wellness Driving Cooking Oil Sales
Fortified, blended, branded, and packaged edible oils have gained about two-third share of the total
edible oil market (Industry sources). Health and wellness continue to be the key messaging for
promoting edible oils. Rising awareness of food safety and hygiene, coupled with changing lifestyles,
have also helped marketers promote sales of their brands through innovative campaigns. Fortified
refined palmolein, safflower, olive and rice bran oil are finding acceptance as healthy cooking oils.
Manufacturers and refiners have brought changes to existing capacity to include traditional oil blends,
given the diverse taste and preference of Indian consumers.
Regional Preference is Paramount: Coconut, peanut and sunflower oils continue to be widely
consumed in south India, peanut and cottonseed oils are more prevalent in Gujarat and Maharashtra,
rapeseed oil in northeast, eastern and northwest India, while soybean oil prevails in central India, and
rice bran oil is picking up across eastern India. Cottonseed oil is finding acceptability due to its light
color, neutral odor and blending characteristics with other oils.
The percentage of refined oils that are directly branded and packaged by the refiners has shown robust
growth in last few years. Branded edible oils sold in low-volume, low-priced packages to standard size
packets and jars are selling well; indicates a growing consumer preference for branded products.
Household and institutional buyers (food processors, restaurants (quick-service) and hotels) are the end
beneficiaries. Institutional buyers often buy cooking oils in bulk or as vanaspati (partially hydrogenated
vegetable oil). These are again repacked and re-sold under different private labels.
99-percent of Indian households use edible oils and therefore they make a potent vehicle for
fortification. Since vitamin A and D are fat-soluble vitamins, oils fortified with these nutrients can
address micronutrient malnutrition and also provides 25-30 percent of the recommended dietary
allowances for vitamins A and D.
Multiple micronutrient deficiencies are rampant in India, and continue to be significant public health
problems, which adversely impact the health and productivity of all the population groups. Large
quantities of oil is purchased and used in the government financed food supplementation schemes like
the MDM and the ICDS. Public Distribution System (PDS) is paving the way for fortified oil being
readily available at the door step of the poorest segment of the population (Source: The Food
Fortification Resource Centre, Food Safety and Standards Authority of India (FSSAI).
Trade:
Edible oil imports in the forecast year will rise five percent to 16.8 MMT. Import growth will be modest
due to higher oilseed production, larger oilseed crush and sufficient beginning stocks. The import
basket will include 10.5 MMT of palm oil followed by 4.2 MMT of soybean and 1.8 MMT of sunflower
seed oil. Since consumption is growing more rapidly than production, the appetite for imports is
growing at a faster rate (11-percent per year) to fill the gap.
Incidentally, India is the world’s largest importer of edible vegetable oil, followed by the EU-27, China,
United States and Pakistan. Industry sources believe that tightening palm oil supplies coupled with the
availability of other soft oils, may someday limit palm imports.
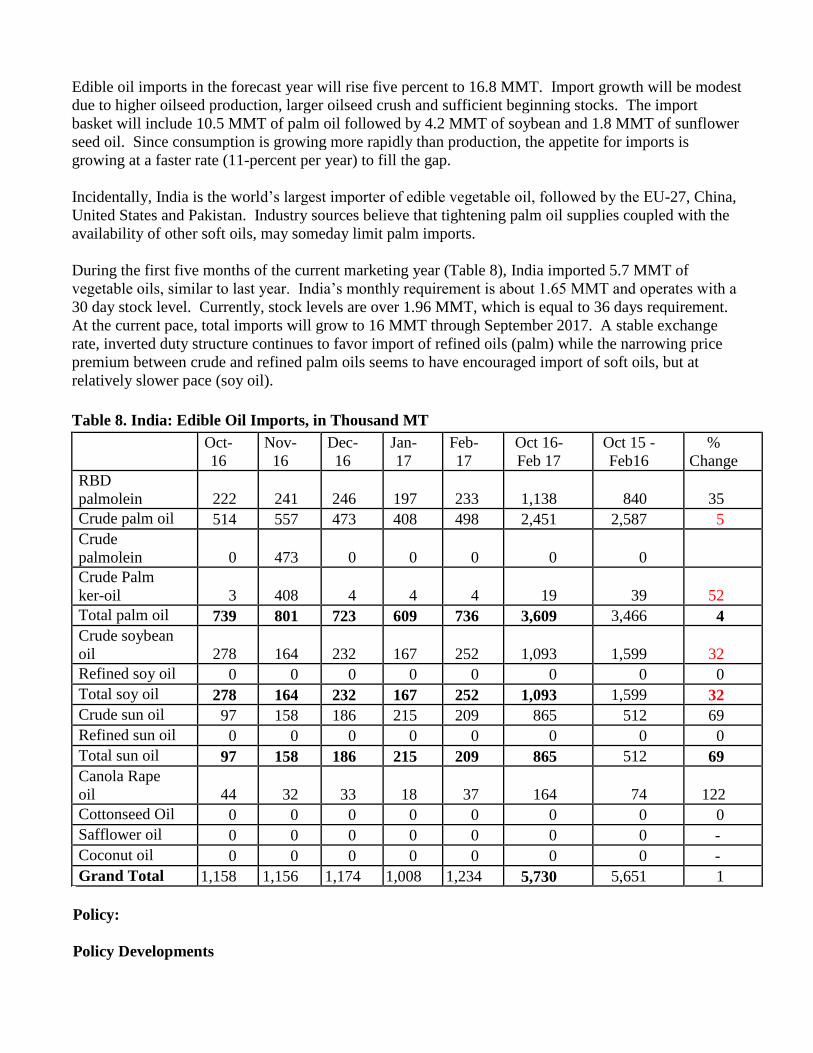
During the first five months of the current marketing year (Table 8), India imported 5.7 MMT of
vegetable oils, similar to last year. India’s monthly requirement is about 1.65 MMT and operates with a
30 day stock level. Currently, stock levels are over 1.96 MMT, which is equal to 36 days requirement.
At the current pace, total imports will grow to 16 MMT through September 2017. A stable exchange
rate, inverted duty structure continues to favor import of refined oils (palm) while the narrowing price
premium between crude and refined palm oils seems to have encouraged import of soft oils, but at
relatively slower pace (soy oil).
Table 8. India: Edible Oil Imports, in Thousand MT
Oct-
16
Nov-
16
Dec-
16
Jan-
17
Feb-
17
Oct 16-
Feb 17
Oct 15 -
Feb16
%
Change
RBD
palmolein 222 241 246 197 233 1,138 840 35
Crude palm oil 514 557 473 408 498 2,451 2,587 5
Crude
palmolein 0 473 0 0 0 0 0
Crude Palm
ker-oil 3 408 4 4 4 19 39 52
Total palm oil 739 801 723 609 736 3,609 3,466 4
Crude soybean
oil 278 164 232 167 252 1,093 1,599 32
Refined soy oil 0 0 0 0 0 0 0 0
Total soy oil 278 164 232 167 252 1,093 1,599 32
Crude sun oil 97 158 186 215 209 865 512 69
Refined sun oil 0 0 0 0 0 0 0 0
Total sun oil 97 158 186 215 209 865 512 69
Canola Rape
oil 44 32 33 18 37 164 74 122
Cottonseed Oil 0 0 0 0 0 0 0 0
Safflower oil 0 0 0 0 0 0 0 -
Coconut oil 0 0 0 0 0 0 0 -
Grand Total 1,158 1,156 1,174 1,008 1,234 5,730 5,651 1
Policy:
Policy Developments
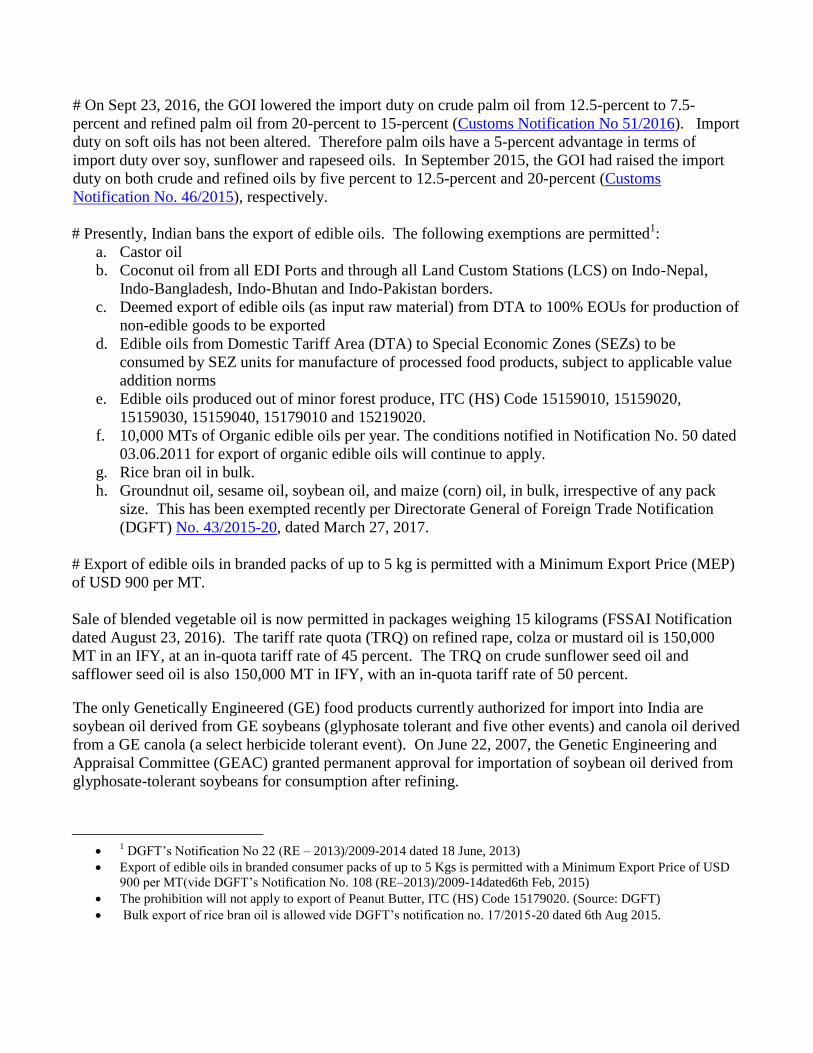
# On Sept 23, 2016, the GOI lowered the import duty on crude palm oil from 12.5-percent to 7.5-
percent and refined palm oil from 20-percent to 15-percent (Customs Notification No 51/2016). Import
duty on soft oils has not been altered. Therefore palm oils have a 5-percent advantage in terms of
import duty over soy, sunflower and rapeseed oils. In September 2015, the GOI had raised the import
duty on both crude and refined oils by five percent to 12.5-percent and 20-percent (Customs
Notification No. 46/2015), respectively.
# Presently, Indian bans the export of edible oils. The following exemptions are permitted1:
a. Castor oil
b. Coconut oil from all EDI Ports and through all Land Custom Stations (LCS) on Indo-Nepal,
Indo-Bangladesh, Indo-Bhutan and Indo-Pakistan borders.
c. Deemed export of edible oils (as input raw material) from DTA to 100% EOUs for production of
non-edible goods to be exported
d. Edible oils from Domestic Tariff Area (DTA) to Special Economic Zones (SEZs) to be
consumed by SEZ units for manufacture of processed food products, subject to applicable value
addition norms
e. Edible oils produced out of minor forest produce, ITC (HS) Code 15159010, 15159020,
15159030, 15159040, 15179010 and 15219020.
f. 10,000 MTs of Organic edible oils per year. The conditions notified in Notification No. 50 dated
03.06.2011 for export of organic edible oils will continue to apply.
g. Rice bran oil in bulk.
h. Groundnut oil, sesame oil, soybean oil, and maize (corn) oil, in bulk, irrespective of any pack
size. This has been exempted recently per Directorate General of Foreign Trade Notification
(DGFT) No. 43/2015-20, dated March 27, 2017.
# Export of edible oils in branded packs of up to 5 kg is permitted with a Minimum Export Price (MEP)
of USD 900 per MT.
Sale of blended vegetable oil is now permitted in packages weighing 15 kilograms (FSSAI Notification
dated August 23, 2016). The tariff rate quota (TRQ) on refined rape, colza or mustard oil is 150,000
MT in an IFY, at an in-quota tariff rate of 45 percent. The TRQ on crude sunflower seed oil and
safflower seed oil is also 150,000 MT in IFY, with an in-quota tariff rate of 50 percent.
The only Genetically Engineered (GE) food products currently authorized for import into India are
soybean oil derived from GE soybeans (glyphosate tolerant and five other events) and canola oil derived
from a GE canola (a select herbicide tolerant event). On June 22, 2007, the Genetic Engineering and
Appraisal Committee (GEAC) granted permanent approval for importation of soybean oil derived from
glyphosate-tolerant soybeans for consumption after refining.
1
DGFT’s Notification No 22 (RE – 2013)/2009-2014 dated 18 June, 2013)
Export of edible oils in branded consumer packs of up to 5 Kgs is permitted with a Minimum Export Price of USD
900 per MT(vide DGFT’s Notification No. 108 (RE–2013)/2009-14dated6th Feb, 2015) The prohibition will not apply to export of Peanut Butter, ITC (HS) Code 15179020. (Source: DGFT) Bulk export of rice bran oil is allowed vide DGFT’s notification no. 17/2015-20 dated 6th Aug 2015.
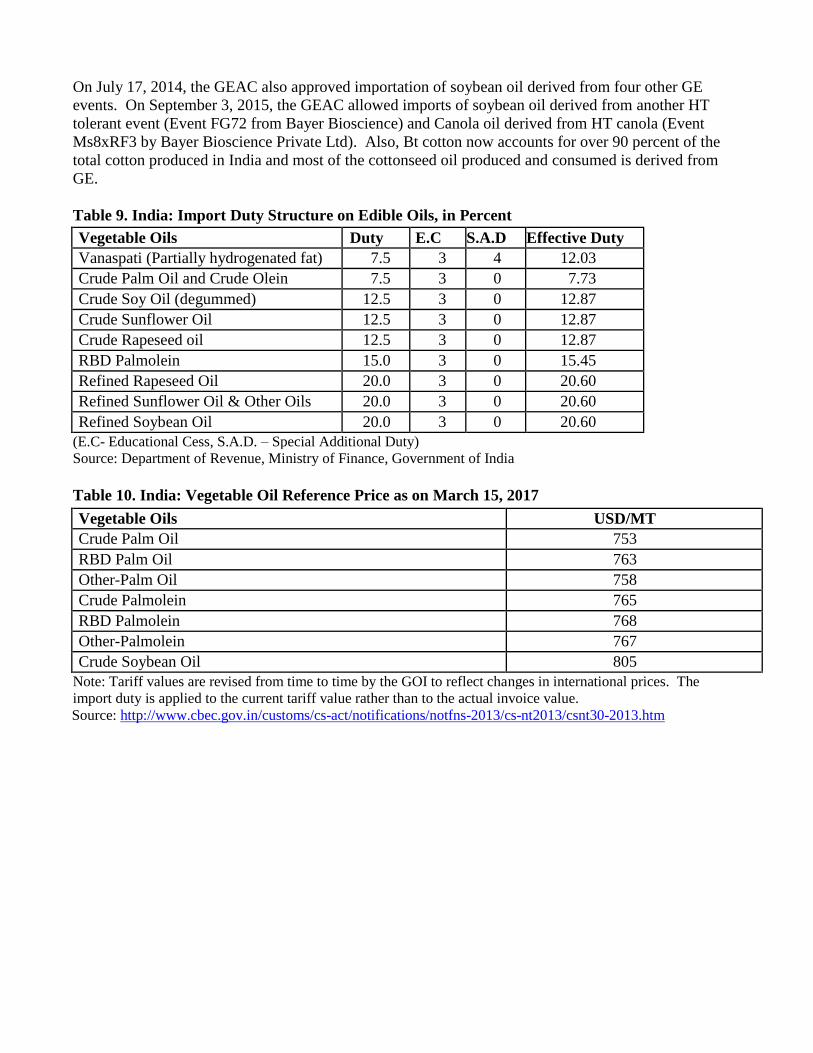
On July 17, 2014, the GEAC also approved importation of soybean oil derived from four other GE
events. On September 3, 2015, the GEAC allowed imports of soybean oil derived from another HT
tolerant event (Event FG72 from Bayer Bioscience) and Canola oil derived from HT canola (Event
Ms8xRF3 by Bayer Bioscience Private Ltd). Also, Bt cotton now accounts for over 90 percent of the
total cotton produced in India and most of the cottonseed oil produced and consumed is derived from
GE.
Table 9. India: Import Duty Structure on Edible Oils, in Percent
Vegetable Oils Duty E.C S.A.D Effective Duty
Vanaspati (Partially hydrogenated fat) 7.5 3 4 12.03
Crude Palm Oil and Crude Olein 7.5 3 0 7.73
Crude Soy Oil (degummed) 12.5 3 0 12.87
Crude Sunflower Oil 12.5 3 0 12.87
Crude Rapeseed oil 12.5 3 0 12.87
RBD Palmolein 15.0 3 0 15.45
Refined Rapeseed Oil 20.0 3 0 20.60
Refined Sunflower Oil & Other Oils 20.0 3 0 20.60
Refined Soybean Oil 20.0 3 0 20.60
(E.C- Educational Cess, S.A.D. – Special Additional Duty)
Source: Department of Revenue, Ministry of Finance, Government of India
Table 10. India: Vegetable Oil Reference Price as on March 15, 2017 Vegetable Oils USD/MT
Crude Palm Oil 753
RBD Palm Oil 763
Other-Palm Oil 758
Crude Palmolein 765
RBD Palmolein 768
Other-Palmolein 767
Crude Soybean Oil 805
Note: Tariff values are revised from time to time by the GOI to reflect changes in international prices. The
import duty is applied to the current tariff value rather than to the actual invoice value.
Source: http://www.cbec.gov.in/customs/cs-act/notifications/notfns-2013/cs-nt2013/csnt30-2013.htm
Production, Supply and Demand Data Statistics:
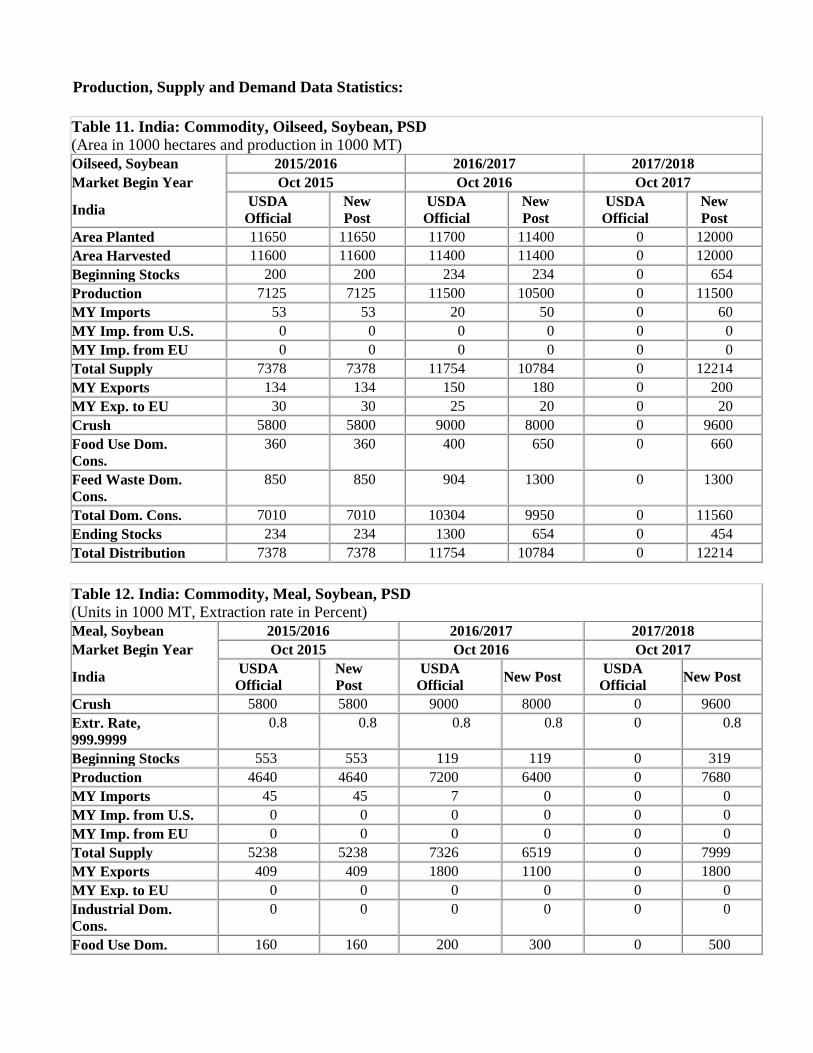
Table 11. India: Commodity, Oilseed, Soybean, PSD
(Area in 1000 hectares and production in 1000 MT)
Oilseed, Soybean 2015/2016 2016/2017 2017/2018
Market Begin Year Oct 2015 Oct 2016 Oct 2017
India USDA
Official
New
Post
USDA
Official
New
Post
USDA
Official
New
Post
Area Planted 11650 11650 11700 11400 0 12000
Area Harvested 11600 11600 11400 11400 0 12000
Beginning Stocks 200 200 234 234 0 654
Production 7125 7125 11500 10500 0 11500
MY Imports 53 53 20 50 0 60
MY Imp. from U.S. 0 0 0 0 0 0
MY Imp. from EU 0 0 0 0 0 0
Total Supply 7378 7378 11754 10784 0 12214
MY Exports 134 134 150 180 0 200
MY Exp. to EU 30 30 25 20 0 20
Crush 5800 5800 9000 8000 0 9600
Food Use Dom.
Cons.
360 360 400 650 0 660
Feed Waste Dom.
Cons.
850 850 904 1300 0 1300
Total Dom. Cons. 7010 7010 10304 9950 0 11560
Ending Stocks 234 234 1300 654 0 454
Total Distribution 7378 7378 11754 10784 0 12214
Table 12. India: Commodity, Meal, Soybean, PSD
(Units in 1000 MT, Extraction rate in Percent)
Meal, Soybean 2015/2016 2016/2017 2017/2018
Market Begin Year Oct 2015 Oct 2016 Oct 2017
India USDA
Official
New
Post
USDA
Official New Post
USDA
Official New Post
Crush 5800 5800 9000 8000 0 9600
Extr. Rate,
999.9999
0.8 0.8 0.8 0.8 0 0.8
Beginning Stocks 553 553 119 119 0 319
Production 4640 4640 7200 6400 0 7680
MY Imports 45 45 7 0 0 0
MY Imp. from U.S. 0 0 0 0 0 0
MY Imp. from EU 0 0 0 0 0 0
Total Supply 5238 5238 7326 6519 0 7999
MY Exports 409 409 1800 1100 0 1800
MY Exp. to EU 0 0 0 0 0 0
Industrial Dom.
Cons.
0 0 0 0 0 0
Food Use Dom. 160 160 200 300 0 500
Cons.
Feed Waste Dom.
Cons.
4550 4550 5000 4800 0 5500
Total Dom. Cons. 4710 4710 5200 5100 0 6000
Ending Stocks 119 119 326 319 0 199
Total Distribution 5238 5238 7326 6519 0 7999
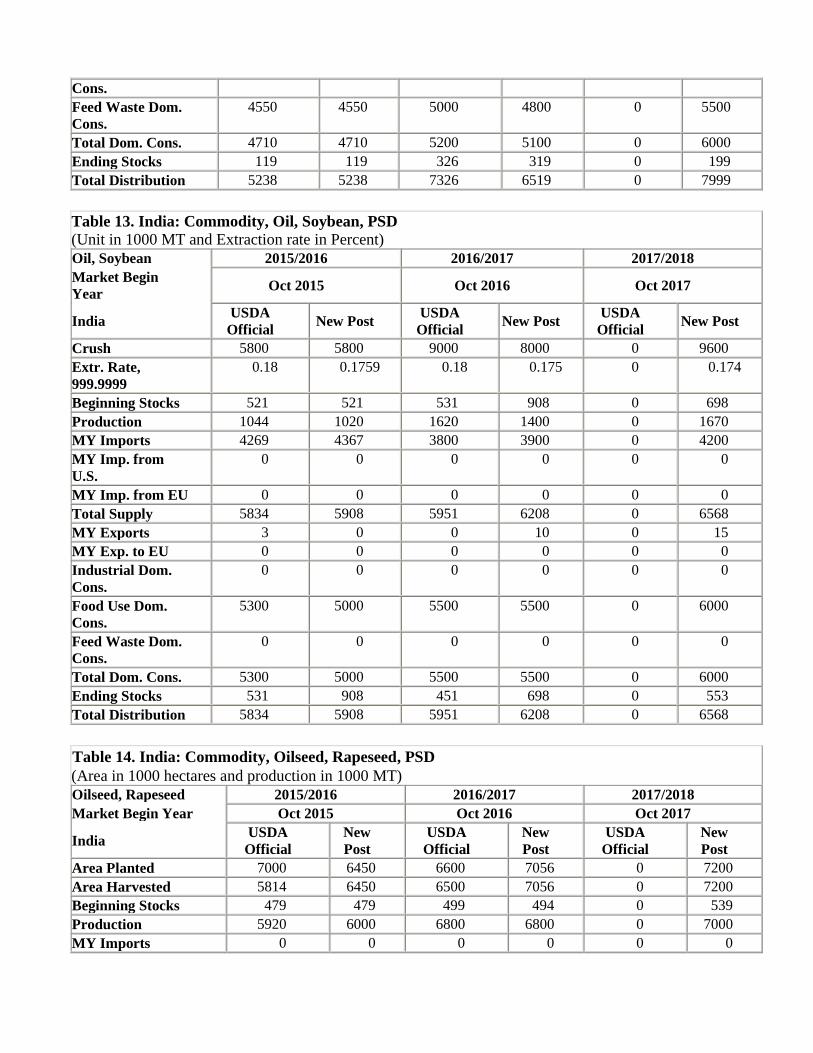
Table 13. India: Commodity, Oil, Soybean, PSD
(Unit in 1000 MT and Extraction rate in Percent)
Oil, Soybean 2015/2016 2016/2017 2017/2018
Market Begin
Year Oct 2015 Oct 2016 Oct 2017
India USDA
Official New Post
USDA
Official New Post
USDA
Official New Post
Crush 5800 5800 9000 8000 0 9600
Extr. Rate,
999.9999
0.18 0.1759 0.18 0.175 0 0.174
Beginning Stocks 521 521 531 908 0 698
Production 1044 1020 1620 1400 0 1670
MY Imports 4269 4367 3800 3900 0 4200
MY Imp. from
U.S.
0 0 0 0 0 0
MY Imp. from EU 0 0 0 0 0 0
Total Supply 5834 5908 5951 6208 0 6568
MY Exports 3 0 0 10 0 15
MY Exp. to EU 0 0 0 0 0 0
Industrial Dom.
Cons.
0 0 0 0 0 0
Food Use Dom.
Cons.
5300 5000 5500 5500 0 6000
Feed Waste Dom.
Cons.
0 0 0 0 0 0
Total Dom. Cons. 5300 5000 5500 5500 0 6000
Ending Stocks 531 908 451 698 0 553
Total Distribution 5834 5908 5951 6208 0 6568
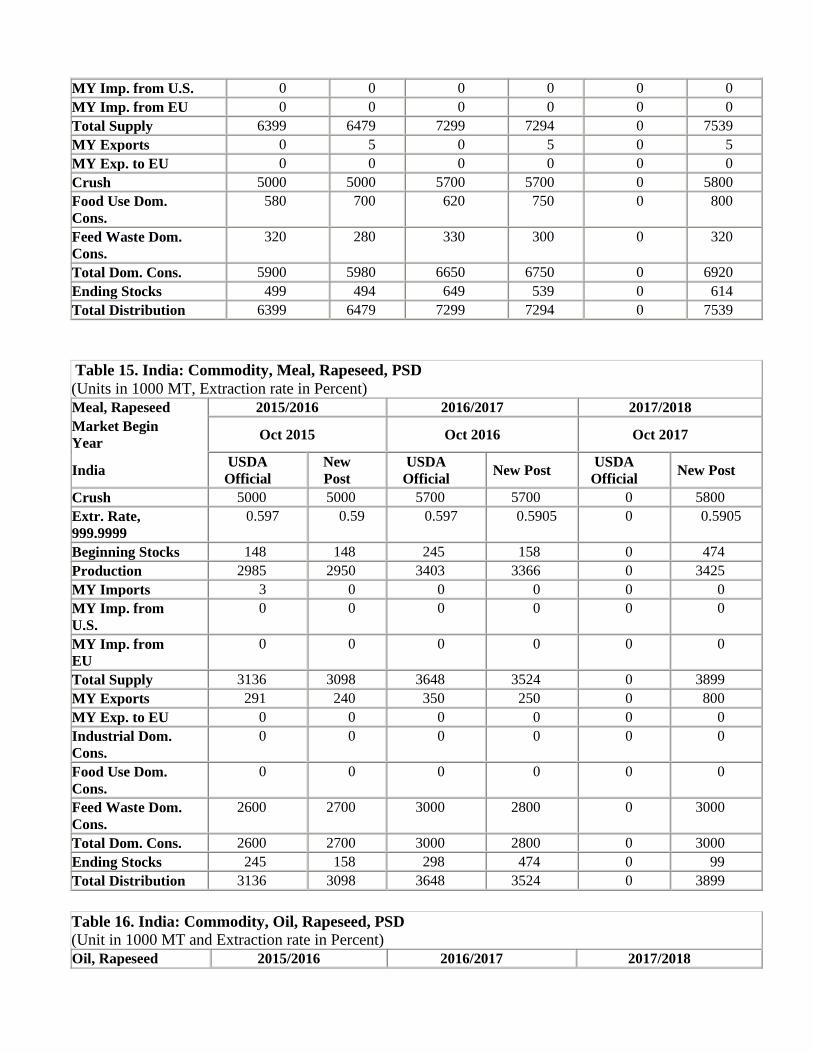
Table 14. India: Commodity, Oilseed, Rapeseed, PSD
(Area in 1000 hectares and production in 1000 MT)
Oilseed, Rapeseed 2015/2016 2016/2017 2017/2018
Market Begin Year Oct 2015 Oct 2016 Oct 2017
India USDA
Official
New
Post
USDA
Official
New
Post
USDA
Official
New
Post
Area Planted 7000 6450 6600 7056 0 7200
Area Harvested 5814 6450 6500 7056 0 7200
Beginning Stocks 479 479 499 494 0 539
Production 5920 6000 6800 6800 0 7000
MY Imports 0 0 0 0 0 0
MY Imp. from U.S. 0 0 0 0 0 0
MY Imp. from EU 0 0 0 0 0 0
Total Supply 6399 6479 7299 7294 0 7539
MY Exports 0 5 0 5 0 5
MY Exp. to EU 0 0 0 0 0 0
Crush 5000 5000 5700 5700 0 5800
Food Use Dom.
Cons.
580 700 620 750 0 800
Feed Waste Dom.
Cons.
320 280 330 300 0 320
Total Dom. Cons. 5900 5980 6650 6750 0 6920
Ending Stocks 499 494 649 539 0 614
Total Distribution 6399 6479 7299 7294 0 7539
Table 15. India: Commodity, Meal, Rapeseed, PSD
(Units in 1000 MT, Extraction rate in Percent)
Meal, Rapeseed 2015/2016 2016/2017 2017/2018
Market Begin
Year Oct 2015 Oct 2016 Oct 2017
India USDA
Official
New
Post
USDA
Official New Post
USDA
Official New Post
Crush 5000 5000 5700 5700 0 5800
Extr. Rate,
999.9999
0.597 0.59 0.597 0.5905 0 0.5905
Beginning Stocks 148 148 245 158 0 474
Production 2985 2950 3403 3366 0 3425
MY Imports 3 0 0 0 0 0
MY Imp. from
U.S.
0 0 0 0 0 0
MY Imp. from
EU
0 0 0 0 0 0
Total Supply 3136 3098 3648 3524 0 3899
MY Exports 291 240 350 250 0 800
MY Exp. to EU 0 0 0 0 0 0
Industrial Dom.
Cons.
0 0 0 0 0 0
Food Use Dom.
Cons.
0 0 0 0 0 0
Feed Waste Dom.
Cons.
2600 2700 3000 2800 0 3000
Total Dom. Cons. 2600 2700 3000 2800 0 3000
Ending Stocks 245 158 298 474 0 99
Total Distribution 3136 3098 3648 3524 0 3899
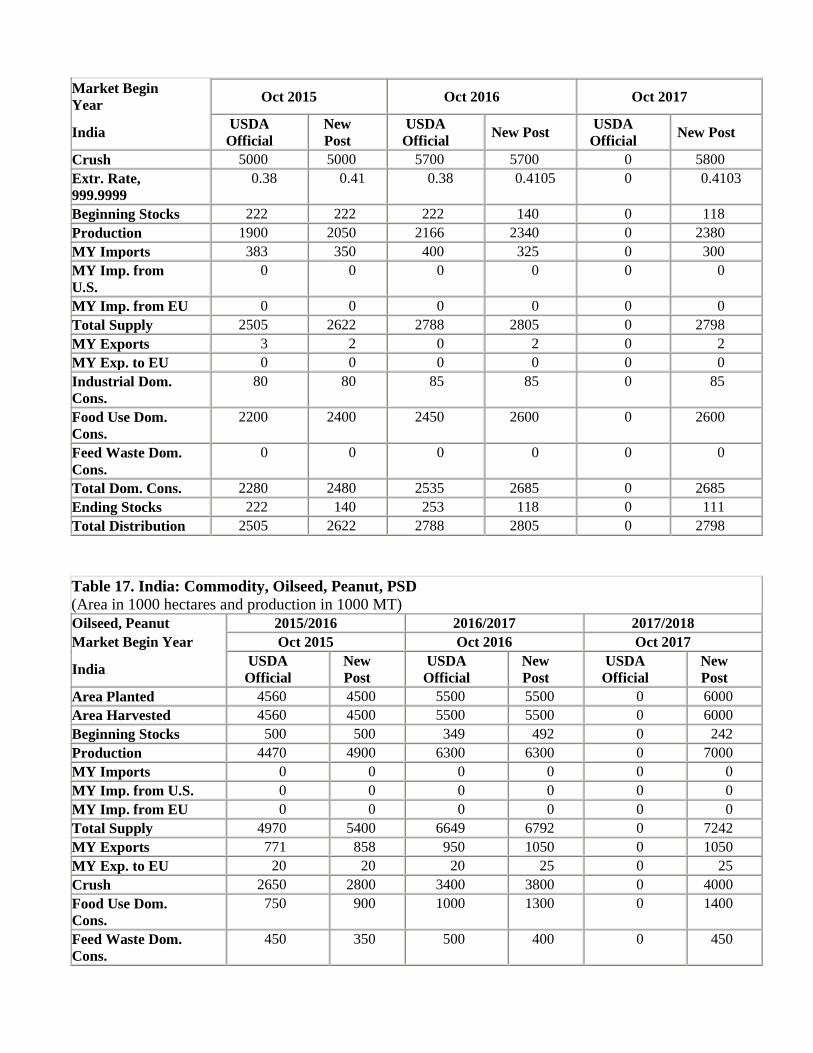
Table 16. India: Commodity, Oil, Rapeseed, PSD
(Unit in 1000 MT and Extraction rate in Percent)
Oil, Rapeseed 2015/2016 2016/2017 2017/2018
Market Begin
Year Oct 2015 Oct 2016 Oct 2017
India USDA
Official
New
Post
USDA
Official New Post
USDA
Official New Post
Crush 5000 5000 5700 5700 0 5800
Extr. Rate,
999.9999
0.38 0.41 0.38 0.4105 0 0.4103
Beginning Stocks 222 222 222 140 0 118
Production 1900 2050 2166 2340 0 2380
MY Imports 383 350 400 325 0 300
MY Imp. from
U.S.
0 0 0 0 0 0
MY Imp. from EU 0 0 0 0 0 0
Total Supply 2505 2622 2788 2805 0 2798
MY Exports 3 2 0 2 0 2
MY Exp. to EU 0 0 0 0 0 0
Industrial Dom.
Cons.
80 80 85 85 0 85
Food Use Dom.
Cons.
2200 2400 2450 2600 0 2600
Feed Waste Dom.
Cons.
0 0 0 0 0 0
Total Dom. Cons. 2280 2480 2535 2685 0 2685
Ending Stocks 222 140 253 118 0 111
Total Distribution 2505 2622 2788 2805 0 2798
Table 17. India: Commodity, Oilseed, Peanut, PSD
(Area in 1000 hectares and production in 1000 MT)
Oilseed, Peanut 2015/2016 2016/2017 2017/2018
Market Begin Year Oct 2015 Oct 2016 Oct 2017
India USDA
Official
New
Post
USDA
Official
New
Post
USDA
Official
New
Post
Area Planted 4560 4500 5500 5500 0 6000
Area Harvested 4560 4500 5500 5500 0 6000
Beginning Stocks 500 500 349 492 0 242
Production 4470 4900 6300 6300 0 7000
MY Imports 0 0 0 0 0 0
MY Imp. from U.S. 0 0 0 0 0 0
MY Imp. from EU 0 0 0 0 0 0
Total Supply 4970 5400 6649 6792 0 7242
MY Exports 771 858 950 1050 0 1050
MY Exp. to EU 20 20 20 25 0 25
Crush 2650 2800 3400 3800 0 4000
Food Use Dom.
Cons.
750 900 1000 1300 0 1400
Feed Waste Dom.
Cons.
450 350 500 400 0 450
Total Dom. Cons. 3850 4050 4900 5500 0 5850
Ending Stocks 349 492 799 242 0 342
Total Distribution 4970 5400 6649 6792 0 7242
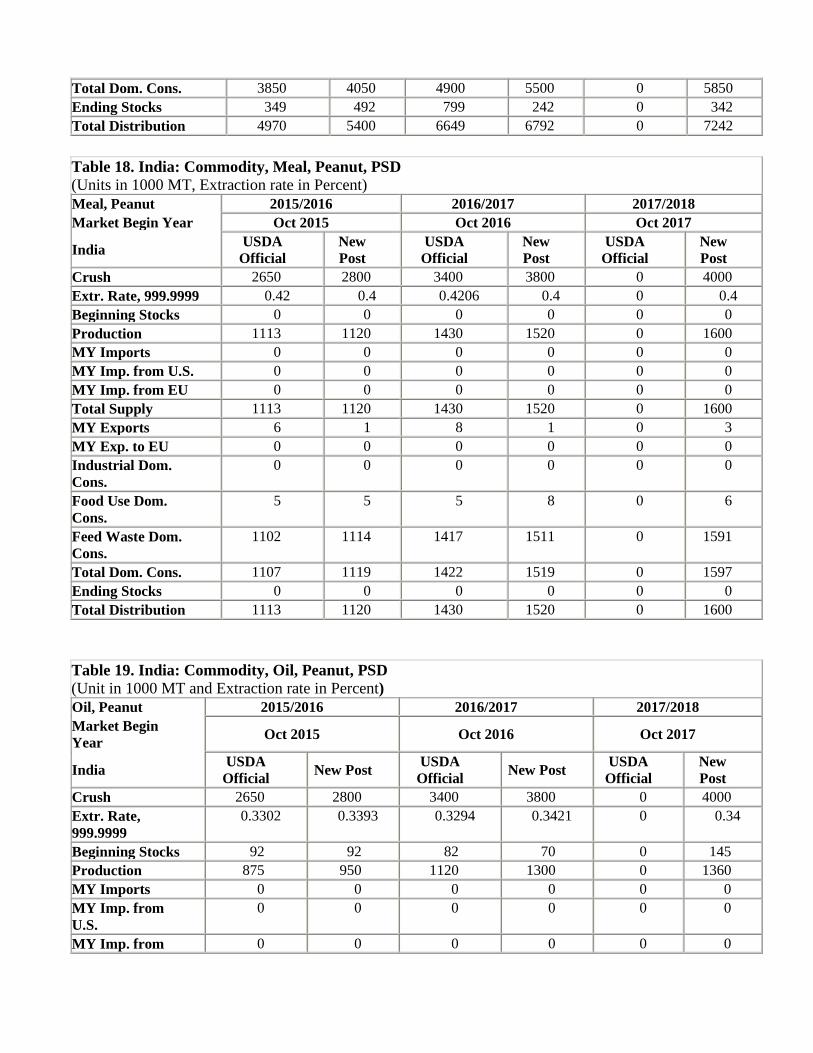
Table 18. India: Commodity, Meal, Peanut, PSD
(Units in 1000 MT, Extraction rate in Percent)
Meal, Peanut 2015/2016 2016/2017 2017/2018
Market Begin Year Oct 2015 Oct 2016 Oct 2017
India USDA
Official
New
Post
USDA
Official
New
Post
USDA
Official
New
Post
Crush 2650 2800 3400 3800 0 4000
Extr. Rate, 999.9999 0.42 0.4 0.4206 0.4 0 0.4
Beginning Stocks 0 0 0 0 0 0
Production 1113 1120 1430 1520 0 1600
MY Imports 0 0 0 0 0 0
MY Imp. from U.S. 0 0 0 0 0 0
MY Imp. from EU 0 0 0 0 0 0
Total Supply 1113 1120 1430 1520 0 1600
MY Exports 6 1 8 1 0 3
MY Exp. to EU 0 0 0 0 0 0
Industrial Dom.
Cons.
0 0 0 0 0 0
Food Use Dom.
Cons.
5 5 5 8 0 6
Feed Waste Dom.
Cons.
1102 1114 1417 1511 0 1591
Total Dom. Cons. 1107 1119 1422 1519 0 1597
Ending Stocks 0 0 0 0 0 0
Total Distribution 1113 1120 1430 1520 0 1600
Table 19. India: Commodity, Oil, Peanut, PSD
(Unit in 1000 MT and Extraction rate in Percent)
Oil, Peanut 2015/2016 2016/2017 2017/2018
Market Begin
Year Oct 2015 Oct 2016 Oct 2017
India USDA
Official New Post
USDA
Official New Post
USDA
Official
New
Post
Crush 2650 2800 3400 3800 0 4000
Extr. Rate,
999.9999
0.3302 0.3393 0.3294 0.3421 0 0.34
Beginning Stocks 92 92 82 70 0 145
Production 875 950 1120 1300 0 1360
MY Imports 0 0 0 0 0 0
MY Imp. from
U.S.
0 0 0 0 0 0
MY Imp. from 0 0 0 0 0 0
EU
Total Supply 967 1042 1202 1370 0 1505
MY Exports 11 12 20 15 0 15
MY Exp. to EU 0 0 0 0 0 0
Industrial Dom.
Cons.
10 10 10 10 0 10
Food Use Dom.
Cons.
864 950 1035 1200 0 1350
Feed Waste Dom.
Cons.
0 0 0 0 0 0
Total Dom. Cons. 874 960 1045 1210 0 1360
Ending Stocks 82 70 137 145 0 130
Total
Distribution
967 1042 1202 1370 0 1505
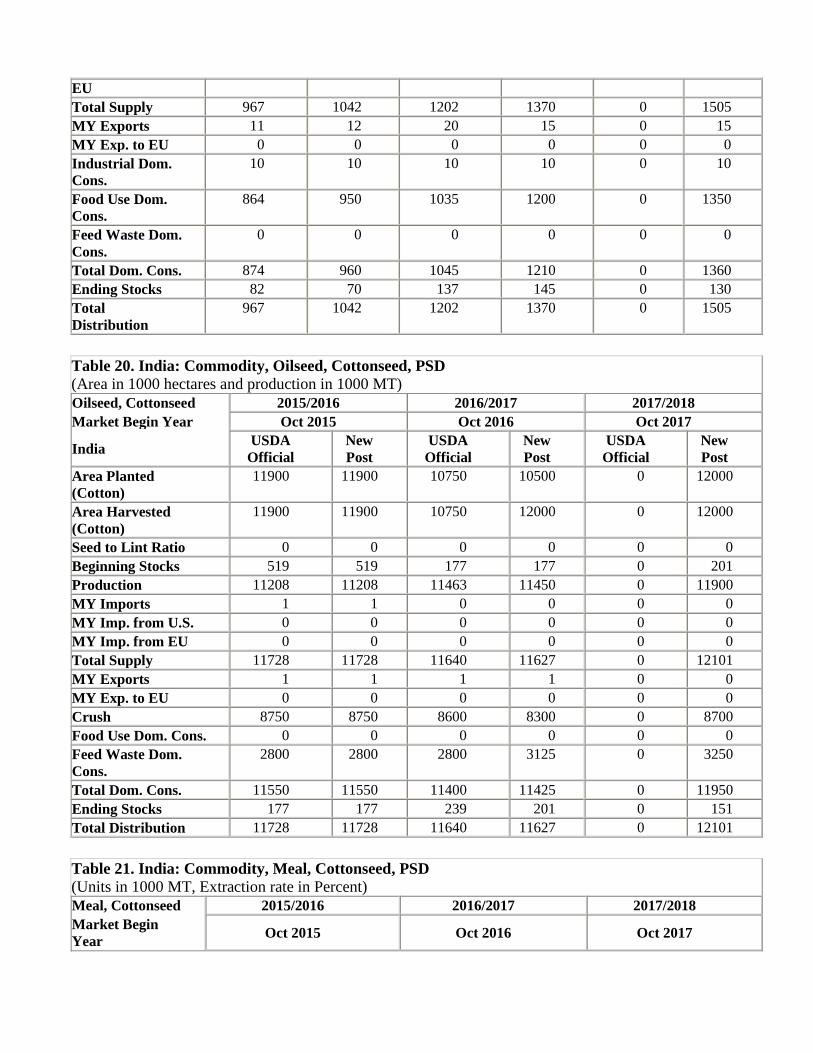
Table 20. India: Commodity, Oilseed, Cottonseed, PSD
(Area in 1000 hectares and production in 1000 MT)
Oilseed, Cottonseed 2015/2016 2016/2017 2017/2018
Market Begin Year Oct 2015 Oct 2016 Oct 2017
India USDA
Official
New
Post
USDA
Official
New
Post
USDA
Official
New
Post
Area Planted
(Cotton)
11900 11900 10750 10500 0 12000
Area Harvested
(Cotton)
11900 11900 10750 12000 0 12000
Seed to Lint Ratio 0 0 0 0 0 0
Beginning Stocks 519 519 177 177 0 201
Production 11208 11208 11463 11450 0 11900
MY Imports 1 1 0 0 0 0
MY Imp. from U.S. 0 0 0 0 0 0
MY Imp. from EU 0 0 0 0 0 0
Total Supply 11728 11728 11640 11627 0 12101
MY Exports 1 1 1 1 0 0
MY Exp. to EU 0 0 0 0 0 0
Crush 8750 8750 8600 8300 0 8700
Food Use Dom. Cons. 0 0 0 0 0 0
Feed Waste Dom.
Cons.
2800 2800 2800 3125 0 3250
Total Dom. Cons. 11550 11550 11400 11425 0 11950
Ending Stocks 177 177 239 201 0 151
Total Distribution 11728 11728 11640 11627 0 12101
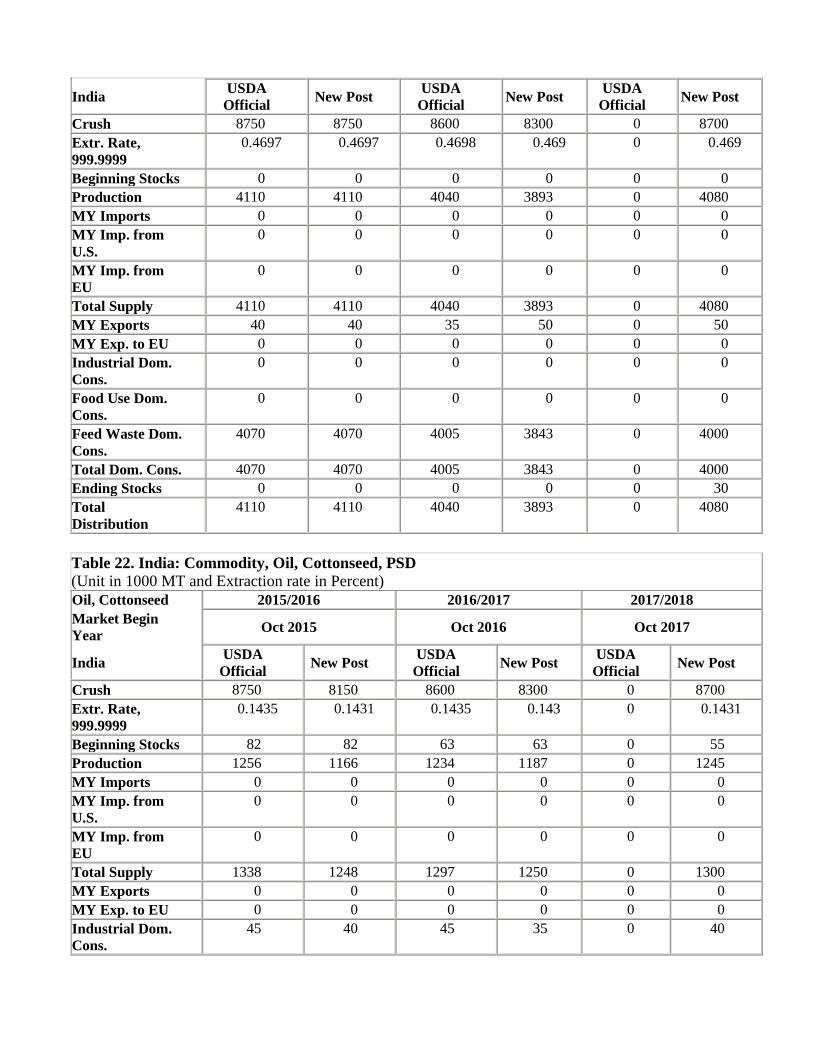
Table 21. India: Commodity, Meal, Cottonseed, PSD
(Units in 1000 MT, Extraction rate in Percent)
Meal, Cottonseed 2015/2016 2016/2017 2017/2018
Market Begin
Year Oct 2015 Oct 2016 Oct 2017
India USDA
Official New Post
USDA
Official New Post
USDA
Official New Post
Crush 8750 8750 8600 8300 0 8700
Extr. Rate,
999.9999
0.4697 0.4697 0.4698 0.469 0 0.469
Beginning Stocks 0 0 0 0 0 0
Production 4110 4110 4040 3893 0 4080
MY Imports 0 0 0 0 0 0
MY Imp. from
U.S.
0 0 0 0 0 0
MY Imp. from
EU
0 0 0 0 0 0
Total Supply 4110 4110 4040 3893 0 4080
MY Exports 40 40 35 50 0 50
MY Exp. to EU 0 0 0 0 0 0
Industrial Dom.
Cons.
0 0 0 0 0 0
Food Use Dom.
Cons.
0 0 0 0 0 0
Feed Waste Dom.
Cons.
4070 4070 4005 3843 0 4000
Total Dom. Cons. 4070 4070 4005 3843 0 4000
Ending Stocks 0 0 0 0 0 30
Total
Distribution
4110 4110 4040 3893 0 4080
Table 22. India: Commodity, Oil, Cottonseed, PSD
(Unit in 1000 MT and Extraction rate in Percent)
Oil, Cottonseed 2015/2016 2016/2017 2017/2018
Market Begin
Year Oct 2015 Oct 2016 Oct 2017
India USDA
Official New Post
USDA
Official New Post
USDA
Official New Post
Crush 8750 8150 8600 8300 0 8700
Extr. Rate,
999.9999
0.1435 0.1431 0.1435 0.143 0 0.1431
Beginning Stocks 82 82 63 63 0 55
Production 1256 1166 1234 1187 0 1245
MY Imports 0 0 0 0 0 0
MY Imp. from
U.S.
0 0 0 0 0 0
MY Imp. from
EU
0 0 0 0 0 0
Total Supply 1338 1248 1297 1250 0 1300
MY Exports 0 0 0 0 0 0
MY Exp. to EU 0 0 0 0 0 0
Industrial Dom.
Cons.
45 40 45 35 0 40
Food Use Dom.
Cons.
1230 1145 1157 1160 0 1200
Feed Waste
Dom. Cons.
0 0 0 0 0 0
Total Dom.
Cons.
1275 1185 1202 1195 0 1240
Ending Stocks 63 63 95 55 0 60
Total
Distribution
1338 1248 1297 1250 0 1300
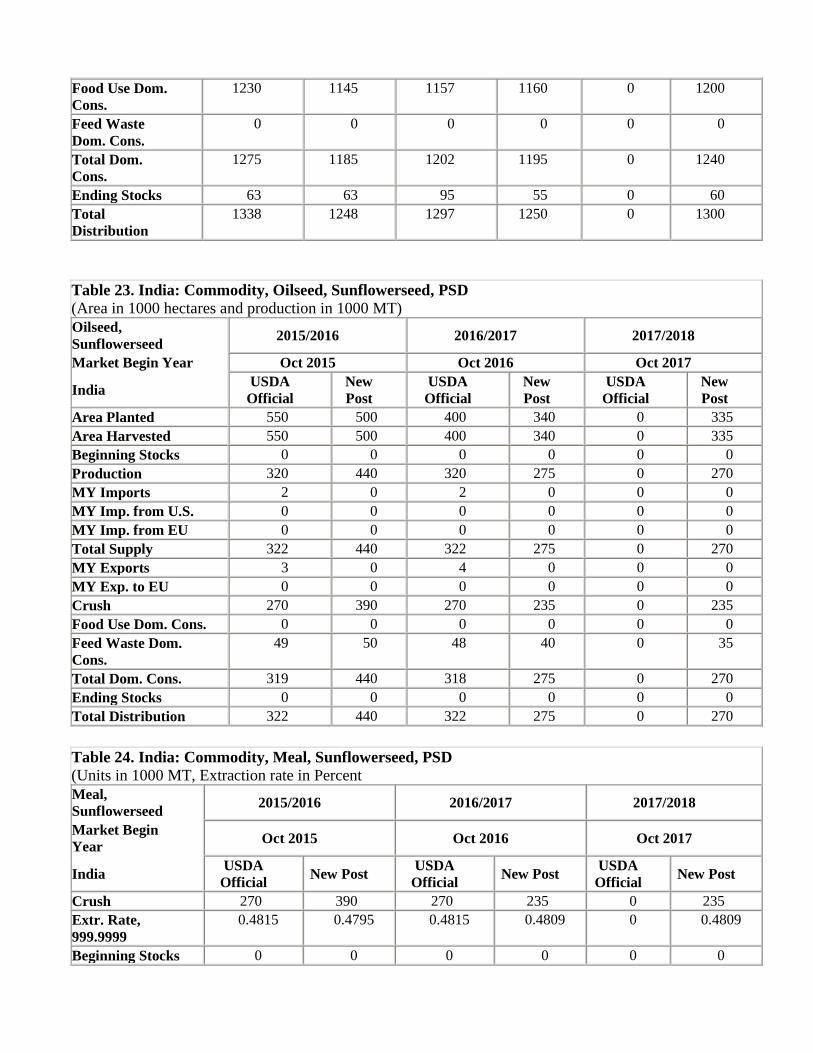
Table 23. India: Commodity, Oilseed, Sunflowerseed, PSD
(Area in 1000 hectares and production in 1000 MT)
Oilseed,
Sunflowerseed 2015/2016 2016/2017 2017/2018
Market Begin Year Oct 2015 Oct 2016 Oct 2017
India USDA
Official
New
Post
USDA
Official
New
Post
USDA
Official
New
Post
Area Planted 550 500 400 340 0 335
Area Harvested 550 500 400 340 0 335
Beginning Stocks 0 0 0 0 0 0
Production 320 440 320 275 0 270
MY Imports 2 0 2 0 0 0
MY Imp. from U.S. 0 0 0 0 0 0
MY Imp. from EU 0 0 0 0 0 0
Total Supply 322 440 322 275 0 270
MY Exports 3 0 4 0 0 0
MY Exp. to EU 0 0 0 0 0 0
Crush 270 390 270 235 0 235
Food Use Dom. Cons. 0 0 0 0 0 0
Feed Waste Dom.
Cons.
49 50 48 40 0 35
Total Dom. Cons. 319 440 318 275 0 270
Ending Stocks 0 0 0 0 0 0
Total Distribution 322 440 322 275 0 270
Table 24. India: Commodity, Meal, Sunflowerseed, PSD
(Units in 1000 MT, Extraction rate in Percent
Meal,
Sunflowerseed 2015/2016 2016/2017 2017/2018
Market Begin
Year Oct 2015 Oct 2016 Oct 2017
India USDA
Official New Post
USDA
Official New Post
USDA
Official New Post
Crush 270 390 270 235 0 235
Extr. Rate,
999.9999
0.4815 0.4795 0.4815 0.4809 0 0.4809
Beginning Stocks 0 0 0 0 0 0
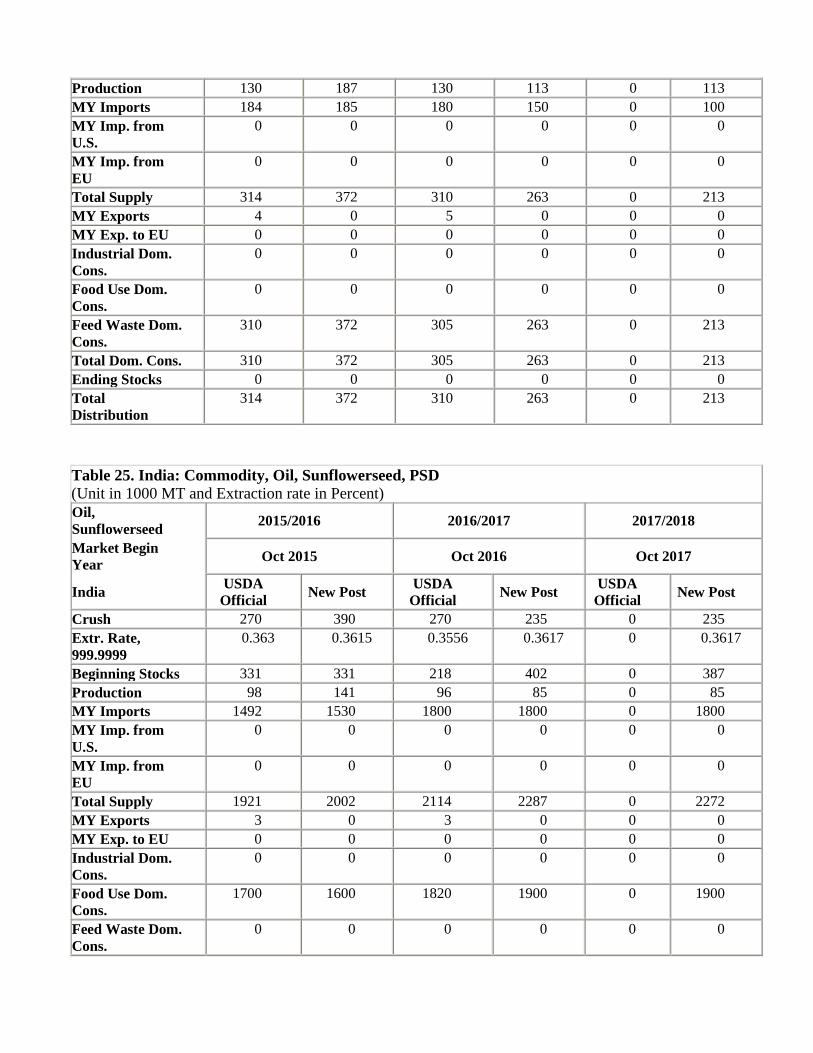
Production 130 187 130 113 0 113
MY Imports 184 185 180 150 0 100
MY Imp. from
U.S.
0 0 0 0 0 0
MY Imp. from
EU
0 0 0 0 0 0
Total Supply 314 372 310 263 0 213
MY Exports 4 0 5 0 0 0
MY Exp. to EU 0 0 0 0 0 0
Industrial Dom.
Cons.
0 0 0 0 0 0
Food Use Dom.
Cons.
0 0 0 0 0 0
Feed Waste Dom.
Cons.
310 372 305 263 0 213
Total Dom. Cons. 310 372 305 263 0 213
Ending Stocks 0 0 0 0 0 0
Total
Distribution
314 372 310 263 0 213
Table 25. India: Commodity, Oil, Sunflowerseed, PSD
(Unit in 1000 MT and Extraction rate in Percent)
Oil,
Sunflowerseed 2015/2016 2016/2017 2017/2018
Market Begin
Year Oct 2015 Oct 2016 Oct 2017
India USDA
Official New Post
USDA
Official New Post
USDA
Official New Post
Crush 270 390 270 235 0 235
Extr. Rate,
999.9999
0.363 0.3615 0.3556 0.3617 0 0.3617
Beginning Stocks 331 331 218 402 0 387
Production 98 141 96 85 0 85
MY Imports 1492 1530 1800 1800 0 1800
MY Imp. from
U.S.
0 0 0 0 0 0
MY Imp. from
EU
0 0 0 0 0 0
Total Supply 1921 2002 2114 2287 0 2272
MY Exports 3 0 3 0 0 0
MY Exp. to EU 0 0 0 0 0 0
Industrial Dom.
Cons.
0 0 0 0 0 0
Food Use Dom.
Cons.
1700 1600 1820 1900 0 1900
Feed Waste Dom.
Cons.
0 0 0 0 0 0
Total Dom. Cons. 1700 1600 1820 1900 0 1900
Ending Stocks 218 402 291 387 0 372
Total
Distribution
1921 2002 2114 2287 0 2272
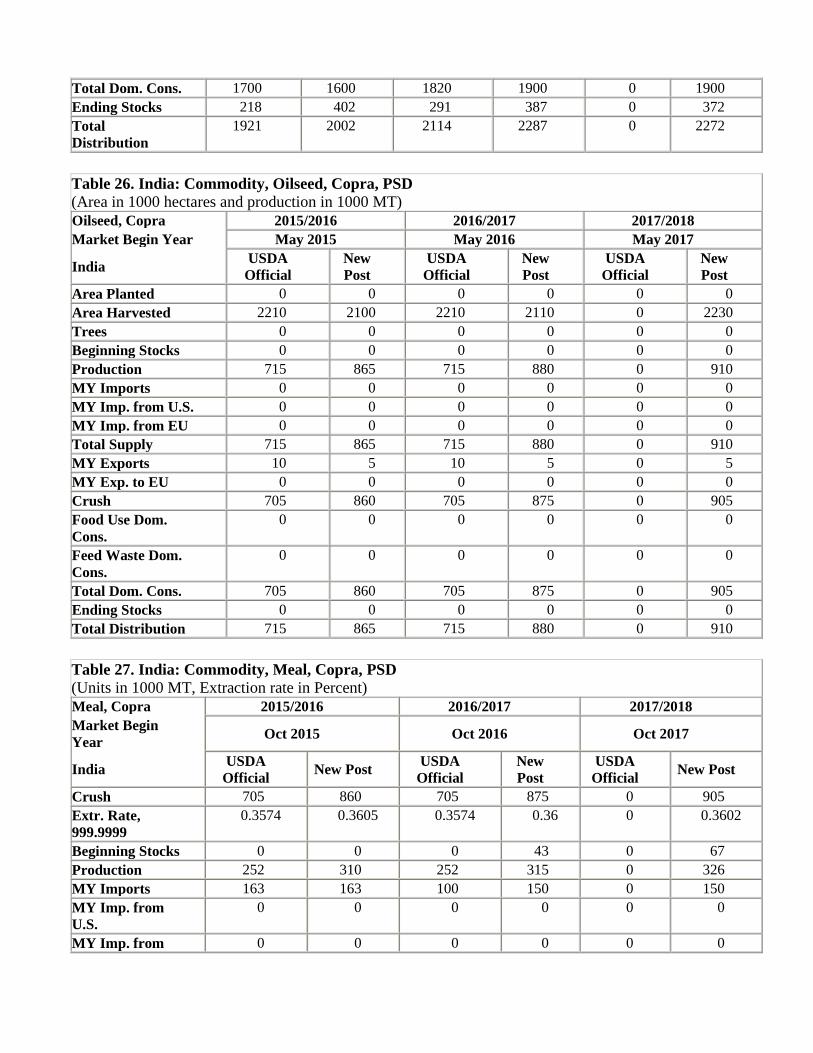
Table 26. India: Commodity, Oilseed, Copra, PSD
(Area in 1000 hectares and production in 1000 MT)
Oilseed, Copra 2015/2016 2016/2017 2017/2018
Market Begin Year May 2015 May 2016 May 2017
India USDA
Official
New
Post
USDA
Official
New
Post
USDA
Official
New
Post
Area Planted 0 0 0 0 0 0
Area Harvested 2210 2100 2210 2110 0 2230
Trees 0 0 0 0 0 0
Beginning Stocks 0 0 0 0 0 0
Production 715 865 715 880 0 910
MY Imports 0 0 0 0 0 0
MY Imp. from U.S. 0 0 0 0 0 0
MY Imp. from EU 0 0 0 0 0 0
Total Supply 715 865 715 880 0 910
MY Exports 10 5 10 5 0 5
MY Exp. to EU 0 0 0 0 0 0
Crush 705 860 705 875 0 905
Food Use Dom.
Cons.
0 0 0 0 0 0
Feed Waste Dom.
Cons.
0 0 0 0 0 0
Total Dom. Cons. 705 860 705 875 0 905
Ending Stocks 0 0 0 0 0 0
Total Distribution 715 865 715 880 0 910
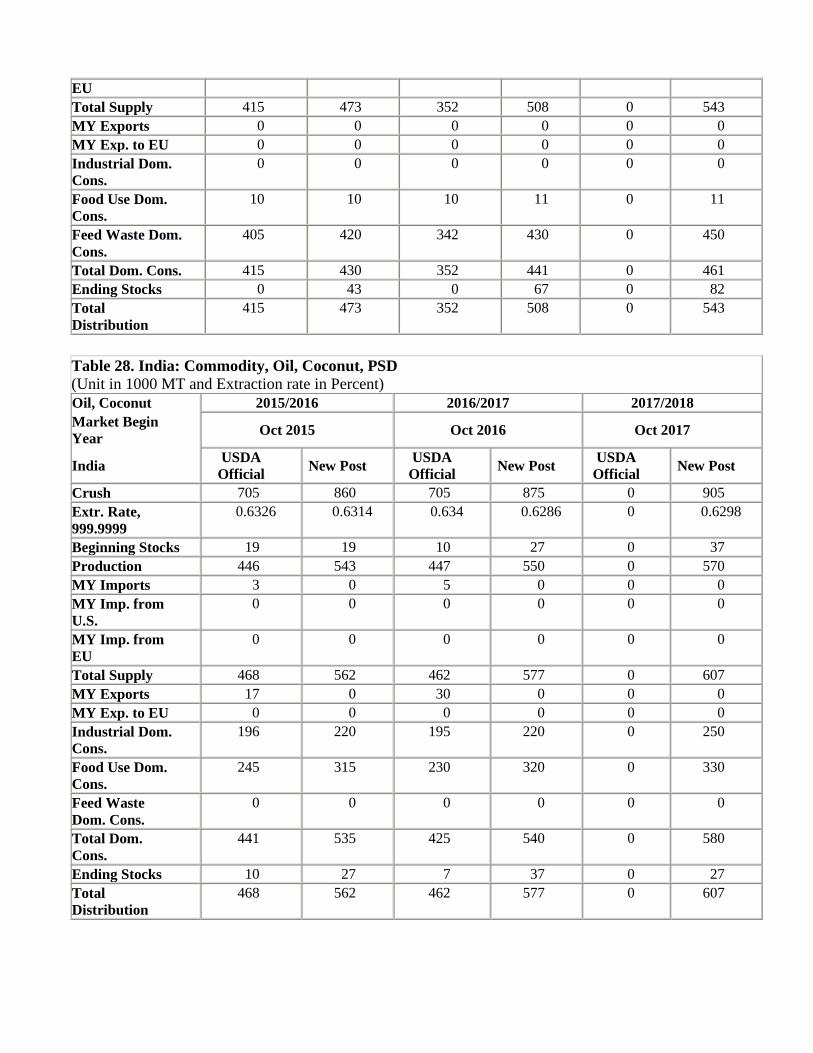
Table 27. India: Commodity, Meal, Copra, PSD
(Units in 1000 MT, Extraction rate in Percent)
Meal, Copra 2015/2016 2016/2017 2017/2018
Market Begin
Year Oct 2015 Oct 2016 Oct 2017
India USDA
Official New Post
USDA
Official
New
Post
USDA
Official New Post
Crush 705 860 705 875 0 905
Extr. Rate,
999.9999
0.3574 0.3605 0.3574 0.36 0 0.3602
Beginning Stocks 0 0 0 43 0 67
Production 252 310 252 315 0 326
MY Imports 163 163 100 150 0 150
MY Imp. from
U.S.
0 0 0 0 0 0
MY Imp. from 0 0 0 0 0 0
EU
Total Supply 415 473 352 508 0 543
MY Exports 0 0 0 0 0 0
MY Exp. to EU 0 0 0 0 0 0
Industrial Dom.
Cons.
0 0 0 0 0 0
Food Use Dom.
Cons.
10 10 10 11 0 11
Feed Waste Dom.
Cons.
405 420 342 430 0 450
Total Dom. Cons. 415 430 352 441 0 461
Ending Stocks 0 43 0 67 0 82
Total
Distribution
415 473 352 508 0 543
Table 28. India: Commodity, Oil, Coconut, PSD
(Unit in 1000 MT and Extraction rate in Percent)
Oil, Coconut 2015/2016 2016/2017 2017/2018
Market Begin
Year Oct 2015 Oct 2016 Oct 2017
India USDA
Official New Post
USDA
Official New Post
USDA
Official New Post
Crush 705 860 705 875 0 905
Extr. Rate,
999.9999
0.6326 0.6314 0.634 0.6286 0 0.6298
Beginning Stocks 19 19 10 27 0 37
Production 446 543 447 550 0 570
MY Imports 3 0 5 0 0 0
MY Imp. from
U.S.
0 0 0 0 0 0
MY Imp. from
EU
0 0 0 0 0 0
Total Supply 468 562 462 577 0 607
MY Exports 17 0 30 0 0 0
MY Exp. to EU 0 0 0 0 0 0
Industrial Dom.
Cons.
196 220 195 220 0 250
Food Use Dom.
Cons.
245 315 230 320 0 330
Feed Waste
Dom. Cons.
0 0 0 0 0 0
Total Dom.
Cons.
441 535 425 540 0 580
Ending Stocks 10 27 7 37 0 27
Total
Distribution
468 562 462 577 0 607
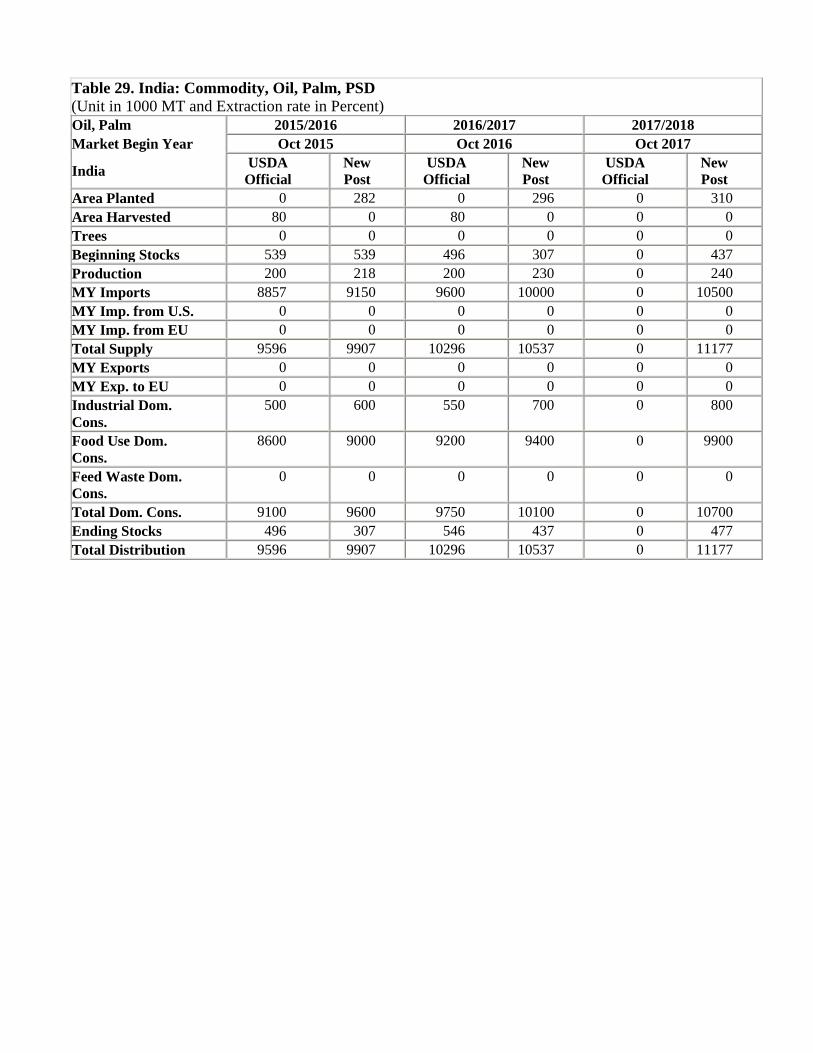
Table 29. India: Commodity, Oil, Palm, PSD
(Unit in 1000 MT and Extraction rate in Percent)
Oil, Palm 2015/2016 2016/2017 2017/2018
Market Begin Year Oct 2015 Oct 2016 Oct 2017
India USDA
Official
New
Post
USDA
Official
New
Post
USDA
Official
New
Post
Area Planted 0 282 0 296 0 310
Area Harvested 80 0 80 0 0 0
Trees 0 0 0 0 0 0
Beginning Stocks 539 539 496 307 0 437
Production 200 218 200 230 0 240
MY Imports 8857 9150 9600 10000 0 10500
MY Imp. from U.S. 0 0 0 0 0 0
MY Imp. from EU 0 0 0 0 0 0
Total Supply 9596 9907 10296 10537 0 11177
MY Exports 0 0 0 0 0 0
MY Exp. to EU 0 0 0 0 0 0
Industrial Dom.
Cons.
500 600 550 700 0 800
Food Use Dom.
Cons.
8600 9000 9200 9400 0 9900
Feed Waste Dom.
Cons.
0 0 0 0 0 0
Total Dom. Cons. 9100 9600 9750 10100 0 10700
Ending Stocks 496 307 546 437 0 477
Total Distribution 9596 9907 10296 10537 0 11177
Recommended