DISCLOSURE APPENDIX AT THE BACK OF THIS REPORT CONTAINS IMPORTANT DISCLOSURES, ANALYST CERTIFICATIONS, LEGAL ENTITY DISCLOSURE AND THE STATUS OF NON-US ANALYSTS. US Disclosure: Credit Suisse does and seeks to do business with companies covered in its research reports. As a result, investors should be aware that the Firm may have a conflict of interest that could affect the objectivity of this report. Investors should consider this report as only a single factor in making their investment decision.
22 August 2017 Asia Pacific/India Equity Research
Automobiles & Components
India Automobiles Sector Research Analysts
Jatin Chawla
91 22 6777 3719
Vaibhav Jain
91 22 6777 3968
THEME
The distinct path towards EVs
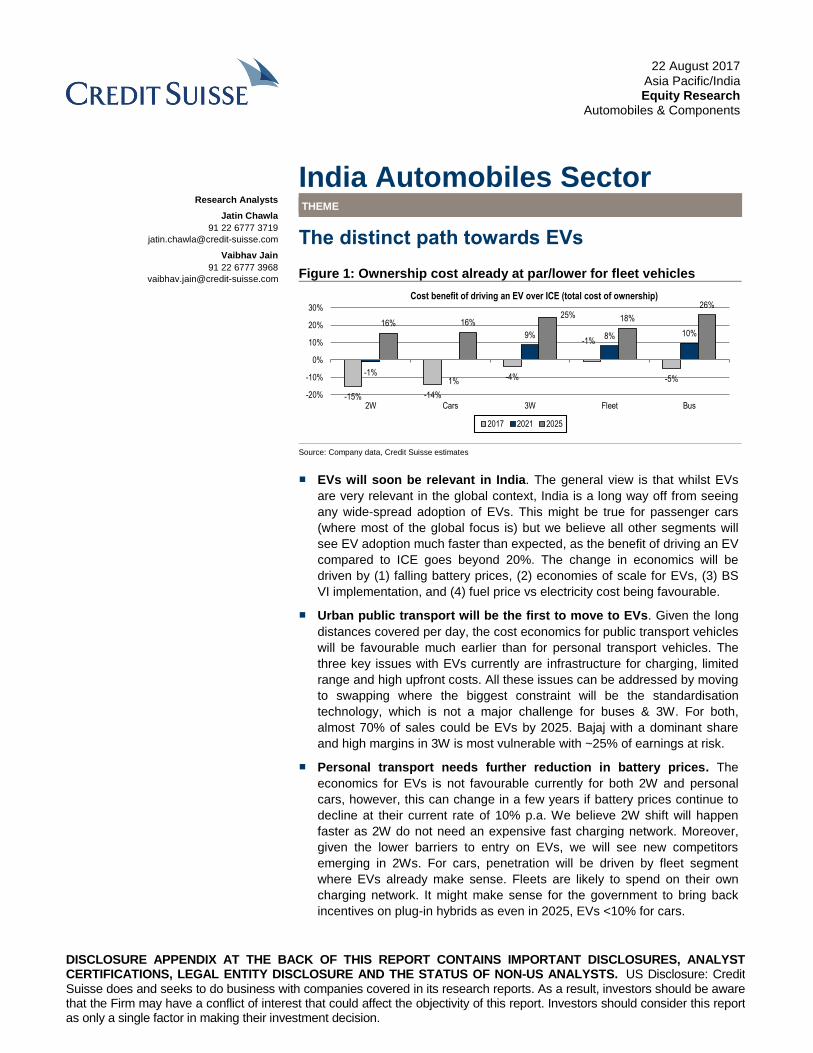
Figure 1: Ownership cost already at par/lower for fleet vehicles
Source: Company data, Credit Suisse estimates
■ EVs will soon be relevant in India. The general view is that whilst EVs
are very relevant in the global context, India is a long way off from seeing
any wide-spread adoption of EVs. This might be true for passenger cars
(where most of the global focus is) but we believe all other segments will
see EV adoption much faster than expected, as the benefit of driving an EV
compared to ICE goes beyond 20%. The change in economics will be
driven by (1) falling battery prices, (2) economies of scale for EVs, (3) BS
VI implementation, and (4) fuel price vs electricity cost being favourable.
■ Urban public transport will be the first to move to EVs. Given the long
distances covered per day, the cost economics for public transport vehicles
will be favourable much earlier than for personal transport vehicles. The
three key issues with EVs currently are infrastructure for charging, limited
range and high upfront costs. All these issues can be addressed by moving
to swapping where the biggest constraint will be the standardisation
technology, which is not a major challenge for buses & 3W. For both,
almost 70% of sales could be EVs by 2025. Bajaj with a dominant share
and high margins in 3W is most vulnerable with ~25% of earnings at risk.
■ Personal transport needs further reduction in battery prices. The
economics for EVs is not favourable currently for both 2W and personal
cars, however, this can change in a few years if battery prices continue to
decline at their current rate of 10% p.a. We believe 2W shift will happen
faster as 2W do not need an expensive fast charging network. Moreover,
given the lower barriers to entry on EVs, we will see new competitors
emerging in 2Ws. For cars, penetration will be driven by fleet segment
where EVs already make sense. Fleets are likely to spend on their own
charging network. It might make sense for the government to bring back
incentives on plug-in hybrids as even in 2025, EVs <10% for cars.
-15% -14%
-4%
-1%
-5%-1%
1%
9% 8% 10%16% 16%
25% 18%
26%
-20%
-10%
0%
10%
20%
30%
2W Cars 3W Fleet Bus
2017 2021 2025
Cost benefit of driving an EV over ICE (total cost of ownership)

22 August 2017
India Automobiles Sector 2
Focus charts Figure 2: Decline in solar tariffs—key driver for
focus on EVs in India
Figure 3: BS-VI will result in a ~10% increase in ICE
prices; with battery price decline gap closing
Source: MNRE, Credit Suisse research Source: Credit Suisse estimates
Figure 4: Post 2020 and with battery prices at
US$130; payback period will come down to ~2 years
Figure 5: 3W, car fleet and buses to have a very
high share of EVs; 2W too will start moving
Source: Credit Suisse estimates Source: Credit Suisse estimates
Figure 6: Bajaj's 3W business—both market share
and margins at risk from EVs
Figure 7: Total cost of ownership of EV vehicles' will
be beneficial for all segments in FY25E
Source: Company data, Credit Suisse estimates Source: Credit Suisse estimates
-
2.0
4.0
6.0
8.0
10.0
12.0
14.0
Dec
’10
Dec
’11
Dec
’12
Jan’
14
Feb
’15
Jun’
15
Aug
’15
Sep
’15
Oct
’15
Nov
'15
Jan'
16
Apr
'16
Jun'
16
Sep
'16
Dec
'16
Feb
'17
May
'17
Solar tariffs in India (Rs/unit)
-
2.0
4.0
6.0
8.0
10.0
12.0
2W PV CV
Increase in vehicle price due to BS VI changes (%)
-
1.0
2.0
3.0
4.0
5.0
6.0
7.0
8.0
9.0
2W PV
2017 2025
0%
10%
20%
30%
40%
50%
60%
70%
80%
Cars (inc fleet) 2W 3W Buses
Share of Evs in 2025 Penetration
0%
10%
20%
30%
40%
50%
60%
70%
80%
90%
100%
3W PV share 3W gasoline/CNGshare
3W small dieselshare
3W large dieselshare
Bajaj's share in 3W Passenger vehicles
(Rs/km) ICE EV ICE EV Preferred Mode
2W 3.2 3.7 3.3 2.8 Charging
Cars 16.1 18.7 16.1 13.9 Charging
3W 2.8 2.9 2.7 2.1 Swapping
PV fleet 9.1 9.1 8.8 7.5 Charging
Bus 42.5 44.6 44.3 35.2 Charging/
Swapping
2017E 2025E
22 August 2017
India Automobiles Sector 3
The distinct path towards EVs
EVs will soon be relevant in India as well
The general view is that whilst EVs are very relevant in the global context; India is long
way off from seeing any wide-spread adoption of EVs. This might be true for passenger
cars (where most of the global focus is) but we believe all other segments will see EV
adoption much faster than expected, with economics on EVs working out to be far better
than ICE (even without incentives).
The key drivers of this improving economics in India will be (1) falling battery pack prices
which have already declined from US$1,000/KWH in 2010 to US$230/Kwh currently, and
are expected to decline 10% every year for the next few years and fall to US$130/kwh by
2025, (2) economies of scale for EV manufacturers helping them lower prices, (3)
implementation of BS-VI norms pushing ICE vehicle prices up by 10%, (4) the fuel price vs
electricity price economics is already favourable in India, and with the movement of mix
towards solar it could become even more favourable, and (5) range and performance
anxiety going away as products become better. The key challenge will be the lack of any
sort of infrastructure for charging and the willingness of the government to continue with
incentives till 2025, once EV volumes start becoming meaningful.
Urban public transport will be the first to move to EV
Given the long distances covered per day, the cost economics for public transport vehicles
will be favourable much earlier than for personal transport vehicles. The three key issues
with EVs currently are infrastructure for charging, limited range and high upfront costs. All
these issues can be addressed by moving to battery swapping where the biggest
constraint will be the standardisation of technology; which though is difficult but not
impossible for standard products like buses & 3W. The other advantages with swapping is
that the process of charging can be moved to a central location which can then tie-up with
renewable energy suppliers at a lower price. Also, given that batteries can be charged in
ideal conditions might help in increasing the life of a battery.
For both buses & 3W, almost 70% of sales in cities by 2025 is likely to be EVs. This
impending change on 3W is not lost on the OEMs and all of them are ready with their
electric vehicles. We feel the biggest negative impact of this change will be on Bajaj Auto
as it is a dominant player with a 80%+ share on small passenger 3W used in urban cities.
For buses, the cost of handling swapping of batteries is higher, and on cost terms almost
equivalent to installing fast chargers that can be used overnight for charging. Fast
charging might just be a more practical solution but that entails high upfront costs on both
the bus and the charging infrastructure.
Personal transport needs further reduction in costs
For personal transport, the cost dynamics still does not work out as payback periods
currently exceed five years, and we feel the payback period has to be <3 years for a
transition to happen; this could happen by FY21, once battery prices are lower and ICE
cost higher post BS-VI. Within personal vehicles, 2W will transition faster than cars as 2W
do not really need a high cost fast charging network. On 2W, there will be competition from
a number of startups as well since the traditional advantages of a 2W OEM—brand and
distribution are unlikely to play a big role in EVs. We expect >20% of total 2W sold to be
electric by 2025. We could see the entry of Bajaj into scooters with an electric scooter.
On cars, penetration will be driven by fleet segment where EVs already make sense.
Fleets are likely to spend on their own charging network. As such this will limit penetration
of EVs to <10% of the total PV volumes even by 2025. We believe it makes sense for the
government to bring back incentives on plug-in hybrids, once battery costs start coming
down; it will make economic sense. No major threat to Maruti as such, Mahindra will
benefit from the shift towards EVs amongst fleet, given that it has a head start.
Lower battery prices, economies of scale,
BS-VI will drive a shift towards EVs
3W – first to move to EVs, swapping a quick
viable solution
Bajaj with a large share in passenger 3W
vulnerable to the shift
Payback period needs to come down to <3
years for shift in personal vehicles
2W will move to EVs before cars as they do not need a dense fast
charging network
22 August 2017
India Automobiles Sector 4
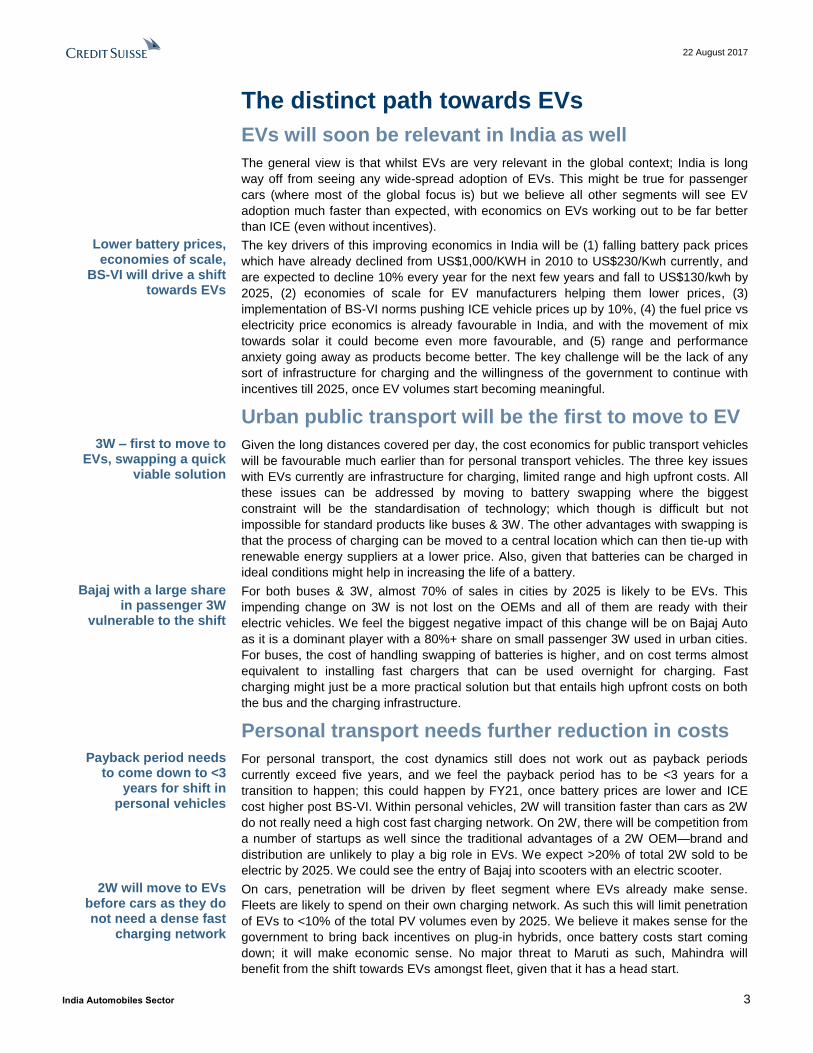
Valuation table Figure 8: Valuation comparison of global auto majors
Company Currency CMP Market cap P/E (x) EV/EBITDA (x) RoE P/B
(LC) (US$ bn) CY17/FY18 CY18/FY19 CY17/FY18 CY18/FY19 CY17/FY18 CY17/FY18
US
Ford Motor Company USD 11 52.0 6.8 6.4 3.6 4.5 21.4 1.3
General Motors Company USD 35 49.9 5.7 5.7 2.4 2.1 19.0 1.0
Tesla USD 338 56.4 Nm Nm 64.7 28.3 -24.0 11.2
Paccar Inc USD 63 22.0 17.2 15.0 12.7 12.1 20.4 3.1
European
BMW EUR 79 61.8 7.4 7.1 3.0 2.9 14.3 1.0
Daimler EUR 60 78.2 6.6 6.7 4.1 4.2 15.9 1.0
Volkswagen EUR 127 78.8 5.4 5.1 2.8 2.6 12.5 0.6
Volvo SEK 137 26.8 14.9 14.1 6.2 5.7 20.0 2.6
Peugeot EUR 18 18.3 7.8 7.0 1.9 1.6 14.9 1.1
Renault EUR 75 25.9 5.1 4.8 3.5 3.2 12.9 0.6
Fiat Chrysler EUR 11 19.0 5.4 4.9 1.7 1.5 15.2 0.8
Korean/ Indonesia
Hyundai Motor Company KRW 147,000 32.2 6.8 6.1 7.9 7.2 8.0 0.6
Kia Motors KRW 35,500 14.1 5.8 5.1 3.7 3.2 8.9 0.5
Astra International IDR 7,925 26.6 15.8 14.2 13.1 11.8 17.2 2.6
Japanese
Toyota Motor JPY 6,138 158.8 10.1 9.4 8.4 7.9 10.1 1.0
Honda Motor JPY 3,022 49.5 9.0 8.3 8.2 7.4 8.0 0.7
Nissan Motor JPY 1,092 37.6 7.2 6.8 6.8 6.5 11.5 0.8
Suzuki Motor JPY 5,454 20.7 15.1 14.1 4.2 3.9 13.2 1.9
Subaru Corporation JPY 3,878 26.1 9.0 8.6 3.7 3.2 20.7 1.8
Mazda Motor JPY 1,598 24.9 8.3 7.7 10.2 9.2 10.7 0.8
Chinese
SAIC Motor Corp Ltd CNY 30 50.5 9.5 8.8 7.0 6.3 17.7 1.6
BYD HKD 48 18.8 26.5 19.7 9.3 7.8 9.2 2.4
Brilliance China Automotive HKD 21 9.1 21.7 16.3 Nm Nm 18.8 3.8
Dongfeng Motor Group Company HKD 10 9.7 6.8 6.5 11.0 10.7 12.7 0.8
Weichai Power CNY 7 6.6 8.6 7.8 4.3 3.8 10.7 0.8
Great Wall Motor HKD 10 13.7 9.1 8.6 6.2 5.8 19.5 1.7
Guangzhou Automobile Group HKD 16 19.5 11.4 10.1 22.5 20.1 18.5 1.9
BAIC Motor Corporation Limited HKD 7 7.3 7.3 6.4 2.2 1.6 16.5 1.1
Geely Automobile Holdings Ltd HKD 19 13.6 22.2 17.4 7.1 6.9 27.4 5.5
Indian
Bajaj Auto INR 2,741 12.8 18.7 16.4 14.1 11.9 26.1 4.5
Hero Motocorp INR 3,885 11.9 20.4 19.0 13.6 12.5 35.6 6.9
Eicher Motors INR 30,998 12.3 38.2 30.7 23.7 18.9 39.9 12.9
TVS Motors INR 582 4.0 37.2 28.7 21.8 16.6 27.7 9.7
Maruti Suzuki INR 7,498 33.4 27.0 22.9 15.4 12.9 22.0 5.6
Mahindra & Mahindra INR 1,375 13.7 21.3 17.8 14.2 12.2 15.1 3.0
Source: IBES estimates.

22 August 2017
India Automobiles Sector 5
EVs will soon be relevant in India as well The general view is that whilst EVs are very relevant in the global context; India is a long
way off from seeing any wide-spread adoption of EVs. This might be true for passenger
cars (where most of the global focus is) but we believe all other segments will see EV
adoption much faster than expected, with economics on EVs working out to be far better
than ICE (even without incentives). The key drivers of this improving economics in India
will be (1) falling battery pack prices which have already declined from US$1,000/KWH in
2010 to US$230/Kwh currently are expected to decline 10% every year for the next few
years and fall to US$130/kwh by 2025, (2) economies of scale for EV manufacturers,
helping them lower prices, (3) implementation of BS-VI norms pushing ICE vehicle prices
up by 10%, (4) the fuel price vs electricity price economics is already favourable in India,
and with the movement of mix towards solar it could become even more favourable, and
(5) range and performance anxiety going away as products become better. The key
challenge will be the lack of any sort of infrastructure for charging, and the willingness of
the government to continue with incentives till 2025, once EV volumes start becoming
meaningful.
EV benefits to increase to ~20% by 2025
We expect the penetration of EVs to increase significantly in the next few years, as the
benefit of owning an EV compared to an ICE (Internal Combustion Engine) vehicle
increases significantly. Already for public transportation segments like 3W, buses and car
fleets; the total cost of owning an EV is comparable to the cost of an ICE vehicle. This
benefit will only increase in the coming years leading to a wide-spread adoption of EVs in
these segments. Given that cost is the most important criteria for these segments, we
would not be surprised if the share of EVs in this segments reaches ~70% levels. On
personal vehicles like 2W and cars, the cost benefit does not make sense today but here
too by FY21 EVs will be at par with ICE, and with at least some sort of infrastructure
created by the public transport segment we will start seeing some shift towards EVs in
these segments as well, especially in 2W where we believe the move towards EVs will
create a completely new category of smart vehicles.
Figure 9: The economics of EVs will be irresistible in a few years
Source: Credit Suisse estimates
-15% -14%
-4%
-1%
-5%
-1%
1%
9% 8%10%
16% 16%
25%
18%
26%
-20%
-10%
0%
10%
20%
30%
2W Cars 3W Fleet Bus
2017 2021 2025
Cost benefit of driving an EV over ICE (total cost of ownership)

22 August 2017
India Automobiles Sector 6
The shift towards EVs will be driven by a number of factors –
#1 Falling battery prices
Electric vehicles growth seems to be at an inflection stage with continuous fall in battery
prices in the last few years, and rising cost of ICE engines due to tightening norms on
emissions driven by environmental concerns. Battery prices have fallen from a level of
US$1000/kwh in 2010 to below US$250/kwh in 2016. There are market expectations of
another 10% reduction per annum in the next few years, driven by scale as well as
technological advancements. At 10% reduction p.a., prices could reach below US$ 90/kwh
in CY25E.
Figure 10: Battery packs prices have fallen +75%
over the last six years..
Figure 11: ...at 10% reduction p.a., prices will reach
below US$90/kwh in CY25E
Source: Electrek Source: Electrek, Credit Suisse estimates
Scale, technological advancement to help in reduction of battery prices
In terms of incremental capacities, China, the US and Korea will account of majority of the
capacity additions over the next few years. We expect these large-scale capacity additions
to help in reduction of battery prices.
Figure 12: China likely to account for +60% of Li-ion battery capacity by 2020
GWH 2016 capacity 2020 capacity Companies
US 1 38 Tesla, LG Chem
China 16 108 Lishen, CALB, Samsung, BYD, LG Chem, Panasonic,
Boston Power, CATL
Korea 11 23 LG Chem, Samsung
Poland - 5 LG Chem
Total 28 174
Source: Company data, Credit Suisse estimates
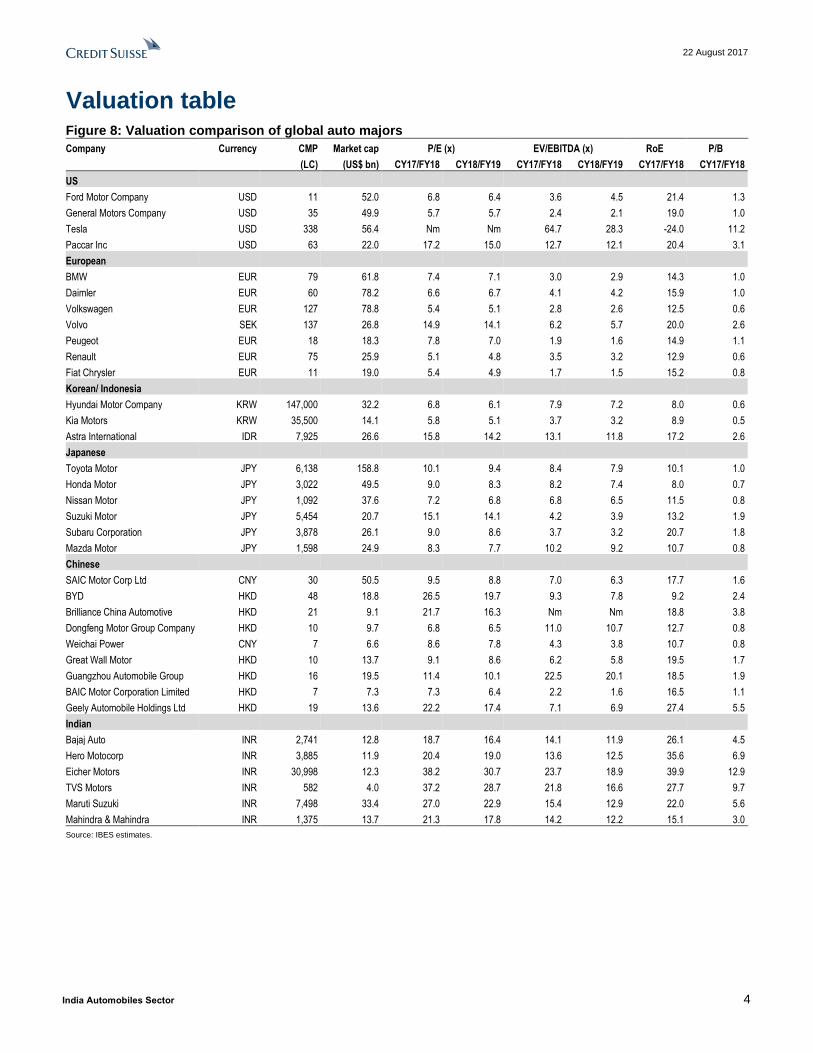
Future cost of batteries will be reduced on lower cost of cells (technology changes leading
to higher energy density, lower production cost) and other technological breakthroughs,
which can help reduce the cost of battery pack content. Battery cells currently account for
about 75% of the total cost. In case of cells, Lithium Nickel Manganese Cobalt oxide
(NMC) currently uses Nickel, Manganese and Cobalt in the same ratio (33% each). This
ratio could change from 1:1:1 to 6:2:2 and later to 8:1:1, thus, reducing the share of the
most expensive element, Cobalt, to just 10% from 33% now. Thus, there could be a
-
200
400
600
800
1,000
1,200
2010 2011 2012 2013 2014 2015 2016
Battery pack price (USD/kwh)
Battery pack price (USD/kwh)
-
50
100
150
200
250
2016 2017E 2018E 2019E 2020E 2021E 2022E 2023E 2024E 2025E
Battery pack price (USD/kwh) At 5% reduction p.a.
At 10% reduction p.a.
Shift from NMC (1:1:1) to NMC (8:1:1) will help
reduce high cost of cobalt
22 August 2017
India Automobiles Sector 7
significant reduction in price of the cells as well as battery packs, which will make batteries
more affordable.
Figure 13: Battery cells account for ~75% of battery pack cost—technological
break-throughs will help in the reduction in battery prices
Source: Credit Suisse estimates
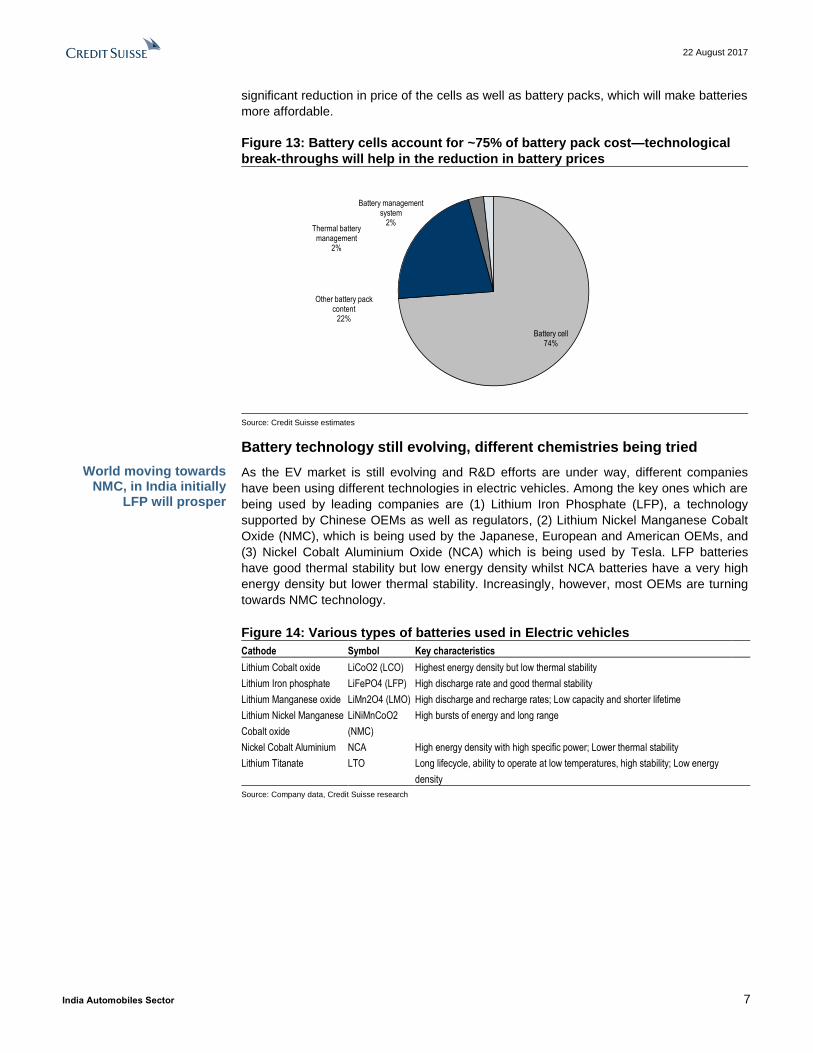
Battery technology still evolving, different chemistries being tried
As the EV market is still evolving and R&D efforts are under way, different companies
have been using different technologies in electric vehicles. Among the key ones which are
being used by leading companies are (1) Lithium Iron Phosphate (LFP), a technology
supported by Chinese OEMs as well as regulators, (2) Lithium Nickel Manganese Cobalt
Oxide (NMC), which is being used by the Japanese, European and American OEMs, and
(3) Nickel Cobalt Aluminium Oxide (NCA) which is being used by Tesla. LFP batteries
have good thermal stability but low energy density whilst NCA batteries have a very high
energy density but lower thermal stability. Increasingly, however, most OEMs are turning
towards NMC technology.
Figure 14: Various types of batteries used in Electric vehicles
Cathode Symbol Key characteristics
Lithium Cobalt oxide LiCoO2 (LCO) Highest energy density but low thermal stability
Lithium Iron phosphate LiFePO4 (LFP) High discharge rate and good thermal stability
Lithium Manganese oxide LiMn2O4 (LMO) High discharge and recharge rates; Low capacity and shorter lifetime
Lithium Nickel Manganese
Cobalt oxide
LiNiMnCoO2
(NMC)
High bursts of energy and long range
Nickel Cobalt Aluminium NCA High energy density with high specific power; Lower thermal stability
Lithium Titanate LTO Long lifecycle, ability to operate at low temperatures, high stability; Low energy
density
Source: Company data, Credit Suisse research
Battery cell74%
Other battery pack content
22%
Thermal battery management
2%
Battery management system
2%
World moving towards NMC, in India initially
LFP will prosper
22 August 2017
India Automobiles Sector 8
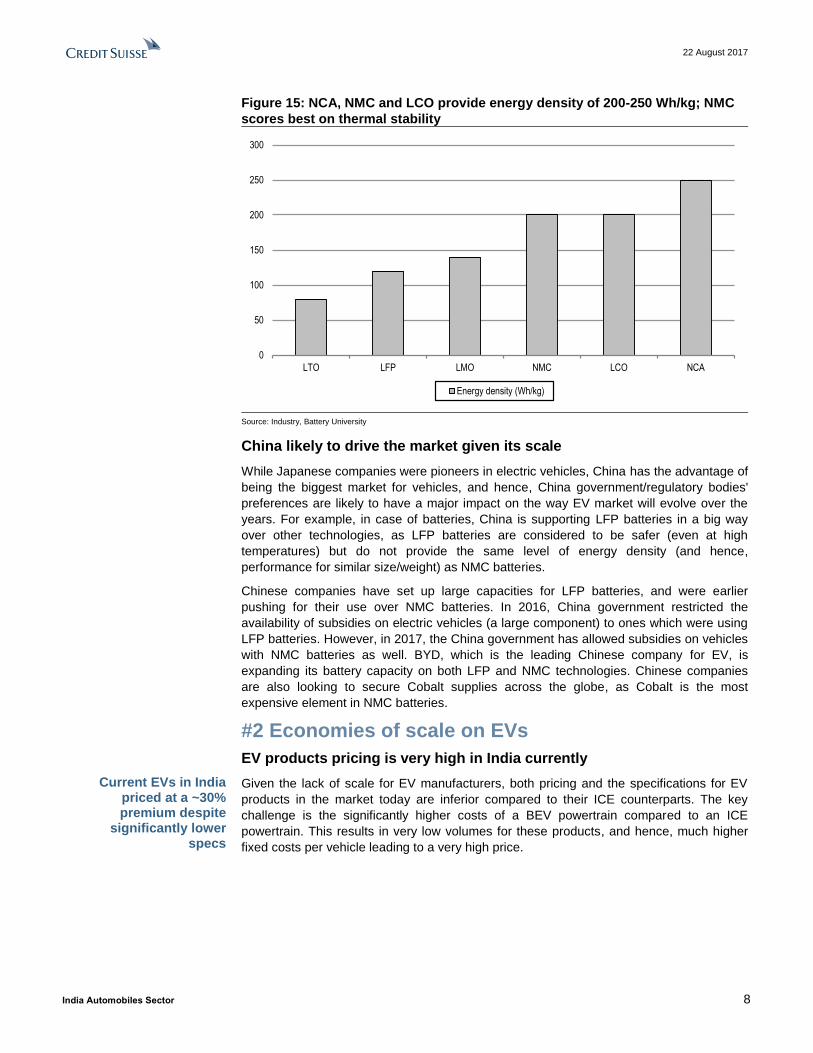
Figure 15: NCA, NMC and LCO provide energy density of 200-250 Wh/kg; NMC
scores best on thermal stability
Source: Industry, Battery University
China likely to drive the market given its scale
While Japanese companies were pioneers in electric vehicles, China has the advantage of
being the biggest market for vehicles, and hence, China government/regulatory bodies'
preferences are likely to have a major impact on the way EV market will evolve over the
years. For example, in case of batteries, China is supporting LFP batteries in a big way
over other technologies, as LFP batteries are considered to be safer (even at high
temperatures) but do not provide the same level of energy density (and hence,
performance for similar size/weight) as NMC batteries.
Chinese companies have set up large capacities for LFP batteries, and were earlier
pushing for their use over NMC batteries. In 2016, China government restricted the
availability of subsidies on electric vehicles (a large component) to ones which were using
LFP batteries. However, in 2017, the China government has allowed subsidies on vehicles
with NMC batteries as well. BYD, which is the leading Chinese company for EV, is
expanding its battery capacity on both LFP and NMC technologies. Chinese companies
are also looking to secure Cobalt supplies across the globe, as Cobalt is the most
expensive element in NMC batteries.
#2 Economies of scale on EVs
EV products pricing is very high in India currently
Given the lack of scale for EV manufacturers, both pricing and the specifications for EV
products in the market today are inferior compared to their ICE counterparts. The key
challenge is the significantly higher costs of a BEV powertrain compared to an ICE
powertrain. This results in very low volumes for these products, and hence, much higher
fixed costs per vehicle leading to a very high price.
0
50
100
150
200
250
300
LTO LFP LMO NMC LCO NCA
Energy density (Wh/kg)
Current EVs in India priced at a ~30% premium despite
significantly lower specs
22 August 2017
India Automobiles Sector 9
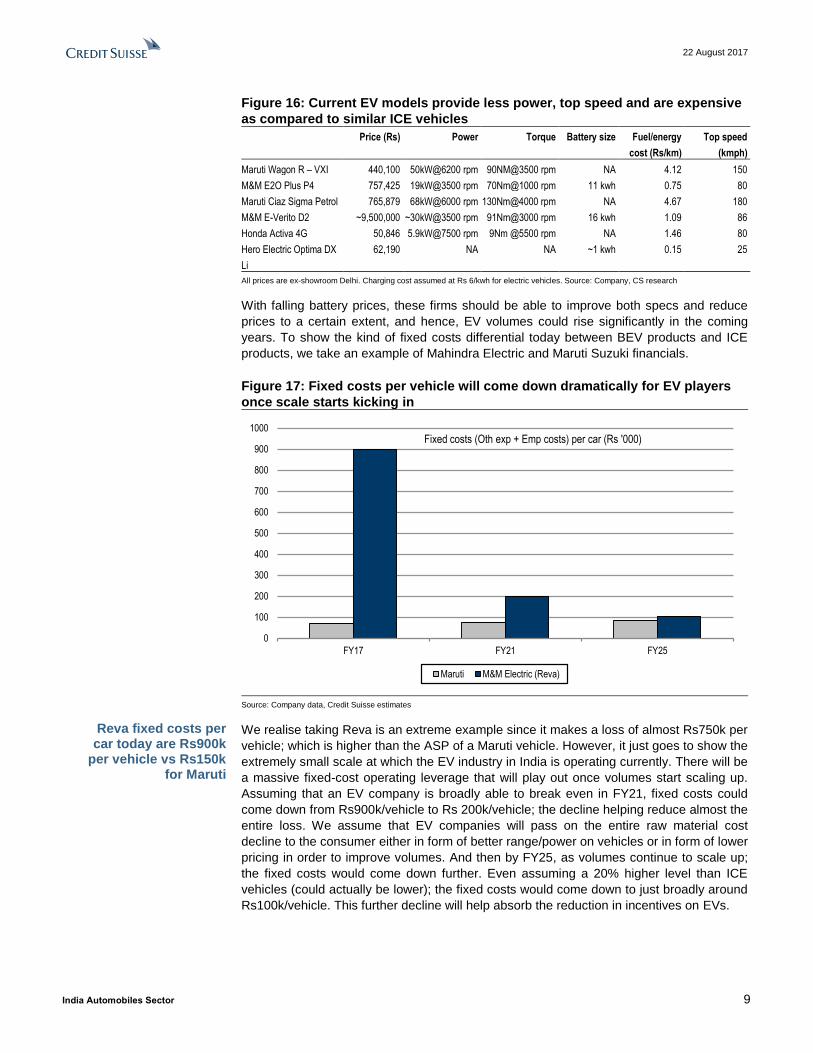
Figure 16: Current EV models provide less power, top speed and are expensive
as compared to similar ICE vehicles
Price (Rs) Power Torque Battery size Fuel/energy
cost (Rs/km)
Top speed
(kmph)
Maruti Wagon R – VXI 440,100 50kW@6200 rpm 90NM@3500 rpm NA 4.12 150
M&M E2O Plus P4 757,425 19kW@3500 rpm 70Nm@1000 rpm 11 kwh 0.75 80
Maruti Ciaz Sigma Petrol 765,879 68kW@6000 rpm 130Nm@4000 rpm NA 4.67 180
M&M E-Verito D2 ~9,500,000 ~30kW@3500 rpm 91Nm@3000 rpm 16 kwh 1.09 86
Honda Activa 4G 50,846 5.9kW@7500 rpm 9Nm @5500 rpm NA 1.46 80
Hero Electric Optima DX
Li
62,190 NA NA ~1 kwh 0.15 25
All prices are ex-showroom Delhi. Charging cost assumed at Rs 6/kwh for electric vehicles. Source: Company, CS research
With falling battery prices, these firms should be able to improve both specs and reduce
prices to a certain extent, and hence, EV volumes could rise significantly in the coming
years. To show the kind of fixed costs differential today between BEV products and ICE
products, we take an example of Mahindra Electric and Maruti Suzuki financials.
Figure 17: Fixed costs per vehicle will come down dramatically for EV players
once scale starts kicking in
Source: Company data, Credit Suisse estimates
We realise taking Reva is an extreme example since it makes a loss of almost Rs750k per
vehicle; which is higher than the ASP of a Maruti vehicle. However, it just goes to show the
extremely small scale at which the EV industry in India is operating currently. There will be
a massive fixed-cost operating leverage that will play out once volumes start scaling up.
Assuming that an EV company is broadly able to break even in FY21, fixed costs could
come down from Rs900k/vehicle to Rs 200k/vehicle; the decline helping reduce almost the
entire loss. We assume that EV companies will pass on the entire raw material cost
decline to the consumer either in form of better range/power on vehicles or in form of lower
pricing in order to improve volumes. And then by FY25, as volumes continue to scale up;
the fixed costs would come down further. Even assuming a 20% higher level than ICE
vehicles (could actually be lower); the fixed costs would come down to just broadly around
Rs100k/vehicle. This further decline will help absorb the reduction in incentives on EVs.
0
100
200
300
400
500
600
700
800
900
1000
FY17 FY21 FY25
Maruti M&M Electric (Reva)
Fixed costs (Oth exp + Emp costs) per car (Rs '000)
Reva fixed costs per car today are Rs900k
per vehicle vs Rs150k for Maruti

22 August 2017
India Automobiles Sector 10
Government trying to bring in some scale benefits with large orders
Government run firm Energy Efficiency Service Ltd (EESL) has recently floated a tender
for procuring 10,000 electric cars (total EV volumes in FY17 were a tenth of the same) and
4,000 chargers to replace government department vehicles with electric cars.
#3 Increase in costs on ICEs
BS-VI emission norms a key trigger for move towards EVs
We feel implementation of BS-VI emission norms will act as a trigger towards the shift to
EV. With BS-VI, the cost of diesel engine vehicles and 2W are likely to increase by 8-10%.
Combined with this, if battery prices also halve by 2025; the upfront price gap can come
down from almost a ~100% premium today to ~25% premium (without incentives) and
result in a payback of 2-3 year which will make EVs attractive enough for personal use as
well. We believe for fleet the price gap is already attractive if the infrastructure gaps are
addressed, and hence, all kinds of fleets—3W, buses, taxis are likely to move increasingly
towards EVs.
Figure 18: Vehicles will see a 6-10% rise in prices post BS-VI implementation
Source: Credit Suisse estimates
#4 Energy costs already favourable in India
Amongst the key automotive markets; the energy cost equation is favourable in India
From a consumer point of view, the key attraction of an electric vehicle is its lower
operating costs vs ICE vehicles. Hence, countries with high gasoline prices and low
electricity can possibly see an early adoption of electric vehicles, all other factors
remaining same. In India, this equation seems favourable as gasoline prices are high due
to high taxation on retail fuels. At the same time, residential electricity prices are much
lower as compared to that of developed markets, as residential electricity prices are cross-
subsidised by commercial and industrial consumers.
-
2.0
4.0
6.0
8.0
10.0
12.0
2W PV CV
Increase in vehicle price due to BS VI changes (%)
BS-VI will result in a 8-10% price increase
across segments
India has high fuel costs and very low
energy costs; ideal for EV transition
22 August 2017
India Automobiles Sector 11
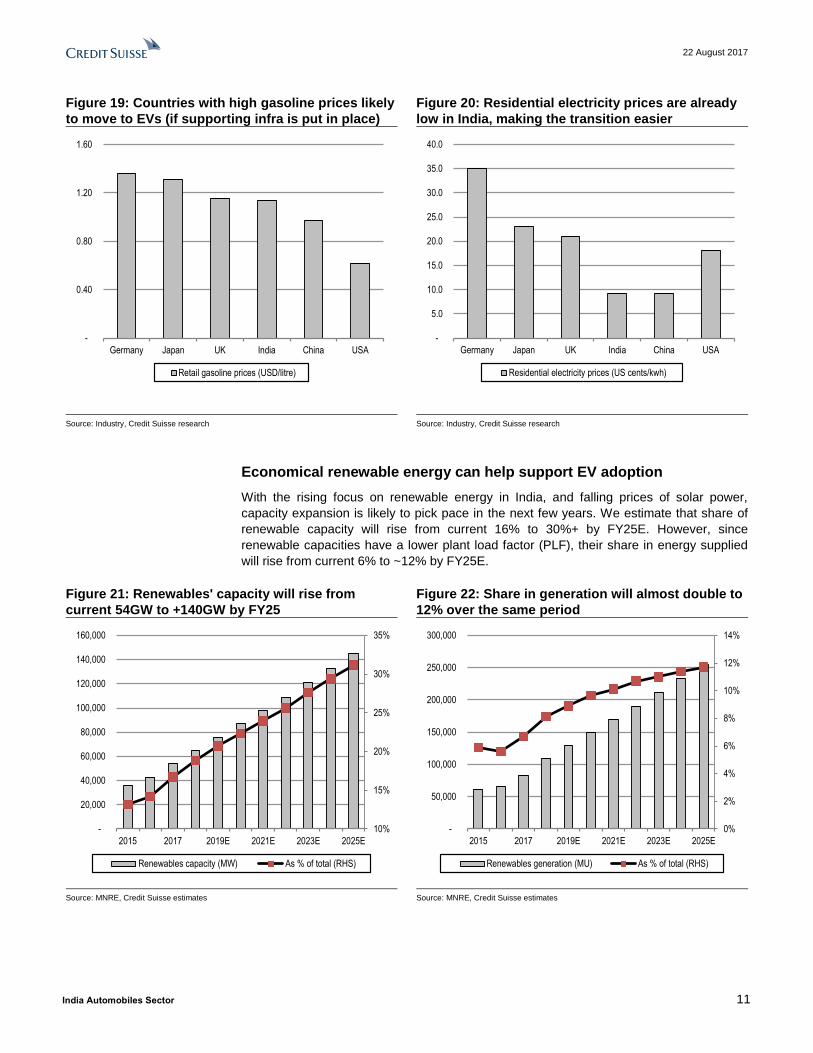
Figure 19: Countries with high gasoline prices likely
to move to EVs (if supporting infra is put in place)
Figure 20: Residential electricity prices are already
low in India, making the transition easier
Source: Industry, Credit Suisse research Source: Industry, Credit Suisse research
Economical renewable energy can help support EV adoption
With the rising focus on renewable energy in India, and falling prices of solar power,
capacity expansion is likely to pick pace in the next few years. We estimate that share of
renewable capacity will rise from current 16% to 30%+ by FY25E. However, since
renewable capacities have a lower plant load factor (PLF), their share in energy supplied
will rise from current 6% to ~12% by FY25E.
Figure 21: Renewables' capacity will rise from
current 54GW to +140GW by FY25
Figure 22: Share in generation will almost double to
12% over the same period
Source: MNRE, Credit Suisse estimates Source: MNRE, Credit Suisse estimates
-
0.40
0.80
1.20
1.60
Germany Japan UK India China USA
Retail gasoline prices (USD/litre)
-
5.0
10.0
15.0
20.0
25.0
30.0
35.0
40.0
Germany Japan UK India China USA
Residential electricity prices (US cents/kwh)
10%
15%
20%
25%
30%
35%
-
20,000
40,000
60,000
80,000
100,000
120,000
140,000
160,000
2015 2017 2019E 2021E 2023E 2025E
Renewables capacity (MW) As % of total (RHS)
0%
2%
4%
6%
8%
10%
12%
14%
-
50,000
100,000
150,000
200,000
250,000
300,000
2015 2017 2019E 2021E 2023E 2025E
Renewables generation (MU) As % of total (RHS)
22 August 2017
India Automobiles Sector 12
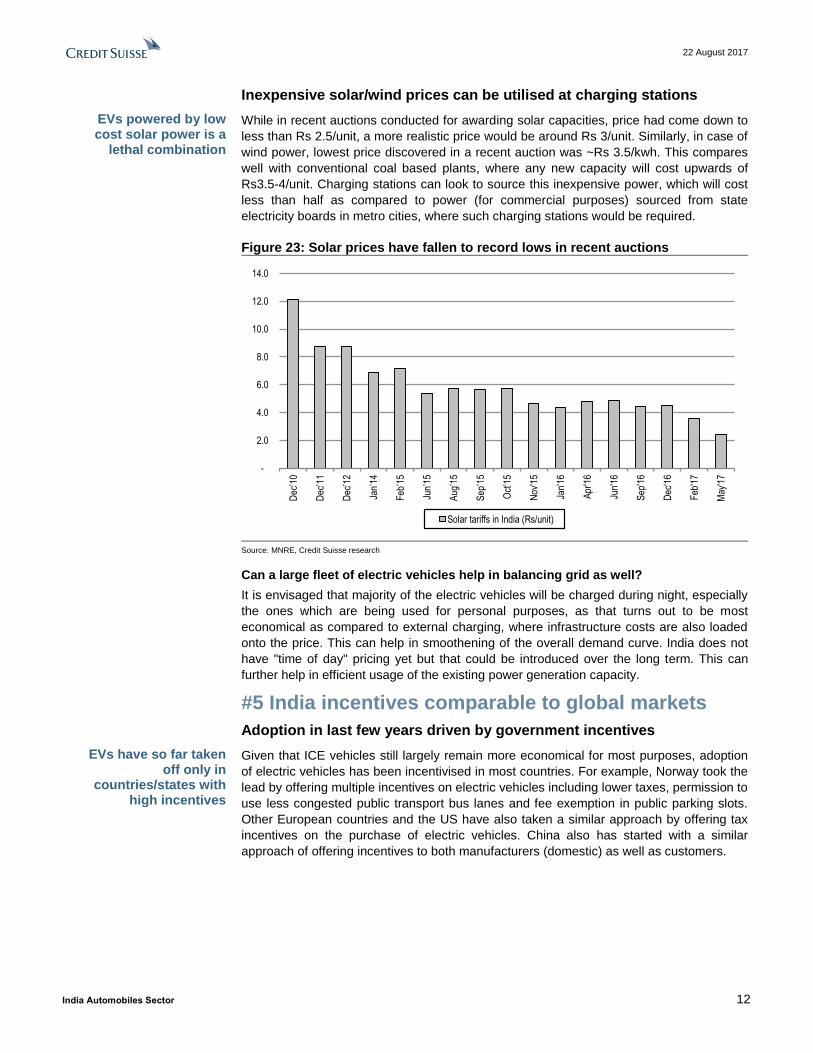
Inexpensive solar/wind prices can be utilised at charging stations
While in recent auctions conducted for awarding solar capacities, price had come down to
less than Rs 2.5/unit, a more realistic price would be around Rs 3/unit. Similarly, in case of
wind power, lowest price discovered in a recent auction was ~Rs 3.5/kwh. This compares
well with conventional coal based plants, where any new capacity will cost upwards of
Rs3.5-4/unit. Charging stations can look to source this inexpensive power, which will cost
less than half as compared to power (for commercial purposes) sourced from state
electricity boards in metro cities, where such charging stations would be required.
Figure 23: Solar prices have fallen to record lows in recent auctions
Source: MNRE, Credit Suisse research
Can a large fleet of electric vehicles help in balancing grid as well?
It is envisaged that majority of the electric vehicles will be charged during night, especially
the ones which are being used for personal purposes, as that turns out to be most
economical as compared to external charging, where infrastructure costs are also loaded
onto the price. This can help in smoothening of the overall demand curve. India does not
have "time of day" pricing yet but that could be introduced over the long term. This can
further help in efficient usage of the existing power generation capacity.
#5 India incentives comparable to global markets
Adoption in last few years driven by government incentives
Given that ICE vehicles still largely remain more economical for most purposes, adoption
of electric vehicles has been incentivised in most countries. For example, Norway took the
lead by offering multiple incentives on electric vehicles including lower taxes, permission to
use less congested public transport bus lanes and fee exemption in public parking slots.
Other European countries and the US have also taken a similar approach by offering tax
incentives on the purchase of electric vehicles. China also has started with a similar
approach of offering incentives to both manufacturers (domestic) as well as customers.
-
2.0
4.0
6.0
8.0
10.0
12.0
14.0
Dec
’10
Dec
’11
Dec
’12
Jan’
14
Feb
’15
Jun’
15
Aug
’15
Sep
’15
Oct
’15
Nov
'15
Jan'
16
Apr
'16
Jun'
16
Sep
'16
Dec
'16
Feb
'17
May
'17
Solar tariffs in India (Rs/unit)
EVs powered by low cost solar power is a
lethal combination
EVs have so far taken off only in
countries/states with high incentives
22 August 2017
India Automobiles Sector 13
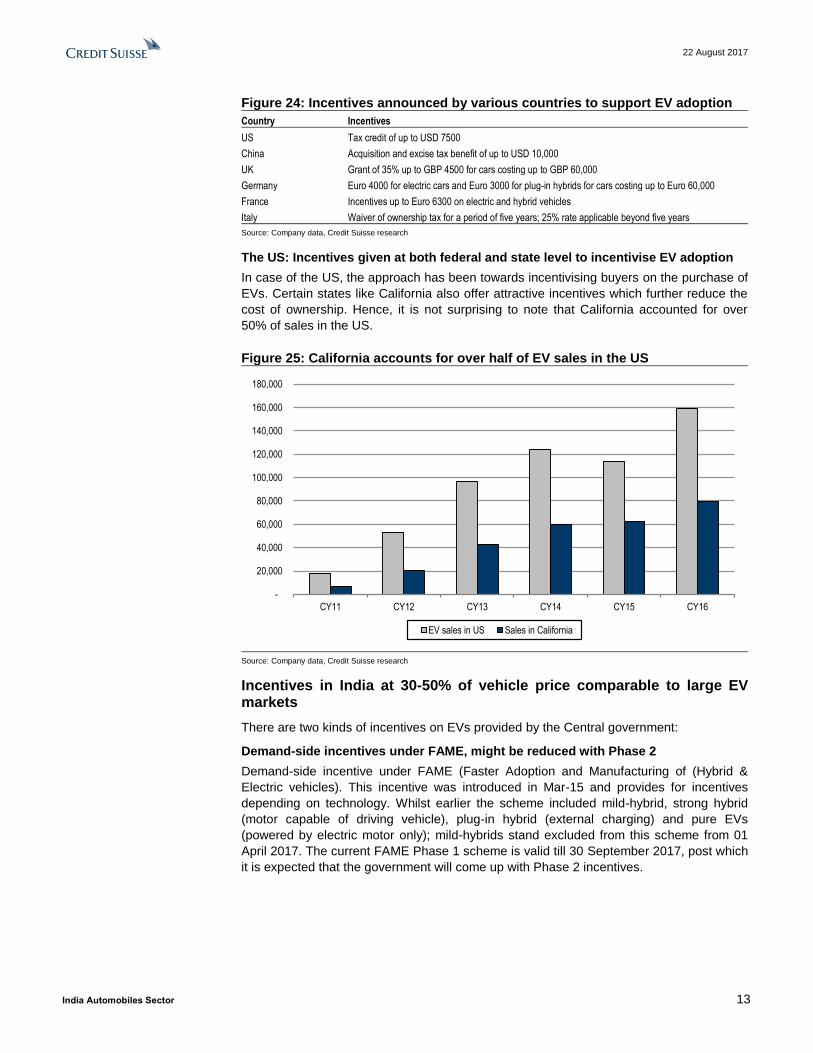
Figure 24: Incentives announced by various countries to support EV adoption
Country Incentives
US Tax credit of up to USD 7500
China Acquisition and excise tax benefit of up to USD 10,000
UK Grant of 35% up to GBP 4500 for cars costing up to GBP 60,000
Germany Euro 4000 for electric cars and Euro 3000 for plug-in hybrids for cars costing up to Euro 60,000
France Incentives up to Euro 6300 on electric and hybrid vehicles
Italy Waiver of ownership tax for a period of five years; 25% rate applicable beyond five years
Source: Company data, Credit Suisse research
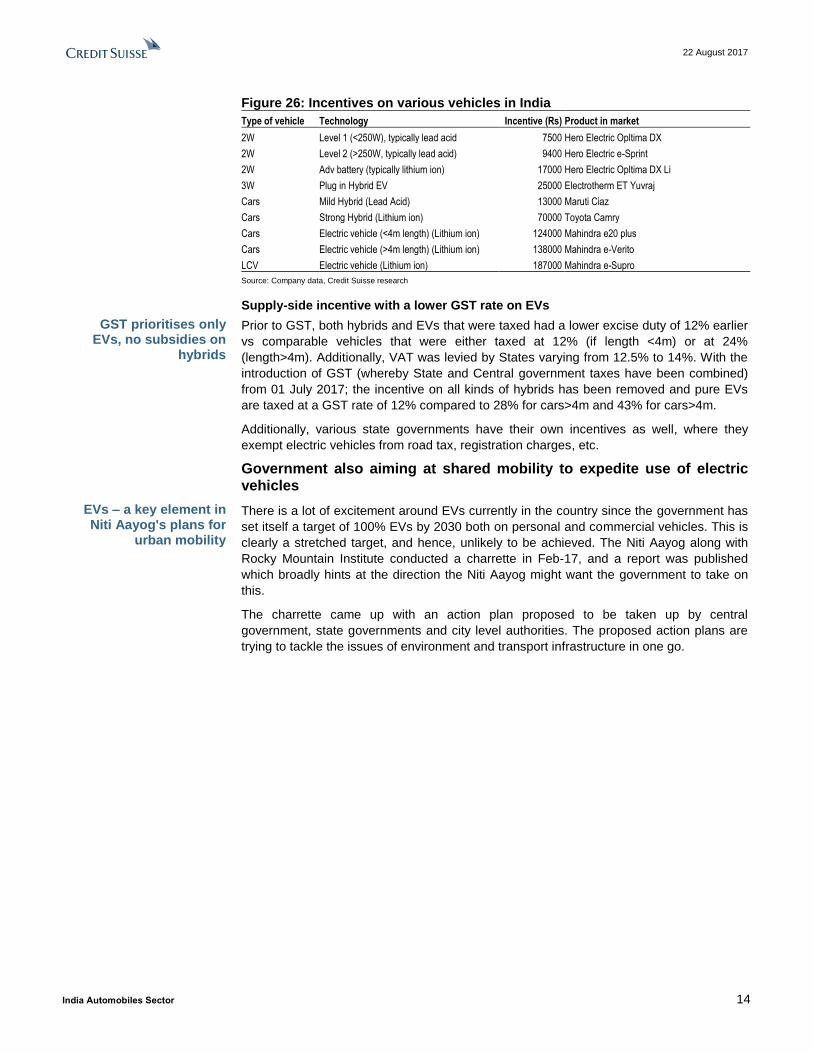
The US: Incentives given at both federal and state level to incentivise EV adoption
In case of the US, the approach has been towards incentivising buyers on the purchase of
EVs. Certain states like California also offer attractive incentives which further reduce the
cost of ownership. Hence, it is not surprising to note that California accounted for over
50% of sales in the US.
Figure 25: California accounts for over half of EV sales in the US
Source: Company data, Credit Suisse research
Incentives in India at 30-50% of vehicle price comparable to large EV markets
There are two kinds of incentives on EVs provided by the Central government:
Demand-side incentives under FAME, might be reduced with Phase 2
Demand-side incentive under FAME (Faster Adoption and Manufacturing of (Hybrid &
Electric vehicles). This incentive was introduced in Mar-15 and provides for incentives
depending on technology. Whilst earlier the scheme included mild-hybrid, strong hybrid
(motor capable of driving vehicle), plug-in hybrid (external charging) and pure EVs
(powered by electric motor only); mild-hybrids stand excluded from this scheme from 01
April 2017. The current FAME Phase 1 scheme is valid till 30 September 2017, post which
it is expected that the government will come up with Phase 2 incentives.
-
20,000
40,000
60,000
80,000
100,000
120,000
140,000
160,000
180,000
CY11 CY12 CY13 CY14 CY15 CY16
EV sales in US Sales in California
22 August 2017
India Automobiles Sector 14
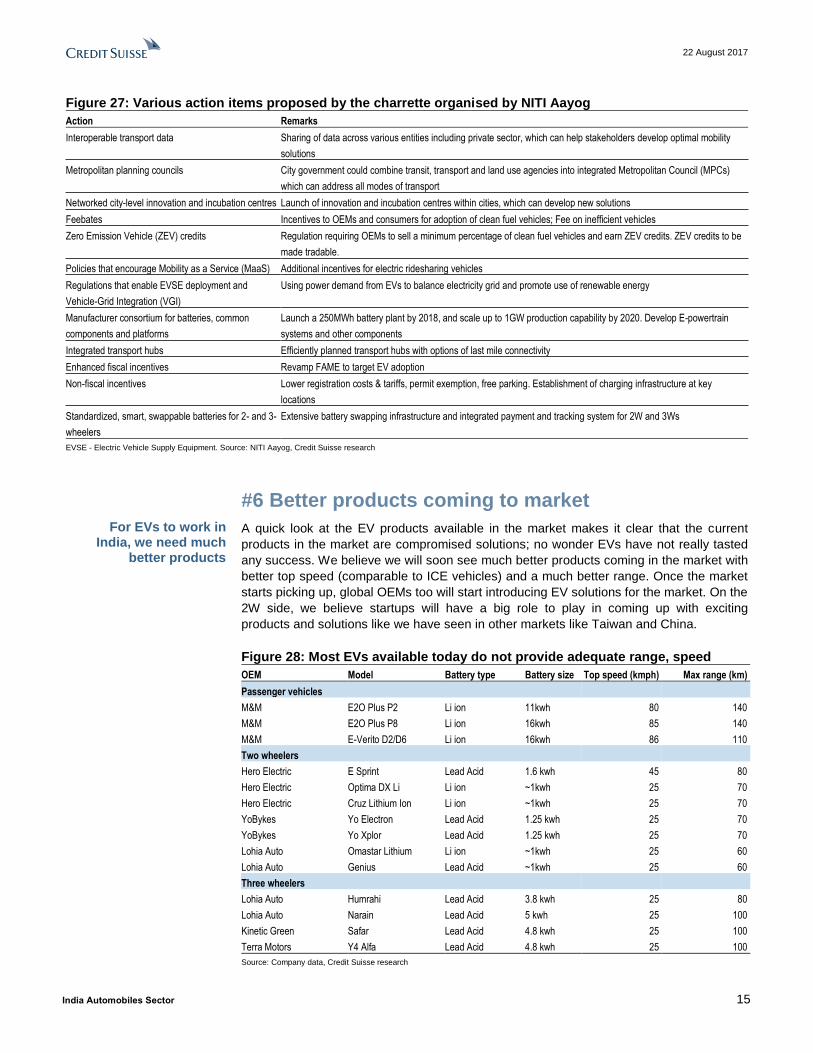
Figure 26: Incentives on various vehicles in India
Type of vehicle Technology Incentive (Rs) Product in market
2W Level 1 (<250W), typically lead acid 7500 Hero Electric Opltima DX
2W Level 2 (>250W, typically lead acid) 9400 Hero Electric e-Sprint
2W Adv battery (typically lithium ion) 17000 Hero Electric Opltima DX Li
3W Plug in Hybrid EV 25000 Electrotherm ET Yuvraj
Cars Mild Hybrid (Lead Acid) 13000 Maruti Ciaz
Cars Strong Hybrid (Lithium ion) 70000 Toyota Camry
Cars Electric vehicle (<4m length) (Lithium ion) 124000 Mahindra e20 plus
Cars Electric vehicle (>4m length) (Lithium ion) 138000 Mahindra e-Verito
LCV Electric vehicle (Lithium ion) 187000 Mahindra e-Supro
Source: Company data, Credit Suisse research
Supply-side incentive with a lower GST rate on EVs
Prior to GST, both hybrids and EVs that were taxed had a lower excise duty of 12% earlier
vs comparable vehicles that were either taxed at 12% (if length <4m) or at 24%
(length>4m). Additionally, VAT was levied by States varying from 12.5% to 14%. With the
introduction of GST (whereby State and Central government taxes have been combined)
from 01 July 2017; the incentive on all kinds of hybrids has been removed and pure EVs
are taxed at a GST rate of 12% compared to 28% for cars>4m and 43% for cars>4m.
Additionally, various state governments have their own incentives as well, where they
exempt electric vehicles from road tax, registration charges, etc.
Government also aiming at shared mobility to expedite use of electric vehicles
There is a lot of excitement around EVs currently in the country since the government has
set itself a target of 100% EVs by 2030 both on personal and commercial vehicles. This is
clearly a stretched target, and hence, unlikely to be achieved. The Niti Aayog along with
Rocky Mountain Institute conducted a charrette in Feb-17, and a report was published
which broadly hints at the direction the Niti Aayog might want the government to take on
this.
The charrette came up with an action plan proposed to be taken up by central
government, state governments and city level authorities. The proposed action plans are
trying to tackle the issues of environment and transport infrastructure in one go.
GST prioritises only EVs, no subsidies on
hybrids
EVs – a key element in Niti Aayog's plans for
urban mobility
22 August 2017
India Automobiles Sector 15
Figure 27: Various action items proposed by the charrette organised by NITI Aayog
Action Remarks
Interoperable transport data Sharing of data across various entities including private sector, which can help stakeholders develop optimal mobility
solutions
Metropolitan planning councils City government could combine transit, transport and land use agencies into integrated Metropolitan Council (MPCs)
which can address all modes of transport
Networked city-level innovation and incubation centres Launch of innovation and incubation centres within cities, which can develop new solutions
Feebates Incentives to OEMs and consumers for adoption of clean fuel vehicles; Fee on inefficient vehicles
Zero Emission Vehicle (ZEV) credits Regulation requiring OEMs to sell a minimum percentage of clean fuel vehicles and earn ZEV credits. ZEV credits to be
made tradable.
Policies that encourage Mobility as a Service (MaaS) Additional incentives for electric ridesharing vehicles
Regulations that enable EVSE deployment and
Vehicle-Grid Integration (VGI)
Using power demand from EVs to balance electricity grid and promote use of renewable energy
Manufacturer consortium for batteries, common
components and platforms
Launch a 250MWh battery plant by 2018, and scale up to 1GW production capability by 2020. Develop E-powertrain
systems and other components
Integrated transport hubs Efficiently planned transport hubs with options of last mile connectivity
Enhanced fiscal incentives Revamp FAME to target EV adoption
Non-fiscal incentives Lower registration costs & tariffs, permit exemption, free parking. Establishment of charging infrastructure at key
locations
Standardized, smart, swappable batteries for 2- and 3-
wheelers
Extensive battery swapping infrastructure and integrated payment and tracking system for 2W and 3Ws
EVSE - Electric Vehicle Supply Equipment. Source: NITI Aayog, Credit Suisse research
#6 Better products coming to market
A quick look at the EV products available in the market makes it clear that the current
products in the market are compromised solutions; no wonder EVs have not really tasted
any success. We believe we will soon see much better products coming in the market with
better top speed (comparable to ICE vehicles) and a much better range. Once the market
starts picking up, global OEMs too will start introducing EV solutions for the market. On the
2W side, we believe startups will have a big role to play in coming up with exciting
products and solutions like we have seen in other markets like Taiwan and China.
Figure 28: Most EVs available today do not provide adequate range, speed
OEM Model Battery type Battery size Top speed (kmph) Max range (km)
Passenger vehicles
M&M E2O Plus P2 Li ion 11kwh 80 140
M&M E2O Plus P8 Li ion 16kwh 85 140
M&M E-Verito D2/D6 Li ion 16kwh 86 110
Two wheelers
Hero Electric E Sprint Lead Acid 1.6 kwh 45 80
Hero Electric Optima DX Li Li ion ~1kwh 25 70
Hero Electric Cruz Lithium Ion Li ion ~1kwh 25 70
YoBykes Yo Electron Lead Acid 1.25 kwh 25 70
YoBykes Yo Xplor Lead Acid 1.25 kwh 25 70
Lohia Auto Omastar Lithium Li ion ~1kwh 25 60
Lohia Auto Genius Lead Acid ~1kwh 25 60
Three wheelers
Lohia Auto Humrahi Lead Acid 3.8 kwh 25 80
Lohia Auto Narain Lead Acid 5 kwh 25 100
Kinetic Green Safar Lead Acid 4.8 kwh 25 100
Terra Motors Y4 Alfa Lead Acid 4.8 kwh 25 100
Source: Company data, Credit Suisse research
For EVs to work in India, we need much
better products

22 August 2017
India Automobiles Sector 16
Lack of charging infrastructure though is a challenge
India has around 100,000 km of national highways and another 150,000 km of state
highways. From a fuel pump perspective there are a total of 60,000 fuel pumps in the
country with around 50% of those on highways, 27% in urban and 22% in rural. So broadly
for 250,000 km of highways there are around 30,000 fuel pumps; broadly confirming to the
global averages of a fuel station every 10 km. If we use this same benchmark for EVs and
assume that fast charging stations will be needed at least on highways and urban cities, it
would mean that India should need around ~50,000 charging stations. With the ones in
highways being DC fast charging stations and 10% of those in cities also being fast
charging stations and the remaining 90% being AC stations. With an investment of around
US$30k for each DC station and US$10k for each Level 2 AC charging station, the total
investment in charging infrastructure will be around US$1.5 bn for EVs (excluding land) to
take off in a big way.
Charging infrastructure standardisation can help
We envisage that passenger vehicles will have slow charging infrastructure at home/office
locations. In terms of public charging infrastructure, those will necessarily have to be fast
charging ones. Such stations would be required in the cities for emergency/back-up
purposes, and on the highways for regular usage. Different countries/groups of countries
have come up with their standards for fast charging infrastructure and are advocating use
of the same. Ideally, like fuel for ICE vehicles, charging standards should also be common
across various vehicles, as it reduces the infrastructure cost for the system.
Figure 29: DC charging standards adopted by various OEMs
Origin country Standard OEMs Communication protocol
Japan CHAdeMO Nissan, Mitsubishi, Kia CAN
European SAE Combo Charging System BMW, GM, VW, Ford, Daimler, others PLC
US Tesla supercharger Tesla NA
China GB/T Chinese OEMs, Tesla CAN BUS
Source: Company data, Credit Suisse research
We expect batteries to be sourced from China
China has caught up with Japan and the US, and is now leading the way in electric
vehicles both in terms of setting up large Li-ion capacities as well as faster adoption of
electric vehicles. On one hand, this will help the country address the issue of pollution
which has impacted the quality of life in many large cities. At the same time, this will also
establish China's dominance in both batteries as well as vehicles.
Figure 30: World sales of electric PVs have crossed 700 thousand.. could reach
1 mn mark in CY18
Source: Company data, Credit Suisse research
0
100
200
300
400
500
600
700
800
2011 2012 2013 2014 2015 2016
EV sales in US ('000) Western Europe China Japan
22 August 2017
India Automobiles Sector 17
Urban public transport will be the first to move to EV Given the long distances covered per day, the cost economics for public transport vehicles
will be favourable much earlier than personal transport vehicles. The three key issues with
EVs currently are infrastructure for charging, limited range and high upfront costs. All
these issues can be addressed by moving to battery swapping where the biggest
constraint will be the standardisation of technology; which though difficult is not impossible
for standard products like buses & 3W. The other advantages with swapping is that the
process of charging can be moved to a central location with tie-ups with renewable energy
suppliers at a lower price. Also, given that batteries can be charged in ideal conditions
might help in increasing the life of a battery.
For both buses & 3W, almost 70% of sales in cities by 2025 is likely to be EVs. This
impending change on 3W is not lost on the OEMs, and all of them are ready with their
electric vehicles. We feel the biggest negative impact of this change will be on Bajaj Auto
as it is a dominant player with a 80%+ share on small passenger 3W used in urban cities.
For buses, the cost of handling swapping of batteries is higher and in cost terms almost
equivalent to installing fast chargers to be used overnight for charging. Fast charging
might just be a more practical solution there but that entails a high upfront costs on both
the bus and the charging infrastructure.
Public transportation to first move to EVs given cost economics
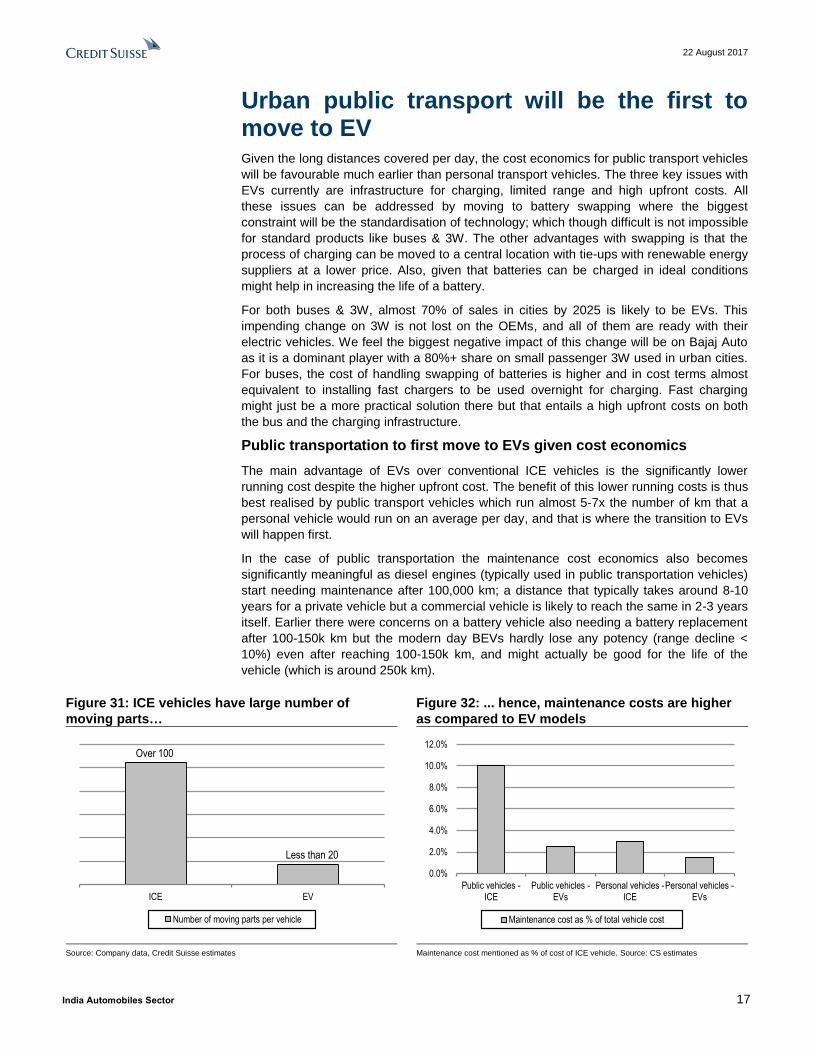
The main advantage of EVs over conventional ICE vehicles is the significantly lower
running cost despite the higher upfront cost. The benefit of this lower running costs is thus
best realised by public transport vehicles which run almost 5-7x the number of km that a
personal vehicle would run on an average per day, and that is where the transition to EVs
will happen first.
In the case of public transportation the maintenance cost economics also becomes
significantly meaningful as diesel engines (typically used in public transportation vehicles)
start needing maintenance after 100,000 km; a distance that typically takes around 8-10
years for a private vehicle but a commercial vehicle is likely to reach the same in 2-3 years
itself. Earlier there were concerns on a battery vehicle also needing a battery replacement
after 100-150k km but the modern day BEVs hardly lose any potency (range decline <
10%) even after reaching 100-150k km, and might actually be good for the life of the
vehicle (which is around 250k km).
Figure 31: ICE vehicles have large number of
moving parts…
Figure 32: ... hence, maintenance costs are higher
as compared to EV models
Source: Company data, Credit Suisse estimates Maintenance cost mentioned as % of cost of ICE vehicle. Source: CS estimates
ICE EV
Number of moving parts per vehicle
Less than 20
Over 100
0.0%
2.0%
4.0%
6.0%
8.0%
10.0%
12.0%
Public vehicles -ICE
Public vehicles -EVs
Personal vehicles -ICE
Personal vehicles -EVs
Maintenance cost as % of total vehicle cost
22 August 2017
India Automobiles Sector 18
The key challenges for adoption of EVs by public transportation are high upfront costs. At
current battery prices, BEV products are 60-80% more expensive than their ICE
counterparts. Whilst the low running costs still justify going the EV way, funding of the
higher upfront costs is a challenge. Given that there is practically no ecosystem for battery
charging in the country today, public transportation sector will have to set it up and each
segment of public transportation is likely to go with the solution most favourable for it.
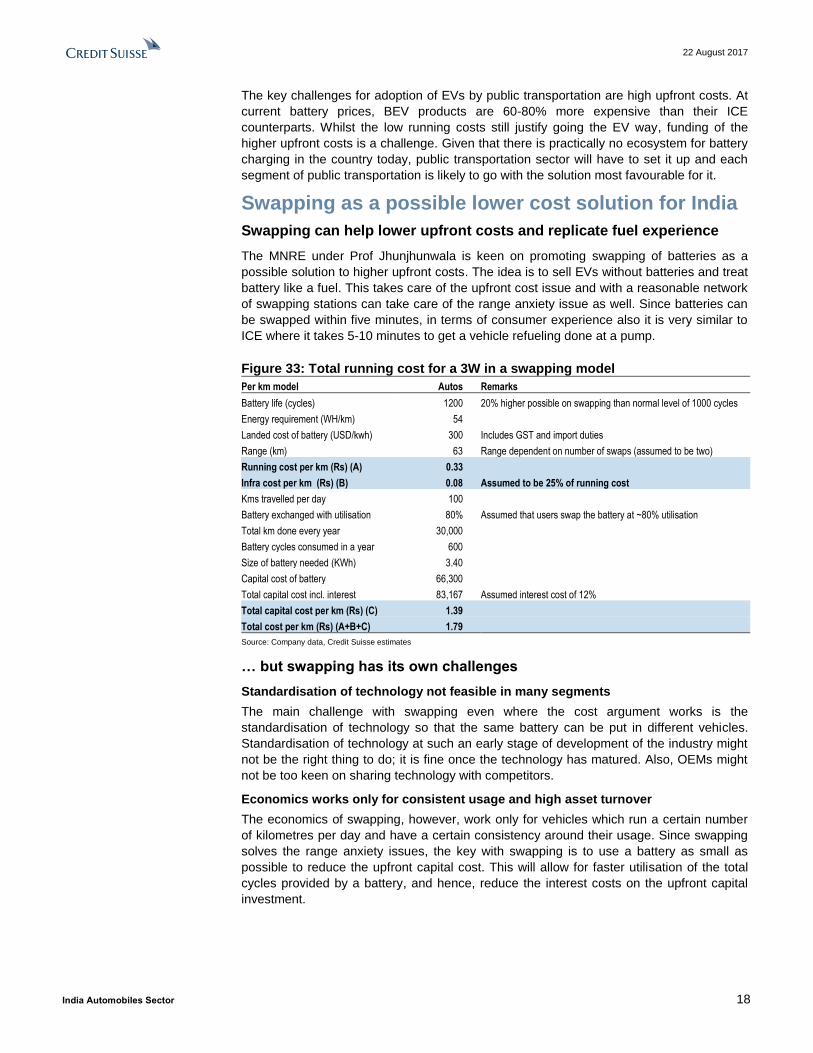
Swapping as a possible lower cost solution for India
Swapping can help lower upfront costs and replicate fuel experience
The MNRE under Prof Jhunjhunwala is keen on promoting swapping of batteries as a
possible solution to higher upfront costs. The idea is to sell EVs without batteries and treat
battery like a fuel. This takes care of the upfront cost issue and with a reasonable network
of swapping stations can take care of the range anxiety issue as well. Since batteries can
be swapped within five minutes, in terms of consumer experience also it is very similar to
ICE where it takes 5-10 minutes to get a vehicle refueling done at a pump.
Figure 33: Total running cost for a 3W in a swapping model
Per km model Autos Remarks
Battery life (cycles) 1200 20% higher possible on swapping than normal level of 1000 cycles
Energy requirement (WH/km) 54
Landed cost of battery (USD/kwh) 300 Includes GST and import duties
Range (km) 63 Range dependent on number of swaps (assumed to be two)
Running cost per km (Rs) (A) 0.33
Infra cost per km (Rs) (B) 0.08 Assumed to be 25% of running cost
Kms travelled per day 100
Battery exchanged with utilisation 80% Assumed that users swap the battery at ~80% utilisation
Total km done every year 30,000
Battery cycles consumed in a year 600
Size of battery needed (KWh) 3.40
Capital cost of battery 66,300
Total capital cost incl. interest 83,167 Assumed interest cost of 12%
Total capital cost per km (Rs) (C) 1.39
Total cost per km (Rs) (A+B+C) 1.79
Source: Company data, Credit Suisse estimates
… but swapping has its own challenges
Standardisation of technology not feasible in many segments
The main challenge with swapping even where the cost argument works is the
standardisation of technology so that the same battery can be put in different vehicles.
Standardisation of technology at such an early stage of development of the industry might
not be the right thing to do; it is fine once the technology has matured. Also, OEMs might
not be too keen on sharing technology with competitors.
Economics works only for consistent usage and high asset turnover
The economics of swapping, however, work only for vehicles which run a certain number
of kilometres per day and have a certain consistency around their usage. Since swapping
solves the range anxiety issues, the key with swapping is to use a battery as small as
possible to reduce the upfront capital cost. This will allow for faster utilisation of the total
cycles provided by a battery, and hence, reduce the interest costs on the upfront capital
investment.

22 August 2017
India Automobiles Sector 19
On personal vehicles like 2W and cars, however, the ideal scenario for consumers would
be to swap once a day or once in two days. Since there will be an inconsistency in the
usage patterns for personal vehicles, the range expectations will be 2x the normal daily
usage, thereby, leading to a bigger battery which is swapped only in 2-3 days, leading to
lower asset utilisation. Also unlike a charging station, a swapping station will need
deployment of human resources to conduct the process of swapping as well as to
safeguard the batteries.
These extra costs mean that for 2W and 4W whilst the upfront cost can be brought in line
with ICE with the help of swapping; the total cost per km including electricity, capital cost
of battery including interest, the infrastructure cost of swapping is far higher than the cost
per km on ICE, and hence, users are unlikely to opt for such a solution.
However, in the case of auto-rickshaws (3W) and buses which largely remain within city
limits and also run a consistently high number of kms on a daily basis; swapping model is
definitely workable. The total cost per km on EV 3W and buses with swapping is already
within a 10% band of what the cost is with ICE. The pace at which battery costs are falling;
the costs will be soon comparable and in a few years the costs on EVs will be far lower
than comparable ICE vehicles. Thus in our view, these are the first segments where the
government needs to focus on.
Swapping can also help increase battery life
Without swapping, even for 3W and buses, one will have to move to fast charging. Fast
charging has an impact on the life of the battery. With swapping, the battery can be taken
to a central location and charged under ideal conditions. This can lead to an increase in
the battery life and make the swapping economics even better. Our checks with industry
suppliers suggest that battery life can be increased by more than 50% from the normal
1,000 cycles to 1,500 cycles when batteries are charged under ideal conditions.
Swapping can help take advantage of lower electricity prices and promote
renewables
With on-board charging of batteries, the batteries have to be charged when the customer
brings them to a charging station. However, with swapping, batteries can be charged at an
appropriate time when demand for electricity is lower, and hence, prices are lower than
normal.
However, the real big advantage of a battery swapping network is that the battery network
can be used as a storage of energy. The big problem with renewable energy like solar and
wind is that they do not produce energy consistently but sporadically and at times when it
might not really be needed. Also, the electric grid is designed to deliver electricity rather
than store it, and hence, it is difficult to align supply with demand. However, with a battery
network it can be charged when there is surplus energy. This could imply that this surplus
power can be available at much cheaper rates rather than at peak energy power rates. It
can also give power back to the grid when power demand is high, and thereby, make
money on the difference in power costs between demand and surplus scenarios. In our
calculations above, we have not used this economics that can further reduce gap between
ICE and electric vehicles with swapping.
Cost of fast charging infrastructure is quite high
AC to DC conversion needed to charge vehicles
There are two options of charging an electric vehicle, one is at home and other one is at
an external charging station. The batteries in an electric vehicle require direct current (DC)
for charging. On the other hand, power supplied from electricity grid is AC. In order to use
AC supply to charge the battery, the vehicle needs to have an on-board charger which
increases the cost of the vehicle depending on the size of charger. In the Indian context,
vehicles are unlikely to have "on-board" chargers beyond 2.5-3kW in order to keep cost of
For personal vehicles, the low asset turnover
means that the economics of swapping
does not work out
With swapping, batteries can be charged in ideal
conditions rather than on-board
A battery bank can make some money by
buying cheap electricity and selling it
when expensive
22 August 2017
India Automobiles Sector 20
the vehicle low. These chargers will be used at home/office locations where vehicles can
get charged for few hours.
Fast chargers will be needed outside home/office environment; government trying
to standardise chargers to maximise utilisation
In addition to home chargers, consumers will require external charging stations. These
charging stations can either have an AC output (which will be supplied to on-board
charger) or have DC output using an off-board DC charger installed at the charging
station.
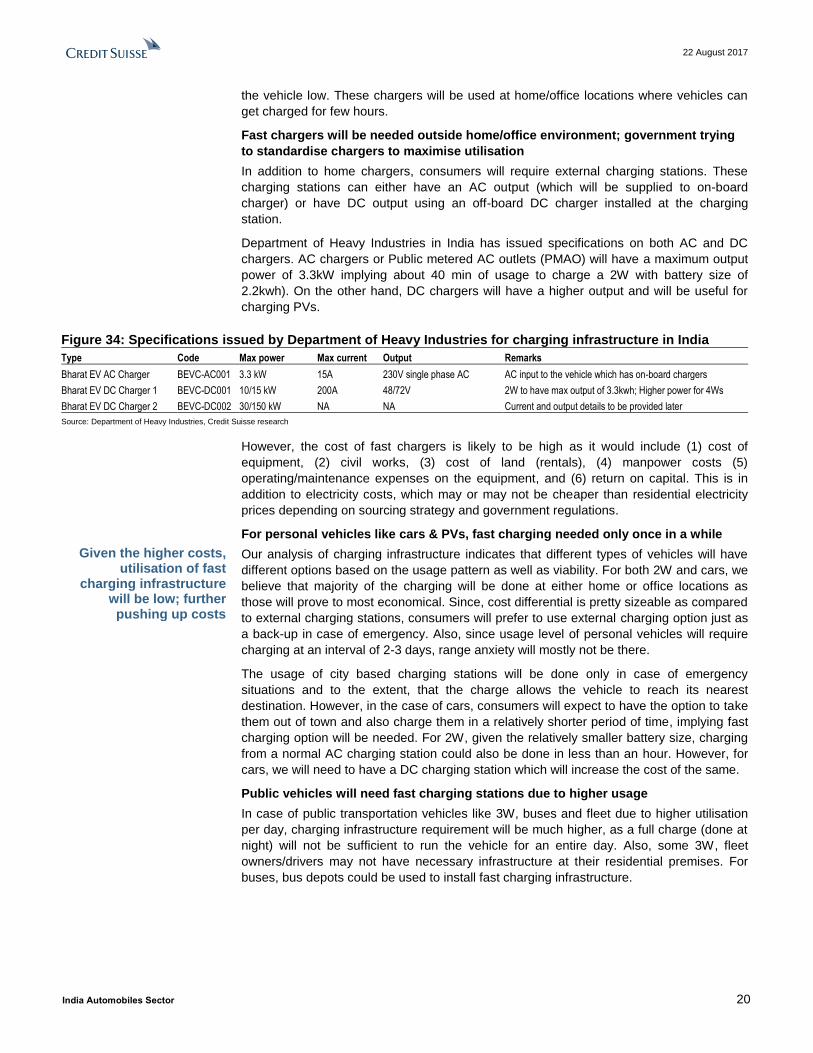
Department of Heavy Industries in India has issued specifications on both AC and DC
chargers. AC chargers or Public metered AC outlets (PMAO) will have a maximum output
power of 3.3kW implying about 40 min of usage to charge a 2W with battery size of
2.2kwh). On the other hand, DC chargers will have a higher output and will be useful for
charging PVs.
Figure 34: Specifications issued by Department of Heavy Industries for charging infrastructure in India
Type Code Max power Max current Output Remarks
Bharat EV AC Charger BEVC-AC001 3.3 kW 15A 230V single phase AC AC input to the vehicle which has on-board chargers
Bharat EV DC Charger 1 BEVC-DC001 10/15 kW 200A 48/72V 2W to have max output of 3.3kwh; Higher power for 4Ws
Bharat EV DC Charger 2 BEVC-DC002 30/150 kW NA NA Current and output details to be provided later
Source: Department of Heavy Industries, Credit Suisse research
However, the cost of fast chargers is likely to be high as it would include (1) cost of
equipment, (2) civil works, (3) cost of land (rentals), (4) manpower costs (5)
operating/maintenance expenses on the equipment, and (6) return on capital. This is in
addition to electricity costs, which may or may not be cheaper than residential electricity
prices depending on sourcing strategy and government regulations.
For personal vehicles like cars & PVs, fast charging needed only once in a while
Our analysis of charging infrastructure indicates that different types of vehicles will have
different options based on the usage pattern as well as viability. For both 2W and cars, we
believe that majority of the charging will be done at either home or office locations as
those will prove to most economical. Since, cost differential is pretty sizeable as compared
to external charging stations, consumers will prefer to use external charging option just as
a back-up in case of emergency. Also, since usage level of personal vehicles will require
charging at an interval of 2-3 days, range anxiety will mostly not be there.
The usage of city based charging stations will be done only in case of emergency
situations and to the extent, that the charge allows the vehicle to reach its nearest
destination. However, in the case of cars, consumers will expect to have the option to take
them out of town and also charge them in a relatively shorter period of time, implying fast
charging option will be needed. For 2W, given the relatively smaller battery size, charging
from a normal AC charging station could also be done in less than an hour. However, for
cars, we will need to have a DC charging station which will increase the cost of the same.
Public vehicles will need fast charging stations due to higher usage
In case of public transportation vehicles like 3W, buses and fleet due to higher utilisation
per day, charging infrastructure requirement will be much higher, as a full charge (done at
night) will not be sufficient to run the vehicle for an entire day. Also, some 3W, fleet
owners/drivers may not have necessary infrastructure at their residential premises. For
buses, bus depots could be used to install fast charging infrastructure.
Given the higher costs, utilisation of fast
charging infrastructure will be low; further pushing up costs
22 August 2017
India Automobiles Sector 21
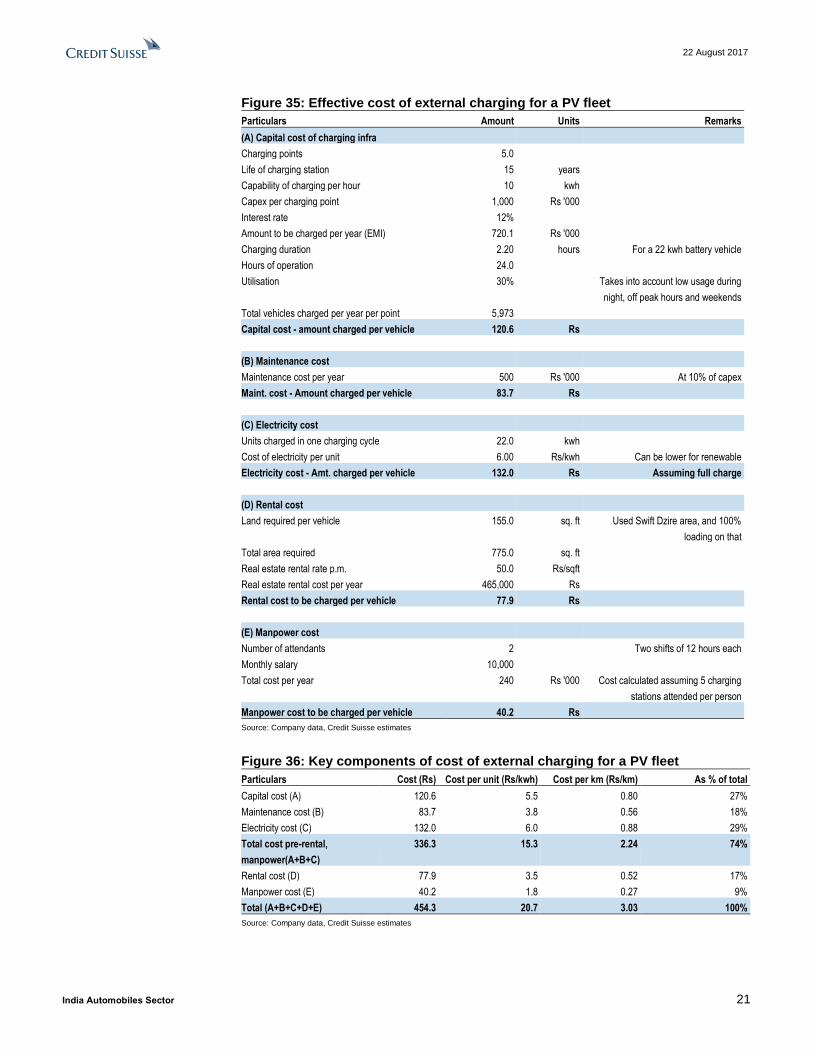
Figure 35: Effective cost of external charging for a PV fleet
Particulars Amount Units Remarks
(A) Capital cost of charging infra
Charging points 5.0
Life of charging station 15 years
Capability of charging per hour 10 kwh
Capex per charging point 1,000 Rs '000
Interest rate 12%
Amount to be charged per year (EMI) 720.1 Rs '000
Charging duration 2.20 hours For a 22 kwh battery vehicle
Hours of operation 24.0
Utilisation 30% Takes into account low usage during
night, off peak hours and weekends
Total vehicles charged per year per point 5,973
Capital cost - amount charged per vehicle 120.6 Rs
(B) Maintenance cost
Maintenance cost per year 500 Rs '000 At 10% of capex
Maint. cost - Amount charged per vehicle 83.7 Rs
(C) Electricity cost
Units charged in one charging cycle 22.0 kwh
Cost of electricity per unit 6.00 Rs/kwh Can be lower for renewable
Electricity cost - Amt. charged per vehicle 132.0 Rs Assuming full charge
(D) Rental cost
Land required per vehicle 155.0 sq. ft Used Swift Dzire area, and 100%
loading on that
Total area required 775.0 sq. ft
Real estate rental rate p.m. 50.0 Rs/sqft
Real estate rental cost per year 465,000 Rs
Rental cost to be charged per vehicle 77.9 Rs
(E) Manpower cost
Number of attendants 2 Two shifts of 12 hours each
Monthly salary 10,000
Total cost per year 240 Rs '000 Cost calculated assuming 5 charging
stations attended per person
Manpower cost to be charged per vehicle 40.2 Rs
Source: Company data, Credit Suisse estimates
Figure 36: Key components of cost of external charging for a PV fleet
Particulars Cost (Rs) Cost per unit (Rs/kwh) Cost per km (Rs/km) As % of total
Capital cost (A) 120.6 5.5 0.80 27%
Maintenance cost (B) 83.7 3.8 0.56 18%
Electricity cost (C) 132.0 6.0 0.88 29%
Total cost pre-rental,
manpower(A+B+C)
336.3 15.3 2.24 74%
Rental cost (D) 77.9 3.5 0.52 17%
Manpower cost (E) 40.2 1.8 0.27 9%
Total (A+B+C+D+E) 454.3 20.7 3.03 100%
Source: Company data, Credit Suisse estimates
22 August 2017
India Automobiles Sector 22
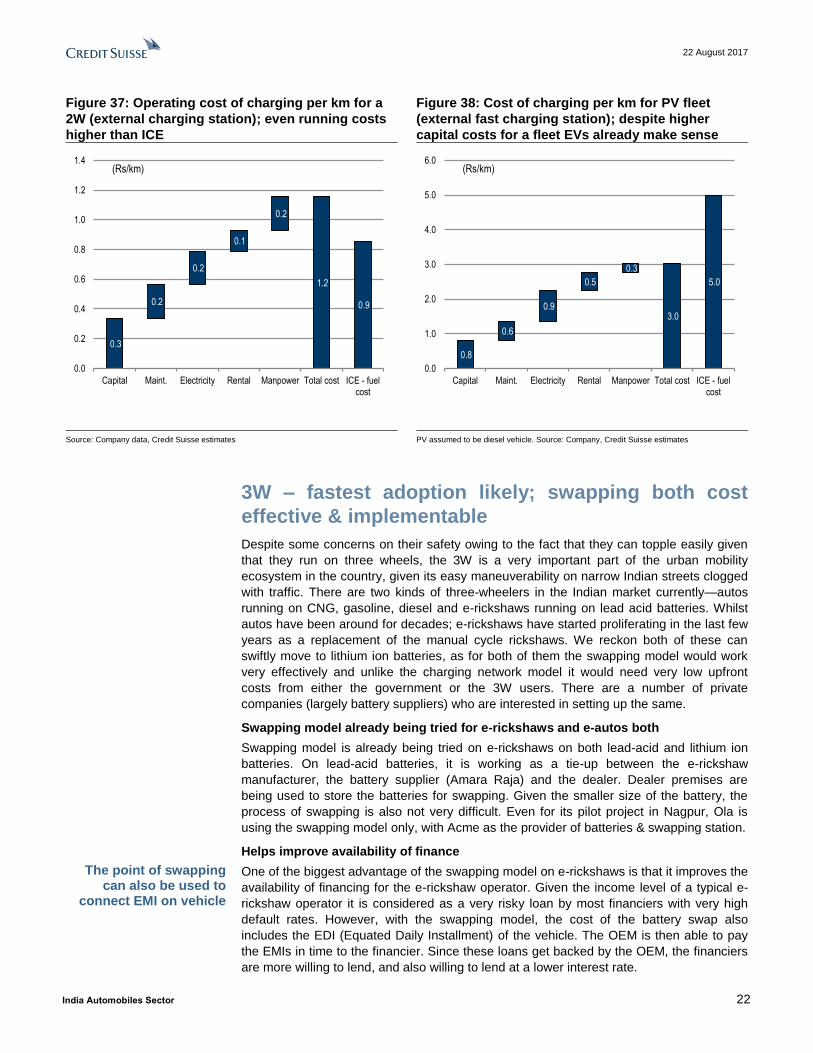
Figure 37: Operating cost of charging per km for a
2W (external charging station); even running costs
higher than ICE
Figure 38: Cost of charging per km for PV fleet
(external fast charging station); despite higher
capital costs for a fleet EVs already make sense
Source: Company data, Credit Suisse estimates PV assumed to be diesel vehicle. Source: Company, Credit Suisse estimates
3W – fastest adoption likely; swapping both cost
effective & implementable
Despite some concerns on their safety owing to the fact that they can topple easily given
that they run on three wheels, the 3W is a very important part of the urban mobility
ecosystem in the country, given its easy maneuverability on narrow Indian streets clogged
with traffic. There are two kinds of three-wheelers in the Indian market currently—autos
running on CNG, gasoline, diesel and e-rickshaws running on lead acid batteries. Whilst
autos have been around for decades; e-rickshaws have started proliferating in the last few
years as a replacement of the manual cycle rickshaws. We reckon both of these can
swiftly move to lithium ion batteries, as for both of them the swapping model would work
very effectively and unlike the charging network model it would need very low upfront
costs from either the government or the 3W users. There are a number of private
companies (largely battery suppliers) who are interested in setting up the same.
Swapping model already being tried for e-rickshaws and e-autos both
Swapping model is already being tried on e-rickshaws on both lead-acid and lithium ion
batteries. On lead-acid batteries, it is working as a tie-up between the e-rickshaw
manufacturer, the battery supplier (Amara Raja) and the dealer. Dealer premises are
being used to store the batteries for swapping. Given the smaller size of the battery, the
process of swapping is also not very difficult. Even for its pilot project in Nagpur, Ola is
using the swapping model only, with Acme as the provider of batteries & swapping station.
Helps improve availability of finance
One of the biggest advantage of the swapping model on e-rickshaws is that it improves the
availability of financing for the e-rickshaw operator. Given the income level of a typical e-
rickshaw operator it is considered as a very risky loan by most financiers with very high
default rates. However, with the swapping model, the cost of the battery swap also
includes the EDI (Equated Daily Installment) of the vehicle. The OEM is then able to pay
the EMIs in time to the financier. Since these loans get backed by the OEM, the financiers
are more willing to lend, and also willing to lend at a lower interest rate.
0.3
0.2
0.2
0.1
0.2
1.2
0.9
0.0
0.2
0.4
0.6
0.8
1.0
1.2
1.4
Capital Maint. Electricity Rental Manpower Total cost ICE - fuelcost
(Rs/km)
0.8
0.6
0.9
0.5
0.3
3.0
5.0
0.0
1.0
2.0
3.0
4.0
5.0
6.0
Capital Maint. Electricity Rental Manpower Total cost ICE - fuelcost
(Rs/km)
The point of swapping can also be used to
connect EMI on vehicle
22 August 2017
India Automobiles Sector 23
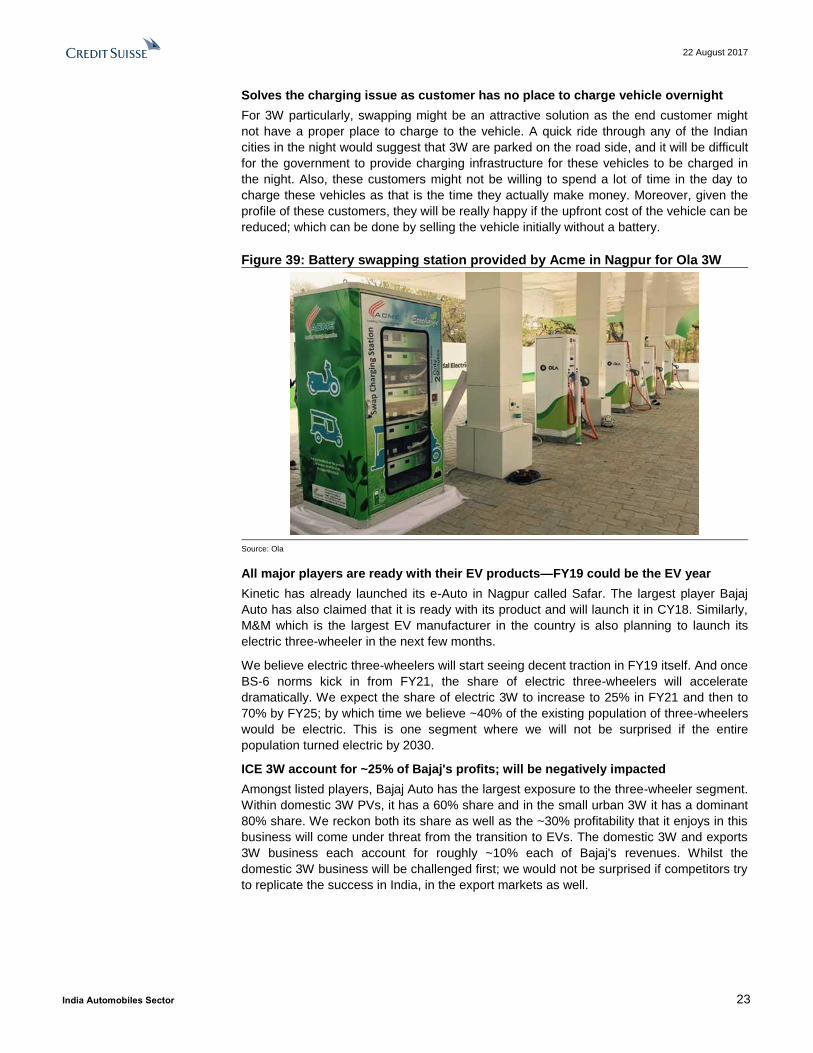
Solves the charging issue as customer has no place to charge vehicle overnight
For 3W particularly, swapping might be an attractive solution as the end customer might
not have a proper place to charge to the vehicle. A quick ride through any of the Indian
cities in the night would suggest that 3W are parked on the road side, and it will be difficult
for the government to provide charging infrastructure for these vehicles to be charged in
the night. Also, these customers might not be willing to spend a lot of time in the day to
charge these vehicles as that is the time they actually make money. Moreover, given the
profile of these customers, they will be really happy if the upfront cost of the vehicle can be
reduced; which can be done by selling the vehicle initially without a battery.
Figure 39: Battery swapping station provided by Acme in Nagpur for Ola 3W
Source: Ola
All major players are ready with their EV products—FY19 could be the EV year
Kinetic has already launched its e-Auto in Nagpur called Safar. The largest player Bajaj
Auto has also claimed that it is ready with its product and will launch it in CY18. Similarly,
M&M which is the largest EV manufacturer in the country is also planning to launch its
electric three-wheeler in the next few months.
We believe electric three-wheelers will start seeing decent traction in FY19 itself. And once
BS-6 norms kick in from FY21, the share of electric three-wheelers will accelerate
dramatically. We expect the share of electric 3W to increase to 25% in FY21 and then to
70% by FY25; by which time we believe ~40% of the existing population of three-wheelers
would be electric. This is one segment where we will not be surprised if the entire
population turned electric by 2030.
ICE 3W account for ~25% of Bajaj's profits; will be negatively impacted
Amongst listed players, Bajaj Auto has the largest exposure to the three-wheeler segment.
Within domestic 3W PVs, it has a 60% share and in the small urban 3W it has a dominant
80% share. We reckon both its share as well as the ~30% profitability that it enjoys in this
business will come under threat from the transition to EVs. The domestic 3W and exports
3W business each account for roughly ~10% each of Bajaj's revenues. Whilst the
domestic 3W business will be challenged first; we would not be surprised if competitors try
to replicate the success in India, in the export markets as well.
22 August 2017
India Automobiles Sector 24
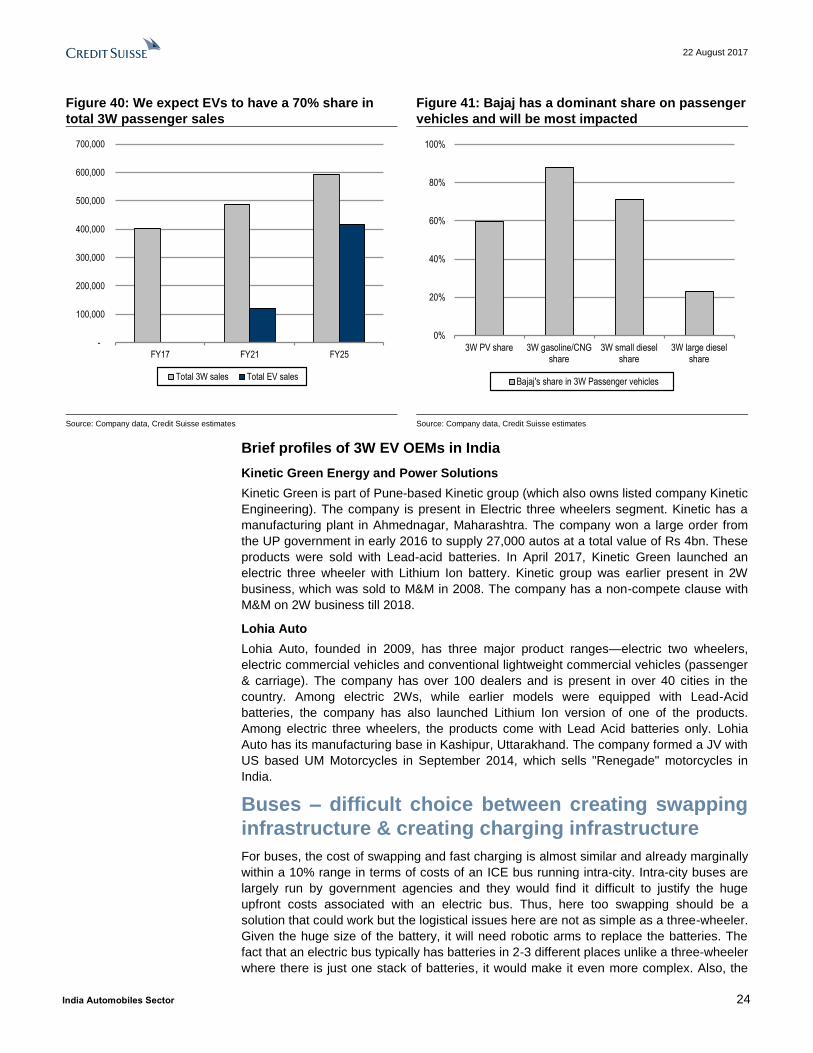
Figure 40: We expect EVs to have a 70% share in
total 3W passenger sales
Figure 41: Bajaj has a dominant share on passenger
vehicles and will be most impacted
Source: Company data, Credit Suisse estimates Source: Company data, Credit Suisse estimates
Brief profiles of 3W EV OEMs in India
Kinetic Green Energy and Power Solutions
Kinetic Green is part of Pune-based Kinetic group (which also owns listed company Kinetic
Engineering). The company is present in Electric three wheelers segment. Kinetic has a
manufacturing plant in Ahmednagar, Maharashtra. The company won a large order from
the UP government in early 2016 to supply 27,000 autos at a total value of Rs 4bn. These
products were sold with Lead-acid batteries. In April 2017, Kinetic Green launched an
electric three wheeler with Lithium Ion battery. Kinetic group was earlier present in 2W
business, which was sold to M&M in 2008. The company has a non-compete clause with
M&M on 2W business till 2018.
Lohia Auto
Lohia Auto, founded in 2009, has three major product ranges—electric two wheelers,
electric commercial vehicles and conventional lightweight commercial vehicles (passenger
& carriage). The company has over 100 dealers and is present in over 40 cities in the
country. Among electric 2Ws, while earlier models were equipped with Lead-Acid
batteries, the company has also launched Lithium Ion version of one of the products.
Among electric three wheelers, the products come with Lead Acid batteries only. Lohia
Auto has its manufacturing base in Kashipur, Uttarakhand. The company formed a JV with
US based UM Motorcycles in September 2014, which sells "Renegade" motorcycles in
India.
Buses – difficult choice between creating swapping
infrastructure & creating charging infrastructure
For buses, the cost of swapping and fast charging is almost similar and already marginally
within a 10% range in terms of costs of an ICE bus running intra-city. Intra-city buses are
largely run by government agencies and they would find it difficult to justify the huge
upfront costs associated with an electric bus. Thus, here too swapping should be a
solution that could work but the logistical issues here are not as simple as a three-wheeler.
Given the huge size of the battery, it will need robotic arms to replace the batteries. The
fact that an electric bus typically has batteries in 2-3 different places unlike a three-wheeler
where there is just one stack of batteries, it would make it even more complex. Also, the
-
100,000
200,000
300,000
400,000
500,000
600,000
700,000
FY17 FY21 FY25
Total 3W sales Total EV sales
0%
20%
40%
60%
80%
100%
3W PV share 3W gasoline/CNGshare
3W small dieselshare
3W large dieselshare
Bajaj's share in 3W Passenger vehicles

22 August 2017
India Automobiles Sector 25
best benefits of swapping are utilised when batteries are charged at a central location as
that can provide ideal charging conditions to improve battery life. Sun Mobility, a company
headed by Reva founder Mr Chetan Maini is looking to develop a swapping solution for
buses. They have recently tied up with Ashok Leyland for the same.
Figure 42: On buses, the cost of swapping and fast charging is almost similar; fast
charging has higher upfront costs but might be easier to implement
Units ICE Electric with fast
charging
Electric with swapping
Battery cost (landed in India) USD/kwh 300
Capital cost Rs '000 3,000 6,240 3,315
Battery size kwh 150
Cost of the battery Rs '000 2,925
Life of the vehicle years 12 12 12
Annual usage km 50,000 50,000 50,000
Range of the vehicle km 150 150
Battery cycles 1,000 1,000
Life of battery km NA 150,000 150,000
Interest rate 12% 12% 12%
NPV capital cost of vehicle (incl.
battery replacements)
Rs '000 3,000 9,529 3,315
Per month EMI Rs '000 39 125 44
Capital cost per km (A) Rs/km 9.5 30.0 10.4
Maintenance cost
Annual cost Rs '000 450 112.5 112.5
Maintenance cost per km (B) Rs km 9.0 2.3 2.3
Operating cost per km (C) Rs/km 24.0 12.3 31.1
Total cost per km (A+B+C) 42.5 44.6 43.8
Source: Company data, Credit Suisse estimates

22 August 2017
India Automobiles Sector 26
Personal transport needs further reduction in costs For personal transport, the cost dynamics still do not work out as payback periods
currently exceed five years, and we feel the payback period has to be <3 years for a
transition to happen; this could happen by FY21 once battery prices are lower and ICE
cost higher post BS-VI. Within personal vehicles, 2W will transition faster than cars as 2W
do not really need a high cost fast charging network. On 2W, there will be competition from
a number of startups as well since the traditional advantages of a 2W OEM—brand and
distribution are unlikely to play a big role in EVs. We expect >20% of the total 2W sold to
be electric by 2025. We could see the entry of Bajaj into scooters with an electric scooter.
On cars, penetration will be driven by fleet segment where EVs already make sense. Fleet
are likely to spend on their own charging network. As such this will limit penetration of EVs
to <10% of the total PV volumes even by 2025. We believe it makes sense for the
government to bring back incentives for plug-in hybrids, once battery costs start coming
down; it will make economic sense. No major threat to Maruti as such, Mahindra will
benefit to a certain extent from the shift towards EVs amongst fleet, given that it has a
head start.
Growth will take off only when payback period falls to < 3 years
As mentioned earlier, one of the big triggers for the mass adoption for EVs in India will be
the implementation of BS-VI norms in 2020. A 40% fall in battery prices would result in the
payback period on a 2W coming down to just two years from over six years currently.
Figure 43: By 2025, the payback period on ICE could be down to just two years
ICE Battery prices at USD 220 Battery prices at USD 130
Expected distance driven (km) 7,500 7,500 7,500
Capital cost (Rs) 55,000 90,000 72,000
Out of which Battery cost (Rs) 42,900 25,740
Battery cost per kwh (USD) 220 130
Battery cost per kwh including import duty &
GST (USD)
300 180
Battery size (kwh) 2.2 2.2
Electricity cost per kwh (Rs) 6.00 6.00
Range (km) 65 65
Mileage on gasoline (km/litre) 60
Gasoline price (Rs/litre) 70
Running cost per annum (Rs) 8,750 1,523 1,523
Maintenance costs (3% on ICE, half on EV)
(Rs)
1,650 825 825
Total cost per annum (Rs) 10,400 2,348 2,348
Payback (years) 6.3 1.6
Source: Company data, Credit Suisse estimates
Two-wheelers – disruption likely once EVs take off
Existing products are compromise vehicles
The existing electric vehicles in the market are compromise vehicles as the manufacturers,
in order to price them in line with ICE vehicles, have put very low size batteries resulting in
a very poor performance. Most of the existing electric scooters on the road have a top
speed of 25kmph which is much lower than the minimum of 60kmph that a consumer
would want. Thus, the usage of electric scooters today is limited with annual sales of

22 August 2017
India Automobiles Sector 27
around 30k p.a.; only 0.2% of the overall domestic 2W volumes of 17.6 mn units. Clearly,
the current economics is not supportive of a wide-scale adoption until battery prices come
down.
Initial focus on premium products
However, we believe there exists a space for an electric vehicle where the main
positioning is not a lower running costs but positioning it as a smart vehicle. Since an
electric vehicle is amenable to a lot more sensors, and thus, can be made much more
feature rich. This will further increase the cost of the vehicle but it can be positioned as a
premium vehicle and sold in the market. It will still need setting up of a charging network,
and hence, if a startup is going to launch the same, the launch will initially will be restricted
to a few top two-wheeler cities. We reckon the target cities could be the cities which are
the top IT centres in the country as youth in such organisations will be more attracted to a
smart vehicle. Given the large size of the market, even with a 1% ratio of early adopters
there is enough scale for people to get into EVs.
Figure 44: EVs will start gaining traction in FY21;
will continue to scale up thereafter
Figure 45: Premium EV scooters can be relevant for
almost ~45% of the 2W market
Source: Company data, Credit Suisse estimates Source: SIAM, Credit Suisse research
2W – even low cost AC chargers can act as fast charging stations
As highlighted in the section above, the cost of swapping is significantly higher than an
ICE engine since on the 2W side. Moreover, in this early stage of the industry, we do not
expect OEMs to collaborate and work with each other closely towards standardisation.
Standardisation of battery and BMS (Battery Management System) is a must for
swapping. Hence, even if battery costs come down significantly we do not expect 2W to
move towards swapping as in a fiercely competitive industry, it is only fair to expect OEMs
to try and create differentiation, and hence, not share technology with each other. Whilst
swapping does not work; what works for 2W is that given the smaller size of the battery
even an AC charging station (not too expensive) is good enough for fast charging of the
battery.
Different models globally
The two most successful 2W electric vehicle companies in the world are Gogoro from
Taiwan and Niu from China. Whilst the base assumption for any personal EV remains that
the vehicle will be charged in the night at home; in order to reduce customer anxiety there
have to be solutions in case the customer needs more battery power during the day.
0%
5%
10%
15%
20%
25%
-
5
10
15
20
25
30
35
40
FY17 FY21 FY25
Total 2W sales % share of EVs
Mopeds5%
Economy15%
Executive (100 cc)
22%
Executive (125 cc)
12%
Premium14%
Scooters32%
22 August 2017
India Automobiles Sector 28
Gogoro has a unique model of swappable batteries
First showcased at the 2015 International CES, Gogoro has developed a simple solution
to the range anxiety on electric vehicles. A Gogoro smart scooter has two sets of
lightweight batteries (weighing ~10 kg each), and these batteries can be exchanged at
company outlets called GoStations where customers can swap batteries within seconds
from an ATM-like machine. It has created a network of 400 such stations in Taiwan with
Taipei City accounting for a bulk of those.
The key advantage of this model is that consumers do not have to worry at all about
charging time, and it mimics the consumer experience of refueling a vehicle that
consumers are used to currently. However, the key challenge with this is that it is
extremely capex intensive and for a startup company it means the scale up takes its own
time. Gogoro, thus, has struggled to really expand beyond Taiwan so far. With its new
scooter, Gogoro has managed to bring down prices to around US$2,500, and with
subsidies it sells at a very attractive price point of US$1,250.
NIU – carry on battery model
NIU, which sells electric scooters in China, was co-founded by Mr Li Yi Nan (former CTO
of Baidu) and Mr Token Hu (ex-Microsoft). The latest product M1 is equipped with a
portable light battery (8.3 kg weight), which can be carried by consumers and charged at
home/workplace. This is in addition to the option of charging the vehicle in a garage with a
cable (without taking out the battery). Per the company, the battery can be charged within
a short period (~45% within an hour, enabling ~50 km of movement) which provides
flexibility to move around without having to worry about the range. The vehicle is equipped
with smart technology to monitor the vehicle hardware including battery, which can be
used for preventive maintenance. The powertrain is being sourced from Bosch, and has a
lower energy consumption. NIU launched its first vehicle in June 2015.
Existing OEMs will face new challenges
From an existing mass OEM perspective the key challenge we believe will be on the
organizational flexibility needed to move the organization towards EVs. EVs will need a
very different kind of selling to customers, the entire distribution channel and the brand
perception will have to be different. Dealers will not make much money on servicing EV
2W, and hence, might need to be compensated with higher margins on EVs. OEMs or
their dealers will have to take responsibility of installing charging systems in a customer's
home. Also, the existing positioning of a mass OEM brand might actually prove to be an
hindrance rather an advantage in trying to sell a smart scooter.
TVS – first OEM to confirm launch of an electric scooter in March/April
TVS Motors at its recent AGM confirmed that it is going to launch a hybrid scooter by the
end of CY17 and a pure electric scooter by Apr-18. The company feels that in the absence
of electric charging infrastructure in the country, hybrids might be the right solution for the
next few years till the charging infrastructure catches up; especially outside the top-tier
cities. Management commentary would suggest that the first hybrids might still be based
on lead-acid batteries. The pure EVs are likely to be based on lithium-ion batteries.
Bajaj Auto – likely to create a separate company for EVs; will address scooter gap
In a recent interview to CNBC, Rajiv Bajaj (MD, Bajaj Auto) suggested that Bajaj will
create a separate company to get into EVs. Per Mr Bajaj, an EV vehicle will need a
completely different brand identity so that the customer does not see the product as just
an incremental conversion of an existing vehicle to an electric powertrain but sees the
product as a new solution suitable for the EV world. We broadly agree with this strategy
but execution will still be a key challenge, with creating a dynamic organisation culture still
likely to be a challenge. We believe this also addresses the distribution question as a new
company would mean that a new distribution chain will be created for the same. We
reckon this will also mark the entry of Bajaj into scooters, a key growth opportunity that
Bajaj could enter scooters with an EV
22 August 2017
India Automobiles Sector 29
Bajaj has so far missed out on. However, taking this approach might mean that Bajaj will
look to directly transition to EVs rather than move to hybrid scooters.
Hero Motocorp – may focus on hybrids under Hero brand, EVs through investments
Our interaction with Hero Electric suggests that as part of the family settlement, Hero
Motocorp (listed company) cannot do pure EVs under the Hero brand name and Hero
Electric cannot make gasoline vehicles under the Hero brand name in Hero Electric. This
might mean that Hero Motocorp may initially focus on hybrids; it is already working on
electric solutions and might be in a position to launch it once the agreement with Hero
Electric lapses. As an alternate strategy, Hero Motocorp. has also invested in Ather
Energy, a startup focused on electric scooters. Startups like Ather, Tork could do well at
the premium end of the market
Whilst in other segments largely existing OEMs are developing electric vehicles; on the
2W side given the low capex nature of the business there are a number of startups
working on solutions. The big challenge earlier for a startup will be creating the brand and
distribution; both these challenges should be significantly lower in the EV world.
Profiles of private companies engaged in Electric 2Ws
Hero Electric
Hero Electric (part of the Hero group) is India’s leading company in electric vehicle space
with presence in 2Ws and E-rickshaws. Hero Electric has a number of products on offer in
the Indian market, including a Lithium-ion product Flash which was launched recently in
February 2017. It has a network of over 300 exclusive sales and service outlets across the
country. Hero Electric has a manufacturing plant at Ludhiana. Since India is still at a
nascent stage in terms of adoption of electric vehicles, volumes are fairly low. Hero
Electric had a 70% market share in Electric 2W in FY16, when industry sold ~20,000
vehicles. Hero Electric is owned by Mr Dayanand Munjal group (comprising sons of late Mr
Dayanand Munjal - Mr Vijay Munjal, Mr Ashish Munjal and Mr Ashok Munjal).
Ather Energy
Ather Energy is a startup company founded in 2013 by Mr Tarun Mehta and Mr Swapnil
Jain, graduates from IIT Madras. The company is planning to launch its first electric
scooter named S340. The product is proposed to be a smart vehicle, with a touchscreen
dashboard, which can be used to monitor vehicle hardware as well. The company
proposes to adopt a different distribution model (as compared to traditional 2W OEMs) and
is likely to have few showrooms in each city. Vehicle performance and condition will be
monitored remotely, which will enable preventive maintenance. The company will launch
its vehicles in Chennai, Pune and Bengaluru, and will set up charging stations as well for
its customers. The company has received funding from Flipkart founders, Tiger Global and
most recently Hero Motocorp (30% stake for ~Rs2 bn in October 2016).
Tork Motors
Tork Motors is a Pune-based startup company founded by Mr Kapil Shelke in 2010. The
company is planning to launch an electric motorcycle named T6X in the cities of Pune,
Bengaluru and New Delhi. Similar to Ather Energy’s S 340, T6X will also come with cloud
connectivity, which will allow the company to suggest preventive maintenance. T6X is
likely to come with a range of 100 kms and maximum speed of 100kmph. The company
has raised capital from a group of angel investors including the founders of Ola.
Cars will take time to go pure electric; government
should possibly incentivise hybrids again
Cost of both swapping & charging infrastructure very high
As far as cars are concerned, the swapping economics does not work. Also, the cost of
setting up a fast charging network is also very high, and hence, it is unlikely that OEMs will
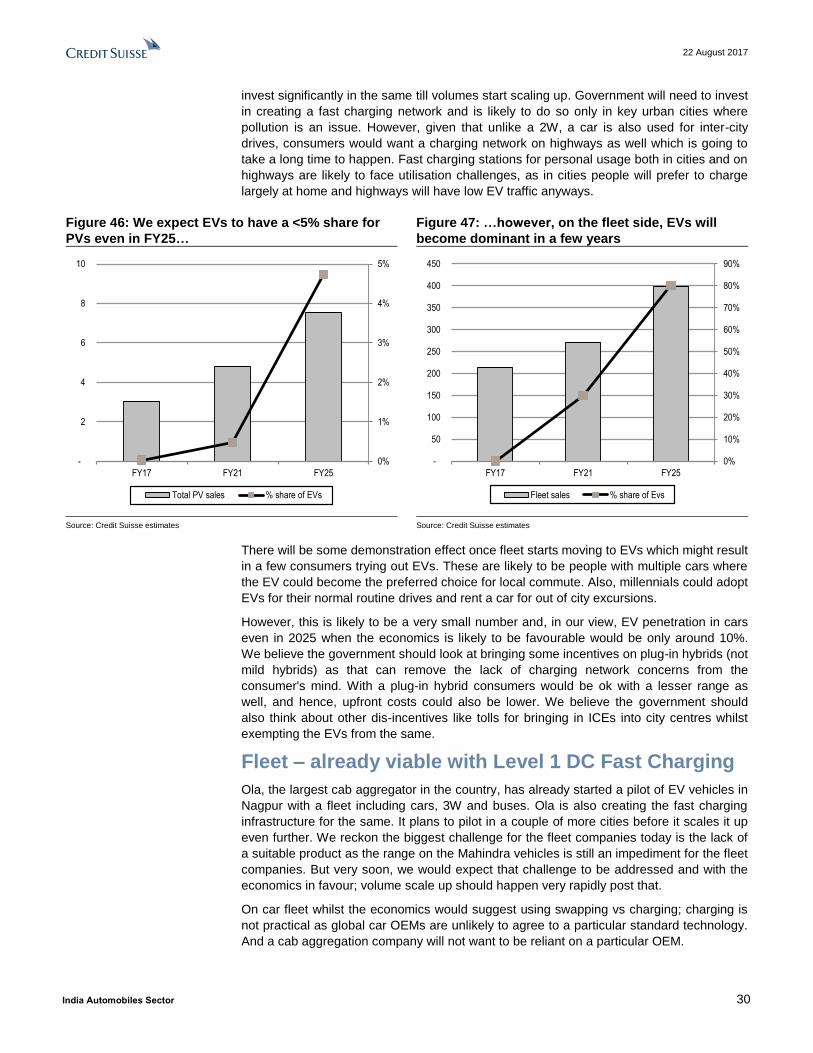
22 August 2017
India Automobiles Sector 30
invest significantly in the same till volumes start scaling up. Government will need to invest
in creating a fast charging network and is likely to do so only in key urban cities where
pollution is an issue. However, given that unlike a 2W, a car is also used for inter-city
drives, consumers would want a charging network on highways as well which is going to
take a long time to happen. Fast charging stations for personal usage both in cities and on
highways are likely to face utilisation challenges, as in cities people will prefer to charge
largely at home and highways will have low EV traffic anyways.
Figure 46: We expect EVs to have a <5% share for
PVs even in FY25…
Figure 47: …however, on the fleet side, EVs will
become dominant in a few years
Source: Credit Suisse estimates Source: Credit Suisse estimates
There will be some demonstration effect once fleet starts moving to EVs which might result
in a few consumers trying out EVs. These are likely to be people with multiple cars where
the EV could become the preferred choice for local commute. Also, millennials could adopt
EVs for their normal routine drives and rent a car for out of city excursions.
However, this is likely to be a very small number and, in our view, EV penetration in cars
even in 2025 when the economics is likely to be favourable would be only around 10%.
We believe the government should look at bringing some incentives on plug-in hybrids (not
mild hybrids) as that can remove the lack of charging network concerns from the
consumer's mind. With a plug-in hybrid consumers would be ok with a lesser range as
well, and hence, upfront costs could also be lower. We believe the government should
also think about other dis-incentives like tolls for bringing in ICEs into city centres whilst
exempting the EVs from the same.
Fleet – already viable with Level 1 DC Fast Charging
Ola, the largest cab aggregator in the country, has already started a pilot of EV vehicles in
Nagpur with a fleet including cars, 3W and buses. Ola is also creating the fast charging
infrastructure for the same. It plans to pilot in a couple of more cities before it scales it up
even further. We reckon the biggest challenge for the fleet companies today is the lack of
a suitable product as the range on the Mahindra vehicles is still an impediment for the fleet
companies. But very soon, we would expect that challenge to be addressed and with the
economics in favour; volume scale up should happen very rapidly post that.
On car fleet whilst the economics would suggest using swapping vs charging; charging is
not practical as global car OEMs are unlikely to agree to a particular standard technology.
And a cab aggregation company will not want to be reliant on a particular OEM.
0%
1%
2%
3%
4%
5%
-
2
4
6
8
10
FY17 FY21 FY25
Total PV sales % share of EVs
0%
10%
20%
30%
40%
50%
60%
70%
80%
90%
-
50
100
150
200
250
300
350
400
450
FY17 FY21 FY25
Fleet sales % share of Evs
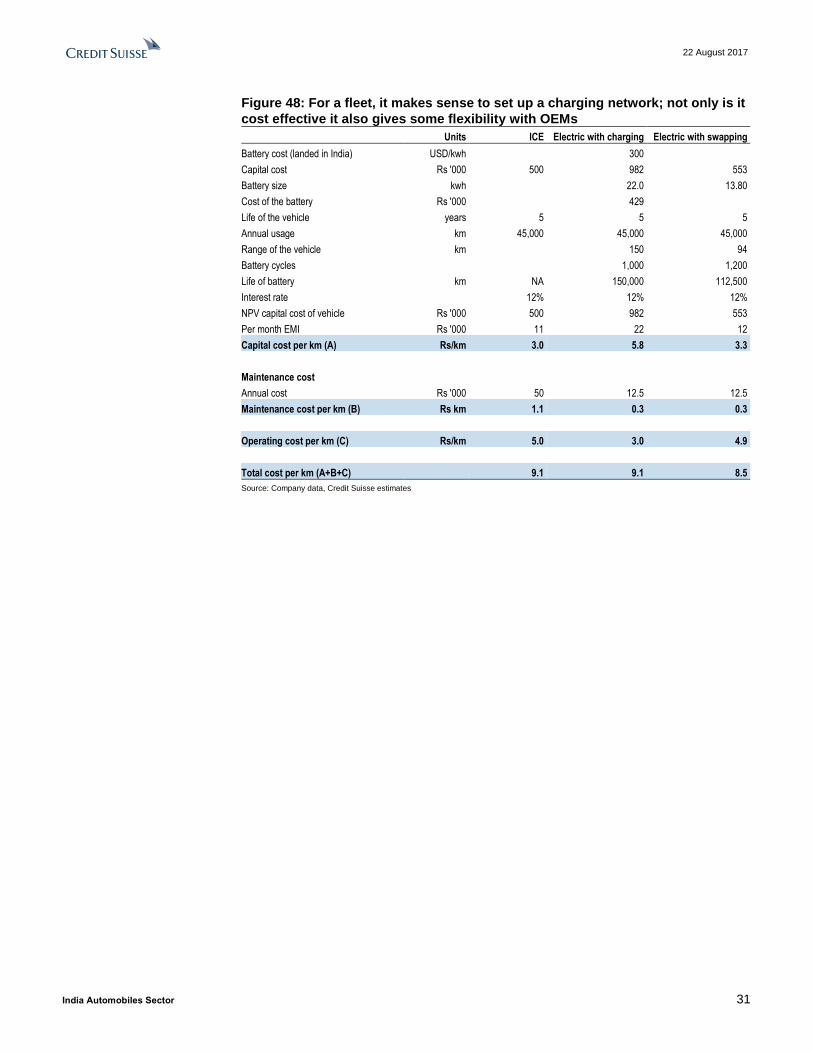
22 August 2017
India Automobiles Sector 31
Figure 48: For a fleet, it makes sense to set up a charging network; not only is it
cost effective it also gives some flexibility with OEMs
Units ICE Electric with charging Electric with swapping
Battery cost (landed in India) USD/kwh 300
Capital cost Rs '000 500 982 553
Battery size kwh 22.0 13.80
Cost of the battery Rs '000 429
Life of the vehicle years 5 5 5
Annual usage km 45,000 45,000 45,000
Range of the vehicle km 150 94
Battery cycles 1,000 1,200
Life of battery km NA 150,000 112,500
Interest rate 12% 12% 12%
NPV capital cost of vehicle Rs '000 500 982 553
Per month EMI Rs '000 11 22 12
Capital cost per km (A) Rs/km 3.0 5.8 3.3
Maintenance cost
Annual cost Rs '000 50 12.5 12.5
Maintenance cost per km (B) Rs km 1.1 0.3 0.3
Operating cost per km (C) Rs/km 5.0 3.0 4.9
Total cost per km (A+B+C) 9.1 9.1 8.5
Source: Company data, Credit Suisse estimates

22 August 2017
India Automobiles Sector 32
Appendix
Different types of EVs
There are multiple different types of electric vehicles based on the level of functionality
provided by the battery and whether external charging is possible or not.
Micro Hybrids – Typically the vehicle will have a very small capacity battery which is
largely used only for Start/Stop functions.
Mild-hybrids – Slightly higher capacity battery which supports the ICE but it is not
possible to exclusively drive the vehicle with electricity. Will typically have regenerative
braking as well to charge the battery.
Hybrids – Hybrid vehicles have two complementary drive systems: An ICE with a fuel tank
and an electric motor with a battery. Both the engine and the electric motor can turn the
transmission at the same time, which can then turn the wheels. However, Hybrids cannot
be charged externally from the grid—the battery gets charged only from the energy of the
engine or regenerative braking.
Plug-in Hybrids - Similar to hybrids, however, plug-in hybrids will have slightly higher
capacity batteries which can be charged externally as well. Plug-in hybrids are very useful
in removing range anxiety from a customer's mind. However, the costs are higher.
Battery electric vehicle – The vehicle runs entirely using an electric motor and a battery
without any support from an ICE. The vehicle must be plugged into an external sources of
electricity to charge it. It will also typically have regenerative braking which uses the
vehicle's electric motor to assist in slowing the vehicle and recover some of the energy
normally converted to heat by the brakes.
Typical parts in an EV powertrain
The main components of an electric vehicle drive system include –
High voltage battery with control unit for battery regulation – The battery is the heart
of an electric vehicle. The high voltage battery supplies its direct voltage to the power
electronics. The Power Electronics convert the direct voltage into an alternating current
which is supplied to the electric motor with three electrical phases via three electrical
wires.
The Electric Motor/Generator with Power electronics & cooling system – Three-
phase synchronous motors are often used as electric motors. A three-phase motor is
powered by a three-phase alternating current. It works with three coil arranged in a circle
around the rotor to from the stator. Several pairs of permanent magnets are located on the
rotor in this synchronous motor. Since the three coils are supplied sequentially with a
current, they together generate a rotating electric field that causes the rotor to rotate.
Transmission including the differential – Pure electric vehicles do not require the
traditional transmission with several speeds. The polarity of the electric motor is simply
reversed when reversing the vehicle; which can be done via a simple gear shifter. The
speed can be regulated infinitely with the accelerator pedal.
Brake system – An electric vehicle has two independent brake systems. One system is
the traditional mechanical brake system. The second brake is formed by the electric drive
motor itself. The energy released by the electric motor during braking and deceleration is
recovered and fed into the battery. This regenerative braking helps the efficiency of an
electric vehicle in city traffic and also reduces the wear of the mechanical brakes.
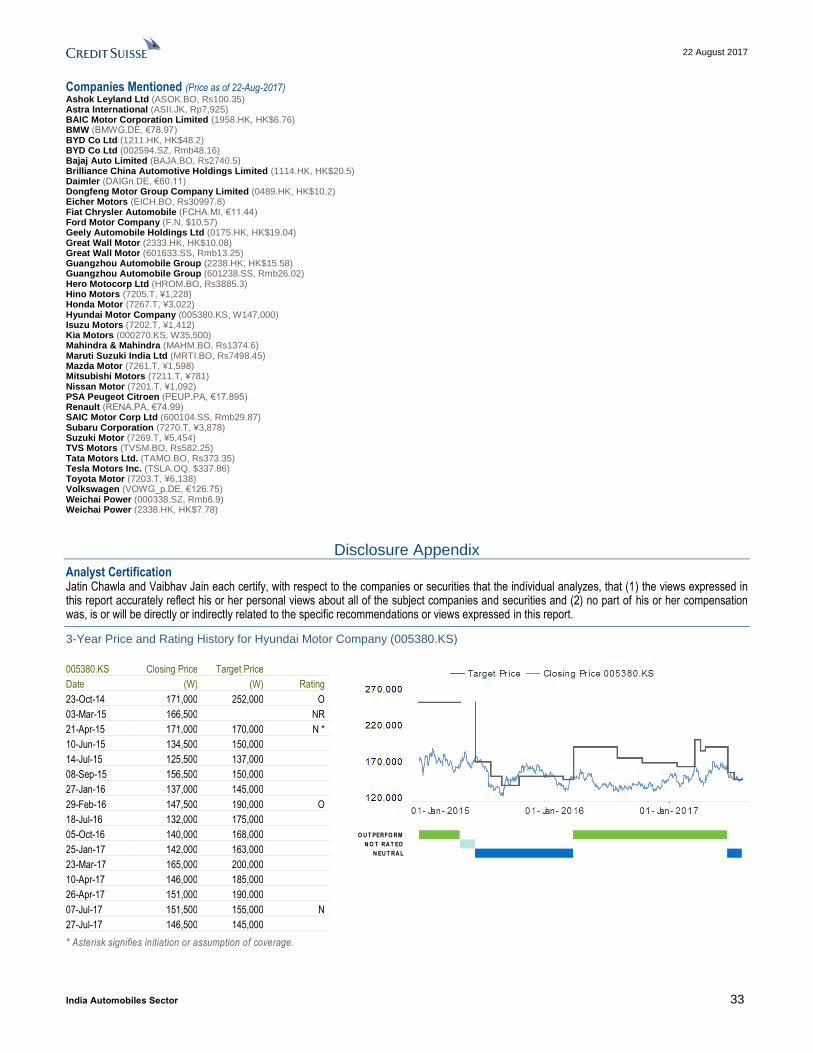
22 August 2017
India Automobiles Sector 33
Companies Mentioned (Price as of 22-Aug-2017) Ashok Leyland Ltd (ASOK.BO, Rs100.35) Astra International (ASII.JK, Rp7,925) BAIC Motor Corporation Limited (1958.HK, HK$6.76) BMW (BMWG.DE, €78.97) BYD Co Ltd (1211.HK, HK$48.2) BYD Co Ltd (002594.SZ, Rmb48.16) Bajaj Auto Limited (BAJA.BO, Rs2740.5) Brilliance China Automotive Holdings Limited (1114.HK, HK$20.5) Daimler (DAIGn.DE, €60.11) Dongfeng Motor Group Company Limited (0489.HK, HK$10.2) Eicher Motors (EICH.BO, Rs30997.8) Fiat Chrysler Automobile (FCHA.MI, €11.44) Ford Motor Company (F.N, $10.57) Geely Automobile Holdings Ltd (0175.HK, HK$19.04) Great Wall Motor (2333.HK, HK$10.08) Great Wall Motor (601633.SS, Rmb13.25) Guangzhou Automobile Group (2238.HK, HK$15.58) Guangzhou Automobile Group (601238.SS, Rmb26.02) Hero Motocorp Ltd (HROM.BO, Rs3885.3) Hino Motors (7205.T, ¥1,228) Honda Motor (7267.T, ¥3,022) Hyundai Motor Company (005380.KS, W147,000) Isuzu Motors (7202.T, ¥1,412) Kia Motors (000270.KS, W35,500) Mahindra & Mahindra (MAHM.BO, Rs1374.6) Maruti Suzuki India Ltd (MRTI.BO, Rs7498.45) Mazda Motor (7261.T, ¥1,598) Mitsubishi Motors (7211.T, ¥781) Nissan Motor (7201.T, ¥1,092) PSA Peugeot Citroen (PEUP.PA, €17.895) Renault (RENA.PA, €74.99) SAIC Motor Corp Ltd (600104.SS, Rmb29.87) Subaru Corporation (7270.T, ¥3,878) Suzuki Motor (7269.T, ¥5,454) TVS Motors (TVSM.BO, Rs582.25) Tata Motors Ltd. (TAMO.BO, Rs373.35) Tesla Motors Inc. (TSLA.OQ, $337.86) Toyota Motor (7203.T, ¥6,138) Volkswagen (VOWG_p.DE, €126.75) Weichai Power (000338.SZ, Rmb6.9) Weichai Power (2338.HK, HK$7.78)
Disclosure Appendix
Analyst Certification Jatin Chawla and Vaibhav Jain each certify, with respect to the companies or securities that the individual analyzes, that (1) the views expressed in this report accurately reflect his or her personal views about all of the subject companies and securities and (2) no part of his or her compensation was, is or will be directly or indirectly related to the specific recommendations or views expressed in this report.
3-Year Price and Rating History for Hyundai Motor Company (005380.KS)
005380.KS Closing Price Target Price
Date (W) (W) Rating
23-Oct-14 171,000 252,000 O
03-Mar-15 166,500 NR
21-Apr-15 171,000 170,000 N *
10-Jun-15 134,500 150,000
14-Jul-15 125,500 137,000
08-Sep-15 156,500 150,000
27-Jan-16 137,000 145,000
29-Feb-16 147,500 190,000 O
18-Jul-16 132,000 175,000
05-Oct-16 140,000 168,000
25-Jan-17 142,000 163,000
23-Mar-17 165,000 200,000
10-Apr-17 146,000 185,000
26-Apr-17 151,000 190,000
07-Jul-17 151,500 155,000 N
27-Jul-17 146,500 145,000
* Asterisk signifies initiation or assumption of coverage.
O U T PERFO RM
N O T RA T ED
N EU T RA L
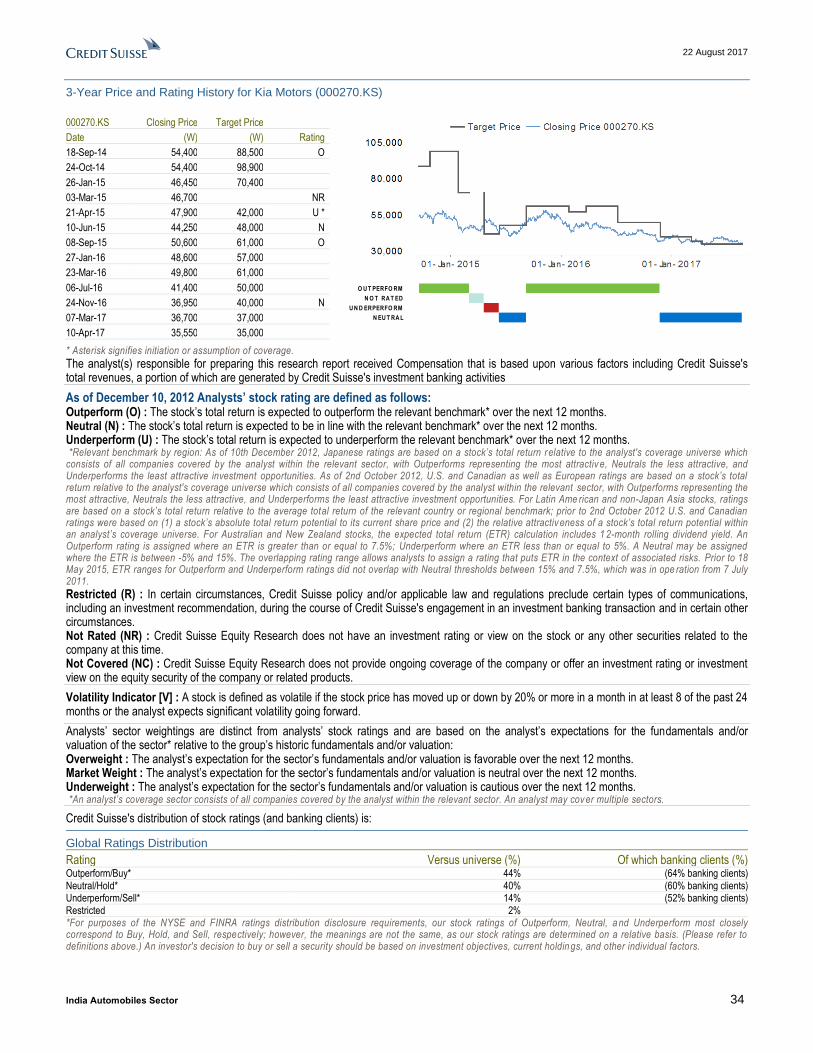
22 August 2017
India Automobiles Sector 34
3-Year Price and Rating History for Kia Motors (000270.KS)
000270.KS Closing Price Target Price
Date (W) (W) Rating
18-Sep-14 54,400 88,500 O
24-Oct-14 54,400 98,900
26-Jan-15 46,450 70,400
03-Mar-15 46,700 NR
21-Apr-15 47,900 42,000 U *
10-Jun-15 44,250 48,000 N
08-Sep-15 50,600 61,000 O
27-Jan-16 48,600 57,000
23-Mar-16 49,800 61,000
06-Jul-16 41,400 50,000
24-Nov-16 36,950 40,000 N
07-Mar-17 36,700 37,000
10-Apr-17 35,550 35,000
* Asterisk signifies initiation or assumption of coverage.
O U T PERFO RM
N O T RA T ED
U N D ERPERFO RM
N EU T RA L
The analyst(s) responsible for preparing this research report received Compensation that is based upon various factors including Credit Suisse's total revenues, a portion of which are generated by Credit Suisse's investment banking activities
As of December 10, 2012 Analysts’ stock rating are defined as follows: Outperform (O) : The stock’s total return is expected to outperform the relevant benchmark* over the next 12 months. Neutral (N) : The stock’s total return is expected to be in line with the relevant benchmark* over the next 12 months. Underperform (U) : The stock’s total return is expected to underperform the relevant benchmark* over the next 12 months. *Relevant benchmark by region: As of 10th December 2012, Japanese ratings are based on a stock’s total return relative to the analyst's coverage universe which consists of all companies covered by the analyst within the relevant sector, with Outperforms representing the most attractiv e, Neutrals the less attractive, and Underperforms the least attractive investment opportunities. As of 2nd October 2012, U.S. and Canadian as well as European ratings are based on a stock’s total return relative to the analyst's coverage universe which consists of all companies covered by the analyst within the relevant sector, with Outperforms representing the most attractive, Neutrals the less attractive, and Underperforms the least attractive investment opportunities. For Latin Ame rican and non-Japan Asia stocks, ratings are based on a stock’s total return relative to the average total return of the relevant country or regional benchmark; prior to 2nd October 2012 U.S. and Canadian ratings were based on (1) a stock’s absolute total return potential to its current share price and (2) the relative attractiv eness of a stock’s total return potential within an analyst’s coverage universe. For Australian and New Zealand stocks, the expected total return (ETR) calculation includes 1 2-month rolling dividend yield. An Outperform rating is assigned where an ETR is greater than or equal to 7.5%; Underperform where an ETR less than or equal to 5%. A Neutral may be assigned where the ETR is between -5% and 15%. The overlapping rating range allows analysts to assign a rating that puts ETR in the context of associated risks. Prior to 18 May 2015, ETR ranges for Outperform and Underperform ratings did not overlap with Neutral thresholds between 15% and 7.5%, which was in ope ration from 7 July 2011. Restricted (R) : In certain circumstances, Credit Suisse policy and/or applicable law and regulations preclude certain types of communications, including an investment recommendation, during the course of Credit Suisse's engagement in an investment banking transaction and in certain other circumstances. Not Rated (NR) : Credit Suisse Equity Research does not have an investment rating or view on the stock or any other securities related to the company at this time. Not Covered (NC) : Credit Suisse Equity Research does not provide ongoing coverage of the company or offer an investment rating or investment view on the equity security of the company or related products.
Volatility Indicator [V] : A stock is defined as volatile if the stock price has moved up or down by 20% or more in a month in at least 8 of the past 24 months or the analyst expects significant volatility going forward.
Analysts’ sector weightings are distinct from analysts’ stock ratings and are based on the analyst’s expectations for the fundamentals and/or valuation of the sector* relative to the group’s historic fundamentals and/or valuation: Overweight : The analyst’s expectation for the sector’s fundamentals and/or valuation is favorable over the next 12 months. Market Weight : The analyst’s expectation for the sector’s fundamentals and/or valuation is neutral over the next 12 months. Underweight : The analyst’s expectation for the sector’s fundamentals and/or valuation is cautious over the next 12 months. *An analyst’s coverage sector consists of all companies covered by the analyst within the relevant sector. An analyst may cover multiple sectors.
Credit Suisse's distribution of stock ratings (and banking clients) is:
Global Ratings Distribution
Rating Versus universe (%) Of which banking clients (%) Outperform/Buy* 44% (64% banking clients) Neutral/Hold* 40% (60% banking clients) Underperform/Sell* 14% (52% banking clients) Restricted 2% *For purposes of the NYSE and FINRA ratings distribution disclosure requirements, our stock ratings of Outperform, Neutral, a nd Underperform most closely correspond to Buy, Hold, and Sell, respectively; however, the meanings are not the same, as our stock ratings are determined on a relative basis. (Please refer to definitions above.) An investor's decision to buy or sell a security should be based on investment objectives, current holdin gs, and other individual factors.
22 August 2017
India Automobiles Sector 35
Important Global Disclosures Credit Suisse’s research reports are made available to clients through our proprietary research portal on CS PLUS. Credit Suisse research products may also be made available through third-party vendors or alternate electronic means as a convenience. Certain research products are only made available through CS PLUS. The services provided by Credit Suisse’s analysts to clients may depend on a specific client’s preferences regarding the frequency and manner of receiving communications, the client’s risk profile and investment, the size and scope of the overall client relationship with the Firm, as well as legal and regulatory constraints. To access all of Credit Suisse’s research that you are entitled to receive in the most timely manner, please contact your sales representative or go to https://plus.credit-suisse.com . Credit Suisse’s policy is to update research reports as it deems appropriate, based on developments with the subject company, the sector or the market that may have a material impact on the research views or opinions stated herein. Credit Suisse's policy is only to publish investment research that is impartial, independent, clear, fair and not misleading. For more detail please refer to Credit Suisse's Policies for Managing Conflicts of Interest in connection with Investment Research: https://www.credit-suisse.com/sites/disclaimers-ib/en/managing-conflicts.html . Credit Suisse does not provide any tax advice. Any statement herein regarding any US federal tax is not intended or written to be used, and cannot be used, by any taxpayer for the purposes of avoiding any penalties. Credit Suisse has decided not to enter into business relationships with companies that Credit Suisse has determined to be involved in the development, manufacture, or acquisition of anti-personnel mines and cluster munitions. For Credit Suisse's position on the issue, please see https://www.credit-suisse.com/media/assets/corporate/docs/about-us/responsibility/banking/policy-summaries-en.pdf . See the Companies Mentioned section for full company names Credit Suisse currently has, or had within the past 12 months, the following as investment banking client(s): TAMO.BO, MAHM.BO, 7203.T, 000270.KS, 7267.T, TSLA.OQ, 1114.HK, 005380.KS, 7205.T, 2238.HK, 0489.HK, 600104.SS, ASII.JK, 601238.SS Credit Suisse provided investment banking services to the subject company (TAMO.BO, 000270.KS, TSLA.OQ, 1114.HK, 005380.KS, 2238.HK, 0489.HK, 600104.SS, 601238.SS) within the past 12 months. Credit Suisse currently has, or had within the past 12 months, the following issuer(s) as client(s), and the services provided were non-investment-banking, securities-related: TAMO.BO, MAHM.BO, 000270.KS, 7267.T, 005380.KS Credit Suisse has managed or co-managed a public offering of securities for the subject company (TSLA.OQ) within the past 12 months. Within the past 12 months, Credit Suisse has received compensation for investment banking services from the following issuer(s): TAMO.BO, 000270.KS, TSLA.OQ, 1114.HK, 005380.KS, 2238.HK, 0489.HK, 600104.SS, 601238.SS Credit Suisse expects to receive or intends to seek investment banking related compensation from the subject company (TAMO.BO, MAHM.BO, HROM.BO, 7203.T, 000270.KS, 7267.T, TSLA.OQ, 1211.HK, 002594.SZ, 2333.HK, 1114.HK, 005380.KS, 7205.T, 2238.HK, 0175.HK, 1958.HK, 0489.HK, 000338.SZ, 600104.SS, ASII.JK, 601633.SS, 601238.SS, 2338.HK) within the next 3 months. Within the last 12 months, Credit Suisse has received compensation for non-investment banking services or products from the following issuer(s): TAMO.BO, MAHM.BO, 000270.KS, 7267.T, 005380.KS As of the date of this report, Credit Suisse makes a market in the following subject companies (1211.HK, 002594.SZ, 2333.HK, 1114.HK, 2238.HK, 0175.HK, 1958.HK, 0489.HK, 601633.SS, 601238.SS). A member of the Credit Suisse Group is party to an agreement with, or may have provided services set out in sections A and B of Annex I of Directive 2014/65/EU of the European Parliament and Council ("MiFID Services") to, the subject issuer (ASOK.BO, BAJA.BO, MRTI.BO, TAMO.BO, MAHM.BO, TVSM.BO, 000270.KS, 7267.T, 7269.T, TSLA.OQ, 1211.HK, 002594.SZ, 2333.HK, 1114.HK, 7270.T, 005380.KS, 7261.T, 7211.T, 2238.HK, 0175.HK, EICH.BO, 1958.HK, 7201.T, 0489.HK, 000338.SZ, 600104.SS, ASII.JK, 7202.T, 601633.SS, 601238.SS, 2338.HK) within the past 12 months. Please visit https://credit-suisse.com/in/researchdisclosure for additional disclosures mandated vide Securities And Exchange Board of India (Research Analysts) Regulations, 2014 Credit Suisse may have interest in (ASOK.BO, BAJA.BO, MRTI.BO, TAMO.BO, MAHM.BO, TVSM.BO, HROM.BO, EICH.BO) As of the end of the preceding month, Credit Suisse beneficially own 1% or more of a class of common equity securities of (2333.HK). Credit Suisse beneficially holds >0.5% long position of the total issued share capital of the subject company (000270.KS, 005380.KS). As of the end of the preceding month, Credit Suisse has a position in the debt securities of (TAMO.BO) Credit Suisse has a material conflict of interest with the subject company (TSLA.OQ) . Credit Suisse is acting as financial advisor to SolarCity Corporation (SQTY.OQ) on their sale to Tesla Motors Inc (TSLA.OQ).
For other important disclosures concerning companies featured in this report, including price charts, please visit the website at https://rave.credit-suisse.com/disclosures or call +1 (877) 291-2683. For date and time of production, dissemination and history of recommendation for the subject company(ies) featured in this report, disseminated within the past 12 months, please refer to the link: https://rave.credit-suisse.com/disclosures/view/report?i=317228&v=-4vetaje44rqxyqr5dckr5a6fk .
Important Regional Disclosures Singapore recipients should contact Credit Suisse AG, Singapore Branch for any matters arising from this research report. The analyst(s) involved in the preparation of this report may participate in events hosted by the subject company, including site visits. Credit Suisse does not accept or permit analysts to accept payment or reimbursement for travel expenses associated with these events. Restrictions on certain Canadian securities are indicated by the following abbreviations: NVS--Non-Voting shares; RVS--Restricted Voting Shares; SVS--Subordinate Voting Shares. Individuals receiving this report from a Canadian investment dealer that is not affiliated with Credit Suisse should be advised that this report may not contain regulatory disclosures the non-affiliated Canadian investment dealer would be required to make if this were its own report. For Credit Suisse Securities (Canada), Inc.'s policies and procedures regarding the dissemination of equity research, please visit https://www.credit-suisse.com/sites/disclaimers-ib/en/canada-research-policy.html. Credit Suisse has acted as lead manager or syndicate member in a public offering of securities for the subject company (ASOK.BO, TAMO.BO, 7267.T, TSLA.OQ, 005380.KS, 2238.HK, 601238.SS) within the past 3 years.

22 August 2017
India Automobiles Sector 36
Principal is not guaranteed in the case of equities because equity prices are variable. Commission is the commission rate or the amount agreed with a customer when setting up an account or at any time after that. This research report is authored by: Credit Suisse Securities (India) Private Limited ........................................................................................................... Jatin Chawla ; Vaibhav Jain To the extent this is a report authored in whole or in part by a non-U.S. analyst and is made available in the U.S., the following are important disclosures regarding any non-U.S. analyst contributors: The non-U.S. research analysts listed below (if any) are not registered/qualified as research analysts with FINRA. The non-U.S. research analysts listed below may not be associated persons of CSSU and therefore may not be subject to the FINRA 2241 and NYSE Rule 472 restrictions on communications with a subject company, public appearances and trading securities held by a research analyst account. Credit Suisse Securities (India) Private Limited ........................................................................................................... Jatin Chawla ; Vaibhav Jain
Important disclosures regarding companies or other issuers that are the subject of this report are available on Credit Suisse ’s disclosure website at https://rave.credit-suisse.com/disclosures or by calling +1 (877) 291-2683.
22 August 2017
India Automobiles Sector 37
This report is produced by subsidiaries and affiliates of Credit Suisse operating under its Global Markets Division. For more information on our structure, please use the following link: https://www.credit-suisse.com/who-we-are This report may contain material that is not directed to, or intended for distribution to or use by, any person or entity who is a citizen or resident of or located in any locality, state, country or other jurisdiction where such distribution, publication, availability or use would be contrary to law or regulation or which would subject Credit Suisse or its affiliates ("CS") to any registration or licensing requirement within such jurisdiction. All material presented in this report, unless specifically indicated otherwise, is under copyright to CS. None of the material, nor its content, nor any copy of it, may be altered in any way, transmitted to, copied or distributed to any other party, without the prior express written permission of CS. All trademarks, service marks and logos used in this report are trademarks or service marks or registered trademarks or service marks of CS or its affiliates.The information, tools and material presented in this report are provided to you for information purposes only and are not to be used or considered as an offer or the solicitation of an offer to sell or to buy or subscribe for securities or other financial instruments. CS may not have taken any steps to ensure that the securities referred to in this report are suitable for any particular investor. CS will not treat recipients of this report as its customers by virtue of their receiving this report. The investments and services contained or referred to in this report may not be suitable for you and it is recommended that you consult an independent investment advisor if you are in doubt about such investments or investment services. Nothing in this report constitutes investment, legal, accounting or tax advice, or a representation that any investment or strategy is suitable or appropriate to your individual circumstances, or otherwise constitutes a personal recommendation to you. CS does not advise on the tax consequences of investments and you are advised to contact an independent tax adviser. Please note in particular that the bases and levels of taxation may change. Information and opinions presented in this report have been obtained or derived from sources believed by CS to be reliable, but CS makes no representation as to their accuracy or completeness. CS accepts no liability for loss arising from the use of the material presented in this report, except that this exclusion of liability does not apply to the extent that such liability arises under specific statutes or regulations applicable to CS. This report is not to be relied upon in substitution for the exercise of independent judgment. CS may have issued, and may in the future issue, other communications that are inconsistent with, and reach different conclusions from, the information presented in this report. Those communications reflect the different assumptions, views and analytical methods of the analysts who prepared them and CS is under no obligation to ensure that such other communications are brought to the attention of any recipient of this report. Some investments referred to in this report will be offered solely by a single entity and in the case of some investments solely by CS, or an associate of CS or CS may be the only market maker in such investments. Past performance should not be taken as an indication or guarantee of future performance, and no representation or warranty, express or implied, is made regarding future performance. Information, opinions and estimates contained in this report reflect a judgment at its original date of publication by CS and are subject to change without notice. The price, value of and income from any of the securities or financial instruments mentioned in this report can fall as well as rise. The value of securities and financial instruments is subject to exchange rate fluctuation that may have a positive or adverse effect on the price or income of such securities or financial instruments. Investors in securities such as ADR's, the values of which are influenced by currency volatility, effectively assume this risk. Structured securities are complex instruments, typically involve a high degree of risk and are intended for sale only to sophisticated investors who are capable of understanding and assuming the risks involved. The market value of any structured security may be affected by changes in economic, financial and political factors (including, but not limited to, spot and forward interest and exchange rates), time to maturity, market conditions and volatility, and the credit quality of any issuer or reference issuer. Any investor interested in purchasing a structured product should conduct their own investigation and analysis of the product and consult with their own professional advisers as to the risks involved in making such a purchase. Some investments discussed in this report may have a high level of volatility. High volatility investments may experience sudden and large falls in their value causing losses when that investment is realised. Those losses may equal your original investment. Indeed, in the case of some investments the potential losses may exceed the amount of initial investment and, in such circumstances, you may be required to pay more money to support those losses. Income yields from investments may fluctuate and, in consequence, initial capital paid to make the investment may be used as part of that income yield. Some investments may not be readily realisable and it may be difficult to sell or realise those investments, similarly it may prove difficult for you to obtain reliable information about the value, or risks, to which such an investment is exposed. This report may provide the addresses of, or contain hyperlinks to, websites. Except to the extent to which the report refers to website material of CS, CS has not reviewed any such site and takes no responsibility for the content contained therein. Such address or hyperlink (including addresses or hyperlinks to CS's own website material) is provided solely for your convenience and information and the content of any such website does not in any way form part of this document. Accessing such website or following such link through this report or CS's website shall be at your own risk.
This report is issued and distributed in European Union (except Switzerland): by Credit Suisse Securities (Europe) Limited, One Cabot Square, London E14 4QJ, England, which is authorised by the Prudential Regulation Authority and regulated by the Financial Conduct Authority and the Prudential Regulation Authority. Germany: Credit Suisse Securities (Europe) Limited Niederlassung Frankfurt am Main regulated by the Bundesanstalt fuer Finanzdienstleistungsaufsicht ("BaFin"). United States and Canada: Credit Suisse Securities (USA) LLC; Switzerland: Credit Suisse AG; Brazil: Banco de Investimentos Credit Suisse (Brasil) S.A or its affiliates; Mexico: Banco Credit Suisse (México), S.A. (transactions related to the securities mentioned in this report will only be effected in compliance with applicable regulation); Japan: by Credit Suisse Securities (Japan) Limited, Financial Instruments Firm, Director-General of Kanto Local Finance Bureau ( Kinsho) No. 66, a member of Japan Securities Dealers Association, The Financial Futures Association of Japan, Japan Investment Advisers Association, Type II Financial Instruments Firms Association; Hong Kong: Credit Suisse (Hong Kong) Limited; Australia: Credit Suisse Equities (Australia) Limited; Thailand: Credit Suisse Securities (Thailand) Limited, regulated by the Office of the Securities and Exchange Commission, Thailand, having registered address at 990 Abdulrahim Place, 27th Floor, Unit 2701, Rama IV Road, Silom, Bangrak, Bangkok10500, Thailand, Tel. +66 2614 6000; Malaysia: Credit Suisse Securities (Malaysia) Sdn Bhd; Singapore: Credit Suisse AG, Singapore Branch; India: Credit Suisse Securities (India) Private Limited (CIN no.U67120MH1996PTC104392) regulated by the Securities and Exchange Board of India as Research Analyst (registration no. INH 000001030) and as Stock Broker (registration no. INB230970637; INF230970637; INB010970631; INF010970631), having registered address at 9th Floor, Ceejay House, Dr.A.B. Road, Worli, Mumbai - 18, India, T- +91-22 6777 3777; South Korea: Credit Suisse Securities (Europe) Limited,
Seoul Branch; Taiwan: Credit Suisse AG Taipei Securities Branch; Indonesia: PT Credit Suisse Sekuritas Indonesia; Philippines:Credit Suisse Securities (Philippines ) Inc., and elsewhere in the world by the relevant authorised affiliate of the above. Additional Regional Disclaimers Hong Kong: Credit Suisse (Hong Kong) Limited ("CSHK") is licensed and regulated by the Securities and Futures Commission of Hong Kong under the laws of Hong Kong, which differ from Australian laws. CSHKL does not hold an Australian financial services licence (AFSL) and is exempt from the requirement to hold an AFSL under the Corporations Act 2001 (the Act) under Class Order 03/1103 published by the ASIC in respect of financial services provided to Australian wholesale clients (within the meaning of section 761G of the Act). Research on Taiwanese securities produced by Credit Suisse AG, Taipei Securities Branch has been prepared by a registered Senior Business Person. Australia (to the extent services are offered in Australia): Credit Suisse Securities (Europe) Limited (“CSSEL”) and Credit Suisse International (“CSI”) are authorised by the Prudential Regulation Authority and regulated by the Financial Conduct Authority (“FCA”) and the Prudential Regulation Authority under UK laws, which differ from Australian Laws. CSSEL and CSI do not hold an Australian Financial Services Licence (“AFSL”) and are exempt from the requirement to hold an AFSL under the Corporations Act (Cth) 2001 (“Corporations Act”) under Class Order 03/1099 published by the Australian Securities and Investments Commission (“ASIC”), in respect of the financial services provided to Australian wholesale clients (within the meaning of section 761G of the Corporations Act). This material is not for distribution to retail clients and is directed exclusively at Credit Suisse's professional clients and eligible counterparties as defined by the FCA, and wholesale clients as defined under section 761G of the Corporations Act. Credit Suisse (Hong Kong) Limited (“CSHK”) is licensed and regulated by the Securities and Futures Commission of Hong Kong under the laws of Hong Kong, which differ from Australian laws. CSHKL does not hold an AFSL and is exempt from the requirement to hold an AFSL under the Corporations Act under Class Order 03/1103 published by the ASIC in respect of financial services provided to Australian wholesale clients (within the meaning of section 761G of the Corporations Act). Credit Suisse Securities (USA) LLC (CSSU) and Credit Suisse Asset Management LLC (CSAM LLC) are licensed and regulated by the Securities Exchange Commission of the United States under the laws of the United States, which differ from Australian laws. CSSU and CSAM LLC do not hold an AFSL and is exempt from the requirement to hold an AFSL under the Corporations Act under Class Order 03/1100 published by the ASIC in respect of financial services provided to Australian wholesale clients (within the meaning of section 761G of the Corporations Act). Malaysia: Research provided to residents of Malaysia is authorised by the Head of Research for Credit Suisse Securities (Malaysia) Sdn Bhd, to whom they should direct any queries on +603 2723 2020. Singapore: This report has been prepared and issued for distribution in Singapore to institutional investors, accredited investors and expert investors (each as defined under the Financial Advisers Regulations) only, and is also distributed by Credit Suisse AG, Singapore Branch to overseas investors (as defined under the Financial Advisers Regulations). Credit Suisse AG, Singapore Branch may distribute reports produced by its foreign entities or affiliates pursuant to an arrangement under Regulation 32C of the Financial Advisers Regulations. Singapore recipients should contact Credit Suisse AG, Singapore Branch at +65-6212-2000 for matters arising from, or in connection with, this report. By virtue of your status as an institutional investor, accredited investor, expert investor or overseas investor, Credit Suisse AG, Singapore Branch is exempted from complying with certain compliance requirements under the Financial Advisers Act, Chapter 110 of Singapore (the “FAA”), the Financial Advisers Regulations and the relevant Notices and Guidelines issued thereunder, in respect of any financial advisory service which Credit Suisse AG, Singapore Branch may provide to you. UAE: This information is being distributed by Credit Suisse AG (DIFC Branch), duly licensed and regulated by the Dubai Financial Services Authority (“DFSA”). Related financial services or products are only made available to Professional Clients or Market Counterparties, as defined by the DFSA, and are not intended for any other persons. Credit Suisse AG (DIFC Branch) is located on Level 9 East, The Gate Building, DIFC, Dubai, United Arab Emirates. EU: This report has been produced by subsidiaries and affiliates of Credit Suisse operating under its Global Markets Division In jurisdictions where CS is not already registered or licensed to trade in securities, transactions will only be effected in accordance with applicable securities legislation, which will vary from jurisdiction to jurisdiction and may require that the trade be made in accordance with applicable exemptions from registration or licensing requirements. Non-US customers wishing to effect a transaction should contact a CS entity in their local jurisdiction unless governing law permits otherwise. US customers wishing to effect a transaction should do so only by contacting a representative at Credit Suisse Securities (USA) LLC in the US. Please note that this research was originally prepared and issued by CS for distribution to their market professional and institutional investor customers. Recipients who are not market professional or institutional investor customers of CS should seek the advice of their independent financial advisor prior to taking any investment decision based on this report or for any necessary explanation of its contents. This research may relate to investments or services of a person outside of the UK or to other matters which are not authorised by the Prudential Regulation Authority and regulated by the Financial Conduct Authority and the Prudential Regulation Authority or in respect of which the protections of the Prudential Regulation Authority and Financial Conduct Authority for private customers and/or the UK compensation scheme may not be available, and further details as to where this may be the case are available upon request in respect of this report. CS may provide various services to US municipal entities or obligated persons ("municipalities"), including suggesting individual transactions or trades and entering into such transactions. Any services CS provides to municipalities are not viewed as "advice" within the meaning of Section 975 of the Dodd-Frank Wall Street Reform and Consumer Protection Act. CS is providing any such services and related information solely on an arm's length basis and not as an advisor or fiduciary to the municipality. In connection with the provision of the any such services, there is no agreement, direct or indirect, between any municipality (including the officials,management, employees or agents thereof) and CS for CS to provide advice to the municipality. Municipalities should consult with their financial, accounting and legal advisors regarding any such services provided by CS. In addition, CS is not acting for direct or indirect compensation to solicit the municipality on behalf of an unaffiliated broker, dealer, municipal securities dealer, municipal advisor, or investment adviser for the purpose of obtaining or retaining an engagement by the municipality for or in connection with Municipal Financial Products, the issuance of municipal securities, or of an investment adviser to provide investment advisory services to or on behalf of the municipality. If this report is being distributed by a financial institution other than Credit Suisse AG, or its affiliates, that financial institution is solely responsible for distribution. Clients of that institution should contact that institution to effect a transaction in the securities mentioned in this report or require further information. This report does not constitute investment advice by Credit Suisse to the clients of the distributing financial institution, and neither Credit Suisse AG, its affiliates, and their respective officers, directors and employees accept any liability whatsoever for any direct or consequential loss arising from their use of this report or its content. Principal is not guaranteed. Commission is the commission rate or the amount agreed with a customer when setting up an account or at any time after that. Copyright © 2017 CREDIT SUISSE AG and/or its affiliates. All rights reserved.
Investment principal on bonds can be eroded depending on sale price or market price. In addition, there are bonds on which investment principal can be eroded due to changes in redemption amounts. Care is required when investing in such instruments. When you purchase non-listed Japanese fixed income securities (Japanese government bonds, Japanese municipal bonds, Japanese government guaranteed bonds, Japanese corporate bonds) from CS as a seller, you will be requested to pay the purchase price only.
Recommended