Index-Based Livestock Insurance in Northern Kenya: An Analysis of the Patterns and Determinants of
Purchase(very provisional, initial results!)
Andrew G. Mude and Christopher B. BarrettI4 Meetings, Rome
June 14, 2012


• Arid and semi-arid lands (ASAL) cover ~ 2/3 of Africa, home to ~20mn pastoralists, who rely on extensive livestock grazing
• ASAL residents confront harsh and volatile environments
• Livelihoods are primarily transhumant pastoralism
• Pastoralist systems are adapted to variable climate, but very vulnerable to severe drought events. Big herd losses cause humanitarian crises, such as the 2011 headline event in East Africa (esp. famine in parts of Somalia).
ASAL, Pastoralists and Vulnerability
Marsabit
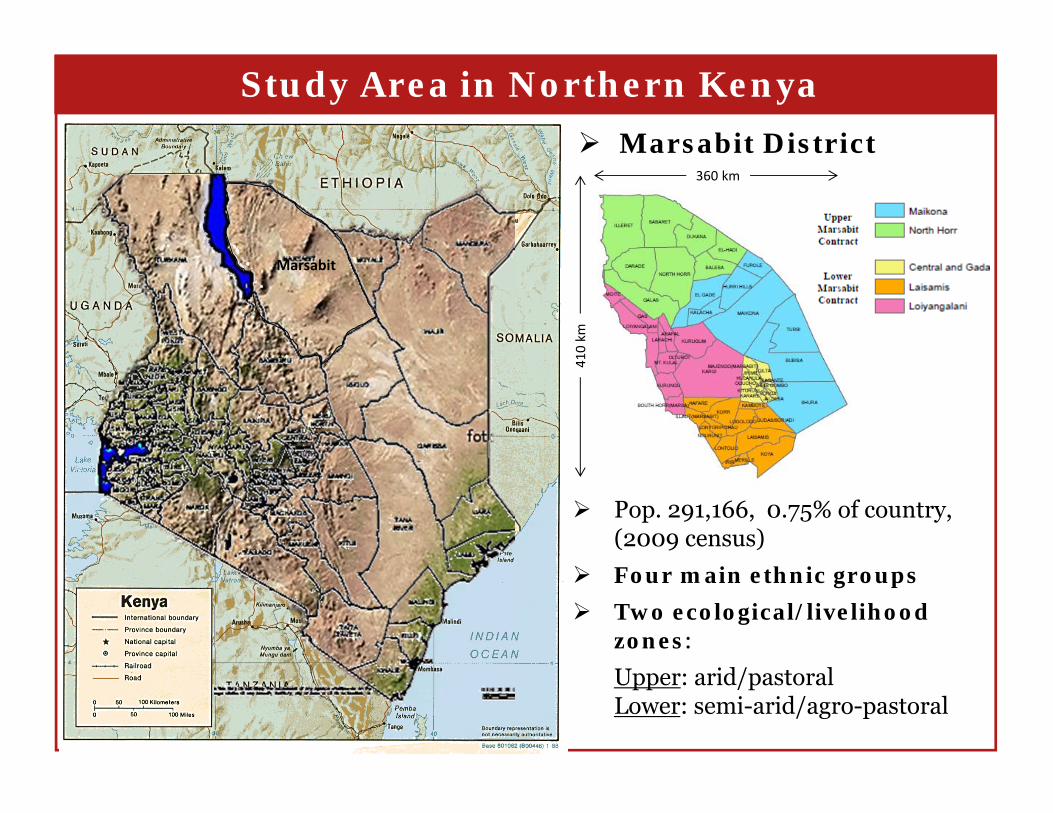
Study Area in Northern Kenya
360 km
410 km
Pop. 291,166, 0.75% of country, (2009 census)
Four main ethnic groups Two ecological/livelihood
zones: Upper: arid/pastoralLower: semi-arid/agro-pastoral
Marsabit District

Cause of Livestock MortalityComponent Shares of Income
• Drought is by far the leading cause of livestock mortality
• Disease and Predation likely to be directly related to drought
• Sale of livestock and livestock products constitute 40% of household income
• External support (food and cash) make up nearly 25% of household income
a
Livestock Share of Productive Assets (Median 100%, Mean 49%)Data source: Project baseline 2009 (924 Marsabit Households)
Northern Kenya: Context for IBLI

Risk of livestock losses based on ALRMP (2000-2010)• Droughts are main cause of catastrophic livestock losses (≥20%)• Livestock losses from droughts are highly covariate, in contrast to
other, smaller, idiosyncratic shocks (predation, accident, disease, etc.) in other years
• Key drought years in sample: 2000, 2005-06, 2009• Drought-related catastrophic herd losses are largely uninsured!
Northern Kenya: Context for IBLI
0%
10%
20%
30%
40%
50%
60%
70%
2000 2001 2002 2003 2004 2005 2006 2007 2008 2009 2010
North Horr
Kalacha
Maikona
Logologo
Korr
Karare
Ngurunit
Seasonal Location Aggregate Livestock Mortality (%)

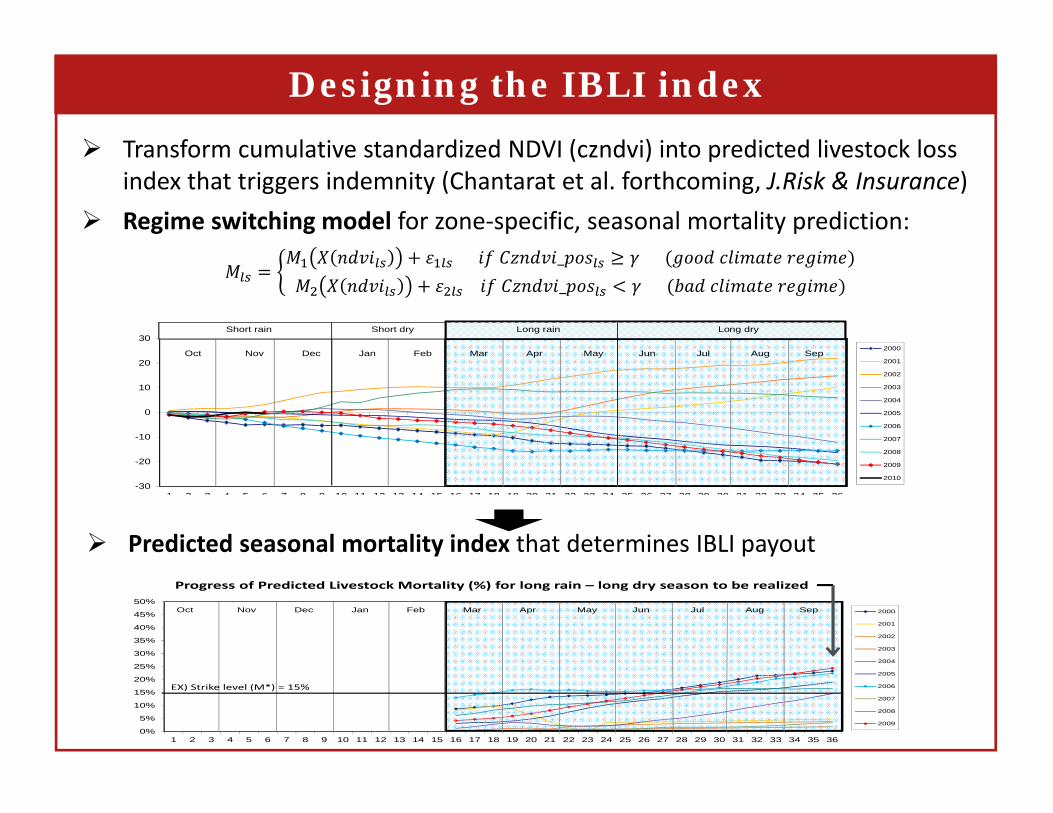
Designing the IBLI index
Normalized difference vegetation index (NDVI) from MODIS sensor
• Indication of availability of vegetation over rangelands(reflecting joint state of weather realizations and stocking rates)
• Spatiotemporally rich(1x1 km2 resolution, available in near-real time every 16 days from 2001- present)
Normal year (May 2007) Drought year (May 2009)
Need to find a reliable, objectively verifiable, covariate signal, , that explains variation in household’s seasonal livestock mortality
DATA• Livestock Mortality (ALRMP)• NDVI (MODIS)
Response FunctionIndex• Predicted Livestock Mortality
2. NDVI‐based Predicted Livestock Mortality Index constructed from household data to minimize basis risk
Transform cumulative standardized NDVI (czndvi) into predicted livestock loss index that triggers indemnity (Chantarat et al. forthcoming, J.Risk & Insurance)
Regime switching model for zone‐specific, seasonal mortality prediction: _ _
-30
-20
-10
0
10
20
30
1 2 3 4 5 6 7 8 9 10 11 12 13 14 15 16 17 18 19 20 21 22 23 24 25 26 27 28 29 30 31 32 33 34 35 36
2000
2001
2002
2003
2004
2005
2006
2007
2008
2009
2010
Oct Nov Dec Jan Feb Mar Apr May Jun Jul Aug Sep
Short rain Short dry Long rain Long dry
spreTd
dss zndvipreCzndvi _
sposTd
dss zndviposCzndvi _
sTd
dss zndviMinCNzndvi )0,(
spreTd
dss zndvipreCzndvi _
constructed from
spreTd
dss zndvipreCzndvi _
sposTd
dss zndviposCzndvi _
sTd
dss zndviMinCNzndvi )0,(
spreTd
dss zndvipreCzndvi _
constructed from Predicted seasonal mortality index that determines IBLI payout
0%
5%
10%
15%
20%
25%
30%
35%
40%
45%
50%
1 2 3 4 5 6 7 8 9 10 11 12 13 14 15 16 17 18 19 20 21 22 23 24 25 26 27 28 29 30 31 32 33 34 35 36
2000
2001
2002
2003
2004
2005
2006
2007
2008
2009
Oct Nov Dec Jan Feb Mar Apr May Jun Jul Aug Sep
Progress of Predicted Livestock Mortality (%) for long rain – long dry season to be realized
EX) Strike level (M*) = 15%
Designing the IBLI index
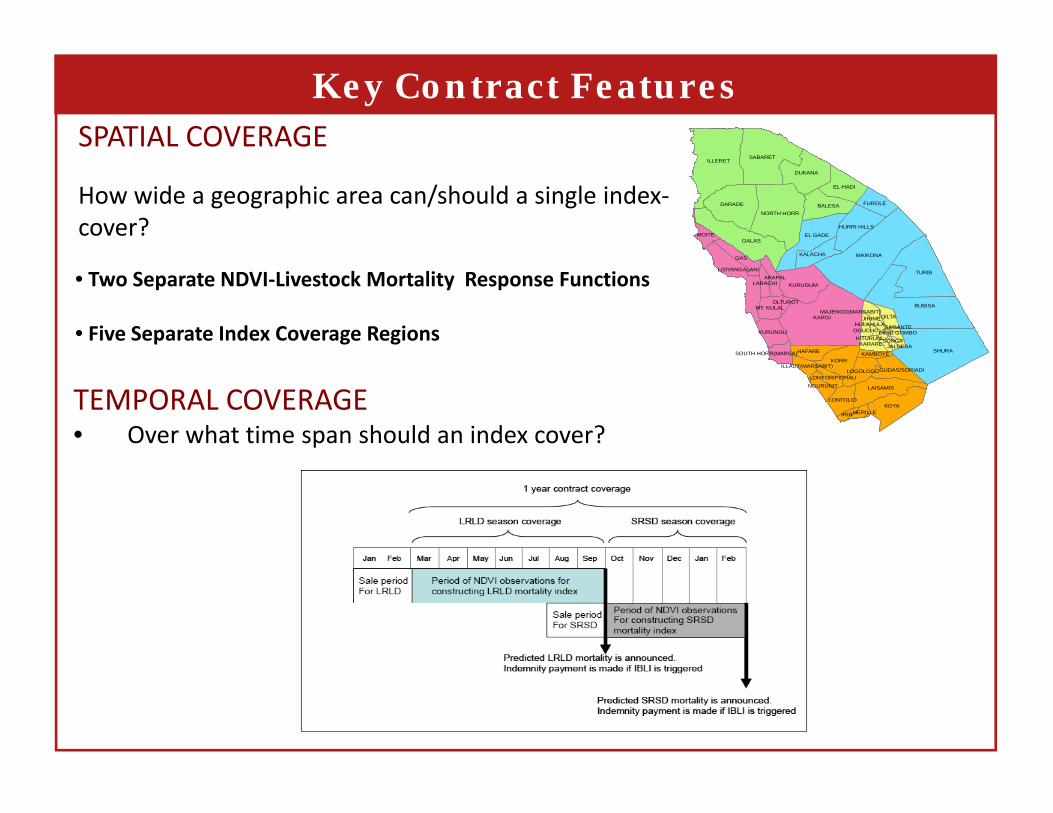
SPATIAL COVERAGE
How wide a geographic area can/should a single index‐cover?
• Two Separate NDVI‐Livestock Mortality Response Functions
• Five Separate Index Coverage RegionsKARGI
SHURA
MAIKONA
BUBISA
TURBI
ILLERET
GALAS
SABARET
KOYA
DARADE
NORTH HORR
DUKANA
EL GADE
KORR
KURUGUM
BALESA
LAISAMIS
EL-HADI
FUROLE
KALACHA
HAFARE
GAS
HURRI HILLS
LOIYANGALANI
KURUNGU
LONTOLIO
ARAPAL
LOGOLOGO
QILTA
MT. KULAL
MOITE
GUDAS/SORIADI
KARARE
IRIR
NGURUNIT
LARACHI
KAMBOYESOUTH HORR(MARSA)
LONYORIPICHAU
SONGA
MERILLE
ILLAUT(MARSABIT)
HULAHULA
MAJENGO(MARSABIT)
OGUCHO
OLTUROT
JALDESAKITURUNI
DIRIB GOMBO
JIRIME
SAGANTE
Designing the IBLI indexTEMPORAL COVERAGE• Over what time span should an index cover?
Key Contract Features

Predicted Mortality Index Readings

Impact Evaluation: Two-Way Stratification Design
Site selection: 16 locationsConfounding factor: ongoing implementation of cash transfer (HSNP)
• Randomly select 50% from locations with and without HSNP
Encouragement design• Insurance education game: played among 50% sample in game site• Discount coupon for 1st 15 TLU insured: (no subsidy for 40% of sample,
10%-60% subsidies for the rest)
Sample selection: 924 households • Sample/site proportional to relative pop. sizes• For each site, random sampling stratified by livestock wealth class (L, M, H)
KARGI
SHURA
MAIKONA
BUBISA
TURBI
ILLERET
GALAS
SABARET
KOYA
DARADE
NORTH HORR
DUKANA
EL GADE
KORR
KURUGUM
BALESA
LAISAMIS
EL-HADI
FUROLE
KALACHA
HAFARE
GAS
HURRI HILLS
LOIYANGALANI
KURUNGU
LONTOLIO
ARAPAL
LOGOLOGO
QILTA
MT. KULAL
MOITE
GUDAS/SORIADI
KARARE
IRIR
NGURUNIT
LARACHI
KAMBOYESOUTH HORR(MARSA)
LONYORIPICHAU
SONGA
MERILLE
ILLAUT(MARSABIT)
HULAHULA
MAJENGO(MARSABIT)
OGUCHO
OLTUROT
JALDESAKITURUNI
DIRIB GOMBO
JIRIME
SAGANTE
HSNP, IBLI Game
HSNP, No IBLI Game
No HSNP, IBLI Game
No HSNP, No IBLI Game
IBLI Game
No IBLI Game
HSNP 4 sites 4 sites
No HSNP 4 sites 4 control sites

Research Question• What are the determinants of household demand for IBLI? (price sensitivity, wealth,
herd size, education, product understanding, risk aversion, credit access, livelihood diversification, trust…)
Existing Literature
New (?) Contributions to Existing Literature• Considering asset risk while prior products concern income risk
• Basis risk controls; hypotheses of spatial and intertemporal adverse selection
• Setting is characterized by non‐convex asset accumulation dynamics (which could determine household’s valuation of IBLI, Chantarat et al. working paper)
Authors Product Results
Bryan 2010 Insured loan Malawi Uptake ↓ ambiguity aversion
Cole et al. 2010 Rainfall Insurance India Uptake ↑ literacy and trust, ↓ price, credit constraints
Cole et al. 2007 Rainfall Insurance India Uptake ↑ wealth, edu, risk aversion, ↓ price
Gine et al. 2008 Rainfall Insurance India Uptake ↑ wealth, trust, ↓ risk aversion, credit constraints
Gine and Yang 2007 Insured loan Malawi Lower uptake of insured loan than loan
Hill et al. 2011 Rainfall Insurance Ethiopia Uptake ↑ edu, wealth, ↓ risk aversion
Determinants of IBLI Demand
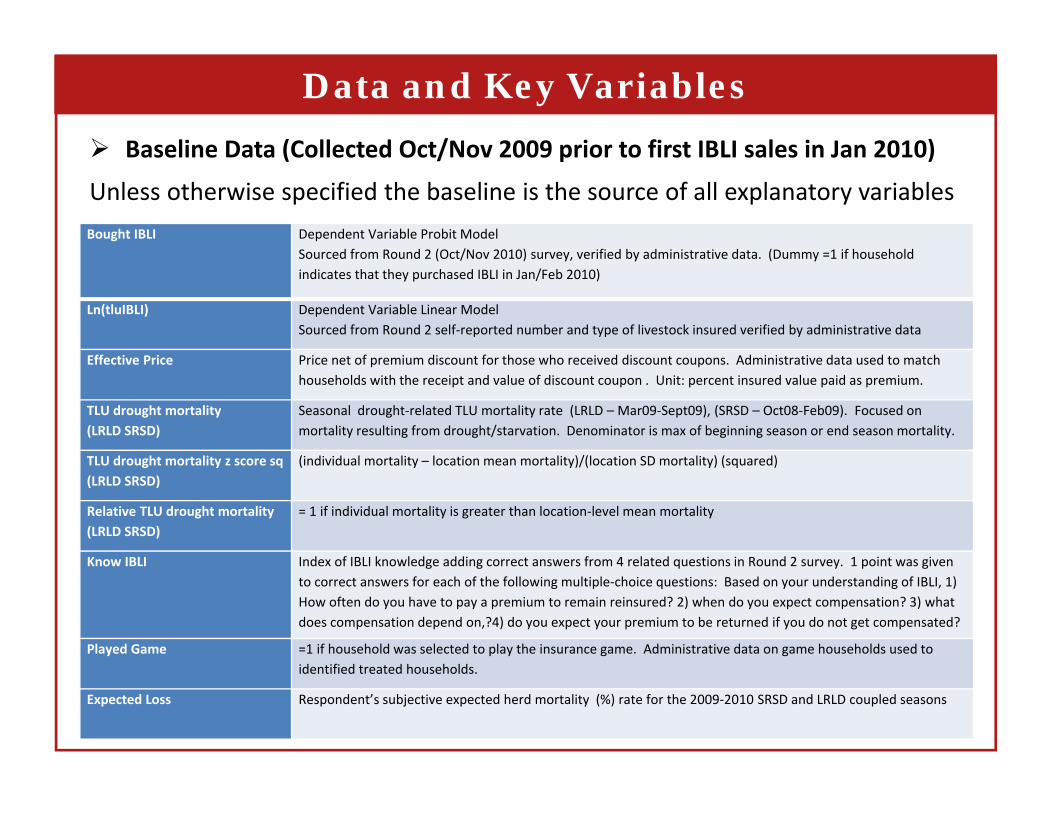
Data and Key Variables
Baseline Data (Collected Oct/Nov 2009 prior to first IBLI sales in Jan 2010)
Unless otherwise specified the baseline is the source of all explanatory variablesBought IBLI Dependent Variable Probit Model
Sourced from Round 2 (Oct/Nov 2010) survey, verified by administrative data. (Dummy =1 if household indicates that they purchased IBLI in Jan/Feb 2010)
Ln(tluIBLI) Dependent Variable Linear ModelSourced from Round 2 self‐reported number and type of livestock insured verified by administrative data
Effective Price Price net of premium discount for those who received discount coupons. Administrative data used to match households with the receipt and value of discount coupon . Unit: percent insured value paid as premium.
TLU drought mortality (LRLD SRSD)
Seasonal drought‐related TLU mortality rate (LRLD – Mar09‐Sept09), (SRSD – Oct08‐Feb09). Focused on mortality resulting from drought/starvation. Denominator is max of beginning season or end season mortality.
TLU drought mortality z score sq(LRLD SRSD)
(individual mortality – location mean mortality)/(location SD mortality) (squared)
Relative TLU drought mortality (LRLD SRSD)
= 1 if individual mortality is greater than location‐level mean mortality
Know IBLI Index of IBLI knowledge adding correct answers from 4 related questions in Round 2 survey. 1 point was given to correct answers for each of the following multiple‐choice questions: Based on your understanding of IBLI, 1) How often do you have to pay a premium to remain reinsured? 2) when do you expect compensation? 3) what does compensation depend on,?4) do you expect your premium to be returned if you do not get compensated?
Played Game =1 if household was selected to play the insurance game. Administrative data on game households used to identified treated households.
Expected Loss Respondent’s subjective expected herd mortality (%) rate for the 2009‐2010 SRSD and LRLD coupled seasons
Data and Key Variables
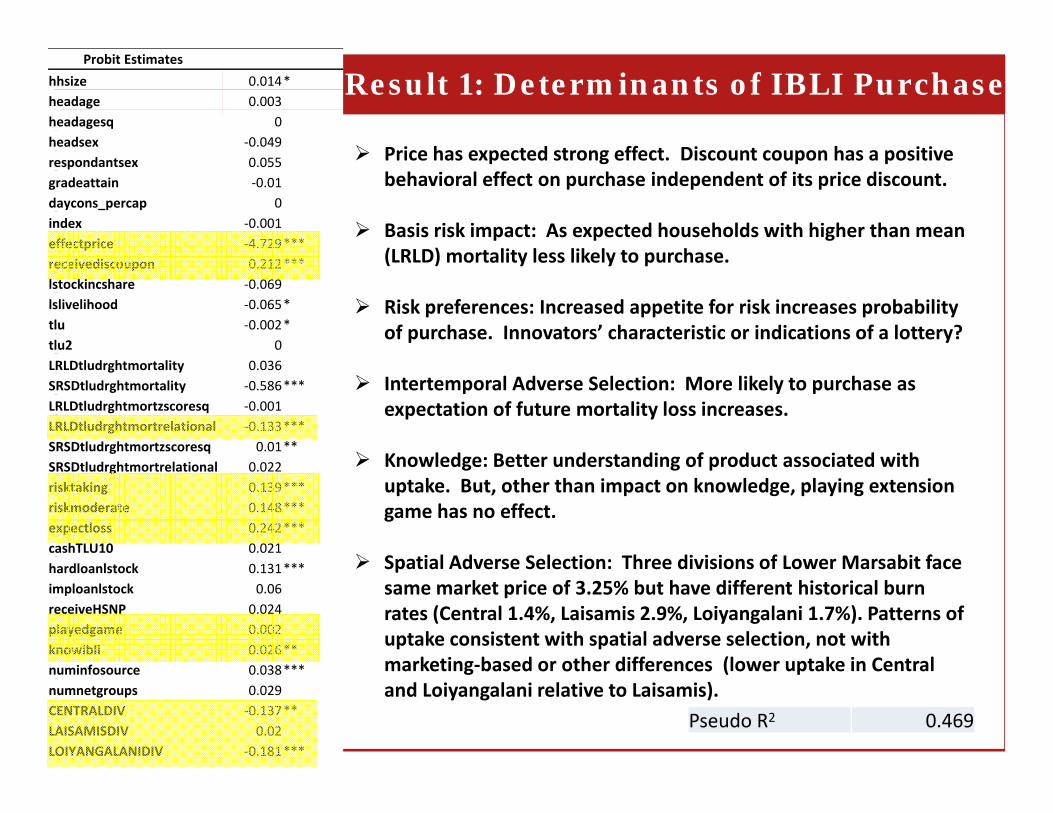
Probit Estimateshhsize 0.014*headage 0.003headagesq 0headsex ‐0.049respondantsex 0.055gradeattain ‐0.01daycons_percap 0index ‐0.001effectprice ‐4.729***receivediscoupon 0.212***lstockincshare ‐0.069lslivelihood ‐0.065*tlu ‐0.002*tlu2 0LRLDtludrghtmortality 0.036SRSDtludrghtmortality ‐0.586***LRLDtludrghtmortzscoresq ‐0.001LRLDtludrghtmortrelational ‐0.133***SRSDtludrghtmortzscoresq 0.01**SRSDtludrghtmortrelational 0.022risktaking 0.139***riskmoderate 0.148***expectloss 0.242***cashTLU10 0.021hardloanlstock 0.131***imploanlstock 0.06receiveHSNP 0.024playedgame 0.002knowibli 0.026**numinfosource 0.038***numnetgroups 0.029CENTRALDIV ‐0.137**LAISAMISDIV 0.02LOIYANGALANIDIV ‐0.181***
Price has expected strong effect. Discount coupon has a positive behavioral effect on purchase independent of its price discount.
Basis risk impact: As expected households with higher than mean (LRLD) mortality less likely to purchase.
Risk preferences: Increased appetite for risk increases probability of purchase. Innovators’ characteristic or indications of a lottery?
Intertemporal Adverse Selection: More likely to purchase as expectation of future mortality loss increases.
Knowledge: Better understanding of product associated with uptake. But, other than impact on knowledge, playing extension game has no effect.
Spatial Adverse Selection: Three divisions of Lower Marsabit face same market price of 3.25% but have different historical burn rates (Central 1.4%, Laisamis 2.9%, Loiyangalani 1.7%). Patterns of uptake consistent with spatial adverse selection, not with marketing‐based or other differences (lower uptake in Central and Loiyangalani relative to Laisamis).
Result 1: Determinants of IBLI Purchase
Pseudo R2 0.469

Dep var : ln (total TLU insured) lneffectprice ‐0.7064***lnmonthpcincome 0.0823tlu 0.0146**tlu2 ‐0.0002*receivediscoupon 0.2734**knowibli 0.0104receiveHSNP 0.0981cashTLU10 0.3608**CENTRALDIV 0.4574**LAISAMISDIV ‐0.0522LOIYANGALANIDIV ‐0.5316***_cons ‐2.7105***
r2 0.404N 221
Result 2: IBLI Demand Elasticity Estimates
Demand seems relatively price inelastic (surprisingly).
Considerable and statistically significant behavioral effect of discount coupon receipt, independent of price
Financial liquidity: measured as a dummy = 1 if household indicates sufficient cash savings to purchase 10 TLU worth of IBLI, matters to quantity demanded. But cash transfer (HSNP) receipts do not.
Herd size: very modest increase up to ~mean+1 SD. Only weakly consistent w/ poverty trap hyp.
No effect of knowledge of IBLI, nor of income

Provisional Summary Findings
Demand for IBLI in Marsabit, Kenya pilot appears:
‐ Reinforce prior index insurance studies’ findings on:‐ price effects (price inelastic demand)‐ risk preference effects‐ wealth effects‐ financial liquidity effects
‐ More novel: ‐ behavioral effects from promotional coupons but not from game exposure
‐ associated with superior understanding of product‐ negatively associated with a proxy for basis risk‐ perhaps some intertemporal and spatial adverse selection

Thank you for your time, interest and comments!
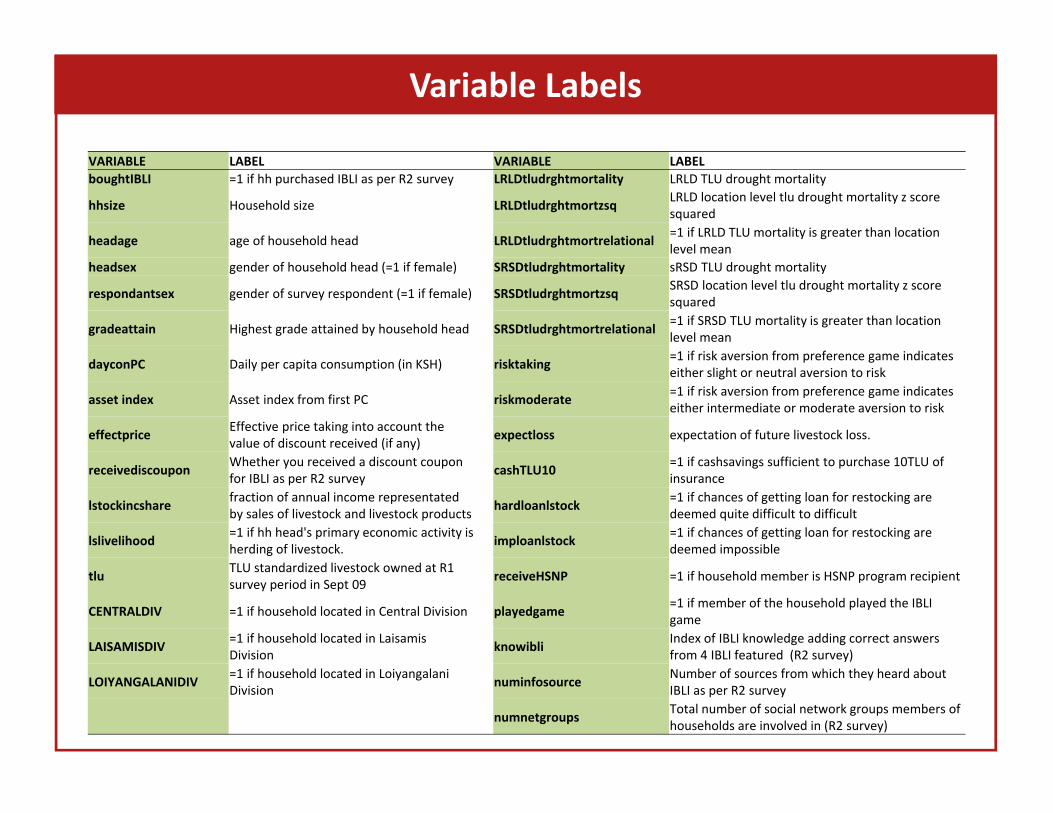
VARIABLE LABEL VARIABLE LABELboughtIBLI =1 if hh purchased IBLI as per R2 survey LRLDtludrghtmortality LRLD TLU drought mortality
hhsize Household size LRLDtludrghtmortzsq LRLD location level tlu drought mortality z score squared
headage age of household head LRLDtludrghtmortrelational =1 if LRLD TLU mortality is greater than location level mean
headsex gender of household head (=1 if female) SRSDtludrghtmortality sRSD TLU drought mortality
respondantsex gender of survey respondent (=1 if female) SRSDtludrghtmortzsq SRSD location level tlu drought mortality z score squared
gradeattain Highest grade attained by household head SRSDtludrghtmortrelational =1 if SRSD TLU mortality is greater than location level mean
dayconPC Daily per capita consumption (in KSH) risktaking =1 if risk aversion from preference game indicates either slight or neutral aversion to risk
asset index Asset index from first PC riskmoderate =1 if risk aversion from preference game indicates either intermediate or moderate aversion to risk
effectprice Effective price taking into account the value of discount received (if any) expectloss expectation of future livestock loss.
receivediscoupon Whether you received a discount coupon for IBLI as per R2 survey cashTLU10 =1 if cashsavings sufficient to purchase 10TLU of
insurance
lstockincshare fraction of annual income representated by sales of livestock and livestock products hardloanlstock =1 if chances of getting loan for restocking are
deemed quite difficult to difficult
lslivelihood =1 if hh head's primary economic activity is herding of livestock. imploanlstock =1 if chances of getting loan for restocking are
deemed impossible
tlu TLU standardized livestock owned at R1 survey period in Sept 09 receiveHSNP =1 if household member is HSNP program recipient
CENTRALDIV =1 if household located in Central Division playedgame =1 if member of the household played the IBLI game
LAISAMISDIV =1 if household located in Laisamis Division knowibli Index of IBLI knowledge adding correct answers
from 4 IBLI featured (R2 survey)
LOIYANGALANIDIV =1 if household located in Loiyangalani Division numinfosource Number of sources from which they heard about
IBLI as per R2 survey
numnetgroups Total number of social network groups members of households are involved in (R2 survey)
Variable Labels
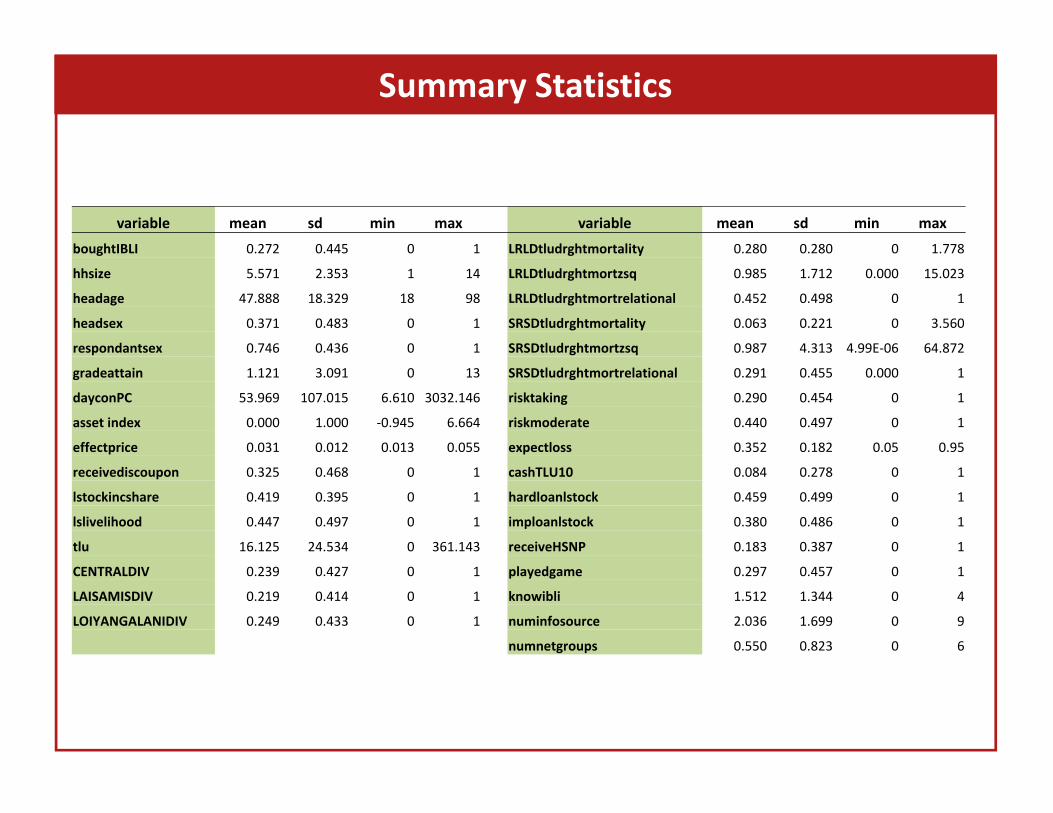
variable mean sd min max variable mean sd min max
boughtIBLI 0.272 0.445 0 1 LRLDtludrghtmortality 0.280 0.280 0 1.778
hhsize 5.571 2.353 1 14 LRLDtludrghtmortzsq 0.985 1.712 0.000 15.023
headage 47.888 18.329 18 98 LRLDtludrghtmortrelational 0.452 0.498 0 1
headsex 0.371 0.483 0 1 SRSDtludrghtmortality 0.063 0.221 0 3.560
respondantsex 0.746 0.436 0 1 SRSDtludrghtmortzsq 0.987 4.313 4.99E‐06 64.872
gradeattain 1.121 3.091 0 13 SRSDtludrghtmortrelational 0.291 0.455 0.000 1
dayconPC 53.969 107.015 6.610 3032.146 risktaking 0.290 0.454 0 1
asset index 0.000 1.000 ‐0.945 6.664 riskmoderate 0.440 0.497 0 1
effectprice 0.031 0.012 0.013 0.055 expectloss 0.352 0.182 0.05 0.95
receivediscoupon 0.325 0.468 0 1 cashTLU10 0.084 0.278 0 1
lstockincshare 0.419 0.395 0 1 hardloanlstock 0.459 0.499 0 1
lslivelihood 0.447 0.497 0 1 imploanlstock 0.380 0.486 0 1
tlu 16.125 24.534 0 361.143 receiveHSNP 0.183 0.387 0 1
CENTRALDIV 0.239 0.427 0 1 playedgame 0.297 0.457 0 1
LAISAMISDIV 0.219 0.414 0 1 knowibli 1.512 1.344 0 4
LOIYANGALANIDIV 0.249 0.433 0 1 numinfosource 2.036 1.699 0 9
numnetgroups 0.550 0.823 0 6
Summary Statistics
Recommended