A Work Project presented as part of the requirements for the Award of Masters Degree in Management from NOVA – School of Business and Economics
IN-STORE SERVICES: UNDERSTANDING THE COMPETITIVE LANDSCAPE IN EUROPE
14119 | MARIA FRANCISCA LOPES PINTO DE FIGUEIREDO OLIVEIRA
A Project carried out on the Masters Degree in Management, under the supervision of: Constança Casquinho
20th May, 2016

2
IN-STORE SERVICES: UNDERSTANDING THE COMPETITIVE LANDSCAPE IN EUROPE
Abstract Private labels have changed the landscape of the retail industry, either in terms of customers’
preferences, retailers’ business models, manufacturers, and their relationships. Europe has been
considered a successful market regarding the penetration of store brands, which questions whether
Daymon Worldwide, whose core business is the strategic development and branding of private labels,
is able to add value to this continent. In this paper, the in-store environment of Portuguese and Spanish
retailers is analyzed, as well as execution and customer engagement services being offered in the
market, to develop six go-to-market strategies that two business units (SAS and Interaction) could
include in their portfolio as a first step for Daymon to prove its competencies and penetrate Europe.
Keywords: Daymon Worldwide, in-store services, customer engagement, execution, go-to-market
strategy, retail business
3
Table of Contents
ABSTRACT 2
BRIEF CONTEXT 4 MARKET OVERVIEW 4 GLOBAL OVERVIEW 4 PORTER’S 5 FORCES ANALYSIS 5 THE BUSINESS PROJECT CHALLENGE 9
REFLECTION ON THE WORK DONE 9 METHODOLOGY 10 HYPOTHESIS 10 METHODOLOGY 10 ANALYSIS 10
PERSONAL REFLECTIONS 26 PERSONAL EXPERIENCE 26 SELF-DEVELOPMENT PLAN 28
APPENDIX 29
REFERENCES 53
4
Brief Context Client Peter Daymon Schwartz and Milt Sender founded Daymon Worldwide (DW) in 1970 with two very
specific, innovative and pioneer visions at that time: first to maximize the market potential of private
brands; secondly, to help their partners to strategically develop their own brands and capture value
from it with sustainable sales (DW, 2016). In fact, these two visionaries recognized that private labels
were simply viewed as tools to catch-up with manufacturers brands as their potential was not being
fully leveraged. They lacked in terms of proper segmentation, targeting, and a positioning able to
attract and retain customers, resulting in a low differentiation among competing retailers. The years
have passed and “what’s next in retail?” became a fundamental question for DW as it observed and
foreseen changes in the retail industry. Consequently, DW’s portfolio of services has been expanding
from customized private brand development to strategy & branding, sourcing solutions, retail driven
services and consumer experience marketing to anticipate future market trends and, in turn, to better
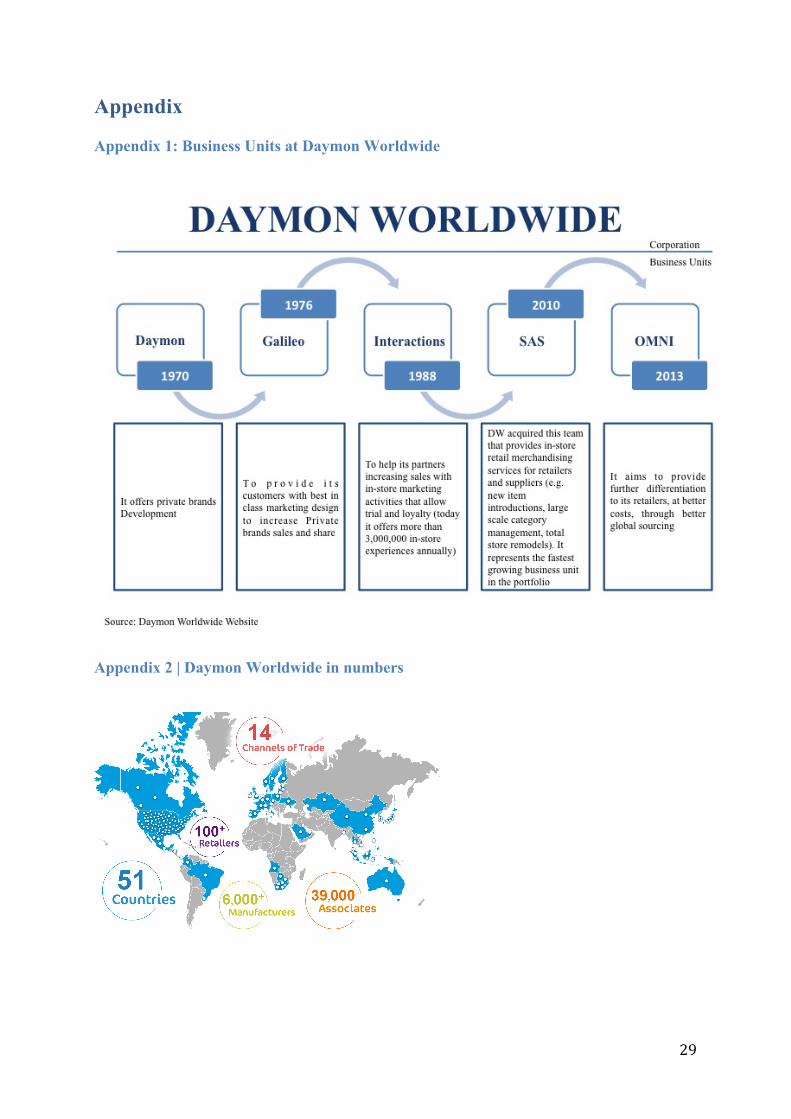
prepare retailers to solve their needs. This expansion to its five business units (Daymon PBD, Galileo,
Interactions, SAS, Omni - Appendix 1) positioned DW as the only company with an array of services
that touches every single aspect of the retail experience with a customized size to each partner:
insights, ideation, development, activation and management. In addition, synergies are created by the
transfer of skills and expertise among the different units, allowing DW to benefit from a stronger
corporate advantage (Porter). Currently, DW is the global leader in consumables retailing. It is present
in 51 countries and it counts with more than 200 offices (Appendix 2).
Market overview
Global Overview
The market of private labels has been under a process of dramatic changes for the last 45 years. If, in
the 1970 retailer brands were called generics for being low-priced and associated with weak quality
nowadays retailers look at them as strategic weapons to increase their margins and as a way to drive
customers’ store choice. In fact, according to a Mckinsey study, retailers own brands’ margins are
typically more than 20% higher than those of similar branded products.
Retailers started pursing distinct strategies regarding their offer of private labels to differentiate from
5
competitors. For instance, some developed a broad portfolio of products from different categories to
have a large representativeness of shelf-space in their own stores. This is the case of discounters as
Lidl that also offers different tiers from lower to higher quality and where there is little endorsement of
the insignia of the store. Others, as Pingo Doce in Portugal, decided to develop strategically one tier
that uses the store’s insignia competing with its suppliers on the shelves. Across categories, customers
can find here a consistent level value for money to leverage a positive perception and association of
both the store and every product displaying the Pingo Doce brand.
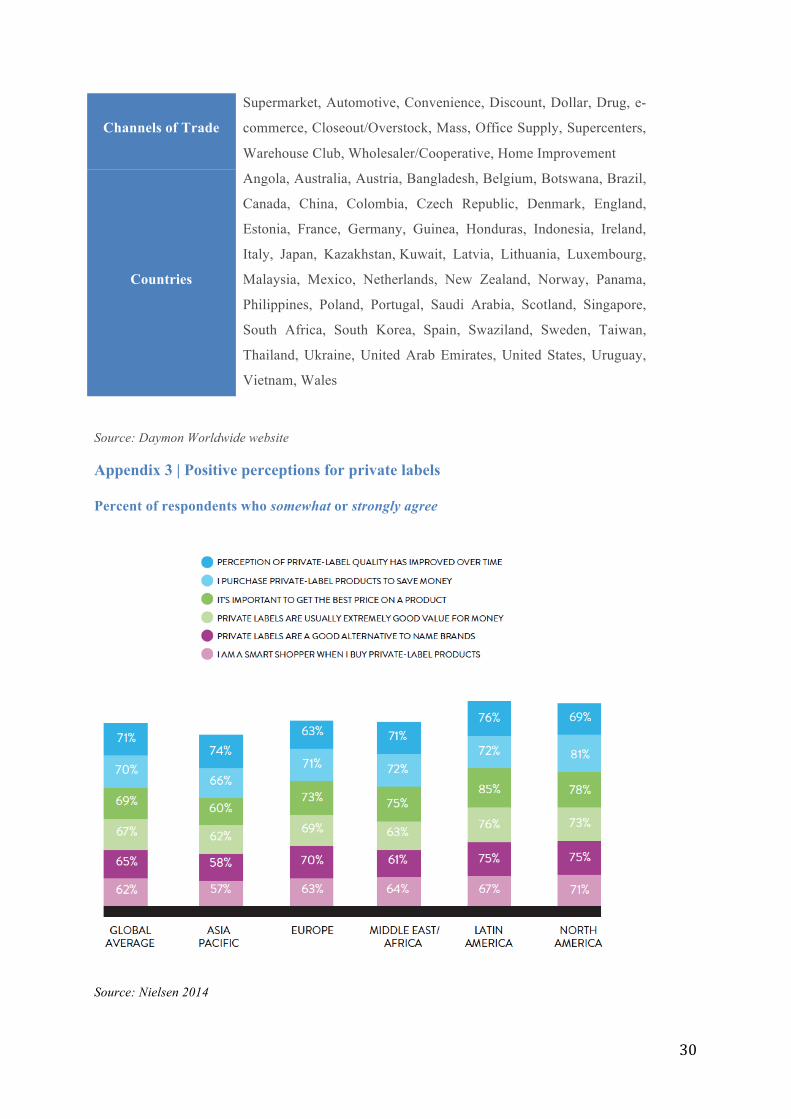
Geographically, although the perception of private labels has improved (Appendix 3), its market share
distribution is not equally divided worldwide. North America, Australia and Europe represent the most
developed regions where the expansion and consolidation of the discounters channel have been
fuelling the penetration of the market for private brands. In contrast, Asian and Middle East consumers
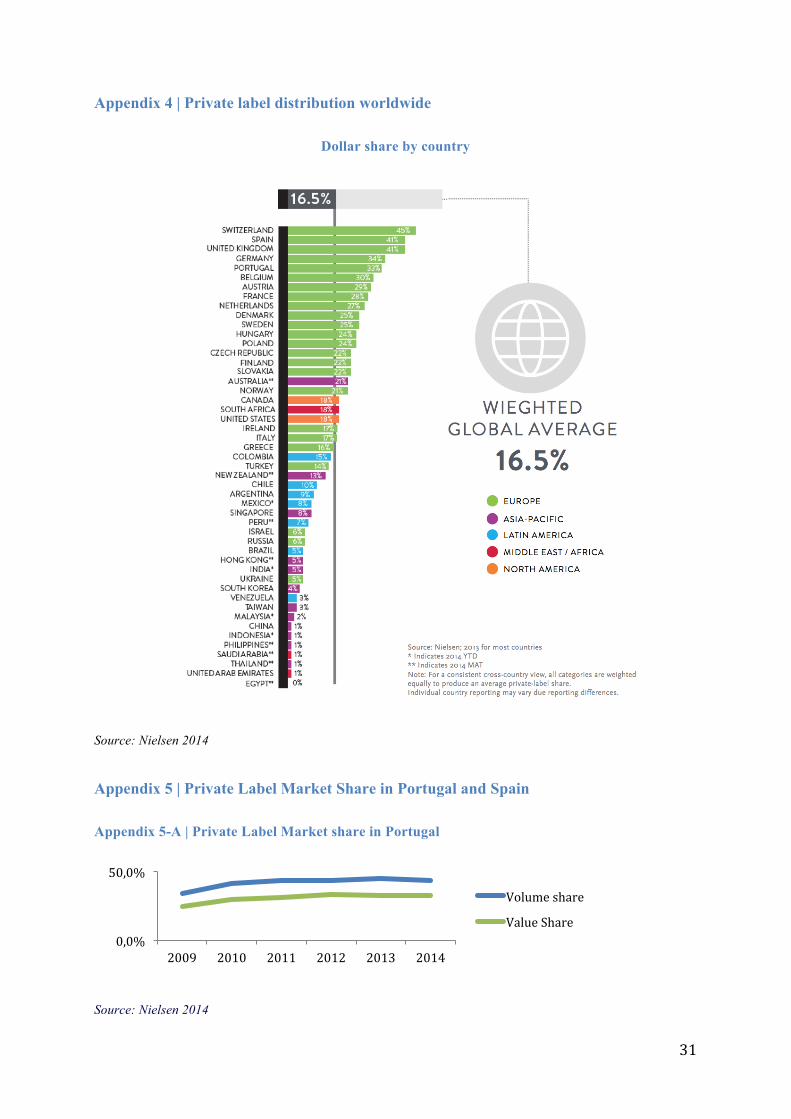
are strongly loyal to their brands, showing a higher resistance to change. Narrowing to Europe, the
penetration is still heterogeneous: the highest values of share are observed on the West while the East
presents lower values ranging from 24% to 5% (Appendix 4).
Porter’s 5 Forces Analysis The model of Porter’s 5 forces analyses the attractiveness of an industry by understanding the ability
of each force to appropriate value from it. In this section, this framework is applied to a segment of the
industry of consumable distributors: the private label distributors in Portugal and Spain.
In Portugal, private labels have presented a positive trend: their market share increased 10% in 5 years
and in 2014 they represented 43.6% of the market of consumable goods (Appendix 5-A) (Nielsen,
2014). However, unless a relevant strategic change occurs, this growth might contract due to two main
reasons. Firstly, with the economic recovery, consumers start valuing more quality, differentiated
flavor and freshness. Secondly, national brands understood that culturally, Portuguese shoppers are
more price sensitive than brand loyal compared to other European countries, incentivizing these
companies to adjust and to start engaging more in price promotions (Euromonitor, 2015).
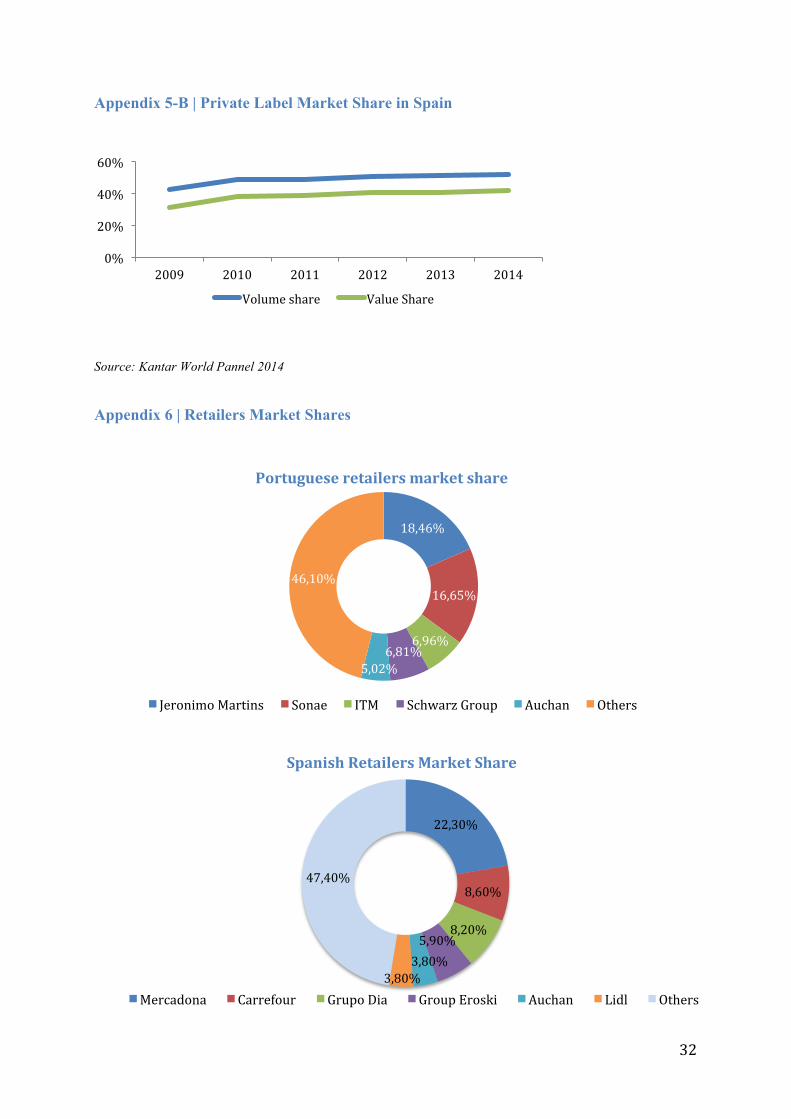
Regarding Spain, the growth rate of the market share of private labels was smaller for the same period,
but in absolute terms higher than in Portugal, reaching 52% of the market in 2014 (Appendix 5-B)
(Nielsen 2014, Kantar 2016). One of the challenges in Spain will be the prospects of economic growth
6
where customers are expected to spend more time socializing outside their homes, benefiting the
foodservice channel in the detriment of retailing (Euromonitor, 2016).
Internal rivalry: This is usually at the inter-store level, where one retailer competes directly with
other retailers that also invest to sell their private labels. In Portugal the two leaders are domestic
chains that together account for nearly 35% of the market (Planet Retail, 2015) and the top five
together for 60%. In Spain, Mercadona leads with 22% while Carrefour, the next biggest player,
accounts only for 8,6%. (Appendix 6) Given the low number of big players, the internal rivalry should
be low and this is correlated with the high penetration of private labels once this business requires a
large scale to pay-off the product innovation, consumer research and marketing to build brand equity.
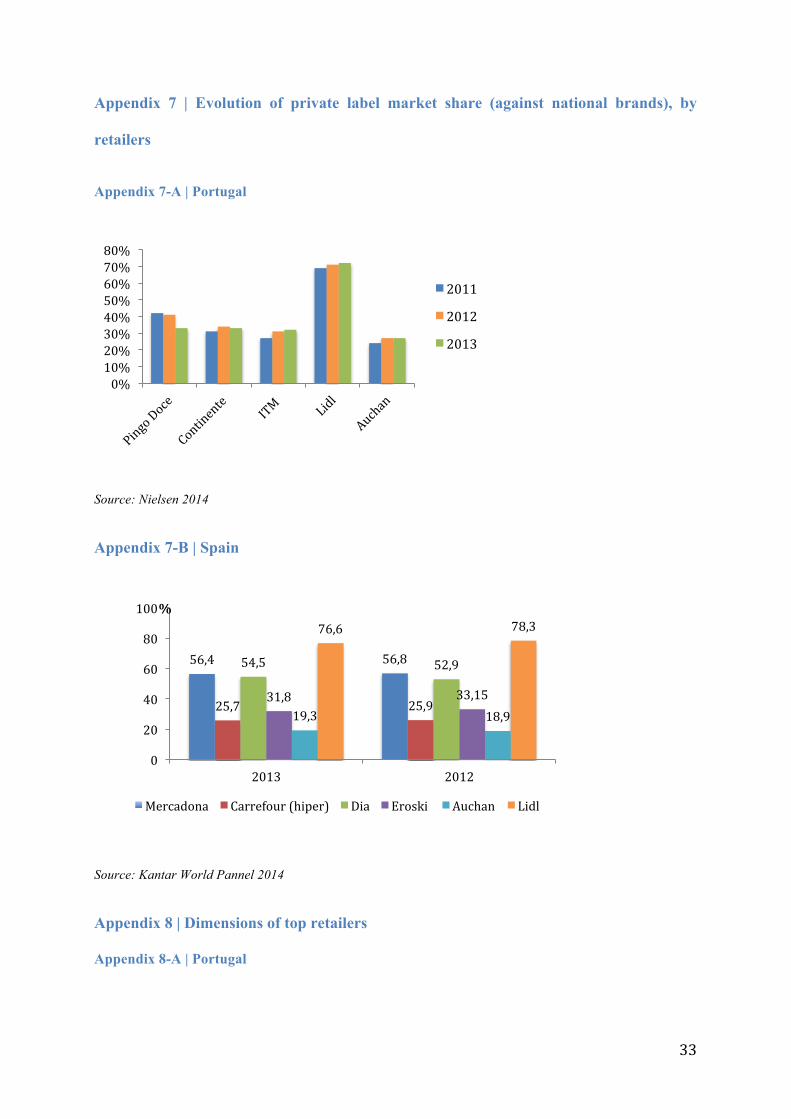
(Nielsen, 2014). However, discounters are expanding and the largest share of their assortment is
composed by their own brands, pressuring competing retailers to increase the value they deliver to
costumers (e.g. Lidl) (Appendix 7 A-B). Overall, internal rivalry is low to moderate in both countries
due to the retail industry’s high concentration but the growth of discounters might increase it.
Threat of new entries: As previously mentioned, since to be competitive private label distributors
retailers need to reach a certain level of scale, the bulky initial investment to a new comer would need
to incur to raise this business represents a huge barrier. Furthermore, brand equity of a private label is
a resource with a path dependency accumulation that gives a competitive advantage for incumbents.
That is, an asset that cannot be instantly acquired, but rather need to be built, and cannot be replicated
just by spending huge sums of money in advertising campaigns (Collis & Montgomery). Thus, overall,
the threat of new entries is low.
Threat of substitutes: This usually occurs as intra-store competition, where within the same selling
space, private and national brands directly compete with each other. In general, the increase in private
labels’ market penetration is translated into a squeeze from small and med-sized brands, while the
category leaders remained their positions (Nielsen, 2014). The switching costs from private to national
brands are relatively low, even though non-tangible benefits are perceived by customers and
significantly differ across categories. On one hand, the national brands usually invest more in
innovation, new launches and marketing activities to increase their brand equity, making customers to
perceive a better quality which pays-off in categories as hair care. On the other hand, price is still a
7
criterion that shoppers use to chose whether to purchase private or national brands within other
categories. In fact, private labels have been more successful in commodity products where customers
perceive little differentiation and an opportunity to save money, as the case of milk (Nielsen, 2014).
Overall, the threat of substitutes seems to be high, but a closer look shows that this might significantly
vary from category to category which suggests, at least, two possible future scenarios. Firstly, one
where private labels change their strategies to be perceived as closer substitutes to national brands, due
to a visible higher investment in innovation, for instance. Secondly, one scenario where the market
observes a higher specialization of portfolio of products of consumable producers: national brands
expanding and focusing on categories where differentiation is more valued and disinvesting in
commodity categories to leave this share for private labels.
Bargaining power of buyers: Overall, since the concentration of the distributors is higher than the
one of buyers this leaves the latter with a relatively low bargaining power.
Bargaining power of suppliers: Distributors of private labels have usually two types of suppliers: for
raw materials and for competencies. Regarding the former one, the bargaining power is balanced.
Each retailer with a large market share might represent an important client for that supplier and if not
satisfied with the agreed conditions, more suppliers can be found, both nationally or internationally,
which attributes negotiation power to retailers. Additionally, these suppliers have also the possibility
to sell their raw materials to both national and international retailers, which gives them some power
too. However, the group of suppliers of competencies shows a higher bargaining power since retailers
usually have knowledge and expertise in terms of distribution when they sell their space for national
brands to reach the final demand, but not to develop their own products. Farther, developing these
competencies internally can be very costly and take too long, leaving retailers to lose their
opportunities (Mckinsey, 2013). This group of suppliers is usually called third party providers and it
includes companies with expertise in marketing and branding, an established network of producers to
source their operations, market research companies to understand the features and specifications their
final clients value, among others. This third party providers market is very fragmented in the sense
that each company is usually very specialized in one limited area (e.g. marketing and IT services) and
finding the right stable partner for a long-term relationship is usually difficult. Overall the bargaining
8
power of suppliers is expected to be moderate to high.
In conclusion, private labels compose a segment of the consumables market that increased in the
recent past and with potential for future growth under proper strategies. In fact, the economic
downturn in both countries boosted these goods. Financial pressures forced many consumers to trade
down, and many found the quality gap between national and private labels not as big as previously
perceived (Nielsen, 2014).
Current client situation
According to DW, while European retailers are keen when buying Americans outperform at selling.
In other words, when looking at North American stores the level of effectiveness of merchandising,
demos and customer engagement is very high. However, the negotiation and purchasing conditions
and the American middleman in the process are much more complex and costly than in Europe. Thus,
the services DW offers to both continents are differently needed and valued by the business partners.
Another geographical difference is felt in the value added that potential clients perceive they could get
from DW, which is translated into different levels of effort and speed to sell their services. As one top
managers stated “What we have been doing in Europe is actually the hardest work: we are trying to
sell the hardest services that we could sell to Europeans because when you come to Europe and you
try to tell that you want to help their private brand they say <<what are you and your American
company going to teach me about private brands when out of the 20 top countries in private brands 18
are European?>>”. However “when we try to talk about anything that has to do with Interactions or
retail direct services they are really interested but the key question they pose afterwards is <<where
are you running presently in Europe?>>”. In fact, its presence in Portugal plays a strategic role: while
the office in Lisbon is the European resource center, the pilot project DW is running with Jerónimo
Martins is critical to prove potential clients about its competencies with tangible results.
In conclusion, the success of the DW’s situation in Portugal is, then, key for the company to penetrate
the rest of Europe with its portfolio of services. For this, DW feels that guidance on existing
opportunities, prioritization and the learning of the current best practices are needed.
9
The Business Project challenge In this context, the challenge of the business project (BP) was not to propose a solution for a weakness
or to an existing problem but to explore potential ways to capitalize from an existing opportunity. This
opportunity was the expansion of the services portfolio of two business units, Interactions and SAS, in
the untapped market of in-store services regarding execution and customer engagement, in Portugal
and Spain.
Reflection on the Work Done Problem definition The ultimate goal of this project was to provide DW with recommendations of detailed go-to-market
strategies in Portugal and in Spain and regarding new services that could serve grocery retailers
specifically in terms of in-store execution and customer engagement. On one hand, in-store execution
involves all aspects of moving a product since its delivery to a shelf, ready to be bought by shoppers,
at the right time and space. On the other hand, in-store customer engagement includes all marketing
and sales activities that aim to interact with shoppers in order to build brand awareness, increase their
loyalty and to persuade them, more or less consciously, to purchase a good.
The scope of the BP was of paramount interest for DW due to three main reasons. Firstly because in-
store services are one of the fastest growing businesses within the retail industry. Secondly, because
the expansion to in-store services can complement the existing services of DW while leveraging
existing competences and relations with both retailers and manufacturers. Finally, it would move the
company closer to final customers, which, in turn, would open the possibility to gather more and better
information of the market to fuel its internal strategies.
As a note, although DW has an exclusive contract with Jerónimo Martins in Portugal the scope of this
BP was to analyse a scenario where this was not a constraint, meaning that the new recommended
services could serve retailers that directly compete with this existing client.
10
Methodology
Hypothesis
This project had four hypotheses: I. There is an untapped market for in-store execution services to be
offered by third party providers; II. There is an untapped market for in-store customer engagement
services to be offered by third party providers; III. DW can expand its portfolio of services to in-store
execution; IV. DW can expand its portfolio of services to in-store customer engagement.
As further explained, none of the four hypotheses was rejected and, consequently, six
recommendations were proposed to the company aiming to add value to DW’s partners by either
increasing their potential sales or by reducing their costs, while capturing profits with it.
Methodology
In order to achieve its final goal, the project was divided into four main phases that lasted, in total,
three months. In an early stage, the side of potential clients for the recommended services was
analysed: first to understand the main players that should be selected and, secondly, to conduct a field
research regarding their in-store services. In the second phase, the analysis moved from the potential
clients’ field to the potential competitors of Interactions and SAS, where the market of third party
service providers (3PP) was researched with a benchmark analysis. In a third phase, a gap analysis
was conducted based on the information collected in the two previous phases. In the last phase, after a
brainstorming session, six go-to-market strategies were developed in order to close existing gaps in the
market. In sum, the two first phases aimed to collect data to feed the gap analysis, which, in turn,
aimed to test hypotheses I. and II. Finally, the last stage aimed to test hypothesis III and IV.
Analysis
Phase 1: Potential Clients analysis
After conducting a Pestle analysis to understand the environment of the two countries, especially
given the fact that the BP group was mainly composed by exchange students, the analysis was
narrowed to the competitive landscape of the retailing market in Portugal and in Spain. The first
finding was that according to Porter’s generic strategies grocery retailers tend to follow a cost
leadership strategy more focused on the efficiency of the processes, control of overheads, economies
11
of scale and scope, among others. However, when tailoring their generic strategy to their companies
retailers use differentiating factors to attract and retain shoppers as stores’ location & coverage, variety
& assortment, loyalty campaigns, in-store experience and private brands (BP slide 13-15, 20-22).
Selection of retailers
In order to filter the huge pool of grocery retailers and pick the ones that could potentially meet the
relevant conditions to be successful, four criteria were applied:
- Large and medium store sizes: In general, larger stores invest more in in-store customer experience
because clients tend to spend more time in those shops. As a result, these retailers desire to give
shoppers a pleasant experience so that they return frequently, to grab their attention for temporary
promotions or demos going on and to convert this interaction into sales. For example, stores with more
than 400 m2 tend to have better layouts with wider corridors where shoppers do not have the challenge
to move with their baskets. Additionally, with a wider selling space, more merchandising takes place,
either with special islands located in high traffic locations, end of aisles installations, special fridges,
among others. Furthermore, this segment of stores asks for more structured logistics to manage their
bigger amount of items sold per day to avoid stock outs, to control the expiration dates, for stock
management purposes, etc. Thus, only hypermarkets, supermarkets and discounters were covered in
the field analysis.
- Retailers from top groups: On one hand, retailers with bigger market shares have a bigger
coverage, which is ultimately translated into a larger market potential to sell the recommended
services since they can be replicated into more locations under the same contract (Appendix 8). On the
other hand, bigger market shares were used as proxies for higher sales per m2, which, in turn, was
assumed as an attractiveness measure to sell through a specific channel. In specific, only stores that
belonged to one of the six biggest groups in terms of market share were selected.
- High daily traffic in-store with customers with medium/high purchasing power: A high average
number of daily store visitors represents a huge opportunity to interact with a great pool of potential
clients per square meter of store. Proper services regarding in-store customer engagement could, then,
be attractive for these retailers since that they could leverage the sales volume and/or value per visitor.
12
The retailers’ presence in big cities from Portugal and Spain was used as a proxy for this measure,
which excluded the group ITM from the Portuguese analysis.
- Medium to high variety & assortment: Individuals have habits are more or less conscious. Thus,
while stores with a very diverse offer attract individuals with very diverse tastes too, some shoppers do
not realize products or brands they are not used to see or consume. This assumption suggested an
opportunity for retailers to increase their marketing activities in-store at the same as DW could close a
potential gap regarding customer engagement here. Again, this criterion was also used when taking
into account that these stores need to deal with big and diverse suppliers and a favorable relationship
should exist between these two partners. Thus, the execution field plays a major role to ensure a good
stock management to prevent stock outs a proper ordering, etc. The number of product categories and
brands sold by a retailer measured this filter.
After applying these four criteria, five retailers were selected for the Portuguese analysis (Pingo Doce,
Continente, Lidl, Jumbo, Minipreço) and four for the Spanish market (Mercadona, Carrefour, Dia,
Lidl). Since El Corte Ingles is present in both countries and its strategy significantly deviates from the
selected retailers (e.g. more selected quality of the assortment and better customer service which is
supported by price premiums), this chain was also studied and used as a benchmark.
It is also important to mention that, under the proposed criteria, small store formats were excluded
from the field research. However, retailers as Consum, Spar and Condis were considered at the stage
of go-to-market strategies development in for Spain after detecting an opportunity that was not
possible to foresee at the initial stage. Additionally, Eroski was not covered also since it is being under
an acquisition process by Dia and Carrefour.
Field Research
A field research was conducted to each selected retailer to have a deeper feeling of their in-store
experience. This phase counted with three main sources of information. Firstly, questionnaires
(Appendix 9) were carried out to at least one store per each retailer in both countries and aimed to
reach three different types of collaborators. In total, eight store managers, eight stockers and one
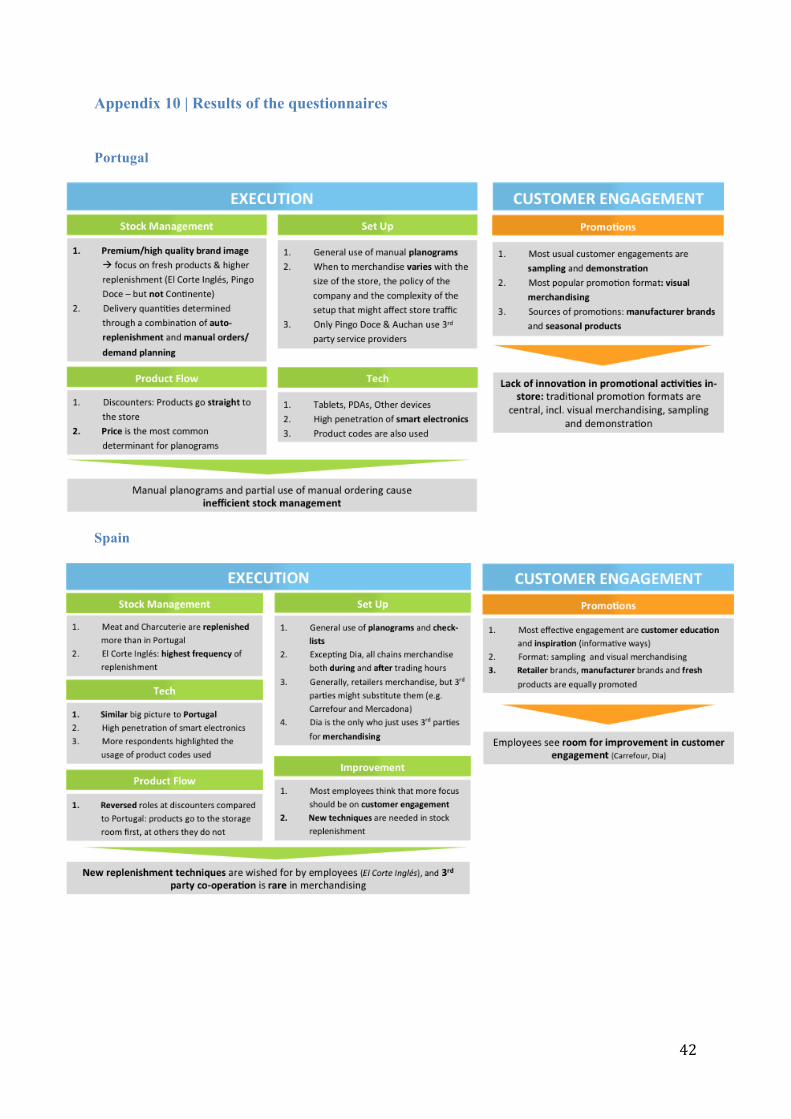
promoter contributed for these results. Appendix 10 shows many findings from the questionnaires but
13
only some will be highlighted.
Regarding in-store execution in Portugal, it was clear that planograms were widely used by retailers to
guide the organization of their products on the shelves. Usually, the first criterion is the category and
only after that one price, brands or other variables take place. Additionally, stock management still has
space for improvement in the sense that, when products arrive daily to the warehouse of a store, they
go to a specific room that is prepared in terms of variables as temperature, humidity and light
attending products’ characteristics. However, the way products are displayed within each room is still
not very organized, which negatively affects the easiness of expiration dates control and the real time
information regarding stock levels. In the Spanish market, stockers and store managers referred that
they wished new replenishment techniques, but with no detail. Finally, when it comes to merchandise
a product in-store, retailers usually perform this implementation task. According to our research, it
seems that Dia is the only retailer that co-operates with 3PP for it. However, this chain grows by
franchising contracts, which means that it was not possible to clarify if this cooperation was specific to
that store or to the whole chain.
In terms of in-store customer engagement, both countries presented similar results. Employees
answered that the typical formats include sampling and demos, cartoon installations, end of aisles and
side shelves. Additionally, the interviewed collaborators stated that they feel a lack of innovation
regarding the format of promotional activities in-store.
The second source of information counted with four interviews held to store managers from tow Pingo
Doce stores, one Continente and one Jumbo. The objective was to digger into more detail the findings
found with the questionnaires.
For the last source, the group visited at least one shop per selected retailer in order to get in touch with
the environment, understand the flow of the store, and, when possible, to take photos of some relevant
observations for the BP.
At this stage, a lot of insights were collected and there was the need to structure and evaluate it.
Aiming to compare the current performance of retailers in both dimensions – in-store execution and
customer engagement – a scoring model was developed (Appendix 11). Based on the questionnaires
and on the in-store observations, it was concluded that, in Portugal, discounters presented the poorest
14
scores in both in-store services, while supermarkets and hypermarkets showed the highest ones
regarding customer engagement. The Spanish case followed a similar pattern regarding execution
while supermarkets and hypermarkets had not only with the highest scores for customer engagement
but also for execution. It was based on this scoring model that potential clients for each
recommendation were selected.
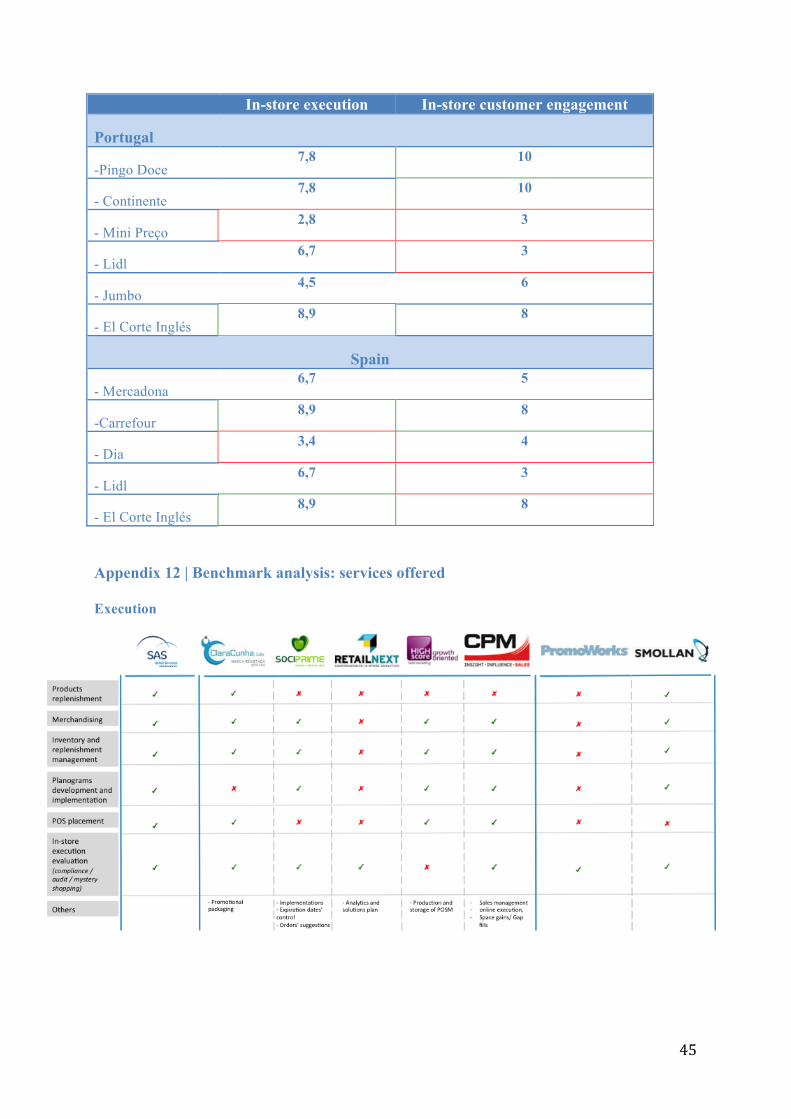
Phase 2: Potential Competitors analysis
Again, three criteria were used to filter the market of 3PP to narrow down the research. On on hand,
players should present a vast portfolio of services and, consequently, smaller and very specialized
agencies were excluded from the study. On the other hand, these players should work with retailers,
either as direct sellers or as simple collaborators. Finally, the focus was on 3PP present in Portugal and
Spain since they composed the scope of the BP. Thus, SAS (for execution) and Interactions (for
customer engagement) were compared against five main competitors: Clara Cunha, Sociprime,
RetailNext, High Score and CPM. Aiming to have an international benchmark too, Promoworks and
Smollan were also considered since they are two of the largest players worldwide. The conclusions of
the benchmark analysis can be divided into three fields: regarding services offered, geographical
markets and partners.
Relatively to services, 3PP generally offer not only in-store but also outdoor services as a way to
improve their competitive advantage and to strength their relationship with their clients. For instance,
besides offering replenishment services and retailtainment events, Clara Cunha participates in parties
& fairs and it lends equipped rooms from its offices to clients. Thus, providing value in these two
different contexts can generate information and a learning experience for 3PP. This enables them to
better understand and serve their clients’ needs and, in turn, 3PP expect a stronger loyalty. Although it
was not possible to access the weight of each service in the total turnover, when dividing their
portfolio of in-store services into execution and customer engagement it was observed that these
companies do not tend to offer many services on the latter. Either they specialize more in execution
(e.g. Clara Cunha, Sociprime, Smollan) or in both (e.g RetailNext, Highscore, CPM). (Appendix 12)
15
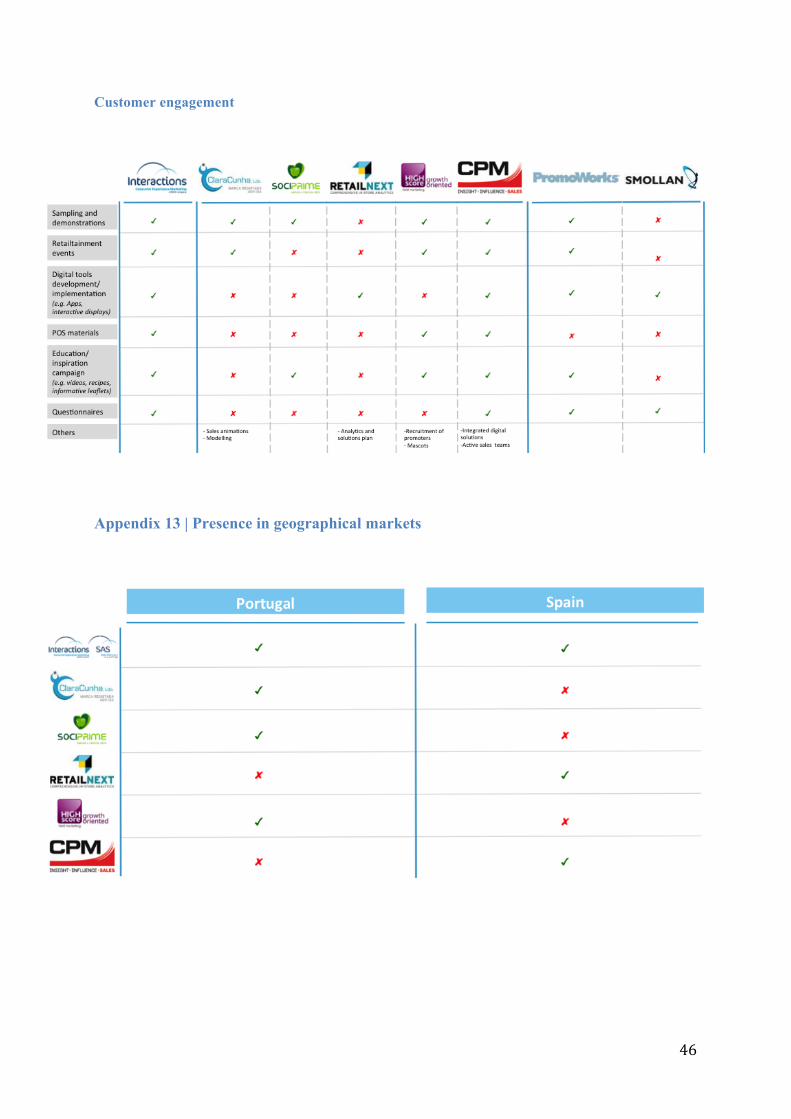
By looking at each country separately (Appendix 13), Portugal showed a more fragmented market
with more local companies while in Spain international players have a stronger presence. Furthermore,
both local and international players presented a room for improvement regarding communication for
external stakeholders. Firstly, because the generally unclear information in their websites is expected
to have a negative influence on a potential demand. Secondly, because retailers are highly concerned
about daily revenues that 3PP’ services could maximize, but also about costs to acquire them. Thus, in
the case of no-rejection of the four hypotheses, a very persuasive approach (e.g. sales force) would be
needed to convince retailers about the value added by 3PP and convert this awareness into adoption.
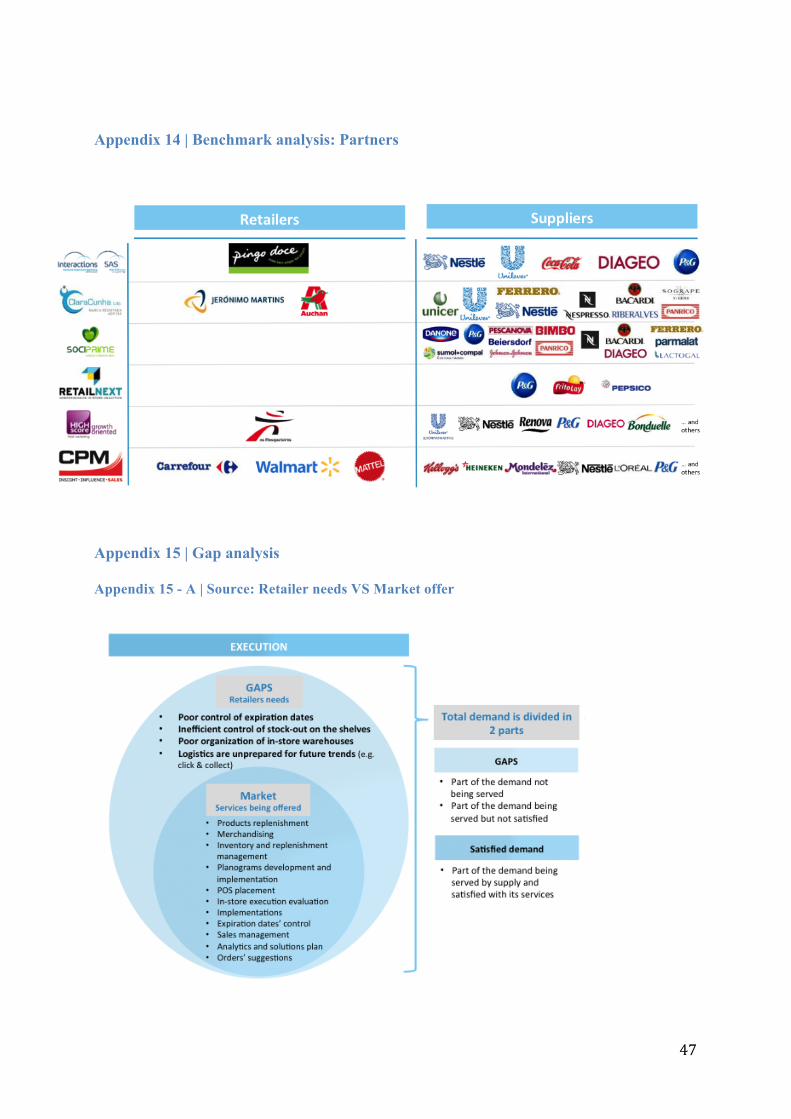
Finally, when analyzing the business partners of 3PP three findings arose. Firstly, suppliers are
generally the main clients while retailers usually simply collaborate by enabling the occurrence of
those activities within their stores. Secondly, there seems to be a low level of conflict of interests when
selling these services to several competing clients or to have one client demanding different services
from competing 3PPs. For example, Sociprime works with Lactogal and Parmalat and with Bimbo and
Panrico. Additionally, Ferrero, Bacardi and Nespresso work simultaneously work with both Clara
Cunha and Sociprime (Appendix 14) (companies’ websites). One possible reason for this web of
relations might be the offer of 3PP services at different prices while suppliers consider them as
commodities and, thus, looking for the least expensive alternative. Another explanation might be the
inexistence of exclusivity contracts or strategic partnerships, which enables clients to contract every
service separately. Nevertheless, both scenarios suggest that clients are not afraid to share info
regarding their products with different partners.
Phase 3: Gap analysis
At this stage, the aim was to synthetize the insights collected on the two previous research phases and
to develop a gap analysis that could test hypothesis I. There is an untapped market for in-store
execution services to be offered by third party providers and II. There is an untapped market for in-
store customer engagement services to be offered by third party providers.
With this process, two kinds of results were expected. First, that there is an unmet demand waiting for
new services with needs in the market that are not being served yet, either by DW or by other players.
16
Second, that there is a portion of the existing demand that is not fully satisfied. In other words, a
number of clients are underserved with the existing offer, representing a space for improvement of
already sold services, either by DW or competitors. If a gap existed regarding execution, hypotheses I.
would not be rejected opening a room to test the third one: DW can expand its portfolio of services to
in-store execution. Similarly, if a gap existed regarding customer engagement, hypotheses II. would
not be rejected allowing a test of the fourth one. In conclusion, if at least one of the first two were not
rejected, it would support the development of the recommendations.
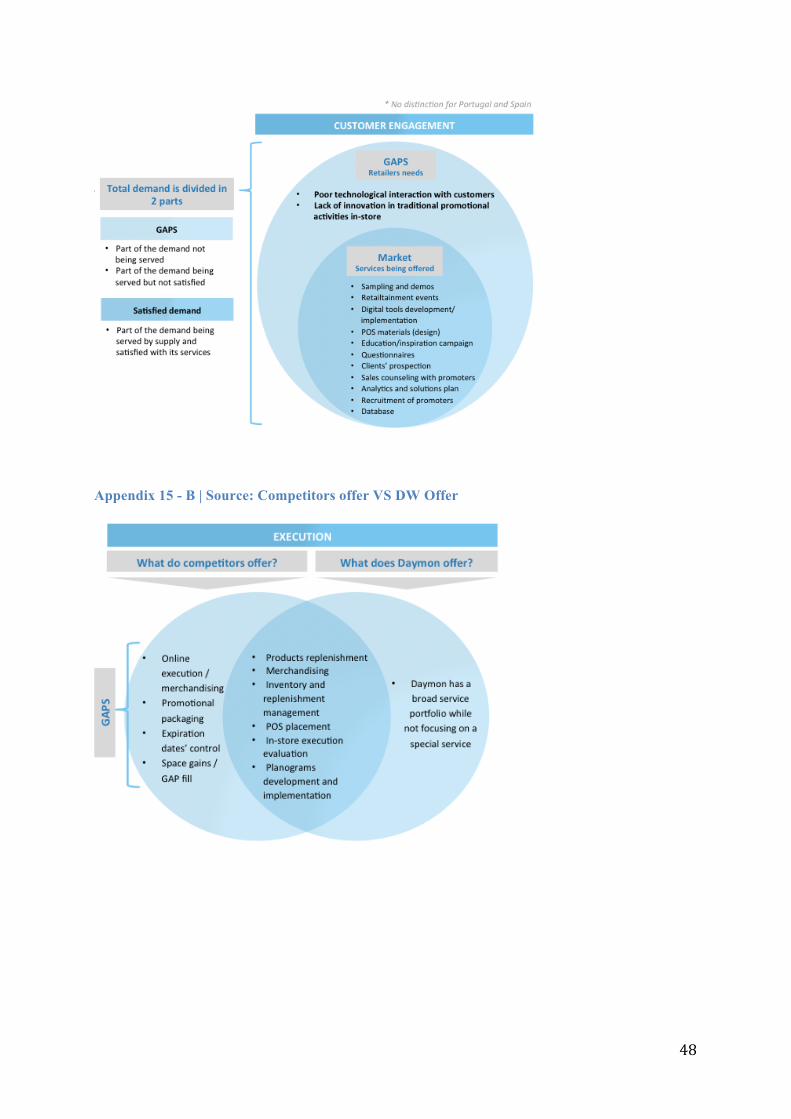
Three sources of gaps were identified and separately analyzed. The first was the mismatch between
what retailers need and what the 3PP market is offering (Appendix 15-A). From the execution
perspective, it was found that there is a poor organization of stores’ warehouses raising opportunity
costs of time and money. Additionally, an inefficient control of expiration dates and a poor control of
stock-outs on the shelves existed once they are still generally managed manually with a stocker that
goes through the corridors to check product by product. Furthermore, the lack of real time information
during trading hours regarding the amount of products on the shelves does not help either. Finally,
even though some chains are adapting their distribution channels’ logistics to satisfy the increasing
demand for convenience, it seems that some other stores’ logistics are still unprepared for future
trends. From the customer engagement side, there is a poor technological interaction with customers in
an era where both mobile Internet penetration and the time spent per day on-line by customers is
increasing in both countries. Although some retailers already have their own app, (e.g. Pingo doce and
Carrefour) the access to free Wi-Fi in-store is eak and there are still technical issues, sub optimizing
the potential of engagement and information collected from them to make more data driven decisions.
Finally, a lack of innovation in promotional activities in-store exists. Firstly, merchandising is being
made by more undifferentiated products’ categories but actual ROI is difficult to measure. Thus,
suppliers might feel discouraged to invest in traditional promotional activities if retailers do not press
them. Secondly, in an interview it was highlighted that customers tend to spend less time in-store and
they shop more frequently for freshness or special price promotions. This results in a lower attention
span for traditional engagement tactics and a need for innovation to grab their attention effectively.
The second source resulted from the comparison of what competitors and DW are offering (Appendix
17
15-B). Here, DW was not selling online execution & merchandising, promotional packaging and
expiration dates’ control as execution services. Regarding customer engagement, the company did not
include in its portfolio the POS materials’ creation, sales animation & modeling or the use of mascots.
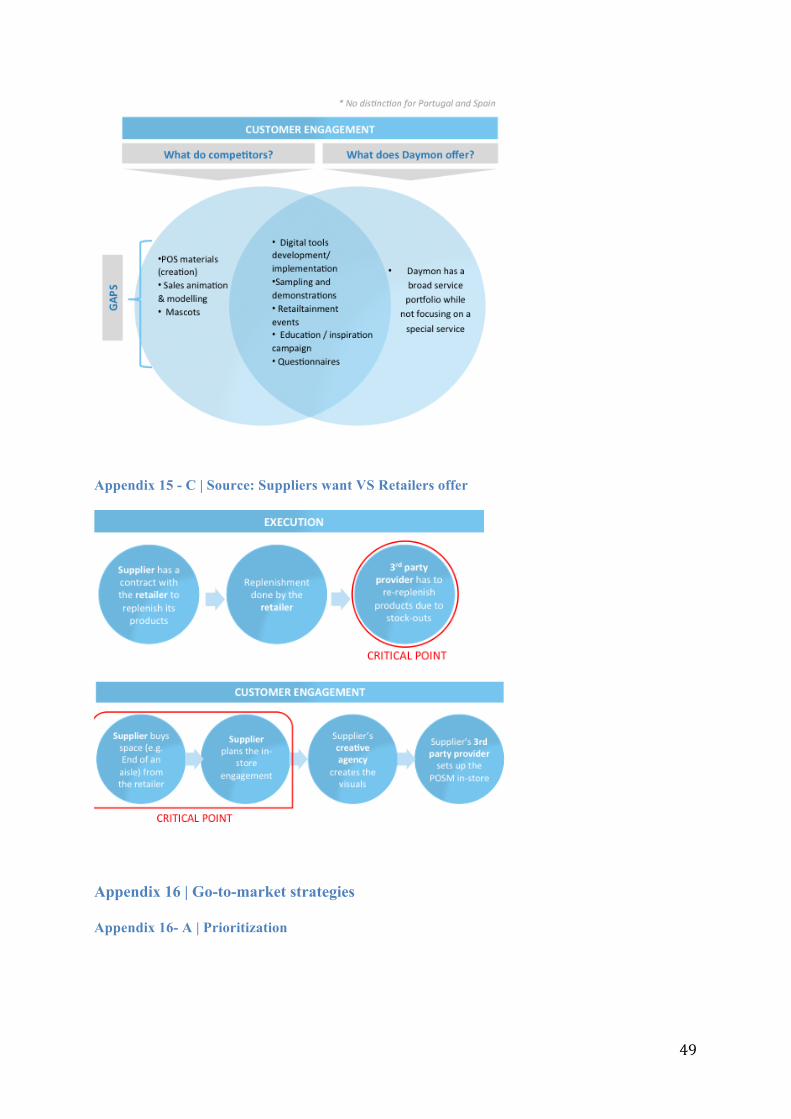
The last source of gaps aimed to understand a mismatch between what national brands want and what
retailers offer to them (Appendix 15-C). For this, the group had the chance to interview one big
supplier that highlighted the inefficient replenishment and, since it can not support shelves’ stock-outs,
it ends up paying twice: to retailers, by contract, and to 3PP to effectively prevent this situation. It was
also pointed that there is a lack of innovation and targeting in the customer engagement activities in-
store: “It looks like a carpet bombing (…) I’m continuously challenging my team regarding the way
we put money in store regarding the return. (...) I don’t think retailers are using in the best way their
intrinsic knowledge. I’m exaggerating but take this as an example: It feels to me that retailers (even
the biggest ones that we work with) are just crapping the surface of their databases in terms of power
of that data. They are not really putting it up the core of what they do while they could use it as their
own advantage, to create competitive advantage”. This represented a gap in communication and in
leverage of data to better measurements.
Even though it was possible to discriminate gaps between execution and customer engagement in each
of the three sources, the available information was not sufficient to divide the analysis by countries.
Thus, it was assumed that if one 3PP was present in more than one country, it offered exactly the same
portfolio of services in each location. Overall, since there were gaps regarding execution and customer
engagement, I. and II. were not rejected.
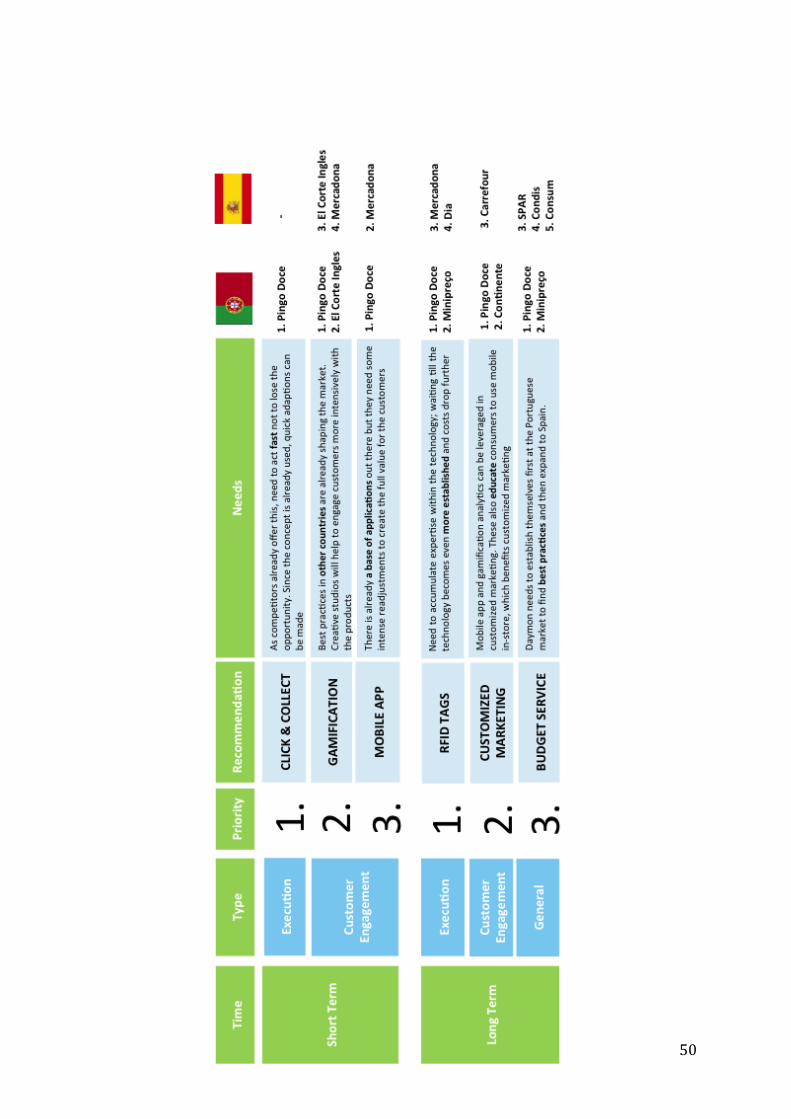
Recommendations to the company
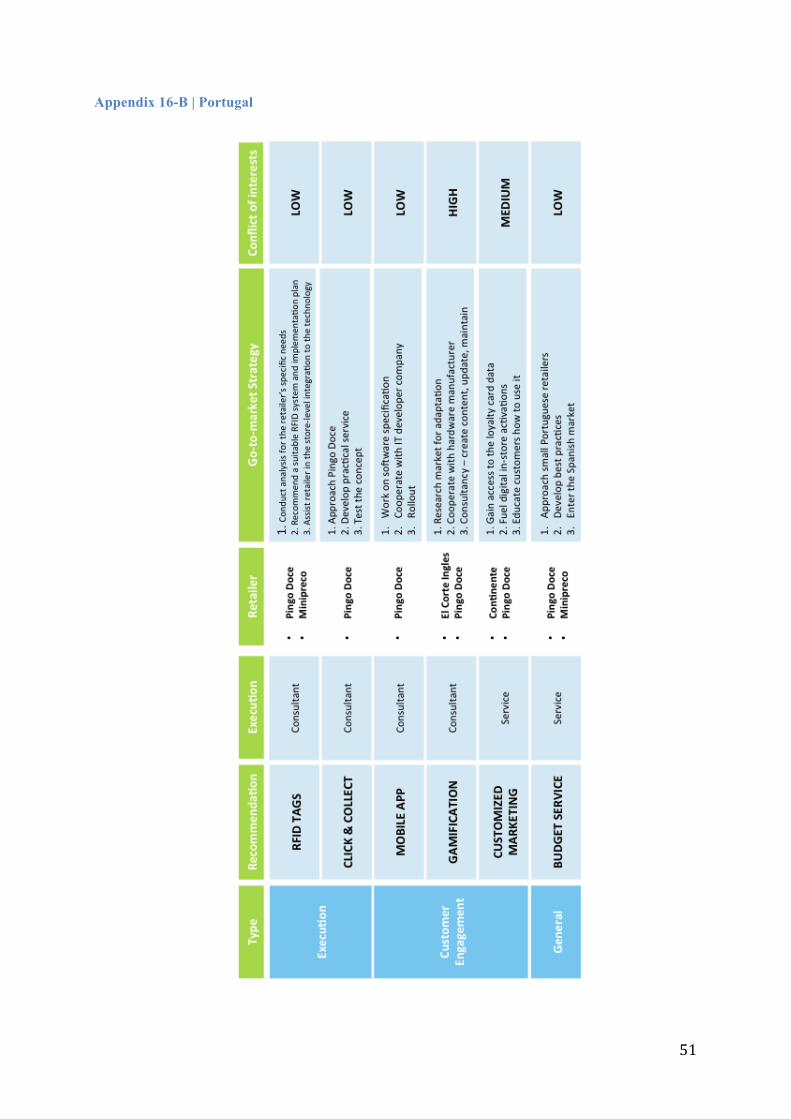
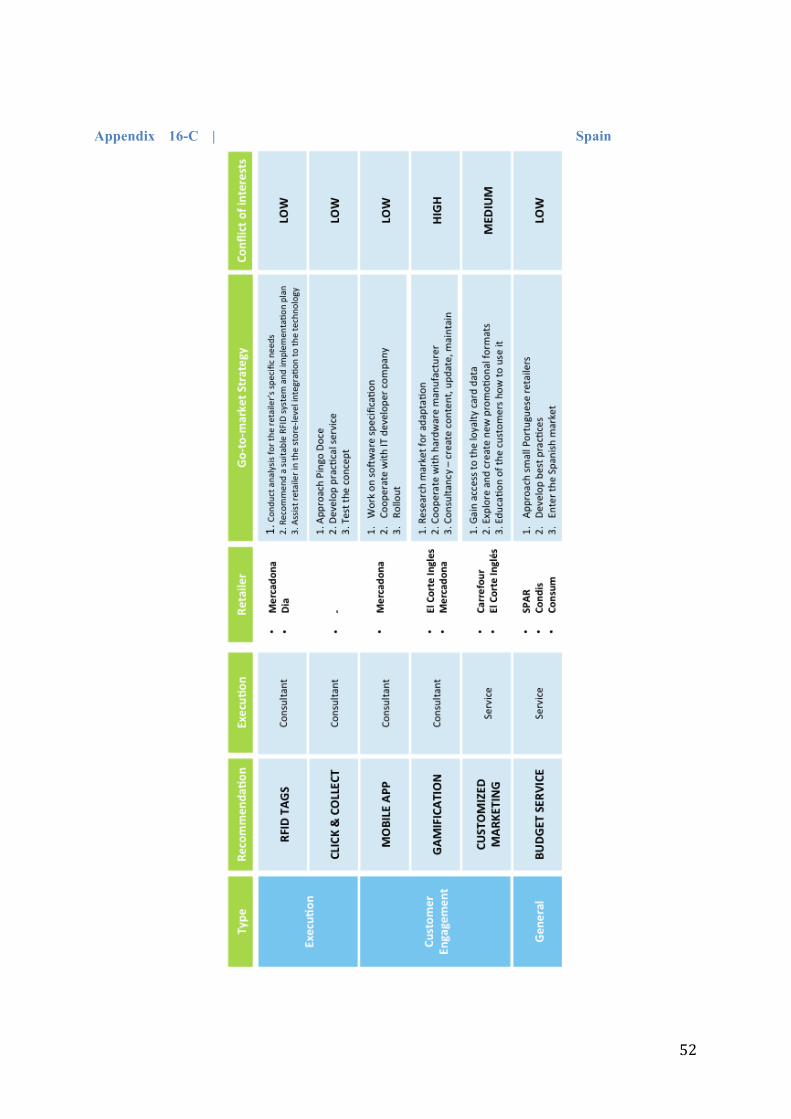
After unveiling and analyzing existing gaps from the three mentioned sources, six recommendations
regarding go-to-market strategies were designed aiming to close some of them (Appendix 16 A-C).
For each suggestion, one value proposition was defined, as well as the answers to the questions to
what, how, to whom and which potential limitations it carries.
Regarding execution, the first recommendation was called RFID Tags and it aimed to improve the
control of stock-outs on the shelves, the poor organization of stores’ warehouses and the control of
18
expiration dates. RFID tags are a technology that enables retailers to increase their efficiency in stock
management and inventory, thus reducing their costs since replenishment with a RFID system is
significantly faster than manually auditing each item or scanning their bar codes. The role of DW
would be to offer a consulting service to advise grocery retailers whether and how to implement RFID
tags in their inventory management. In fact, RFID solutions can become complex, so the company
would become a specialized bridge between the complicacy of tech producers and the needs of
retailers. The second recommendation aimed to close the gap of stores’ logistics being unprepared for
future trends” by offering a consultancy service for retailers who already have an online shop. The
idea would be to advise them how to develop a proper click-and-collect service and integrate it into
their existing store dynamics and execution systems. For retailers who have not set up an online store
yet, DW could also consult them in this area, by offering a service package including not only the
click-and-collect development but also the one for the online store.
Regarding customer engagement, gamification was the first recommendation and it aimed to offer an
exciting solution for the lack of innovation in traditional promotional activities in-store and to the poor
engagement and communication to customers. Gamification is the use of game components and
digital game design techniques to non-game situations as a way to motivate participation, engage, and
generate loyalty. This service would be composed by two elements. On one hand, it would include the
use of Beacons, which are technological devices that aim to attract individuals’ attention to a specific
place. On the other hand, it would include the development of the technology for the so-called
augmented reality, which, as the name suggests, would give customers the opportunity to visualize the
real world virtually with an augmented dimension (e.g. sound, video, graphics or GPS data) but in a
way that it is difficult for the user to distinguish what is real from what is fiction. By using a mobile
app, the surrounding real world of the user would become interactive and digitally manipulable.
Again, DW would add value by working as link with deep market knowledge between brands and IT
representatives. The second recommendation in this field would be the development of a mobile app
for retailers since smartphone and Internet penetrations are very high in both countries, but their use
for customer interactions is modest. The objective would be to enable shoppers to access in a more
convenient way valued insights like recipes, price promotions, seasonal products and invoices. The
19
role of DW would be to assist retailers in the design of the specifications of the app (e.g. understand
the kind of information and pop ups that would be valued by customers and that should, then, be
included). Additionally, the company would assist the study of the best options to implement in-store
services needed to leverage the penetration and the use of this app (e.g. free wi-fi). DW has already
offered an app to track demos occurring in-store, so it could ask to one of its resource center for best
practices regarding its development or to access a potential tech partner that designed that app in the
past. Customized marketing was the third recommendation in this field but it will be explained with
more detail in the individual contribution chapter.
The last recommendation was called budget service and the opportunity was found when realizing that
3PP tend to concentrate their offerings to large retailers with big and expensive service packages.
Since smaller chains do not have the monetary backup for extensive projects they are usually excluded
from this market, even though most of the identified Gaps in some of the bigger retailers were also
present in each of the smaller stores. Thus, this recommendation aimed to offer smaller retailers a
solution for either execution or customer engagement gaps, depending on their specific needs. The
idea would be to break down the complete existing “service package” as a strategy to build a new one,
more tailored to the clients’ needs, at a lower cost. From a competence’s perspective, DW already sells
these services so the company already has the knowledge and the skills needed. The challenge would
be to adapt the pricing strategy to avoid misunderstandings with existing big clients and to learn more
about the specificities of these smaller players.
Concerns Although the group considered that there were more opportunities for DW to explore execution gaps,
since this information was not so accessible in terms of costs, possibility to observe and to fully
understand the steps of the process, more focus was put on the customer engagement side. Here, three
main recommendations concerns seem to arise. First, retailers have a very specific DNA that one
should deeply understand to study whether these services truly have potential to be adopted given their
needs and their willingness to pay. On one hand, these players have very small margins, which make
them very rational to bulky investments and incentive the waiting for the right time to move.
Information is crucial, and one apparent proof might be the fact that the market leader in a country is
20
usually a domestic firm (e.g Pingo Doce in Portugal, Mercadona in Spain, France, Germany, etc). On
the other hand, their suppliers, who are increasingly frustrated with the lack of their ROI
measurement, mainly fund retailers’ business model. According to a top manager, “one interesting
thing to understand would be to see if A-brands feel they are receiving a sufficiently good service in-
store. If it’s not good enough, are they willing to pay/how much are they willing to pay to maximize it.
That will dictate our ability to go and implement the SAS core services. Of course they want to
maximize their sales and ultimately, the business models of retailers are funded by A-brands”.
The second concern is to match the retail DNA with the key resources that give DW a sustainable
competitive advantage. Currently, DW’s success is explained, from a resource-based view, by its deep
knowledge of the retail business, supported by its long relation with the existing clients all over the
world. Additionally, its expertise in branding and marketing, as well as its large international network
of sourcing suppliers, make DW able to add relevant value with resources that are scarce, take time
and high costs to imitate and that are organizationally embedded, allowing DW to profit from them
(Collis and Montgomery). However, even though DW believes Millennials will highly influence the
future of customer engagement in the retail business, the company is not an expert in tech, which
raises the dilemma on whether to start developing it in-house or to look for specialized partners.
Finally, when compared to huge markets as the UK and the US, Portugal and Spain raise the question
of how sizeable can these investments be to ensure an adequate payback.
Individual contribution
By being the only Portuguese in the group a high involvement in all parts of the BP was required to
me. On one hand, in an early phase, it was needed to suggest sources of information as well as to
prepare, translate and conduct all interviews from the field research. The Portuguese interviewees did
not speak English and I had the most similar language to communicate with the Spanish collaborators.
On the other, to avoid asymmetric information within the group that could jeopardize the deepness and
connection of the different phases, I translated every interview and the questionnaires to share the
knowledge we had accessed. Here, I also tried to participate in every discussion to make available my
Portuguese insights so that a suitable structure for each part could be designed (e.g. for the on-line
21
research and selection criteria for the potential clients, for the benchmark and gap analysis in the
competitors’ stage and the set up of a framework for the recommendations). Thus, a strong
collaboration of every member was highly needed to align what, why and how we wanted to
communicate. A section where I could work more independently was on the development of the
customized marketing recommendation, which will be briefly presented.
According to Sociprime 70% of purchasing decisions are taken in-store, next to the shelves. On one
hand, Clara Cunha Company highlights the difficulty to create customer loyalty in undifferentiated
products just with publicity making customers very sensitive to advantageous promotions. This
reflects the importance of in-store customer engagement to grab shoppers’ attention, create desire and
boost sales. On the other hand, from the point of view of the interviewed supplier, retailers are
incurring in a huge marketing fixed cost that is not being translated in responsiveness (e.g. printing
leaflets periodically and sending them to households). In fact, he stated that “I receive loyalty offers
every month and what I get is this letter saying ‘25% discounts’ on some things they choose. The first
3 months I looked to it. Now I don’t because I’ve realized that it has things that i’m not interested in
with a discount that it’s irrelevant. So I go into the store and I find much more interesting things with
50% discount that are coming every week, so it’s completely obsolete.” Furthermore “Nowadays, in-
store activation looks like a carpet bombing when it has the potential to be a more strategic weapon –
right now there’s more information to do so than ever”
This service aimed to close two existing gaps mentioned by the supplier side: firstly, the lack of
strategic marketing to address the right shoppers in order to increase their responsiveness and,
secondly, to leverage the existing data retailers possess about both their shoppers and the promotional
activities to better track KPIs regarding suppliers’ ROI. This data could mean an important input to be
used for negotiations regarding in-store investments with their suppliers.
Customized marketing stands for an in-store digital tool for brand activation that would interact with
shoppers without a personal contact. Furthermore, it would be an adaptive system since this
interaction would result from the scanning of a loyalty card in TV screens in-store where the client
would be informed about the relevant promotions for them, based on past purchases and novelties.
22
For the set-up part, this service would be divided in two phases. At an earlier stage, DW would offer
the design of the concept and the specifications of the system (e.g. define the relevant shoppers’ info
that DW would need to access, find a tech partner to develop the algorithm, design user-friendly
screens and the branding of the service, define KPI’s to track future performance, among others).
Here, DW would need to first patent the concept and technology to avoid imitators. Then, it would
need to negotiate with its clients the inclusion of a clause in their loyalty cards’ contracts that would
enable this company to access certain data currently protected. Finally, some stores would be selected
to pioneer the concept and, after testing it, the adjusted technology would be expanded at a lower cost.
In a second stage, DW would be the responsible to fuel the system with the promotional highlights in-
store to directly communicate to customers (e.g. feed the system on an on-going basis with the results
of retailers’ negotiations with suppliers in terms of promotions, analyze the generated data, track the
performance of KPIs to continuously improve the system, etc). For the success of the service, DW
would educate retailers’ customers with a temporary sales force at the beginning once they would need
to be aware of its existence, understand how to use it and its potential value. Additionally, the
company would need to ask retailers for periodic renewals of their loyalty cards’ databases since it is
not only the quantity of data that creates values but also how updated the information is.
Continente and Pingo doce were pointed as potential clients in Portugal and Carrefour and El Corte
Ingles in Spain since they scored high in customer engagement, based on the past research. This
indicates that these players care about interacting with their shoppers, which represents a potentially
higher willingness to invest to be viewed as first movers and innovators in the area of leveraging
shopper data (e.g. Carrefour launched its own app). Additionally, both Portuguese players have
already have highly established loyalty programs. Finally, one thing that is common to the four players
is that they are present in the hypermarket segment, where, given the larger daily traffic in-store, each
implemented system is expected to have a shorter payback period and to generate more useful data.
Three concerns regarding this recommendation arise. The first one is the need, as Mckinsey’s report
stated, of DW to “make sense of the flood of data. Sophisticated algorithms and analytical tools can
help, but the tools alone don’t constitute a competitive advantage. Rather, it is the knowledge of how
to leverage the tools that can vault a company above its competitors.” DW would need to “hire,
23
develop, and retain skilled analysts who can distinguish relevant from irrelevant data (…) to strike the
right balance between analytical expertise and commercial sense.” Secondly, there are some security
issues regarding the confidentiality of information from customers. Retailers own this data from their
loyalty cards and a good negotiation is needed to enable the sharing of a percentage of it, within the
legal boundaries. Thirdly, developing and implementing technology requires a high investment,
which, in the retail business is not easy to convince. That question that would need to be answered is
who would finance it: DW, its tech partners, retailers or suppliers.
Academic Discussion Possible links with the management field
With the entry of store brands collaboration and competition, which are two apparently opposing
forces, need to coexist: manufacturers are no longer simple suppliers of retailers but, simultaneously,
their competitors. In fact, before a retailer introduces its private labels, suppliers buy its selling space
to reach their final demand while the former has the incentive to maximize the sales of its business
partners. In this scenario, suppliers compete against each other for the same retailer that operates as a
monopolist that seeks the category profit maximization. For this, it sets the retail price for each
product within the category regarding their distinct expected demand. While negotiating with the
retailer, each supplier faces a trade-off: on one hand they want to capture value from the total profit
margin created by all intermediaries that participate in their distribution channel and, hence, they seek
a sufficiently high wholesale price. On the other hand, it needs to be sufficiently low to allow retailers
to have a margin that does not drive retail prices too high, which would affect the final consumers
negatively and decrease the potential total channel profit (Sanjog Misra et al, 2008). However, in a
scenario where store brands exist, retailers also fight for market share against national brands.
Past literature highlights that there are three main benefits for retailers that offer store brands. Firstly,
because they provide retailers a more strategic bargaining power when dealing with national brands
(e.g. wholesale prices) by threatening imitation of their products or because, at least in theory, a
retailer controls decisions related to the marketing mix in-store (shelf space and disposition,
promotions, price, etc) (Narasimhan and Wilcox 1998, Sayman, et al 2002, Ailawadi & Harlam 2004).
24
However, empirical evidence that supports that this bargaining power is higher is scarce. Secondly,
offering own brands provides retailers with higher margins (Pauwels and srinivasan, 2004). Thirdly,
private labels can be used as tools for store loyalty, working as a differentiator from competing
retailers. (Sudhir and Talukdar 2004).
Yet, several questions are raised regarding the opportunity cost of cannibalization of sales, the trade-
offs retailers need to balance in their store brands’ decisions, the conflicts that appear in the channel
due to misaligned incentives, among others.
Relevant theories and empirical studies
In an interaction between retailers and manufacturers bargaining power is usually measured by the
share of profits a player is able to appropriate from the total surplus generated by that distribution
channel. Previously, this power was assumed to be a unilateral ability of a retailer to set the wholesale
price. However more recent studies (Villas Boas and Iyer, 2002) introduced frameworks where it
results from a bilateral negotiation.
In this field, the authors of the academic paper “Do private labels increase retailer bargaining
power?” (Sergio Meza et al, 2009) aimed to test two specific hypotheses. The first one questioned
whether private labels increase the negotiation power that retailers have over manufacturers. Based on
empirical evidence that store brands have a higher profitability than national brands (Pauwels and
Srinivasan 2004) and that they deliver retailers a strategic negotiation power regarding supply terms
for manufacturer brands (Sayman, et al 2002) the second question tested whether retailers strategically
set retail prices to benefit their private label. This could be either by raising the price for national
brands or by setting a lower one for private labels. For this, it was analyzed a Chicago-based grocery
chain that follows an imitation (“me-too”) strategy rather than a differentiation one for its own brand.
Concerning the first hypothesis it was found that retailers increase their bargaining power relatively to
retailers due to the introduction of their own brands and this gain seems to persist in the long run. This
is reflected on a larger pressure for lower wholesale prices, especially within categories where
manufacturers have a low capacity to attract customers (niche markets).
25
In relation to the second hypothesis, evidence suggests that, in fact, retailers strategically set higher
retail prices for manufacturer brands when a store brand is launched. The objective is to facilitate an
early penetration but once a significant and stable market share is achieved within that category,
retailers decrease national brands price to the level that maximizes the profits of the category as a
whole. However, this is only done for brands that compete in mass market categories where the gains
in market share for retailers in the long-run compensate the opportunity cost they are incurring in the
short-run by selling either less national brand products at a higher margin or private labels as a cheaper
alternative for shoppers.
Although this research added value to previous empirical findings, price is the only variable
considered to measure bargaining power. However, in reality, other factors as the market share of
manufacturers, their brand equity or cost advantages enter in this equation. (Sanjog Misra et al, 2008)
Implications for theory and future research
This empirical study from Sergio Meza et al. added value to the academia since, from the supply point
of view, it was the first time that wholesaler and retailer pricing were modeled and estimated with a
framework that controlled the fact that a new entry increases competition in the market, and, then,
pressures both prices to decrease. With novelty, the authors were able to estimate the real net effect on
the bargaining power for retailers due to the introduction of their private label. Additionally, when
modeling the demand side, the authors allowed for heterogeneity in terms of consumer preferences for
different attributes based on a complex econometric model (e.g level of sugar, amount of fiber, price,
promotion). This built up on Kadiyali et al (2000) where demand elasticity was assumed invariant
over time, not capturing the differences before and after the introduction of a store brand.
This study also opens the door for future research regarding the externalities of private brands in
different scenarios. Four suggestions are presented here: Firstly, it was interesting to observe that, in
this case, the strategy of increasing the price of national brands to penetrate private labels worked as a
way to simultaneously prevent an association between low quality and low prices. However, it would
be interesting to understand in future research the costs of this strategy since, if retail prices for
national brands were too high and the pull power of their private labels too low, customers could feel
26
incentivized to change not the brand within that category but to visit a competing store or to simply
give up his purchase. In both cases, retailers would face an opportunity cost.
Secondly, it was analyzed the case where an imitation strategy is pursued by the retailer, which means
that its way to either launch new products or to improve an existing one is to copy, at a higher or lower
degree, successful physical or marketing features of manufacturers’ products. Additionally, this
positioning is more common than a differentiation one (Scott Morton and Zettelmeyer 2004).
However, there is a lack of empirical findings regarding the sustainability of this strategy once it might
disincentive both the speed and the volume of investments that manufactures dedicate to innovation,
once “free-riders” turn their ROI more uncertain.
Thirdly, past research seems to support benefits from private label penetration for retailers. However,
what are the marginal costs and benefits of increasing a brand store market share for retailers? In
specific, to measure the side effects of increasing private brands penetration in terms of the ability and
willingness of suppliers to keep investing in the retail business.
Fourthly, Sergio Meza et al. limited their research to the USA and the study was concluded in 2009.
Thus, the generality of the results might be weak for the European continent in a post-financial crisis
context. In fact, some private labels saw an opportunity to prove they had a higher quality than the
once perceived by shoppers that were forced to cut their household expenses due to the high austerity.
Hence, based on the concepts of the consumer theory from microeconomics, it would be interesting to
understand if private labels are empirically considered ordinary and inferior goods and if their
elasticity to price and income varies from country to country and why.
Personal Reflections
Personal experience
The BP was a learning experience at several levels and I would like to highlight the fact that it
exposed me to realities that I did not have experience with and to significant cultural differences.
On one hand, this experience represented the first contact I had with consultancy, where I have learnt
the importance of an active listening of the client’s needs and the relevance of communicating
periodically to give and receive feedback. One of the multiple examples was the difficulty to clearly
27
understand the real objective and scope of the BP at the beginning but the strong communication with
the client clarified about what was expected to deliver in the last milestone. This project stressed out
the importance of a good initial planning phase that pays off during the process. Firstly, it allowed the
design of different stages and the decomposition of the tasks that should be fulfilled within a certain
period of time in order to comply with an expected deliverable. Secondly, this proved to be a good
technique not only to manage the expectations from the client’s side but also from and within the
group. In fact, it ensured a constant focus on the scope and final goal. Secondly, with a plan aligning
expectations, discipline to comply with the agreed schedule enabled the group to perform smoothly
throughout the semester instead of delaying the progress closer to the final deadline.
On the other hand, this was my first chance to deeply learn the retail business. One clear take away
was the importance of a profound understanding of the ADN of retailers and their business models to
distinguish what could be a good creative idea from what would add value to these players at a cost
they would be able or willing to support.
Finally, differences in culture were felt among the group, once we all had different nationalities, and
when visiting and interviewing Spanish and Portuguese retailers. In fact, at the beginning I thought
Portugal and Spain culturally similar. However, although they have a small geographical distance
according to the CAGE framework (Harvard, 2011) they actually differed in terms of culture. Firstly,
language seemed to be a communication barrier between the group and the Spanish collaborators
when conducting the questionnaires, which did not happen in Portugal due to my nationality.
Secondly, although with a different idiom, the information sharing was much lower in Portugal than in
Spain. In fact, while in Spain the group was able to interview everyone in-store and every employee
seemed excited to help, in Portugal we learnt that stockers were not confortable to do so without a
previous allowance of their store manager. This clearly reflected the Hofstede cultural dimensions,
specifically in the higher score of power distance in Portugal (63) than in Spain (57) (Hofstede center,
2016). Thus, to gather similar information, different approaches were needed to each country, which
asked for flexibility and adaptation rather than waiting for the perfect conditions to work.
28
Self-development plan
From a personal perspective, I would say I was a collaborative colleague since I tried to be available to
answer all questions regarding the specific Portuguese context and to work on consensus. I consider
these were important inputs for the communication within the group. Furthermore, my proactivity and
organization skills helped to develop the story telling and the structure of the BP while my positivism
aimed to remind that we should adapt to the conditions we faced, that we could learn from mistakes
and to remain motivated when facing high levels of workload or limited resources. I believe I could
not require behaviors that I did not give the example in, so I tried to be punctual, to recognize and
apologize for my mistakes and to be publicly grateful for the effort of each colleague.
But I also recognized one area for future improvement, especially with the individual assignment for
the Global Management Practices Course. I realized that I tend to focus more on the observation of the
exterior’ needs to develop conditions that enable progress. Until certain point this could work as a
strength, but in reality this proactivity also supports my lack of assertiveness to avoid conflicts. To
close this gap, I will join an enneagram program to improve my self-awareness and to learn how I tend
to think, feel and react, so that I can better predict my patterns under some circumstances (e.g. stress)
and better adapt my behavior there. “The Enneagram posits that there are nine separate personality
types. Each one is marked by a central defense or preoccupation — a specific lens through which each
of us reflexively and narrowly views the world, in order to feel safe.” (HBR, 2012). In fact, Claudio
Naranjo, which was a Harvard and Berkeley professor, contributed tremendously to the development
of the enneagram model with his knowledge in psychology. Additionally, there was a course in the
Standford MBA program that covered the enneagram and many companies and teams (e.g. Motorola,
CIA, Oakland A’s baseball team) are using this.
29
Appendix Appendix 1: Business Units at Daymon Worldwide
Appendix 2 | Daymon Worldwide in numbers
30
Channels of Trade
Supermarket, Automotive, Convenience, Discount, Dollar, Drug, e-
commerce, Closeout/Overstock, Mass, Office Supply, Supercenters,
Warehouse Club, Wholesaler/Cooperative, Home Improvement
Countries
Angola, Australia, Austria, Bangladesh, Belgium, Botswana, Brazil,
Canada, China, Colombia, Czech Republic, Denmark, England,
Estonia, France, Germany, Guinea, Honduras, Indonesia, Ireland,
Italy, Japan, Kazakhstan, Kuwait, Latvia, Lithuania, Luxembourg,
Malaysia, Mexico, Netherlands, New Zealand, Norway, Panama,
Philippines, Poland, Portugal, Saudi Arabia, Scotland, Singapore,
South Africa, South Korea, Spain, Swaziland, Sweden, Taiwan,
Thailand, Ukraine, United Arab Emirates, United States, Uruguay,
Vietnam, Wales
Source: Daymon Worldwide website
Appendix 3 | Positive perceptions for private labels
Percent of respondents who somewhat or strongly agree
Source: Nielsen 2014
31
Appendix 4 | Private label distribution worldwide
Dollar share by country
Source: Nielsen 2014
Appendix 5 | Private Label Market Share in Portugal and Spain
Appendix 5-A | Private Label Market share in Portugal
Source: Nielsen 2014
0,0%
50,0%
2009 2010 2011 2012 2013 2014
Volumeshare
ValueShare
32
Appendix 5-B | Private Label Market Share in Spain
Source: Kantar World Pannel 2014
Appendix 6 | Retailers Market Shares
0%
20%
40%
60%
2009 2010 2011 2012 2013 2014
Volumeshare ValueShare
18,46%
16,65%
6,96%6,81%
5,02%
46,10%
Portugueseretailersmarketshare
JeronimoMartins Sonae ITM SchwarzGroup Auchan Others
22,30%
8,60%
8,20%5,90%3,80%
3,80%
47,40%
SpanishRetailersMarketShare
Mercadona Carrefour GrupoDia GroupEroski Auchan Lidl Others
33
Appendix 7 | Evolution of private label market share (against national brands), by
retailers
Appendix 7-A | Portugal
Source: Nielsen 2014
Appendix 7-B | Spain
Source: Kantar World Pannel 2014
Appendix 8 | Dimensions of top retailers
Appendix 8-A | Portugal
0%10%20%30%40%50%60%70%80%
2011
2012
2013
56,4 56,8
25,7 25,9
54,5 52,9
31,8 33,1519,3 18,9
76,6 78,3
0
20
40
60
80
100
2013 2012
%
Mercadona Carrefour(hiper) Dia Eroski Auchan Lidl
34
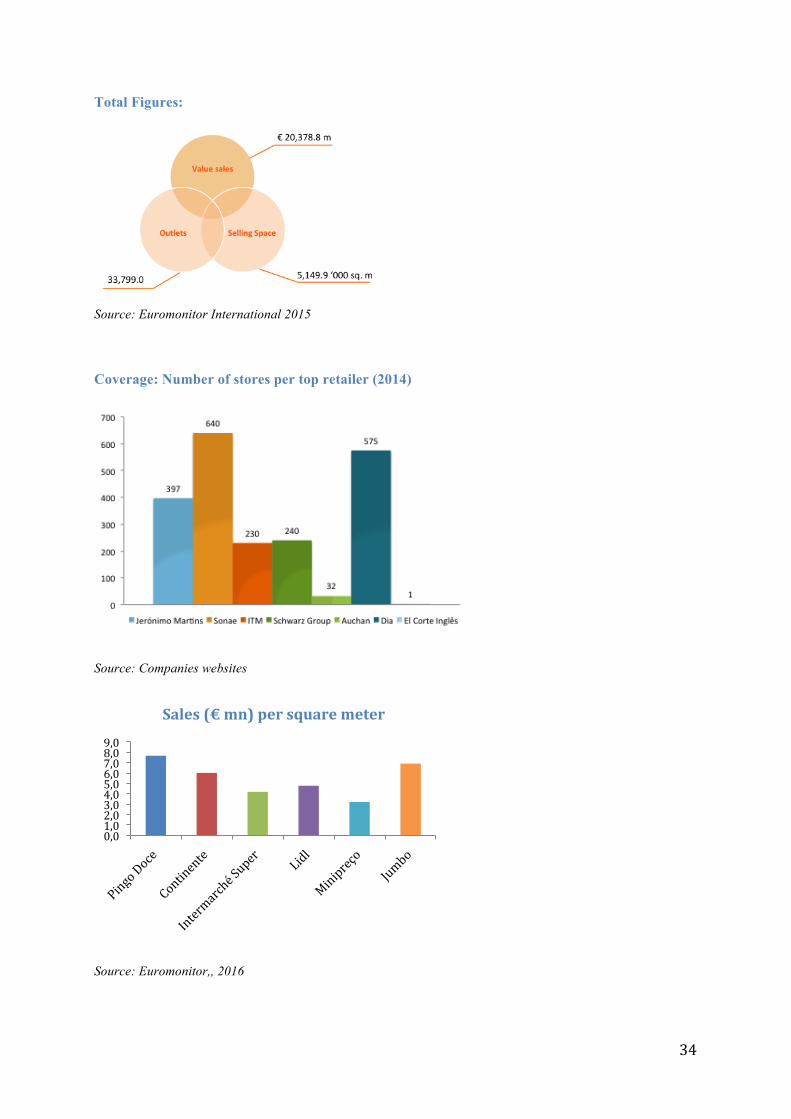
Total Figures:
Source: Euromonitor International 2015
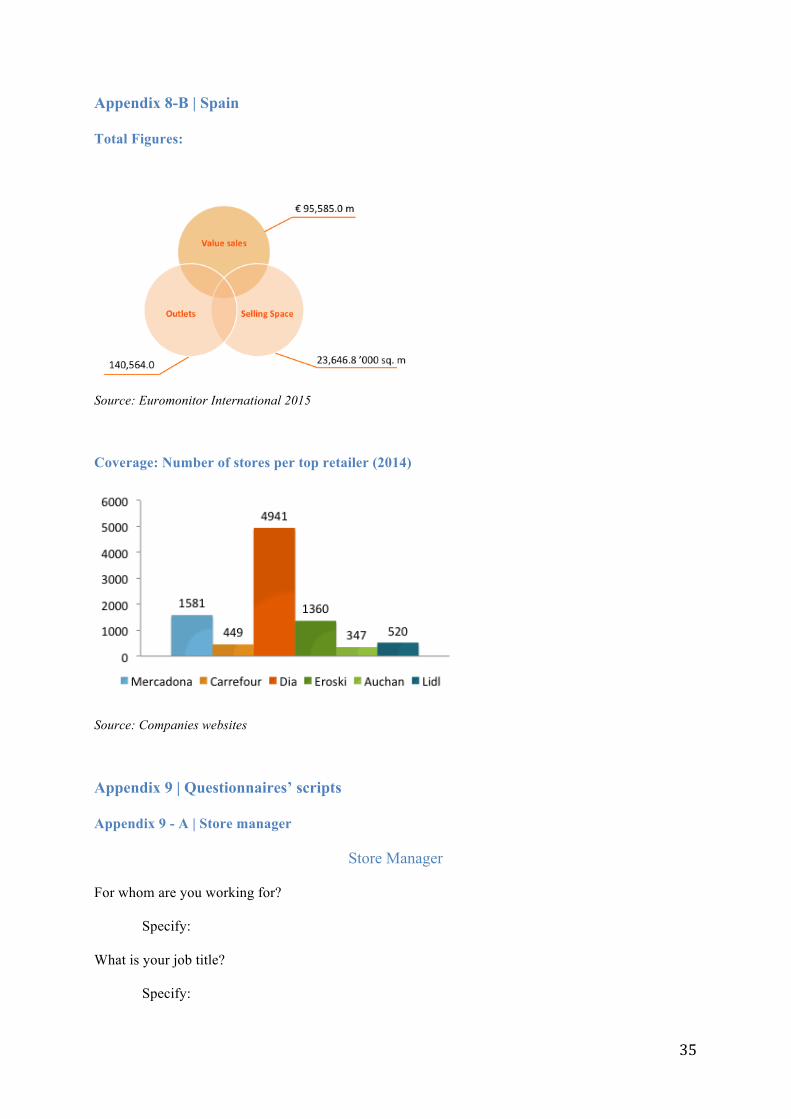
Coverage: Number of stores per top retailer (2014)
Source: Companies websites
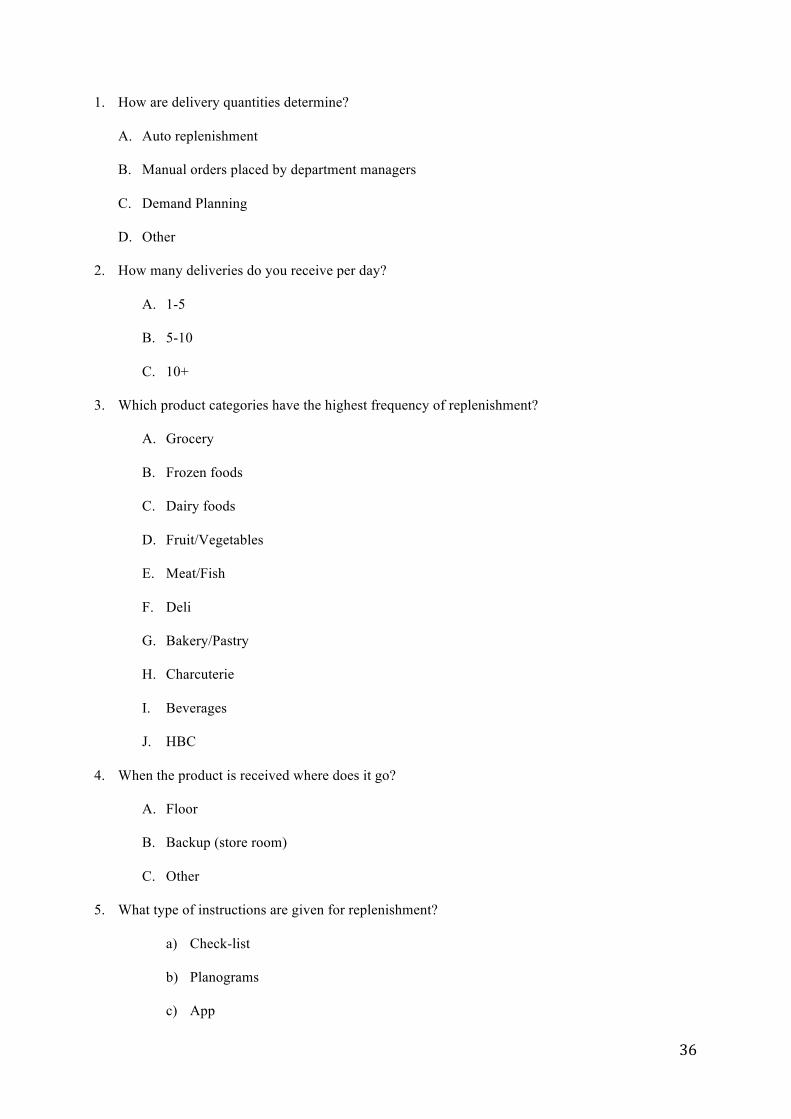
Source: Euromonitor,, 2016
0,01,02,03,04,05,06,07,08,09,0
Sales(€mn)persquaremeter
35
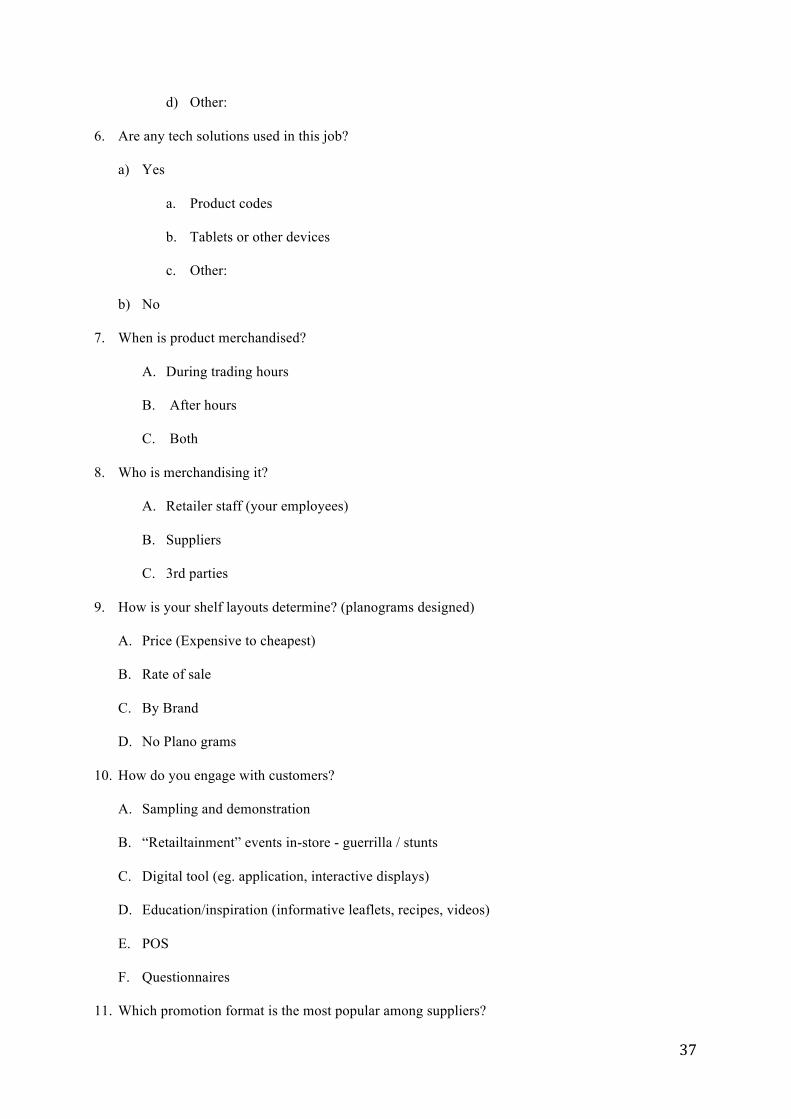
Appendix 8-B | Spain
Total Figures:
Source: Euromonitor International 2015
Coverage: Number of stores per top retailer (2014)
Source: Companies websites
Appendix 9 | Questionnaires’ scripts
Appendix 9 - A | Store manager
Store Manager For whom are you working for?
Specify:
What is your job title?
Specify:
36
1. How are delivery quantities determine?
A. Auto replenishment
B. Manual orders placed by department managers
C. Demand Planning
D. Other
2. How many deliveries do you receive per day?
A. 1-5
B. 5-10
C. 10+
3. Which product categories have the highest frequency of replenishment?
A. Grocery
B. Frozen foods
C. Dairy foods
D. Fruit/Vegetables
E. Meat/Fish
F. Deli
G. Bakery/Pastry
H. Charcuterie
I. Beverages
J. HBC
4. When the product is received where does it go?
A. Floor
B. Backup (store room)
C. Other
5. What type of instructions are given for replenishment?
a) Check-list
b) Planograms
c) App
37
d) Other:
6. Are any tech solutions used in this job?
a) Yes
a. Product codes
b. Tablets or other devices
c. Other:
b) No
7. When is product merchandised?
A. During trading hours
B. After hours
C. Both
8. Who is merchandising it?
A. Retailer staff (your employees)
B. Suppliers
C. 3rd parties
9. How is your shelf layouts determine? (planograms designed)
A. Price (Expensive to cheapest)
B. Rate of sale
C. By Brand
D. No Plano grams
10. How do you engage with customers?
A. Sampling and demonstration
B. “Retailtainment” events in-store - guerrilla / stunts
C. Digital tool (eg. application, interactive displays)
D. Education/inspiration (informative leaflets, recipes, videos)
E. POS
F. Questionnaires
11. Which promotion format is the most popular among suppliers?
38
A. Sampling
B. Special Fridges
C. Ends of aisles
D. Posters / stickers on the floor / cardboard signs or stands
E. Coupons
F. Other:
12. Which brands of products engage more in promotions?
a) Manufacturer brands (e.g. Unilever, P&G)
b) Retailer brands
c) Seasonal products
d) Fresh products
e) Other:
Appendix 9 - B | Stocker
Stocker For whom are you working for?
Specify:
What is your job title?
Specify:
13. Which product categories have the highest frequency of replenishment?
K. Grocery
L. Frozen foods
M. Dairy foods
N. Fruit/Vegetables
O. Meat/Fish
P. Deli
Q. Bakery/Pastry
R. Charcuterie
S. Beverages

39
T. HBC
14. When the product is received where does it go?
D. Floor
E. Backup (store room)
F. Other
15. When is product merchandised?
D. During trading hours
E. After hours
F. Both
16. Who is merchandising it?
D. Retailer staff (your employees)
E. Suppliers
F. 3rd parties
17. If you could choose one, where do you feel the most improvement is needed?
A. Stock ordering
B. Stock replenishment
C. Planogram design
D. Customer engagement
18. What type of instructions are given for replenishment?
e) Check-list
f) Planograms
g) App
h) Other:
19. Are any tech solutions used in this job?
c) Yes
a. Product codes
b. Tablets or other devices
c. Other:
40
d) No
Appendix 9 - C | Promoter
Promoter For whom are you working for?
Specify:
What is your job title?
Specify:
20. Who is merchandising products in-store?
G. Retailer staff
H. Suppliers
I. 3rd parties
21. How do you engage with customers?
G. Sampling and demonstration
H. “Retailtainment” events in-store - guerrilla / stunts
I. Digital tool (eg. application, interactive displays)
J. Education/inspiration (informative leaflets, recipes, videos)
K. POS
L. Questionnaires
22. Which promotion format is the most popular among suppliers?
G. Sampling
H. Special Fridges
I. Ends of aisles
J. Posters / stickers on the floor / cardboard signs or stands
K. Coupons
L. Other:
23. If you could choose one, where do you feel the most improvement is needed?
E. Stock ordering
F. Stock replenishment
41
G. Planogram design
H. Customer engagement
24. Who provides you with the promotion plans/check-list?
a) Retailer
b) Brand manufacturer
c) Event company
d) Other:
25. Which brands of products engage more in promotions?
f) Manufacturer brands (e.g. Unilever, P&G)
g) Retailer brands
h) Seasonal products
i) Fresh products
j) Other:
26. What type of technical services/solutions do you use in this job?
a) None
b) Product codes
c) Survey apps (e.g. on a tablet)
d) Other:
27. Who does the training for you (promoter)?
a) The retailer
b) Another service provider
- Who?
42
Appendix 10 | Results of the questionnaires
Portugal
Spain
43
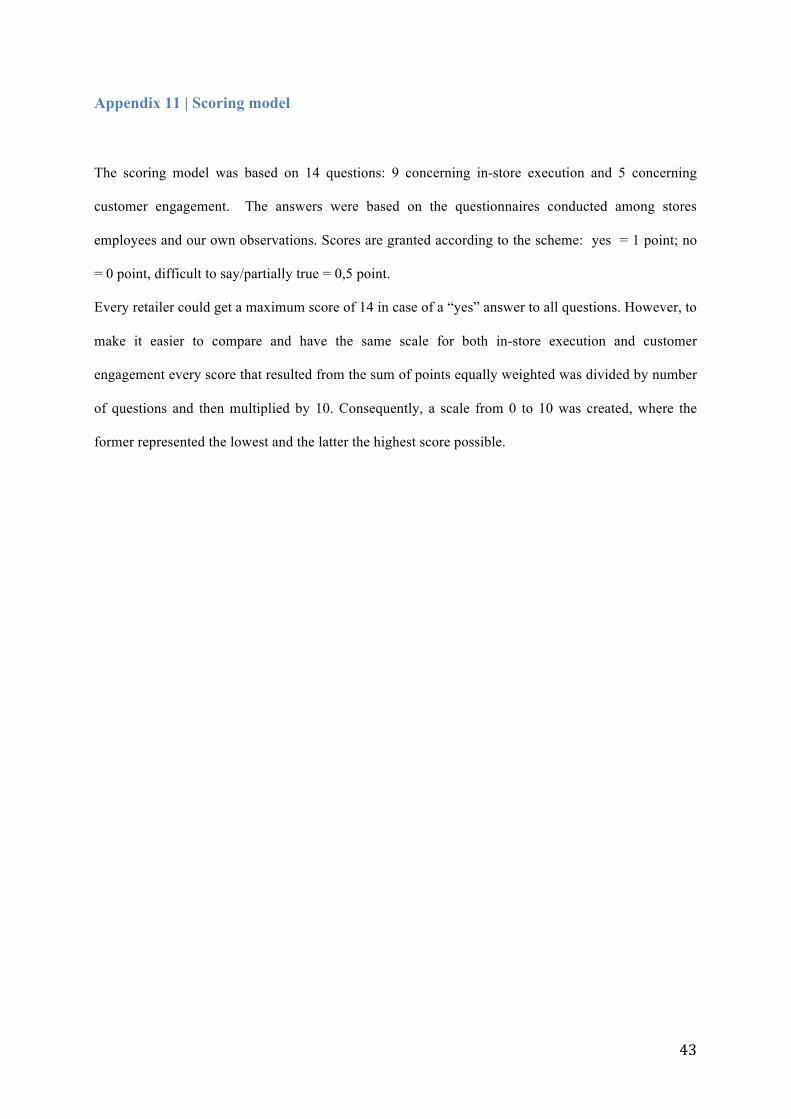
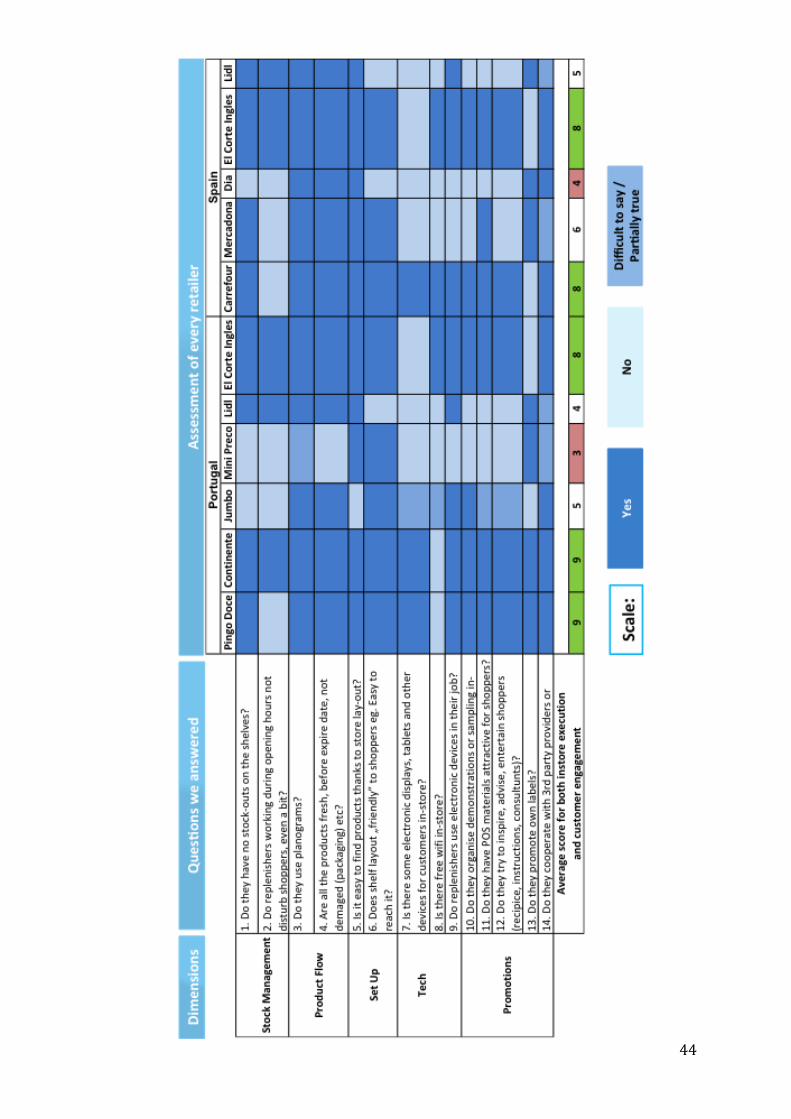
Appendix 11 | Scoring model
The scoring model was based on 14 questions: 9 concerning in-store execution and 5 concerning
customer engagement. The answers were based on the questionnaires conducted among stores
employees and our own observations. Scores are granted according to the scheme: yes = 1 point; no
= 0 point, difficult to say/partially true = 0,5 point.
Every retailer could get a maximum score of 14 in case of a “yes” answer to all questions. However, to
make it easier to compare and have the same scale for both in-store execution and customer
engagement every score that resulted from the sum of points equally weighted was divided by number
of questions and then multiplied by 10. Consequently, a scale from 0 to 10 was created, where the
former represented the lowest and the latter the highest score possible.
44
45
In-store execution In-store customer engagement
Portugal
-Pingo Doce 7,8 10
- Continente 7,8 10
- Mini Preço 2,8 3
- Lidl 6,7 3
- Jumbo 4,5 6
- El Corte Inglés 8,9 8
Spain
- Mercadona 6,7 5
-Carrefour 8,9 8
- Dia 3,4 4
- Lidl 6,7 3
- El Corte Inglés 8,9 8
Appendix 12 | Benchmark analysis: services offered
Execution
46
Customer engagement
Appendix 13 | Presence in geographical markets
47
Appendix 14 | Benchmark analysis: Partners
Appendix 15 | Gap analysis
Appendix 15 - A | Source: Retailer needs VS Market offer
48
Appendix 15 - B | Source: Competitors offer VS DW Offer
49
Appendix 15 - C | Source: Suppliers want VS Retailers offer
Appendix 16 | Go-to-market strategies
Appendix 16- A | Prioritization
50
51
Appendix 16-B | Portugal
52
Appendix 16-C | Spain
53
References • Daymon Worldwide. 2016. Daymon Worldwide. http://www.daymon.com/who-we-are/our-
business/. (accessed May 2, 2016)
• Daymon Worldwide. 2016. “Daymon Worldwide History”.
https://www.youtube.com/watch?v=g17PhORUTkU)
• Porter, Michael. May 1987. “From competitive advantage to corporate strategy”, Harvard
Business School.
• Daymon Worldwide. 2016. “Our business”. http://www.daymon.com/who-we-are/our-
business/. (accessed May 2, 2016)
• Daymon Worldwide. 2016. “Our people”. http://www.daymon.com/who-we-are/our-
people/founders/. (accessed May 2, 2016)
• Daymon Worldwide. 2016. “Our global presence. http://www.daymon.com/who-we-are/our-
global-presence/. (Accessed 2 May, 2016)
• Dave Fedewa and Guillermo Lopez Velarde, 2013. “Bringing the voice of the customer into
the factory”. McKinsey Quarterly
• Nielsen. 2014. “The state of private label around the world”. November, 5
• Nielsen. 2014. “The state of private label around the world”. November, 3-4
• Euromonitor. 2016. “Grocery Retailers in Spain”, January.
http://www.euromonitor.com/grocery-retailers-in-spain/report
• Collis & Montgomery, “A resource based approach”, 2nd edition
• Euromonitor. “Grocey retailers in Portugal”. 22 January.
http://fesrvsd.fe.unl.pt:2117/portal/analysis/tab
• Sociprime Website. 2016. Sociprime. http://www.sociprime.com/#!inicio/mainPage (accessed
March 16, 2016)
• Clara Cunha Website. 2016. Clara Cunha. http://www.clara-cunha.pt (accessed March 16,
2016)
54
• Promoworks Wbsite. 2016. Promoworks. http://www.promoworks.agency. (accessed March
16, 2016)
• RetailNext Website. 2016. RetailNext. http://retailnext.net/en/home/. (accessed March 16,
2016)
• Highscore Website. 2016. Highscore. http://www.highscore.com.pt. (accessed March 16).
CPM Website. 2016. CPM. http://www.cpm-int.com/en/home. (accessed March 16, 2016)
• Smollan Website. 2016. Smollan. http://www.smollan.com. (accessed March 16, 2016)
• Bonsor, Kevin . “How Augmented Reality Works”.
http://computer.howstuffworks.com/augmented-reality.htm (accessed on May 14, 2016
• Collis and Montgomery, “Resources and rents” in A resource based approach, 2nd edition, 30-
44
• Ghemawat, Pankaj; Reiche ,Sebastian; Rosenberg, Michael. Winter 2011. “The globalization
of business enterprise”. IESE Business School. 3-4
• “Perspectives on retail and consumer goods”. Spring 2013 McKinsey & Company. Number 1
• Meza, Sergio. 2009. “Do private labels increase retailer bargaining power?” PhD diss. New
Yorl University
• Kadiyali, Vrinda, N. Vilcassin, and Pradeep K. Chintagunta (2000), “Power in manufacturer-
retailer interactions: An empirical investigation of pricing in a local market,” Marketing
Science, 19, 2, 127-158
• Koen A. M. De Jong. 2015 . “Managing Private labels – Sharing knowledge from research
and practice”. First edition 2015. City. IPLC BV
• Misra, Sanjog and Sanjib K. Mohanty (2008) “Estimating bargaining games in distribution
channels,” working paper
• Narasimhan, Chakravarthi and Ronald T. Wilcox (1998) “Store brands and channel
relationship: a cross-category analysis”, Journal of business, vol 71, nº 4, 573-600
• Pauwels Koen and Shuba Srinivasan (2004), “Who benefits from store brand entry?”
Marketing science 23
55
• GANESH IYER And J. MIGUEL VILLAS-BOAS (2003), “A bargaining theory of
distribution channels”, Journal of Marketing Research, Vol. XL (February 2003), 80–100
• Scott-Morton, Fiona and Florian Zettelmeyer, (2004). “The strategic positioning of store
brands in retailer-manufacturer negotiations,” Review of industrial organization 24:161-194
• The Hofstede Center, 2016. ITIM international. https://geert-hofstede.com/portugal.html. (
Accessed May 15 2016
• Schwartz, Tony. 2012. “Seeing Through Your Blind Spots”. Harvard Business School. August
15
• “The Enneagram In Business: A Powerful Tool For Effective Change”, (accessed May19
2016) http://www.enneagram.net/enneagram-in-business.html
Recommended