1
Improving the Strength of Sandy Soils via Ureolytic CaCO3
Solidification by Sporosarcina ureae
Justin Michael Whitaker1, Sai Vanapalli
2, and Danielle Fortin
1;
5 1Department of Earth and Environmental Sciences (413-ARC). University of Ottawa, K1N 6N5, Ottawa, ON,
Canada 2Department of Civil Engineering (A015-CBY). University of Ottawa, K1N 6N5, Ottawa, ON, Canada
Correspondence to: D. Fortin ([email protected]) 10
Key words: Urease, calcite precipitation, MICP, Sporosarcina, Bacillus, biomineralisation, biofilm
Abstract
15
'Microbial induced carbonate precipitation' (MICP) is a biogeochemical process that can be applied to strengthen
materials. The hydrolysis of urea by microbial catalysis to form carbonate is a commonly studied example of MICP.
In this study, Sporosarcina ureae, a ureolytic organism, was compared to other ureolytic and non-ureolytic
organisms of Bacillus and Sporosarcina in the assessment of its ability to produce carbonates by ureolytic MICP for
ground reinforcement. It was found that S. ureae grew optimally in alkaline (pH ~9.0) conditions which favoured 20
MICP and could degrade urea (U/mL = µmol/min.mL.OD600) at levels (30.28 U/mL) similar to S. pasteurii (32.76 U/mL),
the model ureolytic MICP organism. When cells of S. ureae were concentrated (OD600 ~15-20) and mixed with cementation
medium containing 0.5 M calcium chloride (CaCl2) and urea into a model sand, repeated treatments (3 x 24 h) were able to
improve the confined direct shear strength of samples from 15.77 kPa to as much as 135.80 kPa. This was more than
any other organism observed in the study. Imaging of the reinforced samples with scanning electron microscopy and 25
energy dispersive spectroscopy confirmed the successful precipitation of calcium carbonate (CaCO3), across sand particles
by S. ureae. Treated samples were also tested experimentally according to model North American climatic conditions to
understand the environmental durability of MICP. No significant (p < 0.05) change in strength was observed for samples
that underwent freeze-thaw cycling or flood-like simulations. However, shear strength of samples following acid-rain
simulations fell to 29.2% of control MICP samples. Overall, the species S. ureae was found to be an excellent organism for 30
MICP by ureolysis to achieve ground strengthening. However, the feasibility of MICP as a durable reinforcement technique
is limited by specific climate conditions (i.e. acid rain).
35
40
Comment [L1]: Typographical error corrected
Comment [L2]: L21 modification Alternative units: umol/min.mL.OD600
Comment [L3]: Typographical error corrected
2
1 Introduction
Biomediated calcium carbonate (CaCO3) production is the process by which organisms induce the precipitation of
calcium carbonate. With reference to bacterial CaCO3 precipitation, also known as, 'microbial induced carbonate
precipitation', 'microbial induced calcite precipitation' (MICP) and 'microbial induced calcium carbonate 45
precipitation' (MICCP), the phenomenon is well documented (Stocks-Fischer et al., 1999; Dejong et al., 2006;
Whiffin et al., 2007; van Paassen et al., 2010). For example, cyanobacteria precipitate CaCO3 in microbial processes
related to the shedding of the S-layer, forming the stalagmites and stalactites in limestone caves and adding to the
rocky sediments of coral reefs (Southam 2000). Crystal aggregation of CaCO3 in the kidney, urinary tract or
gallbladder have been shown to be induced by microorganisms such as Proteus mirabilis, a urease positive organism 50
due to secondary infection (Worcester and Coe 2008). Ureolytic soil organisms of the species Sporosarcina or
Bacillus, can also induce CaCO3. For example, in their cycling of nitrogen with a urease enzyme (Hammes et al.,
2003; Gower 2008; Worcester and Coe 2008). This last group of MICP producers has peeked recent engineering
interests to apply them in a bioengineering and repair context.
MICP biotechnology utilizing ureolytic soil organisms, most notably Sporosarcina pasteurii, has been shown to 55
directly reinforce or restore engineered or natural structures, such as the repair of historical monuments (Le Métayer-Levrela
et al., 1999; Webster and May 2006), marble slabs (Li and Qu 2011) and stone heritage sites (Rodriquez-Navaro et al., 2012)
and reduce weathering of soil embankments (Chu et al., 2012). The enzyme urease (urea amidohydrolase, E.C. 3.5.1.5)
initiates the process, catalyzing the breakdown of urea to raise local pH and produce CaCO3 in a solution of calcium ions
often supplied as calcium chloride (CaCl2), as summarized in equations 1 and 2 (eq. [1, 2]). The produced CaCO3 fills 60
structural gaps or bridges materials (i.e., soils grains, etc.) to form a cemented product with unconfined strengths of up to 20
MPa (Whiffin et al., 2007).
[1] CO(NH2)2 + 2 H2O <--> 2 NH4+ + CO3
2- (Urea Hydrolysis)
[2] 2 NH4+ + CO3
2- + CaCl2 <--> CaCO3 + 2 NH4Cl (CaCO3 Formation)
Bacterial species such as Bacillus sphaericus (van Tittelboom et al., 2010) and Bacillus megaterium (Krishnapriya et
al., 2015) have also been applied in material or volume strengthening. The aforementioned ureolytic soil organisms 65
are attractive for MICP as they are, 'generally regarded as safe', (GRAS) bacteria with accessible substrates (i.e.,
urea) and an aerobic metabolism applicable to most engineering and terrestrial environments (DeJong et al., 2006).
These gram positive organisms offer other attractive features such as spore forming capability allowing for long
term capsule storage in cements (Jonkers 2011) and exopolysaccharide (EPS) secretion for improved material
bonding (Bergdale 2012). 70
The application of MICP in industry as a biotechnology is proposed to help reduce the need for current structure
repair practices such as chemical grouting, which have been found to be environmentally detrimental in its
permanence (DeJong et al., 2010) and, in some cases, posing serious human health risks (Karol 2003). That said,
ureolytic MICP does produce excess ammonia which can be harmful (van Paassen et al., 2010). The use of
Comment [L4]: Typographical error; removed „see also‟
Comment [L5]: Editorial comment Chemical formula changed
3
nitrifying and denitrifying bacteria could help solve this issue by oxidizing ammonia to nitrate and later nitrogen gas without 75
affecting MICP. In fact, the work of Gat et al. (2014) has shown co-cultures of ureolytic and non-ureolytic bacteria can
actually be beneficial to MICP. Alternatively, denitrifying bacteria can be used to directly induce MICP to avoid ammonia
toxicity, though the level of CaCO3 is comparatively less to ureolytic MICP and harmful nitrites can build up in solution (van
Paassen et al. 2010). Other pathways to achieve MICP have also been explored with B. megaterium and B. sphaericus (Kang
et al., 2015; Li et al., 2015). 80
Problems on large scale application of the MICP technology have occurred too and remain unsolved. Research by van
Paassen et al. (2009) found poor sample homogeneity of MICP as well as decreasing biomass and urease-inducing CaCO3
activity over time and increasing soil depth in a pilot 100 m3 sand study using Sporosarcina pasteurii, attributing these
heterogeneities mostly to the application process. Alternative metabolisms and bacteria for large scale applications in
biomineralization of CaCO3 have also been investigated by the group (van Paassen et al., 2010). Indeed, it has been 85
commented that the type of bacteria utilized is one of the major considerations and potential limitations in large scale
geotechnical operations (Mitchell and Santamarina, 2005).
Therefore, the search for new bacteria by which to achieve viable levels of MICP is important for optimizing the protocol
best suited (in terms of performance, economics and environmental impact) for marketing in green industry (van Paassen et
al., 2010; Cheng and Cord-Ruwisch 2012; Patel 2015). Following a literature review of the nine documented species of 90
Sporosarcina (Claus and Fahmy, 1986), seven species were found to be urease positive and distinct from Sporosarcina
pasteurii as alternative ureolytic MICP sources. While no candidate improves on some of the short comings of ureolytic
MICP (i.e., ammonia toxicity), each candidate was found to be poorly investigated in the current MICP technology, despite
fitting the ureolytic model for MICP. One candidate, Sporosarcina ureae was selected at random for investigation as it was
deemed appropriate to explore the feasibility of a single candidate species in thorough comparison to other, already published 95
species applied in ureolytic MICP.
Thus, the primary goal of this study was to investigate the suitability of S. ureae as a MICP organism in material
improvement by testing it experimentally against the previously investigated species of Sporosarcina pasteurii, Bacillus
megaterium and Bacillus sphaericus. In its assessment, a parallel investigation was also performed to assess how the MICP
technology, utilizing S. ureae as the candidate MICP organism, can perform under various environmental conditions 100
including acid rain, flooding and freeze-thaw cycling concurrent with colder North American climates.
2 Materials and methods
2.1 Bacteria strains, media, culture and stock conditions 105
Strains of Sporosarcina ureae (BGSC 70A1), Bacillus megaterium (BGSC 7A16), Lysinibacillus sphaericus (BGSC
13A4; previously known as Bacillus sphaericus [Ahmed et al., 2007]) and Bacillus subtilis (BGSC 3A1T) were obtained
from the Bacillus Genetic Stock Centre (BGSC).
Sporosarcina pasteurii (ATCC 11859), previously known as Bacillus pasteurii (Yoon et al., 2001), was kindly donated by 110
the group of Rodrigues et al. (University of Houston, USA). Escherichia coli DH5aTM
was obtained from ThermoFisher. S.
ureae and S. pasteurii strains were grown at 30 oC in a modified ATCC 1832 medium as follows: 5 g/L yeast extract (YE)
Comment [L6]: Editorial comment Typographical error corrected
Comment [L7]: Editorial comment Rearranged literature sources chronologically.
Comment [L8]: Editorial comment Typographical error corrected
Comment [L9]: While not suggested, previous Genus designation stated
Comment [L10]: Previous Genus designation stated as suggested
4
(BD BactoTM
), Tris-Base (TrizmaTM
), 5 g/L ammonium sulfate (Molecular biology grade, Sigma-Aldrich), 10 g/L urea
(Molecular biology grade, Sigma-Aldrich), pH 8.6 . The culture broth, ATCC Medium 3 (3 g/L Beef extract [BD BactoTM
]
and 5 g/L peptone [BD BactoTM
]) was used for B. megaterium, L. sphaericus and B. subtilis. and grown at 30 oC, unless 115
otherwise specified. Colonies of Bacillus and Sporosarcina were maintained on plates prepared as described supplemented
with 15 g/L agar [BD DifcoTM
] . E. coli was grown in Luria-Bertani (LB) broth (10 g/L tryptone [Molecular biology grade,
Sigma-Aldrich], 5 g/L yeast extract [BD BactoTM
], 10 g/L NaCl [Molecular biology grade, Sigma-Aldrich], pH 7.5) and
maintained on LB plates at 37 oC supplemented with 15 g/L agar (BD Difco
TM). Long term stocks of all cultures were
prepared as described (Moore and Rene, 1975) but using dry ice as the freezing agent. 120
2.2 Chemical and Biological Analysis
2.2.1 Culturing
125
Single colonies were lifted and grown overnight at 200 RPM in 5mL of respective strain culture medium in a 15 mL
Corning Falcon© tube. The overnight stock was combined with 200 mL of appropriate culture medium in a 500 mL
Erlenmeyer flask and cultured at 175 RPM. The optical density at 600 nm (OD600) was used to track changes in turbidity of
a culture volume using a Biomate UV-Vis spectrophotometer (Thermoscientific) where 1 mL of culture volume was placed
into 1.5mL polystyrene cuvettes (BioRad) of a 1 cm path length. Ultra-pure water (ddH2O) was used as a blank. At OD600 130
values greater than 0.4, samples of culture volumes were diluted 10-100X in Tris buffered saline (TBS; 50 mM Tris-base
[Trizma©, Sigma-Aldrich], 150 mM NaCl [Molecular biology grade, Sigma-Aldrich], pH 7.5) to maintain a linear
relationship between turbidity and cell growth. When OD600 reached ~ 0.5, the culture was twice spun at 5000 RPM for 5
minutes followed by a pellet re-suspension in 50 mL TBS each time. Next a fraction of volume was removed, spun at 5000
RPM for 5 minutes and re-suspended (OD600 ~ 0.2) in 200 mL of a urea broth (UB) medium in a 500 mL Corning PYREX© 135
round glass media storage bottle containing a modified Stuart's Broth (Stuart et al., 1945) as follows: 20 g/L Urea
(BioReagent, Sigma-Aldrich), 5 g/L Tris-Base (Trizma©, Sigma-Aldrich), 1 g/L glucose (Reagent grade, Sigma-Aldrich), pH
8.0, with (UB-1) or without (UB-2) 10 g/L yeast extract (YE) (BD DifcoTM
). A negative control included a medium only
condition. All steps were performed aseptically with preparations incubated at 150 RPM at 30 °C in triplicate for each
medium condition: UB-1 and UB-2. Each culture for a medium condition was staggered 10 min apart and observed for 12 h, 140
with duplicate 2.5 mL aliquots aseptically withdrawn every 1hr, beginning at time zero (t = 0 h). The entire protocol was
performed twice for a total of 6 data sets (n = 6), measured in duplicate, per culture in a single medium condition.
2.2.2 Total Ammonia (NH3-NH4+), pH and growth (OD-600) aliquots
145
To evaluate different cell parameters efficiently, duplicate aliquots (2.5mL) were taken for tracking pH, OD600 and NH3-
NH4+ production. In brief, first, whole aliquot volume pH was taken with a SB20 symphony pH probe (VWR). Next, a 1mL
volume was removed for OD600 reading as described (2.2.1). Finally, a 500 uL sample for NH3-NH4+ analysis was retrieved
and diluted in 500 uL of ddH2O and stored as described by HACH Inc. (Hach Co. 2015) with the following additional
modifications made: -20 oC storage, 1 drop 5 N H2SO4. 150
Comment [L11]: L166 modification Description of optical density / cellular density
procedure used for all aspects of the study. If desired the following procedural notes could also
be added:
While ddH2O was used as a blank, samples diluted
10-100X had a corresponding TBS sample diluted
with medium only in that range. E.g. Sample 1-10 diluted 20X in TBS (50uL culture
volume in 950uL TBS). Then, a sample diluted 20X with medium only was prepared (50mL medium in
950uL TBS). Final OD600 values reported
subtracted this value from all sample values measured for a dilution.
For undiluted samples, a sample with medium only
was prepared.
Comment [L12]: L166 modifications Based on previous calibrations performed from
recommendations in :
(1) Koch, AL. 1994. “Growth Measurement” IN:
Methods for General and Molecular Bacteriology
Gerhardt, P et al (ed) American Society for Microbiology, Washington, DC. p. 248-277.
(2) Collins and Lyne's Microbiological Methods"
( Estimating Microbial Numbers – p. 144-155)
Comment [L13]: Typographical error changed
Comment [L14]: L166 modification A fraction was equal to the volume required to reach
OD600 ~0.2 from the equation C1V1 = C2V2 where
C1 was the OD600 of the concentrated culture in TBS, and C2 = ~0.2 , V2 = 200mL and V1 = volume
to be spun down.
Comment [L15]: Editorial comment
Word change made „run‟ to „incubated‟
Comment [L16]: Typographical error changed
Comment [L17]: L151 modification URL provided for the downloadable technical
manual of total ammonia measurement by HACH.
Comment [L18]: L151 modification Sentences hereafter removed.
5
2.2.3 Spectrophotometric analysis of NH3-NH4+
Samples were thawed and neutralized with 5 N NaOH as described by HACH Inc. (Hach Co. 2015). NH3-
NH4+measurements were then performed as outlined (HACH Co. 2015) based on an adaptation of the work by Reardon et al. 155
(1966) using a portable DR2700 HACH spectrophotometer. Samples were brought to a measureable range (0.01 to 0.50
mg/L NH3-N) where required. Measurements for appropriate dilutions were made by mass and corrected to volume assuming
a density of 1 g/L. Final values were reported as, „U / mL‟ where units U = µmol of NH3-NH4+ produced per minute and
mL = mL solution normalized to culture density (OD600) starting from t = 1 h.
160
2.3 Microbial cementation
2.3.1 Model sand
Industrial quality, pure coarse silica sand (Unimin Canada Limited) was examined with the following grain 165
distribution where D10, D5o, D60 are 10 %, 50 % and 60 % of the cumulative mass: D10 = 0.62 mm, D50 = 0.88 mm,
D60 = 0.96 mm. The uniformity coefficient, Cu was 1.55 indicating a poorly graded (i.e. uniform) sand as designated by
the Unified Soil Classification System (USCS) (ASTM, 2017). A poorly graded soil was used as a model due to its
undesirable geotechnical characteristics in construction (i.e., settling) and tendency for instability in nature (i.e.,
liquefaction) (Nakata et al., 2001; Scott, 1991). 170
2.3.2 Cementation medium (CM) and culture
Cells of each strain were grown in 1L of their respective medium split into two 1 L Erlenmeyer flasks containing
500 mL medium each at 175 RPM to an OD600 of ~ 1.5 - 2.0 as described (2.2.1). Cells were then harvested and successively 175
concentrated over three runs to 50 mL. Runs involved a spin down at 5000 RPM for 5 min followed by a pellet re-
suspension in TBS. Prior to sand inoculation, 50 mL of a two-times (2X) concentrated cementation (CM) medium (2X CM;
0.5 M CaCl2 [Anhydrous granular, Sigma-Aldrich], 0.5 M urea [BioReagent, Sigma-Aldrich], 5 g/L yeast extract [YE] [BD
DifcoTM
], 50 mM Tris-Base [Trizma©, Sigma-Aldrich], pH 8) was added to the final suspension. Negative controls were 1:1
mixes of ddH2O and 2X CM as well as the non-ureolytic strain (BGSC 3A1T) B. subtilis (Cruz-Ramos et al., 1997). A 180
positive control with S. pasteurii (ATCC 11859), a ureolytic organism capable of ureolytic MICP, (van Paassen et al., 2009)
was also run. The procedure was repeated every 24 h to provide fresh cells for injection during cementation trials.
2.3.3 Sample preparation and cementation trial
185
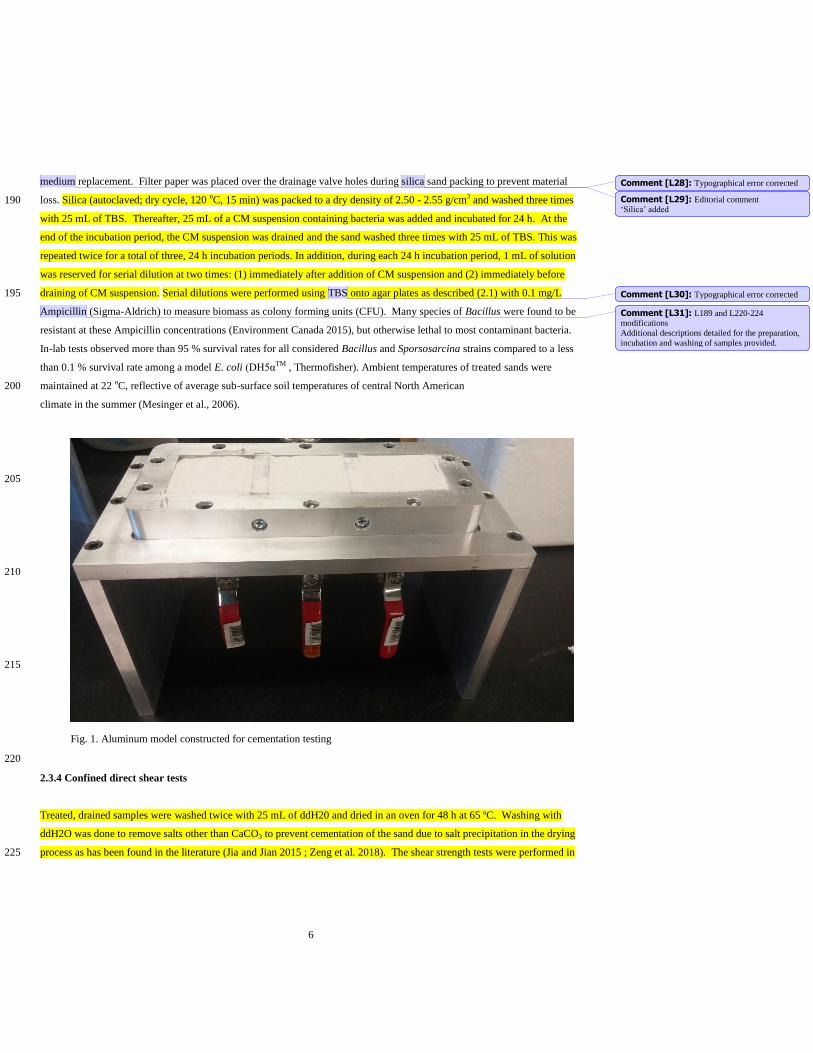
Triplicate test units were constructed from aluminum (Fig. 1), each housing a triplicate set of sample moulds
measuring 60 x 60 x15 mm. Moulds were sized according to the sample intake for the direct shear apparatus
(Model: ELE-26-2112/02) utilized in confined shear tests. Each mould was equipped with a drainage valve for
Comment [L19]: L151 modification Original literature report adapted for total ammonia analysis provided for additional clarity.
Comment [L20]: L147 modification Density assumption stated here only.
Comment [L21]: L274 modification Alternative definition: umol of NH3-NH4+ produced
per minute per mL solution, normalized to cellular density (OD600) , where U / mL =
umol/min/mL/OD600.
Comment [L22]: L163: Please see USCS designations for a sand that is „poorly graded‟ (i.e.
having uniform particle sizes) and „coarse‟ grained (i.e. > 50% mass retained on no. 200 sieve with >
50% passing no. 4 sieve) with less than 5% fines.
See ASTM 2011.
A convenient web link:
https://en.wikipedia.org/wiki/Unified_Soil_Classific
ation_System
Comment [L23]: L166 modification
Comment [L24]: Typographical error corrected
Comment [L25]: Editorial comment „Fresh sample inoculate‟ to „fresh cells‟
Comment [L26]: Typographical error corrected
Comment [L27]: Editorial comment „had equipped‟ to „was equipped‟
6
medium replacement. Filter paper was placed over the drainage valve holes during silica sand packing to prevent material
loss. Silica (autoclaved; dry cycle, 120 oC, 15 min) was packed to a dry density of 2.50 - 2.55 g/cm
3 and washed three times 190
with 25 mL of TBS. Thereafter, 25 mL of a CM suspension containing bacteria was added and incubated for 24 h. At the
end of the incubation period, the CM suspension was drained and the sand washed three times with 25 mL of TBS. This was
repeated twice for a total of three, 24 h incubation periods. In addition, during each 24 h incubation period, 1 mL of solution
was reserved for serial dilution at two times: (1) immediately after addition of CM suspension and (2) immediately before
draining of CM suspension. Serial dilutions were performed using TBS onto agar plates as described (2.1) with 0.1 mg/L 195
Ampicillin (Sigma-Aldrich) to measure biomass as colony forming units (CFU). Many species of Bacillus were found to be
resistant at these Ampicillin concentrations (Environment Canada 2015), but otherwise lethal to most contaminant bacteria.
In-lab tests observed more than 95 % survival rates for all considered Bacillus and Sporsosarcina strains compared to a less
than 0.1 % survival rate among a model E. coli (DH5αTM
, Thermofisher). Ambient temperatures of treated sands were
maintained at 22 oC, reflective of average sub-surface soil temperatures of central North American 200
climate in the summer (Mesinger et al., 2006).
205
210
215
Fig. 1. Aluminum model constructed for cementation testing
220
2.3.4 Confined direct shear tests
Treated, drained samples were washed twice with 25 mL of ddH20 and dried in an oven for 48 h at 65 ºC. Washing with
ddH2O was done to remove salts other than CaCO3 to prevent cementation of the sand due to salt precipitation in the drying
process as has been found in the literature (Jia and Jian 2015 ; Zeng et al. 2018). The shear strength tests were performed in 225
Comment [L28]: Typographical error corrected
Comment [L29]: Editorial comment „Silica‟ added
Comment [L30]: Typographical error corrected
Comment [L31]: L189 and L220-224 modifications
Additional descriptions detailed for the preparation,
incubation and washing of samples provided.
7
a direct shear machine (Model: ELE-26-2112/02). Unless otherwise specified, shear tests were performed on samples with an
applied normal stress of 25 kPa. Shear stress was then applied to failure at a rate of 2.5 mm/min under dry and drained
conditions. Stress-strain curves were acquired via LabView data acquisition software.
2.4 Scanning electron microscopy (SEM) observation 230
Silica grains from the surface layer of treated, washed and dried sands were observed to confirm the crystalline nature of the
resulting precipitates using a JEOL6610LV scanning electron microscope (5 kV). Elemental composition of surface
structures was analyzed, in parallel, by energy dispersive x-ray spectroscopy (EDS).
235
2.5 Environmental simulation tests
2.5.1 Water flushing
The ability for cured samples to perform following a one month saturation period was tested. Treated silica sands were 240
incubated with ddH2O over 6 periods of incubation. Each period involved injection of 25 mL of ddH2O
followed by a 5 day treatment under ambient temperature of 22 oC. Volumes were replaced at the end of each
period. No aliquots for colony counts were taken.
2.5.2 Ice-water cycling 245
To understand the degree to which ice cycling impacted the shear strength of treated silica sand, a selected number of
samples were treated over 6 periods of ddH2O incubation as described immediately above. However, each period began with
a freezing at -20 oC for 24 h, holding for 3 days at -20
oC, followed by a thawing for 24 h at 22
oC. The selected
maximum and minimum temperatures reflect those capable of being reached in Ontario winters and summer 250
(Canada), respectively, according to Environment Canada (Climatic station: Ottawa CDA) (Government of Canada
2017).
2.5.3 Acid erosion
255
Formulation of an acid rain model was made according to average pH values (pH ~ 4.4) of rainfalls reported for
North-Eastern regions of North America (Environment Canada, 2013). The final pH was adjusted using
concentrated sulfuric acid (H2SO4). One delivery volume of acid rain was equivalent to the average monthly
precipitation of a North American region (April, Ottawa, Canada), calculated from records of Environment Canada
(Climatic station: Ottawa CDA) (Government of Canada 2017). Rain was delivered as described for 'Water 260
Flushing' with ddH2O but for a single incubation period. Following incubation, the treated volumes were flushed
with 25 mL of ddH2O.
Comment [L32]: L220-224 The washing, drying and testing methods are
described and made more clear L230/231 modification
The effect of drying is discussed
Comment [L33]: L228 : Editorial comment
Replaced „Visualization‟ with „observed‟
Comment [L34]: L236 modification. Wording changed to reflect the incubation period.
Comment [L35]: Typographical change made
Comment [L36]: Editorial comment
Change from „the trials‟ and „withstand‟ to „treated silica sand‟ and „impacted‟.
8
2.6 Statistical processing
265
All statistical manipulations were performed in Excel (2007). Sample means were reported alongside the standard
error of the mean (SE) or standard deviation (SD). Normality of all data sets were confirmed with the Anderson-
Darling test (α = 0.05). The Student's t-test (unpaired, two-tailed; α = 0.05) was utilized to compare sample means
of experimental conditions for statistical significance. Prior to each t-test, homogeneity of variances for data sets were
determined using a F-test (α = 0.05). Where variances were statistically observed as unequal, a Welch's t-test was adapted to 270
test statistical significance between two sample means.
3 Results
3.1 NH3-NH4+ production 275
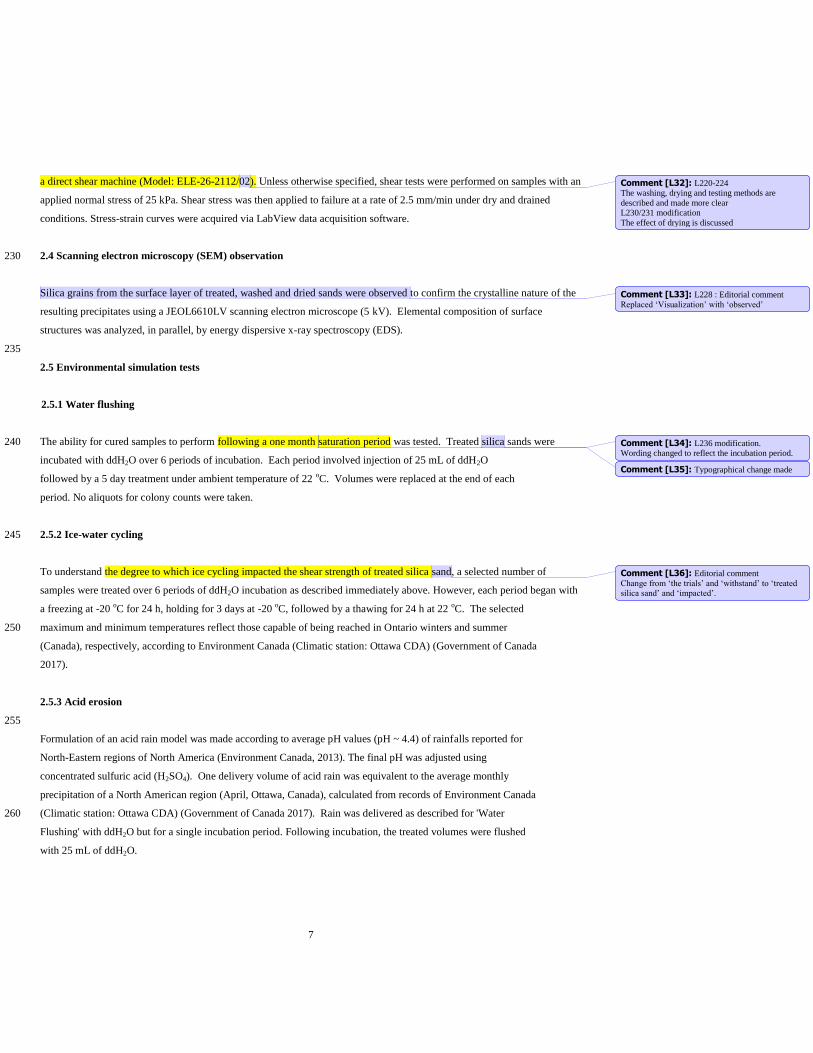
Among the different bacterial strains considered, S. pasteurii (32.50 U/mL [UB-1]; 32.76 U/mL [UB-2]) and S.
ureae (29.00 U/mL [UB-1]; 30.28 U/mL [UB-2]) were capable of producing the first and second highest levels of
NH3-NH4+, respectively, per unit of time, in both UB-1 and UB-2 medium (Fig. 2). Isolates of B. subtilis (2.91
U/mL), B. megaterium (4.87 U/mL) and L. sphaericus (5.89 U/mL) displayed a lower peak of NH3-NH4+ production 280
in both media. When urea in medium moved from the sole source (i.e., UB-2) to one of a number of sources (i.e., UB-1) for
nitrogen, NH3-NH4+ production dropped to near zero values (Fig. 2) for B. subtilis (0.44 U/mL), B.
megaterium (0.56 U/mL) and L. sphaericus (1.20 U/mL) that were statistically significantly different (p < 0.05, n = 6) from
the final UB-1 values for each species. However, isolates of S. ureae and S. pasteurii observed no statistically significant
difference (p > 0.05, n = 6) between final values recorded in UB-1 and UB-2 medium. Instead, a rise in production (t = 0 – 5 285
h) followed by a levelling off in value (t = 6 – 12 h) was the general trend observed in UB-1 and UB-2 medium (Fig. 2).
290
295
Comment [L37]: Typographical change made
Comment [L38]: Modifications made to clarify
that urea was the only source of nitrogen in UB-2 while one of a number of sources for nitrogen in UB-
1.
Comment [L39]: „significant‟ reworded to
„statistically different‟
Comment [L40]: „non significant‟ reworded to „no statistically significant difference‟
Comment [L41]: Typographical change made
9
300
305
310
315
320
325
330
Fig. 2. (a) , (b) NH3-NH4+ production (U/mL = umol of NH3-NH4
+ / minute.mL.OD600 of culture) ; (c), (d) pH ; and (e),
(f) growth of selected bacteria types in (a) , (c) , (e) UB-2 (No YE) and (b) , (d) , (f) UB-1 (10 g/L YE) nutrient
conditions (SD, n = 6).
335
Comment [L42]: Additional suggested change based on L274 comment
10
3.2 Examination of colony growth in culture
All strains showed a decline in growth progression when medium was restricted (i.e., UB-2) to urea as nitrogen and
glucose as carbon, sources, respectively (Fig. 2). Growth repression was greatest in the cases of B. subtilis (-33.9
%), L. sphaericus (-26.8 %) and B. megaterium (-23.6 %) compared to S. pasteurii (-17.8 %) and S. ureae (-16.6 %). 340
Additionally, the final OD600 (t = 12 h) achieved for all strains in UB-2 medium was decreased compared to UB-1
medium values (t = 12 h) and the difference in value for each strain was found to be statistically significantly different (p
< 0.05, n = 6). Growth cessation (i.e. stationary phase) occurred for S. ureae and S. pasteurii in both conditions but later
in UB-1 (t = 11 h) compared to UB-2 (t = 9-10 h) medium (Fig. 2); they grew logistically in both medium conditions. In
general, growth of L. sphaericus, B. subtilis and B. megaterium in UB-2 medium followed a logistic growth curve too. 345
However, in UB-1 medium their growth fit an exponential model, whereby an exponential growth phase was observed
from t = 4 – 12 h following a lag phase of growth between t = 0 – 3 h.
3.3 Changes in pH
350
The alkalinity increased with the increase in time for the strains of S. ureae and S. pasteurii studied, in both UB-1
(8.99, 9.2) and UB-2 (8.74, 8.8) medium. The lowest final pH values were observed in L. sphaericus (7.88; 8.16),
B. megaterium (7.85 ; 7.93) and B. subtilis (7.70 ; 7.81) in UB-1 and UB-2 medium, at the end of 12 h (Fig. 2).
While pH continued to rise for S. pasteurii and S. ureae in either UB-1 or UB-2 medium, it was constant
for L. sphaericus, B. megaterium and B. subtilis after time in UB-1 medium as early as 6 h (L. sphaericus and B. 355
megaterium) in UB-2 medium. While final pH values for L. sphaericus, B. megaterium and B. subtilis
reached higher final (t = 12 h) values in UB-2 medium compared to UB-1, that were found to be statistically
significantly different (p < 0.05, n = 6), the opposite was true for S. pasteurii and S. ureae; values in UB-2 were lower
compared to UB-1 and the difference was found to be statistically significantly different for each species (p < 0.05, n =
6). In general, acidity increased with the increase in time for L. sphaericus, B. megaterium and B. subtilis in UB-1 360
medium. This was also true in UB-2 medium except for L. sphaericus which showed an increase in pH over time.
3.4 Mechanical and biological behaviour in MICP reinforced sands
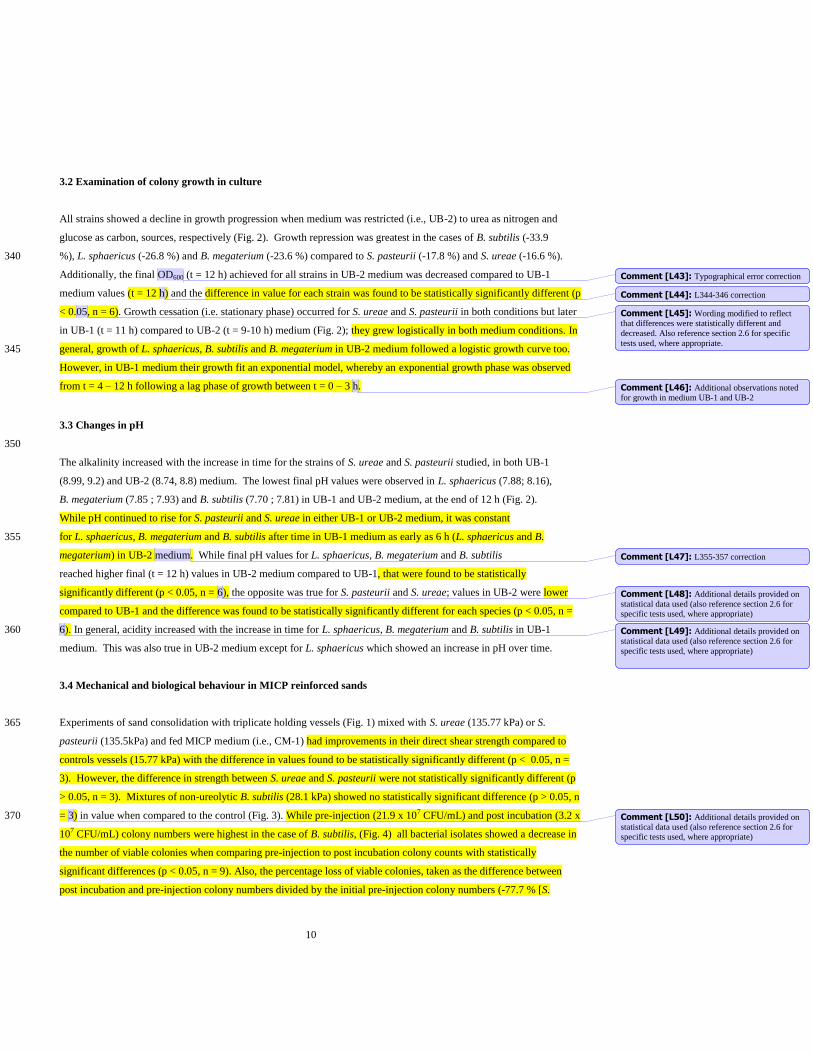
Experiments of sand consolidation with triplicate holding vessels (Fig. 1) mixed with S. ureae (135.77 kPa) or S. 365
pasteurii (135.5kPa) and fed MICP medium (i.e., CM-1) had improvements in their direct shear strength compared to
controls vessels (15.77 kPa) with the difference in values found to be statistically significantly different (p < 0.05, n =
3). However, the difference in strength between S. ureae and S. pasteurii were not statistically significantly different (p
> 0.05, n = 3). Mixtures of non-ureolytic B. subtilis (28.1 kPa) showed no statistically significant difference (p > 0.05, n
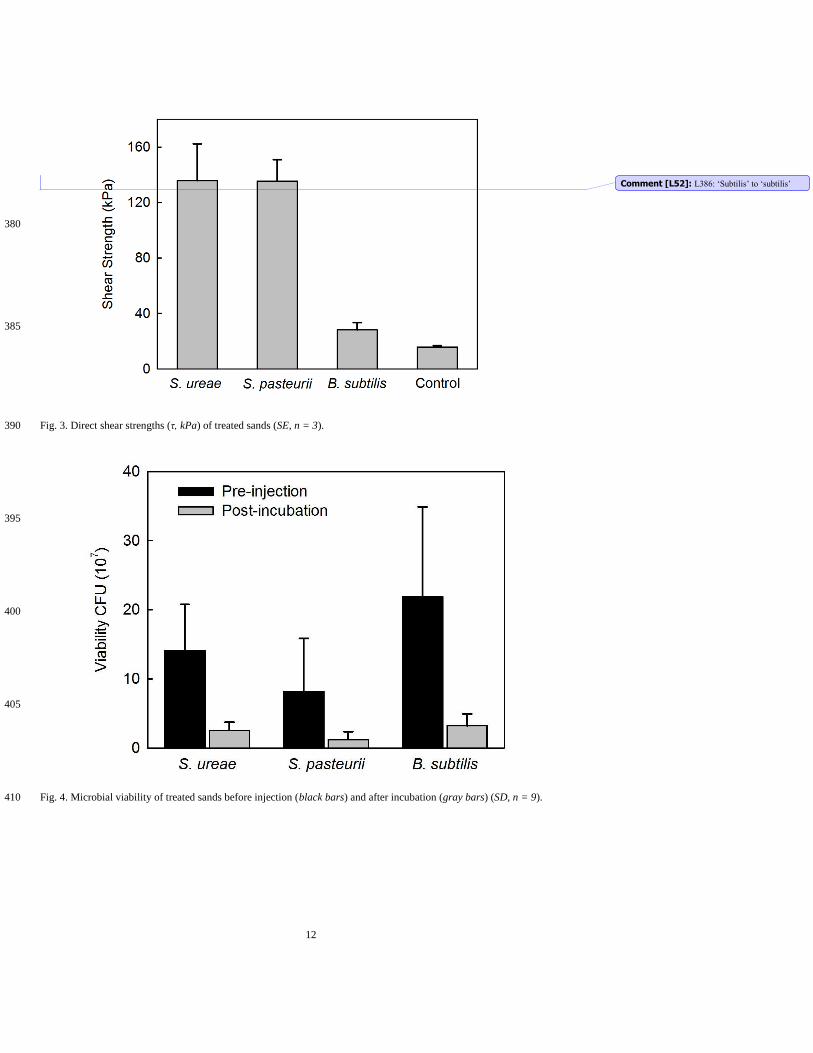
= 3) in value when compared to the control (Fig. 3). While pre-injection (21.9 x 10⁷ CFU/mL) and post incubation (3.2 x 370
107 CFU/mL) colony numbers were highest in the case of B. subtilis, (Fig. 4) all bacterial isolates showed a decrease in
the number of viable colonies when comparing pre-injection to post incubation colony counts with statistically
significant differences (p < 0.05, n = 9). Also, the percentage loss of viable colonies, taken as the difference between
post incubation and pre-injection colony numbers divided by the initial pre-injection colony numbers (-77.7 % [S.
Comment [L43]: Typographical error correction
Comment [L44]: L344-346 correction
Comment [L45]: Wording modified to reflect that differences were statistically different and
decreased. Also reference section 2.6 for specific
tests used, where appropriate.
Comment [L46]: Additional observations noted for growth in medium UB-1 and UB-2
Comment [L47]: L355-357 correction
Comment [L48]: Additional details provided on statistical data used (also reference section 2.6 for specific tests used, where appropriate)
Comment [L49]: Additional details provided on statistical data used (also reference section 2.6 for
specific tests used, where appropriate)
Comment [L50]: Additional details provided on statistical data used (also reference section 2.6 for specific tests used, where appropriate)

11
ureae], -75.4 % [S. pasteurii], -77.7 % [B. subtilis]) were not statistically significantly different (p > 0.05, n = 9) when 375
comparing values between species. Of note, the medium-only control observed no colony growth before and after
incubation.
Comment [L51]: L371-373 corrections
12
380
385
Fig. 3. Direct shear strengths (τ, kPa) of treated sands (SE, n = 3). 390
395
400
405
Fig. 4. Microbial viability of treated sands before injection (black bars) and after incubation (gray bars) (SD, n = 9). 410
Comment [L52]: L386: „Subtilis‟ to „subtilis‟
13
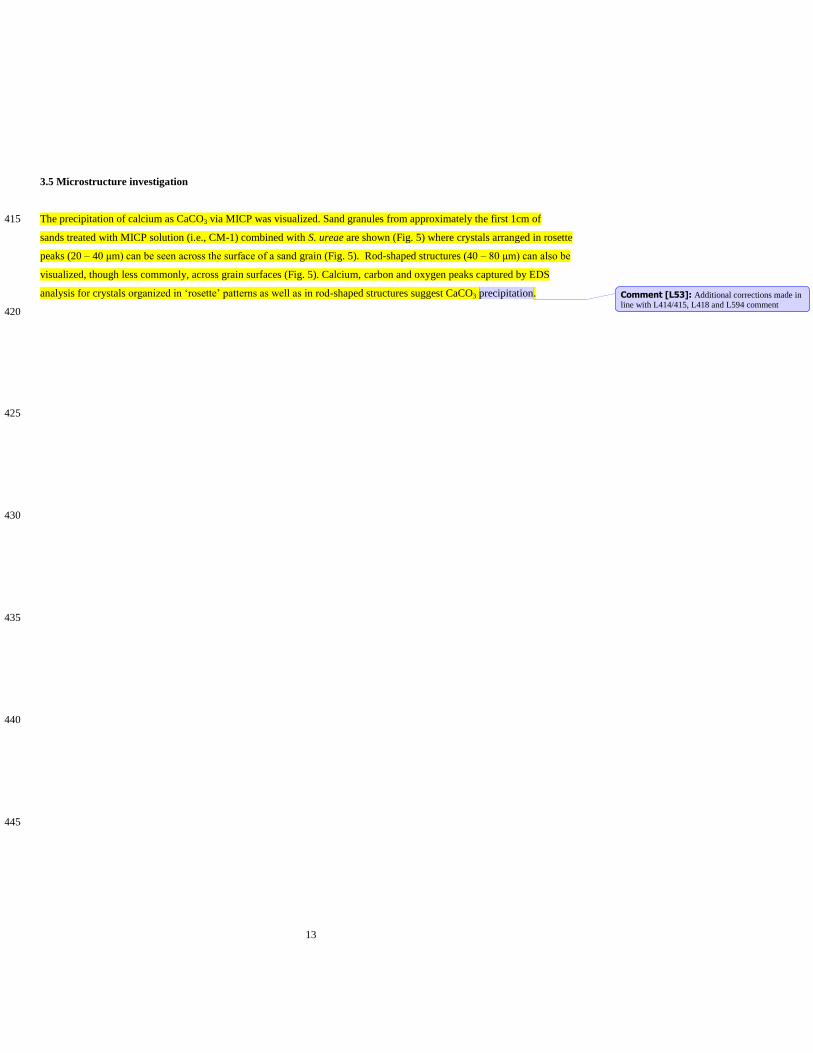
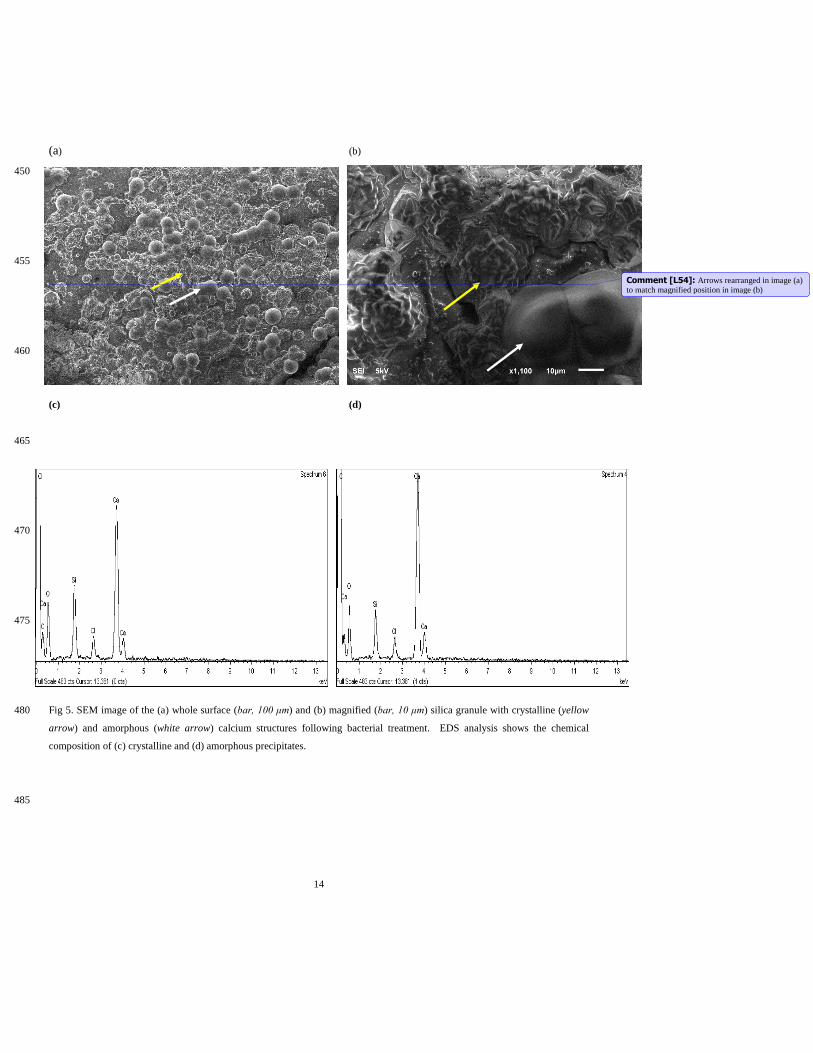
3.5 Microstructure investigation
The precipitation of calcium as CaCO3 via MICP was visualized. Sand granules from approximately the first 1cm of 415
sands treated with MICP solution (i.e., CM-1) combined with S. ureae are shown (Fig. 5) where crystals arranged in rosette
peaks (20 – 40 μm) can be seen across the surface of a sand grain (Fig. 5). Rod-shaped structures (40 – 80 μm) can also be
visualized, though less commonly, across grain surfaces (Fig. 5). Calcium, carbon and oxygen peaks captured by EDS
analysis for crystals organized in „rosette‟ patterns as well as in rod-shaped structures suggest CaCO3 precipitation.
420
425
430
435
440
445
Comment [L53]: Additional corrections made in line with L414/415, L418 and L594 comment
14
(a) (b)
450
455
460
(c) (d)
465
470
475
Fig 5. SEM image of the (a) whole surface (bar, 100 μm) and (b) magnified (bar, 10 μm) silica granule with crystalline (yellow 480
arrow) and amorphous (white arrow) calcium structures following bacterial treatment. EDS analysis shows the chemical
composition of (c) crystalline and (d) amorphous precipitates.
485
Comment [L54]: Arrows rearranged in image (a)
to match magnified position in image (b)
15
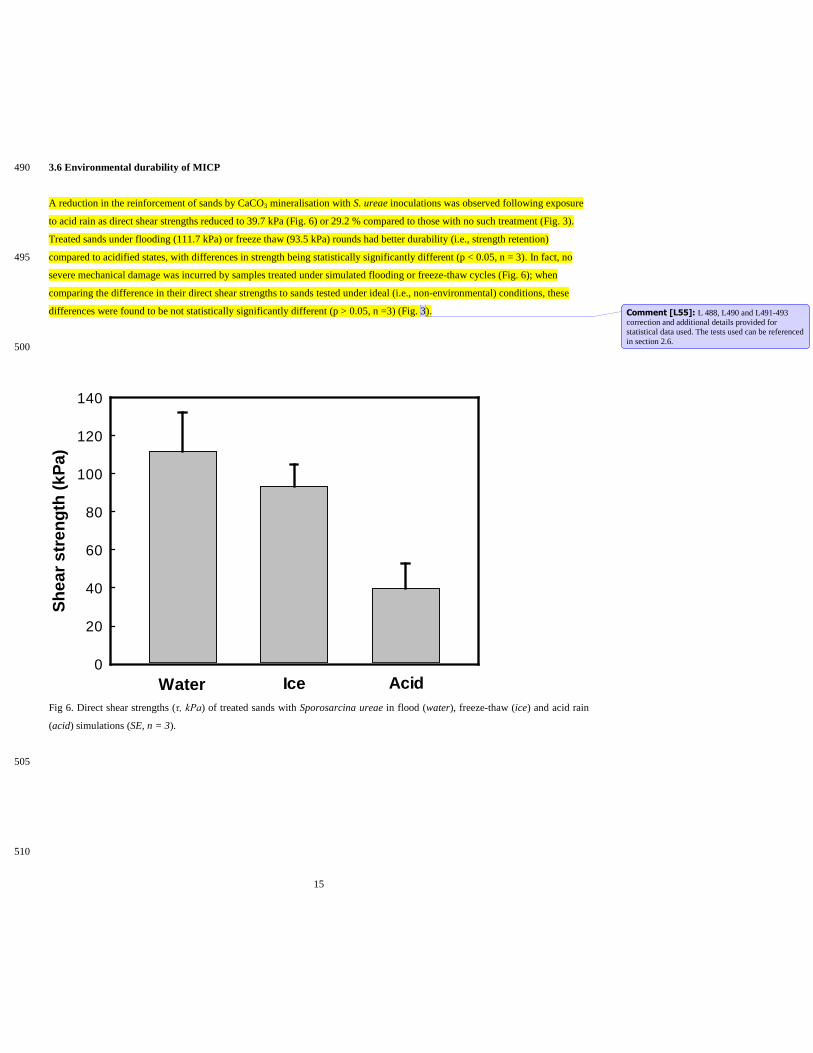
3.6 Environmental durability of MICP 490
A reduction in the reinforcement of sands by CaCO3 mineralisation with S. ureae inoculations was observed following exposure
to acid rain as direct shear strengths reduced to 39.7 kPa (Fig. 6) or 29.2 % compared to those with no such treatment (Fig. 3).
Treated sands under flooding (111.7 kPa) or freeze thaw (93.5 kPa) rounds had better durability (i.e., strength retention)
compared to acidified states, with differences in strength being statistically significantly different (p < 0.05, n = 3). In fact, no 495
severe mechanical damage was incurred by samples treated under simulated flooding or freeze-thaw cycles (Fig. 6); when
comparing the difference in their direct shear strengths to sands tested under ideal (i.e., non-environmental) conditions, these
differences were found to be not statistically significantly different (p > 0.05, n =3) (Fig. 3).
500
Water
Sh
ea
r s
tre
ng
th (
kP
a)
0
20
40
60
80
100
120
140
Ice Acid
Fig 6. Direct shear strengths (τ, kPa) of treated sands with Sporosarcina ureae in flood (water), freeze-thaw (ice) and acid rain
(acid) simulations (SE, n = 3).
505
510
Comment [L55]: L 488, L490 and L491-493
correction and additional details provided for statistical data used. The tests used can be referenced
in section 2.6.
16
4 Discussion
In characterizing S. ureae as a ureolytic organism in MICP, the goals of the study were to understand: (1) its ability to degrade
urea over time relative to other commonly applied MICP bacterial isolates and (2) its preference for urea as a 515
nitrogen source. The strain (BGSC 70A1) was consistent in its total nitrogen (NH3-NH4+) production regardless of whether the
nutrient medium included (i.e. UB-1) or did not include (i.e. UB-2) yeast extract. This can be attributed to mostly urea
catabolism in UB-1 medium and entirely so in UB-2 medium as urea was the sole source of nitrogen. It is important to note that
minor mineralization of the yeast extract components in UB-1 medium would likely have contributed ammonium
(Gat et al., 2014) in this medium condition. This is supported by data recorded for the negative control (medium- 520
only) in UB-1 medium with production as high as 0.12 U/mL (Fig. 2). Also, degradation of amino acids from
bacterial metabolism, such as ornithine, particularly supplied in UB-1 medium via yeast extract, could also
contribute to total nitrogen in solution for this condition (Cruz-Ramos et al., 1997). For both media (UB-1 and
UB-2) dissolution of ammonium as ammonia into the atmosphere would have reduced available nitrogen for
measurement, over time. Thus, a quantitative urea hydroylsis rate cannot be determined from the data collected, as 525
nitrogen production over extended periods of time is a complex collection of some or all of these processes. This limits the
conclusions able to be drawn as only the broad bacterial activity in medium, as regards preferences for urea as a nitrogen source,
overtime can be considered. For a quantitative method determining urease rates a robust protocol is presented by Lauchnor et al.
(2015). Also, urea hydrolysis-induced CaCO3 precipitation rates can be determined by measuring the decrease in dissolved Ca2+
ions overtime (Harbottle et al., 2016). However, overall, the total nitrogen production over time draws support for S. ureae as a 530
promising MICP candidate in biocement as over the time period measured it was able to produce a consistent amount of nitrogen
as ammonia- ammonium in UB-1 or UB-2 medium and ammonia production has been found to be directly proportional to
CaCO3 production (Reddy et al., 2010) and soil stabilization (Park et al., 2012). As mentioned, the production of nitrogen by S.
ureae in medium is due mostly, or completely, to urea catabolism and this process is likely driven chiefly by its urease enzyme
(Gruninger and Goldman, 1988 ; Mobley and Hausinger, 1989). Alternatively, an unknown urea-degrading enzyme other than 535
urease could produce or contribute to the result. Notably, all Bacillus strains observed a significant decrease in total ammonia
production (p < 0.05), when yeast extract was available (i.e., UB-1). This was not observed for S. ureae (p > 0.05) much like S.
pasteurii. Urea is a nitrogen source for
bacterial growth, often catabolised by urease, (Lin et al., 2012) which has been found to be controlled by nitrogen
levels and pH as well as other factors which can differ between bacterial species (Mobley et al., 1995; Mobley et al., 2001). Our 540
observations indicate that S. ureae selects for urea in a metabolic pattern potentially similar to S. pasteurii and quite differently
from the Bacillus strains investigated here, which appear to have medium-dependent metabolism of urea. This is particularly
interesting for B. subtilis as it has been applied as a non-ureolytic control organism in previous literature (Stocks-Fischer et al.,
1999; Gat et al., 2014). However, it had significant (p < 0.05), non-zero total ammonia activity especially in UB-2 medium.
These observations are consistent with previously published literature linking total ammonia production to urea breakdown from 545
urease, when urea is the sole source of nitrogen and urease is the assumed main catabolic enzyme; the enzyme expressed
constitutively in species of Sporosarcina (Mobley et al., 1995) but in a repressible manner (i.e., activated in the absence of NH4+
and other forms of nitrogen [i.e., NO3-] and urea being the sole nitrogen source) in strains such as B. megaterium (Mobley and
Hausinger, 1989) and B. subtilis (Atkinson and Fisher, 1991; Cruz-Ramos et al.,1997). This is indeed suggested by our data as it
Comment [L56]: L509 ; „chief‟ changed to the
current sentence.
Comment [L57]: L512 : Changed to specify that
the nutrient medium, with or without yeast extract
did not affect the ability for S. ureae to produce NH3-NH4+ from compounds like urea.
Comment [L58]: L518: change of „mediums‟ to
„media‟
Comment [L59]: L521/522 : Additions
addressing the limitations of the
ammonium/ammonia measurement on the
conclusions able to be drawn in the study.
Comment [L60]: L527 – removed „see also‟
Comment [L61]: L532 – removed „see also‟
Comment [L62]: Removed „see also‟
17
was observed for B. subtilis, B. megaterium and L. sphaericus that increased total ammonia production reached higher values in 550
UB-2 media compared to near zero values in UB-1 with yeast extract as an alternative nitrogen source. In fact, in UB-2 medium
peaks were reached within 3 – 6 h from near zero values (t = 0 – 1 h) for all Bacillus species, further suggesting an increase in
processes related to urea hydrolysis, such as urease expression, overtime following a reduction in genetic repression. This also
corroborates well with growth patterns. A comparatively slow growth rate occurred (t = 8 – 12 h) after a comparatively fast (t = 3
– 7 h) rate of growth following a lag period (t = 0 – 2 h) for these strains, in general (Fig. 2). An increase in urease, or other urea 555
hydrolysis processes, may account for an ability to grow quickly (t = 3 – 7 h) despite nitrogen limitation in UB-2, as ureolysis
would provide nitrogen for growth related processes. However, growth could have been restricted, overtime, due to other
nutrient limitations such as glucose depletion. This would explain a continued but reduced growth rate (t = 8-12 h) (Fig. 2).
Alternatively, or in addition, the decreased growth could be due to decreased dissolved oxygen content in medium overtime,
which is required for aerobic respiration, such that each Bacillus species switched to a slower, anaerobic growth pattern. An 560
increase in harmful metabolites such as organic acids in solution over time could also have hindered growth; they are supported
to have occurred for these species in UB-1 medium as a decrease in pH over time was observed which correlates to organic acid
production (Fig. 2). Taken together, this has significance as while B. megaterium and L. sphaericus have been investigated as
candidates in ureolytic MICP, this has not been extensively the case for B. subtilis which in this study shows ureolytic capability
under specific conditions. This may guide future research on ureolytic MICP with B. subtilis, particularly where cementation 565
media do not contain nutrient rich additives such as yeast extract. This has been the case in some literature solutions for inducing
ureolytic MICP (van Paassen et al., 2010; Cheng et al., 2013). In this study B. subtilis was included in sand solidification as a
non-ureolytic strain control as the cementation medium contained yeast extract, intended for maximum biomass support and
CaCO3 production rates (van Paassen et al., 2010).
It is clear that S. ureae prefers an alkaline environment, like S. pasteurii and quite different from the other isolates in trials, as in 570
both growth conditions samples grew not only exponentially but towards an increased pH. Urea hydrolysis, driven potentially by
urease, in this species, may maintain ureolytic activity for production of the highly alkaline environment to which it is suited for
growth as an alkaliphile and for its role as a nitrogen cycler (Gruninger and Goldman 1988). These conditions are also important
for CaCO3 production (Whiffin et al., 2007) (Fig. 2). It can also use the charge gradient generated from ammonium production
for energy (Jahns 1996) to support growth. A diagram of this ATP-generating system coupled to ureolysis is available in the 575
work of Jahns (1996) and Whiffin (2004). Additionally, the ammonium is an accessible nutrient (i.e. nitrogen) source
(Gruninger and Goldman 1988). This may partly account for S. ureae and S. pasteurii having the smallest change in growth
between UB-1 and UB-2 medium by having the material but also energetic means to multiply. This is extremely promising as
van Paassen et al. (2010) determined the CaCO3 precipitation rate is positively correlated to the number of viable micro-
organisms in solution. Thus, taken together, the ureolytic, pH and growth data of this study support S. ureae as superior in 580
ureolytic action to every Bacillus strain considered except S. pasteurii. Indeed, the work of Harbottle et al. (2016) likewise found
S. ureae and S. pasteurii to be about as efficient in terms of ureolytic activity (2016). Given the current data, S. ureae and S.
pasteurii are comparable as candidates for ureolytic MICP. This should prompt interest for further investigations differentiating
between the two strains on such parameters as protease activity, exopolysaccharide production and biofilm levels, also connected
to MICP capability (Achal et al. 2010), so as to identify the superior candidate. Some differential work has already been done 585
(Sarmast et al., 2014).
To understand the macroscopic engineering aspects of S. ureae in MICP application, efforts of this study were focused on
measuring and assessing its ability to strengthen model sands via urea hydrolysis to form CaCO3. In experiments with a model
Comment [L63]: Changed „co-nitrogen‟ to
„alternative nitrogen‟.
Comment [L64]: L 549-553 correction
Comment [L65]: Phrase reworded to better
clarify other factors contributing to a decreased
growth rate overtime.
Comment [L66]: L360-L364 : Discussion of why
acidity in UB-1 medium would increase over time
included.
Comment [L67]: Typographical error; changed
„media‟ to „medium‟
Comment [L68]: L561 : Removed „returning to
S. ureae‟. Started new paragraph.
Comment [L69]: Word change; „high‟ to
„ureolytic‟
Comment [L70]: Typographical error; change
„alkalophile‟ to „alkaliphile‟
Comment [L71]: L565; World change, „Whiffen‟ to „Whiffin‟
Comment [L72]: L566 correction
Comment [L73]: L572-573 ; Included work of
Harbottle et al. (2016) as well as Sarmast et al.
(2014) to provide context for this work‟s conclusions
in relation to those found by other groups working with S. ureae on MICP.
18
silica sand featuring poor geotechnical characteristics (i.e., uniform sand profile) for high susceptibility to settling and static
strength decreases (Conforth 2005), it was clearly shown that the S. ureae treatment led to consolidation of the medium in 48 h 590
with an improvement in strength to 135.77 kPa. This was eight times that of the control treatment (15.76 kPa) (Fig. 3). In
addition, while average consolidation strengths had no statistically significant difference (p < 0.05, n = 3) between S. ureae and
S. pasteurii, the peak sample strength recorded for a S. ureae mould (175.8 kPa) exceeded the maximum sample strength
recorded for S. pasteurii (165.7 kPa), the typical model ureolytic organism in MICP soil strengthening. It was also well above
peak average strength recorded for B. subtilis (28.1 kPa) (Fig. 3). This is as expected; B. subtilis is a non-ureolytic organism in 595
the 'good nitrogen' (Atkinson and Fisher, 1991) nutrient conditions supplied by the yeast extract of CM-1 medium. Other
Bacillus species were not tested under the assumption that they too would experience repressive urea hydrolysis expression in
CM-1 medium and would produce similar observations as a result. This is supported by data provided by the groups of Al-
Qabany et al. (2012) and van Paassen et al. (2010) that found CaCO3 precipitation, and by inference soil strength, improved with
more suitable micro-organisms in MICP. Taken together, this study provides evidence that S. ureae is capable of soil 600
improvement by ureolytic MICP similarly to S. pasteurii.
The presence of crystals as organized „rosettes‟ and amorphous „rods‟ was observed (Fig. 5) along sand granules treated with S.
ureae and are evidence that it is capable of inducing prevalent formation of secondary minerals (Fig. 5). The structures were
analyzed by EDS and the results provide support for CaCO3 formation. Assuming that the solution was saturated with respect to
CaCO3 and that the nucleation and crystallization of the calcite polymorph was thermodynamically favoured overtime, the 605
organized deposits should represent calcite (De Yoreo and Vekilov, 2003). However, fast nucleation and crystallization can
result in amorphous CaCO3 structures and could explain the „rod‟ deposits that appear amorphous in morphology under SEM
(Fig. 5) (Addadi et al., 2003). This observation is limited though as SEM cannot discriminate among CaCO3 polymorphs which
can have varying morphology based on the crystallization conditions (Ni and Ratner, 2008). The exact polymorph of CaCO3 for
each structure could be distinguished with techniques such as x-ray diffraction (XRD) and / or Fourier transform infrared 610
spectroscopy (FTIR) (Anthony et al., 2003; Ni and Ratner, 2008). Assuming the „rod‟ structures are amorphous precipitates, this
indicates that the treatment conditions were potentially sub-optimal for the maximum precipitation of crystalline CaCO3 such as
calcite overtime. This could be due to high, local chemical concentrations (e.g., calcium) which have been found to hinder
CaCO3 crystal formation as calcite (Al Qabany et al., 2012). Investigators may be prompted to test alternative calcium
concentrations from those used in this study for injections so as to increase the efficiency of crystalline CaCO3 precipitation in 615
MICP. Finally, medium and B. subtilis treated sands gave no discernible crystal CaCO3 formation (data not shown). This
provides evidence of superficial strengthening in shear tests for these treatments based on natural biofilm excretion (B. subtilis) or
sporadic mineral crystallization. Thus, overall, the microscopy evidence does support that S. ureae can precipitate CaCO3 for
strength improvements in soil which was part of the goal in studying S. ureae in MICP.
Analysing the cell viability of injections before and after incubation in treated sands, it was found that S. ureae maintained higher 620
post-incubation (2.56 x 10⁷ CFU) colony numbers compared to S. pasteurii (1.21 x 10
7 CFU) and that these differences were
statistically significant (p < 0.05, n = 9) (Fig. 5). Also, both species' cell counts were lower and found to be statistically
significantly different (p < 0.05, n = 9) compared to the count for B. subtilis (3.2 x 10⁷ CFU). This difference could be due to the
solution (i.e., TBS) utilized for cell counts. The TBS did not include ammonium and was not buffered at a high pH which are
two necessary conditions for the survival of alkaliphilic species such as Sporosarcina (Morsdörf and Kaltwasser, 1989). Thus, a 625
deflated value for S. pasteurii and S. ureae would result. Also, moulds become mostly anaerobic overtime below the subsurface
Comment [L74]: L581 : Removed „only‟
Comment [L75]: L585 : Changed to better
explain improvements in strength of S. ureae treated
samples in relation to the control treatments.
Comment [L76]: Additional details provided on
statistical data used (also reference section 2.6 for
specific tests used, where appropriate)
Comment [L77]: Typographical error change;
„an‟ to „a‟
Comment [L78]: Typographical error change;
„sp.‟ to „species‟
Comment [L79]: Changed to clarify that
evidence supports S. ureae can improve soils by
ureolytic MICP, much like S. pasteurii
Comment [L80]: L594 ; „Rhombohedra‟ changed
to more qualitative descriptions based on the SEM
images provided.
Comment [L81]: L594, L600, L600-604: This
section is rewritten to better reflect the mineralogy
and microscopy techniques used to identify mineral
precipitation along MICP treated surfaces.
Comment [L82]: Typographical error ; „media‟
to „medium‟.
Comment [L83]: L597/98: Data not shown but
available upon request.
Comment [L84]: L594, L600, L600-604 : This
section is added to give context for why SEM
analysis was performed.
Comment [L85]: Typographical error ;
„analyzed‟ to „analysed‟
Comment [L86]: L606-610 ; This section is
reworded to better clarify that differences in the cell
counts for S. ureae / S. pasteurii compared to B.
subtilis could be due to the dilution medium used for
cell counts.
19
and within the microenvironments of sand grains as oxygen is depleted by bacterial respiration (van Paassen et al., 2010). B.
subtilis may have survived anaerobically (Clements et al., 2002) as opposed to the obligate aerobes S. ureae and S. pasteurii
(Claus and Fahmy, 1986), leading to higher post incubation cell counts for B. subtilis. However, considering the percentage loss
of viable colonies calculated as described (3.4) is comparable between all three species this indicates that neither species 630
outperforms the other in colony survival while in the high salt, high urea CM-1 medium with incubation in treated sands. That
being written, the total numbers in S. ureae are higher compared to S. pasteurii. This is important as cells provide nucleation
points for CaCO3 formation. Indeed, the literature reports designate that strength enhancement by ureolytic MICP is driven by
urea hydrolysis activity but also by the presence of bacteria acting as nucleation sites (Stocks-Fischer et al., 1999; Gat et al.,
2014). While sand surfaces can also act as nucleation points, the negatively charged bacterial cell wall attracts positively 635
charged cations (e.g., calcium) preferentially for the controlled nucleation of CaCO3 over time. In fact, it has been shown that
cell numbers in MICP treatments positively correlate to the precipitation of CaCO3 in both the rate of production and crystal size
(Morris and Ferris, 2006). The group of Hommel et al. (2015) have even developed a model showing that calcite precipitation is
proportional to cell number (i.e. biomass) and potentially improved soil strengths. This model assumes that the features of the
cells such as biofilm production around their cell walls favour and facilitate the precipitation of CaCO3. It follows that any intact 640
cell wall part of the biofilm can facilitate the precipitation process whether the cell itself is alive or dead. Thus, in general, more
cells equates to more CaCO3 precipitation. However, in this study, S. ureae gave rise to strengths in sands that were not
statistically significantly different (p > 0.05, n = 3) versus S. pasteurii treatments. This is unexpected since S. ureae had
comparable ureolytic activity to S. pasteurii but higher cell numbers overtime in precipitation medium. Therefore, more CaCO3
precipitation should have occurred and led to a greater strength increase in sands in S. ureae treatments. This non-linear increase 645
in strength compared to cell number can be a result of a number of factors. For example, the ability for cells to precipitate CaCO3
can be hindered when an abundance of cells injected into porous material (i.e., sands) lead to pore plugging from the organic
matter (i.e., cells). This has been seen to lead to a varied amount of CaCO3 precipitation throughout the volume of a mould (van
Paassen et al., 2009). Where cells are distributed more evenly they can facilitate the precipitation of CaCO3 as nucleation points
(Hommel et al., 2015). This may explain why S. ureae, having a comparable NH3-NH4+
activity to S. pasteurii did not outperform 650
it on average in undrained, direct shear strength tests despite having a higher cell count on average. It may also explain the
broader range of strengths achieved in S. ureae (Fig. 3). For example, a sub-optimal spreading mechanism could have hindered
strength achievement in some moulds of S. ureae treatment where pore plugging by organic matter (i.e., cells) occurred. This in
mind, optimization of treatment protocols would help to determine whether or not S. ureae is the superior candidate
compared to S. pasteurii given that it has consistently increased total cell numbers (Fig. 3) to support more nucleation of CaCO3 655
overtime, in tandem with a NH3-NH4+production comparable to that of S. pasteurii. However, it is important to note that S.
ureae cells are significantly smaller than cells of S. pasteurii (Claus and Fahmy, 1986). Therefore, the total cellular surface area
available for nucleation of CaCO3 would be similar for the two species. This provides a possible explanation for why no
statistically significant differences in strength was observed because if total cellular surface area was most important for
precipitating CaCO3 this means there would be no difference in strengths expected for the same total cellular surface area 660
whether it was spread over a relatively high number of smaller cells (i.e., S. ureae) or fewer number of larger cells (i.e., S.
pasteurii).
It was the current authors‟ focus to also apply tests in conditions reflective of a Canadian environment with a relatively novel
bacterial isolate (S. ureae). Sands treated with S. ureae and which underwent short-term flooding (111.67 kPa) or freeze-thaw
Comment [L87]: Typographical error changed ;
„,.‟ to „.,‟
Comment [L88]: Typographical error changed :
„modeled‟ to “modelled”
Comment [L89]: L615/616, L616-619, L621,
L625/626 : This section rewritten to better describe
the role of bacteria as nucleation points for the precipitation of CaCO3 to provide context in the
discussion of possible reasons S. ureae treatments
did not lead to meaningful strength differences
compared to S. pasteurii treatments.
Comment [L90]: L635 : Rephrased from „may prove‟ to „whether or not‟
Comment [L91]: L639: „proximal‟ to „similar‟
20
cycling (93.47 kPa) showed no statistically significant (p > 0.05, n = 3) strength difference compared to in-lab (135.77 kPa) 665
conditions (Fig. 6). It has been shown that MICP treated sands maintain some porosity in materials (Cheng and Cord-Ruwisch
2012; Chu et al., 2012) and that good strength maintenance in seasonal water saturation and freeze-thaw is possible with porous
materials (Cornforth 2005). Further studies may wish to investigate the permeability of hardened sands via S. ureae at various
levels of CaCO3 precipitation to strike a balance between porosity, peak strength and endurance overtime in weather simulations.
Predictably, it was seen that the acid rain model, reflective or a Northern Ontario rain pH (4.4), eroded the shear 670
strength of sands (Fig. 6) to 35.5 % of originally observed values (Fig. 3). This is a result of the reaction of acid
with CaCO3 producing units of H2O, CO2 and salt, known as weathering. A study by Cheng and Cord-Ruwisch
(2013) reported similar results with a Bacillus sphaericus model. This prompts the idea that a MICP strength model,
regardless of the bacteria treatment selected (S. ureae, S. pasteurii, etc.) for strength enhancement, would require a
time-based repair of treated volumes. This realistically limits its geotechnical and economical practicality in the 675
industry. However, it does prompt interest to test the ability of natural buffers, such as limes and sodas, to increase
the life-span of MICP induced strength enhancement by reducing acid rain degradation.
5 Conclusions
680
This study has worked to verify that S. ureae is a suitable organism to be applied in the soil hardening technology
currently being developed via ureolytic MICP. The authors designate it a close ureolytic MICP candidate, in
performance, to the well studied S. pasteurii and a superior one to several other Bacillus strains. As larger scale
simulations are employed, it is strongly encouraged by the authors that further optimization in the treatment
procedure, regardless of the MICP organism selected, be undergone including ideal soil buffering to reduce certain 685
climatic effects (i.e., acid rain) and optimum volume porosity in the space to be treated to assure an economical
application in industry.
6 Compliance with Ethical Standards
690
Funding: The study was funded by NSERC (Discovery grant number 2016-2021 ; Discovery grant number 2015-
2020) and the University of Ottawa (UROP grant 2012 ; USRA grant 2014)
7 Competing Interests
695
The authors state they have no conflict of interest.
8 Acknowledgements
The authors would like to acknowledge the University of Ottawa (UROP Grant) and the National Sciences and 700
Engineering Research Council of Canada (NSERC USRA and NSERC Discovery grants to D. Fortin and S.
Vanapalli) for financial provisioning in support of this project. Thanks are also given to Mr. Jean Celestin, Mr.
Comment [L92]: L647: „remain‟ to „maintain‟
21
Yunlong (Harry) Lui, Mr. Penghai (Peter) Yin, Dr. Nimal De Silva, Dr. Erika Revesz and Mr. George Mrazek; each providing
assistance in shear measurements, microscopy and/or data analysis.
705
9 References
Achal, V., Abhijit, M., & Reddy, M. (2010). Characterization of Two Urease-Producing and Calcifying Bacillus spp.
Isolated from Cement. J. Microbiol. Biotechnol. , 20(11), 1571-76. doi:10.4014/jmb.1006.06032
Achal, V., Mukherjee, A., Basu, P. C., & Reddy, M. S. (2009). Strain improvement of Sporosarcina pasteurii for 710
enhanced urease and calcite production. J. Ind. Microbiol. Biotechnol. , 36(7), 981-88.
doi:10.1007/s10295-009-0578-z
Al Qabany, A., Soga, K., & Santamarina, C. (2012). Factors affecting efficiency of microbially induced calcite precipitation. J.
Geotech. Geoenviron. Eng. , 138(8), 992-1001. doi:10.1061/(ASCE)GT.1943-5606.0000666
Anthony, J. W., Bideaux, R. A., Bladh, K. W., & Nichols, M. C., available at: http://www.handbookofmineralogy.org (2003). 715
Borates, Carbonates, Sulfates (Vol. 5) in: Handbook of Mineralogy. Chantilly, VA: Mineralogical Society of
America.
ASTM D2487-17, Standard Practice for Classification of Soils for Engineering Purposes (Unified Soil Classification System)
available at : http://www.astm.org/cgi-bin/resolver.cgi?D2487, 2017. Last access: June 2018.
Atkinson, M. R., & Fisher, S.H. (1991). Identification of genes and gene products whose expression is activated during 720
nitrogen-limited growth in Bacillus subtilis. J. Bacteriol. 173, 23–27
Barabesi, C., Galizzi, A., Mastromei, G., Rossi, M., Tamburini, E., & Perito, B. (2007). Bacillus subtilis Gene Cluster
Involved in Calcium Carbonate Biomineralization. J. Bacteriol., 189(1), 228-35. doi:10.1128/JB.01450-06
Bergdale, T. E., Pinkelman, R. J., Hughes, S. R., Zambelli, B., Ciurli, S., & Bang, S. S. (2012). Engineered biosealant strains
producing inorganic and organic biopolymers. J. Biotech. , 161(3), 181-89. doi:10.1016/j.jbiotec.2012.07.001 725
Cheng, L., & Cord-Ruwisch, R. (2012). In situ soil cementation with ureolytic bacteria by surface percolation. J. Ecol. Eng., 42,
64-72. doi:10.1016/j.ecoleng.2012.01.013
Cheng, L., Cord-Ruwisch, R., & Shahin, M. A. (2013). Cementation of sand soil by microbially induced calcite precipitation at
various degrees of saturation. Can. Geotech. J. , 50(1), 81-90. doi:10.1139/cgj-2012-0023
Chu, J., Stabnikov, V., & Ivanov, V. (2012). Microbially Induced Calcium Carbonate Precipitation on Surface or in the Bulk of 730
Soil. Geomicrobiol. J., 29(6), 544-49. doi:10.1080/01490451.2011.592929
Claus, D. & Fahmy, F. (1986). Genus Sporosarcina Kluyver and van Niel 1936. In Mair, Sneath, Sharpe and Holt (Editors),
Bergey's Manual of Systematic Bacteriology, vol. 2. The Williams & Wilkins Co., Baltimore, 1202-1206.
Clements, L.D., Miller, B.S., & Streips, U.N. (2002). Comparative growth analysis of the facultative anaerobes Bacillus
subtilis, Bacillus licheniformis, and Escherichia coli. Syst. Appl. Microbiol. 25: 284–286. 735
Cornforth , D. H. (2005). Landslides in Practice: Investigation, Analysis, and Remedial/Preventative Options in Soils (1st
ed.). Wiley.
Cruz-Ramos, H., Glaser, P., Wray, L. V., Jr., & Fisher, S. H. (1997). The Bacillus subtilis ureABC Operon. J. Bacteriol.,
179(10), 3371-3373.
DeJong, J. T., Fritzges, M. B., & Nüsslein, K. (2006). Microbially Induced Cementation to Control Sand Response to 740
Undrained Shear. J. Geotech. and Geoenviron. Eng., 132(11), 1381-92. doi:10.1061/(ASCE)1090-
0241(2006)132:11(1381)
Comment [L93]: Several typographical errors
corrected (e.g., line spacing). Additional literature
sources also added (see highlighted text).
22
DeJong, J. T., Mortensen, B. M., Martinez, B. C., & Nelson, D. C. (2010). Bio-mediated soil improvement. J. Ecol. Eng.,
36(2), 197-210. doi:10.1016/j.ecoleng.2008.12.029
De Yoreo, J. J., & Vekilov, P. G. (2003). Principles of crystal nucleation and growth. Rev. Mineral. Geochem. 54(1), 57-93. 745
doi:10.2113/0540057
Environment Canada. (2013). Acid Rain FAQ. Retrieved 2016, from
https://www.ec.gc.ca/air/default.asp?lang=En&n=7E5E9F00-1
Environment Canada (2015). Final Screening Assessment for „DSL Bacillus licheniformis/subtilis group‟ (B.
licheniformis/subtilis group (pp. 13-17) (Canada, Environment Canada, Health Canada). Environment Canada. 750
Gat, D., Tsesarsky, M., Shamir, D., & Ronen, Z.. (2014). Accelerated microbal-induced CaCO3 precipitation in a defined co-
culture of ureolytic and non-ureolytic bacteria. Biogeosciences, 11, 2561-2569. doi: 10.5194/bg-11-2561-2014
Government of Canada. (2017). Almanac Averages and Extremes for April 21. Retrieved 2016, from
http://climate.weather.gc.ca/climate_data/almanac_e.html?StationID=4333&period=30&searchMethod=begins
&txtStationName=Ottawa&month=4&day=2 755
Gower, L. (2008). Biomimetic model systems for investigating the amorphous precursor pathway and its role in
biomineralization. Chem. Rev. ,108(11), 4551-627. doi:10.1021/cr800443h
Gruninger , S. E., & Goldman, M. (1988). Evidence for urea cycle activity in Sporosarcina ureae. Arch. Microbiol. 150(4),
394-99. doi:10.1007/BF00408313
Hach Co.Nitrogen Ammonia Salicylate Method [Technical Manual]: available at: 760
https://www.hach.com/asset-get.download.jsa?id=7639983745, last access: 7 June, 2018.
Hammes, F., Boon, N., Villiers, J., Verstraete, W., & Siciliano, S. D. (2003). Strain-Specific Ureolytic Microbial Calcium
Carbonate Precipitation. Appl. Envr. Microbiol., 69(8), 4901-09. doi:10.1128/AEM.69.8.4901-4909.2003
Harbottle, M., Mugwar, A. J., & Botusharova, S., (2016). Aspects of Implementation and Long Term Performance of
Biologically Induced Mineralisation of Carbonates in Porous Media. 26th Goldschmidt Conference, Yokohoma, 765
Japan, June 26 – July 1 2016, 1051.
Hommel, J., Lauchnor, E., Phillips, A., Gerlach, R., Cunningham, A.B., Helmig, R., Ebigbo, A., & Class, H. (2015). A
revised model for microbially induced calcite precipitation: Improvements and new insights based on recent
experiments. Water Resour. Res., 51(5), 3695-3715. doi: 10.1002/2014WR016503
Iftikhar, A., Yokota, A., Yamazoe, A., & Fujiwara, Toru (2007). "Proposal of Lysinibacillus boronitolerans gen. nov. sp. nov., 770
and transfer of Bacillus fusiformis to Lysinibacillus fusiformis comb. nov. and Bacillus sphaericus to Lysinibacillus
sphaericus comb. nov". Int. J. Syst. Evol. Microbiol. 57(5): 1117–1125. doi:10.1099/ijs.0.63867-0
Jahns, T. (1996). Ammonium/urea-dependent generation of a proton electrochemical potential and synthesis of ATP in
Bacillus pasteurii. J. Bacteriol., 178(2), 403-409. doi: 10.1128/jb.178.2.403-409.1996
Jia, He, & Jian, Chu. (2016). Cementation of sand due to salt precipitation in drying process. Mar. Georesour. Geotec. 35(3), 775
441-445. doi: 10.1080/1064119X.2016.1168498
Jonkers, H. M. (2011). Bacteria-based self-healing concrete. Heron, 56(1), 1-12.
Karol, R. H. (2003). Chemical Grouting And Soil Stabilization, Revised And Expanded (3rd ed., Vol. 1). New York, NY :
Taylor & Francis Inc.
Krishnapriya, S., Venkatesh Babu, D.L., & Prince Arulraj, G.(2015). Isolation and identification of bacteria to improve the 780
strength of concrete. Microbiol. Res. 174, 48-55. doi: 10.1016/j.micres.2015.03.009 Comment [L94]: Typographical error correction
23
Kang, C., Kwon, Y., & So, J. (2015). Soil Bioconsolidation Through Microbially Induced Calcite Precipitation by
Lysinibacillus sphaericus WJ-8. Geomicrobiol. J., 33(6), 473-78. doi:10.1080/01490451.2015.1053581
Lauchnor, E. G., Topp, D. M., Parker, A. E., & Gerlach, R. (2015). Whole cell kinetics of ureolysis by Sporosarcina pasteurii. J.
Appl. Microbiol. 118(6). doi : 10.1111/jam.12804 785
Li, M., Fu, Q.-L, Zhang, Q., & Achal, V. (2015). Bio-grout based on microbially induced sand solidification by means of
asparaginase activity. Sci. Rep., 5, 16128. doi: 10.1038/srep16128
Li, P., & Qu, W. (2011). Bioremediation of historic architectural heritages by Sporosarcina pasteurii. ICETCE.
doi:10.1109/ICETCE.2011.5775264
Lin, W., Mathys, V., Ang, E. L., Koh, V. H., Gomez, J. M., Ang, M. L., & Alonso, S. (2012). Urease Activity Represents an 790
Alternative Pathway for Mycobacterium tuberculosis Nitrogen Metabolism. Infect. Immun., 80(8), 2771-79.
doi:10.1128/IAI.06195-11
Litvan, G. G. (1980). Freeze-Thaw Durability of Porous Building Materials (Tech. No. STP691). doi:10.1520/STP36080S
Le Métayer-Levrela, G., Castaniera, S., Orialb, G., Loubièrec, J.-F, & Perthuisota, J.-P. (1999). Applications of bacterial
carbonatogenesis to the protection and regeneration of limestones in buildings and historic patrimony. Sed. 795
Geo., 126(1-4), 25-34. doi: https://doi.org/10.1016/S0037-0738(99)00029-9
Mesinger, F., DiMego, G., Kalnay, E., & Mitchell, K.. (2006). North American Regional Reanalysis. Bulletin of the American
Meteorological Society ,87, 343-60. doi:10.1175/BAMS-87-3-343
Mitchell, A. C., & Ferris, F. G. (2006). The influence of Bacillus pasteurii on the nucleation and growth of calcium carbonate.
Geomicrobiol. J., 23, 213-226. 800
Mitchell, J.K., & Santamarina, J.C.. (2005). Biological considerations in geotechnical engineering. J. Geotech. Geoenviron.
Eng. 131(10), 1222-1233. doi: 10.1061/(asce)1090-0241(2005)131:10(1222)
Mobley, H. L. T., & R.P., Hausinger, (1989). Microbial ureases: significance, regulation, and molecular characterization.
Microbiol. Mol. Biol. Rev. 53, 85–108.
Mobley, H.L.T., Island, M.D., & Hausinger, R.P. (1995). Molecular biology of microbial ureases. Microbiol. Rev. 59, 451-805
480.
Mobley, H. L., Mendz, G. L., & Hazell, S. L. (2001). Helicobacter pylori: Physiology and Genetics. Retrieved 2016, from
https://www.ncbi.nlm.nih.gov/books/NBK2408/
Moore, L.W. & Rene, V. (1975). Liquid nitrogen storage of phytopathogenic bacteria. Phytophathology, 65, 246-50.
Mörsdorf, K., & Kaltwasser, H. (1989). Ammonium assimilation in Proteus vulgaris, Bacillus pasteurii and Sporosarcina ureae. 810
Arch. Microbiol. 152(2), 125-131.
Nakata, Y., Kato, Y., Hyodo, M., Hyde, A. F., & Murata, H. (2001). One Dimensional Compression Behaviour of Uniformly
Graded Sand Related to Particle Crushing Strength. Soils Found., 41(2), 39-51. doi:10.3208/sandf.41.2_39
Ni, M., & Ratner, B. D. (2008). Differentiation of Calcium Carbonate Polymorphs by Surface Analysis Techniques – An XPS
and TOF-SIMS study. Surf. Interface Anal. 40(10), 1356-1361. doi: 10.1002/sia.2904 815
Park, J., Park, S., Kim, W., & Ghim, S. (2012). Application of Bacillus subtilis 168 as a Multifunctional Agent for
Improvement of the Durability of Cement Mortar. J. Microbiol. Biotechnol., 22(11), 1568-74.
doi:10.4014/jmb.1202.02047
Patel, P. (2015). Helping Concrete Heal Itself. ACS Cent Sci., 1(9), 470-72. doi:10.1021/acscentsci.5b00376
Reardon, J., Foreman, J. A., & Searcy, R. L. (1966). New reactants for the colorimetric determination of ammonia. Clin. Chim. 820
Acta., 14, 403-405. doi : 10.1016/0009-8981(66)90120-3
Comment [L95]: Typographical error correction
24
Rodriquez-Navarro, C., Jroundi, F., Schiro, M., Ruiz-Agudo, E., & González-Muñoz, M. T. (2012). Influence of Substrate
Mineralogy on Bacterial Mineralization of Calcium Carbonate: Implications for Stone Conservation. Appl.
Envr. Microbiol.,78(11), 4017-29. doi: 10.1128/AEM.07044-11
Sarmast, M., Farpoor, M. H., Sarcheshmehpoor, M., & Eghbal, M. K. (2014). Micromorphological and Biocalcification 825
Effects of Sporosarcina pasteurii and Sporosarcina ureae in Sandy Soil Columns. J. Agr. Sci. Tech., 16(3),
681-93.
Scott, J. S. (1991). Dictionary of Civil Engineering (4th ed.). New York, NY: Chapman & Hall.
Southam G. (2000). Bacterial Surface-Mediated Mineral Formation, p 257-276. In Lovley D. (ed), Environmental Microbe
Metal Interactions. Washington, DC: ASM Press. doi: 10.1128/9781555818098.ch12 830
Stocks-Fischer, S., Galinat, J. K., & Bang, S. S. (1999). Microbiological precipitation of CaCO3. Soil Biol. Biochem.,
31(11), 1563-71. doi:10.1016/S0038-0717(99)00082-6
Stuart, C.A., Van Stratum, E., & Rustigian, R. (1945). Further Studies on Urease Production by Proteus and Related
Organisms. J. Bacteriol., 49(5), 437-444.
van Paassen, L. A., Harkers, M. P., van Zwieten, G. A., van der Zon, W. H., van der Star, W. R., & van Loosdrecht, M. C. 835
(2009). Scale up of BioGrout: a biological ground reinforcement method. 17th International Conference on Soil
Mechanics and Geotechnical Engineering, Alexandria, Egypt, October 5th
– 9th 2009, 2328-33. doi:10.3233/978-1-
60750-031-5-2328
van Paassen, L. A., Daza, C. M., Staal, M., Sorokin, D. Y., van der Zon, W., & van Loosdrecht, M. C. (2010). Potential soil
reinforcement by biological denitrification. J. Ecol. Eng., 36, 168-75. doi:10.1016/j.ecoleng.2009.03.026 840
van Tittelboom, K., De Belie, N., De Muynck, W., & Verstraete, W. (2010) Use of bacteria to repair cracks in concrete.
Cem. Concr. Res., 40(1), 157-166. doi: 10.1016/j.cemconres.2009.08.025
Webster, A., & May, E. (2006). Bioremediation of weathered-building stone surfaces. Trends Biotechnol., 24(6), 255-60.
doi:10.1016/j.tibtech.2006.04.005
Whiffin, V. S. (2004). Microbial CaCO3 precipitation for the production of biocement. PhD Thesis: Murdoch University , 1-845
162.
Whiffin, V. S., van Paassen, L. A., & Harkes, M. P. (2007). Microbial Carbonate Precipitation as a Soil Improvement
Technique. Geomicrobiol. J., 24(5), 417-23. doi:10.1080/01490450701436505
Worcester , E. M., & Coe, F. L. (2008). Nephrolithiasis Prim. Care, 35(2), 369-Vii. doi:10.1016/j.pop.2008.01.005
Yoon, J. H., Lee, K. C., Weiss N., Kho Y. H., Kang, K. H., & Park Y. H. (2001). Sporosarcina aquimarina sp. nov., a bacterium 850
isolated from seawater in Korea, and transfer of Bacillus globisporus (Larkin and Stokes 1967), Bacillus
psychrophilus (Nakamura 1984) and Bacillus pasteurii (Chester 1898) to the genus Sporosarcina as Sporosarcina
globispora comb. nov., Sporosarcina psychrophila comb. nov. and Sporosarcina pasteurii comb. nov., and
emended description of the genus Sporosarcina. Int J. Syst. Evol. Microbiol. 51, 1079-86. doi: 10.1099/00207713-
51-3-1079 855
Zeng, C., Zheng, J., Cui, M., & Yao, X. (2018). Effection of Water Content on the Strength of Bio-Cemented Sand in Various
Drying Process. 2nd
International Symposium on Asia Urban GeoEngineering. Changsha, China, Nov 24th – 27
th
2017, 23 – 25.
Recommended