Improving the Environment for Competition:More Efficient Purchasing in
Traditional Medicare
William Scanlon
HealthPolicy R&D
National Academy of Social Insurance 17th Annual Conference: Medicare Modernization in a Polarized Environment
January 28, 2005
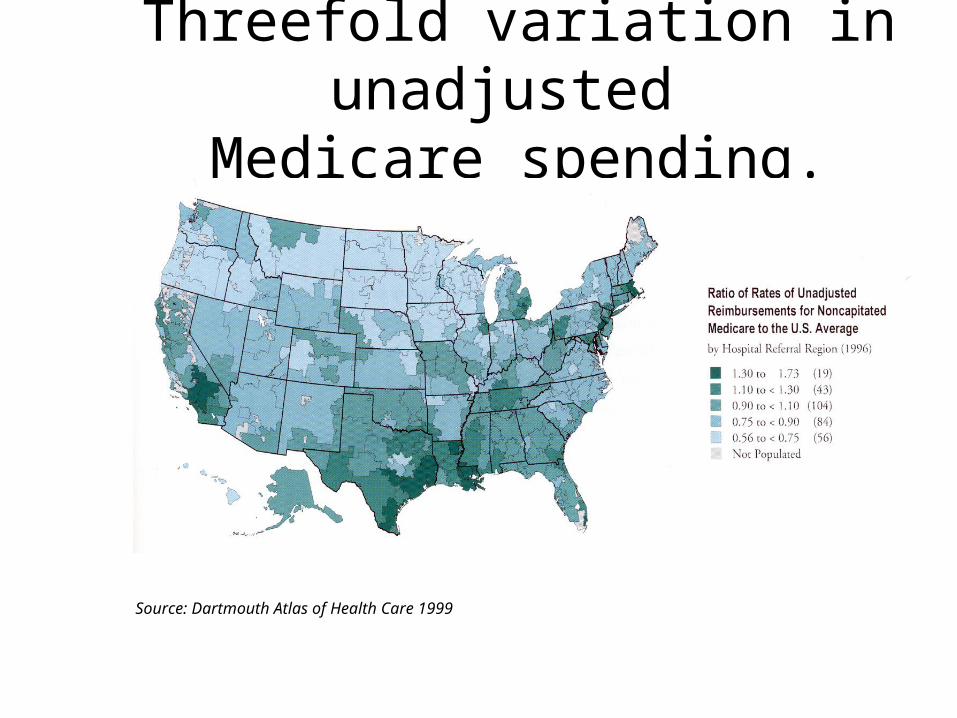
Threefold variation in unadjusted Medicare spending.
Source: Dartmouth Atlas of Health Care 1999
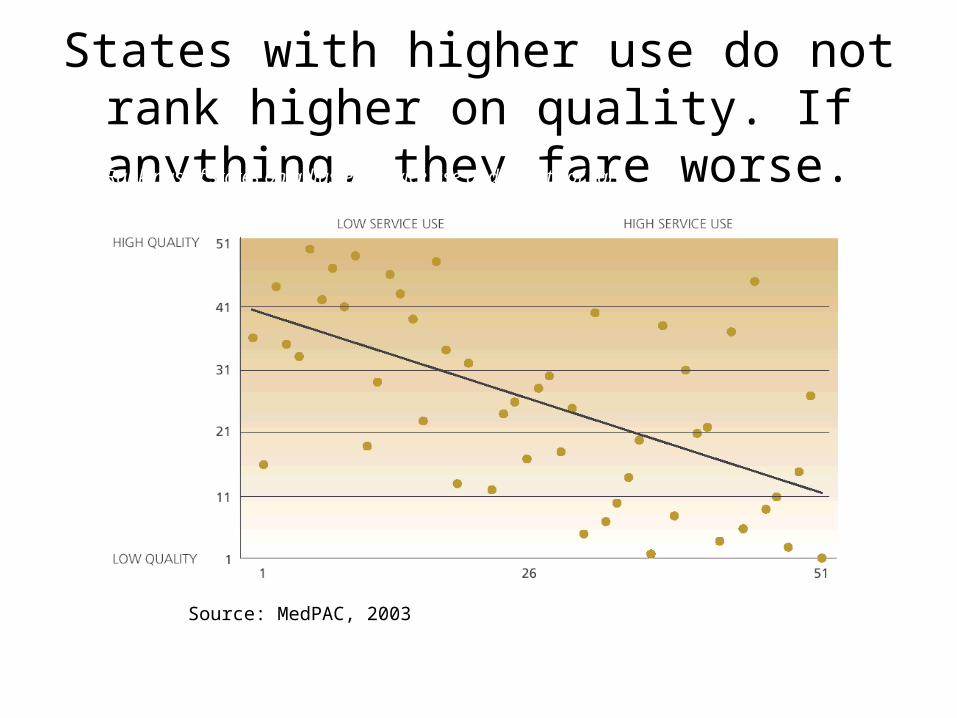
States with higher use do not rank higher on quality. If anything, they fare
worse.Rankings of states on adjusted service use and quality of care
Source: MedPAC analysis of county-level fee-for-service expenditures and other data from CMS, and Jencks et al. 2003
Source: MedPAC, 2003
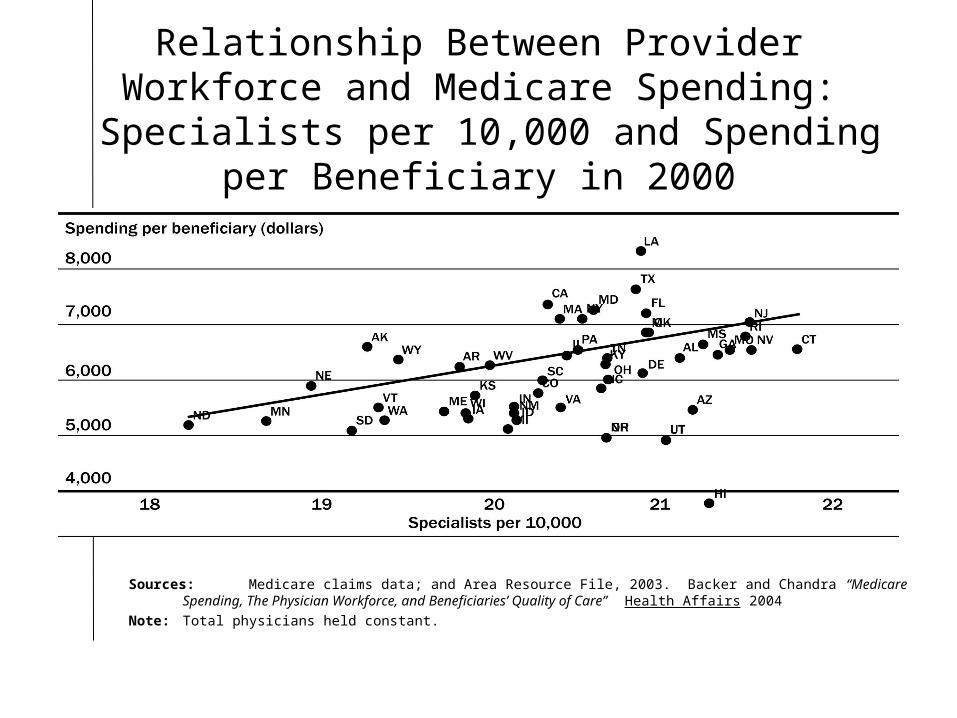
Relationship Between Provider Workforce and Medicare Spending:
Specialists per 10,000 and Spending per Beneficiary in 2000
Sources: Medicare claims data; and Area Resource File, 2003. Backer and Chandra “Medicare Spending, The Physician Workforce, and Beneficiaries’ Quality of Care” Health Affairs 2004
Note: Total physicians held constant.
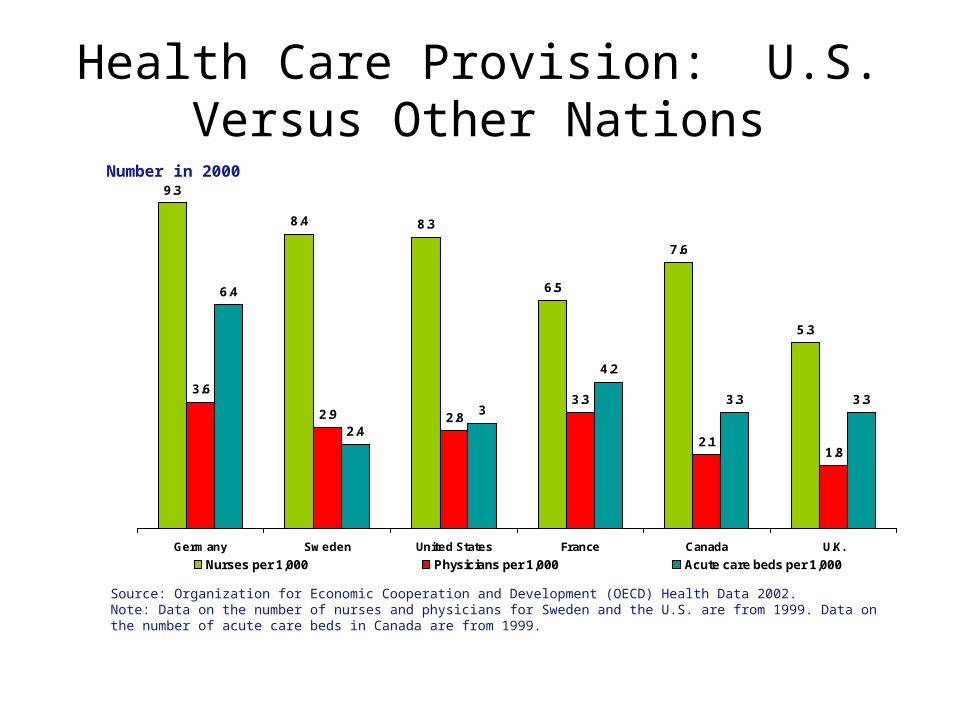
Health Care Provision: U.S. Versus Other Nations
9.3
8.4 8.3
6.5
7.6
5.3
3.6
2.9 2.8
3.3
2.11.8
6.4
2.4
3
4.2
3.3 3.3
Germany Sweden United States France Canada U.K.
Nurses per 1,000 Physicians per 1,000 Acute care beds per 1,000
Source: Organization for Economic Cooperation and Development (OECD) Health Data 2002.Note: Data on the number of nurses and physicians for Sweden and the U.S. are from 1999. Data on the number of acute care beds in Canada are from 1999.
Number in 2000
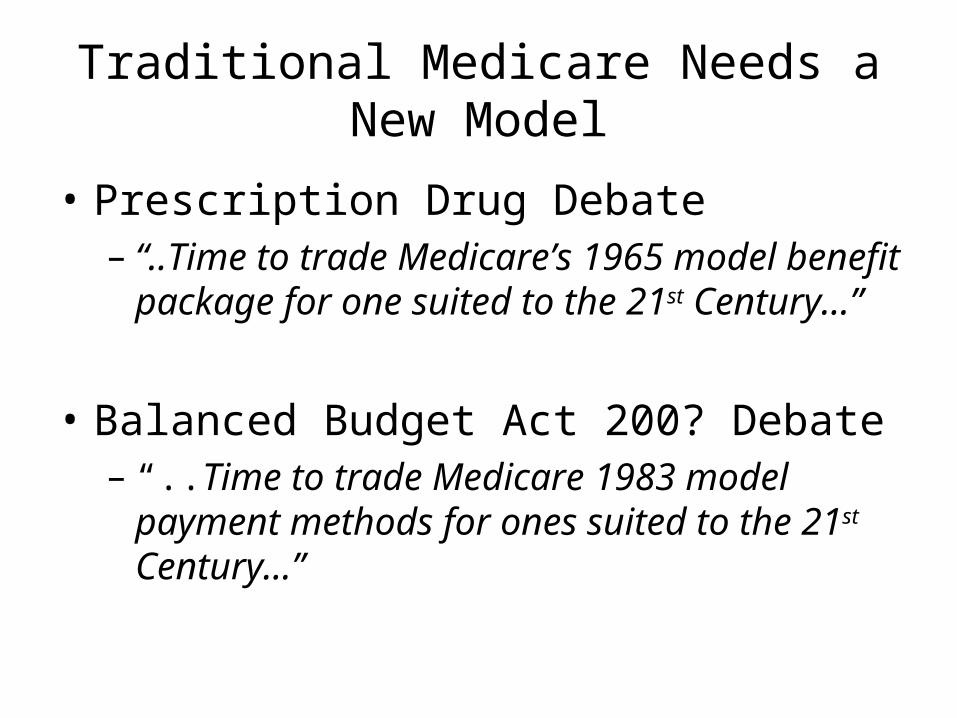
Traditional Medicare Needs a New Model
• Prescription Drug Debate– “..Time to trade Medicare’s 1965 model
benefit package for one suited to the 21st Century…”
• Balanced Budget Act 200? Debate– “..Time to trade Medicare 1983 model
payment methods for ones suited to the 21st Century…”
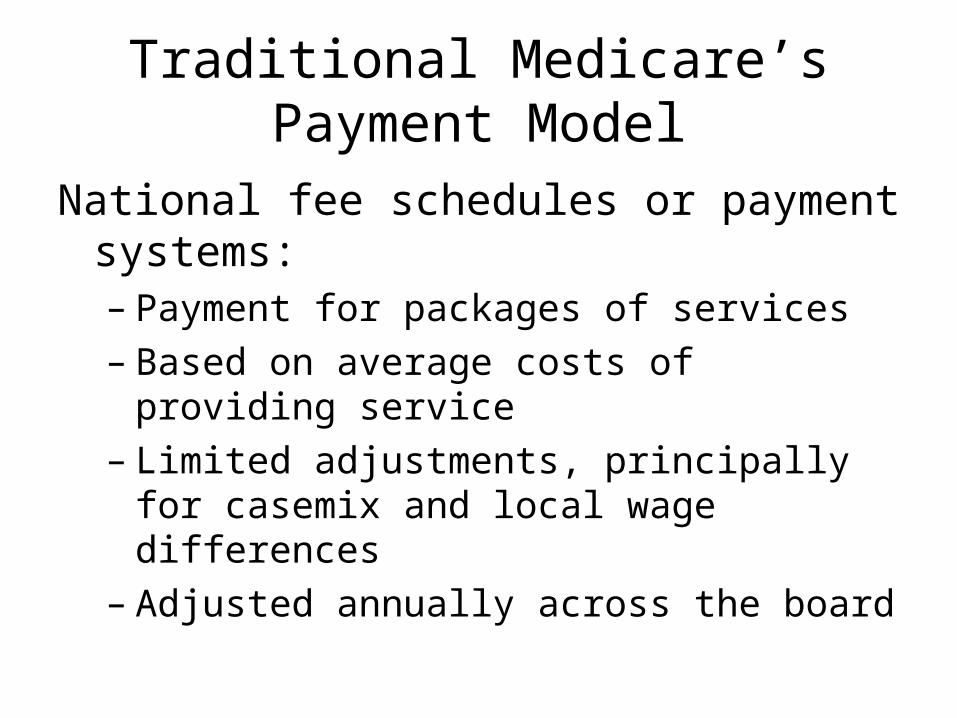
Traditional Medicare’s Payment Model
National fee schedules or payment systems:– Payment for packages of services– Based on average costs of providing service– Limited adjustments, principally for casemix
and local wage differences– Adjusted annually across the board
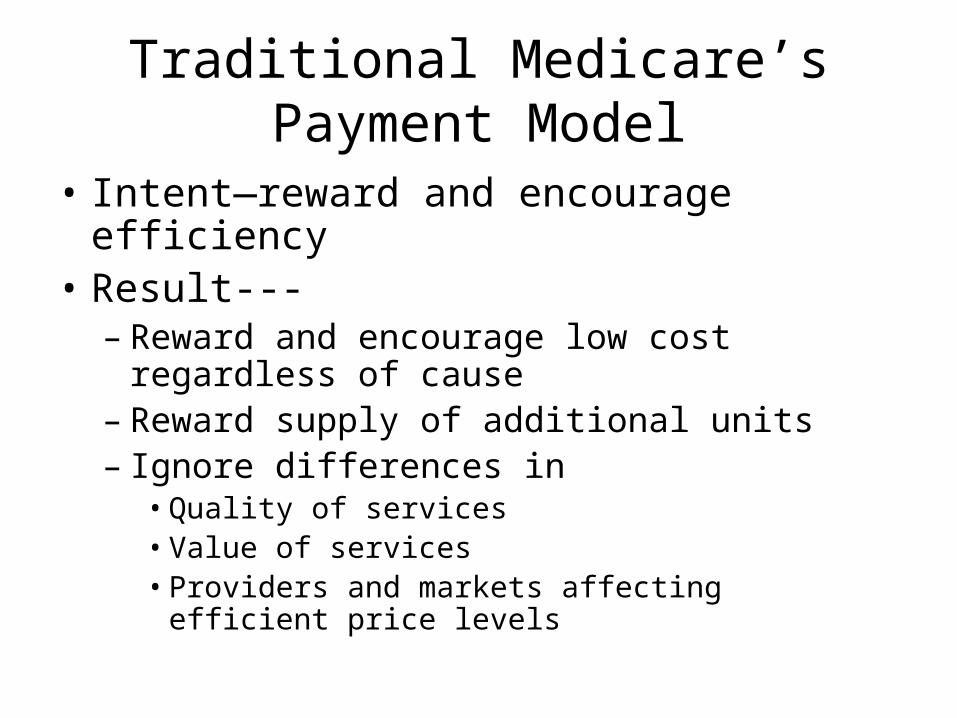
Traditional Medicare’s Payment Model
• Intent—reward and encourage efficiency• Result---
– Reward and encourage low cost regardless of cause
– Reward supply of additional units– Ignore differences in
• Quality of services• Value of services• Providers and markets affecting efficient price
levels
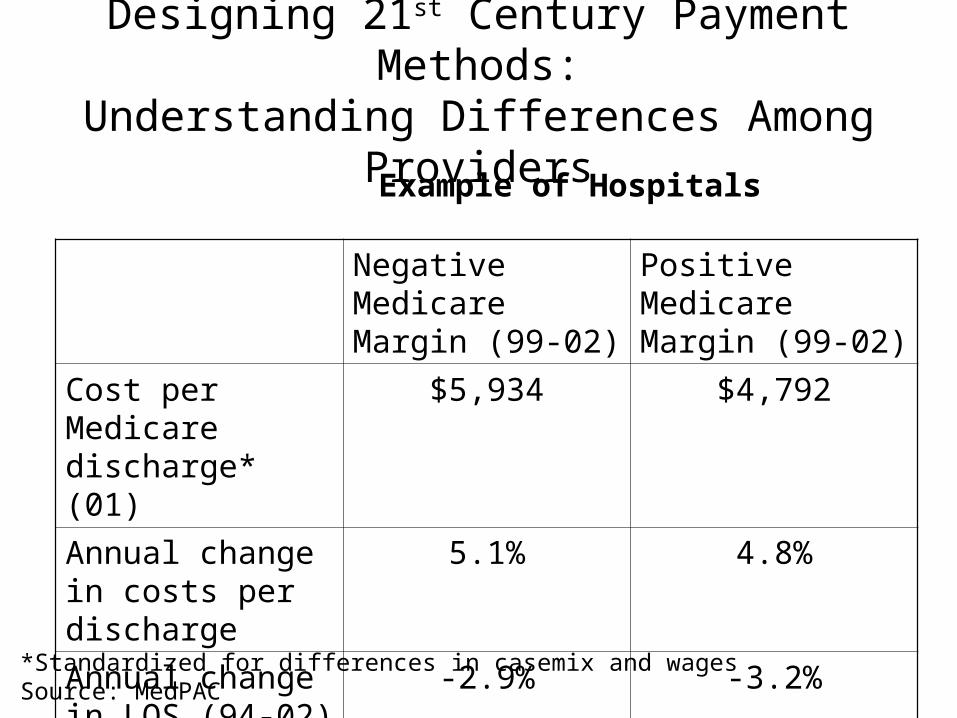
Designing 21st Century Payment Methods:Understanding Differences Among Providers
Negative Medicare Margin (99-02)
Positive Medicare Margin (99-02)
Cost per Medicare discharge* (01)
$5,934 $4,792
Annual change in costs per discharge
5.1% 4.8%
Annual change in LOS (94-02)
-2.9% -3.2%
Example of Hospitals
*Standardized for differences in casemix and wagesSource: MedPAC
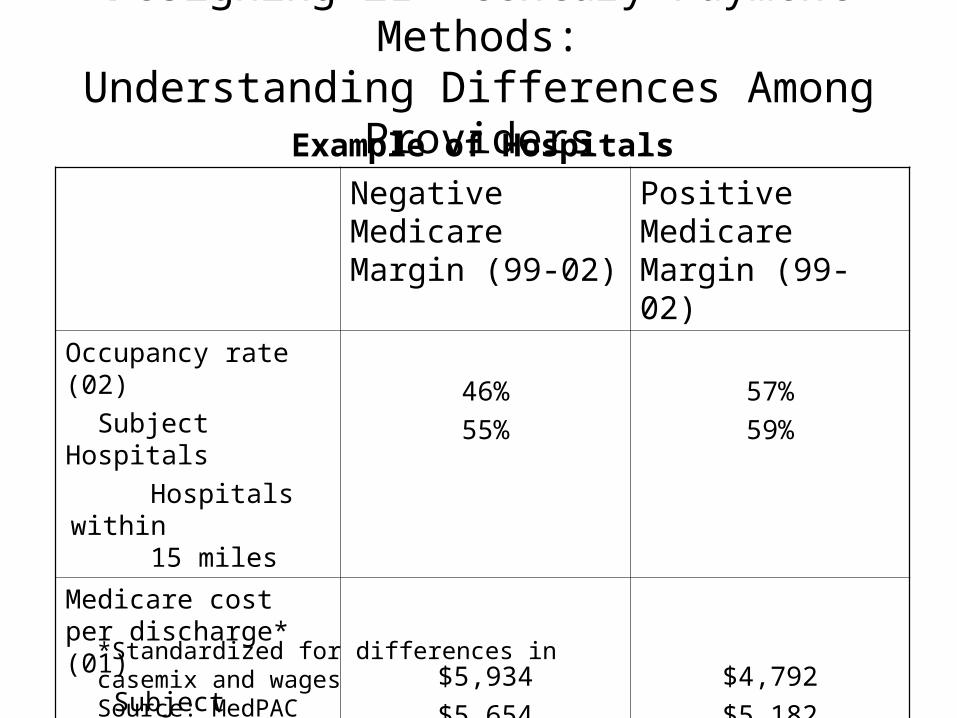
Designing 21st Century Payment Methods:Understanding Differences Among Providers
Example of Hospitals
Negative Medicare Margin (99-02)
Positive Medicare Margin (99-02)
Occupancy rate (02)
Subject Hospitals
Hospitals within 15 miles
46%
55%
57%
59%
Medicare cost per discharge* (01)
Subject Hospitals
Hospitals within
15 miles
$5,934
$5,654
$4,792
$5,182
*Standardized for differences in casemix and wagesSource: MedPAC
Conclusion
• Being more discriminating is essential to becoming an efficient purchaser
• Recognizing quality, value, and market differences are critical priorities
• Traditional Medicare is important to successful competition
Recommended