Improving Oil Spill Impact
Communication and Readiness with GIS
Jake Nelson, Lucy Romeo, Jen Bauer, Dori Dick, Kelly Rose
2016 ESRI UC - San Diego, CaliforniaSession: GIS for Hazmat and Spill ResponseThursday, June 30, 2016
edx.netl.doe.gov/offshore/

2
Overview
• Introduction• Motivation • Spill Model• Impact Communication Approach• Application• Conclusions
edx.netl.doe.gov/offshore/

3
Introduction
• History of U.S. oil spills• The three most recent events – Exxon Valdez, Deepwater
Horizon, Refugio
• 100’s of millions to over a billion dollars worth of damage• Most affected industries: oil and gas, housing, aquaculture,
tourism, and fishing with emphasis on coastal communities.
• High level analyses focus on large-scale economic factors. While useful, these analyses may fail to recognize the extent and degree of damage to the smaller coastal communities
• Disasters can display heterogeneous temporal and geographic “footprints” of damage.
edx.netl.doe.gov/offshore/

4
Introduction
• Most common way to model spills is by simulation.• Varied approaches • Oil “plume” is modeled as a set of individual points• Undergo separate environmental processes – unique
characteristics. • Computationally intensive
• Uncertainty built into models• Ocean is a stochastic environment, modelled as such• Results change from simulation to simulation.
Control Volume
Droplet Distribution

5
Motivation
Accurate Oiling Predictions:
• The tourism industry is a critical economic engine for the United States• Value is greater than the U.S. agriculture, airline, and motion picture industry
combined (Sydnor-Bousso et al., 2011).
• Tourism is especially integral to coastal communities.• Success for all facets of the tourism industry is intrinsically tied to the
conditions of the area.• In the wake of extreme events, tourism is most vulnerable to economic
hardship (Pforr, 2009).
• The hospitality industry is disproportionately vulnerable to disasters and is easily affected by consumer perception in the wake of a disaster (Jauhari, Malhotra, & Venkatesh, 2009)
edx.netl.doe.gov/offshore/

6
Objectives
• Because of the negative perceptions would-be tourists may develop following an event like an oil spill, it is important to both communicate potential oiling and minimize uncertainty regarding the predictions.
• Objective 1: Develop a method for rapid estimation of uncertainty and prediction of oiling.
• Objective 2: Using the BLOSOM model, apply the method to enhance uncertainty and communication of oiling location and severity given a hypothetical spill.
Simulation 1
Simulation 2
edx.netl.doe.gov/offshore/

7
Objectives
• Because of the negative perceptions would-be tourists may develop following an event like an oil spill, it is important to both communicate potential oiling and minimize uncertainty regarding the predictions.
• Objective 1: Develop a method for rapid estimation of uncertainty and prediction of oiling.
• Objective 2: Using the BLOSOM model, apply the method to enhance uncertainty and communication of oiling location and severity given a hypothetical spill.
Simulation 1
Simulation 2
edx.netl.doe.gov/offshore/
8
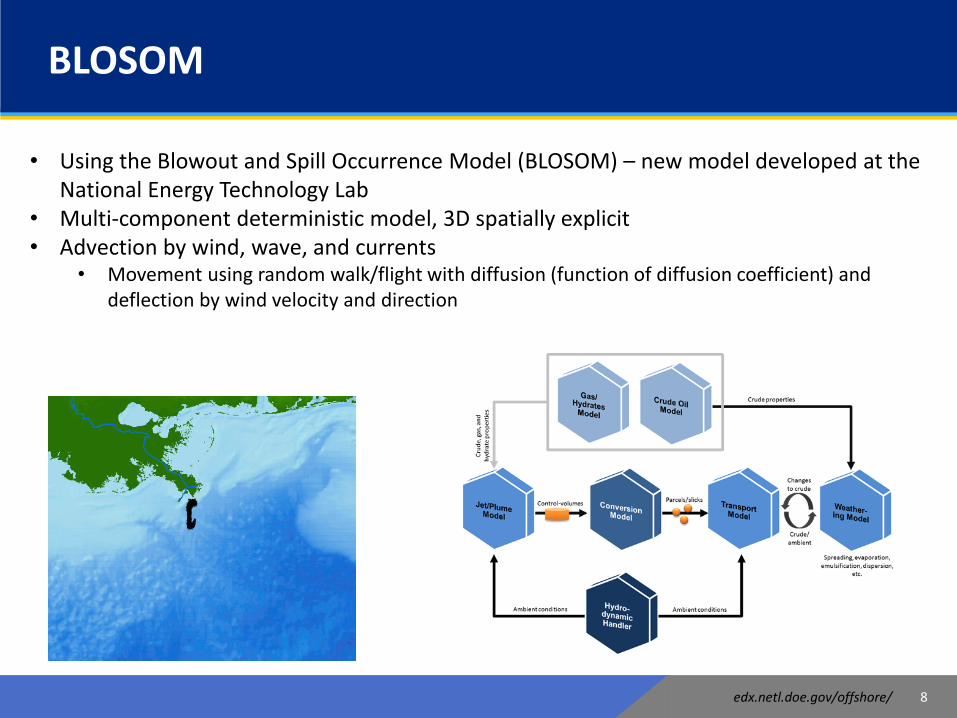
BLOSOM
• Using the Blowout and Spill Occurrence Model (BLOSOM) – new model developed at the National Energy Technology Lab
• Multi-component deterministic model, 3D spatially explicit • Advection by wind, wave, and currents
• Movement using random walk/flight with diffusion (function of diffusion coefficient) and deflection by wind velocity and direction
edx.netl.doe.gov/offshore/

9
Impact Communication Approach
• Mitigate uncertainty
• Repeated sampling approach
• Assign mean value to impact area
• 95% confidence interval
0
50
100
150
200
250
0 0.1 0.2 0.3 0.4 0.5 0.6 0.7 0.8 0.9 1 More
Impact
0
0.1
0.2
0.3
0.4
0.5
0.6
0.7
0.8
1 2 3 4 5 6 7 8 9 10 11 12 13 14 15 16 17 18 19 20
Imp
act
Simulation
1,000
Values for Cell x following 20 simulations Normal distribution of values for Cell x following repeated sampling
edx.netl.doe.gov/offshore/

10
Application in the Gulf of Mexico
- 28.14oN, 94.29o W- Western Gulf of Mexico- 82 miles off the coast- 25 active well platforms in the area- 196ft water depth- 1 week blowout, 2 month duration
**20 simulations
edx.netl.doe.gov/offshore/

11
Application in the Gulf of Mexico
• Recorded the total amount of oil for each cell following the 20 simulations.
• Exported to CSV.• 10/20 values extracted and
used to calculate a mean. Repeated 1000 times/cell.
• Mean value from the 1000 simulations assigned to the cell.
0
50
100
150
200
250
Impact
edx.netl.doe.gov/offshore/
12
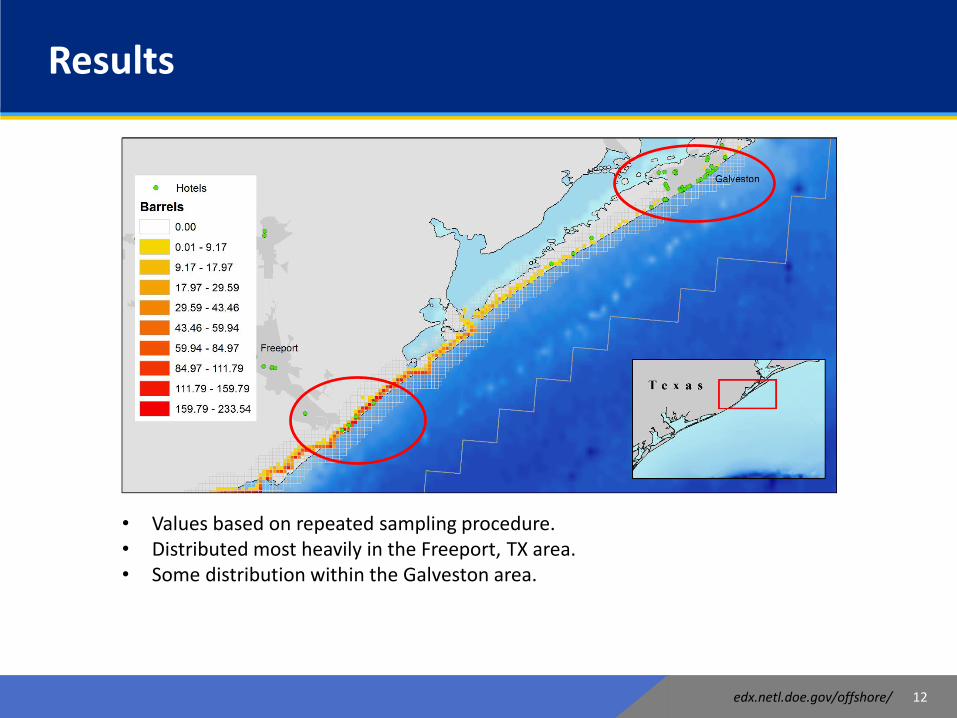
Results
edx.netl.doe.gov/offshore/
• Values based on repeated sampling procedure. • Distributed most heavily in the Freeport, TX area.• Some distribution within the Galveston area.

13
Results
• Contrary to some of the simulations there is a chance for oiling in the Galveston area based on simulation sample.
• More hotels but less oil (up to 9 barrels in most locations)• Targets for protection
• Up to 233 barrels of potential oil along Freeport beaches.
• Much less hotel/accommodation industry presence.• Specific beaches can be
targeted.
edx.netl.doe.gov/offshore/

14
Results
edx.netl.doe.gov/offshore/
Test of performance:
• Five additional simulations performed, independent from original 20. • Oiling from independent samples compared to MC results and results from single
simulations. • RMSE calculated
RMSE
MC Surface Run 2 Surface Run 6 surface Run 10 surface Run 15 surface Run 18 surface
Sample 1 11.96 16.74 17.86 17.44 17.11 17.15
Sample 2 12.51 16.39 17.41 17.80 16.35 16.75
Sample 3 11.91 15.45 16.64 16.89 15.69 15.58
Sample 4 11.17 15.77 16.59 16.68 15.99 15.67
Sample 5 11.80 15.16 16.84 16.07 15.87 16.19

15
Concluding Remarks
edx.netl.doe.gov/offshore/
• Enhance the potential for impact minimization by targeting areas of high oiling
• Communicate where and how much oil will make landfall provides targets for protection and alleviates the potential for falsely assuming oiling.
• Monte Carlo simulations can enhance understanding of the potential for oiling along the shoreline • Repeated sampling• Generation of confidence intervals for each reported value
• In a timely situation, this approach offers decision makers and responders a way to quickly address uncertainty in spill models to help optimize equipment and personnel dispatch.
• Stakeholders able to determine potential for damage and protection need

16
Thank You
Jake Nelson – [email protected] Post-Graduate Research Fellow
For more information on the larger offshore project visit:www.edx.netl.doe.gov
Recommended