Improving Crop Models: Improving Crop Models: Incorporating New Incorporating New Processes, New Processes, New Approaches, Approaches, and Better Datasetsand Better Datasets
Jon I. Lizaso([email protected])
Technical University of Madrid
13th ESA Congress 25-29 August 2014, Debrecen, Hungary
2
OverviewOverview
Crop models improved in response to:o Better crop/environment understandingo New scientific questionso Need for better accuracy (especially under stress conditions)
Incorporating new processes o Anthesis-Silking Interval (ASI) in maize
Incorporating new approacheso Sink-limited kernel set in maize
The need for quality and diversity of datasets

3
Early crop modelsEarly crop models Early models described canopy light capture and
photosynthesiso De Wit, 1965; Monteith, 1965; Duncan et al., 1967
Personal computers not availableo Apple II released in 1977 o IBM PC released in 1981
Later models incorporated development, growth and partitioning, and yieldo Hesketh, Baker & Duncan 1971, 1972; Baker, Hesketh & Duncan,
1972
Almost 50 years of model improvement Better understanding New questions Better accuracy (stresses)
Review: Boote et al., 2013. Plant, Cell & Environment
4
Improving models: new Improving models: new processesprocesses Crop simulation models are a deliberate simplification of a
field grown crop
Modelers decide what process to include: Objectives
Models evolve:o Including new processeso Including new approaches (substitute/complement previous)o Re-parameterization or Re-calibration (quality datasets)
Example of incorporating a new process: Anthesis-Silking Interval (ASI) in maize
o Yield is sink-limitedo Kernel set is source-limited (under most field conditions)

5
Maize monoecious plantMaize monoecious plant
Pistillate flowers with stigmata
Staminate flowers shedding pollen
Monoecious:Monoecious:Separate male & Separate male & female flowers female flowers
in the plantin the plant
Grain yield depends on the synchrony between
Anthesis & Silking for adequate pollination and kernel set
ASI

6
Strong relationship of maize grain yield with ASI
Especially under water stress
Modern hybrids, with enhanced stress-tolerance, show similar trend
Incorporated ASI simulation into CERES-Maize
ASI (GDU 10-30º C)
-30 0 30 60 90 120
Gra
in Y
ield
(M
g h
a-1)
0
4
8
12
16
20ControlStress
Elite US Corn Belt hybrids(G. Edmeades, pers comm)
Bolaños & Edmeades, 1992SC403
ASI (d)
0 5 10 15 20
Gra
in Y
ield
(M
g h
a-1)
0
2
4
6
8Bolaños&Edmeades, 1993Managed Drought (SC403)Managed Drought (SC513)
(K. Tesfaye, pers comm)
Incorporating new processes: Incorporating new processes: ASIASI

7
Incorporating new processes: Incorporating new processes: ASIASI
BAGDD(SPE)
AAGDD(SPE)
1: Avg Shoot Growth Rate
(SGR)ASI
Barrenness
PSTR
SLPF
(MIN)
PAR
CO2
LAIPopDens
RowSpac
TEMP
WSTR
NSTR
KSTR
SRAD
k
RUE
Ear Growth
PartEar
Incorporated into CERES-Maize v4.5
Flowering event changed from silking to anthesis
The model calculates the average shoot growth rate (SGR) during a thermal time window around flowering
Thermal time window delimited by two user-specified parameters
8
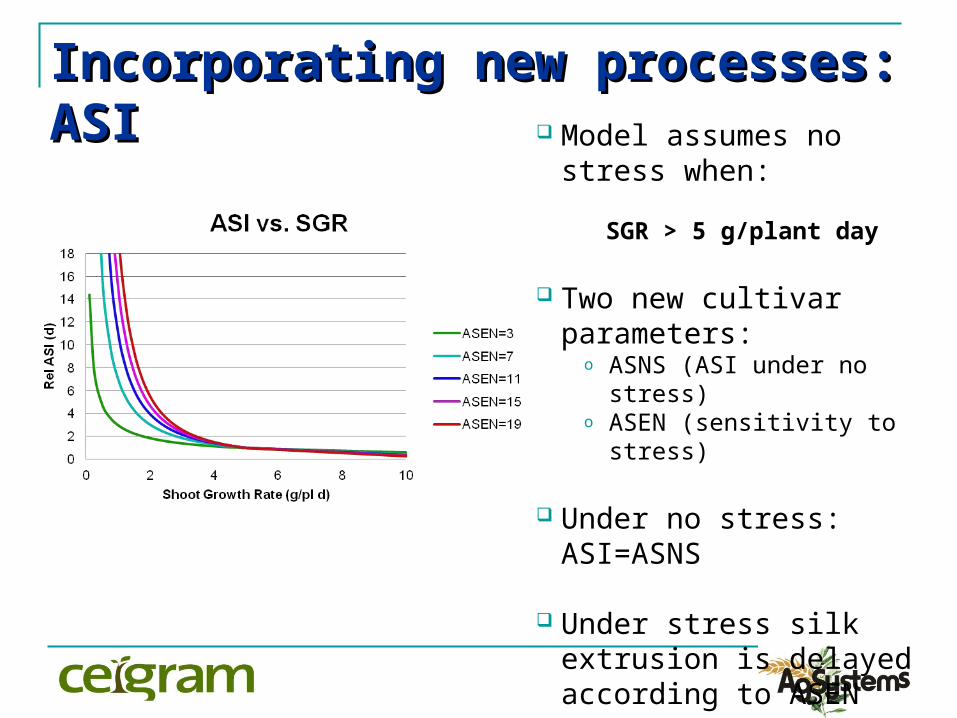
Incorporating new processes: Incorporating new processes: ASIASI Model assumes no stress
when:
SGR > 5 g/plant day
Two new cultivar parameters:o ASNS (ASI under no stress)o ASEN (sensitivity to stress)
Under no stress: ASI=ASNS
Under stress silk extrusion is delayed according to ASEN

9
Incorporating new processes: Incorporating new processes: ASIASI
The model estimates kernel number as a function of ASI, according to Bolaños & Edmeades (1993)
For negative ASI values (protogyny), it uses a function calculated from Lizaso et al. (2003, 2007)
SGR 2: ASI
ASEN(CUL)
ASNS(CUL)
Onset Lin Grain Fill
KernelNumber

10
Incorporating new processes: Incorporating new processes: ASIASI
Model calculates barrenness as a function of SGR
Since kernels are set on ears, barren ears are checked with ASI
3: Kernel Number
(KN)
YieldG2(CUL)
SGR ASIOnset Lin Grain Fill
4: Barrenness
(EPP)
THRE(ECO)
PLTPOP

11
Incorporating new processes: Incorporating new processes: ASIASI
Finally, yield is calculated with:
o kernel number (KN)o ears/plant (EPP)o onset of linear grain fill
KN
EPP5:
Yield
G3(CUL)
P5(CUL)
Onset Lin Grain FillASI

12
Incorporating new processes: Incorporating new processes: ASIASI
2: ASI
ASEN(CUL)
ASNS(CUL)
6: Onset Lin Grain
Fill
DSGFT(ECO)
3: Kernel Number
(KN)
4: Barrenness
(EPP)
THRE(ECO)
5: Yield
7: Ear Growth
BAGDD(SPE)
AAGDD(SPE)
1: Avg Shoot Growth Rate
(SGR)
PartEar
P5(CUL)
G3(CUL)
G2(CUL)
13
Incorporating new processes: Incorporating new processes: ASIASI
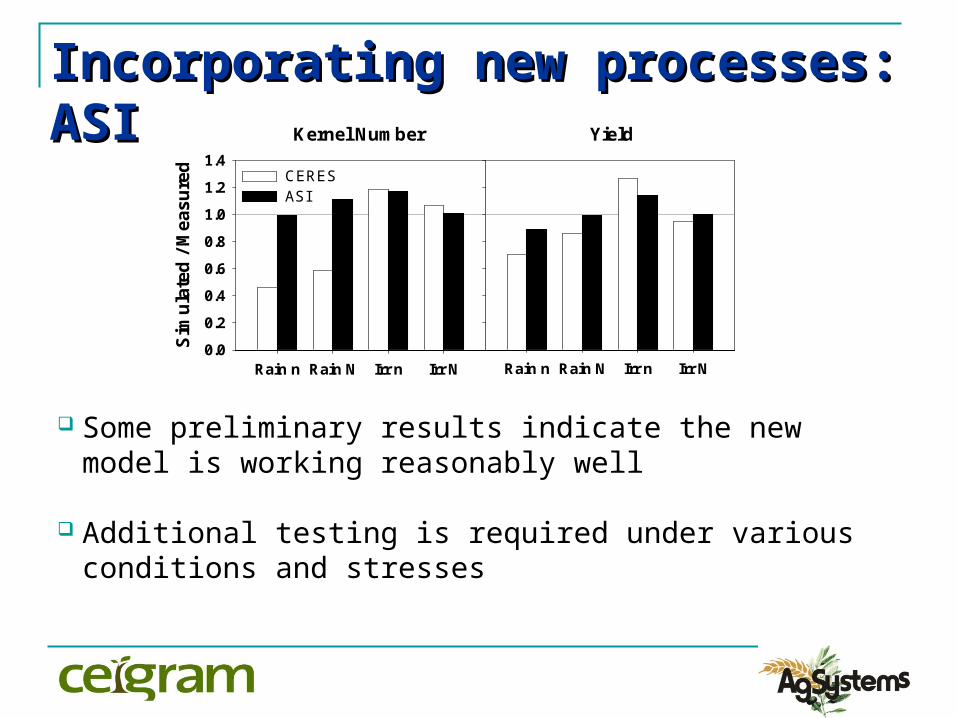
Some preliminary results indicate the new model is working reasonably well
Additional testing is required under various conditions and stresses
Kernel Number
Rain n Rain N Irr n Irr N
Sim
ula
ted
/ M
ea
su
red
0.0
0.2
0.4
0.6
0.8
1.0
1.2
1.4
Yield
Rain n Rain N Irr n Irr N
CERESASI

14
Improving models: new Improving models: new approachesapproaches Maize grain yield is sink-limited. The potential size of the sink,
kernel set, is determined around flowering
However, maize kernel set is usually source-limited
Maize models simulate kernel numbers:o Light capturedo Photosynthetic rateo Growth rate
Example of incorporating a new approach: Sink-limited kernel set in maize
Edmeades and Daynard, 1979

15
Simulating kernel set in maize Simulating kernel set in maize
J. Lizaso, 2005
If pollen becomes limited, as in hybrid seed production, or there is poor synchrony between anthesis and silking, kernel set may be sink-limited
Example of incorporating a new approach that complements current procedure: sink-limited kernel seto Pollen dynamicso Silk dynamicso Relationship linking pollen & silks

16
8
53
212212
Self-adhesive traps are located daily at silks level. Fluorescence microscopy produces images that are processed with image-analysis software. This result in pollen counts as pollen grains cm-2 d-1 (Fonseca et al., 2002)
J. Lizaso, 2007
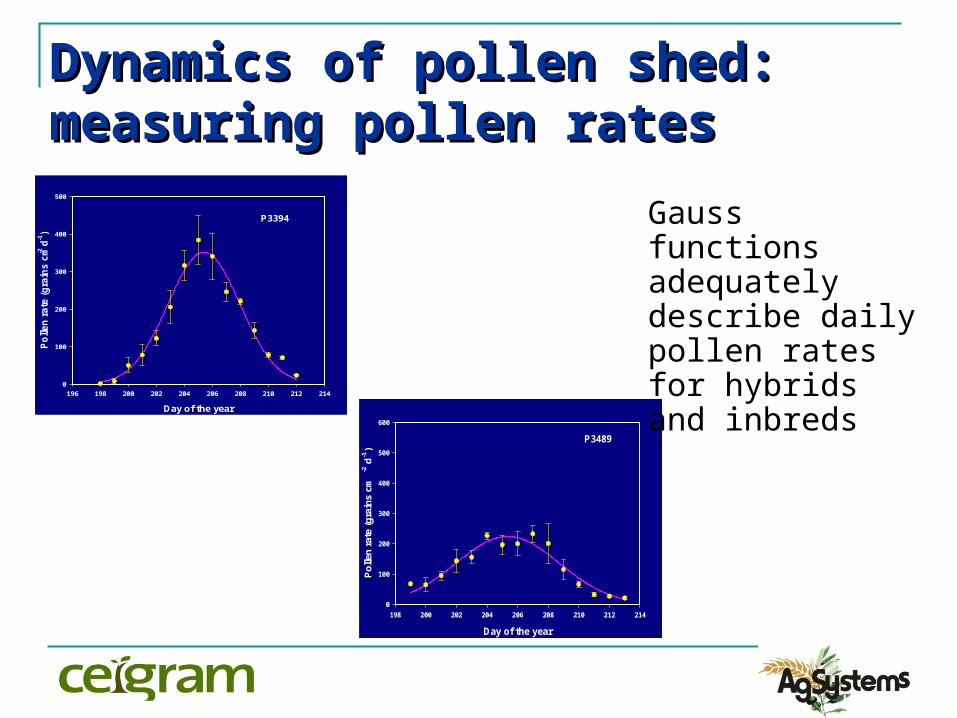
Dynamics of pollen shed: Dynamics of pollen shed: measuring pollen ratesmeasuring pollen rates
17
P3394
Day of the year
196 198 200 202 204 206 208 210 212 214
Po
lle
n r
ate
(g
rain
s c
m-2 d
-1)
0
100
200
300
400
500
P3489
Day of the year
198 200 202 204 206 208 210 212 214
Po
llen
rat
e (g
rain
s cm
-2 d
-1)
0
100
200
300
400
500
600
Gauss functions adequately describe daily pollen rates for hybrids and inbreds
J. Lizaso, 2007
Dynamics of pollen shed: Dynamics of pollen shed: measuring pollen ratesmeasuring pollen rates

18
Total pollen produced per tassel can be field measured or estimated from tassel morphology (Fonseca et al., 2003)
J. Lizaso, 2007
Dynamics of pollen shed: Dynamics of pollen shed: simulating pollen ratessimulating pollen rates
To simulate ear-level pollen rates (grain cm-2 d-1) 2 pieces of information are required:
Progression of population reaching anthesis (%) Daily pollen production from individual tassels (grain plant-1 d-1).
These values can be calculated from: Total pollen produced per tassel (million grains/tassel) Duration of pollen shed per tassel (d)

19
Day of the year
195 200 205 210 215 220 225
Per
cen
t o
f p
lan
ts (
%)
0
20
40
60
80
100
Anthesis
Dekalb 6118 pl m-2
Days after anthesis
0 1 2 3 4 5 6 7 8
Po
lle
n g
rain
s p
lan
t-1 (
millio
ns
)
0.0
0.2
0.4
0.6
0.8
Pollen shed
Dekalb 6118 pl m-2
2.64 millions
8 days
Dynamics of pollen shed: Dynamics of pollen shed: simulating pollen ratessimulating pollen ratesDynamics of pollen shed: Dynamics of pollen shed: simulating pollen ratessimulating pollen rates
Simulated pollen rate
Day of the year
190 195 200 205 210 215
Po
llen
ra
te (
gra
ins
cm-2
)
0
50
100
150
200
250
300
Dekalb 6118 pl m-2
Days after anthesis
0 1 2 3 4 5 6 7 8
Po
llen
gra
ins p
lan
t-1 (
millio
ns)
0.0
0.2
0.4
0.6
0.8
Pollen shed
Day of the year
195 200 205 210 215 220 225
Pe
rce
nt
of
pla
nts
(%
)
0
20
40
60
80
100
Anthesis

20J. Lizaso, 2007
Silks are cut and ears are covered with glassine bags to prevent pollination
Each day 2 cm pieces are cut from the silk bouquet and are kept in alcohol at 4º C
Silks are counted and monomolecular functions are fit
Dynamics of silk appearance:Dynamics of silk appearance:measuring silk extrusionmeasuring silk extrusion
21J. Lizaso, 2007
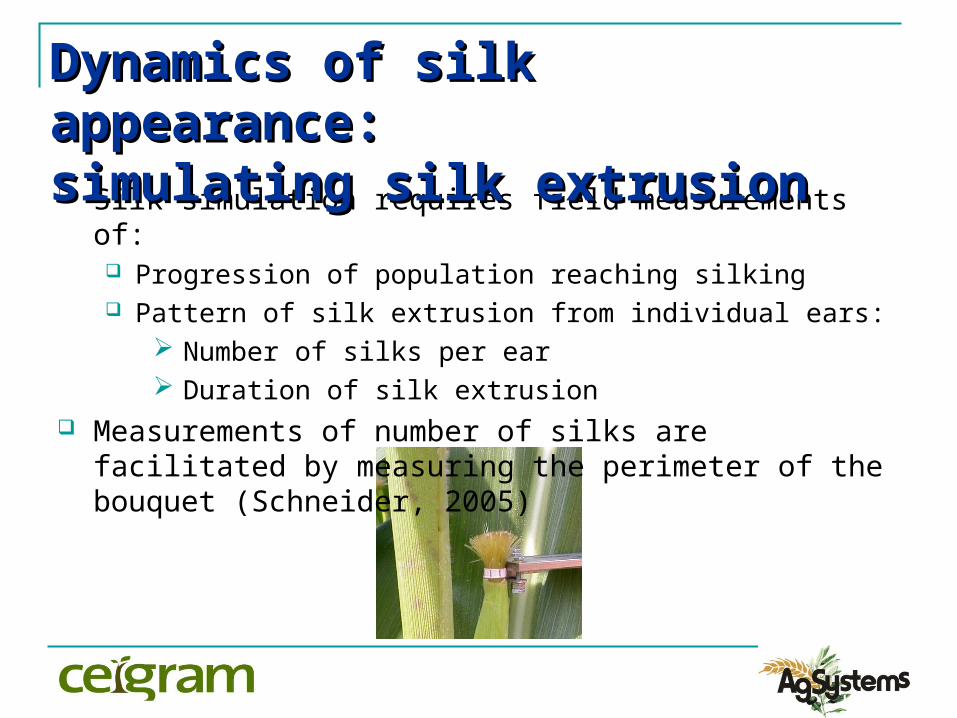
Silk simulation requires field measurements of: Progression of population reaching silking Pattern of silk extrusion from individual ears:
Number of silks per ear Duration of silk extrusion
Measurements of number of silks are facilitated by measuring the perimeter of the bouquet (Schneider, 2005)
Dynamics of silk appearance:Dynamics of silk appearance:simulating silk extrusionsimulating silk extrusion
22
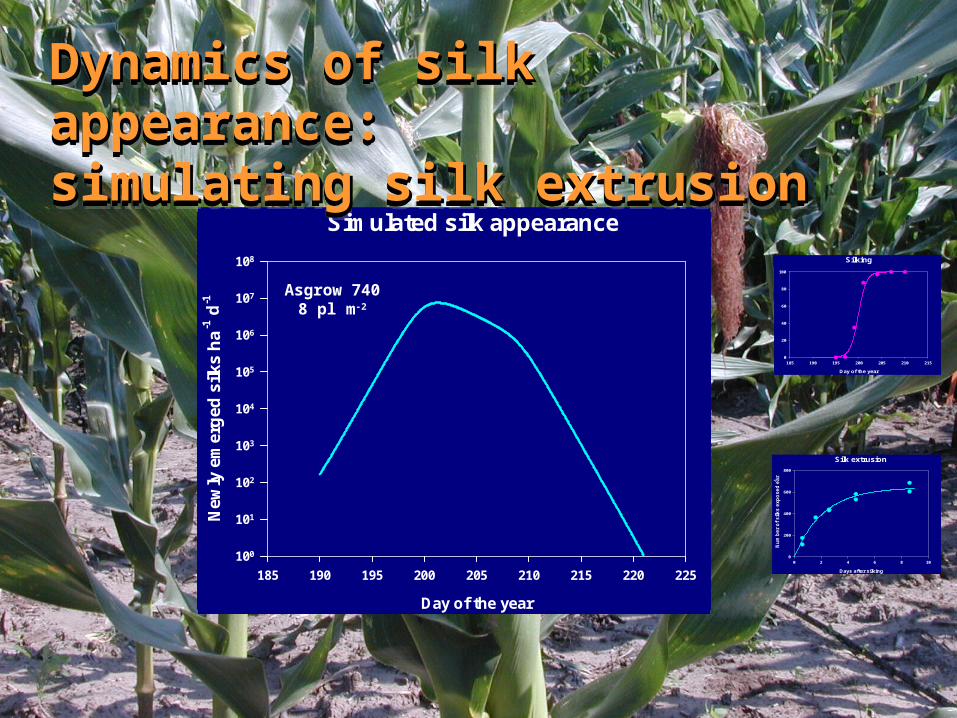
Silking
Day of the year
185 190 195 200 205 210 215
Pe
rce
nt
of
pla
nts
(%
)
0
20
40
60
80
100
Asgow 7408 pl m-2
Silk extrusion
Days after silking
0 2 4 6 8 10
Nu
mb
er o
f si
lks
ex
po
sed
ea
r-1
0
200
400
600
800
Asgrow 7408 pl m-2
Silk extrusion
Days after silking
0 2 4 6 8 10
Nu
mb
er
of
silk
s e
xp
os
ed
ea
r-1
0
200
400
600
800
Silking
Day of the year
185 190 195 200 205 210 2150
20
40
60
80
100
Simulated silk appearance
Day of the year
185 190 195 200 205 210 215 220 225
New
ly e
mer
ged
silk
s h
a-1
d-1
100
101
102
103
104
105
106
107
108
Asgrow 7408 pl m-2
Dynamics of silk appearance:Dynamics of silk appearance:simulating silk extrusionsimulating silk extrusionDynamics of silk appearance:Dynamics of silk appearance:simulating silk extrusionsimulating silk extrusion
23
Simulated pollen rate
Day of the year
190 195 200 205 210 215
Po
llen
rat
e (g
rain
s cm
-2)
0
50
100
150
200
250
300
Dekalb 6118 pl m-2
Simulated pollen rate
Day of the year
190 195 200 205 210 215
Po
llen
rat
e (g
rain
s cm
-2)
0
50
100
150
200
250
300
Simulated silk appearance
Day of the year
185 190 195 200 205 210 215 220 225
New
ly e
mer
ged
silk
s h
a-1
d-1
100
101
102
103
104
105
106
107
108
Simulated silk appearance
Day of the year
185 190 195 200 205 210 215 220 225
New
ly e
mer
ged
silk
s h
a-1
d-1
100
101
102
103
104
105
106
107
108
Asgrow 7408 pl m-2
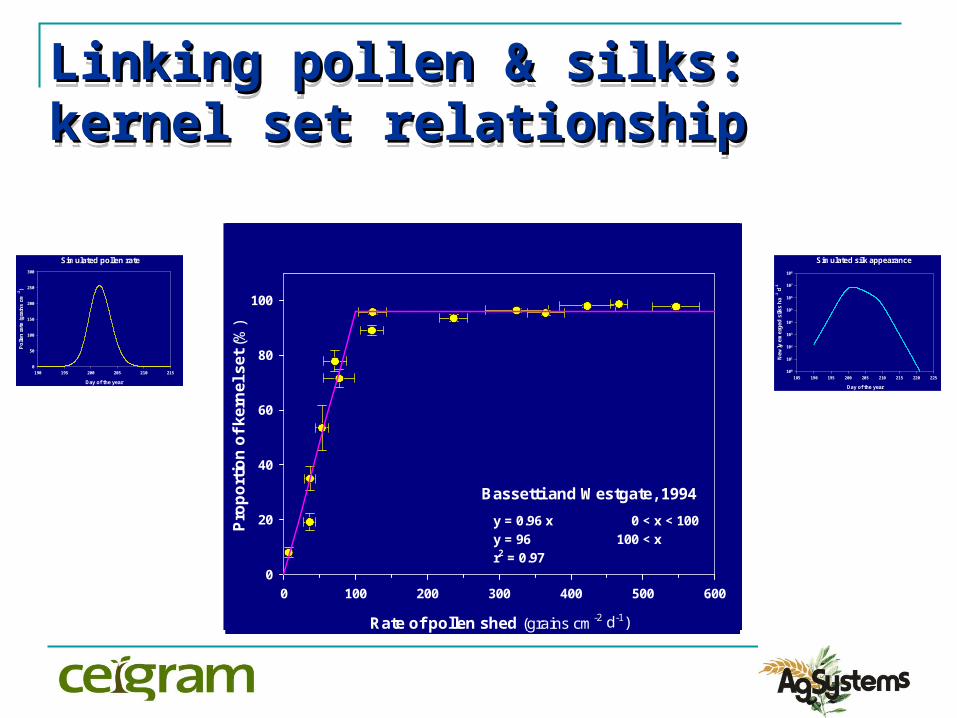
Rate of pollen shed (grains cm-2 d-1)
0 100 200 300 400 500 600
Pro
po
rtio
n o
f ke
rnel
set
(%
)
0
20
40
60
80
100
y = 0.96 x 0 < x < 100
y = 96 100 < x
r2 = 0.97
Bassetti and Westgate, 1994
Linking pollen & silks: kernel Linking pollen & silks: kernel set relationshipset relationshipLinking pollen & silks: kernel Linking pollen & silks: kernel set relationshipset relationship

24J. Lizaso, 2005
Results from seed production fields show the processes are quite predictable and our procedures capture them
Too many inputs from male and female inbreds
Yet useful for seed industry
When both, source- and sink-limited conditions were simulated the new model showed excellent accuracy
Measured kernels plant-1
0 400 800 1200 1600
Sim
ula
ted
ker
nel
s p
lan
t-1
0
400
800
1200
1600
CERESModified
r2C = 0.77; MSDC = 23127
r2M = 0.87; MSDM = 8350
Measured kernels plant-1
0 200 400 600 800
Sim
ula
ted
ker
nel
s p
lan
t-1
0
200
400
600
800
CERESModified
r2C = 0.17; MSDC = 15084
r2M = 0.73; MSDM = 6664
Evaluating a complementary Evaluating a complementary approachapproachLizaso et al., 2007
25J. Lizaso, 2005
A number of current efforts to improve crop models:
o AgMIP Program: Pilot studies on wheat, maize, rice, and ongoing work on sugarcane, potato, sorghum-millet, peanut, soybean
o MACSUR Project: Focusing on European agriculture, more interested in crop rotations, pastures, and livestock
o Model packages: DSSAT, APSIM, CropSyst, STICS, EPIC, and others
Beyond the number of processes included, and the approach chosen, a permanent concern for model improvement/testing is the quality and diversity of datasets especially in areas and processes poorly represented
Towards the future: the Towards the future: the quest for quality & diverse quest for quality & diverse datasetsdatasets

26J. Lizaso, 2005
Field data collection must continue especially in areas and processes poorly represented
AgMIP maize team showed that an ensemble of 19 models was superior simulating maize yield than any single model
So, how many models are enough?
As the ensemble size increased, relative variation dropped differently for each site
Towards the future: the Towards the future: the quest for quality & diverse quest for quality & diverse datasetsdatasets
Number of models averaged
0 4 8 12 16 20
Rel
ativ
e va
riat
ion
of
sim
ula
ted
yie
ld
0.0
0.1
0.2
0.3
0.4Morogoro, TZ Lusignan, FRRio Verde, BRAmes, US
Bassu et al., 2014

27
Recommended