IMPROVED OIL SLICK IDENTIFICATION USING CMOD5 MODEL FOR WIND SPEED
EVALUATION ON SAR IMAGES
University of Sciences and Technology Houari Boumediene (USTHB). Faculty of Electronics and Computer Science. Laboratory of Image Processing and radiation.
BP 32, El-Alia, Bab-Ezzouar, 16111 Algiers, Algeria. Email : [email protected], [email protected]
H.KHENOUCHI & Y. SMARA
XXV International Federation of Surveyors
Congress, Kuala Lumpur, Malaysia, 16 – 21
June 2014
MAPPING ILLICIT DISCHARGES

DETECTED SPILLS ASSOCIATED
WITH SHIP ROUTES
40 MT Oil
annualy60 MT Oil
annualy
50 MT Oil
annualy
125 MT Oil
annualy
XXV International Federation of Surveyors
Congress, Kuala Lumpur, Malaysia, 16 – 21
June 2014
Introduction
To decrease the ominous effect due to this pollution, the surveillance of the inshore zones is necessary:
Coast guard
- Limited to small sectors.
- Don't cover the totality of the navy surface.
Satellite remote sensing
- An extended observation capacity.
- A fast detection and identification of the pollution.
The radar SAR is the useful tool in the control and surveillance of oil spill pollution on sea surfaces.
XXV International Federation of Surveyors
Congress, Kuala Lumpur, Malaysia, 16 – 21
June 2014

Physical and geometric parameters alone are not always sufficient to
provide enough information in order to identify the nature of the oil spill.
There are several natural phenomena that can have the same radar
signature as an oil spill called look alikes. To help in the identification of the suspect
objects, supplementary data, such as the wind speed that can be calculated from
radar images, have proved themselves to be efficient.
Problematic/Objective
The objective of this study is to estimate the wind vector from radar SAR
images. This is to be done in order to include wind speed, in addition to parameters
linked to the physics and the geometry of the oil spill, in the neural network as
additional input (using 2 models CMOD4 and CMOD5 to estimate the wind speed).
XXV International Federation of Surveyors
Congress, Kuala Lumpur, Malaysia, 16 – 21
June 2014
Sea surface
Wave
SAR
Braggscattering phenomenon
Observation Of The Sea By The Radar SAR
The Radar is an instrument that has the following particularities:
� The possibility to work night and day.
� The weak sensitivity to the atmospheric conditions.
� The power of detection of the roughness of the surface.
XXV International Federation of Surveyors
Congress, Kuala Lumpur, Malaysia, 16 – 21
June 2014

The SAR Image
• Once oil poured in sea, it
remain to the surface of water
• Increase the viscosity of the
surface that becomes smooth.
• Attenuation of the radar signal
backscattering
XXV International Federation of Surveyors
Congress, Kuala Lumpur, Malaysia, 16 – 21
June 2014
Characterization Of Oil Spill On The SAR Images
Several natural phenomena
present a radar signature similar
to the one of the oil spills.
Wind front
Naturelspill
Oil spill
Vortex
OilSpill
Look-alike
Identification
XXV International Federation of Surveyors
Congress, Kuala Lumpur, Malaysia, 16 – 21
June 2014

Look Alikes
• SAR sensors detect all films that, like oil,
smooth the sea surface:
• Look-alikes: Other man-made substances: fish
or vegetable oil, chemical, sewage, other…
• Natural phenomena: low wind area, algae,
current front …
XXV International Federation of Surveyors
Congress, Kuala Lumpur, Malaysia, 16 – 21
June 2014
Identification Methodology
First approach: Second Approach:
XXV International Federation of Surveyors
Congress, Kuala Lumpur, Malaysia, 16 – 21
June 2014

Data Set
84 SAR PRI / ERS-2 images
149 examples of spill candidates:
76 oil spills
73 look-alike
Characteristics Value
Frequencie 5.3 GHZ
Incidence angle 23 °
pixel 12.5 m x 12.5m
scene 100 x 100 Km
Characteristics of SAR PRI images
XXV International Federation of Surveyors
Congress, Kuala Lumpur, Malaysia, 16 – 21
June 2014
Identification Method (First Approach)
SAR PRI Image
Extraction of parameters
Information file
Visual inspection
Selection of zone of interest
Decisional algorithm
(neural network)
Geometricparameters
Statisticalparameters
XXV International Federation of Surveyors
Congress, Kuala Lumpur, Malaysia, 16 – 21
June 2014
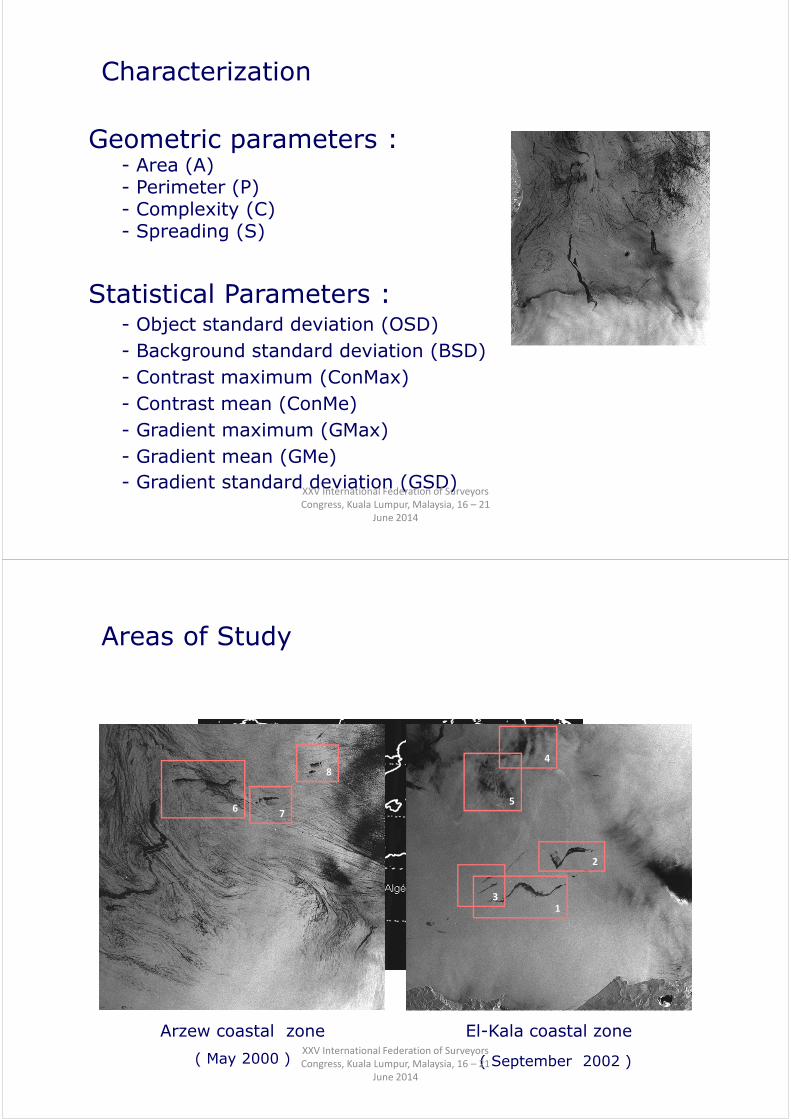
Characterization
Geometric parameters :- Area (A)- Perimeter (P)- Complexity (C)- Spreading (S)
Statistical Parameters :- Object standard deviation (OSD)
- Background standard deviation (BSD)
- Contrast maximum (ConMax)
- Contrast mean (ConMe)
- Gradient maximum (GMax)
- Gradient mean (GMe)
- Gradient standard deviation (GSD)XXV International Federation of Surveyors
Congress, Kuala Lumpur, Malaysia, 16 – 21
June 2014
Areas of Study
Images localisation
Arzew coastal zone
( May 2000 )
El-Kala coastal zone
( September 2002 )
1
2
3
4
56
7
8
XXV International Federation of Surveyors
Congress, Kuala Lumpur, Malaysia, 16 – 21
June 2014

Features
Parameter Zone 1 Zone 2 Zone 3 Zone 4 Zone 5 Zone 6 Zone 7 Zone 8
A(Km²) 17.48 26.61 3.03 54.64 76.8 62.64 2.52 1.95
P(Km) 43.30 76.70 13.70 110.7 250.20 190.25 11.25 9.25
C 5.4 4.01 2.22 5.22 8.05 6.52 2.5 2.2
S 5.20 7.64 1.22 28.52 30.01 29.11 2.1 2.1
Osd 2.61 2.59 1.64 2.35 1.89 2.12 1.50 0.22
BSd 0.91 0.84 0.71 1.41 1.38 1.25 0.62 0.31
ConMax 15.38 13.85 8.59 13.58 10.33 12.55 8.62 7.54
ConMe 8.64 6.46 5.44 6.4 5.48 5.94 5.21 4.34
Gmax 15.16 9.05 6.94 7.01 6.59 6.7 5.83 6.47
GMe 7.2 2.99 3.18 3.2 2.64 3.0 2.54 3.22
GSd 1.42 1.31 1.39 1.53 0.94 1.23 1.28 1.21
XXV International Federation of Surveyors
Congress, Kuala Lumpur, Malaysia, 16 – 21
June 2014
Neural Network (11 Inputs)
Oil
spill
Look-
alike
1
2
11
Area
Perimeter
Complexity
GSD
Zone of
interest
XXV International Federation of Surveyors
Congress, Kuala Lumpur, Malaysia, 16 – 21
June 2014

Zone Type Identification
1 Oil spill 0.41
2 Oil spill 0.85
3 Oil spill 0.92
4 Look-alike 0.01
5 Look-alike 0.07
6 look-alike 0.08
7 Oil spill 0.72
8 Oil spill 0.92
Results (First approach)
14 149 examples:
76 Oil spills.
73 Look-alike.
9 ambiguous results.
16 identification errors.
83% of good identification
XXV International Federation of Surveyors
Congress, Kuala Lumpur, Malaysia, 16 – 21
June 2014
Wind Direction Estimation
The evaluation of the wind direction is based on the
interpretation of atmospheric and oceanic phenomena. The
maximum of phenomena provoked by wind is collected in order to
estimate the direction of wind.
XXV International Federation of Surveyors
Congress, Kuala Lumpur, Malaysia, 16 – 21
June 2014
Arzew costal zone
( May 2000 )
El-Kala costal zone
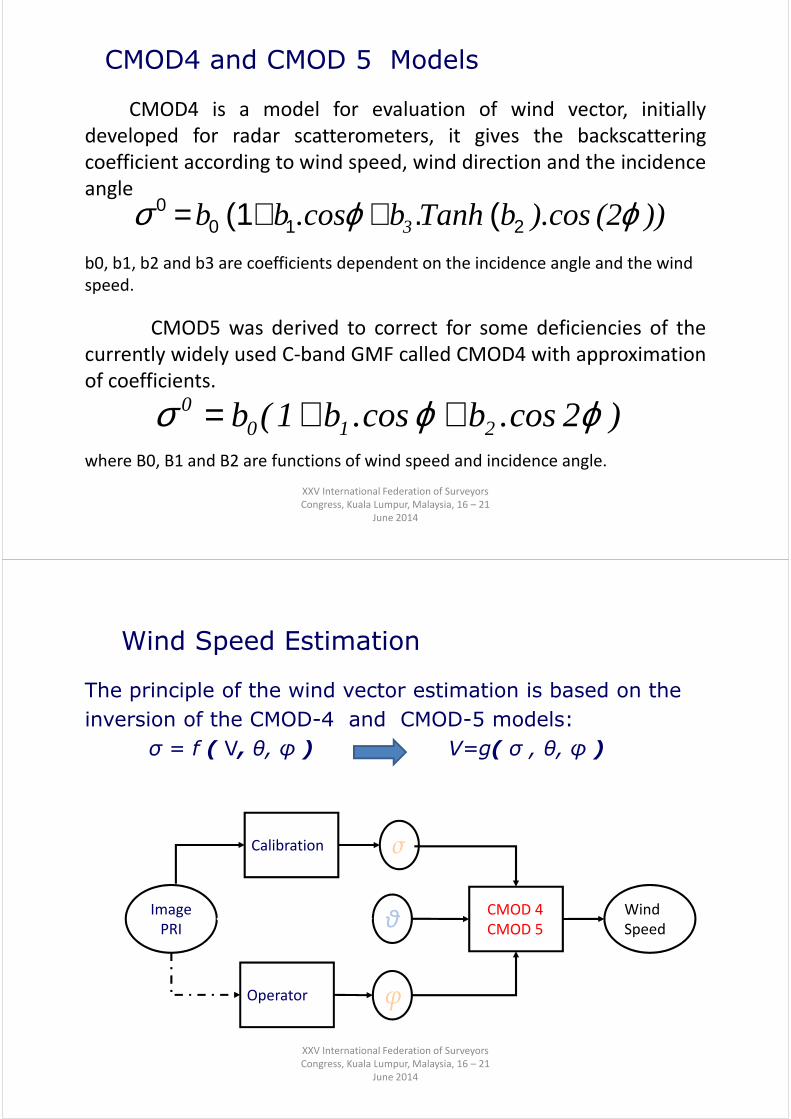
CMOD4 and CMOD 5 Models
CMOD4 is a model for evaluation of wind vector, initially
developed for radar scatterometers, it gives the backscattering
coefficient according to wind speed, wind direction and the incidence
angle
))(2).cosbTanhb.cosbb 3 ϕϕσ 2100 (.++(1 =
b0, b1, b2 and b3 are coefficients dependent on the incidence angle and the wind
speed.
XXV International Federation of Surveyors
Congress, Kuala Lumpur, Malaysia, 16 – 21
June 2014
CMOD5 was derived to correct for some deficiencies of the
currently widely used C-band GMF called CMOD4 with approximation
of coefficients.
)2cos.bcos.b1(b 2100 ϕϕσ ++=
where B0, B1 and B2 are functions of wind speed and incidence angle.
The principle of the wind vector estimation is based on the
inversion of the CMOD-4 and CMOD-5 models:
σ = f ( V, θ, φ ) V=g( σ , θ, φ )
Image
PRI θ
φOperator
σCalibration
CMOD 4
CMOD 5
Wind
Speed
Wind Speed Estimation
XXV International Federation of Surveyors
Congress, Kuala Lumpur, Malaysia, 16 – 21
June 2014

SAR/ASAR
Image
Parameters extraction
Information
file
Visual Inspection
zone of interest
Decisional Algorithm
(neural network)
Wind speed
Calculation
Estimation of
wind direction
Identification Method (Second approach)
XXV International Federation of Surveyors
Congress, Kuala Lumpur, Malaysia, 16 – 21
June 2014
Features
Parameter Zone 1 Zone 2 Zone 3 Zone 4 Zone 5 Zone 6 Zone 7 Zone 8
A(Km²) 17.48 26.61 3.03 54.64 76.8 62.64 2.52 1.95
P(Km) 43.30 76.70 13.70 110.7 250.20 190.25 11.25 9.25
C 5.4 4.01 2.22 5.22 8.05 6.52 2.5 2.2
S 5.20 7.64 1.22 28.52 30.01 29.11 2.1 2.1
Osd 2.61 2.59 1.64 2.35 1.89 2.12 1.50 0.22
BSd 0.91 0.84 0.71 1.41 1.38 1.25 0.62 0.31
ConMax 15.38 13.85 8.59 13.58 10.33 12.55 8.62 7.54
ConMe 8.64 6.46 5.44 6.4 5.48 5.94 5.21 4.34
Gmax 15.16 9.05 6.94 7.01 6.59 6.7 5.83 6.47
GMe 7.2 2.99 3.18 3.2 2.64 3.0 2.54 3.22
GSd 1.42 1.31 1.39 1.53 0.94 1.23 1.28 1.21
V(CMOD4) 4.1 4.1 3.9 2.4 2.1 1.9 2.1 2.4
V(CMOD5) 5.4 5.4 5.2 3.7 3.4 3.2 3.4 3.7
XXV International Federation of Surveyors
Congress, Kuala Lumpur, Malaysia, 16 – 21
June 2014

Neural Network (12 Inputs)
Oil
spill
Look-
alike
1
2
12
Area
Perimeter
Complexity
Wind speed
Zone of
interest
XXV International Federation of Surveyors
Congress, Kuala Lumpur, Malaysia, 16 – 21
June 2014
Zone Type (CMOD4) (CMOD5)
1 Oil spill89% 99%
2 Oil spill92% 99%
3 Oil spill95% 99%
4 Look-alike2% 0.004%
5 Look-alike6% 0.5%
6 Look-alike3% 4%
7 Oil spill81% 99%
8 Oil spill96% 99%
Results (Second approach)
149 exemples:
76 oil spills.
73 Look-alike.
CMOD4: 3 ambigous results.
13 identification error.
89% of good identification
CMOD5: 1 ambigous results.
10 identification error.
92% of good identificationXXV International Federation of Surveyors
Congress, Kuala Lumpur, Malaysia, 16 – 21
June 2014

Conclusion
In conclusion of our study:
� The two developed processes gave encouraging results.
� The evaluation of the wind direction from the SAR-PRI images
can be done by visual interpretation.
� The adaptation of the CMOD4 model to the SAR-PRI images
permits the evaluation of the wind speed.
� The wind speed brings an improvement to the process of
identification.
� The CMOD5 improve the identification of oil spill on SAR images
XXV International Federation of Surveyors
Congress, Kuala Lumpur, Malaysia, 16 – 21
June 2014
Recommended