Imperfect competition in financial markets:
ISLAND vs NASDAQ*
Bruno Biais1, Christophe Bisiere2 and Chester Spatt3
Revised November 26, 2003
Many thanks to participants at presentations at the Banque de France, the 2003 Eco-
nomics of the Software and Internet Industries Conference in Toulouse, the 2002 European
Finance Association Meetings, the 2002 European Econometric Society Meeting, the Hautes
Etudes Commerciales (Paris), the London School of Economics, NASDAQ, the Fall 2002
National Bureau of Economic Research Market Microstructure meetings, the 2002 Rutgers
University Market Microstructure Conference in honor of David Whitcomb, the Securities
and Exchange Commission, and the6th Toulouse Finance Workshop. We are particularly
grateful for insightful comments from Thierry Foucault, Burton Hollifield, Stewart May-
hew, Richard Roll, Gideon Saar, Patrik Sandas, Bruno Solnik, Leonid Waverman and David
Whitcomb. The financial support of the Fondation Banque de France is gratefully acknowl-
edged.
1Toulouse University (IDEI-CRG-GREMAQ)2Toulouse University (IDEI-CRG)3Carnegie Mellon University
brought to you by COREView metadata, citation and similar papers at core.ac.uk
provided by Research Papers in Economics

Abstract
The Internet reduces the cost of exchanging information. Electronic markets exploit this
opportunity to enable investors to place quotes at very little cost and compete with incumbent
trading systems. Does this quasi–free entry situation lead to competitive liquidity supply?
We analyze trades and order placement on Nasdaq and a competing electronic order book,
Island. While Island traders often undercut Nasdaq quotes, they undercut each other much
less frequently. The coarse tick size prevailing on Nasdaq in 2000 was considerably reduced
in 2001, while the Island tick remained very thin. This resulted in tighter spreads onboth
markets. These findings are inconsistent with the perfect competition hypothesis, under
which Island traders should undercut each others as much as Nasdaq quotes, and quote
zero-profits spreads, unaffected by a drop in the Nasdaq tick. We also estimate and test
a theoretical model of competition in limit orders, and find that Island limit orders earned
rents in 2000, but not in 2001. Our findings suggest that perfect competition cannot be
taken for granted, even in modern financial markets, and that competition among markets
complements competition among traders.

Imperfect competition in financial markets:
ISLAND vs NASDAQ
1 Introduction
Internet technology reduces communication and information processing costs. In turn, this reduces the
cost of entry in financial markets. Thus, new market mechanisms can be created and compete with
incumbent trading systems, and a larger population of investors and traders can access the market. In
conjunction with this technological revolution, the regulatory change brought about by the 1997 SEC
order display rule enhanced the ability of investors to post offers to trade stocks in the market. Electronic
Communication Networks (hereafter ECNs) developed to exploit these opportunities. These changes in
the structure of the market should foster competition to supply liquidity.
To study this point we focus on Island, one of the largest ECNs, which amounted to nearly 10% of
the trading volume in Nasdaq stocks in 2002.4 Island is operated as a fully transparent electronic limit
order market, where all investors can anonymously post quotes. Its book is freely observable to all on the
web in real time. Accessing this market is very inexpensive. In fact, Island grants a small rebate to limit
orders when they are hit, to reward liquidity supply. We study the extent to which these features of the
market foster competitive liquidity supply.
Stigler (1957) lists five conditions under which perfect competition obtains according to Adam
Smith: “1) The rivals must act independently, not collusively. 2) The number of rivals, potential as
well as present, must be sufficient to eliminate extraordinary gains. 3) The economic units possess tol-
erable knowledge of the market opportunities. 4) There must be freedom to act on this knowledge. 5)
Sufficient time must elapse for resources to flow in the directions and quantities desired by their owners.”
Christie and Schultz (1994) note that on Nasdaq dealers enjoy relatively free–entry and exit. Thus,
the second of Stigler’s conditions could hold, and the competitive outcome could be expected. How-
ever, Christie and Schultz (1994) showed empirically that Nasdaq dealers enforced implicit collusion, in
violation of Stigler’s first condition, which resulted in excessively large spreads.
Their analysis showed that competition in financial markets is imperfect when small groups of finan-
cial intermediaries have privileged access to the market and to information collection and dissemination
4Island recently merged with Instinet, but its market model has not been altered.
1

(see e.g., also Chen and Ritter, 2000). Such privileges do not seem to exist on Island. Thus the compet-
itive outcome is more likely on Island than it was on Nasdaq before the recent market reforms. Stigler’s
conditions 1) and 2) could hold on Island since there is open access to the market to many investors via
the web. Also, the remarkable transparency of Island should ensure that condition 3) is satisfied. The
1997 Order–Handling Rule emphasized investors’ right to place orders, hence condition 4) should hold
also. Thus, after sufficient time (as required by condition 5), traders should devote resources to supply
liquidity on Island, until a competitive situation is reached.
We test the hypothesis that liquidity supply on Island is competitive. We empirically analyze the
strategies followed by liquidity suppliers on Island. We test if limit orders on Island are consistent with
free-entry equilibrium, in line with the theoretical analysis of electronic order books by Glosten (1994).
We also aim to shed light on the competition between Island, a relatively recent electronic marketplace,
and the incumbent market, Nasdaq. Thus we tackle competition among liquidity suppliers within one
trading mechanismandcompetition between trading mechanisms.
Our empirical strategy takes advantage of the difference in the pricing grids used in these two market
places and of their changes. Before April 2001, the pricing grid on Nasdaq was relatively coarse, as
the tick size was one-sixteenth, and quite thin on Island, where the tick size was 1/256. In April 2001,
the Nasdaq pricing grid was decimalized. Prices on Nasdaq are now quoted in cents. At the same time
the Island tick was reduced to one-thousandth of a dollar. While the change in tick size on Nasdaq
is sizeable, the change in tick size on Island is negligible. We study if the pricing grids on the two
markets and their changes had an impact on the strategies of liquidity suppliers. Did the rather coarse
pricing grid prevailing on Nasdaq prior to decimalization constrain liquidity suppliers on this market?
Did Island liquidity suppliers take advantage of the thinner grid prevailing on this ECN? How did the
decimalization affect the competition between the two trading systems?
To conduct our analysis, we combine two sources of data for actively traded Nasdaq stocks. On the
one hand we have downloaded the sequence of trades and order book dynamics from the Island site,
on the other hand we have used the Nastraq dataset from Nasdaq. To study liquidity supply on Island
and Nasdaq, we analyze the distribution of the best quotes on the Island limit order book and on the
Nasdaq market (excluding Island quotes) as well as the placement of limit orders on Island and their
profitability.5
5Quotes in the Nastraq dataset are rounded to match the Nasdaq grid. This precludes observing situations where Island
quotes are strictly better than Nasdaq quotes by less than one Nasdaq tick. In contrast, by using unrounded Island data, we can
analyze the strategies of Island limit order traders who undercut Nasdaq quotes by using the finer pricing grid prevailing in this
2

In the pre–decimalization sample, the Nasdaq spread is equal to one tick more than 80% of the time.
Thus the tick size was binding on Nasdaq and resulted in excessively large spreads. During this sample
period, the most frequent values of the bid–ask spread on Island were one and two Nasdaq ticks. Note,
however, that Island traders were not constrained to place their orders on this relatively coarse grid size.
Indeed, we find that the second most frequent value of the Island spread corresponds to situations where
the Nasdaq tick was undercut by just one (very thin) Island tick. This clustering of Island limit orders
is not consistent with the perfect competition hypothesis. Under the latter, limit order schedules should
mirror the marginal cost of liquidity provision (see Glosten, 1994, and Biais, Martimort and Rochet,
2000), which is unlikely to exhibit clustering.
In the post-decimalization sample, the coarse tick constraint is relaxed on Nasdaq, and accordingly,
there is a marked decrease in the Nasdaq spread. While the change in the Island tick (from 1/256 to
1/1000) was negligible, we also observe a strong decrease in the Island spread. If Island quotes simply
reflected the cost of supplying liquidity, as requested by competitive behavior, they would not be affected
by a change in the tick size prevailing on the competing marketplace. Rather, our results suggest that
Island limit order traders engaged in competition for order flow with the Nasdaq market makers more
than among themselves. Facing a reduction in the Nasdaq spread, Island limit order traders had to
tighten their quotes. That they were able to do so, and yet had not done it before, suggests they competed
imperfectly and earned rents prior to decimalization.
Under this imperfect competition hypothesis, Island limit orders would be expected to undercut the
current market best quotes more often when these quotes are set by Nasdaq market makers than when
they are set by Island limit orders. To investigate this point we study the frequency of undercutting
orders on Island. Undercutting orders are defined as (non-immediately marketable) limit orders placed
within the best quotes (see Biais, Hillion and Spatt, 1995). We find that, when the best quote is set by
an Island order, the probability that the next Island order will be undercutting is less than 10%. In stark
contrast, when the best quote is set by other Nasdaq participants, the probability that the next Island order
be undercutting is greater than 25%. Thus our findings suggest that Island limit order traders undercut
Nasdaq quotes but compete less aggressively against one another to preserve their rents.
One might wonder how such behaviors could emerge in anonymous markets with potentially many
participants. We learned from discussions with market participants that, while retail day–traders repre-
sent a significant fraction of the number of orders placed in the market, only a limited number of large
ECN.
3

professional traders monitored Island and Nasdaq and strategically undercut Nasdaq quotes to earn trad-
ing profits. This induces a violation of the second of the five Stigler–Smith conditions listed above, thus
raising the possibility of imperfectly competitive behavior.
To examine these points further, we study whether the gross profits earned by Island limit order
traders exceed the cost they incur to supply liquidity. Using the generalized method of moments, we test
restrictions imposed by theoretical models of competition in limit–order schedules (Glosten (1994) and
Biais, Martimort and Rochet (2000)) and estimate the costs and the oligopoly rents of liquidity suppliers.
The hypothesis that limit orders placed on Island face no adverse selection cost is rejected. Furthermore,
our estimates are consistent with Island limit orders earning oligopoly rents when the Nasdaq spread was
constrained by the coarse pricing grid prevailing on that market. In contrast, Island quotes observed after
the decrease in the Nasdaq tick are consistent with competitive liquidity supply.
Our analysis sheds light on the way in which the Internet can enhance competition, and correspond-
ingly, increase liquidity. It enables efficient modern market architectures to be established. These com-
pete with the incumbent and force them to catch up. But, perfect competition should not be taken for
granted, even on an Internet-based transparent easily accessible limit order book, although Adam Smith’s
conditions for perfect competition seem to hold. Competition between markets is necessary to comple-
ment competition among traders.6
Our emphasis on the competition between markets is in the line of Rust and Hall (2003). They model
the competition between a trading mechanism where quotes are publicly posted by a market maker and
another trading mechanism operated by middlemen. Their theoretical analysis sheds light on the likely
effects of the reduction in search and transactions costs resulting from the information revolution and the
advent of the World Wide Web. It also highlights the risk of undercutting faced by market makers publicly
posting bid and ask prices. Our empirical investigation thus concurs with their theoretical analysis.
Our GMM analysis of limit-order schedules and adverse selection builds on the insightful structural
econometric analysis of Sandas (2001), though we take a somewhat different viewpoint. In particular,
while Sandas (2001) assumes competitive liquidity supply, we investigate market power. Thus, we si-
multaneously estimate adverse selection costs and the rents earned by Island liquidity suppliers. This
relies in part on estimating the profits earned by limit orders. Thus our approach is related to the in-
sightful analysis of the profitability of limit orders by Hasbrouck and Harris (1996), in particular to their
6Thus our analysis adds to the debate on centralized vs. fragmented markets (e.g. Chowdhry and Nanda (1991) and Parlour
and Seppi (2003)), and to the literature on the competition between markets (e.g. Barclay, Hendershott and McCormick (2003)
and Bessembinder and Kaufman (1997)).
4

“ex–post performance measure,” which computes the profitability of different types of orders, e.g., limit
orders at the best quotes, when they are executed. Our focus differs from theirs, however. While they
compare the performance of order placement strategies, we focus on the competition to supply liquidity
and document undercutting strategies. Also, we take advantage in our identification strategy of the fact
that we have two different samples, over which the order–handling cost is likely to remain constant,
while other parameters, such as the oligopoly mark–up, are likely to change.
Interesting empirical analyses of ECNs are offered by Simaan, Weaver and Whitcomb (2003), Huang
(2002), Barclay, Hendershott and McCormick (2003) and Hasbrouck and Saar (2001). Our focus on
strategic liquidity supply and rents, differs from Huang (2002), who focuses mainly on price discovery,
Hasbrouck and Saar (2001), who analyze the relationship between volatility and the order flow as well as
fleeting orders, and Barclay, Hendershott and McCormick (2003), who shed light on the choice of trad-
ing venues by informed traders. Our result that Island limit orders undercut Nasdaq quotes by using the
fine Island grid complements the finding by Simaan, Weaver and Whitcomb (2003) that Nasdaq market
makers tend to quote on odd (Nasdaq) ticks on ECNs, thus narrowing the spread.7 Another difference
between our paper and the literature devoted to ECNs is that we develop a structural econometric ap-
proach to analyze quantitatively the trade–offs between adverse selection costs and oligopoly rents. A
by–product of this analysis is to offer a new method to disentangle components of the spread without re-
lying on parametric assumptions on distributions, while building directly from a standard microstructure
model.8
The next section presents the institutional environment. Section 3 presents the data. Section 4
presents our empirical analysis of orders, quotes and spreads on Island and Nasdaq. Section 5 extends
this analysis by offering a structural econometric investigation of profits and spreads on Island. Section
6 concludes.7The quotes data used by Simaan, Weaver and Whitcomb (2003) are rounded to the Nasdaq grid. Thus they could not
observe undercutting quotes posted on the finer Island grid.8Hasbrouck (1988) disentangles inventory costs from adverse selection costs by estimating the transient and permanent
impacts of trades. Our approach does not enable us to estimate inventory costs, as it is based on a theoretical model where
liquidity suppliers are risk neutral.
5
2 Institutional environment
2.1 ECNs
ECNs use web–based platforms, which collect limit and market orders, and match them or display them
on internet–based order books. In 2002 they have been estimated to capture 39.3% of the dollar volume
of trading in Nasdaq securities (source: Market Data).9 The largest ECN, Instinet, was estimated to
represent 12% of the trading volume on Nasdaq in February 2002, while Island amounted to 9.6%,
RediBook to 6.5%, and Archipelago to 10.5%.10
While ECNs compete with the traditional source of liquidity on Nasdaq (i.e., market makers), they
do not take proprietary positions, but simply handle and display their customer’s orders. They cannot
conduct trades away from the current best market prices and must allocate orders according to price
priority. However, time priority is not enforced between ECNs and Nasdaq market makers.
Interestingly, empirical evidence so far does not suggest that the trading process managed by ECNs is
systematically free riding on price discovery achieved by the traditional market participants (the Nasdaq
dealers). To the contrary, Huang (2002) shows empirically that ECNs are important contributors to the
price discovery process. In line with this result, Barclay, Hendershott and McCormick (2003) offer
evidence of informed trades directed to ECNs and contributing to price discovery.
2.2 Island
Island is a web–based transparent limit order book.11 Trades and the best 15 quotes on each side of the
book can freely be viewed in real time through the internet. Island subscribers can freely place orders.
Trades can take place from 7:00 a.m. to 8:00 p.m. Immediately executed orders are charged .25 cent per
share traded. Non-marketable limit orders posted in the book receive .1 cent per share when executed,
as compensation for supplying liquidity. When an order is transmitted to Island, if it is not immediately
marketable, it is stored and displayed anonymously in the Island order book. If the order is marketable it
is executed at the best market price.
Until April 2001, the Nasdaq tick size was 1/16 and the Island tick size was 1/256. Since April
2001, the Nasdaq tick size has been reduced to one cent ($0.01), while on Island prices are quoted with
a three-digit precision, i.e., the tick size is one-thousandth of a dollar. The thinner price grid on Island
9In March 2000, this proportion was 26.1% and in June 2001 it was 37.1% (McAndrews and Stefanadis, 2000).10Island captured 6.4% of the trading in Nasdaq securities in March 2000, and 9.5% in June 2001.11Hasbrouck and Saar (2001) offer a good description of the market structure.
6

makes it easier for traders placing orders on that ECN to undercut Nasdaq market makers’ quotes.
Until October 2002 the best Island bid and ask quotes were displayed on the Nasdaq screen, along
with the best quotes of ECNs and market makers.12 Note, however, that Island quotes displayed and
“advertised” on the Nasdaq screen were not shown at their actual price (quoted on a thin grid) but at
rounded prices (from the Nasdaq grid). For example, when the Nasdaq tick was one-sixteenth, if the best
ask for stock XYZ on Island was one dollar and 1/24, it was displayed on Nasdaq at one dollar and 1/16.
Rounding the Island quotes enabled NASDAQ to avoid price priority constraints, and reduced the ability
of the ECN to advertise good quotes and thus attract orders. This made it very important for Island to use
another vehicle besides NASDAQ screens to disseminate information. This may be one of the reasons
for the excellent and easily accessible website Island has developed.
Because of the display of the best Island bid and ask quotes on the Nasdaq screen, if the grid size
was the same in the two market segments, the Nasdaq inside quote would, by construction always be at
least as good as the Island spread. The grid is thinner on Island than on Nasdaq, however. This raises the
possibility that Island quotes, placed on thin ticks inside the relatively coarse grid Nasdaq, could better
the Nasdaq quote, at least on one side of the book.
3 Data
We acquired quotes and trades data from Nasdaq (including the Dealer Quotes (DQ) file, the Inside Quote
(IQ) file, and the Trades (TR) file). We also downloaded a continuous record of the Island book from
the Island website during 5 trading days in March 2000 (from March 8 to March 14) and 5 trading days
in June 2001 (from June 18 to June 22). We collected this data for 7 stocks: COMS, Cisco, Dell, Intel,
Microsoft, QCom, and Sun. One advantage of the Island data (downloaded from the Island website) is
that it is not rounded to sixteenths (unlike the ECN quotes reported in the NASDAQ DQ file). Hence we
can study the use of fine ticks by Island traders.
We consider data starting at the opening of NASDAQ (at 9:30 or a few minutes before) and ending
at the NASDAQ close: 4:00 p.m. (Because of a data feed problem, for March 10, we have data only
between 9:30 and 2:30).
Summary statistics on the Island data and the Nasdaq data are presented in Table 1. The Island data
set includes 138432 trades for the March 2000 sample and 139966 trades for the June 2001 sample. The
12In the fall of 2002 Nasdaq introduced its own order book, Super Montage. As briefly discussed in the conclusion below
this led to changes in the interaction between Island and Nasdaq.
7
average trade size on Island in the March 2000 sample is 389 shares, while its counterpart for the June
2001 sample is 450 shares. The average trade size on Nasdaq is about twice as large (797 shares per
trade in 2000 sample and 898 in 2001). While market activity was comparable in 2000 and 2001, prices
fell dramatically; while the average transaction price is 99.14 in the March 2000 sample, it is 31.69 in
the June 2001 sample. Volatility tends to be lower in the 2001 sample than in its 2000 counterpart.
4 Orders, quotes and spreads on Island and Nasdaq
4.1 Spreads and quotes
To document the market environment in which Island limit order traders operated, first consider the best
quotes posted on Nasdaq by market makers and other ECNs than Island. In March 2000, the time-
weighted average spread resulting from these quotes was 1.27 sixteenths, i.e., $.079.13 The spread was
exactly equal to one tick 81.5% of the time, while the two other most frequent values of the spread were
2 ticks (13.25% of the time) and 3 ticks (3.36% of the time). After decimalization, in June 2001, the
Nasdaq tick was one cent and the time-weighted average spread was reduced to $.014. The spread was
exactly equal to one tick 78.08% of the time, while the two other most frequent values of the spread were
2 ticks (12.26% of the time) and 3 ticks (4.23% of the time). Thus, decimalization led to a dramatic
decrease in the average spread on Nasdaq, as well as a reduction in clustering. This is consistent with the
view that the coarse tick size in 2000 constrained liquidity supply and led to artificially large spreads,14
and that this constraint was relaxed by decimalization.
Now turn to the best quotes placed on Island. In 2000, the time-weighted average spread for our 7
stocks and our sample period was equal to $ 0.198.15 Thus, the average Island spread was on average
larger than the Nasdaq inside spread resulting from Island’s competitors. Yet, Island limit order traders
used the finer pricing grid prevailing on their market to often undercut the Nasdaq touch. Figure 1, Panel
A, depicts the frequency of different values of the spread for the seven stocks in our sample, on Island and
on Nasdaq in March 2000.16 As illustrated in the figure there is marked clustering in the data. Clustering
13Average spreads for each of the 7 stocks in our sample are presented in Table 1. Across all stocks, the mode and the median
spreads were equal to exactly one-sixteenth ($.0625).14As illustrated in other contexts by Harris (1991, 1994).15The mode and the median were 32/256, i.e., $.125. Average spreads on Island for the 7 stocks in our sample are presented
in Table 1.16Our graphical representation of the empirical frequency of different values of the spread is similar to Figure 1 in Christie
and Schultz, 1994, and Figure 2 in Barclay et al, 1999. In the appendix, we provide additional information on the comparison
8
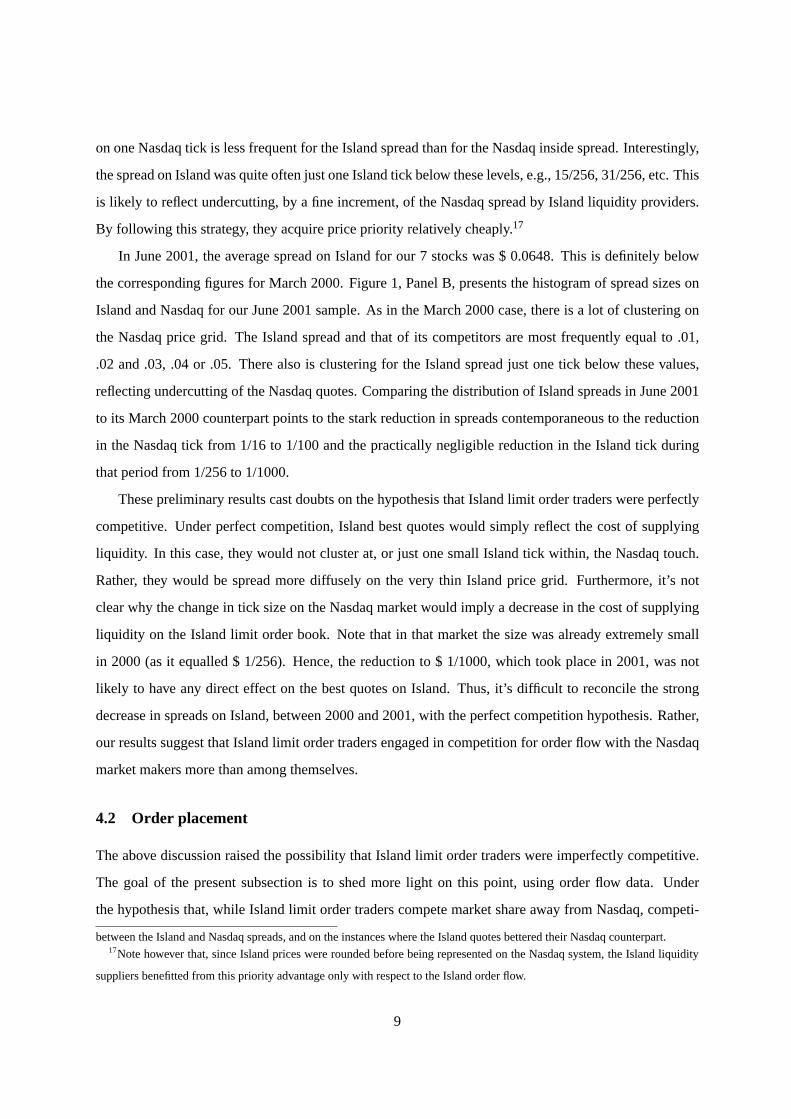
on one Nasdaq tick is less frequent for the Island spread than for the Nasdaq inside spread. Interestingly,
the spread on Island was quite often just one Island tick below these levels, e.g., 15/256, 31/256, etc. This
is likely to reflect undercutting, by a fine increment, of the Nasdaq spread by Island liquidity providers.
By following this strategy, they acquire price priority relatively cheaply.17
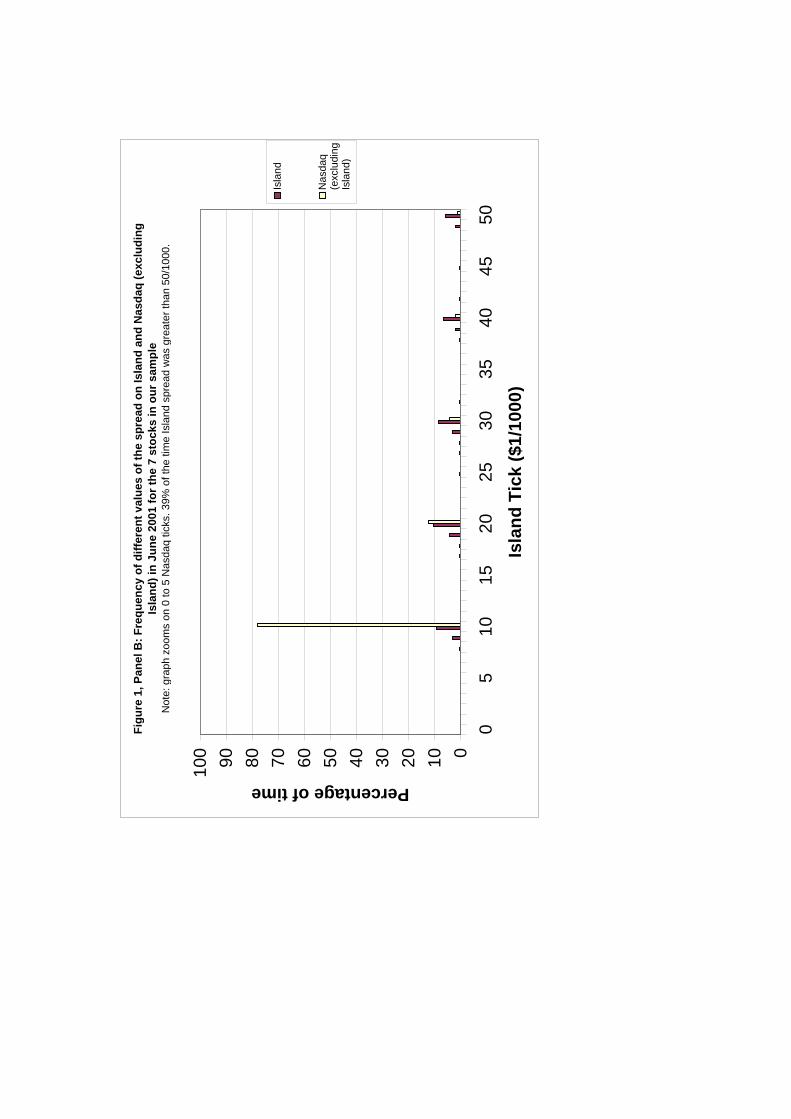
In June 2001, the average spread on Island for our 7 stocks was $ 0.0648. This is definitely below
the corresponding figures for March 2000. Figure 1, Panel B, presents the histogram of spread sizes on
Island and Nasdaq for our June 2001 sample. As in the March 2000 case, there is a lot of clustering on
the Nasdaq price grid. The Island spread and that of its competitors are most frequently equal to .01,
.02 and .03, .04 or .05. There also is clustering for the Island spread just one tick below these values,
reflecting undercutting of the Nasdaq quotes. Comparing the distribution of Island spreads in June 2001
to its March 2000 counterpart points to the stark reduction in spreads contemporaneous to the reduction
in the Nasdaq tick from 1/16 to 1/100 and the practically negligible reduction in the Island tick during
that period from 1/256 to 1/1000.
These preliminary results cast doubts on the hypothesis that Island limit order traders were perfectly
competitive. Under perfect competition, Island best quotes would simply reflect the cost of supplying
liquidity. In this case, they would not cluster at, or just one small Island tick within, the Nasdaq touch.
Rather, they would be spread more diffusely on the very thin Island price grid. Furthermore, it’s not
clear why the change in tick size on the Nasdaq market would imply a decrease in the cost of supplying
liquidity on the Island limit order book. Note that in that market the size was already extremely small
in 2000 (as it equalled $ 1/256). Hence, the reduction to $ 1/1000, which took place in 2001, was not
likely to have any direct effect on the best quotes on Island. Thus, it’s difficult to reconcile the strong
decrease in spreads on Island, between 2000 and 2001, with the perfect competition hypothesis. Rather,
our results suggest that Island limit order traders engaged in competition for order flow with the Nasdaq
market makers more than among themselves.
4.2 Order placement
The above discussion raised the possibility that Island limit order traders were imperfectly competitive.
The goal of the present subsection is to shed more light on this point, using order flow data. Under
the hypothesis that, while Island limit order traders compete market share away from Nasdaq, competi-
between the Island and Nasdaq spreads, and on the instances where the Island quotes bettered their Nasdaq counterpart.17Note however that, since Island prices were rounded before being represented on the Nasdaq system, the Island liquidity
suppliers benefitted from this priority advantage only with respect to the Island order flow.
9

tion within Island is less strong, undercutting of the best quotes by Island limit orders should be more
prevalent when the best quotes are set by Nasdaq than when they are set by the Island book.
To test this conjecture, we analyzed the Island order flow in more detail. In line with Biais, Hillion
and Spatt (1995) we differentiated 12 categories of events:
• trades resulting from the placement of market orders to buy or sell;
• new buy or sell limit orders not immediately executed, placed within the best quotes, at the best
quotes, or away from the best quotes;
• cancellations of orders, at or away from the best quotes, on the bid or the ask side;
Table 2 reports the frequency of each of these 12 events in ten different situations for the 2000
sample. Panel A reports the frequencies of events occurring on the ask side of the book (market or limit
orders to sell), while Panel B reports the frequencies of events occurring on the bid side (market or limit
orders to buy). In each panel, the first column reports the unconditional frequencies, while the 9 other
columns, report the frequencies conditional on which market sets the best price, on the bid side and the
ask side. For example, the second column corresponds to the instances where the best bid and the best
ask quote were both quoted by Island, while the third column corresponds to the case where the best bid
was quoted by Island and the best ask by Nasdaq market makers or other ECNs than Island. To conduct
this conditional analysis we merged the Island data file and the Nasdaq IQ data file.18 Inspecting the two
panels of Table 2, we note that cancellations and order placement away from the best quotes are quite
frequent. For example, their frequency is much higher than in the Paris Bourse (see Biais, Hillion and
Spatt, 1995). This is consistent with the finding by Hasbrouck and Saar (2001) that a large fraction of
the limit orders submitted to Island are “fleeting orders” which are rapidly cancelled.
Undercutting corresponds to the placement of limit sell orders within the quotes. The frequencies
reported in Table 2, Panel A, show that undercutting of the best market ask by Island limit orders is more
frequent when Nasdaq sets the best ask than when Island sets the best ask. When the best bid is set
by Island, the frequency of undercutting by Island orders is 4.54% when the best ask is set by Island,
and 26.55% when the best ask is set by Nasdaq. When the best bid is set by Nasdaq, the frequency of
undercutting by Island orders is 7.99% when the best ask is set by Island, and 37.48% when the best ask
18This was made difficult by synchronicity problems. The consequences of these non–synchronicity problems and the way
we dealt with them are discussed in the appendix.
10

is set by Nasdaq. When the best bid is the same on Island and Nasdaq, the frequency of undercutting by
Island orders is 4.39% when the best ask is set by Island, and 29.58% when the best ask is set by Nasdaq.
To put these numbers in perspective, we can compare them to their counterparts in Panel B, which report
the frequency of improvements of the best bid by Island limit orders. Whether Island or Nasdaq sets the
best ask quote has less impact on the relative magnitude of these frequencies.19
A similar result holds on the bid side. Improvements of the best bid correspond to the placement of
limit buy orders within the quotes. The frequencies reported in Table 2, Panel B, show that improvements
of the best bid by Island limit orders are more frequent when Nasdaq sets the best bid than when Island
sets the best bid. When the best ask is set by Island, the frequency of undercutting by Island orders is
4.78% when the best bid is set by Island, and 25.17% when the best bid is set by Nasdaq. When the best
ask is set by Nasdaq, the frequency of bid improvements by Island orders is 9.40% when the best bid is
set by Island, and 40.85% when the best bid is set by Nasdaq. When the best ask is the same on Island
and Nasdaq, the frequency of improvements by Island orders is 5.15% when the best bid is set by Island,
and 30.79% when the best bid is set by Nasdaq. Whether Island or Nasdaq sets the best bid quote has
less impact on the relative magnitude of undercutting on the ask side.
Table 3 reports similar frequencies for the 2001 sample. Panel A focuses on the ask side of the
book. Compare the frequencies of undercutting when Island sets the best ask and when Nasdaq sets the
best ask: They are 5.25% and 14.10%, respectively, when Island sets the best bid; 8.89% and 29.97%,
respectively, when Nasdaq sets the best bid; 4.55% and 21.64%, respectively, when the best bids are
the same on Island and Nasdaq. Comparing these figures to their counterparts in Panel B, one observes
that whether Island or Nasdaq sets the best ask quote has less impact on the relative magnitude of these
frequencies. Inspecting Panel B, one can observe that similar results obtain for the bid side of the book.
These results are in line with the hypothesis that Island limit order traders compete more aggressively
19For example, when the best bid is set by Island, the frequency of bid improvements by Island orders is 4.78% when the
best ask is set by Island, and 9.40% when the best ask is set by Nasdaq. When the best bid is set by Nasdaq, the frequency
of bid improvements by Island orders is 25.17% when the best ask is set by Island, and 40.85% when the best ask is set by
Nasdaq. When the best bid is the same on Island and Nasdaq, the frequency of bid improvements by Island orders is 11.96%
when the best ask is set by Island, and 23.35% when the best ask is set by Nasdaq. These pairs of frequencies are ordered in
the same way as their counterpart for undercutting on the ask side, but the effect is less strong. This similarity might reflect the
alternance of phases of activity and inactivity on Island. During the former, undercutting and improvements are frequent, and
Island often establishes the best quotes, though not during the latter. That the identity of the market setting the best ask quote
has much less impact on the frequency of bid improvements than on that of undercutting on the ask side is consistent with our
imperfect competition hypothesis,
11

with Nasdaq than with one another, as the frequency of undercutting on the ask side is greater when the
best ask is quoted by Nasdaq, while the frequency of improvements on the bid side is greater when the
best bid is quoted by Nasdaq. The magnitude of this effect is more pronounced in 2000 than in 2001,
suggesting that deviations from perfect competition were stronger in the former year than in the latter.
4.3 Conclusion
Putting together the above results, the following picture of the competition between Nasdaq and Island
emerges: Before decimalization, liquidity supply on Nasdaq was constrained by the coarse tick size,
resulting in large spreads. Island limit order traders took advantage of that situation by frequently un-
dercutting the Nasdaq quote by just one thin Island tick. While they competed market share away from
Nasdaq, they competed much less aggressively among themselves on Island.
The decrease in the Nasdaq tick brought about by decimalization led to a stark decrease in the Nasdaq
spread. There was no significant contemporaneous change in the Island tick, which was already very thin
before 2001, and unlikely to constrain order placement. Yet, the Island spread was strongly reduced by
decimalization on Nasdaq. This reduction took place because the Island limit order traders had to react to
the decrease of the spread of their Nasdaq competitors. That they were able to engage in this reduction,
and yet had not done it before, is suggestive of imperfect competition among Island liquidity suppliers.
The next section studies this point further.
5 An econometric analysis of the costs and profits of Island limit order
traders
5.1 Theoretical framework
In this section we examine econometrically the costs incurred by Island limit order traders and the profits
they earn. Consider a limit order to sell, at timet, at the best quote in the Island limit order book:At. If
this order is filled its profit is:
At − v − (c− f),
wherev is the fundamental value of the asset,c is the order–handling cost incurred by the limit order
trader, andf is the compensation offered by Island to executed limit orders. Note thatf is not a parameter
to be estimated, but an observable pricing rule set by Island.
12
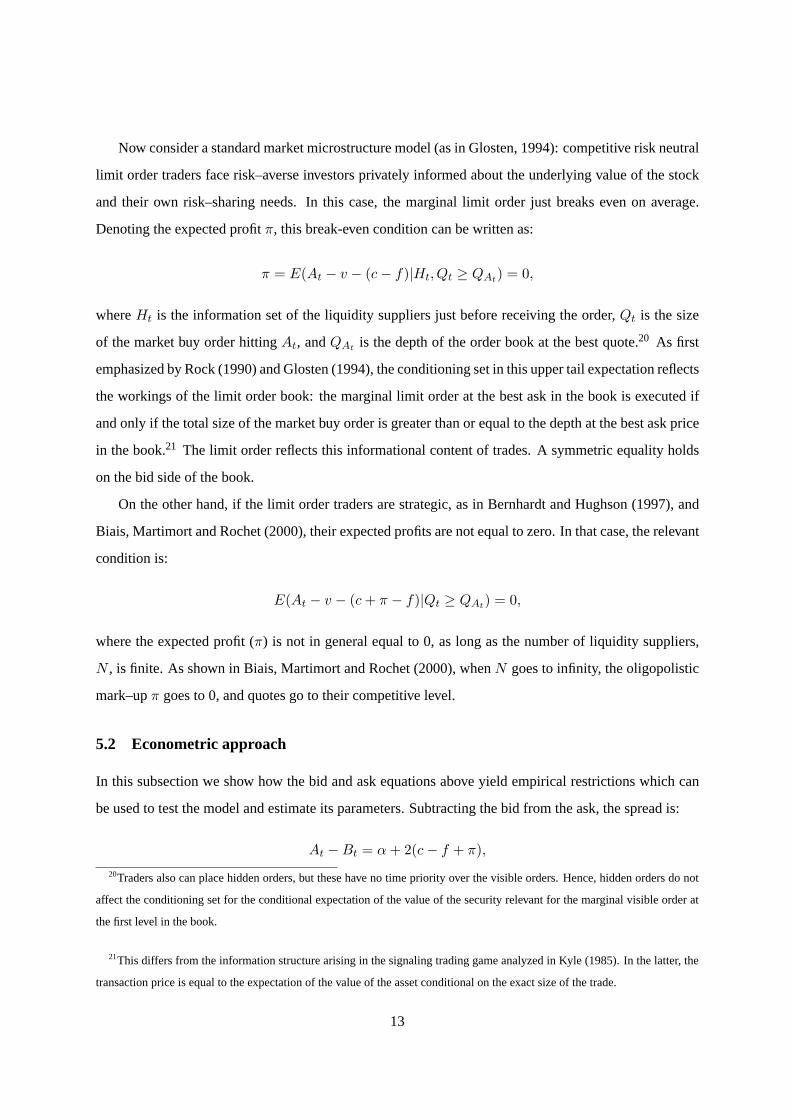
Now consider a standard market microstructure model (as in Glosten, 1994): competitive risk neutral
limit order traders face risk–averse investors privately informed about the underlying value of the stock
and their own risk–sharing needs. In this case, the marginal limit order just breaks even on average.
Denoting the expected profitπ, this break-even condition can be written as:
π = E(At − v − (c− f)|Ht, Qt ≥ QAt) = 0,
whereHt is the information set of the liquidity suppliers just before receiving the order,Qt is the size
of the market buy order hittingAt, andQAt is the depth of the order book at the best quote.20 As first
emphasized by Rock (1990) and Glosten (1994), the conditioning set in this upper tail expectation reflects
the workings of the limit order book: the marginal limit order at the best ask in the book is executed if
and only if the total size of the market buy order is greater than or equal to the depth at the best ask price
in the book.21 The limit order reflects this informational content of trades. A symmetric equality holds
on the bid side of the book.
On the other hand, if the limit order traders are strategic, as in Bernhardt and Hughson (1997), and
Biais, Martimort and Rochet (2000), their expected profits are not equal to zero. In that case, the relevant
condition is:
E(At − v − (c + π − f)|Qt ≥ QAt) = 0,
where the expected profit (π) is not in general equal to 0, as long as the number of liquidity suppliers,
N , is finite. As shown in Biais, Martimort and Rochet (2000), whenN goes to infinity, the oligopolistic
mark–upπ goes to 0, and quotes go to their competitive level.
5.2 Econometric approach
In this subsection we show how the bid and ask equations above yield empirical restrictions which can
be used to test the model and estimate its parameters. Subtracting the bid from the ask, the spread is:
At −Bt = α + 2(c− f + π),
20Traders also can place hidden orders, but these have no time priority over the visible orders. Hence, hidden orders do not
affect the conditioning set for the conditional expectation of the value of the security relevant for the marginal visible order at
the first level in the book.
21This differs from the information structure arising in the signaling trading game analyzed in Kyle (1985). In the latter, the
transaction price is equal to the expectation of the value of the asset conditional on the exact size of the trade.
13

where:
α = [E(v|Qt ≥ QAt ,Ht)− E(v|Qt ≤ −|QBt |,Ht)]
denotes the informational component of the spread.
Some time after (say at timet + ∆t), the liquidity suppliers have updated their expectation of the
fundamental value of the asset to form:
E(v|Ht+∆t).
We proxy this expectation by the mid–quote observed half an hour after the trade:
mt+∆t = E(v|Ht+∆t) + εt+∆t.
For simplicity, we assume thatεt+∆t is white noise. In this context, we obtain that:
mt+∆t −At = [E(v|Ht+∆t) + εt+∆t]− [E(v|Qt ≥ QAt ,Ht) + c− f + π].
Taking expectations conditional on the occurrence of the purchase at timet:
E(mt+∆t −At|Qt ≥ QAt ,Ht) =
E([E(v|Ht+∆t) + εt+∆t]− [E(v|Qt ≥ QAt ,Ht) + c− f + πi]|Qt ≥ QAt ,Ht).
Applying the law of iterated expectations:
E([E(v|Ht+∆t) + εt+∆t]|Qt ≥ QAt ,Ht) = E(v|Qt ≥ QAt ,Ht).
Hence, the expected difference between the ask price and the subsequent mid–quote simplifies to:
E(At −mt+∆t|Qt ≥ QAt ,Ht) = c− f + π.
A similar equality holds for the bid side:
E(mt+∆t −Bt|Qt ≤ −|QBt |,Ht) = c− f + π.
The intuition is that, on average, the informational component of the spread differences out, so that
the difference between the transaction price and the subsequent midquote, i.e., the gross trading profit of
the liquidity supplier, is equal to his non–informational cost (c net of the compensation offered by Island
to liquidity supply,f ) plus the oligopoly rent (π).
14
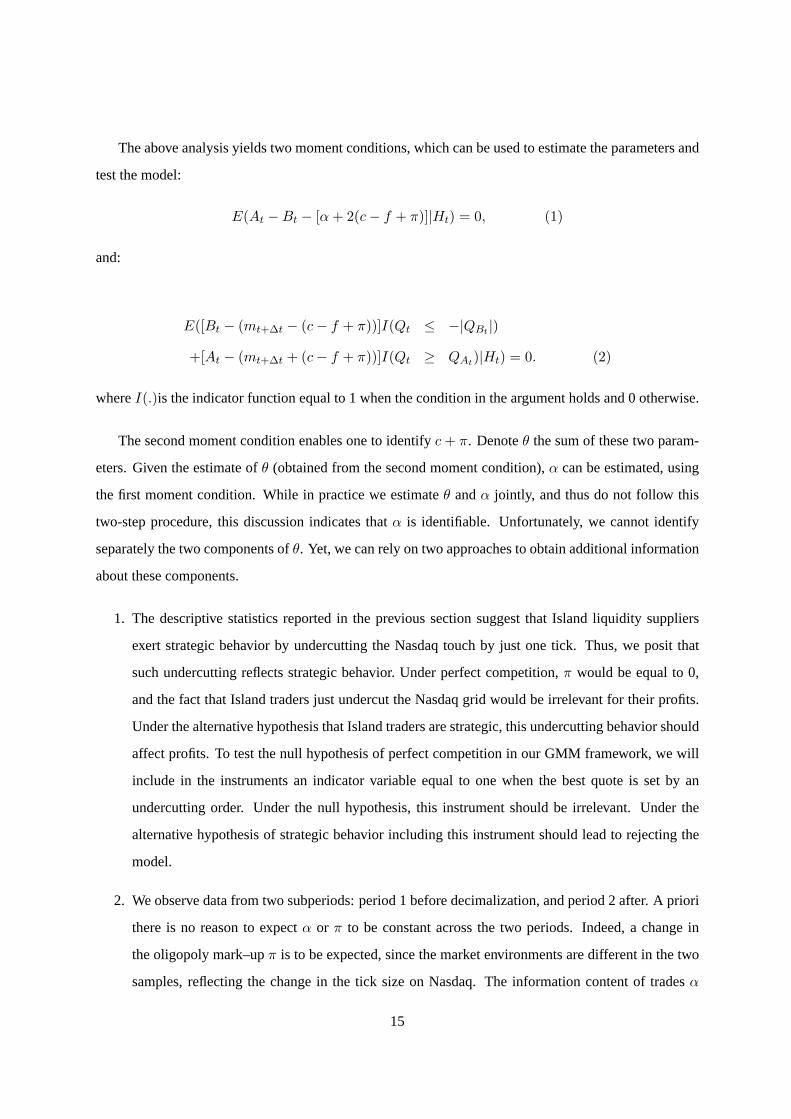
The above analysis yields two moment conditions, which can be used to estimate the parameters and
test the model:
E(At −Bt − [α + 2(c− f + π)]|Ht) = 0, (1)
and:
E([Bt − (mt+∆t − (c− f + π))]I(Qt ≤ −|QBt |)
+[At − (mt+∆t + (c− f + π))]I(Qt ≥ QAt)|Ht) = 0. (2)
whereI(.)is the indicator function equal to 1 when the condition in the argument holds and 0 otherwise.
The second moment condition enables one to identifyc + π. Denoteθ the sum of these two param-
eters. Given the estimate ofθ (obtained from the second moment condition),α can be estimated, using
the first moment condition. While in practice we estimateθ andα jointly, and thus do not follow this
two-step procedure, this discussion indicates thatα is identifiable. Unfortunately, we cannot identify
separately the two components ofθ. Yet, we can rely on two approaches to obtain additional information
about these components.
1. The descriptive statistics reported in the previous section suggest that Island liquidity suppliers
exert strategic behavior by undercutting the Nasdaq touch by just one tick. Thus, we posit that
such undercutting reflects strategic behavior. Under perfect competition,π would be equal to 0,
and the fact that Island traders just undercut the Nasdaq grid would be irrelevant for their profits.
Under the alternative hypothesis that Island traders are strategic, this undercutting behavior should
affect profits. To test the null hypothesis of perfect competition in our GMM framework, we will
include in the instruments an indicator variable equal to one when the best quote is set by an
undercutting order. Under the null hypothesis, this instrument should be irrelevant. Under the
alternative hypothesis of strategic behavior including this instrument should lead to rejecting the
model.
2. We observe data from two subperiods: period 1 before decimalization, and period 2 after. A priori
there is no reason to expectα or π to be constant across the two periods. Indeed, a change in
the oligopoly mark–upπ is to be expected, since the market environments are different in the two
samples, reflecting the change in the tick size on Nasdaq. The information content of tradesα
15

also might well have changed. Correspondingly, we carry the estimation separately over the two
periods, which yields two sets of parameter estimates:{α1, θ1} and{α2, θ2}. On the other hand,
it is plausible that the order-handling costc is constant across our two subsamples. Under this
assumption, we disentangleπ from c by comparing the results obtained for the two periods. Since
θ1 = c + π1 andθ2 = c + π2 we have that:θ1 − θ2 = π1 − π2. Thus, if we find thatθ1 − θ2 > 0
and sinceπ2 must be non–negative, we know thatπ1 > 0.
Finally note that our approach to decomposing the spread is robust and avoids relying upon auxiliary
parametric assumptions, instead building directly upon a fundamental microstructure model.
5.3 Empirical results
5.3.1 Observations and instruments
As discussed above, if limit order traders are competitive and risk neutral, the marginal limit orders break
even on average (in line with Glosten, 1994, and Sandas, 2001). In contrast, with a discrete pricing grid,
infra-marginal orders can earn profits, even in the competitive case. Hence, to test the hypothesis that
liquidity supply is competitive, we impose the moment conditions only on trades involving marginal
limit orders in the book. For example, suppose that, at the best ask quote in the book, 500 shares are
offered. A market buy order for 250 shares would not hit the marginal limit order. Hence it would not
be included in the data we use to estimate the model and test the competitive hypothesis. In contrast, a
market buy order for 500 shares or more would be included.
5.3.2 A first, simple, specification
First we estimate a simple specification, where it is assumed that the parameters are constant across
market conditions. The instruments are the square of the change in the stock price during the last half–
hour, to proxy for the volatility, and the sign of the last trade. The parameter estimates are presented in
Table 4:
• As can be seen in the table, the estimates ofα are significantly positive in both subperiods. Neg-
ative estimates ofα would have contradicted the model. Significantly positive estimates lead to
rejection of the hypothesis that there is no adverse selection.
• The estimate ofc + π is positive in 2000 for 6 stocks out of 7, and significantly so for 3 stocks.
It is also significantly positive for the pooled data. Hence, we reject the hypothesis that there
16

is no order–handling cost or market power in that period. In contrast, the estimate ofc + π is
significantly positive only for one stock out of seven after decimalization. For this period, it is not
significantly different from 0 for the pooled data. Thus, overall, the result is thatc+π was positive
before decimalization, but not after. Under the plausible assumption thatc did not vary between
the two periods, this suggests that liquidity supply on Island was imperfectly competitive before
decimalization and competitive afterwards, i.e.,π was significantly positive during the first period
and not significantly different from zero in the second period.
5.3.3 A more flexible specification
While the assumption thatc is constant through time and market conditions is reasonable, adverse se-
lection and rent-earning opportunities are likely to vary. Consequently, we estimate a more flexible
specification allowing the parameters to vary with market conditions. In this specification the adverse
selection cost parameter for stockk at timet (αkt ) is specified as:
αkt = βαk
Xkt ,
whereβαkis a vector of parameters andXk
t is a vector of variables including:
• the constant,
• the depth at the best ask quote for observations corresponding to purchases, and depth at the best
bid for observations corresponding to sales,
• the square of the change in the stock price during the last half–hour, to proxy for the volatility.
Similarly, θkt = βθk
Xkt . The instruments used to carry out the estimation are the variables inXk
t , to
which we add the sign of the last trade.
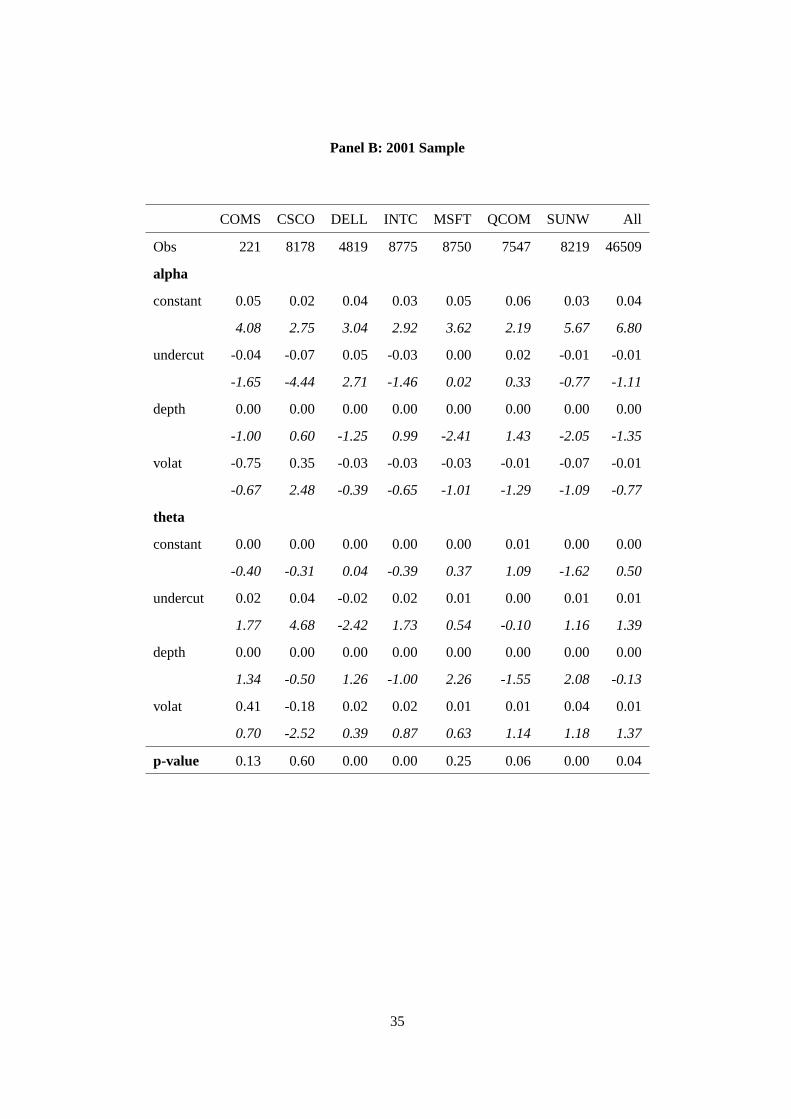
The parameter estimates and the p–values for this more flexible specification are presented in Table
5. Both in 2000 and in 2001 the null hypothesis that the model is correct is not rejected at the 5% level
for 4 stocks out of 7. This suggests reasonable adequacy of the model to the data.22 The p–level is much
smaller when the model is estimated with the pooled data suggesting that parameters do differ across
stocks.
For the adverse selection component of the spread, the constant (i.e., the first element ofβα) is
significantly positive for 5 stocks out of seven and for the pooled data, both in 2000 and in 2001. This
22This reasonable fit of our structural model with a flexible specification is not unlike that obtained in Sandas (2001).
17

reinforces our previous finding that Island liquidity suppliers face significant adverse selection costs.
Regarding depth and volatility there is no clear pattern in the parameter estimates. Neither is there
any clear pattern either in the parameter estimates relative toθ, except that in 2000 the order-handling
cost/market power parameter is increasing in volatility.
5.3.4 The role of undercutting
Under perfect competition, Island limit orders’ expected profits should be zero, irrespective of whether
they undercut Nasdaq or not. Thus, the indicator variable equal to one when the Nasdaq grid is undercut
by just one tick should be unrelated to the profit of Island orders. Hence, to test the null hypothesis of
perfect competition, we include this indicator variable in the instruments.
The p–level and parameter estimates obtained when undercutting is included in the set of instruments
are presented in Table 6. The model is now rejected at the 5% level in 5 cases out of 7 in 2000 and 6
cases out of 7 in 2001. This contrasts with the results obtained when undercutting was not included in the
instruments (in that case the model was rejected in for 3 stocks only in 2000 and in 2001). These results
point to the relevance of undercutting for the profits of Island limit order traders. While this would be
expected to arise with strategic limit order placement, this contradicts the perfect competition hypothesis.
This suggests to explore further the determinants of liquidity suppliers’ rents by including the indi-
cator of undercutting in the variables in the flexible model. Table 7 presents the parameter estimates and
p–values obtained in this specification. As in Table 5, the null hypothesis that the model is correct is
not rejected at the 5% level for 4 stocks out of 7. Parameter estimates for the constant, volatility and
depth are similar to those reported in the previous table, which speaks in favor of the robustness of the
model. For the market power/order-handling costs parameter, the estimate corresponding to the under-
cutting variable is positive for 5 stocks out of 7. While this is significant for only 2 stocks in 2000 and
one stock in 2001, this is broadly consistent with the hypothesis that Island limit order traders earn rents
by undercutting the Nasdaq grid.
6 Conclusion
This paper is a study in the industrial organization of financial markets. We examine the competition
between limit order traders as well as the competition between markets. We find that, before decimal-
ization, Nasdaq spreads were constrained by the tick size, and were correspondingly excessively wide.
Reacting to this situation, limit order traders used Island as a platform to compete for the supply of liquid-
18

ity. To do so they often undercut the Nasdaq inside quotes, by using the finer Island grid. Undercutting
on Island did not lead to competitive liquidity supply, however. In contrast with zero–profit free–entry
equilibrium, limit orders placed on Island, before the Nasdaq decimalization, earned positive profits (net
of transactions costs). After the Nasdaq decimalization, the Island spread became much tighter. In this
context, the rents earned by Island limit orders virtually disappeared.
Our results suggest that the wide dissemination of information and the reduction in the costs of
accessing markets brought about by the internet technology are important but not sufficient to eliminate
market power in financial markets, in particular in the supply of liquidity. In addition to the competition
between liquidity suppliers within a marketplace, competition between trading mechanisms plays an
important role.
In the fall of 2002, Nasdaq introduced a new trading mechanism, Super Montage, enabling the dis-
play of orders in an electronic book. While this made Nasdaq more similar to Island, it did not reduce the
competition between the two markets. Island does not participate in Super Montage. While it continues
to run its electronic limit order book, its orders are represented on the Cincinnati Stock Exchange and
appear on the Nasdaq level 1 and 2 screens under the heading “Cinn”. Analyzing the evolution of the
competition between the electronic limit order books of the incumbent (Nasdaq) and the new entrants
(the ECNs) is an interesting avenue of further research.
19
References
Andresen, M., 2000, Don’t CLOBer the ECNs,Wall Street Journal, March 27.
Barclay, M., W. Christie, J. Harris, E. Kandel, and P. Schultz, 1999, The effects of market reform on
trading costs and depths of Nasdaq stocks,Journal of Finance, 54, 1–34.
Barclay, M., T. Hendershott and T. McCormick, 2003, Competition among trading venues: Informa-
tion and trading on electronic communications networks,Journal of Finance, 58, 2637–2665.
Bernhardt, D., and E. Hughson, 1997, Splitting orders,Review of Financial Studies, 10, 69–102.
Bessembinder, H., and H. Kaufman, 1997, A cross exchange comparison of execution costs and and
information flow for NYSE–listed stocks,Journal of Financial Economics, 46, 293–319.
Biais, B., P. Hillion and C. Spatt, 1995, An empirical analysis of the order book and order flow in the
Paris Bourse,Journal of Finance, 50, 1655-1689.
Biais, B., D. Martimort and J.C. Rochet, 2000, Competing mechanisms in a common value environ-
ment,Econometrica, 68, 799–837.
Chen, H., and J. Ritter, 2000, The seven percent solution,Journal of Finance, 55, 1105-1131.
Chowdhry, B., and V. Nanda, Multimarket trading and market liquidity,Review of Financial Studies,
4, 483-511.
Christie, W., and P. Schultz, 1994, Why do Nasdaq market makers avoid odd–eight quotes?,Journal
of Finance, 49, 1813–1840.
Glosten, L., 1994, Is the electronic limit order book inevitable?,Journal of Finance, 49, 1127–1161.
Harris, L., 1994, Minimum price variations, discrete bid-ask spreads, and quotation sizes,Review of
Financial Studies, 7, 149-178.
Harris, L., 1991, Stock price clustering and discreteness,Review of Financial Studies, 4, 389-415.
Harris, L., and J. Hasbrouck, 1996, Market versus limit orders: The SuperDOT evidence on order
submission strategy,Journal of Financial and Quantitative Analysis, 31, 213–231.
Hasbrouck, J., and G. Saar, 2001, Limit orders and volatility in a hybrid market: The Island ECN,
working paper, New York University.
Hasbrouck, J., 1988, Trades, quotes, inventories and information,Journal of Financial Economics,
22, 229–252.
Huang, R., 2002, The quality of ECN and Nasdaq market maker quotes,Journal of Finance,57,
1285-1319.
Kyle, P., 1985, Continuous auctions and insider trading,Econometrica, 53, 1315-1336.
20

Market Data,http://www.marketdata.nasdaq.com.
McAndrews, J., and C. Stefanadis, The emergence of Electronic Communications Networks in the
US equity markets,Federal Reserve Bank of New York Current Issues in Economics and Finance, Volume
6, Number 12, pages 1 to 6.
Parlour, C., and D. Seppi, 2003, Liquidity-based competition for order flow,Review of Financial
Studies, 16, 301-343.
Rock, K., 1990, The specialist’s order book and price anomalies, working paper, Harvard Business
School.
Rust, J., and G. Hall, 2003, Middlemen versus Market Makers: A Theory of Competitive Exchange,
Journal of Political Economy, 111, 353–403.
Sandas, P., 2001, Adverse selection and competitive market making: Empirical evidence from a limit
order market,Review of Financial Studies, 14, 705-734.
Stigler, G., 1957, Perfect competition, historically contemplated,Journal of Political Economy, 65,
1-17.
Simaan, Y., D. Weaver, and D. Whitcomb, 2003, Market-maker quotation behavior and pretrade
transparency,Journal of Finance, 58, 1247-1268.
21

Table 1: Summary statistics on daily activity
The table reports the average daily number of trades, the average trade size (in terms of
number of shares per trade), the average $ spread, the average difference between the highest
and the lowest transaction price of the day, the average transaction price, and the average
daily return. The statistics are given for each stock in the sample and also when pooling all
stocks.
Panel A: 2000 Sample
# trades Trade size Spread (in $) Hi-Low Price Return
Stock Nasdaq Island Nasdaq Island Nasdaq Island (in $)
COMS 20,585 2,829 659 393 .080 .218 5.85 64.6 -.045
CSCO 39,831 5,141 655 338 .076 .178 6.15 136.1 -.003
DELL 52,255 5,879 1,185 478 .064 .092 3.33 52.8 .029
INTC 31,521 3,929 779 392 .075 .211 5.69 119.5 .006
MSFT 41,279 5,157 942 416 .071 .147 3.99 97.6 .010
QCOM 37,713 4,834 463 331 .106 .282 10.50 131.0 .007
SUNW 21,897 2,611 583 331 .083 .256 5.18 94.0 -.010
All 35,012 4,340 797 389 .079 .198 5.81 99.1 -.001
22
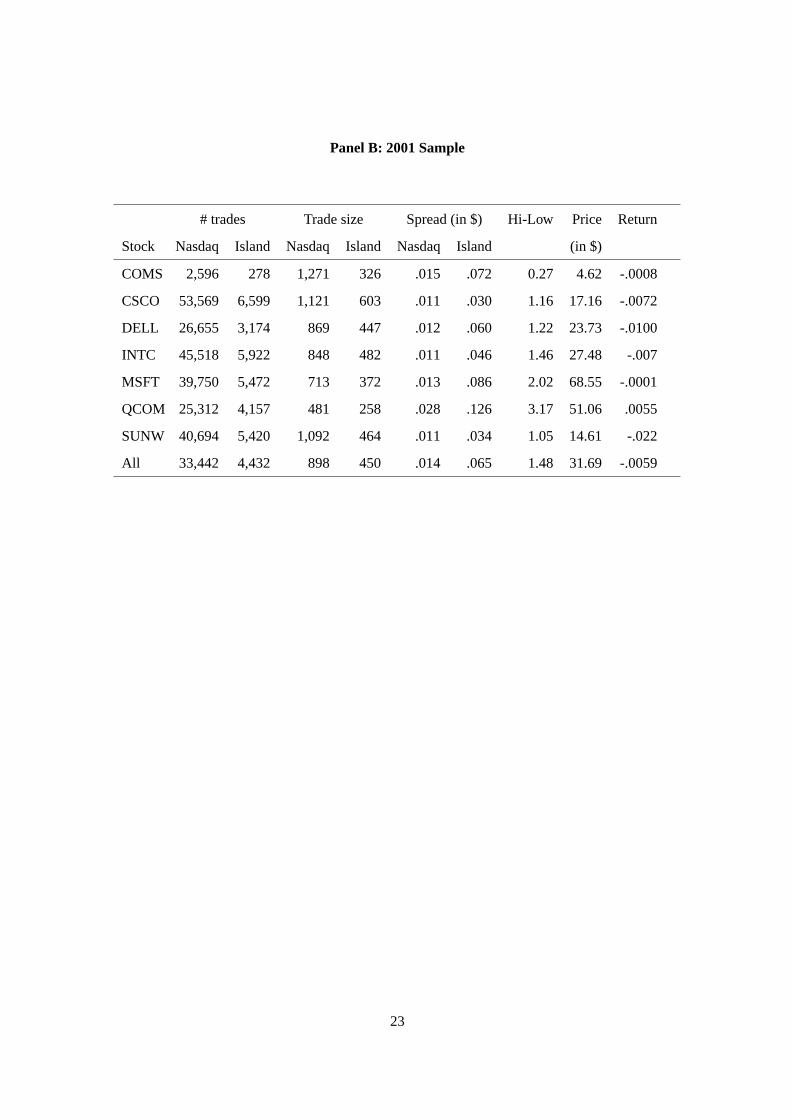
Panel B: 2001 Sample
# trades Trade size Spread (in $) Hi-Low Price Return
Stock Nasdaq Island Nasdaq Island Nasdaq Island (in $)
COMS 2,596 278 1,271 326 .015 .072 0.27 4.62 -.0008
CSCO 53,569 6,599 1,121 603 .011 .030 1.16 17.16 -.0072
DELL 26,655 3,174 869 447 .012 .060 1.22 23.73 -.0100
INTC 45,518 5,922 848 482 .011 .046 1.46 27.48 -.007
MSFT 39,750 5,472 713 372 .013 .086 2.02 68.55 -.0001
QCOM 25,312 4,157 481 258 .028 .126 3.17 51.06 .0055
SUNW 40,694 5,420 1,092 464 .011 .034 1.05 14.61 -.022
All 33,442 4,432 898 450 .014 .065 1.48 31.69 -.0059
23

Table 2: Frequency of different types of orders on Island in 2000
We identify 6 categories of orders on each side of the book (buy and sell), differentiating them by
execution status (immediate in the case of market orders, delayed for new quotes placed in the book,
prevented in the case of cancellations) and location in the book (at, within or away from the best quotes).
Pooling all stocks, we compute the relative frequency of each of these events on each side of the book.
The first column reports unconditional frequencies, while the 9 remaining columns report frequencies
conditional on 9 different situations: 1) when the best bid and ask quotes are set by Island, 2) when the
best bid is set by Island but the best ask is set by Nasdaq, 3) when the best bid is set by Island and the
ask is the same on Island and Nasdaq, 4) when the best bid is set by Nasdaq while the best ask is set by
Island, 5) when the best bid and ask are set by Nasdaq, 6) when the best bid is set by Nasdaq and the ask
is the same on Island and Nasdaq, 7) when the bid is the same on Nasdaq and Island and the best ask is
set by Island, 8) when the bid is the same on Nasdaq and Island and the best ask is set by Nasdaq, and 9)
when the bid and the ask are the same on Island and Nasdaq. Panel A focuses on the ask side of the book
(orders to sell), while Panel B focuses on the bid side (orders to buy). Each column within each panel is
a vector of relative frequencies adding up to 100%.
Panel A: Ask side
Best Bid set by: All Isld Isld Isld Nasdaq Nasdaq Nasdaq Same Same Same
Best Ask set by: All Isld Nasdaq Same Isld Nasdaq Same Isld Nasdaq Same
Cancel ask at 13.66 14.71 12.25 18.16 9.84 12.91 16.55 12.25 13.58 17.09
best quotes
Cancel ask away 24.44 27.36 12.74 17.71 35.74 21.69 25.89 30.51 18.17 21.45
from best quotes
New ask at 12.96 5.76 9.92 22.27 6.43 9.02 26.08 5.44 8.32 20.76
best quotes
New ask away 22.34 32.06 16.45 17.41 36.82 15.80 15.81 31.79 14.62 14.79
from best quotes
New ask within 15.82 4.54 26.55 7.80 7.99 37.48 12.53 4.39 29.58 8.27
best quotes
Sale 10.78 15.58 22.09 16.65 3.18 3.11 3.14 15.61 15.73 17.66
24

Panel B: Bid Side
Best Bid set by: All Isld Isld Isld Nasdaq Nasdaq Nasdaq Same Same Same
Best Ask set by: All Isld Nasdaq Same Isld Nasdaq Same Isld Nasdaq Same
Cancel bid at 13.90 17.00 13.12 17.69 12.44 12.61 13.96 14.60 12.74 13.59
best quotes
Cancel bid away 23.78 26.10 34.46 27.79 12.39 19.43 15.36 18.45 23.62 18.86
from best quotes
New bid at 8.96 5.88 7.33 5.74 7.47 7.20 7.40 16.50 16.99 15.16
best quotes
New bid away 21.82 25.28 31.95 25.19 13.44 16.17 14.16 17.21 19.14 17.69
from best quotes
New bid within 18.41 4.78 9.40 5.15 25.17 40.85 30.79 11.96 23.35 14.71
best quotes
Purchase 13.13 20.96 3.74 18.43 29.09 3.75 18.33 21.28 4.15 20.00
25
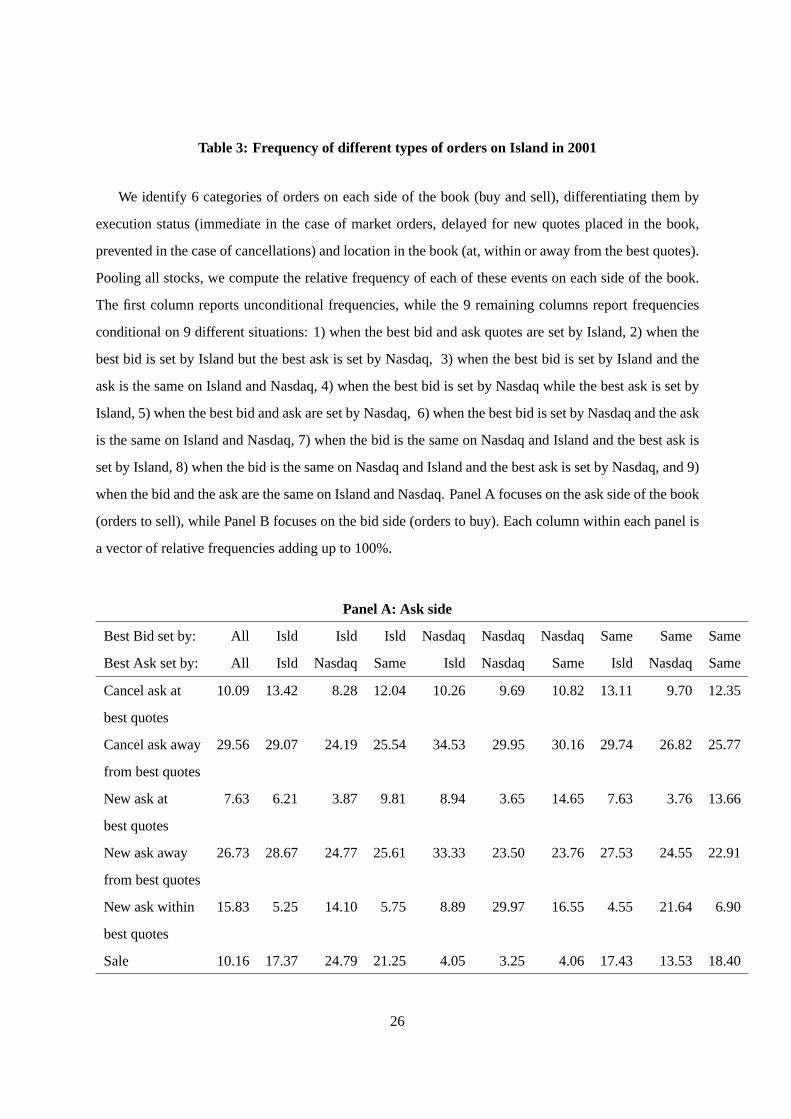
Table 3: Frequency of different types of orders on Island in 2001
We identify 6 categories of orders on each side of the book (buy and sell), differentiating them by
execution status (immediate in the case of market orders, delayed for new quotes placed in the book,
prevented in the case of cancellations) and location in the book (at, within or away from the best quotes).
Pooling all stocks, we compute the relative frequency of each of these events on each side of the book.
The first column reports unconditional frequencies, while the 9 remaining columns report frequencies
conditional on 9 different situations: 1) when the best bid and ask quotes are set by Island, 2) when the
best bid is set by Island but the best ask is set by Nasdaq, 3) when the best bid is set by Island and the
ask is the same on Island and Nasdaq, 4) when the best bid is set by Nasdaq while the best ask is set by
Island, 5) when the best bid and ask are set by Nasdaq, 6) when the best bid is set by Nasdaq and the ask
is the same on Island and Nasdaq, 7) when the bid is the same on Nasdaq and Island and the best ask is
set by Island, 8) when the bid is the same on Nasdaq and Island and the best ask is set by Nasdaq, and 9)
when the bid and the ask are the same on Island and Nasdaq. Panel A focuses on the ask side of the book
(orders to sell), while Panel B focuses on the bid side (orders to buy). Each column within each panel is
a vector of relative frequencies adding up to 100%.
Panel A: Ask side
Best Bid set by: All Isld Isld Isld Nasdaq Nasdaq Nasdaq Same Same Same
Best Ask set by: All Isld Nasdaq Same Isld Nasdaq Same Isld Nasdaq Same
Cancel ask at 10.09 13.42 8.28 12.04 10.26 9.69 10.82 13.11 9.70 12.35
best quotes
Cancel ask away 29.56 29.07 24.19 25.54 34.53 29.95 30.16 29.74 26.82 25.77
from best quotes
New ask at 7.63 6.21 3.87 9.81 8.94 3.65 14.65 7.63 3.76 13.66
best quotes
New ask away 26.73 28.67 24.77 25.61 33.33 23.50 23.76 27.53 24.55 22.91
from best quotes
New ask within 15.83 5.25 14.10 5.75 8.89 29.97 16.55 4.55 21.64 6.90
best quotes
Sale 10.16 17.37 24.79 21.25 4.05 3.25 4.06 17.43 13.53 18.40
26
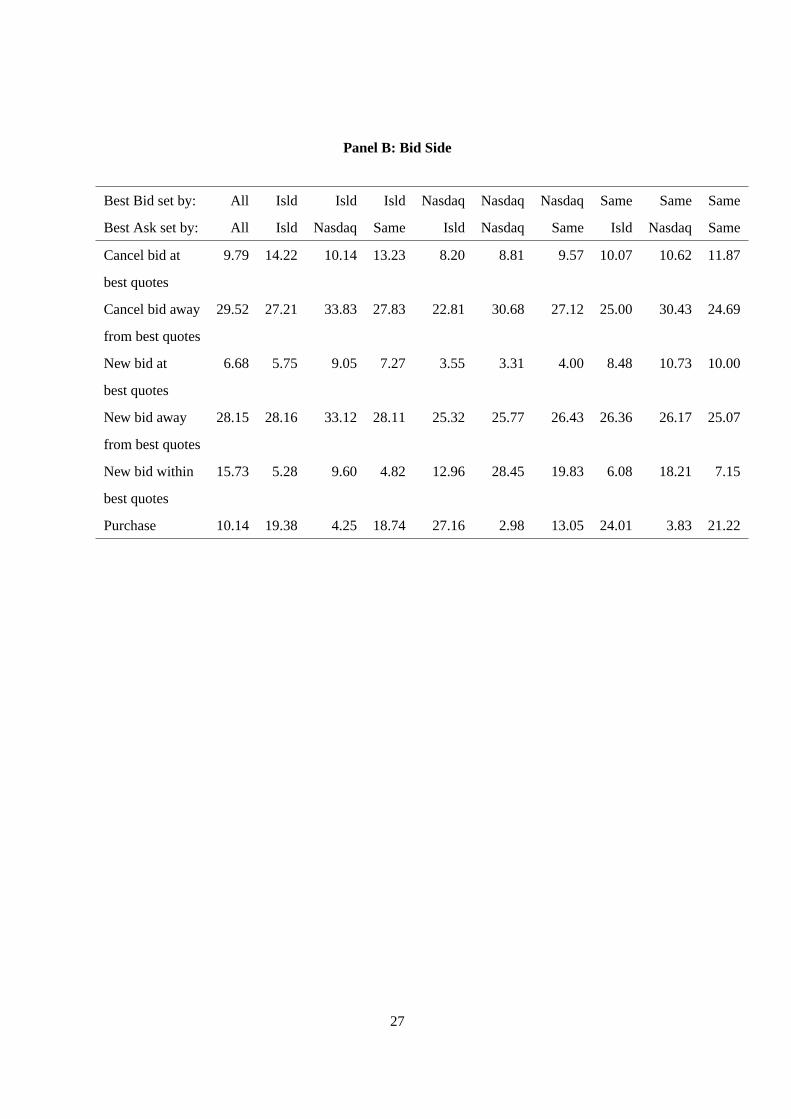
Panel B: Bid Side
Best Bid set by: All Isld Isld Isld Nasdaq Nasdaq Nasdaq Same Same Same
Best Ask set by: All Isld Nasdaq Same Isld Nasdaq Same Isld Nasdaq Same
Cancel bid at 9.79 14.22 10.14 13.23 8.20 8.81 9.57 10.07 10.62 11.87
best quotes
Cancel bid away 29.52 27.21 33.83 27.83 22.81 30.68 27.12 25.00 30.43 24.69
from best quotes
New bid at 6.68 5.75 9.05 7.27 3.55 3.31 4.00 8.48 10.73 10.00
best quotes
New bid away 28.15 28.16 33.12 28.11 25.32 25.77 26.43 26.36 26.17 25.07
from best quotes
New bid within 15.73 5.28 9.60 4.82 12.96 28.45 19.83 6.08 18.21 7.15
best quotes
Purchase 10.14 19.38 4.25 18.74 27.16 2.98 13.05 24.01 3.83 21.22
27
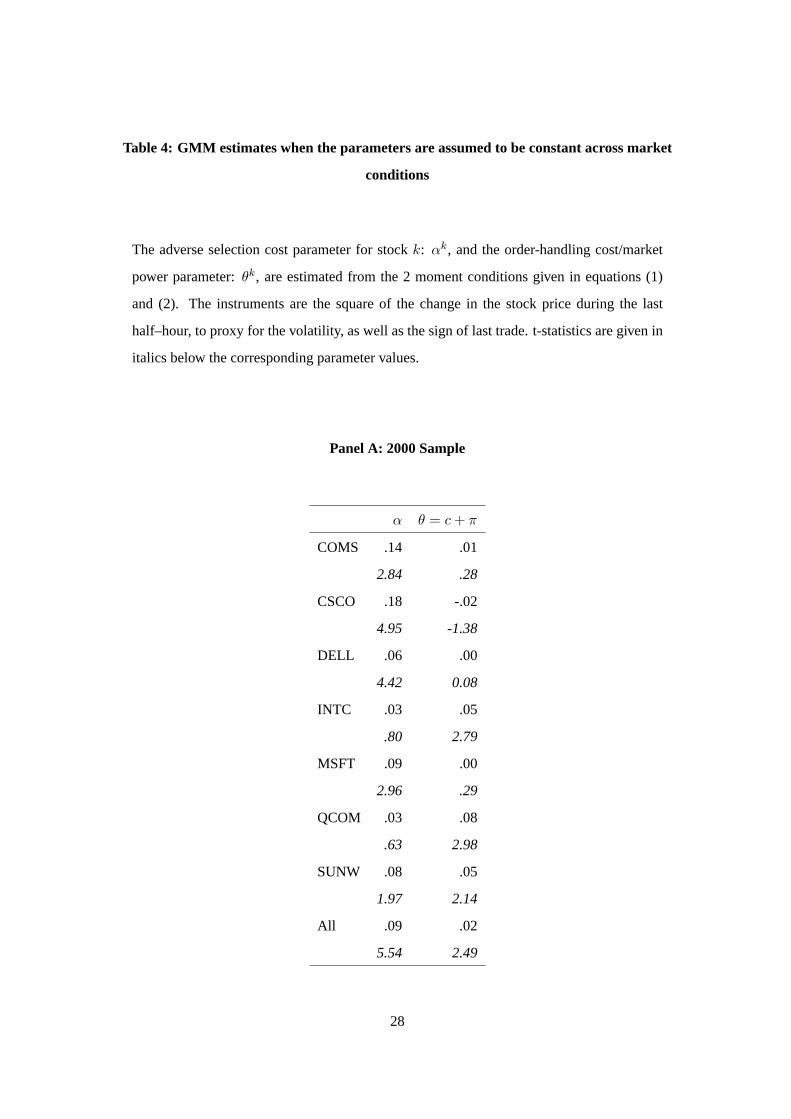
Table 4: GMM estimates when the parameters are assumed to be constant across market
conditions
The adverse selection cost parameter for stockk: αk, and the order-handling cost/market
power parameter:θk, are estimated from the 2 moment conditions given in equations (1)
and (2). The instruments are the square of the change in the stock price during the last
half–hour, to proxy for the volatility, as well as the sign of last trade. t-statistics are given in
italics below the corresponding parameter values.
Panel A: 2000 Sample
α θ = c + π
COMS .14 .01
2.84 .28
CSCO .18 -.02
4.95 -1.38
DELL .06 .00
4.42 0.08
INTC .03 .05
.80 2.79
MSFT .09 .00
2.96 .29
QCOM .03 .08
.63 2.98
SUNW .08 .05
1.97 2.14
All .09 .02
5.54 2.49
28
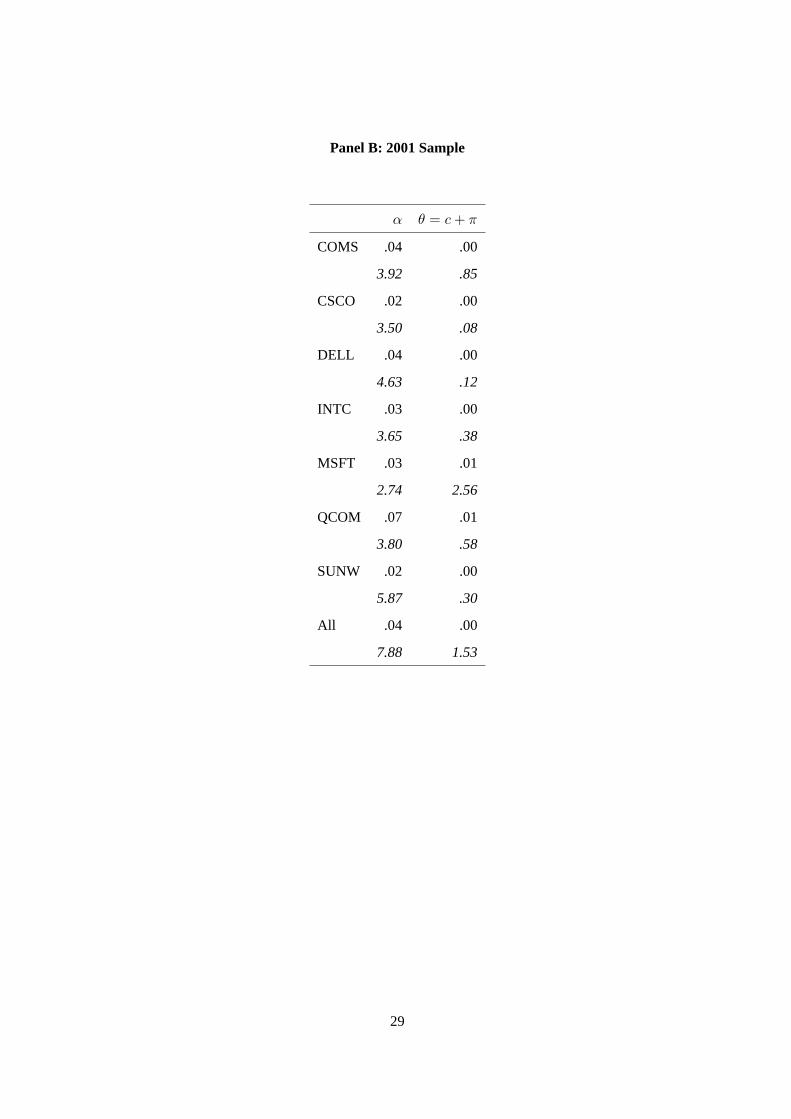
Panel B: 2001 Sample
α θ = c + π
COMS .04 .00
3.92 .85
CSCO .02 .00
3.50 .08
DELL .04 .00
4.63 .12
INTC .03 .00
3.65 .38
MSFT .03 .01
2.74 2.56
QCOM .07 .01
3.80 .58
SUNW .02 .00
5.87 .30
All .04 .00
7.88 1.53
29

Table 5: GMM estimates of the flexible model
The adverse selection cost parameter for stockk at time t (αk1,t) is specified as:αk
1,t =
βαkXk
t ,whereβαkis a vector of parameters andXk
t is a vector of variables equal to: the
constant, the depth at the best ask quote for observations corresponding to purchases, and
the depth at the best bid for observations corresponding to sales, as well as the square of
the change in the stock price during the last half–hour, to proxy for the volatility. Similarly,
the order–handling–cost/market power parameter is specified as:θk1,t = βθk
Xkt . The set of
instruments includes the variables as well as the sign of last trade. t-statistics are given in
italics below the corresponding parameter values.
Panel A: 2000 Sample
COMS CSCO DELL INTC MSFT QCOM SUNW All
Obs 3709 7293 5557 5634 6971 5343 3847 38354
alpha
constant 0.22 0.13 0.08 0.10 0.10 0.05 0.19 0.12
2.91 2.23 3.15 1.87 2.19 0.53 2.46 5.65
depth 0.00 0.00 0.00 0.00 0.00 0.00 0.00 0.00
-0.37 0.38 1.15 -1.56 0.23 -3.31 -1.01 -1.24
volat -0.05 0.04 -0.04 -0.01 -0.03 0.04 -0.09 -0.01
-2.17 1.29 -1.81 -1.20 -1.51 1.88 -1.40 -1.87
theta
constant -0.03 -0.01 -0.01 0.01 0.00 0.07 -0.02 0.00
-0.92 -0.42 -0.85 0.50 -0.10 1.58 -0.42 0.27
depth 0.00 0.00 0.00 0.00 0.00 0.00 0.00 0.00
0.39 -0.11 -0.99 1.82 0.08 3.53 1.50 1.46
volat 0.03 -0.01 0.02 0.00 0.02 -0.02 0.05 0.01
2.31 -0.61 1.94 1.57 1.96 -1.69 1.41 3.02
p-value 0.00 0.16 0.00 0.00 0.63 0.05 0.56 0.00
30
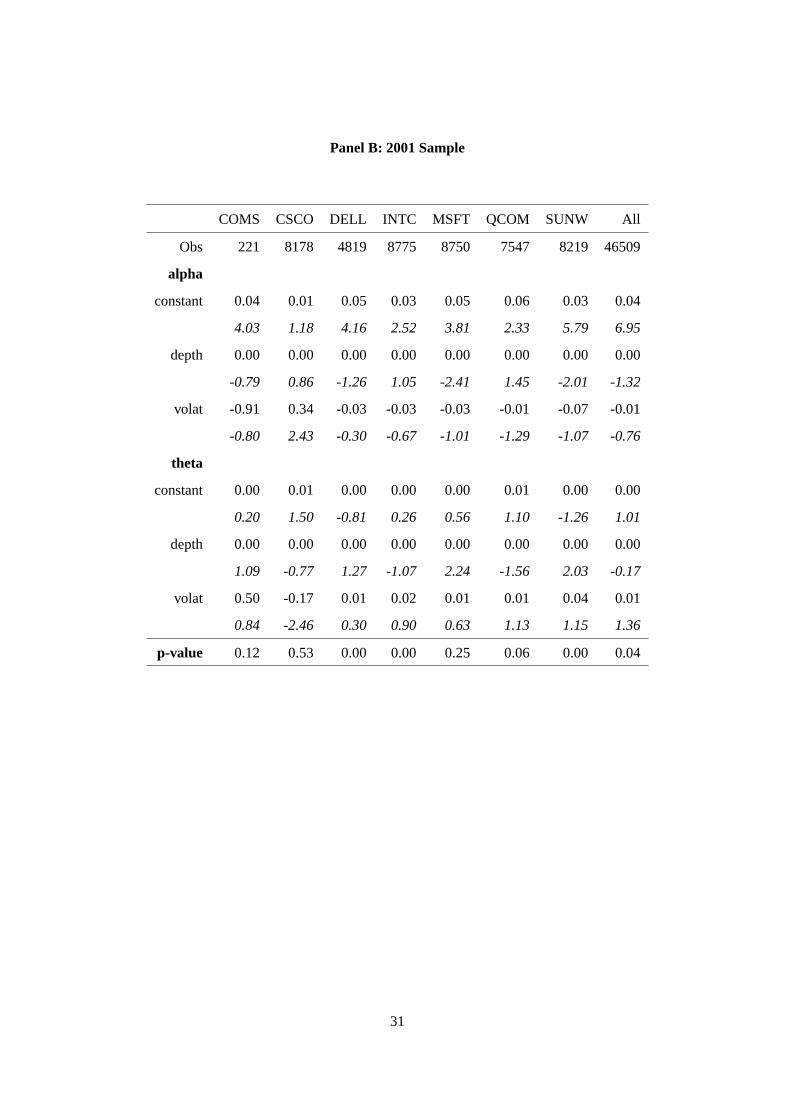
Panel B: 2001 Sample
COMS CSCO DELL INTC MSFT QCOM SUNW All
Obs 221 8178 4819 8775 8750 7547 8219 46509
alpha
constant 0.04 0.01 0.05 0.03 0.05 0.06 0.03 0.04
4.03 1.18 4.16 2.52 3.81 2.33 5.79 6.95
depth 0.00 0.00 0.00 0.00 0.00 0.00 0.00 0.00
-0.79 0.86 -1.26 1.05 -2.41 1.45 -2.01 -1.32
volat -0.91 0.34 -0.03 -0.03 -0.03 -0.01 -0.07 -0.01
-0.80 2.43 -0.30 -0.67 -1.01 -1.29 -1.07 -0.76
theta
constant 0.00 0.01 0.00 0.00 0.00 0.01 0.00 0.00
0.20 1.50 -0.81 0.26 0.56 1.10 -1.26 1.01
depth 0.00 0.00 0.00 0.00 0.00 0.00 0.00 0.00
1.09 -0.77 1.27 -1.07 2.24 -1.56 2.03 -0.17
volat 0.50 -0.17 0.01 0.02 0.01 0.01 0.04 0.01
0.84 -2.46 0.30 0.90 0.63 1.13 1.15 1.36
p-value 0.12 0.53 0.00 0.00 0.25 0.06 0.00 0.04
31

Table 6: Flexible model when undercutting is included in the instruments but not in the variables
The adverse selection cost parameter at timet (α1,t) is specified as:α1,t = βαXt, where
βα is a vector of parameters andXt is a vector of variables equal to: the constant, the depth
at the best ask quote for purchases and at the best bid for sales, as well as the square of
the change in the stock price during the last half–hour to proxy for volatility. The order–
handling–cost/market power parameter is specified as:θ1,t = βθXt. Instruments include
the variables, the sign of last trade, and the indicator variable equal to one if the Island limit
order which has been hit bettered the Nasdaq grid by just one Island tick. t-statistics are
given in italics below the corresponding parameter values.
Panel A: 2000 Sample
COMS CSCO DELL INTC MSFT QCOM SUNW All
Obs 3709 7293 5557 5634 6971 5343 3847 38354
alpha
constant 0.22 0.12 0.08 0.10 0.09 0.04 0.19 0.11
2.96 2.03 3.26 1.98 2.17 0.46 2.49 5.44
depth 0.00 0.00 0.00 0.00 0.00 0.00 0.00 0.00
-0.39 0.39 1.13 -1.69 0.23 -3.31 -1.11 -1.09
volat -0.05 0.04 -0.03 -0.01 -0.03 0.05 -0.09 -0.01
-2.16 1.33 -1.74 -1.20 -1.53 2.06 -1.47 -1.87
theta
constant -0.04 -0.01 -0.01 0.01 0.00 0.07 -0.02 0.01
-0.97 -0.22 -0.97 0.44 -0.06 1.63 -0.51 0.48
depth 0.00 0.00 0.00 0.00 0.00 0.00 0.00 0.00
0.40 -0.12 -0.97 1.93 0.08 3.50 1.67 1.50
volat 0.03 -0.01 0.02 0.00 0.02 -0.02 0.05 0.01
2.32 -0.66 1.86 1.57 1.98 -1.76 1.47 3.02
p-value 0.00 0.02 0.00 0.00 0.90 0.00 0.09 0.00
32
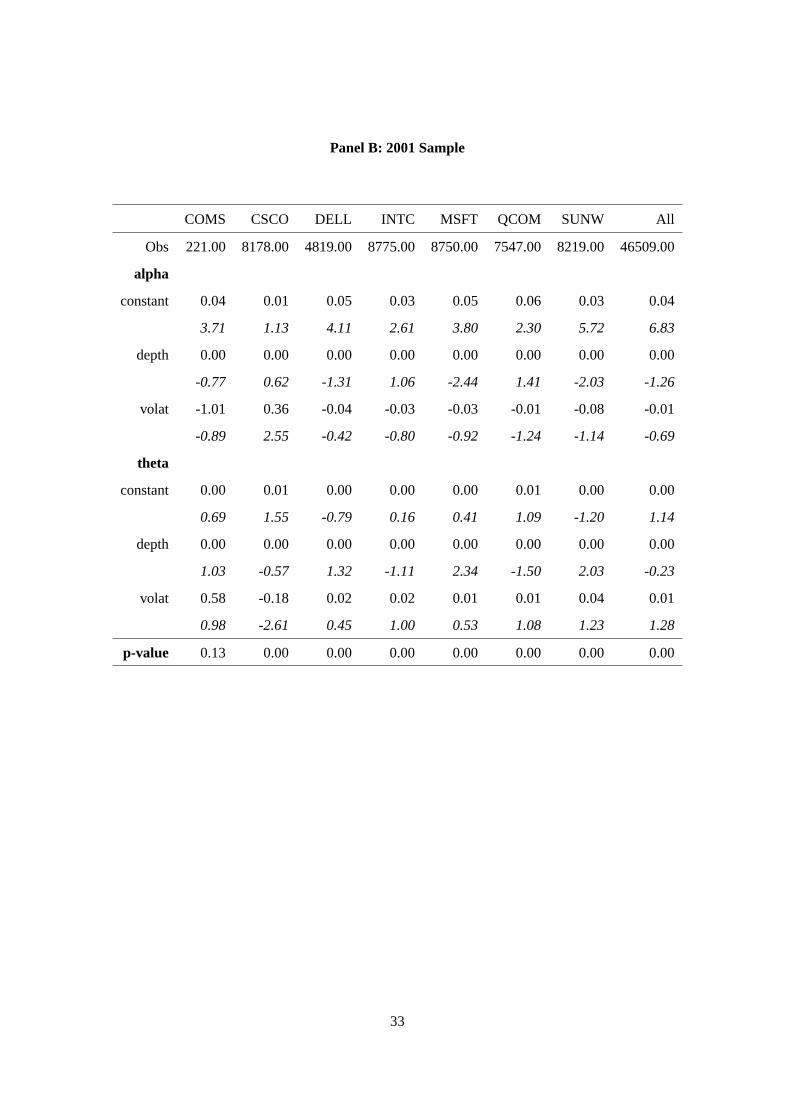
Panel B: 2001 Sample
COMS CSCO DELL INTC MSFT QCOM SUNW All
Obs 221.00 8178.00 4819.00 8775.00 8750.00 7547.00 8219.00 46509.00
alpha
constant 0.04 0.01 0.05 0.03 0.05 0.06 0.03 0.04
3.71 1.13 4.11 2.61 3.80 2.30 5.72 6.83
depth 0.00 0.00 0.00 0.00 0.00 0.00 0.00 0.00
-0.77 0.62 -1.31 1.06 -2.44 1.41 -2.03 -1.26
volat -1.01 0.36 -0.04 -0.03 -0.03 -0.01 -0.08 -0.01
-0.89 2.55 -0.42 -0.80 -0.92 -1.24 -1.14 -0.69
theta
constant 0.00 0.01 0.00 0.00 0.00 0.01 0.00 0.00
0.69 1.55 -0.79 0.16 0.41 1.09 -1.20 1.14
depth 0.00 0.00 0.00 0.00 0.00 0.00 0.00 0.00
1.03 -0.57 1.32 -1.11 2.34 -1.50 2.03 -0.23
volat 0.58 -0.18 0.02 0.02 0.01 0.01 0.04 0.01
0.98 -2.61 0.45 1.00 0.53 1.08 1.23 1.28
p-value 0.13 0.00 0.00 0.00 0.00 0.00 0.00 0.00
33
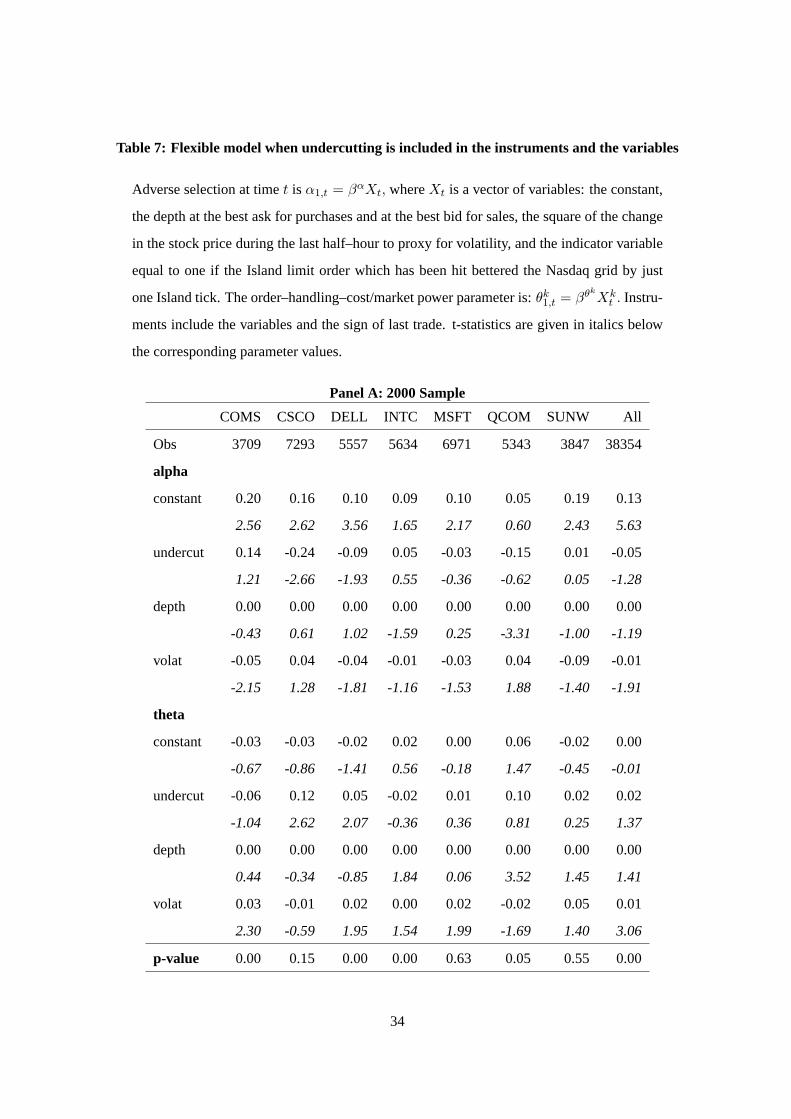
Table 7: Flexible model when undercutting is included in the instruments and the variables
Adverse selection at timet is α1,t = βαXt, whereXt is a vector of variables: the constant,
the depth at the best ask for purchases and at the best bid for sales, the square of the change
in the stock price during the last half–hour to proxy for volatility, and the indicator variable
equal to one if the Island limit order which has been hit bettered the Nasdaq grid by just
one Island tick. The order–handling–cost/market power parameter is:θk1,t = βθk
Xkt . Instru-
ments include the variables and the sign of last trade. t-statistics are given in italics below
the corresponding parameter values.
Panel A: 2000 Sample
COMS CSCO DELL INTC MSFT QCOM SUNW All
Obs 3709 7293 5557 5634 6971 5343 3847 38354
alpha
constant 0.20 0.16 0.10 0.09 0.10 0.05 0.19 0.13
2.56 2.62 3.56 1.65 2.17 0.60 2.43 5.63
undercut 0.14 -0.24 -0.09 0.05 -0.03 -0.15 0.01 -0.05
1.21 -2.66 -1.93 0.55 -0.36 -0.62 0.05 -1.28
depth 0.00 0.00 0.00 0.00 0.00 0.00 0.00 0.00
-0.43 0.61 1.02 -1.59 0.25 -3.31 -1.00 -1.19
volat -0.05 0.04 -0.04 -0.01 -0.03 0.04 -0.09 -0.01
-2.15 1.28 -1.81 -1.16 -1.53 1.88 -1.40 -1.91
theta
constant -0.03 -0.03 -0.02 0.02 0.00 0.06 -0.02 0.00
-0.67 -0.86 -1.41 0.56 -0.18 1.47 -0.45 -0.01
undercut -0.06 0.12 0.05 -0.02 0.01 0.10 0.02 0.02
-1.04 2.62 2.07 -0.36 0.36 0.81 0.25 1.37
depth 0.00 0.00 0.00 0.00 0.00 0.00 0.00 0.00
0.44 -0.34 -0.85 1.84 0.06 3.52 1.45 1.41
volat 0.03 -0.01 0.02 0.00 0.02 -0.02 0.05 0.01
2.30 -0.59 1.95 1.54 1.99 -1.69 1.40 3.06
p-value 0.00 0.15 0.00 0.00 0.63 0.05 0.55 0.00
34
Panel B: 2001 Sample
COMS CSCO DELL INTC MSFT QCOM SUNW All
Obs 221 8178 4819 8775 8750 7547 8219 46509
alpha
constant 0.05 0.02 0.04 0.03 0.05 0.06 0.03 0.04
4.08 2.75 3.04 2.92 3.62 2.19 5.67 6.80
undercut -0.04 -0.07 0.05 -0.03 0.00 0.02 -0.01 -0.01
-1.65 -4.44 2.71 -1.46 0.02 0.33 -0.77 -1.11
depth 0.00 0.00 0.00 0.00 0.00 0.00 0.00 0.00
-1.00 0.60 -1.25 0.99 -2.41 1.43 -2.05 -1.35
volat -0.75 0.35 -0.03 -0.03 -0.03 -0.01 -0.07 -0.01
-0.67 2.48 -0.39 -0.65 -1.01 -1.29 -1.09 -0.77
theta
constant 0.00 0.00 0.00 0.00 0.00 0.01 0.00 0.00
-0.40 -0.31 0.04 -0.39 0.37 1.09 -1.62 0.50
undercut 0.02 0.04 -0.02 0.02 0.01 0.00 0.01 0.01
1.77 4.68 -2.42 1.73 0.54 -0.10 1.16 1.39
depth 0.00 0.00 0.00 0.00 0.00 0.00 0.00 0.00
1.34 -0.50 1.26 -1.00 2.26 -1.55 2.08 -0.13
volat 0.41 -0.18 0.02 0.02 0.01 0.01 0.04 0.01
0.70 -2.52 0.39 0.87 0.63 1.14 1.18 1.37
p-value 0.13 0.60 0.00 0.00 0.25 0.06 0.00 0.04
35
Appendix: Additional statistical information
Comparing the Island and Nasdaq spreads Using the merged Island and Nasdaq dataset, we com-
pared the best Island bid quote and the best bid posted on Nasdaq by its competitors. 35.89% of the
time the Island bid was strictly higher than its Nasdaq counterpart, 43.16% of the time it was lower, and
20.94% of the time the two bid quotes were equal. On the ask side, the best Island quote was better than
that of its competitors 26.71% of the time, it was higher 43.43% of the time, and the two quotes were
equal 29.87% of the time.
These results are consistent with the findings by Simaan, Weaver and Whitcomb (2003), that ECNs
often establish the inside market. Our results differ from, and complement theirs because we analyze data
on unrounded Island quotes, downloaded from their site, rather than rounded quotes from the Nasdaq DQ
file. Hence, we find more frequent occurrences of the situation where Island beats the Nasdaq market
makers quotes, and we document undercutting by Island orders on a finer grid than the sixteenth grid.
The consequences of rounding To better document the impact of the rounding procedure on the quotes
observed on the Nasdaq system, we conducted the following experiment. Using the Island data for March
2000 (from the NASTRAQ DQ file), we computed the mean spread on Island. It was equal to $59.26/256,
which is greater than its Island data counterpart, $50.70/256. This shows that the rounding procedure
made the Island quotes much less attractive than they were actually. This confirms our remark above that
Island traders relied on other ticks than sixteenths to quote to a large extent.
Synchronicity problems Since the Island quotes are incorporated in the Nastraq IQ quotes, the former
can be better than the latter only when they are on a finer price grid than the Nasdaq grid. This offers an
opportunity to assess the magnitude of the problems induced by synchronicity. When the best Island bid
(resp. ask) is better than the best Nasdaq bid (resp. ask), it should be on a finer tick than the Nasdaq grid.
In our data this is the case for DELL 84.60% (resp. 84.63%) of the time. This suggests that in 15% of
the cases synchronicity problems induce mistakes in our best quotes comparisons.
36

Fig
ure
1, P
anel
A:
Fre
qu
ency
of
dif
fere
nt
valu
es o
f th
e sp
read
on
Isla
nd
an
d N
asd
aq (
excl
ud
ing
Is
lan
d)
in M
arch
200
0 fo
r th
e 7
sto
cks
in o
ur
sam
ple
Not
e: g
raph
zoo
ms
on 0
to 2
Nas
daq
ticks
. 46%
of t
he ti
me
Isla
nd s
prea
d w
as g
reat
er th
an 3
2/25
6.
0102030405060708090100
04
812
1620
2428
32
Isla
nd
Tic
k ($
1/25
6)
Percentage of time
Isla
nd
Nas
daq
(exc
ludi
ngIs
land
)
Fig
ure
1, P
anel
B:
Fre
qu
ency
of
dif
fere
nt
valu
es o
f th
e sp
read
on
Isla
nd
an
d N
asd
aq (
excl
ud
ing
Is
lan
d)
in J
un
e 20
01 f
or
the
7 st
ock
s in
ou
r sa
mp
leN
ote:
gra
ph z
oom
s on
0 to
5 N
asda
q tic
ks. 3
9% o
f the
tim
e Is
land
spr
ead
was
gre
ater
than
50/
1000
.
0102030405060708090100
05
1015
2025
3035
4045
50
Isla
nd
Tic
k ($
1/10
00)
Percentage of time
Isla
nd
Nas
daq
(exc
ludi
ngIs
land
)
Recommended