Impacts of Commercial and Residential Development on
the Gulf Intracoastal Waterway: A Case Study in
Alabama
Dean Goodin, Ph.D. Eric Dohner
Linda Brown, USACE

Introduction
Coastal Alabama was heavily impacted by Hurricane Ivan (2004) • Landfall at Gulf Shores and Orange Beach • Category 3 with 130 mph winds
Before After

Before After

Highway 182 (Perdido Beach Blvd)

Introduction
Coastal Alabama was also impacted by Hurricane Katrina (2005) • 67 mph sustained winds • Storm surge of 10 feet
Introduction
New development trend in northern Gulf Coast is construction along the Gulf Intracoastal Waterway (GIWW) • Threat of tropical storms • Escalating prices of beachfront property
GIWW extends from Brownsville, TX to Apalachee Bay, FL • 520 miles – open bays or coastal sounds • 780 miles – man-made canals

Gulf Intracoastal Waterway

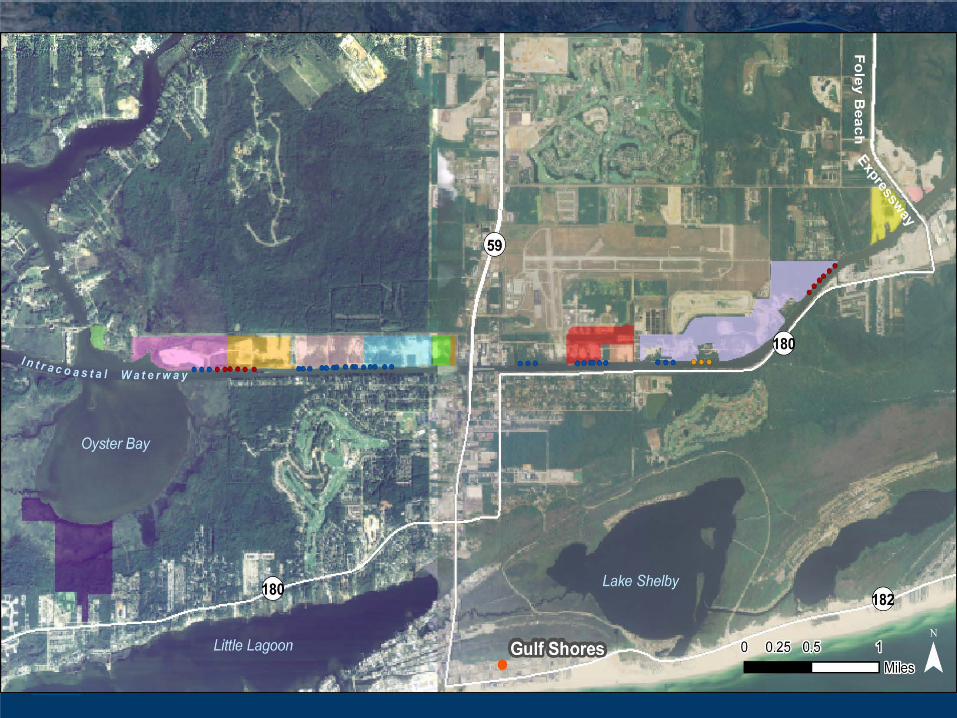
Foley Land Cut
In coastal Alabama, the Foley Land Cut is poised for development • 10-mile stretch of GIWW in Gulf Shores
and Orange Beach • Located approximately 2 miles inland • Authorized channel dimensions
• 125 feet wide • 12 feet deep • Maintained by Corps of Engineers for
commercial barge traffic operations


Foley Land Cut
North Shore East
Oyster Bay
North Shore West

Foley Land Cut
Gulf Shores/Orange Beach region developed and marketed as a tourist destination From 1990 to 2000 permanent
population increased • 50% Gulf Shores • 68% Orange Beach
2007 Population ~12,000 Seasonal population expected to
increase 30%

Foley Land Cut Why FLC?
• Sheltered from tropical storms • Available waterfront property • Provides waterway access to Gulf of
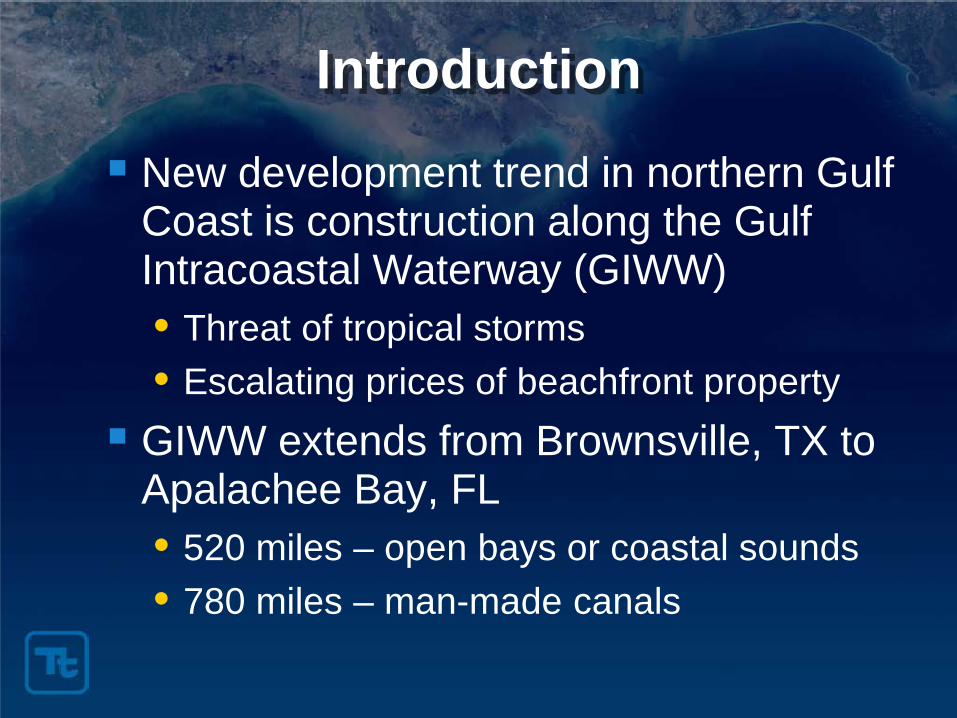
Mexico via Bon Secour Bay and Wolf Bay Existing development
• Condominiums/single-family homes • Marinas • Restaurant • Commercial

Lulu’s Homeport Marina
Sailboat Bay Marina
Reynold’s Ready Mix
The Wharf

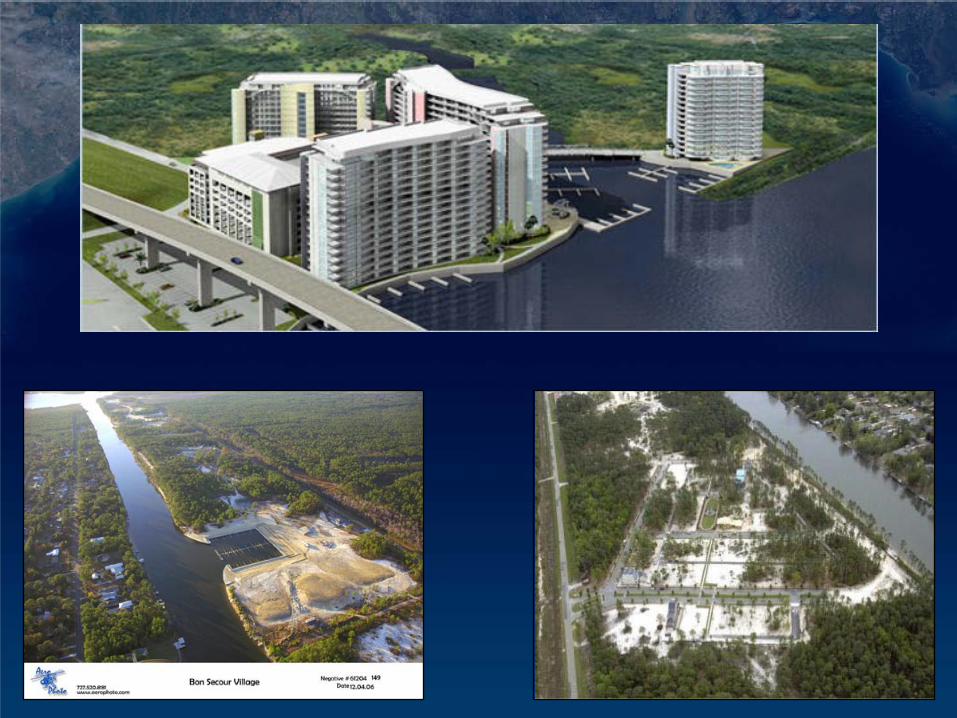
Proposed Development 15 proposed developments on FLC
• 14 located on north shore of FLC • 1 located on south shore of Oyster Bay • 16,700 condo units • 3464 boat slips
• 1722 wet slips • 1742 dry slips
• Marinas • Retail shopping • Office space • Amenities (pools, greenspace, boardwalks)

Development Size Boat Slips Condominiums Units Retail/Commercial Greenspace
(acres) Wet Dry Permanent Seasonal (square feet) (acres)
47 Canal Place 31 270 308 370 905 - -
501 Point West 37 63 80 340 797 - 18.5
Bayside Harbour 8 116 - 35 81 - 4.7
Bon Secour Village Eastern Marina 5 10 528 - - - -
Bon Secour Village West 1000 107 - 3,000 3,000 750,000 500
Delfino Resort 1 26 53 - 145 579 25,000 10.4
Delfino Resort 2 12 50 - 80 320 30,000 4.8
Harbour Lights Marina 16 76 - 170 170 25,000 -
KFPH Properties 5 50 - 100 100 20,000 -
Lawrenz Eastern Marina 37 77 - 750 500 700,000 1.85
Lawrenz Western Marina 8 43 - 173 115 - 0.84
Oyster Bay Marina 205 396 - 500 500 7,000 155
Summerdance 240 318 826 1048 2127 27,000 100
Walker Creek 10 42 - 155 316 - -
Waterways East 12 51 - 92 200 - 10
TOTAL 1652 1722 1742 6958 9710 1,584,000 806.09
Proposed Development


EIS
Environmental Impact Statement (EIS) • Evaluate environmental and
socioeconomic consequences of development
• Address potential impacts to FLC and surrounding communities
• Waterway Capacity Study • Hurricane Evacuation Study

EIS
Direct and indirect impacts Short-term and long-term impacts Cumulative impacts Mitigation of impacts Irreversible and irretrievable
commitment of resources Alternatives to proposed actions

EIS Cultural Resources Threatened &
Endangered Species Wetlands Fish & Wildlife Resources Vegetative Communities Water Quality Soils & Geology Land Use
Recreation Resources Utilities Air Quality Noise Light Socioeconomic
Resources Traffic & Transportation Hazardous & Toxic
Materials

Waterway Capacity Study
Federally authorized use for commercial traffic Recreational use must not impact
present and future commercial operations Safety and navigation concerns
• Speeding • Uneducated boaters • Congestion in high use areas (Hwy 59
boat ramp, Lulu’s, bridges, etc.)

Lulu’s Homeport Marina Highway 59 Bridge Public Boat Ramp
Bon Secour Village Marina The Wharf Marina

Hurricane Evacuation Study
Impacts of proposed developments • Increased population of permanent and
seasonal residents • Increased number of vehicles
Infrastructure • Evacuation routes • Vessel evacuation and security plan • Shelters

Alternatives
No Action Alternative Maximum Boat Slip Alternative
• Approve permits for up to 3093 boat slips through 2025
Minimum Boat Slip Alternative • Initially approve 1943 boat slips • Option of phasing-in 1150 additional boat
slips until reach maximum (3093)

Alternatives
Alternatives Proposed changes from original proposals
Maximum number of additional boat slips Phase-in for additional boat slips
a. No Action N/A 0 N/A b. Maximum Boat Slip Alternative
Conservative RD approach (bottom number of the 15% confidence range) in the number of boat slips additional slips for implementing accepted mitigation options approved site plans
3,093 boat slips permitted
N/A
c. Minimum Boat Slip Alternative
Conservative RD approach (bottom number of the 15% confidence range) in the number of boat slips potential future phase in approach no additional boat slips, mitigation options not implemented approved site plans
1,943 boat slips initially permitted 1,150 additional boat slips phased in at 25% per evaluation period beginning after Evaluation Period 1.
Evaluation Period 1 = 1,943 Evaluation Period 2 = 2,230 Evaluation Period 3 = 2,517 Evaluation Period 4 = 2,804 Evaluation Period 5 = 3,093

Impacts
Land Use/Land Cover Socioeconomics Recreational Resources Ecological Resources Noise Light Pollution
Mitigation
Mooring Facilities • 4 Primary • 10 Secondary • 1 Tertiary
Safety signage Marine police Boater education Maps for commercial operators


In Closing
EIS provides an objective evaluation of impacts associated with the proposed actions Example for future development along
GIWW and Gulf Coast • Florida
• St. Joe Land Company (Apalachicola Bay) • Texas
• Port O’Connor (Dolphin Point Community)

Questions?
Recommended