Distr. LIMITED
E/ESCWA/EDID/2017/Technical Paper.2 3 April 2017 ORIGINAL: ENGLISH
Economic and Social Commission for Western Asia (ESCWA)
Impact of the Libyan crisis on the Tunisian economy
An estimation of the macroeconomic and fiscal impacts of the Libyan
crisis on the Tunisian economy
United Nations Beirut, 2017
17-00215
iii
Preface
The present paper is a joint effort between the United Nations Economic and Social Commission for
Western Asia (ESCWA), the World Bank and the Tunisian Institute of Competitiveness and Quantitative Studies. It presents the results of a computable general equilibrium (CGE) model developed to estimate the macroeconomic and fiscal impacts of the Libyan crisis on the Tunisian economy. The model captures the
following five effects of the Libyan crisis on the Tunisian economy: the impact of the presence of Libyans in Tunisia on aggregate demand; the effect of the crisis on the remittances of Tunisian workers in Libya; the impact of the deteriorating business environment on private investments; the consequences of domestic and regional security challenges on the tourism sector; and the impact of the crisis on government security spending.
Results suggest that the Libyan crisis is responsible for 24 per cent of the deceleration of economic growth in Tunisia over the period 2011-2015, equivalent to a welfare loss of 8.8 billion Tunisian dinars ($880
million per year, equivalent to 2 per cent of 2015 GDP per year). These impacts are mainly driven by the effects of the crisis on private investment and tourism through their impact on investor confidence and international tourists demand for Tunisian tourism services. The decrease in investment and tourism explains
60 per cent and 36 per cent of the overall impact of the crisis, respectively. Fewer remittances from Libya, increased government spending on security and the weaker purchasing power of Libyan residents and visitors
account for 1.4 per cent, 1.2 per cent and 0.8 per cent of the estimated impact, respectively.
The fiscal cost of the Libyan crisis for Tunisia (increased government security spending and reduced tax revenues) is estimated at 5.8 billion Tunisian dinars (TND) for the period 2011-2015 ($580 million per year,
which is equivalent to 1.36 per cent of 2015 GDP per year). Simulations show that financing these costs through taxes would considerably increase tax rates in Tunisia: income taxes would have to increase by 41 per cent cumulatively for the period 2011-2015, and tax administrations would need to be strengthened to tackle tax evasion incentives. Financing this cost with debt would increase government-financing needs by TND 7
billion over the five years (equivalent to 15 per cent of the 2015 public debt-to-GDP ratio).

iv

v
CONTENTS
Page
Chapter
A. Deteriorating business environment and a fall in private sector investments ........................ 2
B. Presence of Libyans in Tunisia .............................................................................................. 3
C. Worsening security situation and increased government security spending ......................... 4
D. Return of Tunisian workers from Libya ................................................................................ 4
E. Impact on the tourism sector ................................................................................................. 4
A. Methodology .......................................................................................................................... 5
B. Hypotheses ............................................................................................................................ 6
C. Central scenario ..................................................................................................................... 6
D. Alternative scenarios ............................................................................................................. 7
LIST OF TABLES
Table 1. Estimation of private investment contractions ......................................................................... 3
Table 2. Total revenue of Libyan households in Tunisia ....................................................................... 3
Table 3. Consumption profile of Libyans residing in Tunisia ............................................................... 6
Table 4. Hypotheses under the three scenarios ...................................................................................... 7
LIST OF FIGURES
Figure 1. Private investments, constant prices (index 100 in 2010) ..................................................... 2
Figure 2. Evolution of the global terrorism index in Tunisia ................................................................ 4
Figure 3. Evolution of the share of the government budget on security (interior and defence)
in Tunisia from 2010 onwards ............................................................................................... 4
Figure 4. Annual growth rate of the hotel and restaurant service sector ............................................... 5
Figure 5. Tourist night stays in hotels and similar establishments (foreigners only)............................ 5
Figure 6. Growth rates (predicted and observed) .................................................................................. 8
Figure 7. Unemployment rates (predicted and observed) ..................................................................... 8
Figure 8. Estimated losses in growth (percentage points)..................................................................... 8
Figure 9. Estimated welfare losses (GDP in million TND) .................................................................. 8
vi
CONTENTS (continued)
Page
Figure 10. Breakdown of factors behind the decline in the growth rate ................................................. 9
Figure 11. Breakdown of losses per channel of transmission ................................................................. 9
Figure 12. Aggregate consumption, variation in % ............................................................................... 9
Figure 13. Investment, variation in % ..................................................................................................... 9
Figure 14. Exchange rate ........................................................................................................................ 10
Figure 15. Exports and imports, variation in % ..................................................................................... 10
Figure 16. Model estimate of fiscal revenues, variation in % ................................................................. 10
Figure 17. Observed tax revenues, variation in % ................................................................................. 10
Figure 18. External debt-to-GDP ratio, variation in % ........................................................................... 11
Figure 19. Sectoral impacts, growth variation in % ................................................................................ 11
Figure 20. Evolution of the public debt structure in Tunisia, 2010-2015 (million TND) ....................... 12
LIST OF ANNEXES
Annex I. Budgets of the ministries of interior and defence .................................................................. 14
Annex II. Revenues of Libyan households in Tunisia transiting through the banking sector ............... 14
Annex III. Revenues of Libyan households transiting through the border ............................................. 14
Annex IV. Expenditures and savings of Libyan households in Tunisia in 2010 ..................................... 15
Annex V. Comparison of GDP projections and actual GDP values in Tunisia between 2010 and 2015 ....................................................................................................................... 16
Annex VI. Accumulated differences between IMF GDP estimates and realized GDP in the MENA region between 2010 and 2015 .............................................................................................. 16

vii
Abbreviations
CGE Computable general equilibrium
ESCWA Economic and Social Commission for Western Asia
GDP Gross domestic product
IMF International Monetary Fund
INS Institut National de Tunisie
ITCEQ Institut Tunisien de la Compétitivité et des Etudes Quantitatives
MENA Middle East and North Africa
SAM Social Accounting Matrix
TND Tunisian dinar
VAT Value-added tax
WTO World Tourism Organization
References to dollars ($) are to United States dollars, unless otherwise stated.
Introduction
Between 2011 and 2015, Tunisia lost on average 3.86 growth points per year relative to the 2010
projections of the International Monetary Fund (IMF). This poor performance is in line with predictions from the literature on the state of economies undergoing democratic transitions, which are characterized by increased social demands and tensions, a lack of visibility for investors and a weakening of the State. In addition to these
internal challenges, Tunisia has also been affected by the security and economic crisis in Libya (a neighbouring country and its sixth major economic partner). The main objective of the present paper is to quantify the macroeconomic and fiscal impacts of the Libyan crisis on the Tunisian economy over the period 2011-2015, while controlling for a number of endogenous and exogenous factors including the cost to the economy of the political transition that Tunisia has been undergoing since 2011.
The economic literature clearly illustrates that civil war in a country has negative consequences on neighbouring countries. Conflicts in general, both minor and extended, have a significant effect on
development factors in neighbouring countries. Murdoch and Sandler1 illustrate that armed conflict in a country reduces economic growth in bordering countries by 85 per cent in the short run, and 31 per cent in the long run. Unsurprisingly, these effects are greater when neighbouring countries themselves are facing political,
security and economic instability. Negative impacts are amplified when economic, trade and financial linkages between the countries are strong.
The situation in Libya has been marked by various events since 2011. Although the political uprisings that started in 2011 have not been very violent, the crisis has yet to be resolved. Despite the 2012 and 2014 elections, elected officials have not been able to neutralize armed groups, or stop the civil war. The Libyan
economy is heavily dependent on revenues from oil and gas. High oil prices before 2014 and foreign exchange reserves kept public finances in a relatively good position and prevented a humanitarian crisis, despite the conflict. However, an extended period of instability and plummeting oil prices have taken a heavy toll on Libya’s financial resources, and weakened the Libyan Government’s ability to maintain internal peace and
social stability.
Because of the strong ties between the two countries, poor economic performance in Libya reverberates in the Tunisian economy through various intricate channels. In addition, internal conflict in Libya could
negatively affect Tunisia, in general, and its business environment, in particular, owing to a heightened sense of insecurity and a negative perception of the region as a whole. The Libyan economy has been immobilized since 2012 by a slowdown in the oil and gas industry; political instability that led to an inflow of arms and militants; and a rise in armed groups and militant training camps.
The paper is organized as follows. Chapter I presents the main effects of the Libya crisis incorporated in the CGE model, used to estimate its macroeconomic and fiscal impact on the Tunisian economy. Chapter II presents the model, the main hypotheses and scenario. Chapters III and IV summarize the findings on the
macroeconomic and fiscal impact of the Libyan crisis on Tunisia. Chapter VI sets on the conclusion.
1 Ames C. Murdoch and Todd Sandler, Civil wars and economic growth: spatial dispersion, American Journal of Political
Science, vol. 48, No. 1, pp. 138-151, 2004.

2
FIVE MAJOR EFFECTS OF THE LIBYAN CRISES ON TUNISIA
The effects of the Libyan crisis on Tunisia are complex, with both positive and negative effects at the
macroeconomic and sectoral levels. The present chapter sets out the following five major effects, which are
incorporated into the CGE model.
A. DETERIORATING BUSINESS ENVIRONMENT AND A FALL IN PRIVATE SECTOR INVESTMENTS
The political transition in Tunisia has been accompanied by investment levels lower than the predicted
and pre-2011 investment rates. As illustrated in figure 1, holding prices constant, private sector investments
shrunk by 20 per cent in 2011 and have remained constant at these relatively low levels.
Figure 1. Private investments, constant prices (index 100 in 2010)
Source: Institut National de Tunisie (INS).
Even though the domestic situation and social tensions have greatly contributed to this situation, the
insecurity level is undoubtedly one of its main causes. As far as investors are concerned, insecurity is a source
of uncertainty and thus a significant risk factor. Moreover, investors are generally risk averse, and risk aversion
is heightened in the context of a security crisis. This negative effect is noticeable both for new investors
(Tunisian or foreign) and for those renewing fixed cost factors of production. The 2015 annual survey of the
Institut Tunisien de la Compétitivité et des Etudes Quantitatives (ITCEQ) reveals that 47 per cent of investors
questioned affirmed that the crisis in Libya was a major obstacle to their current business dealings and for
future business growth (see box).
Box. Tunisian business environment survey by ITCEQ
Since 2000, ITCEQ has conducted an annual survey on the business environment and competitiveness of private
enterprises in Tunisia. Its main objectives are to identify the main constraints that enterprises face in their business
operations; to evaluate business performance and strategies for the maintenance or improvement of competitiveness
in an increasingly tough business environment; and to collect information on businesses’ predictions with regard to
the state of the business environment, in general, and job creation and investments in the private sector, in particular.
The 2015 field survey took place between 1 October 2015 and 15 November 2015. A total of 833 enterprises
participated, equivalent to a 70 per cent response rate. Around 70 per cent of respondents were either the head of
their respective businesses or second or third in the leadership hierarchy. Data was collected by ITCEQ through
one-on-one interviews with business leaders.
The study is based on the perceptions of business leaders on the legal and institutional environments in which they
operate. The 2015 survey results reveal that the political situation, insecurity and corruption are the greatest obstacles
in business leaders’ opinion. Regarding the Libyan crisis, 47 per cent of respondents considered it a major challenge
for business operations and growth.
0
20
40
60
80
100
120
2010 2011 2012 2013 2014 2015
3
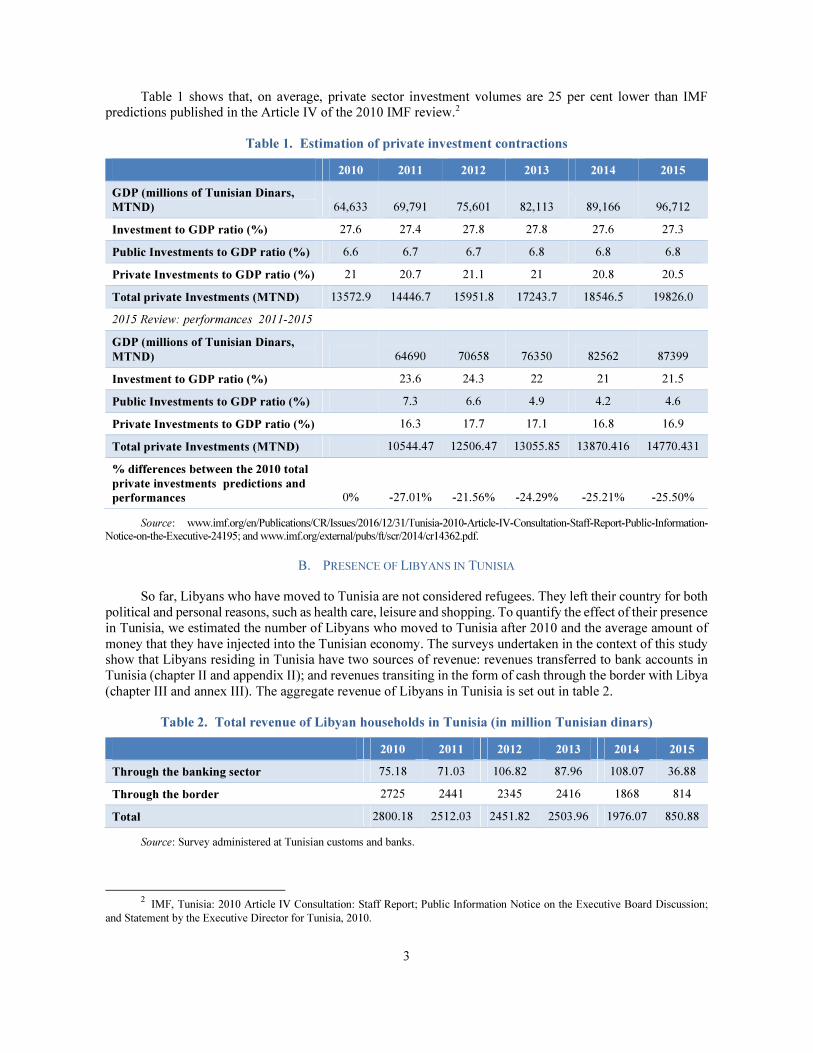
Table 1 shows that, on average, private sector investment volumes are 25 per cent lower than IMF predictions published in the Article IV of the 2010 IMF review.2
Table 1. Estimation of private investment contractions
2010 2011 2012 2013 2014 2015
GDP (millions of Tunisian Dinars,
MTND) 64,633 69,791 75,601 82,113 89,166 96,712
Investment to GDP ratio (%) 27.6 27.4 27.8 27.8 27.6 27.3
Public Investments to GDP ratio (%) 6.6 6.7 6.7 6.8 6.8 6.8
Private Investments to GDP ratio (%) 21 20.7 21.1 21 20.8 20.5
Total private Investments (MTND) 13572.9 14446.7 15951.8 17243.7 18546.5 19826.0
2015 Review: performances 2011-2015
GDP (millions of Tunisian Dinars,
MTND) 64690 70658 76350 82562 87399
Investment to GDP ratio (%) 23.6 24.3 22 21 21.5
Public Investments to GDP ratio (%) 7.3 6.6 4.9 4.2 4.6
Private Investments to GDP ratio (%) 16.3 17.7 17.1 16.8 16.9
Total private Investments (MTND) 10544.47 12506.47 13055.85 13870.416 14770.431
% differences between the 2010 total
private investments predictions and
performances 0% -27.01% -21.56% -24.29% -25.21% -25.50%
Source: www.imf.org/en/Publications/CR/Issues/2016/12/31/Tunisia-2010-Article-IV-Consultation-Staff-Report-Public-Information-
Notice-on-the-Executive-24195; and www.imf.org/external/pubs/ft/scr/2014/cr14362.pdf.
B. PRESENCE OF LIBYANS IN TUNISIA
So far, Libyans who have moved to Tunisia are not considered refugees. They left their country for both political and personal reasons, such as health care, leisure and shopping. To quantify the effect of their presence in Tunisia, we estimated the number of Libyans who moved to Tunisia after 2010 and the average amount of
money that they have injected into the Tunisian economy. The surveys undertaken in the context of this study show that Libyans residing in Tunisia have two sources of revenue: revenues transferred to bank accounts in Tunisia (chapter II and appendix II); and revenues transiting in the form of cash through the border with Libya
(chapter III and annex III). The aggregate revenue of Libyans in Tunisia is set out in table 2.
Table 2. Total revenue of Libyan households in Tunisia (in million Tunisian dinars)
2010 2011 2012 2013 2014 2015
Through the banking sector 75.18 71.03 106.82 87.96 108.07 36.88
Through the border 2725 2441 2345 2416 1868 814
Total 2800.18 2512.03 2451.82 2503.96 1976.07 850.88
Source: Survey administered at Tunisian customs and banks.
2 IMF, Tunisia: 2010 Article IV Consultation: Staff Report; Public Information Notice on the Executive Board Discussion;
and Statement by the Executive Director for Tunisia, 2010.
4
C. WORSENING SECURITY SITUATION AND INCREASED GOVERNMENT SECURITY SPENDING
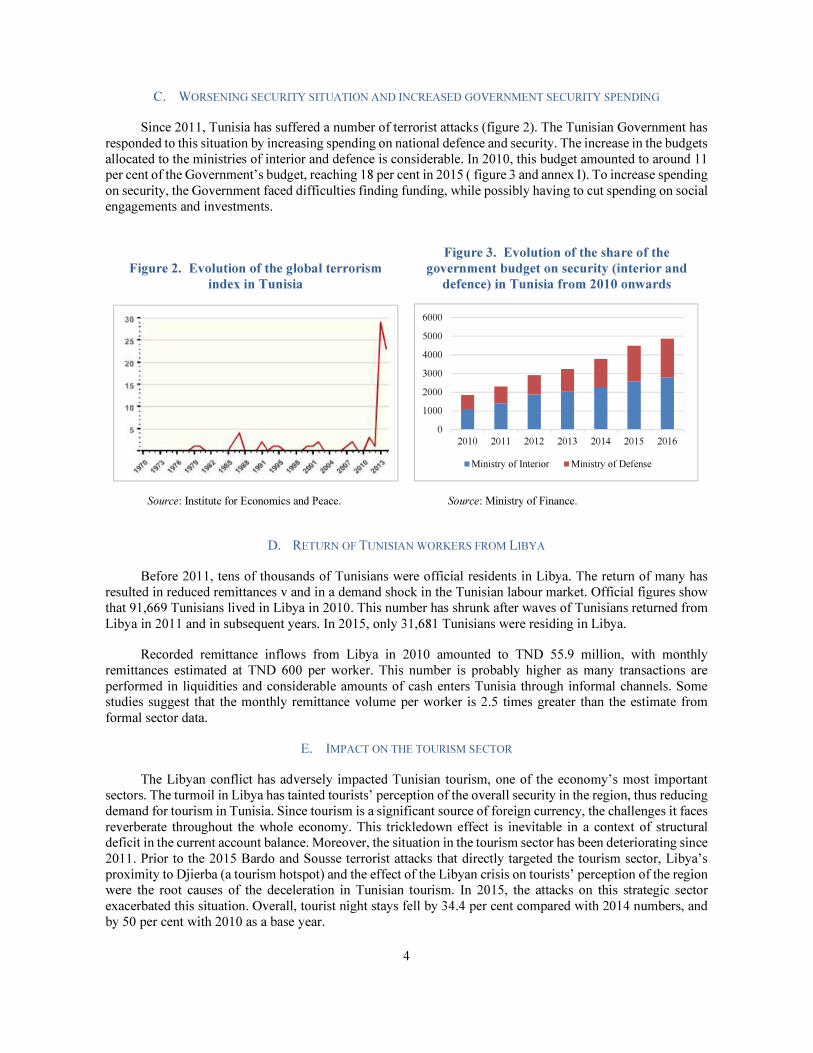
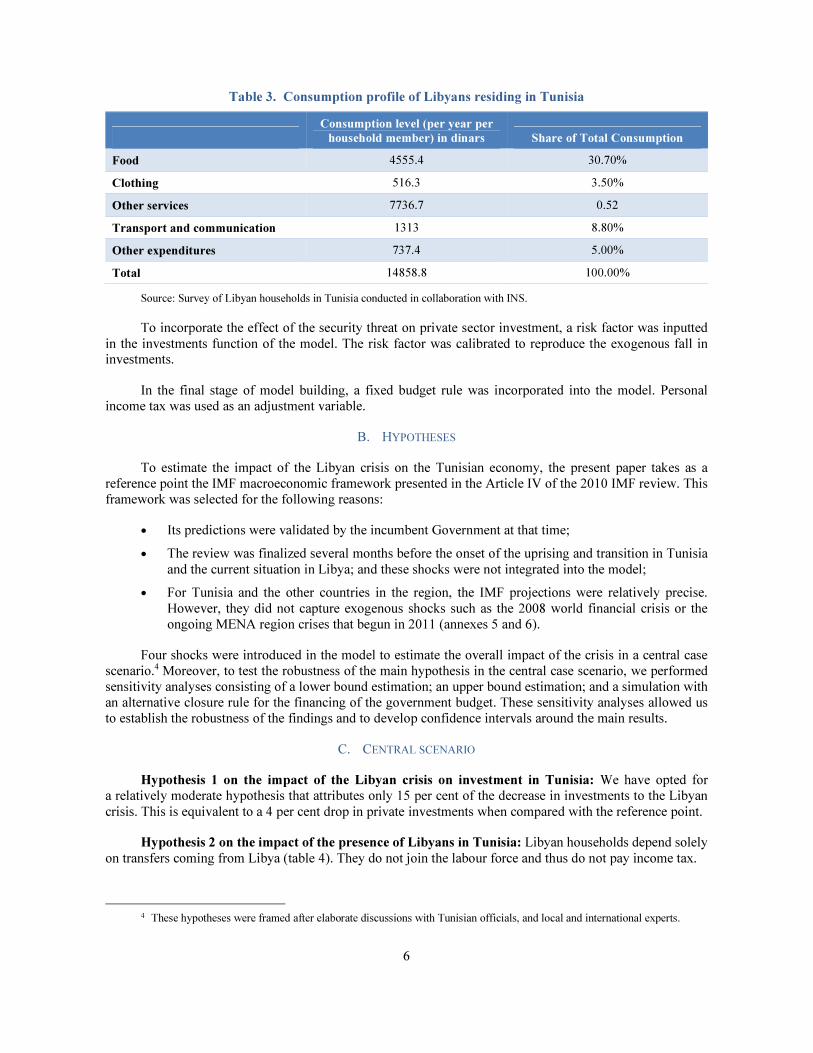
Since 2011, Tunisia has suffered a number of terrorist attacks (figure 2). The Tunisian Government has
responded to this situation by increasing spending on national defence and security. The increase in the budgets allocated to the ministries of interior and defence is considerable. In 2010, this budget amounted to around 11 per cent of the Government’s budget, reaching 18 per cent in 2015 ( figure 3 and annex I). To increase spending
on security, the Government faced difficulties finding funding, while possibly having to cut spending on social engagements and investments.
Figure 2. Evolution of the global terrorism
index in Tunisia
Figure 3. Evolution of the share of the
government budget on security (interior and
defence) in Tunisia from 2010 onwards
Source: Institute for Economics and Peace. Source: Ministry of Finance.
D. RETURN OF TUNISIAN WORKERS FROM LIBYA
Before 2011, tens of thousands of Tunisians were official residents in Libya. The return of many has resulted in reduced remittances v and in a demand shock in the Tunisian labour market. Official figures show that 91,669 Tunisians lived in Libya in 2010. This number has shrunk after waves of Tunisians returned from
Libya in 2011 and in subsequent years. In 2015, only 31,681 Tunisians were residing in Libya.
Recorded remittance inflows from Libya in 2010 amounted to TND 55.9 million, with monthly remittances estimated at TND 600 per worker. This number is probably higher as many transactions are
performed in liquidities and considerable amounts of cash enters Tunisia through informal channels. Some studies suggest that the monthly remittance volume per worker is 2.5 times greater than the estimate from
formal sector data.
E. IMPACT ON THE TOURISM SECTOR
The Libyan conflict has adversely impacted Tunisian tourism, one of the economy’s most important sectors. The turmoil in Libya has tainted tourists’ perception of the overall security in the region, thus reducing demand for tourism in Tunisia. Since tourism is a significant source of foreign currency, the challenges it faces
reverberate throughout the whole economy. This trickledown effect is inevitable in a context of structural deficit in the current account balance. Moreover, the situation in the tourism sector has been deteriorating since
2011. Prior to the 2015 Bardo and Sousse terrorist attacks that directly targeted the tourism sector, Libya’s proximity to Djierba (a tourism hotspot) and the effect of the Libyan crisis on tourists’ perception of the region were the root causes of the deceleration in Tunisian tourism. In 2015, the attacks on this strategic sector
exacerbated this situation. Overall, tourist night stays fell by 34.4 per cent compared with 2014 numbers, and by 50 per cent with 2010 as a base year.
0
1000
2000
3000
4000
5000
6000
2010 2011 2012 2013 2014 2015 2016
Ministry of Interior Ministry of Defense

5
Figure 4. Annual growth rate of the hotel and
restaurant service sector
Figure 5. Tourist night stays in hotels and
similar establishments (foreigners only)
Source: INS quarterly bulletins. Source: World Trade Organization and Tunisian National Office for Tourism.
COMPUTABLE GENERAL EQUILIBRIUM MODEL
A. METHODOLOGY
A CGE model is the only tool that can link all the effects of the crisis on different sectors of the economy
in a coherent macroeconomic framework. The channels through which challenges in Libya reverberate in
Tunisia are complex, and most easily understood through a CGE model. This model also enables us to measure
the impacts of the flow of migrants on a series of macroeconomic indicators, including national accounts
(growth, consumption, investments) and external accounts (exchange rate, trade, debt, current account
balance). The CGE model used in the present study is a country-specific dynamic recursive model, calibrated
with data on the Tunisian economy (2010 social computability matrix).3
This approach enables us to model the convergence of prices and quantities towards their new values,
while linking the sequence of static equilibria to a system of equations that update the main macroeconomic
variables at each period.
To account for the effect of the presence of Libyans on the Tunisian economy, a representative Libyan
household was introduced in the Social Accounting Matrix (SAM) of 2010. Here, we assume that this
household, which does not pay income tax, faces the same consumption/savings arbitrage as the Tunisian
consumer (annex IV). The consumption bundle of the representative Libyan household was computed with
data from the survey of Libyan households in Tunisia conducted in collaboration with INS (table 3).
3 For a detailed description of the model, see www.uneca.org/sites/default/files/PublicationFiles/atpc62_fr.pdf (in French).
0
5
10
15
20
25
30
35
2010 2011 2012 2013 2014 2015
Millions
Europeans Libyans Rest of the world
6
Table 3. Consumption profile of Libyans residing in Tunisia
Consumption level (per year per
household member) in dinars Share of Total Consumption
Food 4555.4 30.70%
Clothing 516.3 3.50%
Other services 7736.7 0.52
Transport and communication 1313 8.80%
Other expenditures 737.4 5.00%
Total 14858.8 100.00%
Source: Survey of Libyan households in Tunisia conducted in collaboration with INS.
To incorporate the effect of the security threat on private sector investment, a risk factor was inputted
in the investments function of the model. The risk factor was calibrated to reproduce the exogenous fall in investments.
In the final stage of model building, a fixed budget rule was incorporated into the model. Personal income tax was used as an adjustment variable.
B. HYPOTHESES
To estimate the impact of the Libyan crisis on the Tunisian economy, the present paper takes as a reference point the IMF macroeconomic framework presented in the Article IV of the 2010 IMF review. This framework was selected for the following reasons:
• Its predictions were validated by the incumbent Government at that time;
• The review was finalized several months before the onset of the uprising and transition in Tunisia
and the current situation in Libya; and these shocks were not integrated into the model;
• For Tunisia and the other countries in the region, the IMF projections were relatively precise.
However, they did not capture exogenous shocks such as the 2008 world financial crisis or the ongoing MENA region crises that begun in 2011 (annexes 5 and 6).
Four shocks were introduced in the model to estimate the overall impact of the crisis in a central case scenario.4 Moreover, to test the robustness of the main hypothesis in the central case scenario, we performed sensitivity analyses consisting of a lower bound estimation; an upper bound estimation; and a simulation with an alternative closure rule for the financing of the government budget. These sensitivity analyses allowed us to establish the robustness of the findings and to develop confidence intervals around the main results.
C. CENTRAL SCENARIO
Hypothesis 1 on the impact of the Libyan crisis on investment in Tunisia: We have opted for a relatively moderate hypothesis that attributes only 15 per cent of the decrease in investments to the Libyan
crisis. This is equivalent to a 4 per cent drop in private investments when compared with the reference point.
Hypothesis 2 on the impact of the presence of Libyans in Tunisia: Libyan households depend solely
on transfers coming from Libya (table 4). They do not join the labour force and thus do not pay income tax.
4 These hypotheses were framed after elaborate discussions with Tunisian officials, and local and international experts.
7
Hypothesis 3 on the impact of the Libyan crisis on Tunisian security spending: To account for the
effect of the situation in Libya on public finances in Tunisia, we suppose the crisis in Libya accounts for 50
per cent of the increase in security and defence expenditures.
Hypothesis 4: Impact of the Libyan crisis on the Tourism sector: We put forth that 50% of the fall
in tourist night stays in 2015 (in comparison with the 2010 base year) is due to the Libyan crisis. This is
equivalent to a 25% contraction in productivity in the tourism sector (in comparison with the scenario of
reference).
D. ALTERNATIVE SCENARIOS
The ‘low’ scenario includes the hypotheses listed above but with lower estimates for hypotheses 1, 3,
and 4. Table 4 summarizes these hypotheses under the three scenarios:
Table 4. Hypotheses under the three scenarios
Hypothesis on Low scenario Central scenario High scenario
Investments
2 per cent decrease in
private investments
4 per cent decrease in
private investments
6 per cent decrease in
private investments
Presence of Libyans in
Tunisia Same hypothesis Same hypothesis Same hypothesis
Public finances
35 per cent of the increase
in the security and defence
budgets can be attributed
to the situation in Libya
50 per cent of the
increase in the security
and defence budgets
can be attributed to the
situation in Libya
65 per cent of the
increase in the security
and defence budgets
can be attributed to the
situation in Libya
Tourism sector
12.5 per cent decline in
the tourism sector
25 per cent decline in
the tourism sector
37.5 per cent decline in
the tourism sector
In addition to these three scenarios, we add one in which the Government covers additional public
expenditures generated by the Libyan crisis through external debt financing rather than increasing income tax.
TUNISIAN PRIVATE INVESTMENT AND TOURISM
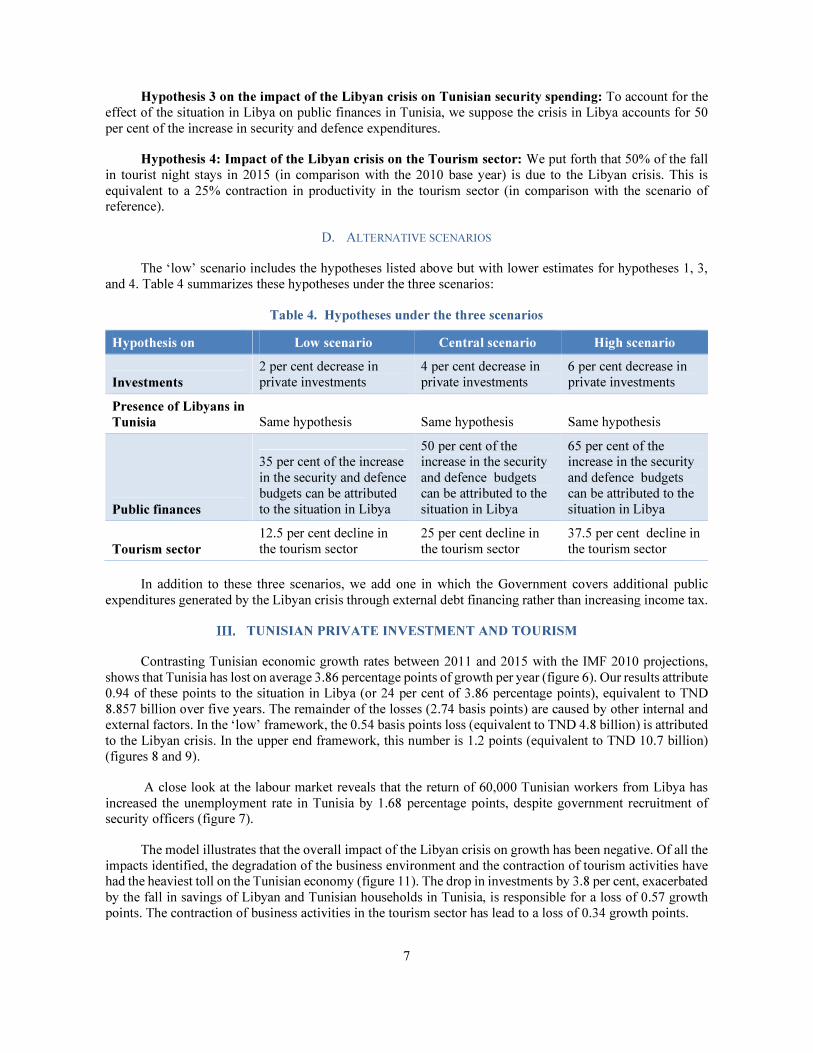
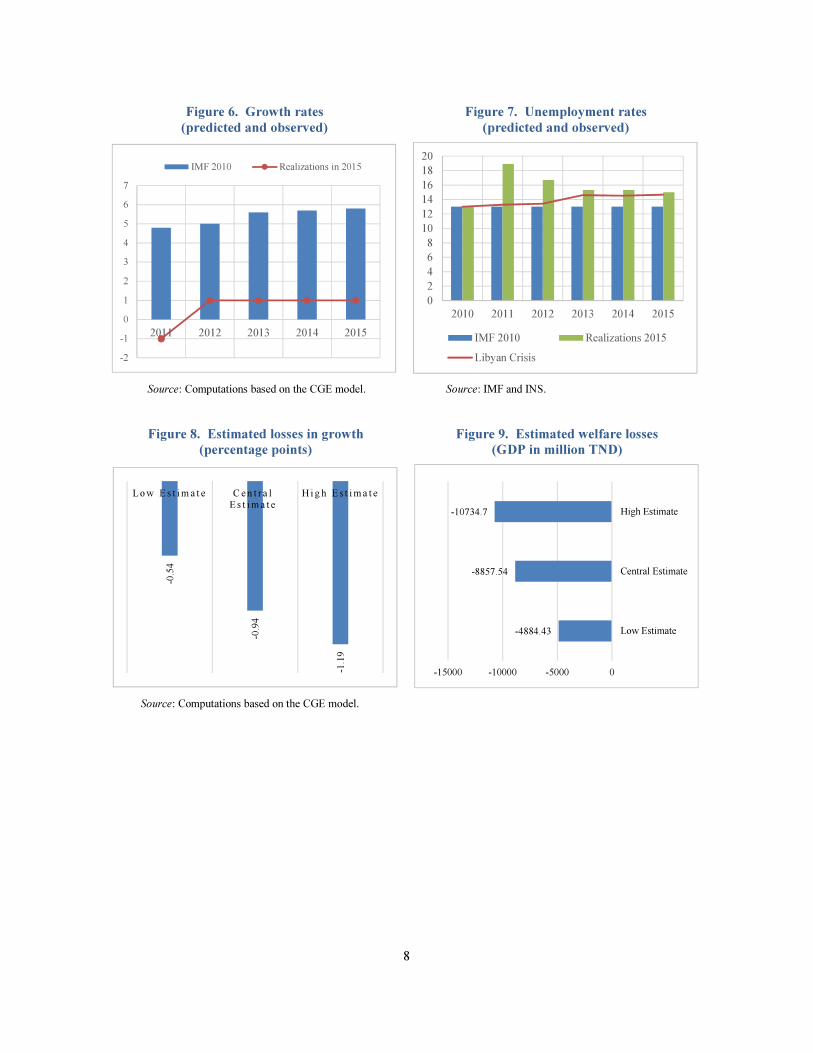
Contrasting Tunisian economic growth rates between 2011 and 2015 with the IMF 2010 projections,
shows that Tunisia has lost on average 3.86 percentage points of growth per year (figure 6). Our results attribute
0.94 of these points to the situation in Libya (or 24 per cent of 3.86 percentage points), equivalent to TND
8.857 billion over five years. The remainder of the losses (2.74 basis points) are caused by other internal and
external factors. In the ‘low’ framework, the 0.54 basis points loss (equivalent to TND 4.8 billion) is attributed
to the Libyan crisis. In the upper end framework, this number is 1.2 points (equivalent to TND 10.7 billion)
(figures 8 and 9).
A close look at the labour market reveals that the return of 60,000 Tunisian workers from Libya has
increased the unemployment rate in Tunisia by 1.68 percentage points, despite government recruitment of
security officers (figure 7).
The model illustrates that the overall impact of the Libyan crisis on growth has been negative. Of all the
impacts identified, the degradation of the business environment and the contraction of tourism activities have
had the heaviest toll on the Tunisian economy (figure 11). The drop in investments by 3.8 per cent, exacerbated
by the fall in savings of Libyan and Tunisian households in Tunisia, is responsible for a loss of 0.57 growth
points. The contraction of business activities in the tourism sector has lead to a loss of 0.34 growth points.
8
Figure 6. Growth rates
(predicted and observed)
Figure 7. Unemployment rates
(predicted and observed)
Source: Computations based on the CGE model. Source: IMF and INS.
Figure 8. Estimated losses in growth
(percentage points)
Figure 9. Estimated welfare losses
(GDP in million TND)
Source: Computations based on the CGE model.
-2
-1
0
1
2
3
4
5
6
7
2011 2012 2013 2014 2015
IMF 2010 Realizations in 2015
0
2
4
6
8
10
12
14
16
18
20
2010 2011 2012 2013 2014 2015
IMF 2010 Realizations 2015
Libyan Crisis
-0.54
-0.94
-1.19
Low E s t im a t e C en t r a l
E s t ima t e
H i g h E s t ima t e
-4884.43
-8857.54
-10734.7
-15000 -10000 -5000 0
Low Estimate
Central Estimate
High Estimate

9
Figure 10. Breakdown of factors behind the
decline in the growth rate
Figure 11. Breakdown of losses per channel of
transmission
Source: Computations based on the CGE model.
The Libyan crisis has affected the Tunisian economy in two ways. The first effect is on aggregate
demand (figure 12). All else equal, Libyan and Tunisian households have lost parts of their incomes and have
thus reduced their consumption over the five-year period (-26 per cent for Libyan households and -3.4 per cent
for Tunisian households). Moreover, the Government raised its spending by 2.2 per cent to face the security
threat caused by the Libyan crisis. These additional government expenditures were funded through a 41 per
cent increase in income tax rates (yielding TND 5.5 billion), which in turn put downward pressure on
household consumption. The second effect is linked to investment volumes (figure 13) as the degradation of
the business environment has lead to a 4 per cent shrinkage in investments. Furthermore, the income
contraction of Libyan and Tunisian households in Tunisia has further reduced investment. Despite the
maintenance of public investments at its baseline level, total investment points dropped by 4.7 percentage
points (TND 3.9 billion).
Imports have fallen by 3.8 per cent and exports by 1.7 per cent. The fall in demand and the depreciation
of the Tunisian dinar (figure 14) caused by a decline of money inflows have caused a contraction of imports.
Lower production levels explain the contraction in export volumes (figure 15).
Figure 12. Aggregate consumption,
variation in %
Figure 13. Investment,
variation in %
Source: Computations based on the CGE model.
-0.94
-2.74
-3.68
-4.00 -3.00 -2.00 -1.00 0.00
Libyan Crisis
Other factors
total
-0.57
-0.008
-0.012
-0.014
-0.34
Deterioration of business
climate and decrease in
private investments
Presence of Libyans in
Tunisia
Deterioration of security
conditions and increase in
security expenses
Return of Tunisians living
in Libya
Decrease in tourist
activities
-3.4
-26.5
2.2
-30.0 -20.0 -10.0 0.0 10.0
Tunisian households consumption
Libyan households consumption
Government consumption
-4.7
-6.3
0
-8.0 -6.0 -4.0 -2.0 0.0
Total Investment
Private Investment
Public Investment

10
Figure 14. Exchange rate
Figure 15. Exports and imports,
variation in %
Source: Computations based on the CGE model.
FISCAL COST OF THE LIBYAN CRISIS
At the fiscal level, aside from income taxes used to close the government budget, revenues from all other
taxes have noticeably contracted (figure 16). All other things equal, VAT revenues fall by 6.3 per cent over
the five years (equivalent to TND 1.17 billion) for domestic products against 4.6 per cent (TND 522 million)
for imported goods. Customs duties have shrunk by 4.8 per cent (TND 104 million) against 3.6 per cent for
corporate taxes. The only positive impact on the government budget is the significant drop in subsidies by 7.6
per cent (TND 492 million). This was a direct result of the reduction in the consumption of both Libyan and
Tunisian households. In the scenario where fiscal costs are covered with debt rather than an increase in income
tax, collected income tax over the five-year period would have fallen by 7.08 per cent (TND 458 million).
This result is in line with the trend in fiscal receipts by tax type observed from 2010 onwards. Between
2010 and 2015, the individual tax burden increased by 107 per cent, while receipts from other types of tax
grew by less than 85 per cent (figure 17).
Figure 16. Model estimate of fiscal revenues,
variation in %
Figure 17. Observed tax revenues,
variation in %
Source: Computations based on the CGE model. Source: Ministry of Finance.
0.96
0.98
1
1.02
1.04
1.06
1.08
1.1
1.12
2010 2011 2012 2013 2014 2015
IMF 2010 Libyan Crisis
-1.7
-3.8
-4.5
-4.0
-3.5
-3.0
-2.5
-2.0
-1.5
-1.0
-0.5
0.0
Total Export Total Import
-7.6 -3.6
41.6
-4.6 -6.3 -4.8
-20.0
-10.0
0.0
10.0
20.0
30.0
40.0
50.0
107.3
39.3
-7.3
51.9
45.7
85.9
-20.0 0.0 20.0 40.0 60.0 80.0 100.0 120.0
Income Tax
Corporate Tax
Customs
VAT
Consumtion fees
Other fees
11
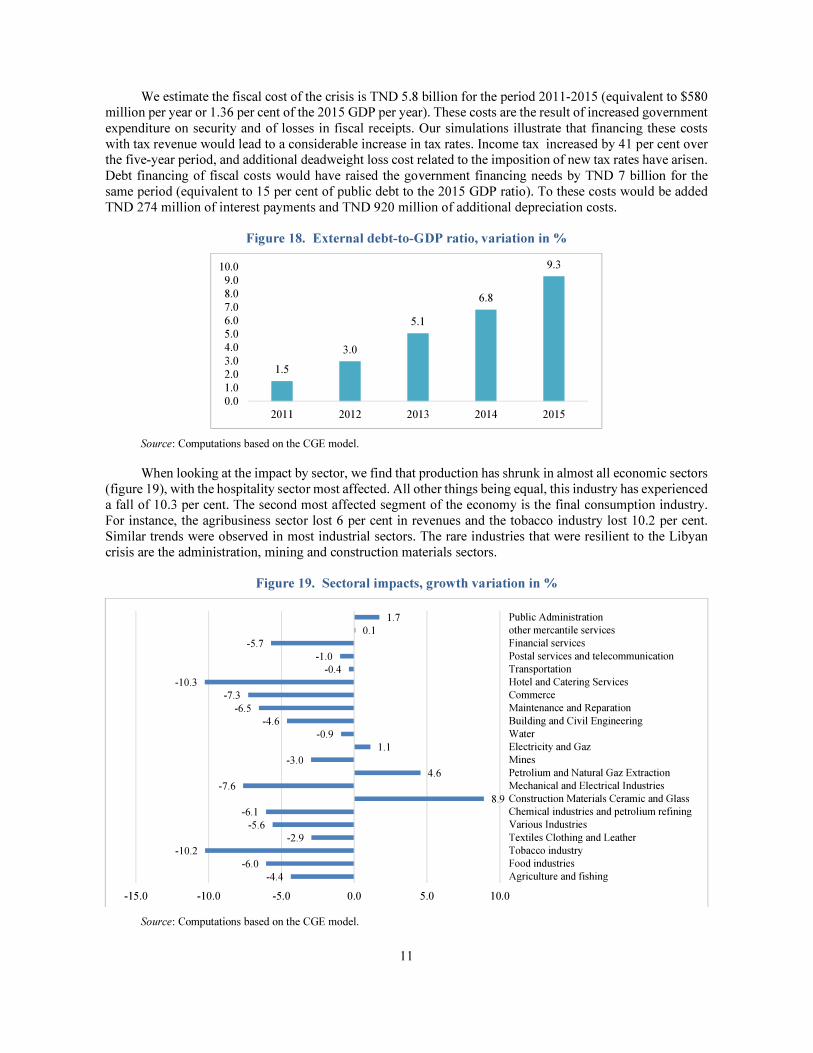
We estimate the fiscal cost of the crisis is TND 5.8 billion for the period 2011-2015 (equivalent to $580 million per year or 1.36 per cent of the 2015 GDP per year). These costs are the result of increased government
expenditure on security and of losses in fiscal receipts. Our simulations illustrate that financing these costs with tax revenue would lead to a considerable increase in tax rates. Income tax increased by 41 per cent over the five-year period, and additional deadweight loss cost related to the imposition of new tax rates have arisen.
Debt financing of fiscal costs would have raised the government financing needs by TND 7 billion for the same period (equivalent to 15 per cent of public debt to the 2015 GDP ratio). To these costs would be added TND 274 million of interest payments and TND 920 million of additional depreciation costs.
Figure 18. External debt-to-GDP ratio, variation in %
Source: Computations based on the CGE model.
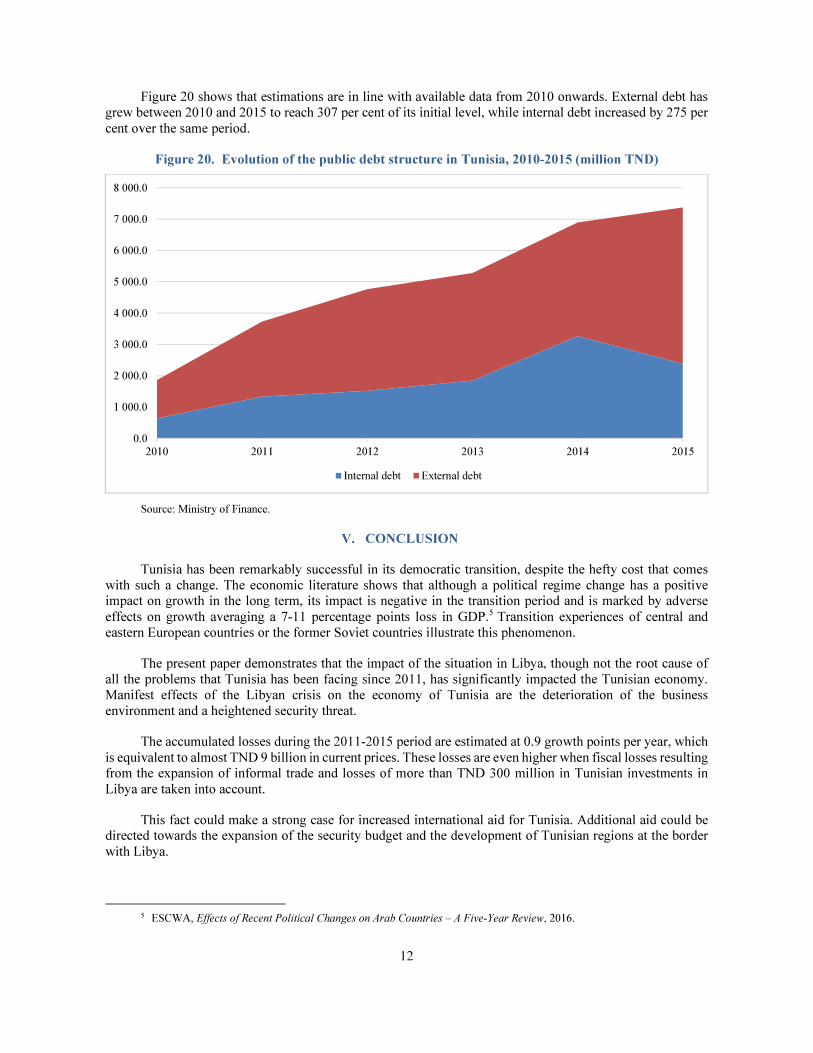
When looking at the impact by sector, we find that production has shrunk in almost all economic sectors (figure 19), with the hospitality sector most affected. All other things being equal, this industry has experienced a fall of 10.3 per cent. The second most affected segment of the economy is the final consumption industry. For instance, the agribusiness sector lost 6 per cent in revenues and the tobacco industry lost 10.2 per cent. Similar trends were observed in most industrial sectors. The rare industries that were resilient to the Libyan crisis are the administration, mining and construction materials sectors.
Figure 19. Sectoral impacts, growth variation in %
Source: Computations based on the CGE model.
1.5
3.0
5.1
6.8
9.3
0.0
1.0
2.0
3.0
4.0
5.0
6.0
7.0
8.0
9.0
10.0
2011 2012 2013 2014 2015
-4.4
-6.0
-10.2
-2.9
-5.6
-6.1
8.9
-7.6
4.6
-3.0
1.1
-0.9
-4.6
-6.5
-7.3
-10.3
-0.4
-1.0
-5.7
0.1
1.7
-15.0 -10.0 -5.0 0.0 5.0 10.0
Agriculture and fishing
Food industries
Tobacco industry
Textiles Clothing and Leather
Various Industries
Chemical industries and petrolium refining
Construction Materials Ceramic and Glass
Mechanical and Electrical Industries
Petrolium and Natural Gaz Extraction
Mines
Electricity and Gaz
Water
Building and Civil Engineering
Maintenance and Reparation
Commerce
Hotel and Catering Services
Transportation
Postal services and telecommunication
Financial services
other mercantile services
Public Administration
12
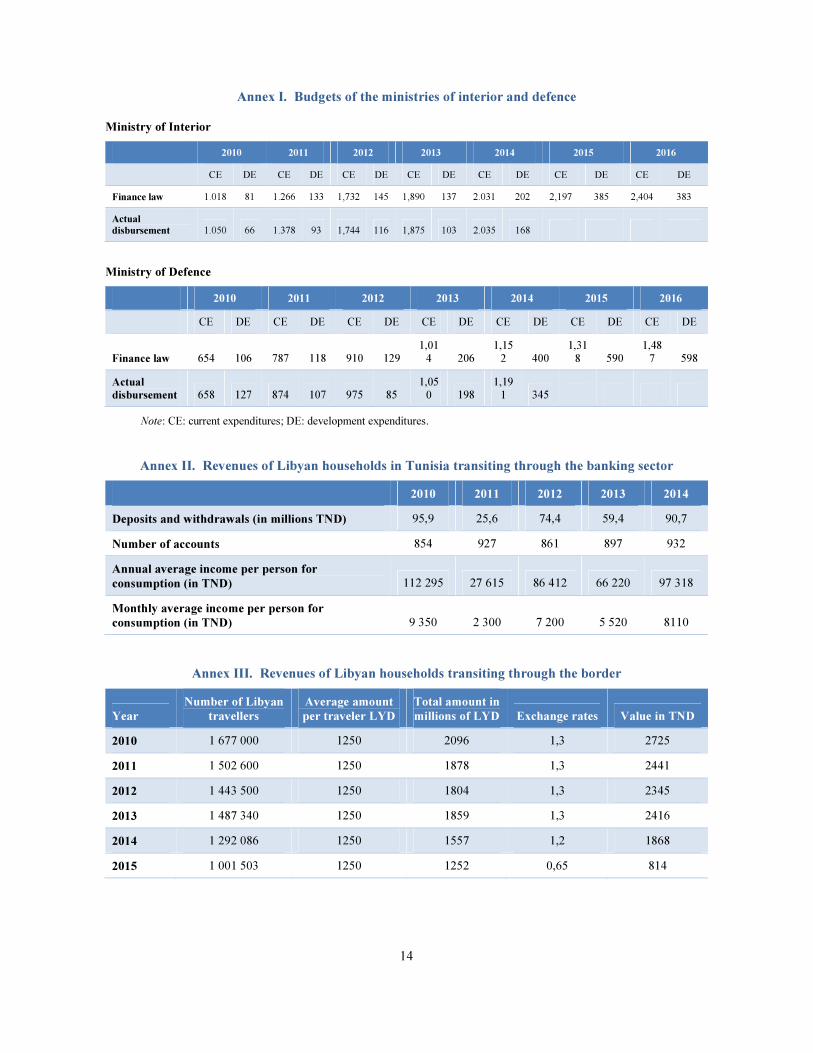
Figure 20 shows that estimations are in line with available data from 2010 onwards. External debt has
grew between 2010 and 2015 to reach 307 per cent of its initial level, while internal debt increased by 275 per
cent over the same period.
Figure 20. Evolution of the public debt structure in Tunisia, 2010-2015 (million TND)
Source: Ministry of Finance.
CONCLUSION
Tunisia has been remarkably successful in its democratic transition, despite the hefty cost that comes
with such a change. The economic literature shows that although a political regime change has a positive
impact on growth in the long term, its impact is negative in the transition period and is marked by adverse
effects on growth averaging a 7-11 percentage points loss in GDP.5 Transition experiences of central and
eastern European countries or the former Soviet countries illustrate this phenomenon.
The present paper demonstrates that the impact of the situation in Libya, though not the root cause of
all the problems that Tunisia has been facing since 2011, has significantly impacted the Tunisian economy.
Manifest effects of the Libyan crisis on the economy of Tunisia are the deterioration of the business
environment and a heightened security threat.
The accumulated losses during the 2011-2015 period are estimated at 0.9 growth points per year, which
is equivalent to almost TND 9 billion in current prices. These losses are even higher when fiscal losses resulting
from the expansion of informal trade and losses of more than TND 300 million in Tunisian investments in
Libya are taken into account.
This fact could make a strong case for increased international aid for Tunisia. Additional aid could be
directed towards the expansion of the security budget and the development of Tunisian regions at the border
with Libya.
5 ESCWA, Effects of Recent Political Changes on Arab Countries – A Five-Year Review, 2016.
0.0
1 000.0
2 000.0
3 000.0
4 000.0
5 000.0
6 000.0
7 000.0
8 000.0
2010 2011 2012 2013 2014 2015
Internal debt External debt

13
The political situation in Libya is beginning to stabilize and there are hopes of a Libyan economic revival. This would provide many economic opportunities for both countries, if exploited appropriately. Libya
and Tunisia would benefit from beginning to lay the groundwork in terms of logistics and regulations, to maximize gains from this opportunity. With a risk that the reconstruction of Libya will feed the informal sector, early preparation is primordial. For instance, the two Governments could join forces to reinforce ground, air
and sea infrastructure linking the two countries. They could also set up a mechanism that facilitates the entry of consumption goods in Libya through formal channels to avoid informal trading.
14
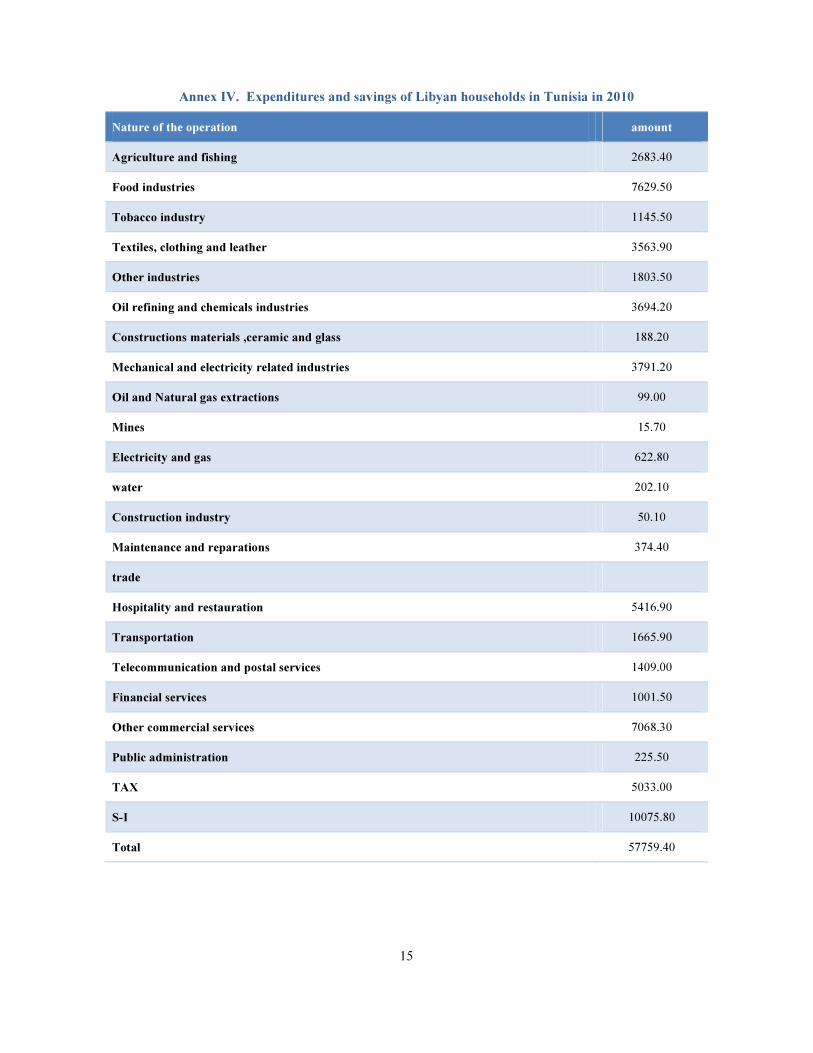
Annex I. Budgets of the ministries of interior and defence
Ministry of Interior
2010 2011 2012 2013 2014 2015 2016
CE DE CE DE CE DE CE DE CE DE CE DE CE DE
Finance law 1.018 81 1.266 133 1,732 145 1,890 137 2.031 202 2,197 385 2,404 383
Actual
disbursement 1.050 66 1.378 93 1,744 116 1,875 103 2.035 168
Ministry of Defence
2010 2011 2012 2013 2014 2015 2016
CE DE CE DE CE DE CE DE CE DE CE DE CE DE
Finance law 654 106 787 118 910 129 1,01
4 206 1,15
2 400 1,31
8 590 1,48
7 598
Actual
disbursement 658 127 874 107 975 85 1,05
0 198 1,19
1 345
Note: CE: current expenditures; DE: development expenditures.
Annex II. Revenues of Libyan households in Tunisia transiting through the banking sector
2010 2011 2012 2013 2014
Deposits and withdrawals (in millions TND) 95,9 25,6 74,4 59,4 90,7
Number of accounts 854 927 861 897 932
Annual average income per person for
consumption (in TND) 112 295 27 615 86 412 66 220 97 318
Monthly average income per person for
consumption (in TND) 9 350 2 300 7 200 5 520 8110
Annex III. Revenues of Libyan households transiting through the border
Year
Number of Libyan
travellers
Average amount
per traveler LYD
Total amount in
millions of LYD Exchange rates Value in TND
2010 1 677 000 1250 2096 1,3 2725
2011 1 502 600 1250 1878 1,3 2441
2012 1 443 500 1250 1804 1,3 2345
2013 1 487 340 1250 1859 1,3 2416
2014 1 292 086 1250 1557 1,2 1868
2015 1 001 503 1250 1252 0,65 814
15
Annex IV. Expenditures and savings of Libyan households in Tunisia in 2010
Nature of the operation amount
Agriculture and fishing 2683.40
Food industries 7629.50
Tobacco industry 1145.50
Textiles, clothing and leather 3563.90
Other industries 1803.50
Oil refining and chemicals industries 3694.20
Constructions materials ,ceramic and glass 188.20
Mechanical and electricity related industries 3791.20
Oil and Natural gas extractions 99.00
Mines 15.70
Electricity and gas 622.80
water 202.10
Construction industry 50.10
Maintenance and reparations 374.40
trade
Hospitality and restauration 5416.90
Transportation 1665.90
Telecommunication and postal services 1409.00
Financial services 1001.50
Other commercial services 7068.30
Public administration 225.50
TAX 5033.00
S-I 10075.80
Total 57759.40

16
Annex V. Comparison of GDP projections and actual GDP values in Tunisia
between 2010 and 2015
Annex VI. Accumulated differences between IMF GDP estimates and realized GDP
in the MENA region between 2010 and 2015
0
5
10
15
20
25
30
35
40
2005 2006 2007 2008 2009 2010
US
$ B
illi
on
s
Projections Realizations
18.2 14.4 10.4 3.4 0.3
-0.4 -13.1 -13.6 -21.5 -30.4 -36.1 -56.0 -59.0 -62.9 -82.5-112.8
-534.4
-636.6
-800
-600
-400
-200
0
200
Recommended