IMPACT OF CONSUMER DEMOGRAPHIC CHARACTERISTICS ON ADOPTION
RATE OF ELECTRIC TRANSPORTATION
Presented in Partial Fulfillment of the Requirements for
The Master of Education Degree in the
College of Education and Human Service Professions
By
Pamela A. Schmitt
University of Minnesota Duluth
May 2019
Committee Signatures: Chair: _____________________________________________ Member: _____________________________________________ Graduate Program Director: ___________________________________________

ii
Acknowledgements Thank you to the staff at the UMD Department of Education for being so generous and
supportive. A special thank you to Insoon Han for encouraging me and helping me complete my
Master’s degree. Without her this would not have been possible.

iii
Dedication
This thesis is dedicated to my family, friends and co-workers who supported me through the
learning, research and writing. Especially, my Aunt who has relentlessly and tirelessly reminded
me that I need to finish it!
iv
Abstract
This study sought to contribute additional research to advancing electric transportation through
identifying correlations between demographic characteristics and a consumer’s interest in
adopting electric transportation. While the electric vehicle (EV) market is relatively small, it has
steadily expanded since 2010 and is forecasted for exponential growth in the coming decades if
the United States follows suit behind other developed countries. This paper utilized customer
survey results from a mid-sized electric utility in Northeastern Minnesota. Quantitative analysis
was used to explore the relationship between demographic characteristics and interest in
ownership of an EV. Results did not show a statistical significance between any of the
demographic variables and interest in electric vehicles, but demonstrate a need for further
research on this topic and the ways that the U.S. has been able to incentivize adoption of EVs.
Keywords – plug-in electric vehicles; beneficial electrification, transportation
electrification.
v
Table of Contents
Acknowledgments ii
Dedication iii
Abstract iv
Table of Contents v
List of Tables vii
List of Figures viii
Chapter One Introduction 1
Purpose of the Study 3
Background and Significance of the Study 3
Setting 5
Assumptions 5
Scope and Limitations of the Study 5
Definitions 6
Summary 6
Chapter Two Literature Review 7
Electric Transportation Technology 7
Barriers Associated with Electrifying Transportation 8
Consumer Demographics Influencing Interest in EVs 10
Summary 11
Chapter Three Methodology 13
Research Design 13
vi
Setting and Participants 13
Measures 14
Data Gathering and Analysis 14
Summary 15
Chapter Four Results and Discussion 16
Participant Interest in a Plug-in Electric Vehicle by Demographic
Characteristics 16
Associations between Interest in a Plug-in Electric Vehicle and
Environmental Awareness 19
Summary 20
Chapter Five Summary and Conclusion 21
Significant Findings 21
Implications 22
Limitations and Recommendations 22
Conclusion 23
References 25
Appendices 28
vii
List of Tables
Table 1. Participant Characteristics 14
Table 2. Participant Interest in a Plug-in Electric Vehicle by Demographic
Characteristics 18
Table 3. Association with Interest in a Plug-in Electric Vehicle and Environmental
Awareness Question 20
viii
List of Figures
Figure 1. A map of the United States showing electricity for an EV total emissions
equivalent to an internal combustion engine (ICE) vehicle’s emissions miles per
gallons (MPG) 2
Figure 2. EV technology adoption curve 3
Figure 3. insideEVs.com monthly U.S. EV sales chart 4
Figure 4. An Electric Vehicle advertisement from the late 1800s targeting women 7
Figure 5. Map of EV charger density in the U.S. by state 9
Figure 6. 2014 EV purchase incentive comparison by country compared to EV
adoption rate 11
1
Chapter One
Introduction
In 2017, the transportation sector made history by making its way to the top of the list for
the United States’ highest contributor of greenhouse gas (GHG) emissions (United States
Environmental Protection Agency, 2019). Its predecessor, electricity generation, previously held
the lead position. That makes it hard to imagine that refueling an entire industry to be powered
off of the formerly leading GHG contributor would be a move in the right direction, but that
appears to be the case. When considering the future, “all-in” emissions and overall efficiency,
there are many forms of environmentally Beneficial Electrification (Dennis, 2015). As energy
generated and sent onto the grid gets cleaner due to mounting pressures from policy makers and
climate change, we “are changing the environmental value of using electric appliances to
produce heat and hot water in buildings, requiring a more systems-based approach to energy
efficiency tools and revisions to the methodology for calculating ‘source’ energy metrics
(Dennis, 2015, p. 100)”.
This essentially means that energy efficiency policy and the experts creating it are
considering a look at the entire picture of carbon footprint of a fuel and possible end-use
applications. There is growing conversation and policy development around electrification of
transportation which is a prime example of this methodology not only increasing energy
efficiency, but also reducing environmental impacts (Malone et al., 2018). A growing
Transportation Electrification effort represents enormous opportunity, but comes with significant
challenges. Since 2010, the United States Electric Vehicle (EV) market has been steadily
growing (Loveday, 2018). Wide-ranging benefits for the country range from reducing GHG to
improving the nation’s energy independence (Department of Energy). At a consumer level,
2
individuals can expect to have a safer (O’Malley, 2015), cheaper to fuel and maintain
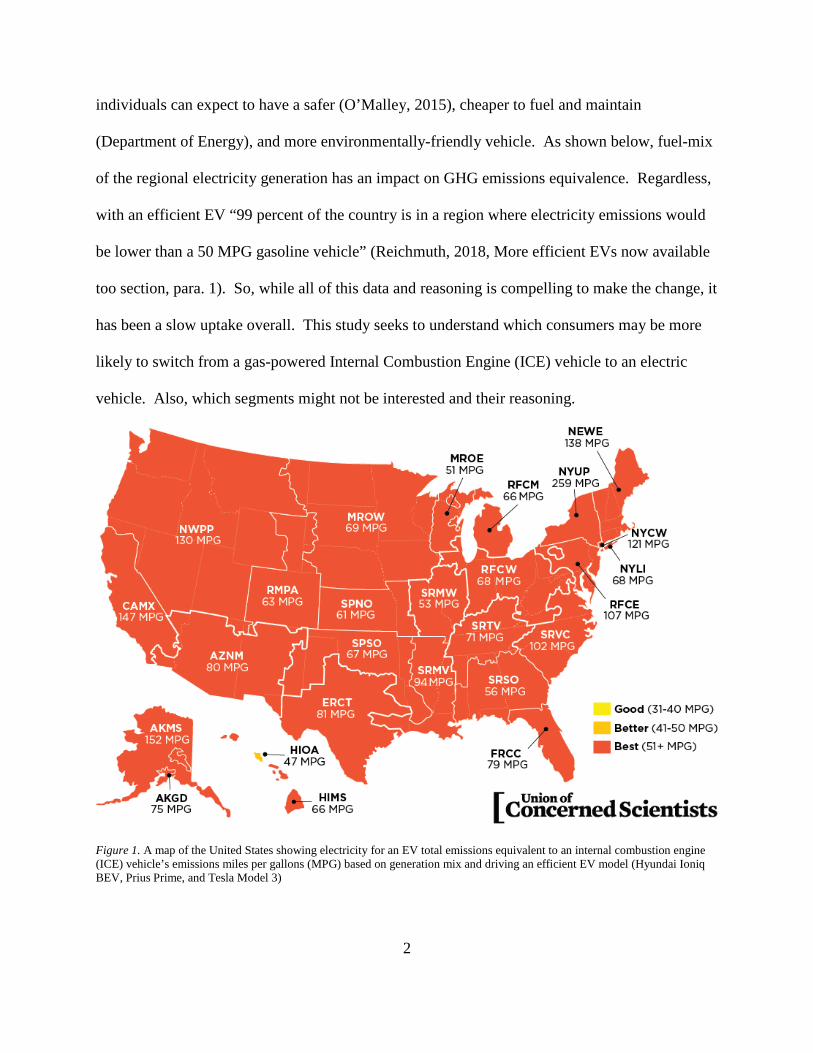
(Department of Energy), and more environmentally-friendly vehicle. As shown below, fuel-mix
of the regional electricity generation has an impact on GHG emissions equivalence. Regardless,
with an efficient EV “99 percent of the country is in a region where electricity emissions would
be lower than a 50 MPG gasoline vehicle” (Reichmuth, 2018, More efficient EVs now available
too section, para. 1). So, while all of this data and reasoning is compelling to make the change, it
has been a slow uptake overall. This study seeks to understand which consumers may be more
likely to switch from a gas-powered Internal Combustion Engine (ICE) vehicle to an electric
vehicle. Also, which segments might not be interested and their reasoning.
Figure 1. A map of the United States showing electricity for an EV total emissions equivalent to an internal combustion engine (ICE) vehicle’s emissions miles per gallons (MPG) based on generation mix and driving an efficient EV model (Hyundai Ioniq BEV, Prius Prime, and Tesla Model 3)
3
Purpose of the Study
The purpose of this study was to compare interest in electric transportation against
demographic characteristics in order to add resources to available research used by policy
makers, auto manufacturers and other interested stakeholders trying to grow the adoption of
electric transportation. The study used responses from an online survey conducted by Company
A.
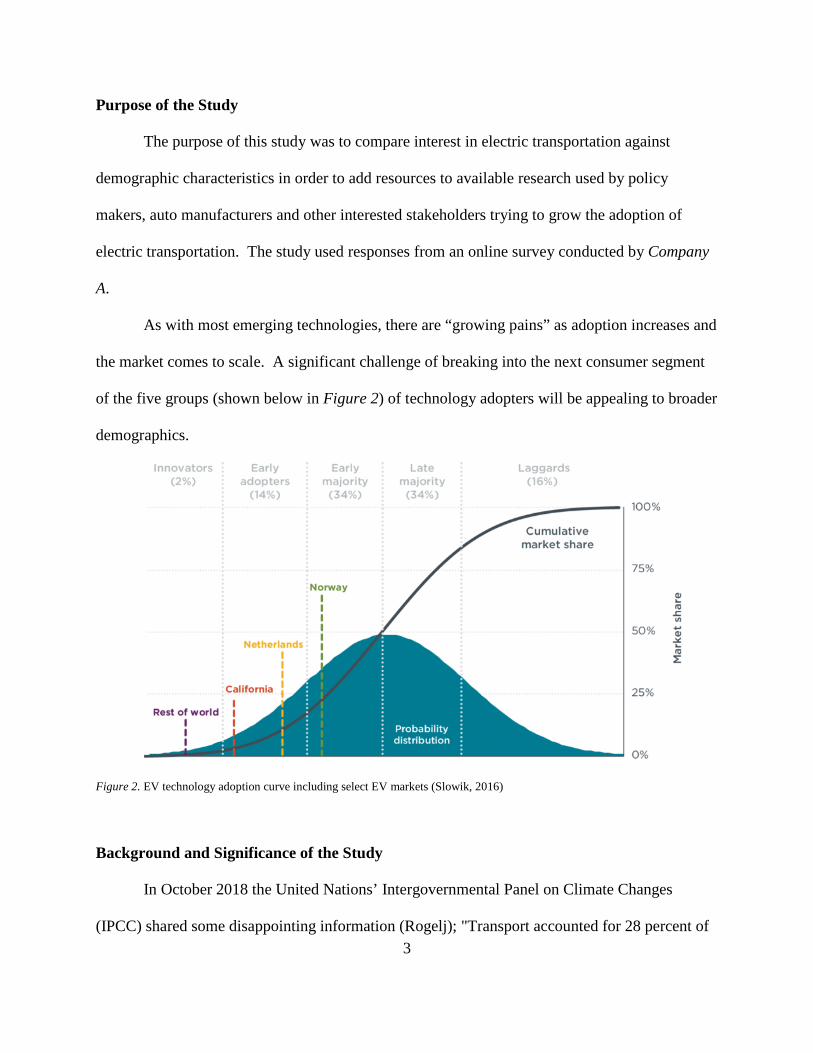
As with most emerging technologies, there are “growing pains” as adoption increases and
the market comes to scale. A significant challenge of breaking into the next consumer segment
of the five groups (shown below in Figure 2) of technology adopters will be appealing to broader
demographics.
Figure 2. EV technology adoption curve including select EV markets (Slowik, 2016)
Background and Significance of the Study
In October 2018 the United Nations’ Intergovernmental Panel on Climate Changes
(IPCC) shared some disappointing information (Rogelj); "Transport accounted for 28 percent of

4
global final-energy demand and 23 percent of global energy-related CO2 emissions in 2014,"
according to the second chapter of the report. "Emissions increased by 2.5 percent annually
between 2010 and 2015, and over the past half century the sector has witnessed faster emissions
growth than any other” (Joselow, 2018, T H E C L I M A T E R E P O R T S E C T I O N
. section, para.3). The study maps out various scenarios of the world’s climate future
under different decarbonization of electricity and other fuels, and electrification of energy end
use. The study makes it clear that to minimize the impacts of climate change, the world needs to
rapidly do both of those things.
Only a month before the IPCC report, it had been announced that electric vehicle sales in
the United States finally reached one million units sold (Kane, 2018). While this might seem
like cause to celebrate, this record-setting sales month for EVs was only 0.03% of the vehicles
sold that month (MarkLines, 2018).
Figure 3. insideEVs.com monthly chart for U.S. plug-in EV sales from January 2010 – February 2019
If the United States and other countries around the world are going to rapidly decarbonize
the transportation sector, understanding the barriers to entry will be key to unlocking market
5
potential for the broader population to adopt EVs. Furthermore, it will be important to recognize
that characteristics like gender identity, income and home-ownership factor into different barriers
of entry and ultimately the likelihood of adoption. In turn, understanding how these indicators
might currently prevent a consumer from considering an EV may inform future strategies on
awareness efforts, education, outreach and marketing to targeted demographic segments.
Setting
This study focused on customers of an electric utility in Northeastern Minnesota. The
utility marketed the survey online through their website, social media channels and email interest
lists. Customers that chose to take the survey did so on their own personal devices, but were
required to provide confirmation that they were an actual customer of the utility.
Assumptions
The primary researcher was an employee of the electric utility for several years, working
on initiatives related to EVs prior to the study. With several years of experience working
directly with customers of the utility, the researcher had an inherent bias while developing the
survey as to the questions asked in the instrument.
Scope and Limitations of the Study
The survey conducted was only made available to the customers from Company A, based
in Northeastern Minnesota. Marketing of the survey was done almost completely online through
email marketing and social media. Therefore, some bias should be assumed as customers who
only opt to receive physical communications would not have had the option to participate.
Additionally, a majority of the customers that responded already participate in Company A’s
program offerings related to emerging electric technologies.
6
Definitions
Beneficial Electrification – changing the fuel from one source like petroleum, natural gas,
etc. to electricity to achieve more efficient use of energy and/or reduction in environmentally
harmful emissions.
Decarbonization – removing carbon-emitting fuels from various sectors like
transportation and electricity generation.
Electric Vehicle – a vehicle powered by a battery that is charged from electricity.
Summary
The purpose of this study was to see if any correlations could be drawn between
demographic characteristics and interest in adopting electric transportation.
7
Chapter Two
Literature Review
There were three predominant themes in the literature on electric vehicles. First, the
technology of electric transportation and its supporting infrastructure. Then, the benefits
associated with transitioning to this technology. Finally, a limited body of research on consumer
demographics influencing interest in electrification of transportation.
Electric Transportation Technology
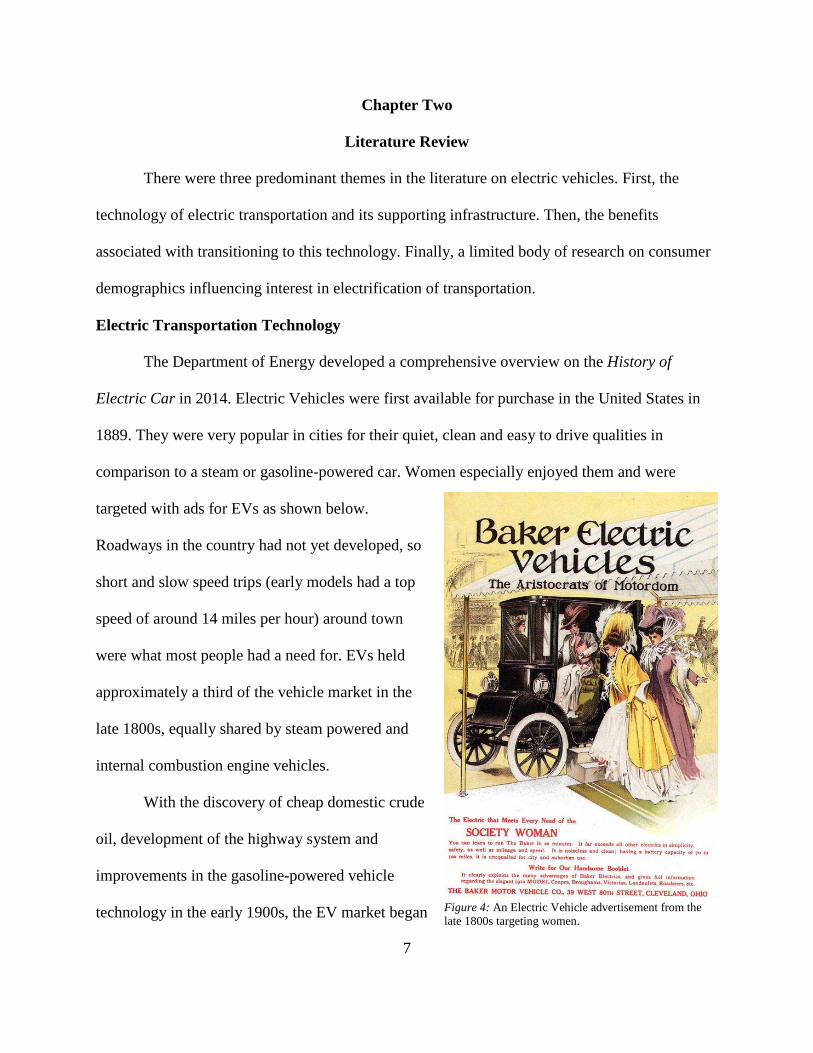
The Department of Energy developed a comprehensive overview on the History of
Electric Car in 2014. Electric Vehicles were first available for purchase in the United States in
1889. They were very popular in cities for their quiet, clean and easy to drive qualities in
comparison to a steam or gasoline-powered car. Women especially enjoyed them and were
targeted with ads for EVs as shown below.
Roadways in the country had not yet developed, so
short and slow speed trips (early models had a top
speed of around 14 miles per hour) around town
were what most people had a need for. EVs held
approximately a third of the vehicle market in the
late 1800s, equally shared by steam powered and
internal combustion engine vehicles.
With the discovery of cheap domestic crude
oil, development of the highway system and
improvements in the gasoline-powered vehicle
technology in the early 1900s, the EV market began Figure 4: An Electric Vehicle advertisement from the late 1800s targeting women.
8
its decline. It wasn’t until the late 1960s when gasoline prices skyrocketed that the country began
thinking about how to transition some of all of the transportation sector back to electricity to
reduce its reliance on foreign oil. Congress followed along and later passed the Electric and
Hybrid Vehicle Research, Development, and Demonstration Act of 1976 appropriating funds for
research and development of electric and hybrid vehicle technology. Gas prices returned to a
somewhat “normal” state and so did society’s sense of urgency over the matter. EVs developed
in the 70s had a high price and less-than-desirable performance when comparing range and speed
with ICE vehicles.
Fast forward to the 1990s and early 2000s. Environmental policy and regulation entered a
new era, setting new mandates for vehicle efficiency standards. This, along with the introduction
of hybrid vehicles to the U.S. market in 1999, rekindled auto-manufacturer’s intrigue with plug-
in electric vehicle technology. In 2006, a Silicon Valley startup called Tesla Motors announced
their first model. This marked the beginning of a U.S. EV market renaissance.
Barriers Associated with Electrifying Transportation
“The plug-in electric vehicle (PEV) holds much promise today—from reducing
dependency on imported petroleum to decreasing greenhouse gas emissions to improving urban
air quality (National Academy of Sciences, 2015, Absract, para.1)”. In spite of that opportunity,
93% of transportation is fueled by petroleum (EEI, 2014). There are many perceived and real
barriers standing in the way of making this benefit (and many others) a reality.
Charging infrastructure. Charging an EV can happen anywhere a standard outlet exists,
but there are different levels of voltage determining the speed rate of the how the charging. 95%
of charging happens at home and work, where charging is generally funded by the homeowner or
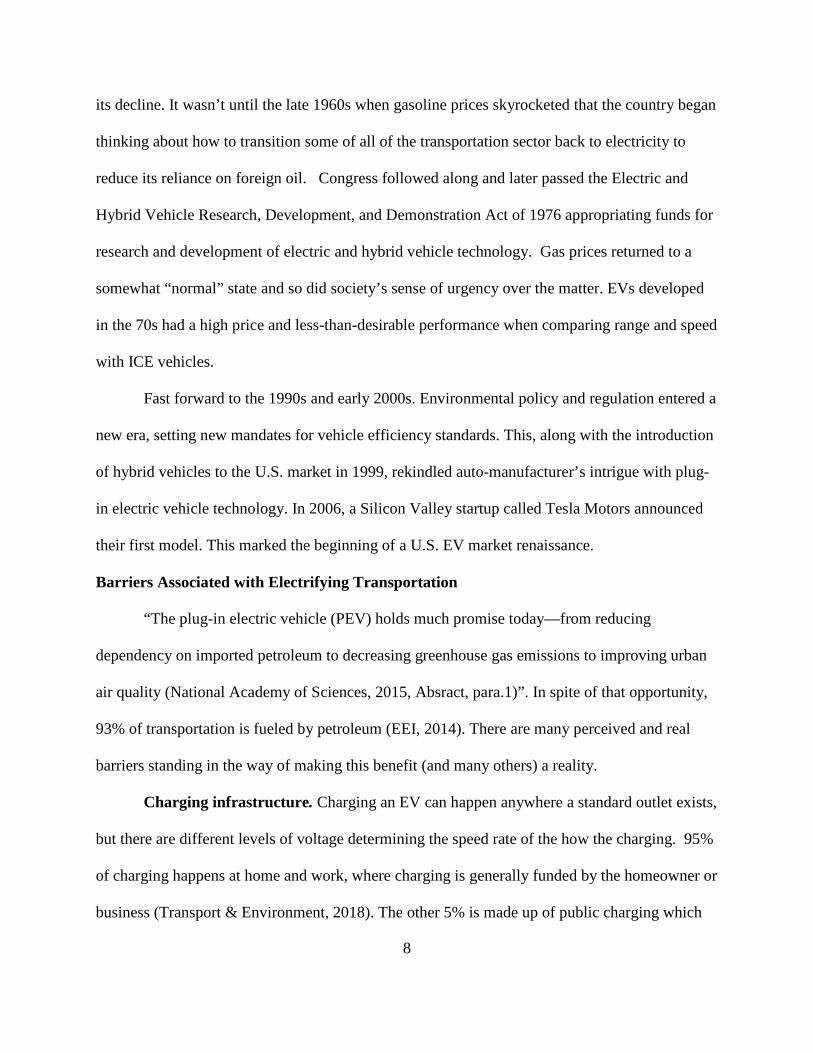
business (Transport & Environment, 2018). The other 5% is made up of public charging which
9
has variable coverage across the United States as shown below. The lack of charging is a major
cause of concern for consumer, causing range anxiety or a feeling of limitation on their ability to
travel freely like they can with an ICE.
Figure 5. EV charger density by state based on amount of public roads
EV charging technology. Speed of charging, Charging an EV can happen anywhere a
standard 110 volt electric outlet exists, but this type of charging (Level 1) is slow, adding about
three to five miles of range per hour. While 95% of charging happens at home and work
(Transport & Environment, 2018), consumers will generally get hung up on those 5% scenarios
where they will rely on public charging to travel outside the range their home or workplace
charging would allow. It generally takes less than ten minutes to full a conventional gasoline-
10
powered car or ICE, but charging an EV can from empty to full can range from 30 minutes to
several days (in the extreme cases of using 110 AC outlets to recharge EVs with a larger kWh
batteries) (Menser). Until the convenience of fueling ICE vehicles can be matched by EVs,
adoption will continue to be slower.
Perceptions on ownership. Until a consumer experiences an EV for themselves they
tend to be skeptical of EV technology (Bühler, 2014). Common fears include limitation of their
range, flammability of batteries, performance and higher costs. The promising results of the field
study reference above showed that consumer attitudes towards EVs dramatically changed when
they drove the vehicles, making this limitation easier to overcome.
Consumer Demographics Influencing Interest in EVs
There was limited research available on how consumer demographics correlate to the
early adopters of EVs or current consumers’ interest in transitioning to an EV. Some studies had
been done on socio-economic indicators. The most prevalently researched topic was the impact
of incentives on adoption.
Socio-economic factors. Sierzchula conducted a detailed study across 30 countries to try
and identify correlations between incentives, local charging, socio-demographic variables and
electric vehicle adoption. The study concluded that locality to EV production facility and
available public charging were the strong indicators of adoption. The broader socio-demographic
variables such as income, education level, and environmentalism were not good predictors of
adoption levels. This could be because national EV markets were so small, relative to overall
automobile sales.
11
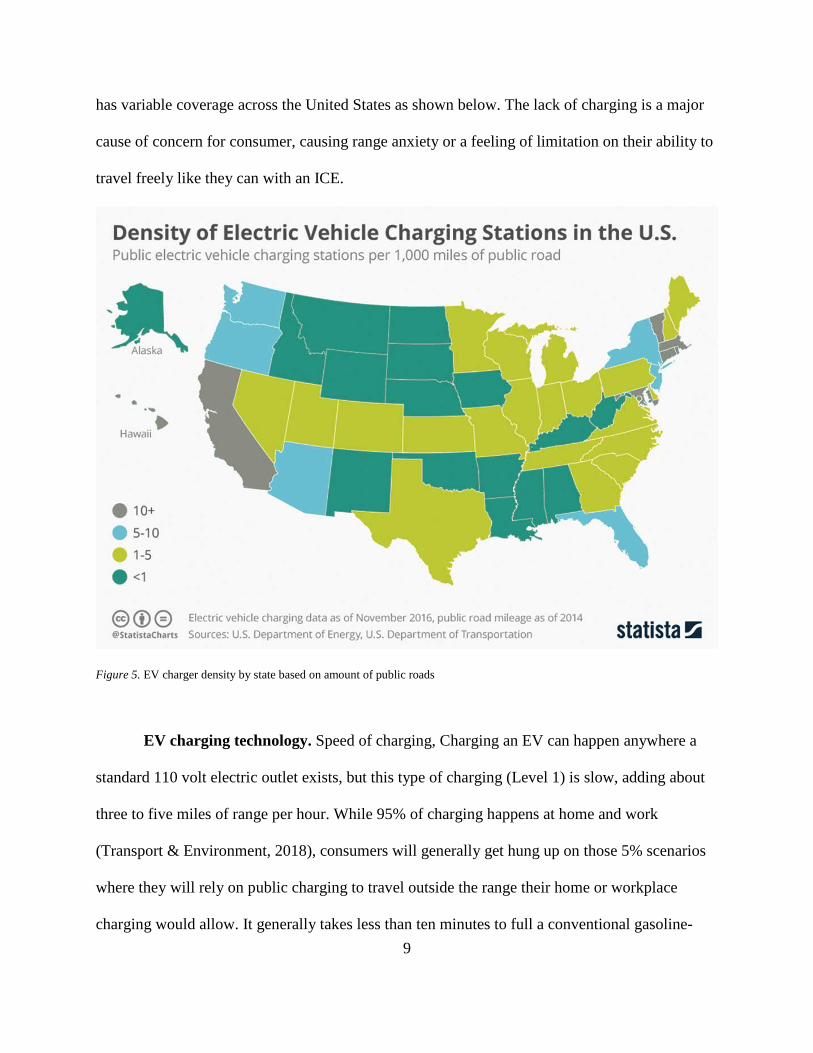
Incentives. The same 2014 study found a statistical significance in financial purchase
incentives driving adoption of EVs. The results vary widely and below is a chart of the country’s
financial incentives compared against the rate of EV adoption.
Figure 6. 2014 EV purchase incentive comparison by country compared to EV adoption rate.
Another study from 2015 suggested that vehicle range was still the leading factor for U.S.
consumers in making the decision to drive electric (Helveston).
Summary
Converting the United States transportation sector from carbon-based fueled cars to
increasingly-renewable powered electric vehicles will take significant effort and a lot of time.
With consumer skepticism, lack of available public charging, and relatively low gasoline prices,
policy-makers will have to decide what measures to take regarding extending or expanding the
federal tax rebate incentive. Additionally, in-person experiences are thought to be very impactful
of changing consumer perception of EVs. Car dealerships, electric utilities, EV charging

12
companies and public organizations should partner together to arrange these experiences for
consumers. Finally, a higher tax on gasoline would likely drive consumers to seek alternatives.
Until then, more research is needed on to specify which populations or consumer groups will be
the easiest to convert and target the efforts there.
13
Chapter Three
Methodology
The purpose of this quantitative study was to determine if there are correlations between
demographic characteristics and interest level in purchasing an electric vehicle. If patterns can
be identified between certain demographics that are more or less likely to be interested in an
electric vehicle, automotive dealerships, policy makers and other members of the electric
transportation industry may be able to take a more strategic approach when promoting this form
of Beneficial Electrification. This chapter will explain the setting and survey participants, how
the study was developed, and the procedures used to gather and analyze data.
Research Design
The research methods deployed for this study were quantitative descriptive and
correlational. The quantitative descriptive method was used because there were research
questions that involved a relationship between two variables. A correlational method was also
used because there were research questions that had multiple variables being studies within the
same group of survey participants.
Setting and Participants
The participants of this study included 229 customers of Company A, an electric utility in
Northeastern Minnesota. Customers were solicited to respond to this survey via the company’s
social media channels, website and email marketing lists. As shown below in Table 1, this
resulted in 229 verified customers of Company A responded to the survey. 124 of the respondents
identified as female, 96 as male, and 9 preferred not to identify with a gender. Almost 46% of the
respondents indicated that they have an annual income in excess of $75,000. The majority of
survey participants identified as working, as well as having children in the home (though these
14
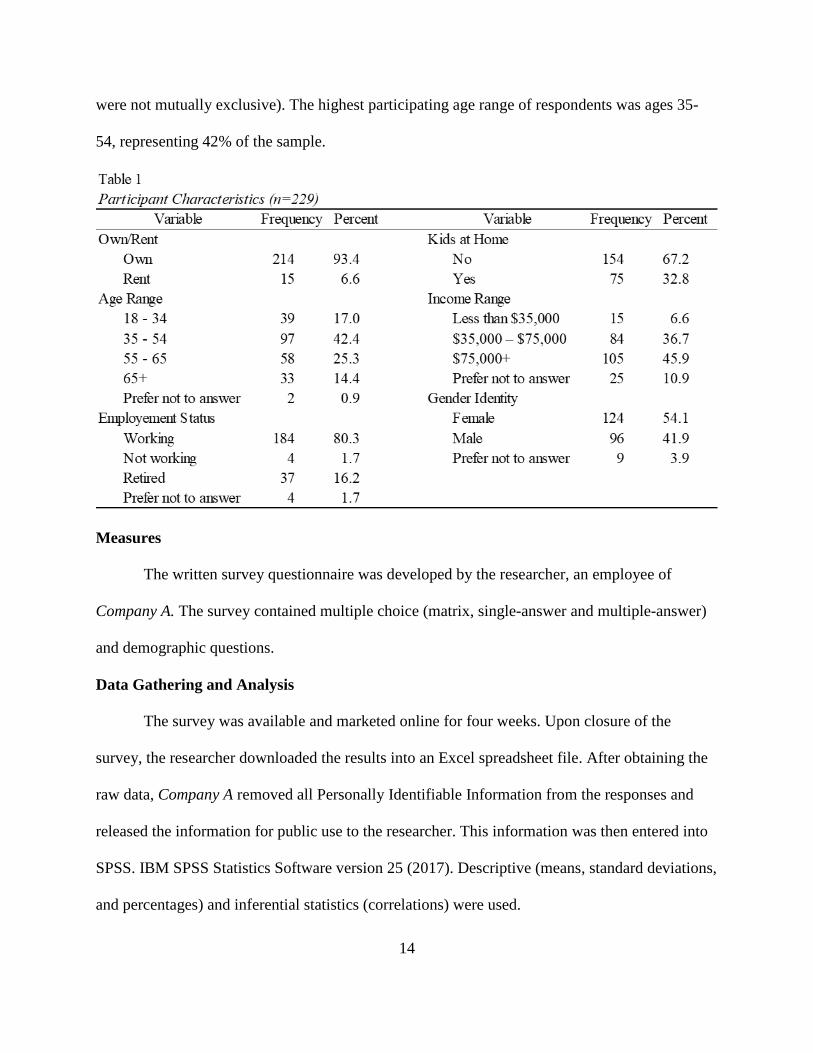
were not mutually exclusive). The highest participating age range of respondents was ages 35-
54, representing 42% of the sample.
Measures
The written survey questionnaire was developed by the researcher, an employee of
Company A. The survey contained multiple choice (matrix, single-answer and multiple-answer)
and demographic questions.
Data Gathering and Analysis
The survey was available and marketed online for four weeks. Upon closure of the
survey, the researcher downloaded the results into an Excel spreadsheet file. After obtaining the
raw data, Company A removed all Personally Identifiable Information from the responses and
released the information for public use to the researcher. This information was then entered into
SPSS. IBM SPSS Statistics Software version 25 (2017). Descriptive (means, standard deviations,
and percentages) and inferential statistics (correlations) were used.
15
Summary
Two hundred twenty nine customers of an electric utility based out of Northeastern
Minnesota participated in the survey. An online survey questionnaire was developed to
determine a correlation between demographic characteristics (age, income, gender identity) and
interest level in electric vehicle ownership at a point in time measurement.
16
Chapter Four
Results and Discussion
First, this chapter will report participant interest in a plug-in electric vehicle by their
demographic characteristics. Then the associations between the interest and environmental
awareness are described.
Participant Interest in a Plug-in Electric Vehicle by Demographic Characteristics
Table 2 shows the results on the participant interests in a plug-in electric vehicle analyzed
by their demographic characteristics.
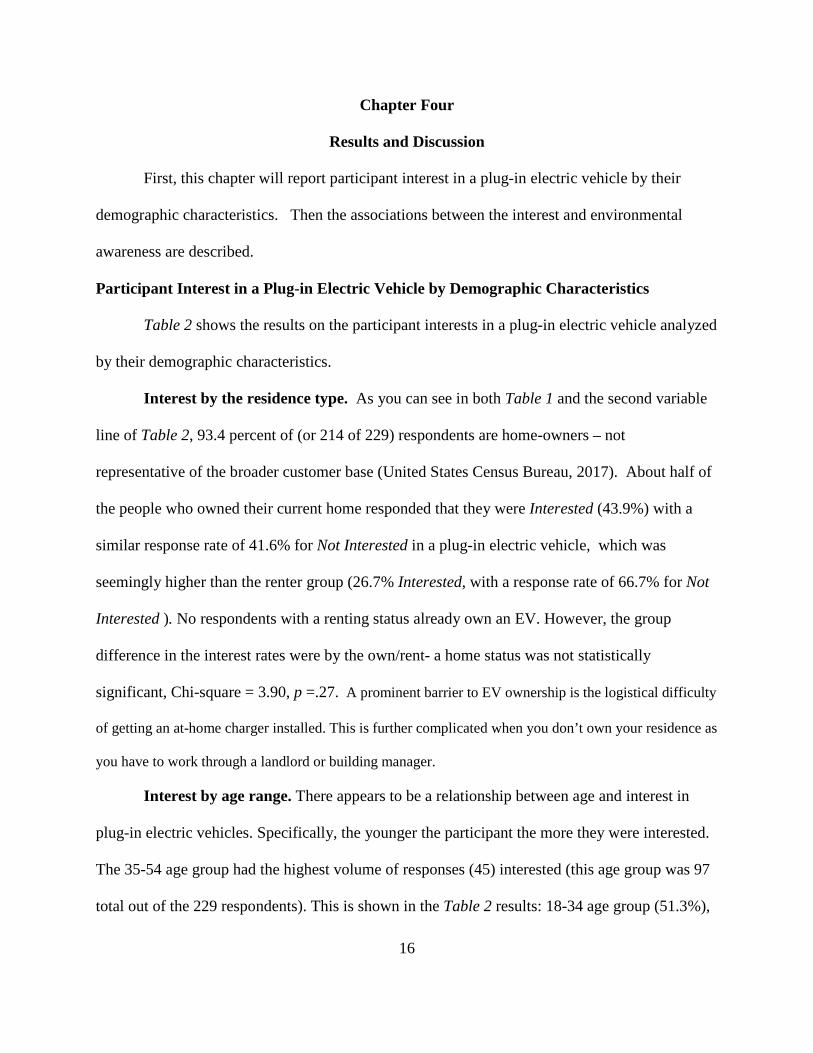
Interest by the residence type. As you can see in both Table 1 and the second variable
line of Table 2, 93.4 percent of (or 214 of 229) respondents are home-owners – not
representative of the broader customer base (United States Census Bureau, 2017). About half of
the people who owned their current home responded that they were Interested (43.9%) with a
similar response rate of 41.6% for Not Interested in a plug-in electric vehicle, which was
seemingly higher than the renter group (26.7% Interested, with a response rate of 66.7% for Not
Interested ). No respondents with a renting status already own an EV. However, the group
difference in the interest rates were by the own/rent- a home status was not statistically
significant, Chi-square = 3.90, p =.27. A prominent barrier to EV ownership is the logistical difficulty
of getting an at-home charger installed. This is further complicated when you don’t own your residence as
you have to work through a landlord or building manager.
Interest by age range. There appears to be a relationship between age and interest in
plug-in electric vehicles. Specifically, the younger the participant the more they were interested.
The 35-54 age group had the highest volume of responses (45) interested (this age group was 97
total out of the 229 respondents). This is shown in the Table 2 results: 18-34 age group (51.3%),
17
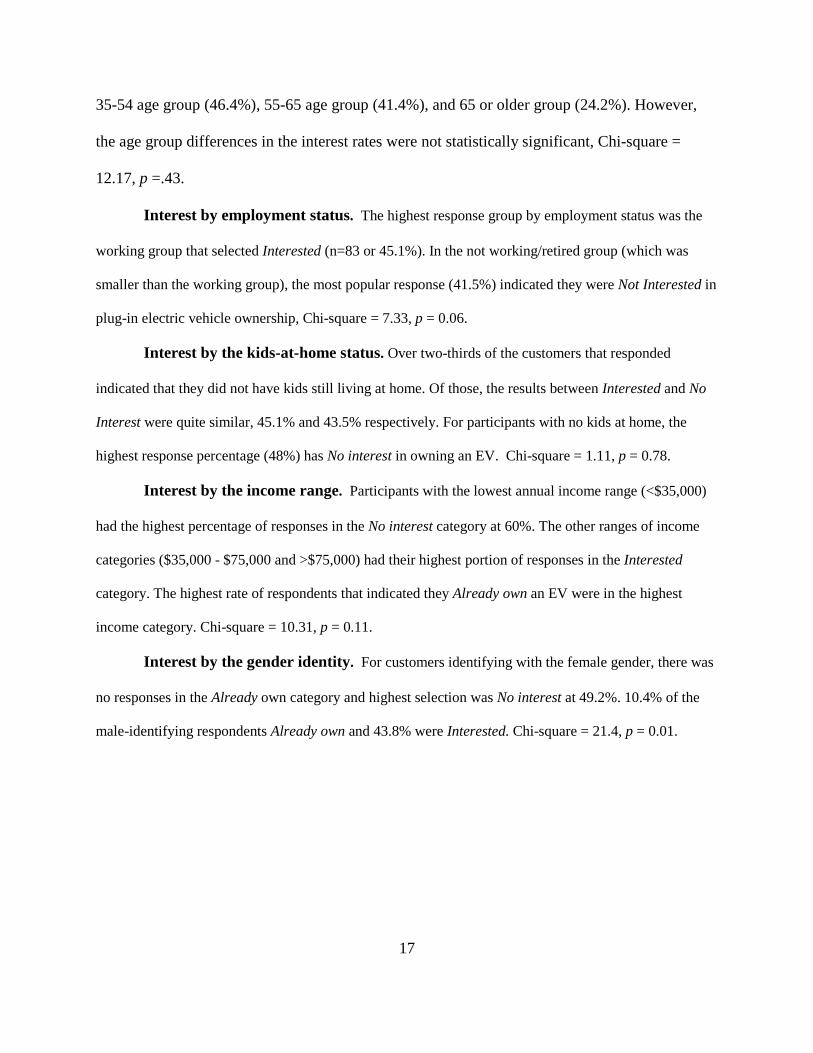
35-54 age group (46.4%), 55-65 age group (41.4%), and 65 or older group (24.2%). However,
the age group differences in the interest rates were not statistically significant, Chi-square =
12.17, p =.43.
Interest by employment status. The highest response group by employment status was the
working group that selected Interested (n=83 or 45.1%). In the not working/retired group (which was
smaller than the working group), the most popular response (41.5%) indicated they were Not Interested in
plug-in electric vehicle ownership, Chi-square = 7.33, p = 0.06.
Interest by the kids-at-home status. Over two-thirds of the customers that responded
indicated that they did not have kids still living at home. Of those, the results between Interested and No
Interest were quite similar, 45.1% and 43.5% respectively. For participants with no kids at home, the
highest response percentage (48%) has No interest in owning an EV. Chi-square = 1.11, p = 0.78.
Interest by the income range. Participants with the lowest annual income range (<$35,000)
had the highest percentage of responses in the No interest category at 60%. The other ranges of income
categories ($35,000 - $75,000 and >$75,000) had their highest portion of responses in the Interested
category. The highest rate of respondents that indicated they Already own an EV were in the highest
income category. Chi-square = 10.31, p = 0.11.
Interest by the gender identity. For customers identifying with the female gender, there was
no responses in the Already own category and highest selection was No interest at 49.2%. 10.4% of the
male-identifying respondents Already own and 43.8% were Interested. Chi-square = 21.4, p = 0.01.
18
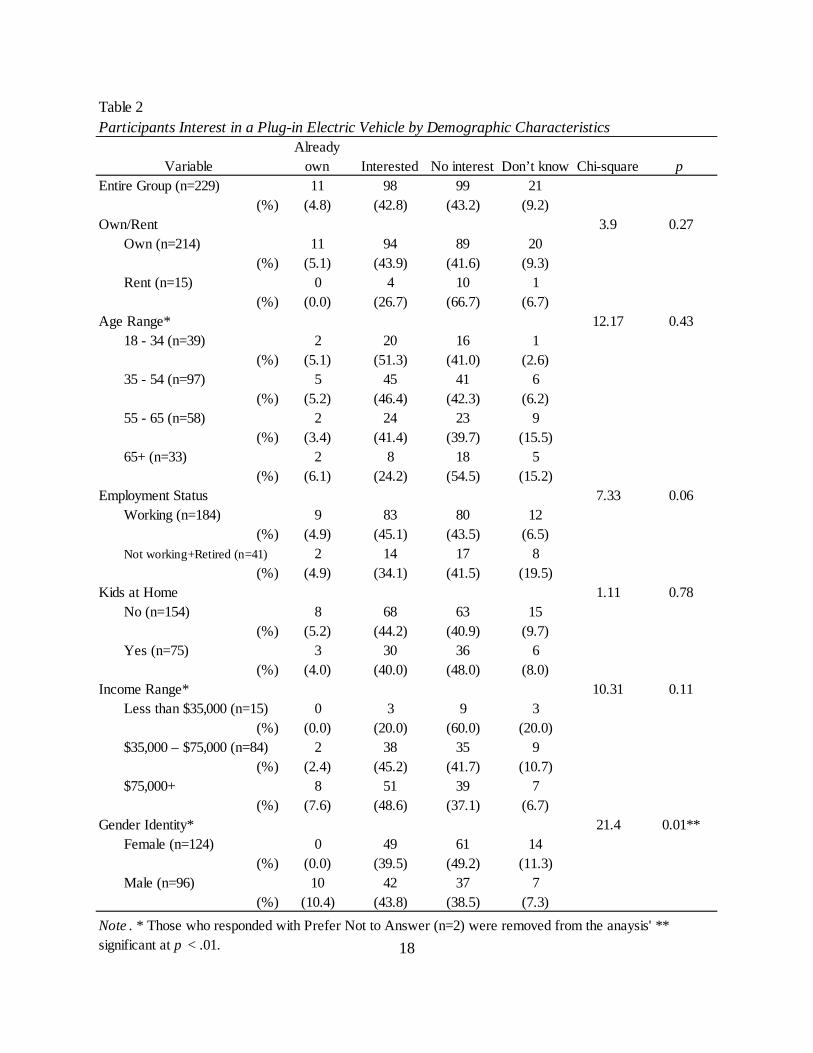
Table 2Participants Interest in a Plug-in Electric Vehicle by Demographic Characteristics
Already own Interested No interest Don’t know Chi-square p
Entire Group (n=229) 11 98 99 21(%) (4.8) (42.8) (43.2) (9.2)
3.9 0.27Own (n=214) 11 94 89 20
(%) (5.1) (43.9) (41.6) (9.3)Rent (n=15) 0 4 10 1
(%) (0.0) (26.7) (66.7) (6.7)Age Range* 12.17 0.43
18 - 34 (n=39) 2 20 16 1(%) (5.1) (51.3) (41.0) (2.6)
35 - 54 (n=97) 5 45 41 6(%) (5.2) (46.4) (42.3) (6.2)
55 - 65 (n=58) 2 24 23 9(%) (3.4) (41.4) (39.7) (15.5)
65+ (n=33) 2 8 18 5(%) (6.1) (24.2) (54.5) (15.2)
Employment Status 7.33 0.06Working (n=184) 9 83 80 12
(%) (4.9) (45.1) (43.5) (6.5)Not working+Retired (n=41) 2 14 17 8
(%) (4.9) (34.1) (41.5) (19.5)Kids at Home 1.11 0.78
No (n=154) 8 68 63 15(%) (5.2) (44.2) (40.9) (9.7)
Yes (n=75) 3 30 36 6(%) (4.0) (40.0) (48.0) (8.0)
Income Range* 10.31 0.11Less than $35,000 (n=15) 0 3 9 3
(%) (0.0) (20.0) (60.0) (20.0)$35,000 – $75,000 (n=84) 2 38 35 9
(%) (2.4) (45.2) (41.7) (10.7)$75,000+ 8 51 39 7
(%) (7.6) (48.6) (37.1) (6.7)Gender Identity* 21.4 0.01**
Female (n=124) 0 49 61 14(%) (0.0) (39.5) (49.2) (11.3)
Male (n=96) 10 42 37 7(%) (10.4) (43.8) (38.5) (7.3)
Variable
Own/Rent
Note . * Those who responded with Prefer Not to Answer (n=2) were removed from the anaysis' ** significant at p < .01.
19
Associations between Interest in a Plug-in Electric Vehicle and Environmental Awareness
Table 3 presents the results on the associations between the interest in an electric vehicle
and environmental awareness. The Interested response rates for those who have taken steps to
lower their electric bill using less electricity on a Daily basis (41.6%) and Often (44.6%) were
very similar to the groups answered Sometimes (42.0% and Never (40.0%), Chi-square = 2.17, p
=.99. Correlation between engagement in energy efficiency and interest in EV adoption was
lacking.
Of customers responding they have “No interest” (n=99), the top identifying statement
they agreed with was “I want to save money” (n=90 or 90.9%), followed by “to help protect our
environment by reducing my energy use” (n=73 or 73.7%). About half of the “No interest”
group, responded that they wanted “to help our environment by using renewable resources such
as wind or solar instead of carbon-emitting resources” (n=45 or 45.5%). Less than half of the
“No interest” group, responded that they wanted “a consistent bill, one that does not change a lot
from month to month or season to season” (n=39 or 39.4%).
Of customers responding they have “No interest” the top identifying statement they
agreed with was “I want to save money”. Electric vehicles were very expensive when they first
were introduced and this perception still carries on today. This is despite the fact that today an
efficient EV will save owners money on energy costs (vs. fuel), and receive financial incentives
upon purchase and have less ongoing maintenance costs (Reichmuth, 2017).
20
Summary
The results generally aligned with the limited research available. No statistical
significance could be drawn between consumer demographics and interest in purchasing EVs.
However, there does appear to be a higher portion or interest and ownership within the
populations that own their homes and have annual incomes above $35,000.
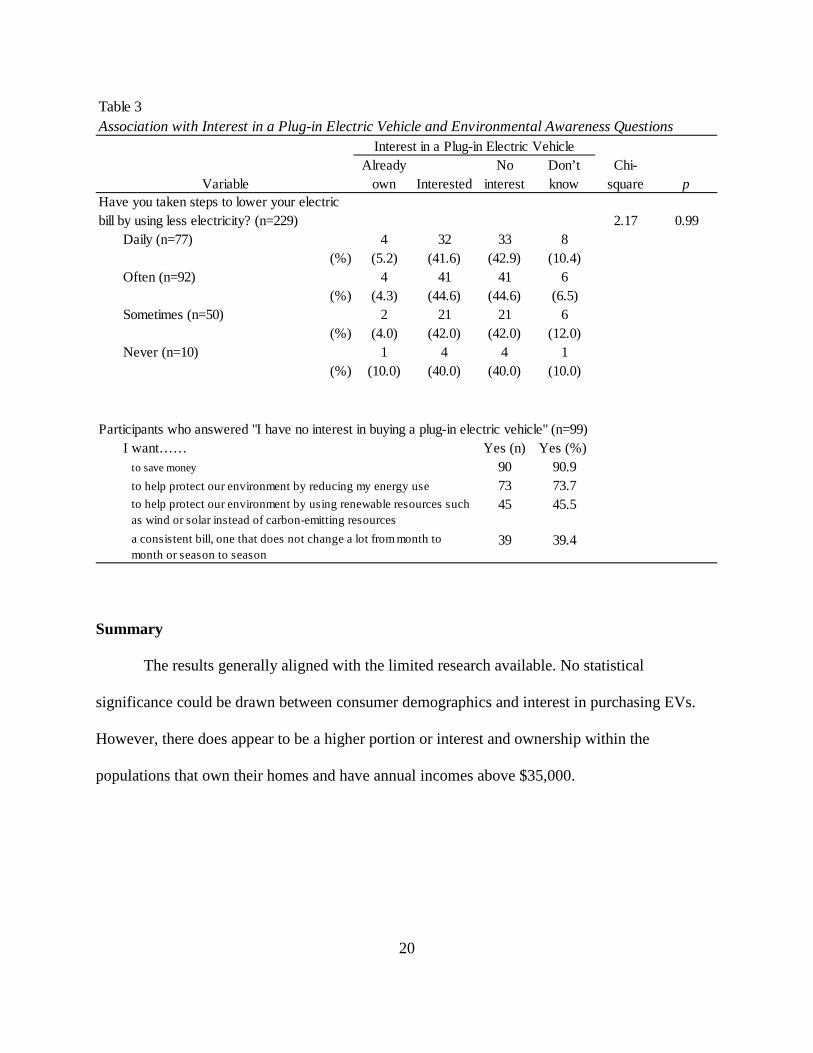
Table 3Association with Interest in a Plug-in Electric Vehicle and Environmental Awareness Questions
Already own Interested
No interest
Don’t know
Chi-square p
2.17 0.99Daily (n=77) 4 32 33 8
(%) (5.2) (41.6) (42.9) (10.4)Often (n=92) 4 41 41 6
(%) (4.3) (44.6) (44.6) (6.5)Sometimes (n=50) 2 21 21 6
(%) (4.0) (42.0) (42.0) (12.0)Never (n=10) 1 4 4 1
(%) (10.0) (40.0) (40.0) (10.0)
I want…… Yes (n) Yes (%) to save money 90 90.9
73 73.745 45.5
39 39.4
to help protect our environment by reducing my energy useto help protect our environment by using renewable resources such as wind or solar instead of carbon-emitting resourcesa consistent bill, one that does not change a lot from month to month or season to season
Variable
Interest in a Plug-in Electric Vehicle
Have you taken steps to lower your electric bill by using less electricity? (n=229)
Participants who answered "I have no interest in buying a plug-in electric vehicle" (n=99)
21
Chapter Five
Summary and Conclusions
Electric vehicles still represent a very small portion of vehicles on the road today. Until
adoption increases it will be difficult to have a statistically representative population to
determine if demographic characteristics are a leading indicator of likelihood to convert to this
re-emerging and technology. Other research suggests that financial incentives play a strong role
and recommend that the United States continue to offer financial incentives to consumers until
adoption rates increase. Availability of public charging infrastructure is also a key theme across
the majority of any research done related to EVs and often referred to as the biggest challenge
with this massive change ahead.
More research should be done across a broader geographical area with a larger sample
size. If further studies also lack a statistical significance, policy-makers could make more well-
informed decisions on how to target consumers through the other correlating indicators. Focus
should then shift to expanding EV charging infrastructure, financial incentives and general
education and outreach to the uninformed population.
Significant Findings
While statistically insignificant, there were varying levels of interest across the
demographic characteristics. Consumers that rent vs. owned showed a lower level of interest in
owning an EV. This is likely due to the fact that there are logistical challenges of establishing
“home charging” facilities when you don’t own the property, or have a way to properly
compensate the landlord for the additional energy used. This is not a well-researched topic and
will be especially important as popularity of condominiums has been on the rise in recent years.
22
Interest by age groups steadily declined as the age group increases. Younger consumers
are more likely to take interest in new technology and be open to new experience so this is no
surprise. Additionally, males and higher income ($75,000+) were the most interested in their
respective demographic categories. The income results are typical and expected as EVs have
historically had a higher upfront cost and therefore purchased by consumers with a higher
income.
Implications
Electrifying transportation will yield significant benefits in the United States and
continuously improve as the country takes further steps to decarbonize electricity generation.
How far and how fast is dependent on the combination of federal and state policy makers, public
and private research, and the automobile industry. Advancing adoption will require education
and outreach to a broad population, different strategies for different segments and an
improvement in the cost/benefit ratio. This could come in the way of increased gas prices
(naturally or through taxation), lowering the purchase price and ownership costs of EVs
(naturally or through tax breaks).
These benefits will be realized when adoption rates increase, gasoline consumption
declines and the nation utilizes the electric grid more efficiently. Results of this study reveal a
small, but noticeable difference in a limited set of participants that indicate different approaches
may be needed. Depending if financial incentives continue, urban areas are targeted first with
public charging stations, or home-owners are found to be the priority, may results in different
results and inform future plans to increase adoption. This transition will not happen fast and is
likely to need a multi-faceted approach.
23
Limitations and Recommendations
This study was limited to a small pool of participants in a somewhat rural area of the
Midwest. These results are not statistically representative of the U.S., or even the region.
Additionally, the researcher had an inherent bias as an employee of Company A, an electric
utility in Northeastern Minnesota. The survey was only conducted online and solicited to a
relatively small subset of customers that have different technology habits and interests when
compared with the entire population.
More quantitative studies should be done on consumers interest in EVs as it relates to
their interest or disinterest in owning an EV. As it related to actionable items to advance
adoptions of electric vehicles, the United States should invest in public EV charging
infrastructure and continue to incentivize the purchase of the cars themselves. While there was
limited confirmation that demographic characteristics necessarily play a role in adoption, both of
those strategies seem well-researched to support further funding.
Conclusion
They say it took over 50 years for the United States to majorly transition from horse and
carriage to automobiles. At that time, three technologies had an almost equal market share:
electric, steam, and internal combustion vehicles. While gasoline has reigned supreme for the last
century there is a growing movement that suggests the quiet, clean, and efficient ride of an
electric vehicle will make its way back to the top in due time. It’s now the leading opportunity
for the United States to reduce its greenhouse gas emissions and limit their contribution to the
future impacts of climate change.
As with all emerging technologies, the “early adopter” population is small. Close
attention will have to be paid to breaking down the barriers of adoption, potentially segment by

24
segment. Until then, broad measures like incentives and investments in public charging should
be increased and the corresponding impacts on adoption examined. After all, technology
solutions for the largest contributors to climate change are currently one of the few positive
outlooks on the horizon for our climate future.
25
References
Bühler, F., Cocron, P., Neumann, I., Franke, T., Josef. F. Krems. (2014). Is EV experience
related to EV acceptance? Results from a German field study. Retrieved from
https://www.tu-
chemnitz.de/hsw/psychologie/professuren/allpsy1/pdf/Buehler_et_al_in%20press_Accept
EV.pdf
Dennis, K. (2015). Environmentally beneficial electrification: Electricity as the end-use option.
The Electricity Journal, 28 (9), 100-112. Retrieved from
http://www.emnrd.state.nm.us/ECMD/documents/Electrification.pdf
Department of Energy. (2014). The history of the electric car. Retrieved from
https://www.energy.gov/articles/history-electric-car
Department of Energy. (n.d.). Electric Vehicle Benefits and Considerations. Retrieved from
https://afdc.energy.gov/fuels/electricity_benefits.html
Department of Energy. (n.d.). Reducing Pollution with Electric Vehicles. Retrieved from
https://www.energy.gov/eere/electricvehicles/reducing-pollution-electric-vehicles
Edison Electric Institute. (2014). Transportation Electrification: Utilities Fleets Leading the
Charge. Retrieved from
http://www.eei.org/issuesandpolicy/electrictransportation/FleetVehicles/Documents/EEI_
UtilityFleetsLeadingTheCharge.pdf
Helveston, J., Liu, Y., McDonnell Feit, E., Fuchs, E., Klampfl, E., Michalek, J. (2015). Will
subsidies drive electric vehicle adoption? Measuring consumer preferences in the U.S.
and China. Retrieved from https://www.cmu.edu/me/ddl/publications/2015-TRA-
Helveston-etal-EVs-in-China-US.pdf
26
Joselow, X. (2018, October 12). The u.s. has 1 million electric vehicles, but does it matter?
Transportation is the largest, fastest-growing contributor to emissions in the country.
Scientific America, Retrieved from https://www.scientificamerican.com/article/the-u-s-
has-1-million-electric-vehicles-but-does-it-matter/
Kane, M. (2018). 1,000,000 plug-in electric cars sold in the U.S. Retrieved from
https://insideevs.com/news/340135/plug-in-electric-cars-sales-in-us-surpass-1-million/
Loveday, S. (2018). Monthly Plug-In EV Sales Scorecard. Retrieved from
https://insideevs.com/monthly-plug-in-sales-scorecard/
Malone, E., Woolf, T., & Goldberg, D. (2018). Updating the Energy Efficiency Cost-
Effectiveness Framework in Minnesota. Retrieved from http://mn.gov/commerce-
stat/pdfs/card-synapse-cost-effectiveness.pdf
MarkLines. (2018). USA - Flash report, sales volume, September 2018. Retrieved from
https://www.marklines.com/en/statistics/flash_sales/salesfig_usa_2018#sep
Menser, P. (n.d.). Charging behavior revealed: Large national studies analyze EV infrastructure
needs. Retrieved from https://inl.gov/article/charging-behavior-revealed-large-national-
studies-analyze-ev-infrastructure-needs/
National Academy of Sciences (2015). Overcoming Barriers to Deployment of Plug-In Electric
Vehicles. Retrieved from https://www.nap.edu/resource/21725/EV_report_brief.pdf
O’Malley, S. (2015). Crashworthiness of electric and hybrid vehicles. Retrieved from
https://www-esv.nhtsa.dot.gov/Proceedings/24/files/24ESV-000318.PDF
Reichmuth, D. (2017). Going from Pump to Plug Adding Up the Savings from Electric Vehicles.
Retrieved from www.ucsusa.org/ev-savings
27
Reichmuth, D. (2018). New data show electric vehicles continue to get cleaners. Retrieved April
27, 2019 from https://blog.ucsusa.org/dave-reichmuth/new-data-show-electric-vehicles-
continue-to-get-cleaner
Rogelj, J., D. Shindell, K. Jiang, S. Fifita, P. Forster, V. Ginzburg, C…. M.V. Vilariño.
(2018). Mitigation Pathways Compatible with 1.5°C in the Context of Sustainable
Development. In V.P, Masson-Delmotte, H.O, Zhai, D. Pörtner, J. Roberts, P.R. Skea, A.
Shukla, …T. Waterfield (eds.) Global Warming of 1.5°C (pp. 93-174). Retrieved from
https://report.ipcc.ch/sr15/pdf/sr15_spm_final.pdf
Slowik, P., Lutsey, N. (2016). Evolution of incentives to sustain the transition to a global electric
fleet. Retrieved from
https://www.theicct.org/sites/default/files/publications/EV%20Evolving%20Incentives_w
hite-paper_ICCT_nov2016.pdf
Transport & Environment. (2018). Roll-out of public EV charging infrastructure in the EU: Is the
chicken and egg dilemma resolved? Retrieved from
https://www.transportenvironment.org/sites/te/files/Charging%20Infrastructure%20Repor
t_September%202018_FINAL.pdf
United States Census Bureau. (2018). 2017 American community survey results. Retrieved from
https://datausa.io/profile/geo/st.-louis-county-mn/#housing
United States Environmental Protection Agency. (n.d.). Sources of greenhouse gas emissions.
Retrieved from https://www.epa.gov/ghgemissions/sources-greenhouse-gas-emissions

28
Appendices
29
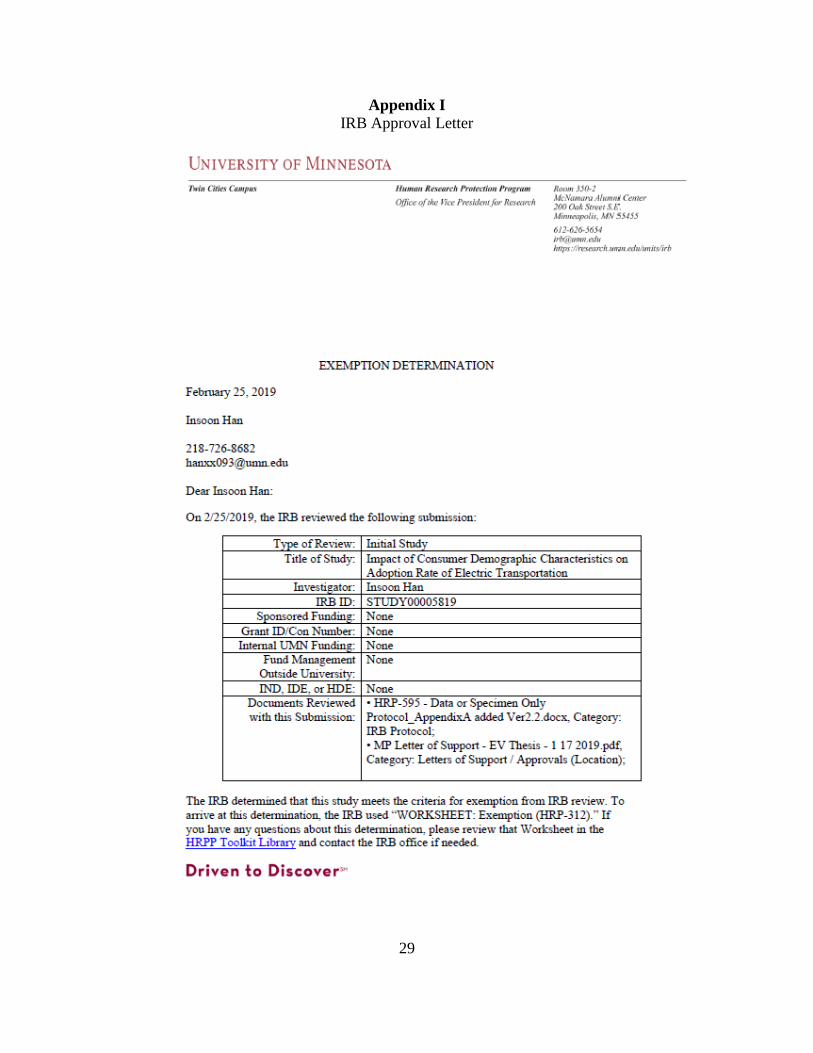
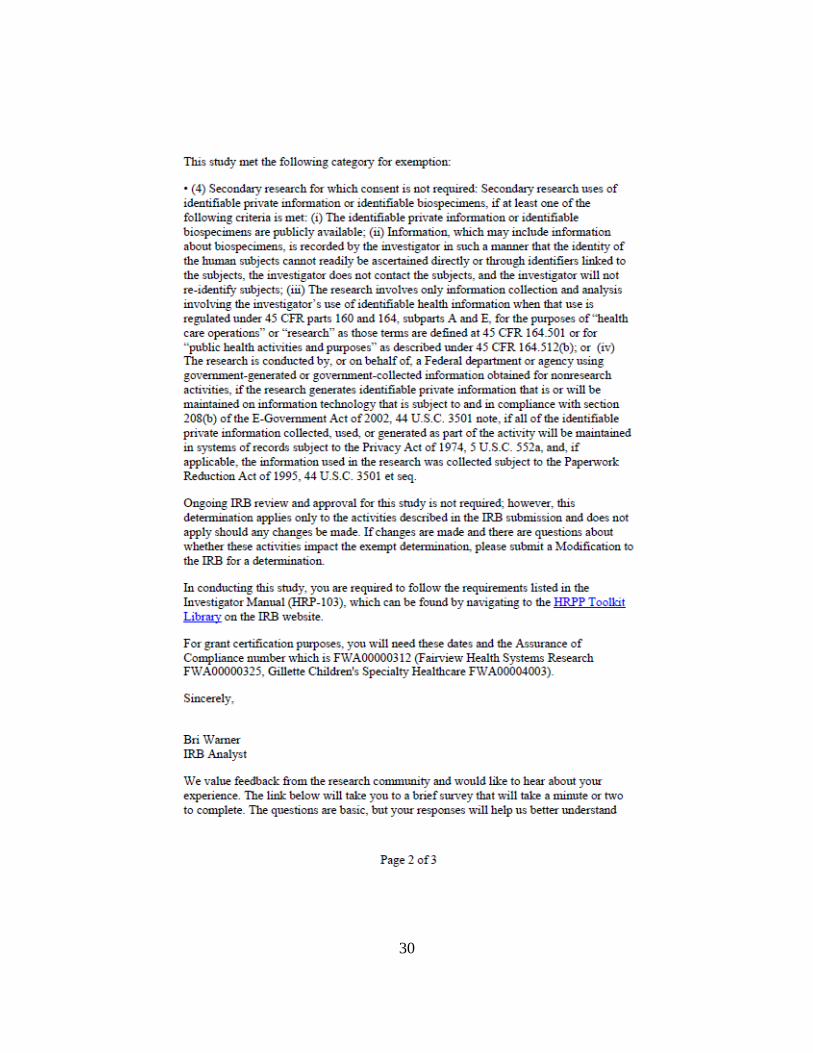
Appendix I IRB Approval Letter
30

31

32
Appendix II
1. What is the address of your primary residence? 2. Do you own or rent your current residence? [IF “RENT”, ASK] Do you pay your own electric
utility bills? • Own • Rent/Yes • Rent/No
3. Which of the following ranges contains your age?
• 18 – 34 • 35 – 54 • 55 – 65 • 65+ • Prefer not to answer
4. Are you currently working, not working or retired?
• Working • Not Working • Retired
5. Do you have pre-school or school-aged children living at home?
• Yes • No
6. Which of the following categories contains your total household income for last year?
• Less than $35,000 • $35,000 - $75,000 • $75,000+
7. Gender
• Male • Female • Prefer not to answer
8. Which of the following statements best describes your interest in a Plug-In Electric Vehicle?
A. I already own a Plug-In Electric Vehicle B. I expect my next car to be a Plug-In Electric Vehicle C. I plan to at least look into buying a Plug-In Electric Vehicle D. I’ve thought about buying a Plug-In Electric Vehicle E. I have no interest in buying a Plug-In Electric Vehicle F. Don’t know
IF ANSWER E
33
• What is the primary reason why you are not interested in an Electric Vehicle? [select all that apply]
i. Cost of purchasing the car ii. Cost of charging
iii. Cost of maintaining the car (battery repair) iv. Leery about the technology v. Concern about the car’s performance in winter/on hills
vi. Lack of public charging in our region vii. Hassle of charging
viii. Waiting for the kinks to get worked out with the technology
YOUR BILL 9. Which of the following statements most closely describes how you handle your monthly electric
bill. (check only one) • I look at the total and pay it • I glance at the different charges before paying the bill • I have auto pay and rarely look at the bill • I thoroughly review my bill to understand changes in my energy use • I use MyAccount to monitor my real-time usage and use that as an estimate to gauge what my
next bill will be 10. Please select all statements that apply to you
• I want to save money • I want to help protect our environment by reducing my energy use • I want to help protect our environment by using renewable resources such as wind or solar
instead of carbon-emitting resources • I want a stable bill; one that does not change a lot from month to month or season to season • I want to reduce stress on the electric system by reducing usage during peak times • I don’t think about my bill or how much electricity I’m using
11. Regarding how your electricity usage impacts the amount you pay on your bill, would you say
that you: • Understand Fairly Well • Are Somewhat Confused - and would like more information • Are Somewhat Confused - and would NOT like more information • Don’t Know
12. What do you think is the average amount of your electric bill each month?
• Between $0--40 • Between $41-80 • Between $81-120 • Between $121-160 • Between $161-200

34
• Over $200 • Don’t Know
13. When you think about the amount of electricity you use every month, do you believe you are using:
• Similar amounts as others on average • A little more than others on average • A lot more than others on average • A little less than others on average • A lot less than others on average
14. In the past 12 months, how often did you receive an electric bill that was higher than you expected?
• Never • Rarely (1-2 bills) • Sometimes (3-4 bills) • Often (5+)
15. In the past, have you taken steps to lower your electric bill by using less electricity?
• Frequently • Often • Sometimes • Never
• If they answered Frequently, Often or Sometime this question should display:
i. Did you notice any reductions in your electric bill after taking these steps? 1. Yes 2. Don’t recall 3. No
16. Which of the following statements best describes your current attitude toward reducing your electric bill?
• Would like to do more to reduce my electric bill and am interested in new ideas • Would do more to reduce my bill but doubtful that further steps would be effective • I have done a lot to save energy in my home and there is little more that can be done • Not sure • Not concerned, little or no interest in reducing my bill
17. Looking ahead five years, how concerned are you about the affordability of electricity?
• Very Concerned • Somewhat Concerned • Not Very Concerned • Not at all Concerned • Don’t Know
TIME-OF-DAY AWARENESS & UNDERSTANDING

35
18. Have you heard of the term “smart grid,” or of the product “smart meters”? Smart Grid refers to new technology and infrastructure that improves customer service and reduces costs by studying how customers use power. Smart meters are advanced versions of household meters that transmit information back to Minnesota Power frequently during the day and are part of the overall smart grid. Smart meters allow Minnesota Power to offer new programs to customers that give them more control over their bill.
• Yes • No • Don’t Know
19. Which of the following energy-related concepts are you familiar with? (select all that apply) • Time-of-Use Rate, Time-of-Day Rate or Time-Varying Rate • Off-Peak or On-Peak • Critical Peak Pricing • Peak Event Day or Peak Time Rebate
20. How interested would you be in a Minnesota Power “Time-of-Day” program that gave you the ability to potentially save money by shifting some of your energy usage to “Off-Peak” times like nights and weekends?
• Very Interested • Somewhat Interested • Neutral • Not Interested • Don't Know
21. How interested would you be in this “Time-of-Day” program if you knew that excessive energy usage during “On-Peak” times - like during the day on weekdays - might result in a higher electricity bill?
• Very Interested • Somewhat Interested • Neutral • Not Interested • Don't Know
22. A “Peak Event” refers to a 3 or 4 hour window when electricity is in extremely high demand and is very expensive. If you were on a “Time-of-Day” program, and Minnesota Power could reward you for reducing your usage during these “Peak Events,” which would you prefer:
• A cash rebate, or • Having the reward built into your monthly bill
23. If you were on the Time-of-Day rate, would you be okay if the On-Peak and Off-Peak periods shifted from season to season (e.g. Winter On-Peak 5 – 9 PM, Summer On-Peak 12 – 4 PM)?
• Yes

36
• Neutral • No
24. If you were on “Time-of-Day” program and Minnesota Power could warn you about an upcoming “Peak Event” and an opportunity to reduce your bill, what would be your preferred method of communication?
• Text • E-mail • Mobile App Notifications • An automated phone call
Recommended