APPENDIXA–PimaCountyHealthStatusCompendiumUpdated:8/12/13
Section1.Demographics 1
PIMA COUNTY HEALTH STATUS COMPENDIUM
SummaryfortheCommunityHealthAssessment
APPENDIXA–PimaCountyHealthStatusCompendiumUpdated:8/12/13
Section1.Demographics 2
Table of Contents Section1.Demographics.......................................................................................................................................................................6
Population.............................................................................................................................................................................................6
AgeDistributionandMedianAge................................................................................................................................................7
RaceandEthnicity..............................................................................................................................................................................8
EducationandLanguage..................................................................................................................................................................9
Economy...............................................................................................................................................................................................10
Section2.MortalityData....................................................................................................................................................................13
Age‐AdjustedLeadingCauseofDeath.....................................................................................................................................13
Age‐SpecificLeadingCauseofDeath........................................................................................................................................14
Cancer....................................................................................................................................................................................................18
HeartDiseaseandStroke..............................................................................................................................................................21
RespiratoryDisease.........................................................................................................................................................................22
InjuryandViolence..........................................................................................................................................................................23
Section3.MorbidityData...................................................................................................................................................................28
DiabetesandObesity.......................................................................................................................................................................28
Asthma..................................................................................................................................................................................................30
Cancer....................................................................................................................................................................................................31
Section4.HealthRiskBehaviors.....................................................................................................................................................33
PhysicalActivity................................................................................................................................................................................33
SexualBehavior.................................................................................................................................................................................34
SubstanceAbuse...............................................................................................................................................................................35
TobaccoUse........................................................................................................................................................................................39
BehavioralHealthServices...........................................................................................................................................................41
DentalHealthandHygiene...........................................................................................................................................................42
PreventiveHealthServices...........................................................................................................................................................43
Section5.CommunicableDiseases................................................................................................................................................45
HepatitisA...........................................................................................................................................................................................45
Meningococcal...................................................................................................................................................................................46
Tuberculosis.......................................................................................................................................................................................47
HIV/AIDS..............................................................................................................................................................................................48
ChildhoodVaccinations..................................................................................................................................................................49
Section6.MaternalandChildHealth............................................................................................................................................51
APPENDIXA–PimaCountyHealthStatusCompendiumUpdated:8/12/13
Section1.Demographics 3
PregnancyandPrenatalCare......................................................................................................................................................51
Births.....................................................................................................................................................................................................54
FetalandInfantMortality.............................................................................................................................................................57
Section7.IssuesRelatedtoAging..................................................................................................................................................60
SocialCharacteristics......................................................................................................................................................................61
Disabilityix............................................................................................................................................................................................61
LeadingCausesofDeath................................................................................................................................................................61
Alzheimer’sdisease.........................................................................................................................................................................62
Accidents(Falls)................................................................................................................................................................................63
Suicide...................................................................................................................................................................................................64
Section8.AccesstoCare....................................................................................................................................................................66
InsuranceCoverage.........................................................................................................................................................................66
TransportationScore......................................................................................................................................................................67
UrgentCareandEDUsage............................................................................................................................................................68
ProvidertoPopulation...................................................................................................................................................................69
References................................................................................................................................................................................................70
APPENDIXA–PimaCountyHealthStatusCompendiumUpdated:8/12/13
Section1.Demographics 4
Methodology:
Datainthisreportwerecompiledfromavarietyofpublicallyavailableresourcesincluding:theArizonaHealthStatusandVitalStatisticsReportfromtheArizonaDepartmentofHealthServices(ADHS),theBehavioralRiskFactorSurveillanceSystem(BRFFS)andYouthRiskBehaviorSurveillanceSystem(YRBSS)reportsfromtheCentersforDiseaseControlandPrevention(CDC),theArizonaYouthSurveyfromtheArizonaCriminalJusticeCommission,andtheU.S.CensusBureau.Dataformapswereobtainedfromthe2011PimaCountyStatisticalProfilesofPrimaryCareAreas.PreliminarydataforthechildhoodvaccineexemptionwereobtainedinternallyfromthePimaCountyHealthDepartment(PCHD).Ifavailable,datawerecompiledtoassessfortrendsinPimaCountyoverafiveyearperiod.PimaCountydatawerecomparedtoArizonadataandHealthyPeople2010and2020goals.Themostcurrentdataavailablewereusedinthisreport.

APPENDIXA–PimaCountyHealthStatusCompendiumUpdated:8/12/13
Section1.Demographics 5
SECTION 1. DEMOGRAPHICS
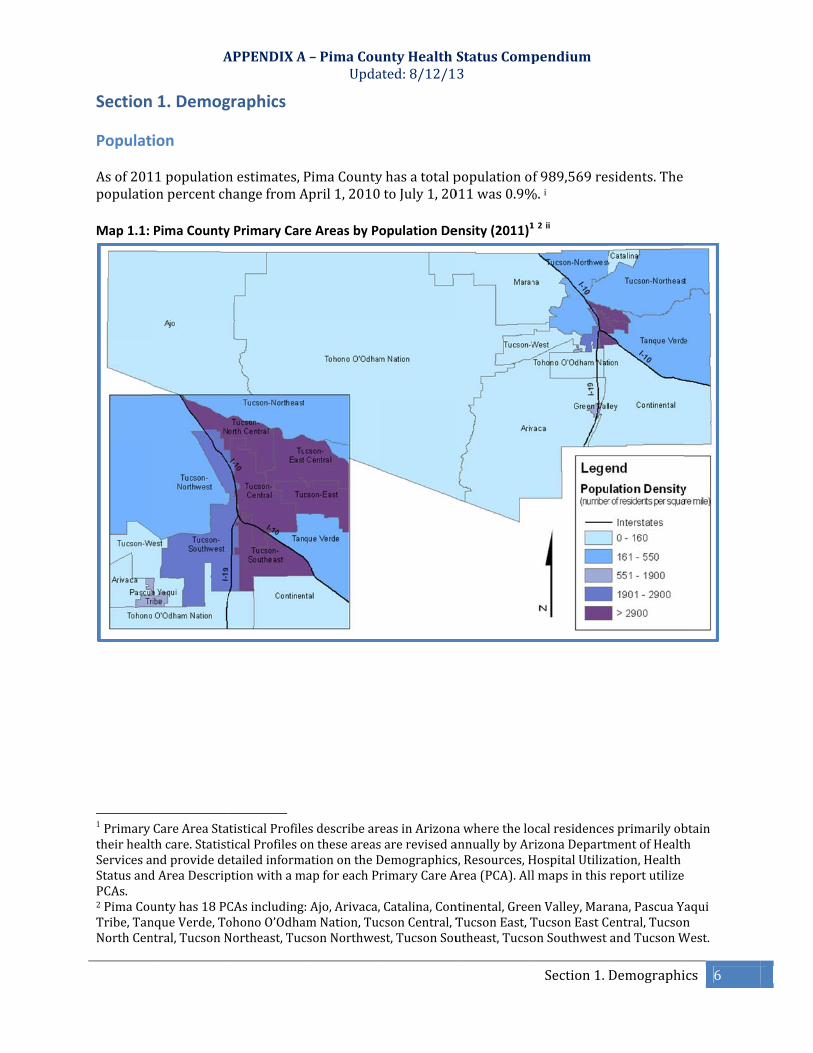
SectionPopulatAsof201populatioMap 1.1:
1 PrimarytheirhealtServicesaStatusandPCAs. 2PimaCouTribe,TanNorthCen
A
1. Demog
ion
11populationonpercentch
Pima County
CareAreaStathcare.StatistndprovidededAreaDescrip
untyhas18PCnqueVerde,Tontral,TucsonN
APPENDIXA
graphics
nestimates,PhangefromA
y Primary Car
atisticalProfileticalProfilesoetailedinformptionwitham
CAsincludingohonoO’OdhaNortheast,Tuc
A–PimaCouUpda
PimaCountyApril1,2010
re Areas by Po
esdescribearontheseareasationontheD
mapforeachPr
:Ajo,Arivaca,amNation,TuccsonNorthwe
untyHealthated:8/12/1
yhasatotalptoJuly1,20
opulation De
easinArizonasarerevisedaDemographicsrimaryCareA
Catalina,ConcsonCentral,Tst,TucsonSou
StatusComp3
populationo011was0.9%
ensity (2011)1
awheretheloannuallybyArs,Resources,HArea(PCA).All
ntinental,GreeTucsonEast,Tutheast,Tucso
pendium
Section1.
f989,569re%.i
1 2 ii
ocalresidencerizonaDepartmHospitalUtilizlmapsinthis
enValley,MarTucsonEastConSouthwest
Demographi
sidents.The
sprimarilyobmentofHealthation,Healthreportutilize
ana,PascuaYentral,TucsonandTucsonW
ics 6
btainh
aquinWest.

APPENDIXA–PimaCountyHealthStatusCompendiumUpdated:8/12/13
Section1.Demographics 7
Age Distribution and Median Age Graph 1.2: Pima County Population by Age Distribution (2011)i
MedianAge:i
ThemedianageofthetotalpopulationofPimaCountyis37.7years.
Themedianageofthemalepopulationis36.2years.
Themedianageofthefemalepopulationis39.1years.
0
1
2
3
4
5
6
7
8
9
Percentage of the overall population
Age in Years

APPENDIXA–PimaCountyHealthStatusCompendiumUpdated:8/12/13
Section1.Demographics 8
Race and Ethnicity Graph 1.3: Pima County Population by Race (2011)i
Graph 1.4: Pima County Population by Ethnicity (2011)i
74.3%
3.5%
3.3%
2.6%0.2%
3.7%12.4%
White
Black or African American
American Indian and AlaskaNativeAsian
Native Hawaiian and OtherPacific IslanderTwo or More Races
Other
34.6%
65.4%
Hispanic or Latino
Not Hispanic or Latino

APPENDIXA–PimaCountyHealthStatusCompendiumUpdated:8/12/13
Section1.Demographics 9
Education and Language Graph 1.5: Pima County Population (25 years and older) by Educational Attainment (2011)i
Language:i
28.3%ofPimaCountyresidentsspeakanotherlanguageotherthanEnglishathome.
5%ofPimaCountyhouseholdsarelinguisticallyisolated,meaningthateveryhouseholdmemberaged14andolderhassomedifficultyspeakingEnglish.
5.4%
7.7%
23.3%
26.1%
8.1%
17.4%
12.1%
Less than 9th grade
9th to 12th grade, no diploma
High school graduate (includesequivalency)
Some college, no degree
Associate's degree
Bachelor's degree
Graduate or professional degree

EconomMap 1.6:
Map 1.7:
A
my
Pima County
Pima County
APPENDIXA
y Primary Car
y Primary Car
A–PimaCouUpda
re Areas by Po
re Areas by Po
untyHealthated:8/12/1
opulation Be
opulation Be
StatusComp3
low 100% of
low 200% of
pendium
Section1.
Poverty (201
Poverty (201
Demographi
11)ii
11)ii
ics 10

Map 1.8:
Map 1.9:
A
Pima County(2011)ii
Pima County
APPENDIXA
y Primary Car
y Primary Car
A–PimaCouUpda
re Areas by Pe
re Areas by Pe
untyHealthated:8/12/1
ercent of Chi
ercent of Une
StatusComp3
ldren under 1
employment
pendium
Section1.
12 Years of A
(2011)ii
Demographi
Age in Poverty
ics 11
y

APPENDIXA–PimaCountyHealthStatusCompendiumUpdated:8/12/13
Section1.Demographics 12
SECTION 2: MORTALITY DATA
APPENDIXA–PimaCountyHealthStatusCompendiumUpdated:8/12/13
Section2.MortalityData 13
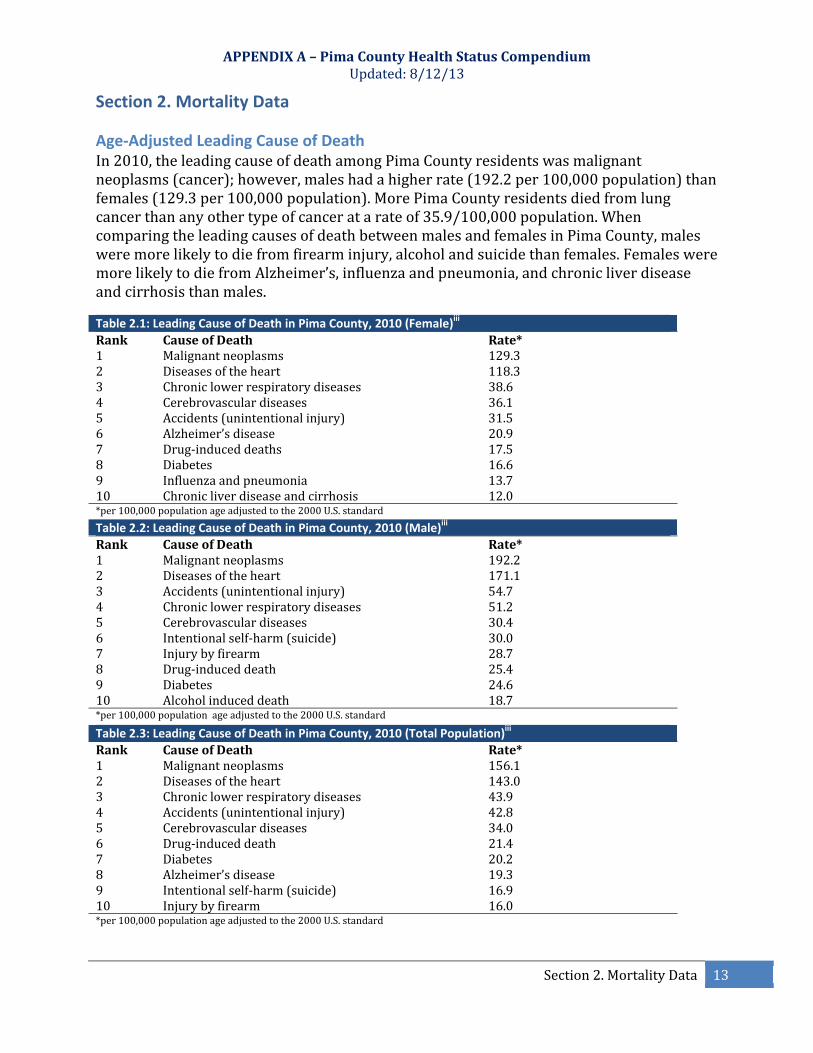
Section 2. Mortality Data Age‐Adjusted Leading Cause of Death In2010,theleadingcauseofdeathamongPimaCountyresidentswasmalignantneoplasms(cancer);however,maleshadahigherrate(192.2per100,000population)thanfemales(129.3per100,000population).MorePimaCountyresidentsdiedfromlungcancerthananyothertypeofcanceratarateof35.9/100,000population.WhencomparingtheleadingcausesofdeathbetweenmalesandfemalesinPimaCounty,malesweremorelikelytodiefromfirearminjury,alcoholandsuicidethanfemales.FemalesweremorelikelytodiefromAlzheimer’s,influenzaandpneumonia,andchronicliverdiseaseandcirrhosisthanmales.
Table 2.1: Leading Cause of Death in Pima County, 2010 (Female)iii
Rank CauseofDeath Rate*1 Malignantneoplasms 129.32 Diseasesoftheheart 118.33 Chroniclowerrespiratorydiseases 38.64 Cerebrovasculardiseases 36.15 Accidents(unintentionalinjury) 31.56 Alzheimer’sdisease 20.97 Drug‐induceddeaths 17.58 Diabetes 16.69 Influenzaandpneumonia 13.710 Chronicliverdiseaseandcirrhosis 12.0*per100,000populationageadjustedtothe2000U.S.standard
Table 2.2: Leading Cause of Death in Pima County, 2010 (Male)iii
Rank CauseofDeath Rate*1 Malignantneoplasms 192.22 Diseasesoftheheart 171.13 Accidents(unintentionalinjury) 54.74 Chroniclowerrespiratorydiseases 51.25 Cerebrovasculardiseases 30.46 Intentionalself‐harm(suicide) 30.07 Injurybyfirearm 28.78 Drug‐induceddeath 25.49 Diabetes 24.610 Alcoholinduceddeath 18.7*per100,000populationageadjustedtothe2000U.S.standard
Table 2.3: Leading Cause of Death in Pima County, 2010 (Total Population)iii
Rank CauseofDeath Rate*1 Malignantneoplasms 156.12 Diseasesoftheheart 143.03 Chroniclowerrespiratorydiseases 43.94 Accidents(unintentionalinjury) 42.85 Cerebrovasculardiseases 34.06 Drug‐induceddeath 21.47 Diabetes 20.28 Alzheimer’sdisease 19.39 Intentionalself‐harm(suicide) 16.910 Injurybyfirearm 16.0*per100,000populationageadjustedtothe2000U.S.standard

Age‐Spe Map 2.4: Map 2.5:
A
ecific Leadin
Pima County
Pima County
APPENDIXA
ng Cause of
y Primary Car
y Primary Car
A–PimaCouUpda
f Death
re Areas by In
re Areas by Ch
untyHealthated:8/12/1
nfant Mortali
hild Mortality
StatusComp3
ty, Age less t
y, Age 1‐14 (2
Insufficient data
pendium
Section2.
than 1 year (2
2002‐2011)ii
a/Data not available
MortalityDa
2002‐2011)ii
ata 14
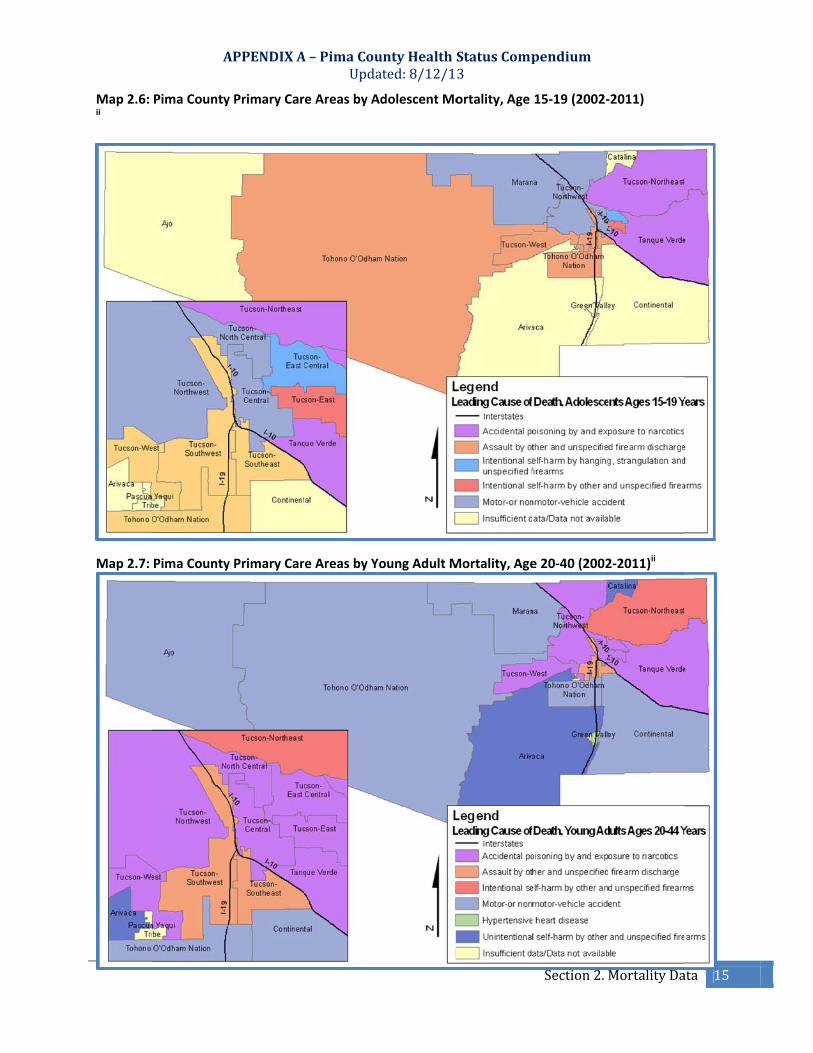
Map 2.6: ii
Map 2.7:
A
Pima County
Pima County
APPENDIXA
y Primary Car
y Primary Car
A–PimaCouUpda
re Areas by A
re Areas by Yo
untyHealthated:8/12/1
dolescent Mo
oung Adult M
StatusComp3
ortality, Age
Mortality, Age
pendium
Section2.
15‐19 (2002‐
e 20‐40 (2002
MortalityDa
‐2011)
2‐2011)ii
ata 15

Map 2.8: Map 2.9:
A
Pima County
Pima County
APPENDIXA
y Primary Car
y Primary Car
A–PimaCouUpda
re Areas by M
re Areas by El
untyHealthated:8/12/1
Mid Age Mort
lderly Mortal
StatusComp3
ality, Age 45‐
lity, Age 65‐8
pendium
Section2.
‐64 (2002‐20
84 (2002‐2011
MortalityDa
11)ii
1)ii
ata 16

Map 2.10
A
0: Pima Count
APPENDIXA
ty Primary Ca
A–PimaCouUpda
are Areas by E
untyHealthated:8/12/1
Elderly Morta
StatusComp3
ality, Older th
pendium
Section2.
han 85 years
MortalityDa
old (2002‐20
ata 17
011)ii
APPENDIXA–PimaCountyHealthStatusCompendiumUpdated:8/12/13
Section2.MortalityData 18
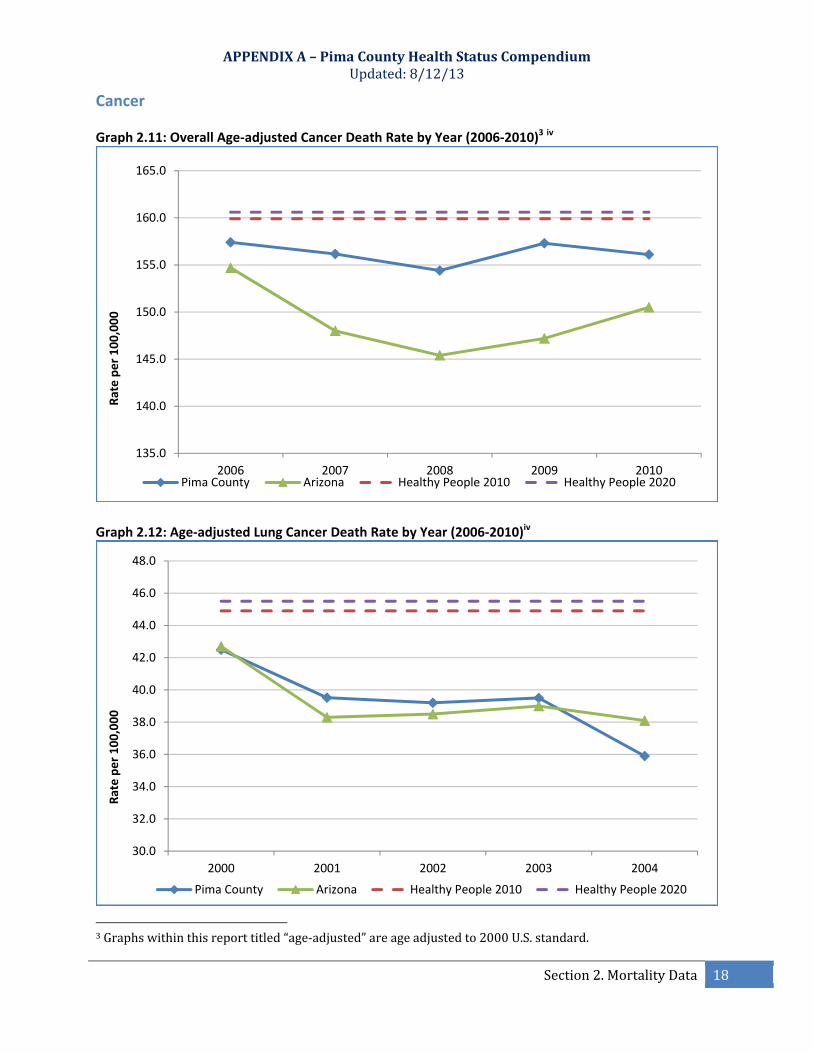
Cancer Graph 2.11: Overall Age‐adjusted Cancer Death Rate by Year (2006‐2010)3 iv
Graph 2.12: Age‐adjusted Lung Cancer Death Rate by Year (2006‐2010)iv
3Graphswithinthisreporttitled“age‐adjusted”areageadjustedto2000U.S.standard.
135.0
140.0
145.0
150.0
155.0
160.0
165.0
2006 2007 2008 2009 2010
Rate per 100,000
Pima County Arizona Healthy People 2010 Healthy People 2020
30.0
32.0
34.0
36.0
38.0
40.0
42.0
44.0
46.0
48.0
2000 2001 2002 2003 2004
Rate per 100,000
Pima County Arizona Healthy People 2010 Healthy People 2020

APPENDIXA–PimaCountyHealthStatusCompendiumUpdated:8/12/13
Section2.MortalityData 19
Graph 2.13: Age‐adjusted Breast Cancer Death Rate by Year (2006‐2010)iv
Graph 2.14: Age‐adjusted Colorectal Cancer Death Rate by Year (2006‐2010)iv
15.0
16.0
17.0
18.0
19.0
20.0
21.0
22.0
23.0
24.0
25.0
2006 2007 2008 2009 2010
Rate per 100,000
Pima County Arizona Healthy People 2010 Healthy People 2020
10.0
11.0
12.0
13.0
14.0
15.0
16.0
2006 2007 2008 2009 2010
Rate per 100,000
Pima County Arizona Healthy People 2010 Healthy People 2020

APPENDIXA–PimaCountyHealthStatusCompendiumUpdated:8/12/13
Section2.MortalityData 20
Graph 2.15: Age‐adjusted Prostate Cancer Death Rate by Year (2006‐2010)iv
Graph 2.16: Age‐adjusted Cervical Cancer Death Rate by Year (2007‐2011)x
10.0
12.0
14.0
16.0
18.0
20.0
22.0
24.0
26.0
28.0
30.0
2006 2007 2008 2009 2010
Rate per 100,000
Pima County Arizona Healthy People 2010 Healthy People 2020
2007 2008 2009 2010 2011
Pima County 2.1 1.3 1.8 2.4 2.1
Arizona 1.9 1.8 1.8 2 2.1
Healthy People 2010 2 2 2 2 2
Healthy People 2020 2.2 2.2 2.2 2.2 2.2
0
0.5
1
1.5
2
2.5
3
Rate per 100,000 females

APPENDIXA–PimaCountyHealthStatusCompendiumUpdated:8/12/13
Section2.MortalityData 21
Heart Disease and Stroke Graph 2.16: Age‐adjusted Coronary Heart Disease Death Rate by Year (2006‐2010)iv
Graph 2.17: Age‐adjusted Stroke Death Rate by Year (2006‐2010)iv
0.0
20.0
40.0
60.0
80.0
100.0
120.0
140.0
160.0
180.0
2006 2007 2008 2009 2010
Rate per 100,000
Pima County Arizona Healthy People 2010 Healthy People 2020
0.0
10.0
20.0
30.0
40.0
50.0
60.0
2006 2007 2008 2009 2010
Rate per 100,000
Pima County Arizona Healthy People 2010 Healthy People 2020
APPENDIXA–PimaCountyHealthStatusCompendiumUpdated:8/12/13
Section2.MortalityData 22
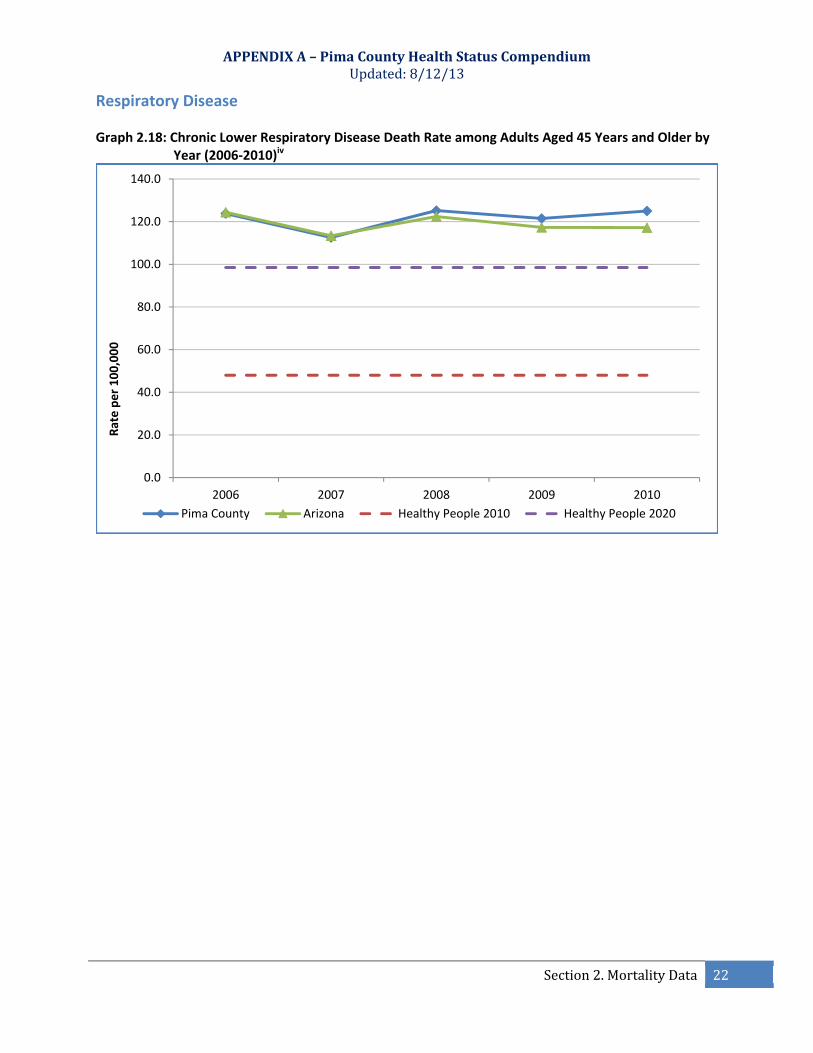
Respiratory Disease Graph 2.18: Chronic Lower Respiratory Disease Death Rate among Adults Aged 45 Years and Older by
Year (2006‐2010)iv
0.0
20.0
40.0
60.0
80.0
100.0
120.0
140.0
2006 2007 2008 2009 2010
Rate per 100,000
Pima County Arizona Healthy People 2010 Healthy People 2020

APPENDIXA–PimaCountyHealthStatusCompendiumUpdated:8/12/13
Section2.MortalityData 23
Injury and Violence Graph 2.19: Age‐adjusted Firearm‐related Death Rate by Year (2006‐2010)iv
Graph 2.20: Age‐adjusted Unintentional Injury Death Rate by Year (2006‐2010)iv
0.0
2.0
4.0
6.0
8.0
10.0
12.0
14.0
16.0
18.0
2006 2007 2008 2009 2010
Rate per 100,000
Pima County Arizona Healthy People 2010 Healthy People 2020
0.0
10.0
20.0
30.0
40.0
50.0
60.0
2006 2007 2008 2009 2010
Rate per 100,000
Pima County Arizona Healhy People 2010 Healthy People 2020

APPENDIXA–PimaCountyHealthStatusCompendiumUpdated:8/12/13
Section2.MortalityData 24
Graph: 2.21: Age‐adjusted Motor Vehicle Death Rate by Year (2006‐2010)iv
Graph 2.22: Age‐adjusted Homicide Rate by Year (2006‐2010)iv
0.0
5.0
10.0
15.0
20.0
25.0
2006 2007 2008 2009 2010
Rate per 100,000
Pima County Arizona Healthy Arizona 2010 Healthy People 2020
0.0
2.0
4.0
6.0
8.0
10.0
12.0
2006 2007 2008 2009 2010
Rate per 100,000
Pima County Arizona Healthy Arizona 2010 Healthy People 2020

APPENDIXA–PimaCountyHealthStatusCompendiumUpdated:8/12/13
Section2.MortalityData 25
Graph 2.23: Age‐Adjusted Suicide Rate by Year (2006‐2010)iv
Graph 2.24: Suicide Rate among Adolescents Aged 15 to 19 Years by Year (2006‐2010)iv
0.0
2.0
4.0
6.0
8.0
10.0
12.0
14.0
16.0
18.0
2006 2007 2008 2009 2010
Rate per 100,000
Pima County Arizona Healthy Arizona 2010 Healthy People 2020
0.0
2.0
4.0
6.0
8.0
10.0
12.0
14.0
2006 2007 2008 2009 2010
Rate per 100,000
Pima County Arizona Healthy Arizona 2010 Healthy People 2020

APPENDIXA–PimaCountyHealthStatusCompendiumUpdated:8/12/13
Section2.MortalityData 26
Diabetes Graph 2.25: Age‐adjusted Diabetes‐related Death Rate by Year (2006‐2010)iv
0.0
10.0
20.0
30.0
40.0
50.0
60.0
70.0
80.0
90.0
100.0
2006 2007 2008 2009 2010
Rate per 100,000
Pima County Arizona Healthy People 2010 Healthy People 2020
APPENDIXA–PimaCountyHealthStatusCompendiumUpdated:8/12/13
Section2.MortalityData 27
SECTION 3: MORBIDITY DATA

APPENDIXA–PimaCountyHealthStatusCompendiumUpdated:8/12/13
Section3.MorbidityData 28
Section 3. Morbidity Data Diabetes and Obesity Graph 3.1: Rate of Inpatient Discharges with Diabetes as first‐listed Diagnosis by Year (2006‐2010)iv
Graph 3.2: Percent of Overweight Adults by Year (2006‐2010)v
10.0
11.0
12.0
13.0
14.0
15.0
16.0
17.0
18.0
19.0
20.0
2006 2007 2008 2009 2010
# of discharges per 10,000 population
Pima County Arizona
0
5
10
15
20
25
30
35
40
45
2006 2007 2008 2009 2010
% Overw
eight (bmi 25.0‐29.9)
Pima County Arizona
APPENDIXA–PimaCountyHealthStatusCompendiumUpdated:8/12/13
Section3.MorbidityData 29
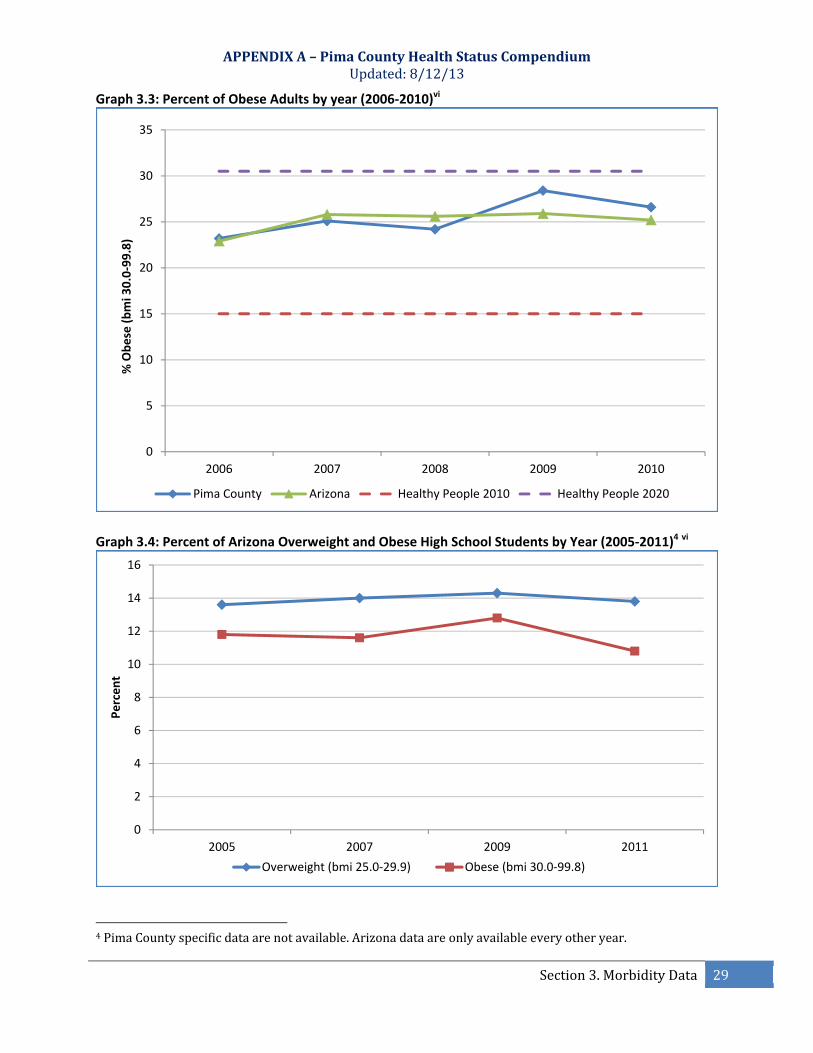
Graph 3.3: Percent of Obese Adults by year (2006‐2010)vi
Graph 3.4: Percent of Arizona Overweight and Obese High School Students by Year (2005‐2011)4 vi
4PimaCountyspecificdataarenotavailable.Arizonadataareonlyavailableeveryotheryear.
0
5
10
15
20
25
30
35
2006 2007 2008 2009 2010
% Obese (bmi 30.0‐99.8)
Pima County Arizona Healthy People 2010 Healthy People 2020
0
2
4
6
8
10
12
14
16
2005 2007 2009 2011
Percent
Overweight (bmi 25.0‐29.9) Obese (bmi 30.0‐99.8)
APPENDIXA–PimaCountyHealthStatusCompendiumUpdated:8/12/13
Section3.MorbidityData 30
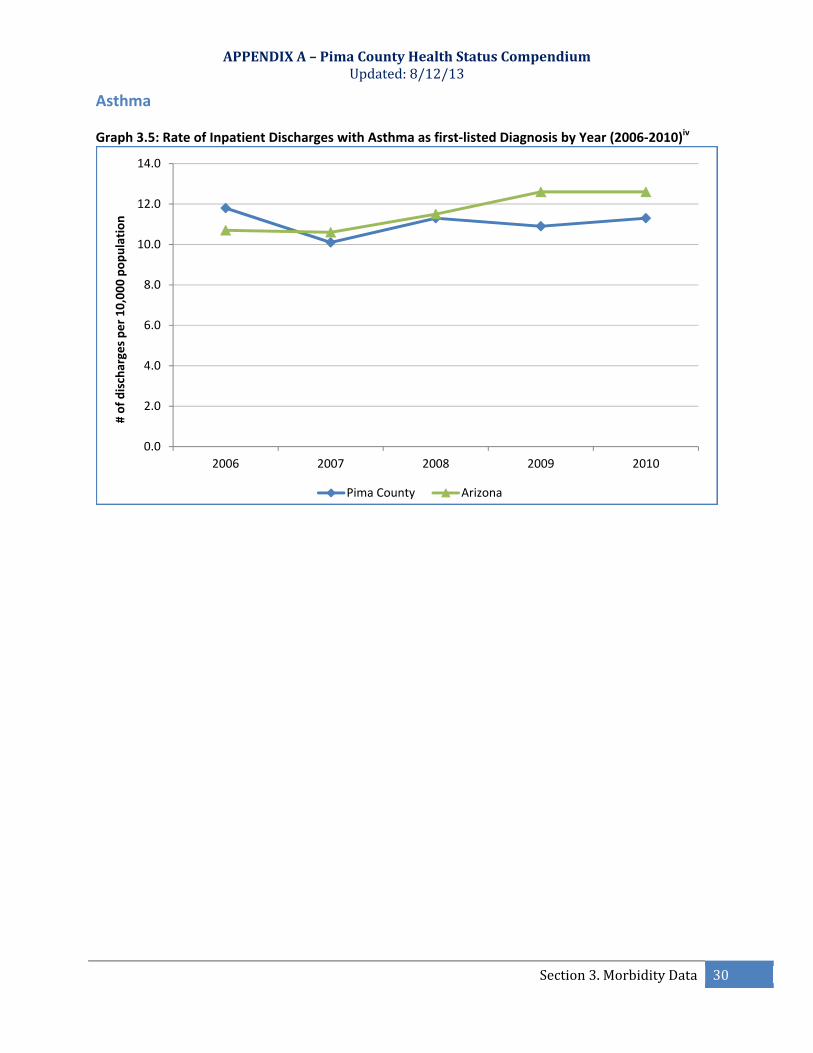
Asthma Graph 3.5: Rate of Inpatient Discharges with Asthma as first‐listed Diagnosis by Year (2006‐2010)iv
0.0
2.0
4.0
6.0
8.0
10.0
12.0
14.0
2006 2007 2008 2009 2010
# of discharges per 10,000 population
Pima County Arizona
APPENDIXA–PimaCountyHealthStatusCompendiumUpdated:8/12/13
Section3.MorbidityData 31
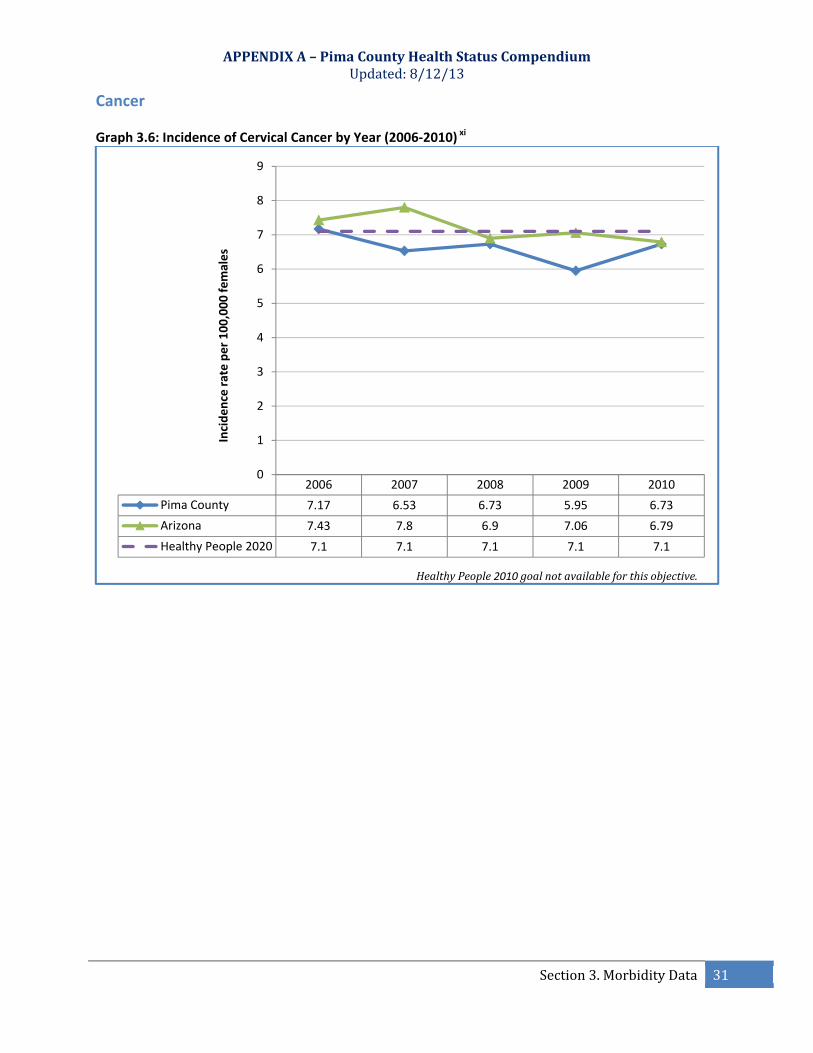
Cancer Graph 3.6: Incidence of Cervical Cancer by Year (2006‐2010) xi
2006 2007 2008 2009 2010
Pima County 7.17 6.53 6.73 5.95 6.73
Arizona 7.43 7.8 6.9 7.06 6.79
Healthy People 2020 7.1 7.1 7.1 7.1 7.1
0
1
2
3
4
5
6
7
8
9
Incidence rate per 100,000 females
HealthyPeople2010 goal notavailableforthisobjective.

APPENDIXA–PimaCountyHealthStatusCompendiumUpdated:8/12/13
Section3.MorbidityData 32
SECTION 4: HEALTH RISK BEHAVIORS

APPENDIXA–PimaCountyHealthStatusCompendiumUpdated:8/12/13
Section4.HealthRiskBehaviors 33
Section 4. Health Risk Behaviors Physical Activity Graph 4.1: Adults that Participated in Physical Activity (in the past month) by Year v
Graph 4.2: Percent of Arizona High School Students that did not participate in at least 60 minutes of
Physical Activity by Sex by Year (2009‐2011)5 vi
5PimaCountyspecificdataarenotavailable.Arizonadataareonlyavailablefor2009and2011.
74
75
76
77
78
79
80
81
82
2006 2007 2008 2009 2010
Percent
Pima County Arizona
18.8
12.5
17.5
13.2
0
2
4
6
8
10
12
14
16
18
20
2009 2011
Percentage
Female Male

APPENDIXA–PimaCountyHealthStatusCompendiumUpdated:8/12/13
Section4.HealthRiskBehaviors 34
Sexual Behavior Graph 4.3: Rate of Gonorrhea Infection by Year (2006‐2010)iv
Graph 4.4: Incidence of Primary and Secondary Syphilis by Year (2006‐2010)iv
0
50
100
150
200
250
300
2006 2007 2008 2009 2010
Rate per 100,000
Pima County ArizonaHealthy People 2010 Healthy People 2020 (male)Helathy People 2020 (female)
0
1
2
3
4
5
6
7
8
9
2006 2007 2008 2009 2010
Rate per 100,000
Pima County ArizonaHealthy People 2010 Healthy People 2020 (male)Healthy People 2020 (female)

APPENDIXA–PimaCountyHealthStatusCompendiumUpdated:8/12/13
Section4.HealthRiskBehaviors 35
Substance Abuse Graph 4.5: Age‐adjusted Rate of Drug‐induced Deaths by Year (2006‐2010)iv
Graph 4.6: Age‐adjusted Rate of Cirrhosis Deaths by Year (2006‐2010)iv
0.0
5.0
10.0
15.0
20.0
25.0
2006 2007 2008 2009 2010
Rate per 100,000
Pima County Arizona Healthy Arizona 2010 Healthy People 2020
0.0
2.0
4.0
6.0
8.0
10.0
12.0
14.0
16.0
2006 2007 2008 2009 2010
Rate per 100,000
Pima County Arizona Healthy Arizona 2010 Healthy People 2020

APPENDIXA–PimaCountyHealthStatusCompendiumUpdated:8/12/13
Section4.HealthRiskBehaviors 36
Graph 4.7: Percentage of Adults Aged 18 Years and Older who report Binge Drinking in the Last 30 Days by Year (2006‐2010)6 v
Graph 4.8: Percentage of Youth Grades 8, 10, and 12 who report Drinking Alcohol in their Lifetime by
Year (2006‐2012)7 vii
6BingedrinkingisdefinedasmaleshavingfiveormoredrinksononeoccasionandfemaleshavingfourormoredrinksononeoccasionaccordingtotheBehavioralRiskfactorSurveillanceSystem.7Dataareonlyavailableforevennumberedyears.
0
5
10
15
20
25
30
2006 2007 2008 2009 2010
Percentage
Pima County Arizona Healthy People 2010 Healthy People 2020
0
10
20
30
40
50
60
70
80
2006 2008 2010 2012
Percentage
Pima County Arizona

APPENDIXA–PimaCountyHealthStatusCompendiumUpdated:8/12/13
Section4.HealthRiskBehaviors 37
Graph 4.9: Percentage of Youth Grades 8, 10, and 12 who report Binge Drinking in the Past 30 Days by Year (2006‐2012)8 vii
Graph 4.10: Percentage of Youth Grades 8, 10, and 12 indicating Marijuana Use in the Past 30 Days by
Year (2006‐2012)9 vii
8Dataareonlyavailableforevennumberedyears.Bingedrinkingisdefinedasdrinking5ormorealcoholicdrinksinarow.HealthyPeopleindicatorsvaryslightlyfromdataavailableintheArizonaYouthSurvey.HealthyPeopleusestheagesofadolescentsfrom12to17yearsasopposetousinggrades.9Dataareonlyavailableforevennumberedyears.HealthyPeopleindicatorsvaryslightlyfromdataavailableintheArizonaYouthSurvey.HealthyPeopleusestheagesofadolescentsfrom12to17yearsasopposetousinggrades.
0
5
10
15
20
25
30
2006 2008 2010 2012
Percentage
Pima County Arizona Healthy People 2010 Healthy People 2020
0
2
4
6
8
10
12
14
16
18
20
2006 2008 2010 2012
Percentage
Pima County Arizona Healthy People 2010 Healthy People 2020
APPENDIXA–PimaCountyHealthStatusCompendiumUpdated:8/12/13
Section4.HealthRiskBehaviors 38
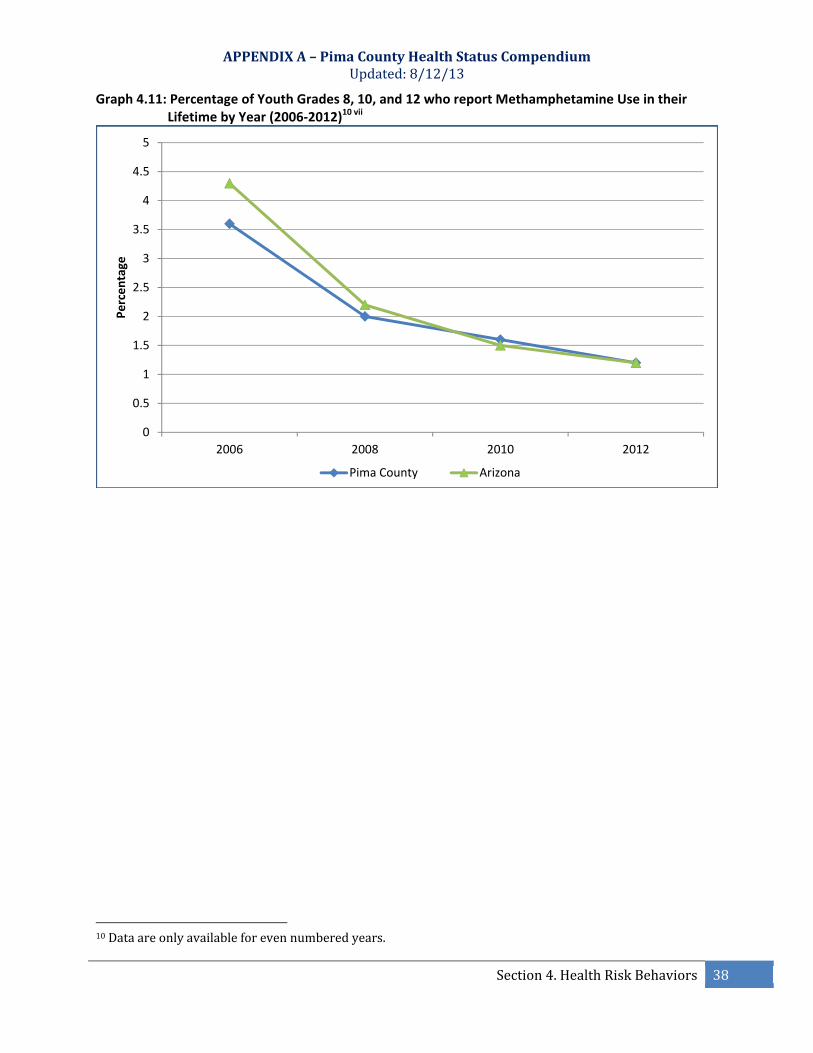
Graph 4.11: Percentage of Youth Grades 8, 10, and 12 who report Methamphetamine Use in their Lifetime by Year (2006‐2012)10 vii
10Dataareonlyavailableforevennumberedyears.
0
0.5
1
1.5
2
2.5
3
3.5
4
4.5
5
2006 2008 2010 2012
Percentage
Pima County Arizona
APPENDIXA–PimaCountyHealthStatusCompendiumUpdated:8/12/13
Section4.HealthRiskBehaviors 39
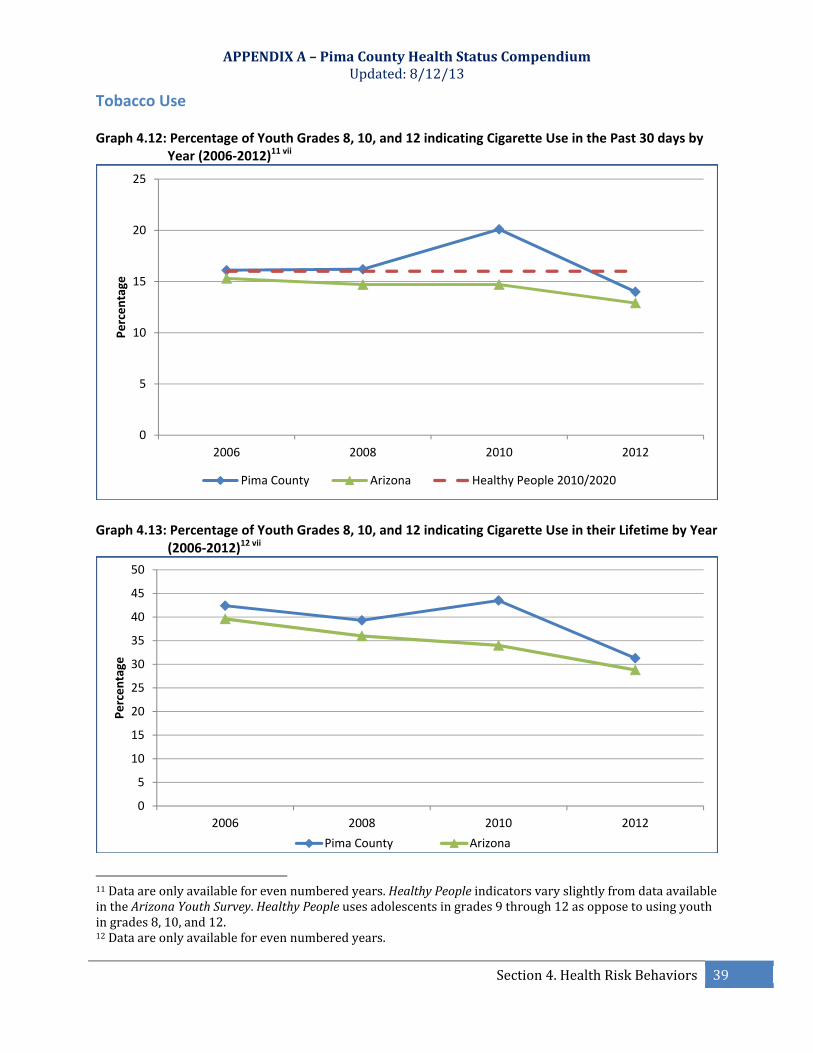
Tobacco Use Graph 4.12: Percentage of Youth Grades 8, 10, and 12 indicating Cigarette Use in the Past 30 days by
Year (2006‐2012)11 vii
Graph 4.13: Percentage of Youth Grades 8, 10, and 12 indicating Cigarette Use in their Lifetime by Year
(2006‐2012)12 vii
11Dataareonlyavailableforevennumberedyears.HealthyPeopleindicatorsvaryslightlyfromdataavailableintheArizonaYouthSurvey.HealthyPeopleusesadolescentsingrades9through12asopposetousingyouthingrades8,10,and12.12Dataareonlyavailableforevennumberedyears.
0
5
10
15
20
25
2006 2008 2010 2012
Percentage
Pima County Arizona Healthy People 2010/2020
0
5
10
15
20
25
30
35
40
45
50
2006 2008 2010 2012
Percentage
Pima County Arizona
APPENDIXA–PimaCountyHealthStatusCompendiumUpdated:8/12/13
Section4.HealthRiskBehaviors 40
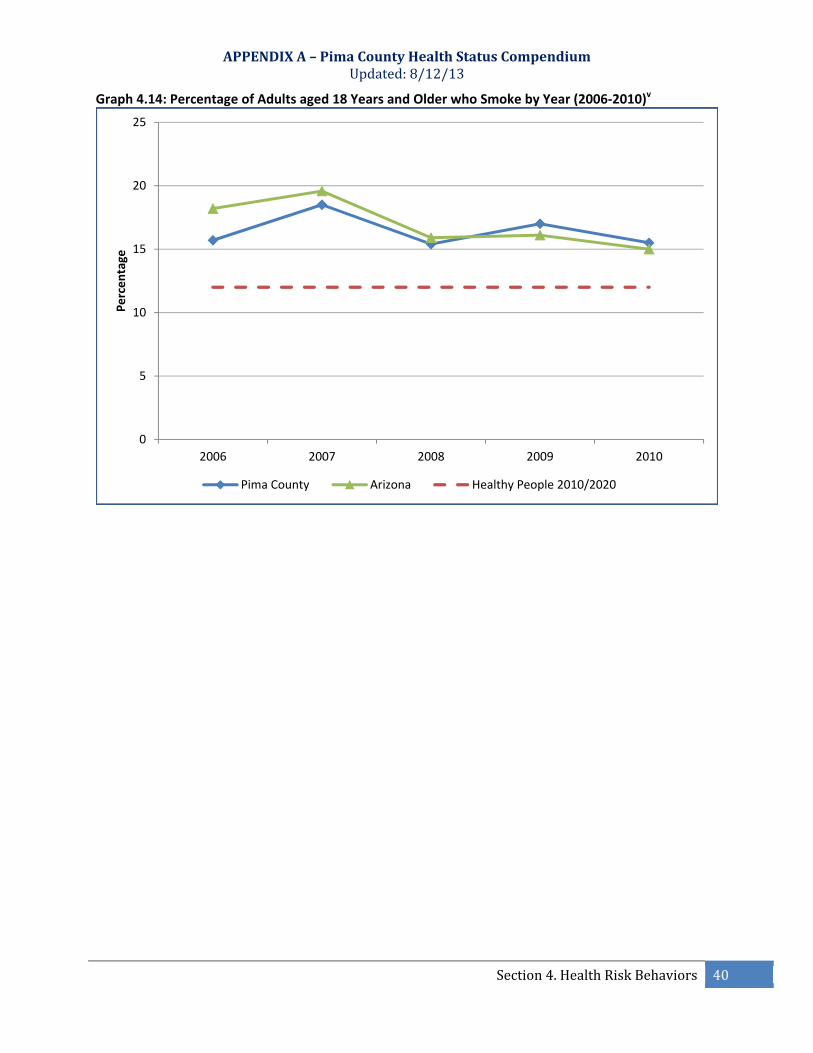
Graph 4.14: Percentage of Adults aged 18 Years and Older who Smoke by Year (2006‐2010)v
0
5
10
15
20
25
2006 2007 2008 2009 2010
Percentage
Pima County Arizona Healthy People 2010/2020
APPENDIXA–PimaCountyHealthStatusCompendiumUpdated:8/12/13
Section4.HealthRiskBehaviors 41
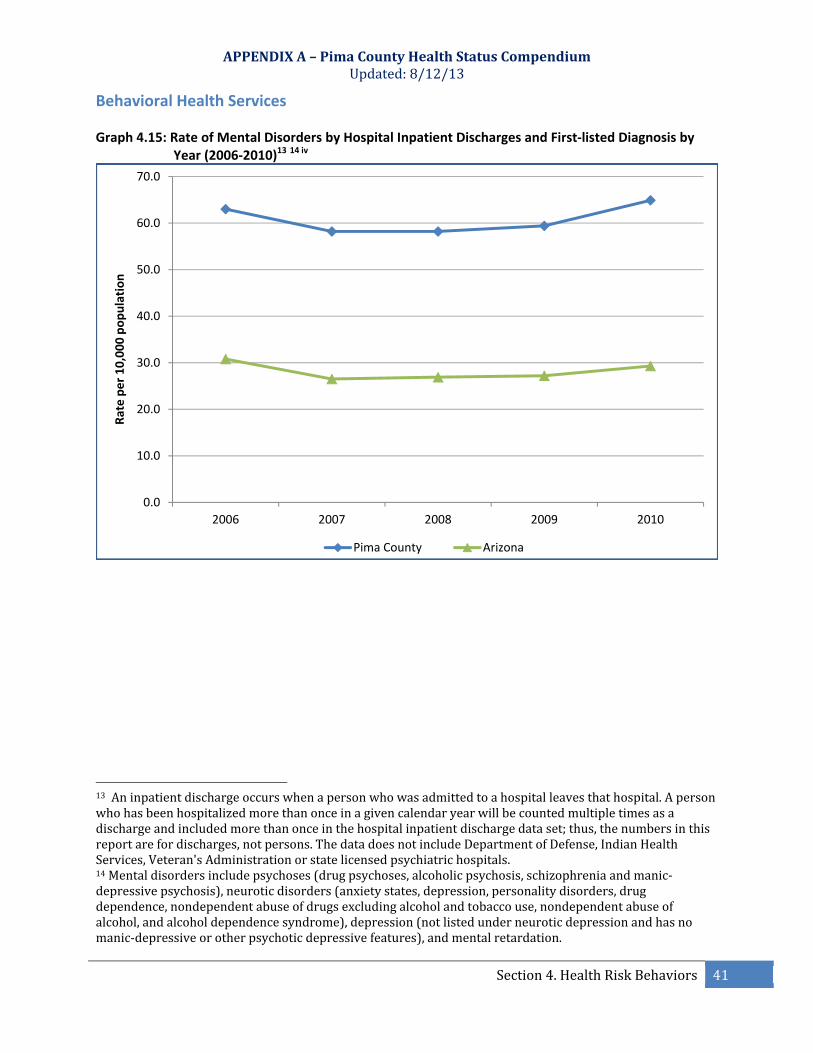
Behavioral Health Services Graph 4.15: Rate of Mental Disorders by Hospital Inpatient Discharges and First‐listed Diagnosis by
Year (2006‐2010)13 14 iv
13Aninpatientdischargeoccurswhenapersonwhowasadmittedtoahospitalleavesthathospital.Apersonwhohasbeenhospitalizedmorethanonceinagivencalendaryearwillbecountedmultipletimesasadischargeandincludedmorethanonceinthehospitalinpatientdischargedataset;thus,thenumbersinthisreportarefordischarges,notpersons.ThedatadoesnotincludeDepartmentofDefense,IndianHealthServices,Veteran'sAdministrationorstatelicensedpsychiatrichospitals.14Mentaldisordersincludepsychoses(drugpsychoses,alcoholicpsychosis,schizophreniaandmanic‐depressivepsychosis),neuroticdisorders(anxietystates,depression,personalitydisorders,drugdependence,nondependentabuseofdrugsexcludingalcoholandtobaccouse,nondependentabuseofalcohol,andalcoholdependencesyndrome),depression(notlistedunderneuroticdepressionandhasnomanic‐depressiveorotherpsychoticdepressivefeatures),andmentalretardation.
0.0
10.0
20.0
30.0
40.0
50.0
60.0
70.0
2006 2007 2008 2009 2010
Rate per 10,000 population
Pima County Arizona

APPENDIXA–PimaCountyHealthStatusCompendiumUpdated:8/12/13
Section4.HealthRiskBehaviors 42
Dental Health and Hygiene Table 4.16: Pima County Third Graders Oral Health Data, 2012viii Tooth Decay
Decay(TreatedandUntreated) 66.0%UntreatedDecay 35.0%TreatedDecay 55.0%
NumberofTeethwithUntreatedDecay 0.9NumberofTeethwithTreatedDecay 2.0Sealants
SealantsPresent 47.0%SealantsNeeded 80.0%Dental Visit
Urgent(needsdentalvisitwithinthenext24hours) 6.0%Early(needsdentalvisitwithinnextseveralweeks) 30.0%
APPENDIXA–PimaCountyHealthStatusCompendiumUpdated:8/12/13
Section4.HealthRiskBehaviors 43
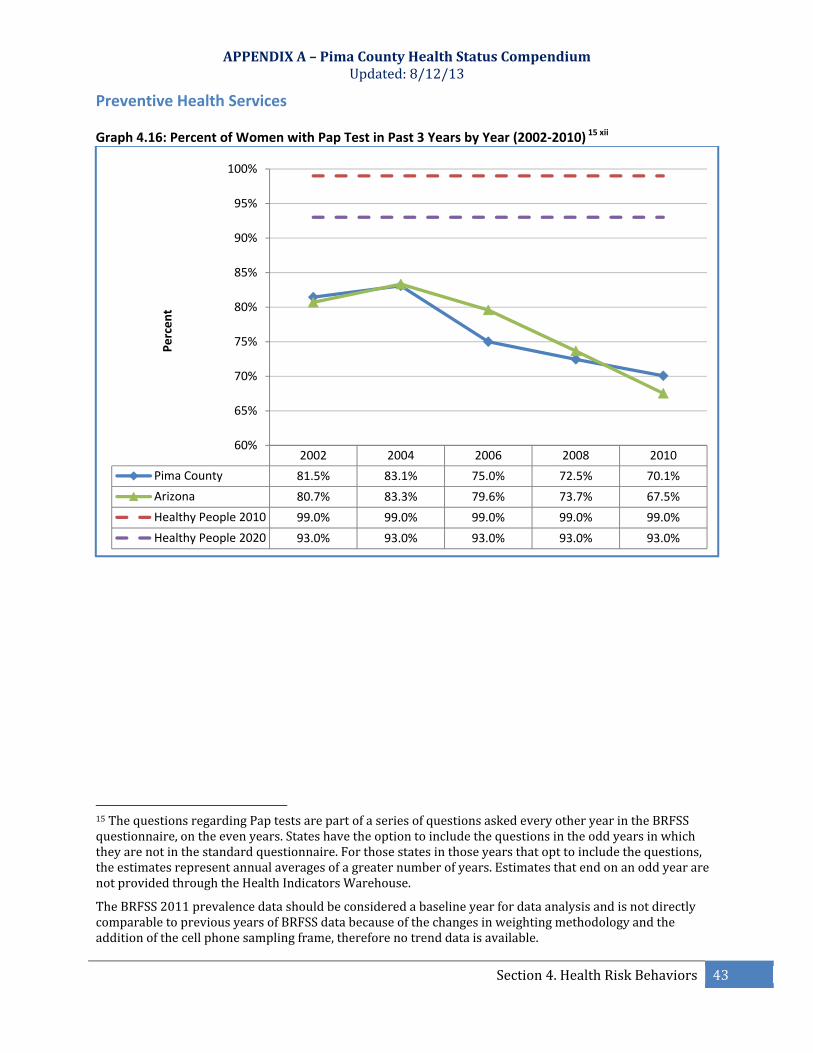
Preventive Health Services Graph 4.16: Percent of Women with Pap Test in Past 3 Years by Year (2002‐2010) 15 xii
15ThequestionsregardingPaptestsarepartofaseriesofquestionsaskedeveryotheryearintheBRFSSquestionnaire,ontheevenyears.Stateshavetheoptiontoincludethequestionsintheoddyearsinwhichtheyarenotinthestandardquestionnaire.Forthosestatesinthoseyearsthatopttoincludethequestions,theestimatesrepresentannualaveragesofagreaternumberofyears.EstimatesthatendonanoddyeararenotprovidedthroughtheHealthIndicatorsWarehouse.
TheBRFSS2011prevalencedatashouldbeconsideredabaselineyearfordataanalysisandisnotdirectlycomparabletopreviousyearsofBRFSSdatabecauseofthechangesinweightingmethodologyandtheadditionofthecellphonesamplingframe,thereforenotrenddataisavailable.
2002 2004 2006 2008 2010
Pima County 81.5% 83.1% 75.0% 72.5% 70.1%
Arizona 80.7% 83.3% 79.6% 73.7% 67.5%
Healthy People 2010 99.0% 99.0% 99.0% 99.0% 99.0%
Healthy People 2020 93.0% 93.0% 93.0% 93.0% 93.0%
60%
65%
70%
75%
80%
85%
90%
95%
100%Percent

APPENDIXA–PimaCountyHealthStatusCompendiumUpdated:8/12/13
Section4.HealthRiskBehaviors 44
SECTION 5. COMMUNICABLE DISEASES

APPENDIXA–PimaCountyHealthStatusCompendiumUpdated:8/12/13
Section5.CommunicableDiseases 45
Section 5. Communicable Diseases Hepatitis A Graph 5.1: Age‐adjusted Rate of Hepatitis A by Year (2006‐2010) iv
0
0.5
1
1.5
2
2.5
3
3.5
4
4.5
5
2006 2007 2008 2009 2010
Rate per 100,000
Pima County Arizona Healthy People 2010 Healthy People 2020

APPENDIXA–PimaCountyHealthStatusCompendiumUpdated:8/12/13
Section5.CommunicableDiseases 46
Meningococcal Graph 5.2: Age‐adjusted Rate of Meningococcal Disease by Year (2006‐2010)iv
0
0.2
0.4
0.6
0.8
1
1.2
2006 2007 2008 2009 2010
Rate per 100,000
Pima County Arizona Healthy People 2010 Healthy People 2020

APPENDIXA–PimaCountyHealthStatusCompendiumUpdated:8/12/13
Section5.CommunicableDiseases 47
Tuberculosis Graph 5.3: Age‐adjusted Rate of Tuberculosis by Year (2006‐2010)iv
0
1
2
3
4
5
6
2006 2007 2008 2009 2010
Rate per 100,000
Pima County Arizona Healthy People 2010/2020

APPENDIXA–PimaCountyHealthStatusCompendiumUpdated:8/12/13
Section5.CommunicableDiseases 48
HIV/AIDS Graph 5.4: Age‐adjusted Rate of HIV Deaths by Year (2006‐2010)iv
Graph 5.5: Age‐adjusted Rate of New AIDS Cases by Yeariv
0
0.5
1
1.5
2
2.5
3
3.5
2006 2007 2008 2009 2010
Rate per 100,000
Pima County Arizona Healthy People 2010 Healthy People 2020
0.0
2.0
4.0
6.0
8.0
10.0
12.0
14.0
2006 2007 2008 2009 2010
Rate per 100,000
Pima County Arizona Healthy People 2010 Healthy People 2020
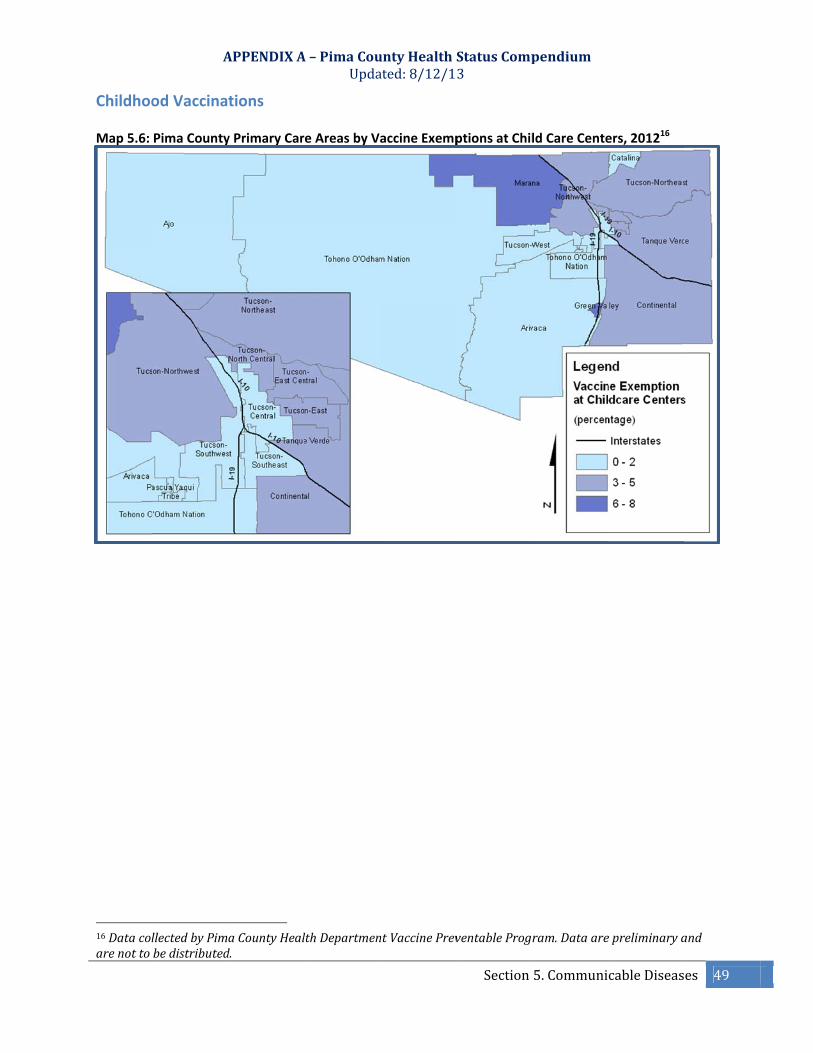
Childhoo Map 5.6:
16Datacolarenotto
A
od Vaccina
Pima County
llectedbyPimbedistributed
APPENDIXA
tions
y Primary Car
aCountyHeald.
A–PimaCouUpda
re Areas by Va
lthDepartmen
untyHealthated:8/12/1
accine Exemp
ntVaccinePrev
StatusComp3
Section
ptions at Chil
ventableProgr
pendium
5.Communi
ld Care Cente
ram.Dataare
cableDiseas
ers, 201216
epreliminarya
es 49
and
APPENDIXA–PimaCountyHealthStatusCompendiumUpdated:8/12/13
Section5.CommunicableDiseases 50
SECTION 6. MATERNAL AND CHILD HEALTH

SectionPregnan Graph 6.1
Map 6.1:
50.
60.
70.
80.
90.
100.
Percentage
A
6. Matern
ncy and Pre
1: Proportion(2006‐2010
Pima CountyCare (2011)ii
0
0
0
0
0
0
200
Pima Cou
APPENDIXA
nal and Ch
enatal Care
of Pregnant 0)iv
y Primary Cari
06
unty A
A–PimaCouUpda
ild Health
Women who
re Areas by Pe
2007
Arizona
untyHealthated:8/12/1
o Receive Pre
ercentage of
2008
Healthy Pe
StatusComp3
Section6.
enatal Care in
Pregnant Wo
20
ople 2010
pendium
Maternalan
n the First Tri
omen who Re
009
Healthy
ndChildHeal
mester by Ye
eceive Prena
2010
People 2020
lth 51
ear
tal

APPENDIXA–PimaCountyHealthStatusCompendiumUpdated:8/12/13
Section6.MaternalandChildHealth 52
Graph 6.2: Abstinence from Cigarette Smoking among Pregnant Women by Year (2006‐2010)iv
Graph 6.3: Pregnancies among Adolescent Females aged 15‐17 Years by Year (2006‐2010)iv
91.0
92.0
93.0
94.0
95.0
96.0
97.0
98.0
99.0
100.0
2006 2007 2008 2009 2010
Percentage
Pima County Arizona Healthy People 2010 Healthy People 2020
0
5
10
15
20
25
30
35
40
45
2006 2007 2008 2009 2010
Per 1,000 females 15‐17 years old
Pima County Arizona Healthy Arizona 2010 Healthy People 2020

Map 6.3:
A
Pima County
APPENDIXA
y Primary Car
A–PimaCouUpda
re Areas by Te
untyHealthated:8/12/1
een Births pe
StatusComp3
er 1,000 Fema
Section6:
pendium
ales 14‐19 Ye
Maternaland
ear Oldsii
dChildHealt53
th
APPENDIXA–PimaCountyHealthStatusCompendiumUpdated:8/12/13
54
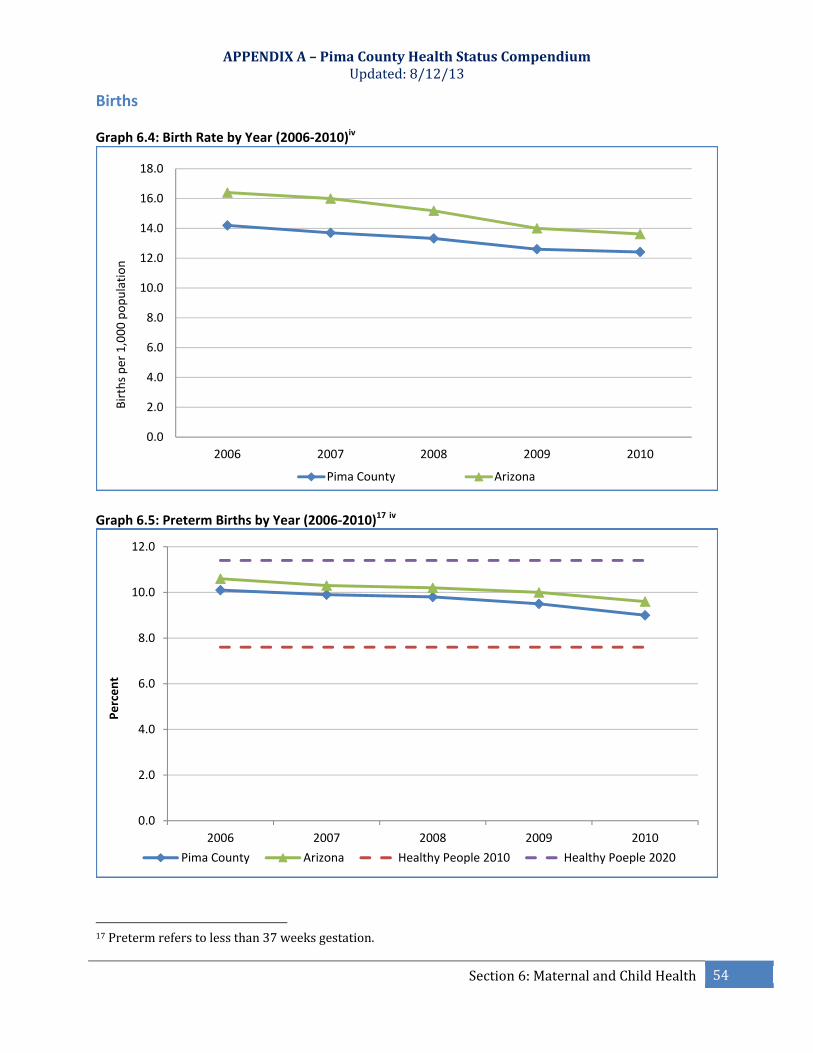
Births Graph 6.4: Birth Rate by Year (2006‐2010)iv
Graph 6.5: Preterm Births by Year (2006‐2010)17 iv
17Pretermreferstolessthan37weeksgestation.
0.0
2.0
4.0
6.0
8.0
10.0
12.0
14.0
16.0
18.0
2006 2007 2008 2009 2010
Births per 1,000 population
Pima County Arizona
0.0
2.0
4.0
6.0
8.0
10.0
12.0
2006 2007 2008 2009 2010
Percent
Pima County Arizona Healthy People 2010 Healthy Poeple 2020
Section6:MaternalandChildHealth

Graph 6.6
Map 6.6:
18LowBir
0.0
1.0
2.0
3.0
4.0
5.0
6.0
7.0
8.0
9.0Percent
A
6: Low Birth W
Pima County
rthWeight(LB
0
0
0
0
0
0
0
0
0
0
200
Pima Cou
APPENDIXA
Weight by Ye
y Primary Car
BW)referstoa
6
unty A
A–PimaCouUpda
ar (2006‐201
re Areas by Lo
anyneonatew
2007
Arizona
untyHealthated:8/12/1
10)18 iv
ow‐Weight B
weighinglesst
2008
Healthy Pe
StatusComp3
irths per 1,00
than2,500gra
20
ople 2010
Section6:
pendium
00 Live Births
amsatbirth.
009
Healthy
Maternalan
s (2011)ii
2010
People 2020
dChildHealt 55
th

APPENDIXA–PimaCountyHealthStatusCompendiumUpdated:8/12/13
56
Graph 6.7: Very Low Birth Weight by Year (2006‐2010)19 iv
19VeryLowBirthWeight(VLBW)referstoanyneonatewhoseweightatbirthis1,500gramsorless.
0.0
0.2
0.4
0.6
0.8
1.0
1.2
1.4
1.6
2006 2007 2008 2009 2010
Percent
Pima County Arizona Healthy People 2010 Healthy People 2020
Section6:MaternalandChildHealth

APPENDIXA–PimaCountyHealthStatusCompendiumUpdated:8/12/13
57
Fetal and Infant Mortality Graph 6.8: Fetal Deaths at 20 or More Weeks of Gestation by Year (2006‐2010)20 iv
Graph 6.9: Fetal and Infant Deaths during the Perinatal Period by Year (2006‐2010)21 iv
20Includesspontaneousandinducedterminationofpregnancyat20ormoreweeksofgestationorifgestationalageisunknown,thedeathsoffetusesofatleast350gramsormore.21Theperinatalperiodis28weeksofgestationto7daysafterbirth.
0.0
1.0
2.0
3.0
4.0
5.0
6.0
7.0
2006 2007 2008 2009 2010
Rate per 1,000 live births
Pima County Arizona Healthy People 2010 Healthy People 2020
0
1
2
3
4
5
6
7
8
2006 2007 2008 2009 2010
Rate per 1,000 live births
Pima County Arizona Healthy People 2010 Healthy People 2020
Section6:MaternalandChildHealth

APPENDIXA–PimaCountyHealthStatusCompendiumUpdated:8/12/13
58
Graph 6.10: Infant Deaths by Year (2006‐2010)22 iv
Graph 6.11: Neonatal Deaths by Year (2006‐2010)23 iv
22Anydeathatanytimefrombirthupto,butnotincluding,thefirstyearofage.23Deathofalivebornneonatebeforetheneonatebecomes28daysold.
0
1
2
3
4
5
6
7
8
2006 2007 2008 2009 2010
Rate per 1,000 live births
Pima County Arizona Healthy Arizona 2010/ Healthy People 2020
0.0
1.0
2.0
3.0
4.0
5.0
6.0
2006 2007 2008 2009 2010
Rate per 1,000 live births
Pima County Arizona Healhty People 2010 Healthy People 2020
Section6:MaternalandChildHealth

APPENDIXA–PimaCountyHealthStatusCompendiumUpdated:8/12/13
59
Graph 6.12: Postneonatal Deaths by Year (2006‐2010)24 iv
24Anydeathofaliveborninfantatleast28daysofagebutlessthanoneyearofage.
0.0
0.5
1.0
1.5
2.0
2.5
3.0
3.5
4.0
4.5
5.0
2006 2007 2008 2009 2010
Rate per 1,000 live births
Pima County Arizona Healthy People 2010 Healthy People 2020
Section6:MaternalandChildHealth

APPENDIXA–PimaCountyHealthStatusCompendiumUpdated:8/12/13
Section7.IssuesRelatedtoAging 60
SECTION 7. ISSUES RELATED TO AGING

APPENDIXA–PimaCountyHealthStatusCompendiumUpdated:8/12/13
Section7.IssuesRelatedtoAging 61
Section 7. Issues Related to Aging Social Characteristicsix
Thepercentageofhouseholdswithoneormoreindividuals65yearsandover:27.9%(Arizona:26.2%)
Thepercentageofgrandparentsresponsiblefortheirgrandchildren:43.2%(Arizona:40.7%)
Disabilityix
Thepercentageofthepopulation65yearsandolderwithadisability:34.6%(Arizona
33.6%)Table 7.1: Percentage of Elderly population (65 Years and Older) with Disabilities by Type ix Disability Type Pima (%) Arizona (%)
Hearingdifficulty 15.9 15.0Visiondifficulty 7.1 6.4Cognitivedifficulty 8.6 8.2Ambulatorydifficulty 22.0 21.3Self‐caredifficulty 7.8 7.0Independentlivingdifficulty 14.7 13.1
Leading Causes of Death Table 7.2 Leading Causes of Death among Elderly (65 Years and Older) in Pima County, 2010iii
Rank Cause of Death Rate*1 Diseaseoftheheart 919.42 Malignantneoplasms 887.03 Chroniclowerrespiratorydiseases 312.04 Alzheimer’sdisease 155.35 Diabetes 109.16 Influenzaandpneumonia 100.57 Accident(unintentionalinjury) 91.28 Parkinson’sdisease 66.19 Nephritis,nephroticsyndromeandnephrosis 64.110 Septicemia 41.6*per100,000elderly65yearsandolder

APPENDIXA–PimaCountyHealthStatusCompendiumUpdated:8/12/13
Section7.IssuesRelatedtoAging 62
Alzheimer’s disease Graph 7.3: Age‐adjusted Rate of Alzheimer’s Deaths by Year (2006‐2010)iv
Graph 7.4: Rate of Alzheimer’s Death among Elderly (65 Years and Older) by Year (2006‐2010)iv
0
5
10
15
20
25
30
35
40
2006 2007 2008 2009 2010
Rate per 100,000 population
Pima County Arizona
0
50
100
150
200
250
300
2006 2007 2008 2009 2010
Rate per 100,000 elderly 65 years an
d older
Pima County Arizona

APPENDIXA–PimaCountyHealthStatusCompendiumUpdated:8/12/13
Section7.IssuesRelatedtoAging 63
Accidents (Falls) Graph 7.5: Age‐adjusted Death Rate from Falls by Year (2006‐2010)iv
0.0
2.0
4.0
6.0
8.0
10.0
12.0
14.0
2006 2007 2008 2009 2010
Rate per 100,000
Pima County Arizona Healthy People 2010 Healhty People 2020

APPENDIXA–PimaCountyHealthStatusCompendiumUpdated:8/12/13
Section7.IssuesRelatedtoAging 64
Suicide Graph 7.6: Suicide Rate among Elderly (65 Years and Older) by Year (2006‐2010)iv
0.0
5.0
10.0
15.0
20.0
25.0
30.0
35.0
2006 2007 2008 2009 2010
Rate per 100,000
Pima County Arizona Healthy Arizona 2010 Healthy People 2020

APPENDIXA–PimaCountyHealthStatusCompendiumUpdated:8/12/13
Section7.IssuesRelatedtoAging 65
SECTION 8. ACCESS TO CARE

APPENDIXA–PimaCountyHealthStatusCompendiumUpdated:8/12/13
Section8.AccesstoCare 66
Section 8. Access to Care Insurance Coverage Graph 8.1: Pima County Adults with Health Insurance, Three‐Year Estimates (2009‐2011)ix
Graph 8.2: Pima County Children (Under 18 Years) with Health Insurance, Three‐Year Estimates
(2009‐2011)ix
60.8%37.3%
14.8%
With private health insurance With public coverage No health insurance coverage
89.3%
10.7%
With health insurance coverage No health insurance coverage

TranspoMap 8.3:
T
T
25Thetranthan100%yearofagepopulationadequateo
A
ortation Sco
Pima County
ransportatio
ransportatio
nsportationsc%ofFPL,perce,percentofpnwithoutaveorgreaterthe
APPENDIXA
ore
y Primary Car
onScoreforP
onScoreforA
coreiscomprientofpopulatpopulationwitehicle,andnoneneedfortran
A–PimaCouUpda
re Areas by Tr
PimaCounty
Arizona:135
isedofthese6tionolderthanthworkdisabncommercialvnsportation.
untyHealthated:8/12/1
ransportation
y:95
5
6indicators:pn65yearsofaility,mobilityvehicle‐to‐pop
StatusComp3
n Score (2011
percentofpopage,percentoylimitationorpulationratio
pendium
Section8.
1)25 ii
ulationwithaofpopulationyself‐carelimit.Thehigherth
AccesstoCa
annualincomeyoungerthantation,percenhescore,thel
are 67
eless14ntofless
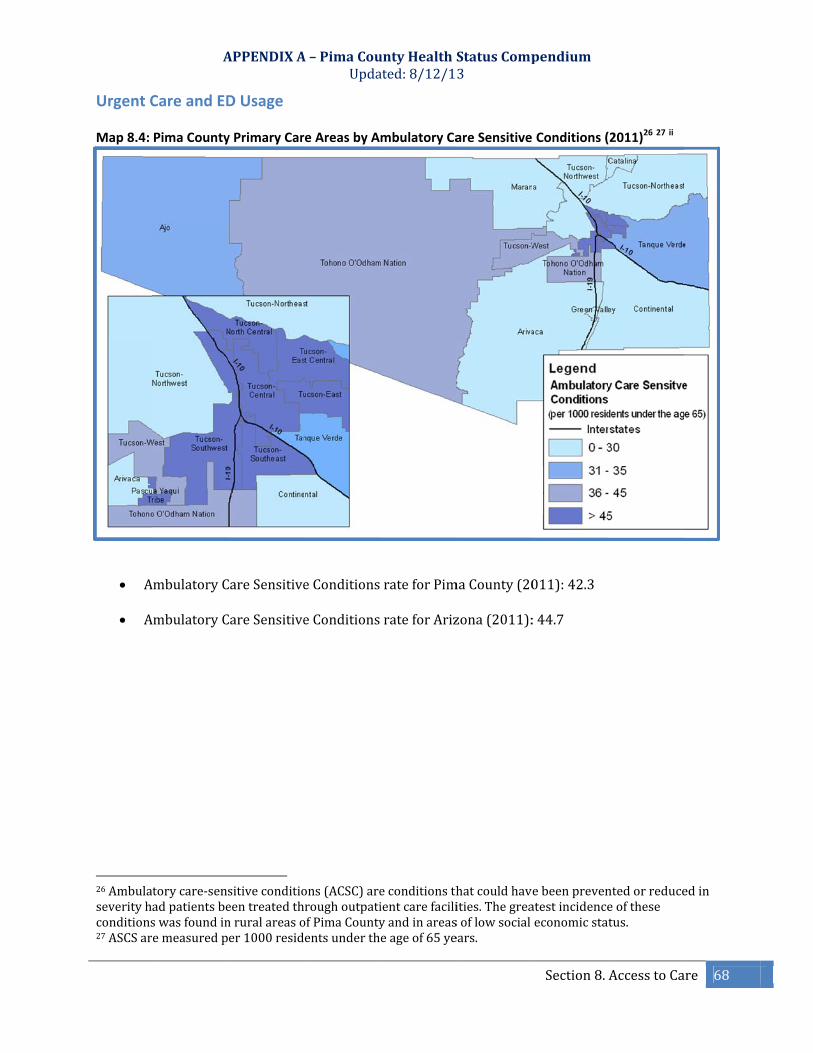
Urgent CMap 8.4:
A
A
26Ambulaseverityhconditions27ASCSar
A
Care and ED
Pima County
AmbulatoryC
AmbulatoryC
torycare‐sensadpatientsbeswasfoundinemeasuredp
APPENDIXA
D Usage
y Primary Car
CareSensitive
CareSensitive
sitiveconditioeentreatedthnruralareasoer1000resid
A–PimaCouUpda
re Areas by A
eConditions
eConditions
ons(ACSC)areroughoutpatiofPimaCountyentsunderth
untyHealthated:8/12/1
mbulatory Ca
rateforPim
rateforAriz
econditionsthientcarefaciliyandinareaseageof65ye
StatusComp3
are Sensitive
maCounty(20
zona(2011):
hatcouldhavities.Thegreasoflowsocialears.
pendium
Section8.
Conditions (
011):42.3
:44.7
ebeenprevenatestincidenceeconomicstat
AccesstoCa
(2011)26 27 ii
ntedorreduceeofthesetus.
are 68
edin

ProviderMap 8.5:
A
r to Popula
Pima County
APPENDIXA
ation
y Primary Car
A–PimaCouUpda
re Areas by Pr
untyHealthated:8/12/1
rovider to Po
StatusComp3
opulation Rat
pendium
Section8.
tio (2011)ii
AccesstoCaare 69

APPENDIXA–PimaCountyHealthStatusCompendiumUpdated:8/12/13
References 70
References iU.S.CensusBureau.(2010)ArizonaStateandCountyQuickFacts.RetrievedFebruary21,2013,fromhttp://www.census.gov/iiArizonaDepartmentofHealthServices.(2011).StatisticalProfile2011.BureauofHealthSystemsDevelopment.iiiMrela,ChristopherK.&ClareTorres.(2010).ArizonaHealthStatusandVitalStatistics.ArizonaDepartmentofHealthServices.ivMrela,ChristopherK.&ClareTorres.(2006‐2010).ArizonaHealthStatusandVitalStatistics.ArizonaDepartmentofHealthServices.vCentersforDiseaseControlandPrevention(2011).BehavioralRiskFactorSurveillanceSystem.Retrieved:February26,2013,fromhttp://www.cdc.gov/brfss/index.htm.viCentersforDiseaseControlandPrevention(2011).YouthRiskBehaviorSurveillanceSystem.RetrievedonFebruary27,2013fromhttp://www.cdc.gov/HealthyYouth/yrbs/index.htmviiArizonaCriminalJusticeCommission(2012).ArizonaYouthSurvey.RetrievedonMarch26,2012fromhttp://www.bach‐harrison.com/arizonadataproject/Indicators.aspxviiiArizonaDepartmentofHealthServices(2012).OralHealthofArizonaChildren.OfficeofOralHealth.ixUnitedStatesCensusBureau(2009‐2011).AmericanCommunitySurvey3‐yearEstimates.RetrievedonMarch27,2013fromhttp://factfinder2.census.gov/faces/tableservices.xMrela,ChristopherK.&ClareTorres.(2007‐2011).ArizonaHealthStatusandVitalStatistics.ArizonaDepartmentofHealthServices.xiArizonaDepartmentofHealthServices(2005‐2010).ArizonaCancerRegistry.Retrieved:June10,2013fromhttp://www.azdhs.gov/phs/phstats/cancer‐registry/.xiiCentersforDiseaseControlandPrevention(2002‐2010).BehavioralRiskFactorSurveillanceSystem.Retrieved:June11,2013fromhttp://healthindicators.gov/Indicators/Pap‐test‐women‐18‐percent_115/Profile/Data.
Recommended


![Welcome [webcms.pima.gov]webcms.pima.gov/UserFiles/Servers/Server_6/File...significant benefits: • Save and access vital health stats and fitness activities online or via our mobile](https://img.pdfslide.us/doc/110x75/5f85bd3b519d8104be2db962/welcome-significant-benefits-a-save-and-access-vital-health-stats-and.jpg)