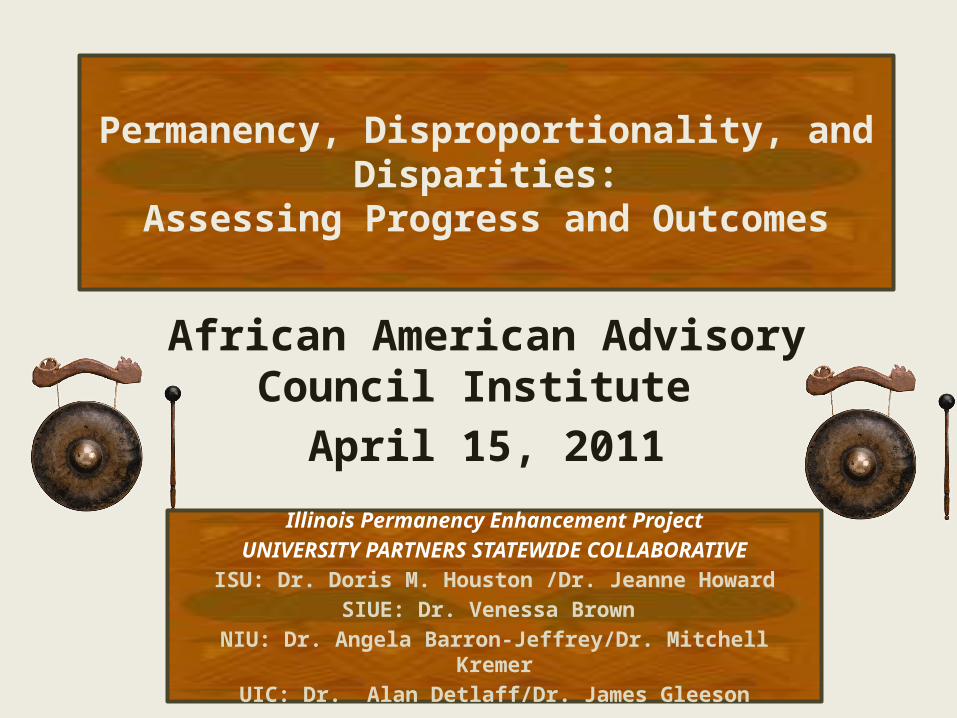
Permanency, Disproportionality, and Disparities:Assessing Progress and Outcomes
African American Advisory Council Institute
April 15, 2011
Illinois Permanency Enhancement ProjectUNIVERSITY PARTNERS STATEWIDE COLLABORATIVE
ISU: Dr. Doris M. Houston /Dr. Jeanne HowardSIUE: Dr. Venessa Brown
NIU: Dr. Angela Barron-Jeffrey/Dr. Mitchell KremerUIC: Dr. Alan Detlaff/Dr. James Gleeson
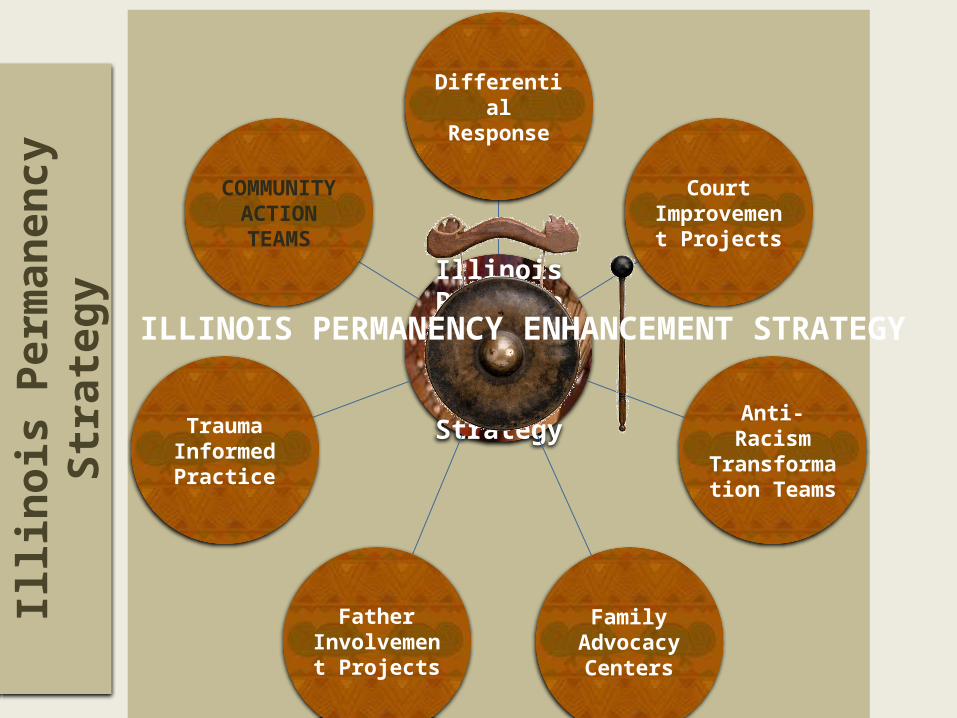
Illinois Permanency
Enhancement Strategy
Differential Response
Court Improvement Projects
Anti-Racism Transformation
Teams
Family Advocacy Centers
Father Involvement Projects
Trauma Informed Practice
COMMUNITY ACTION TEAMS
Illin
ois
Perm
anen
cySt
rate
gy ILLINOIS PERMANENCY ENHANCEMENT STRATEGY
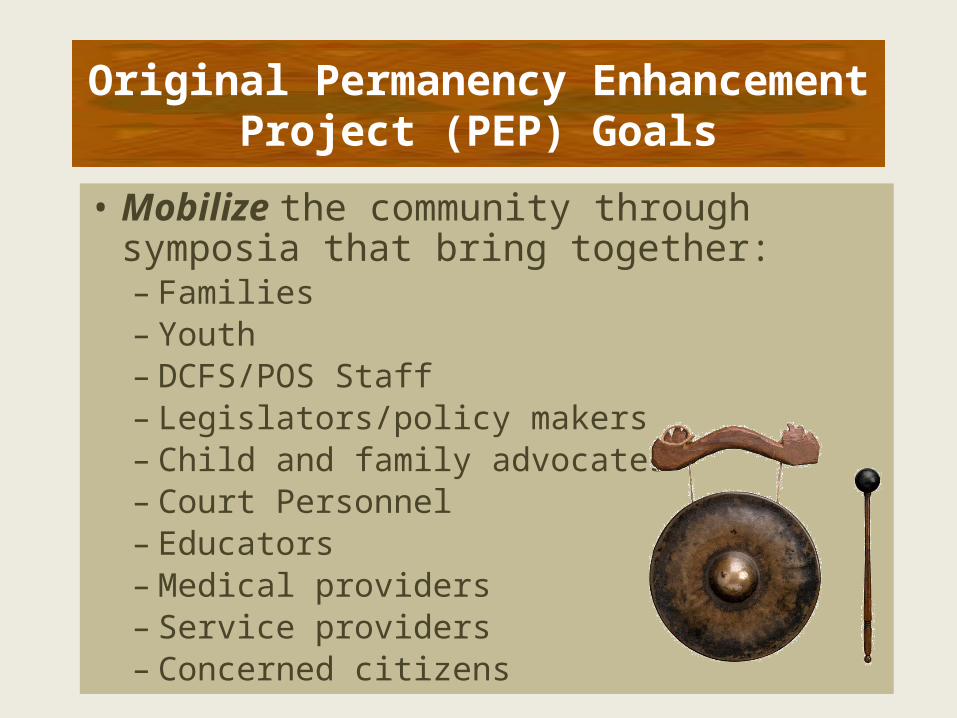
Original Permanency Enhancement Project (PEP) Goals
• Mobilize the community through symposia that bring together:– Families– Youth– DCFS/POS Staff– Legislators/policy makers – Child and family advocates– Court Personnel – Educators– Medical providers– Service providers– Concerned citizens
PEP Goals
• Convene ACTION TEAMS made up of Stakeholders, Staff, and Concerned Citizens.
• Implement community ACTION PLANS to improve permanency and reduce racial disparities.
PEP Goals
• Measure progress through evaluation.
• Adjust strategies as needed.
PEP Goals
SIGNS OF PROGRESS
Ain’t No Stopping Us
Now!
QUESTION 1: • How are we doing with Community
Stakeholder Engagement?
QUESTION 1:
How are we doing with Community Stakeholder
Engagement?
INSERT HERE:
STATEWIDE SUMMARY OF Action Team Stakeholder
Attendance by Type, 2007- 20110
200
400
600
800
1000
1200
1400
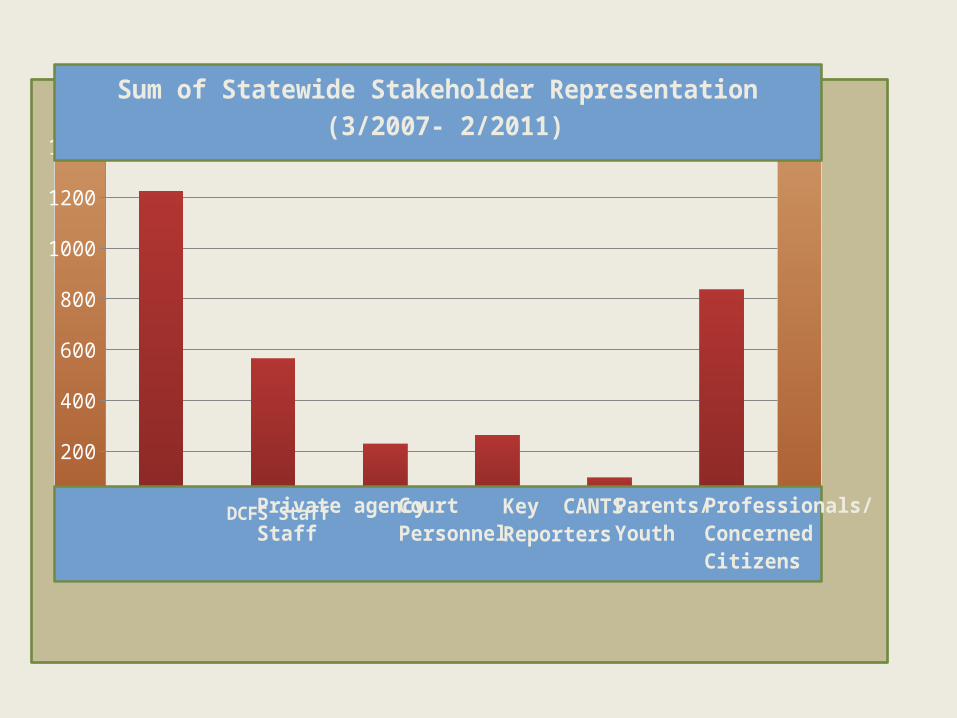
Sum of Statewide Stakeholder Representation (3/2007- 2/2011)
DCFS Staff Private agencyStaff
Court Personnel
Key CANTSReporters
Parents/Youth
Professionals/ConcernedCitizens
QUESTION 2: • How have we changed… community
perceptions and professional practices PEP?
QUESTION 3: • How have we changed… relationships
and collaboration?
QUESTION 2: Have Community PERCEPTIONS and Professional PRACTICES improved?
QUESTION 3: Have RELATIONSHIPS AND COLLABORATION improved?
TELLING OUR STORY: Action Team Members
Share Stories of Change
Go to PEP Web site to see video clips
htt p://adopti onresearch.i l l inoisstate.edu/PEP/
Question 4:
Have DISPARITIES changed ?
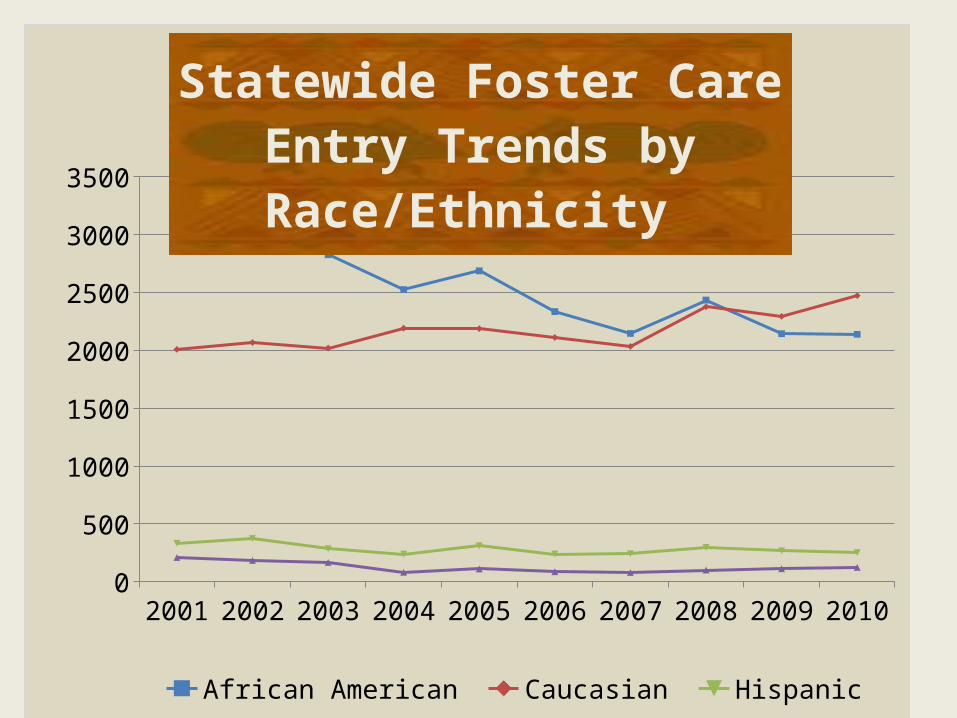
2001 2002 2003 2004 2005 2006 2007 2008 2009 20100
500
1000
1500
2000
2500
3000
3500
Statewide Foster Care Entry Trends by Race/Ethnicity
African American Caucasian Hispanic Other
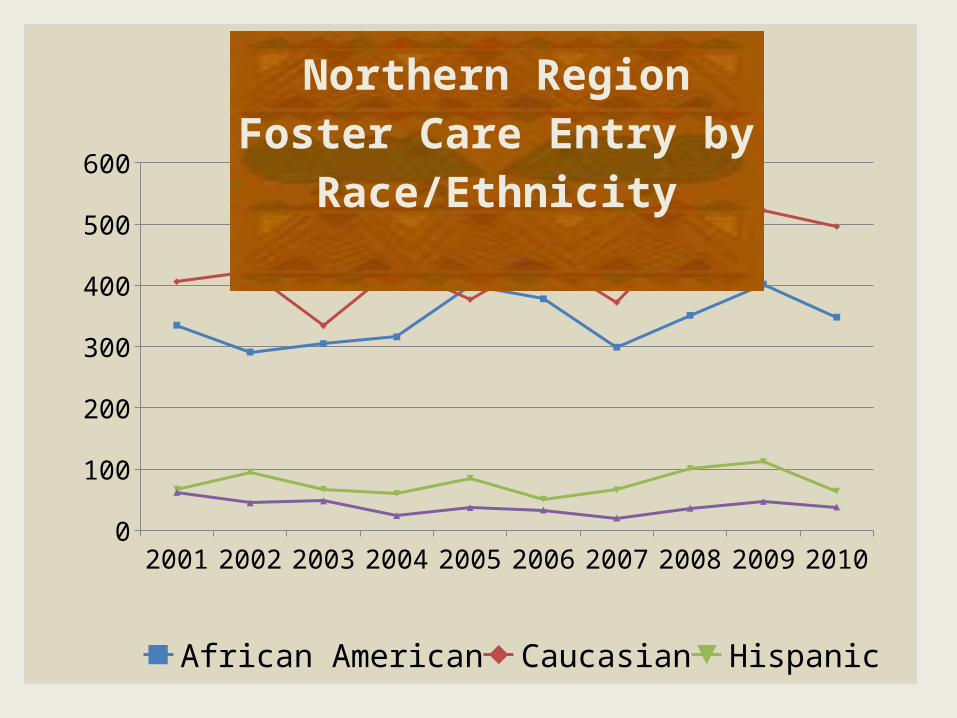
2001 2002 2003 2004 2005 2006 2007 2008 2009 20100
100
200
300
400
500
600
Northern RegionFoster Care Entry by Race/Ethnicity
African American Caucasian Hispanic Other
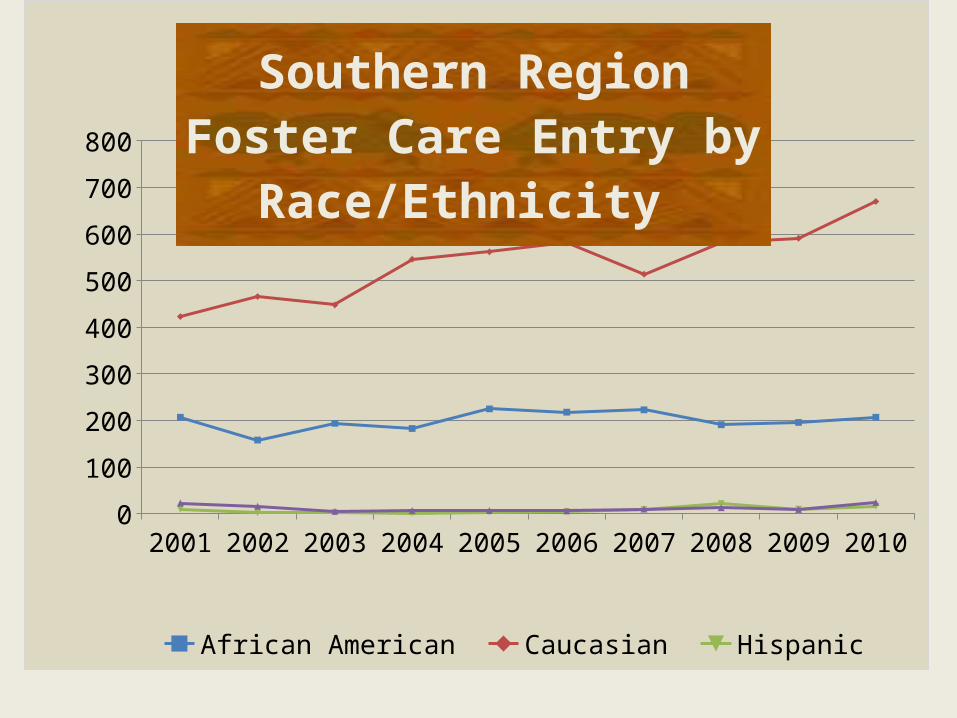
2001 2002 2003 2004 2005 2006 2007 2008 2009 20100
100
200
300
400
500
600
700
800
Southern RegionFoster Care Entry by Race/Ethnicity
African American Caucasian Hispanic Other
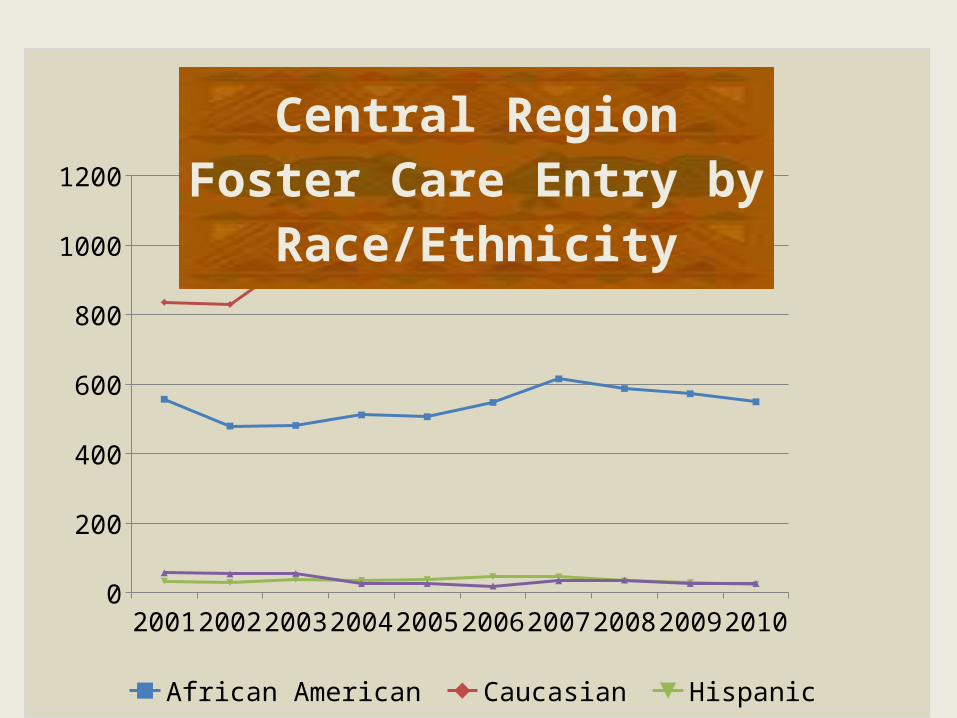
2001 2002 2003 2004 2005 2006 2007 2008 2009 20100
200
400
600
800
1000
1200
Central RegionFoster Care Entry by Race/Ethnicity
African American Caucasian Hispanic Other
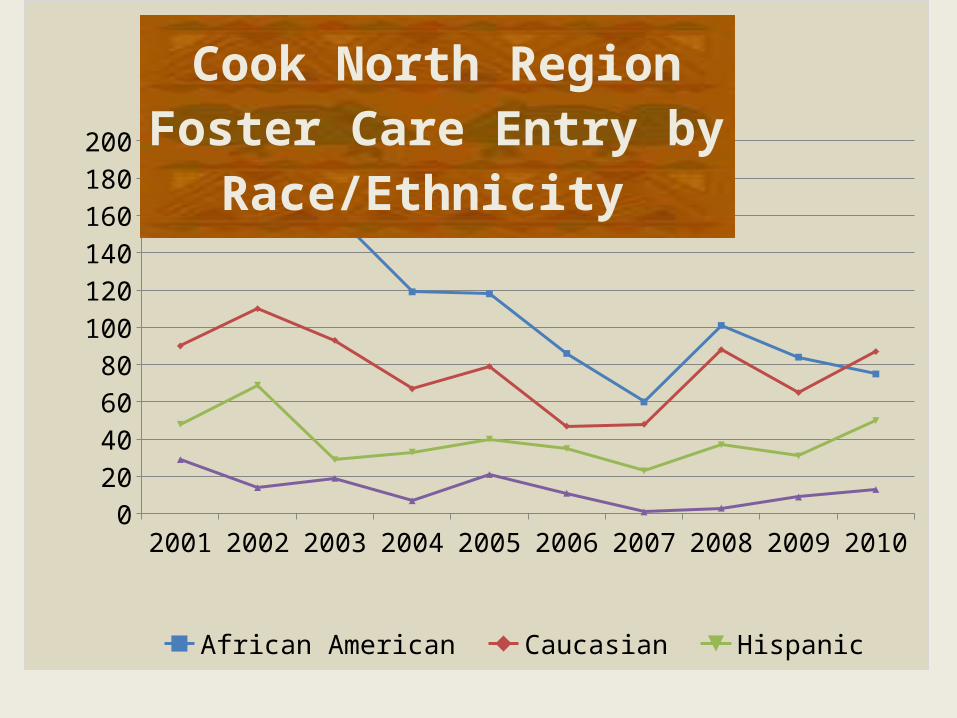
2001 2002 2003 2004 2005 2006 2007 2008 2009 20100
20406080
100120140160180200
Cook North RegionFoster Care Entry by Race/Ethnicity
African American Caucasian Hispanic Other
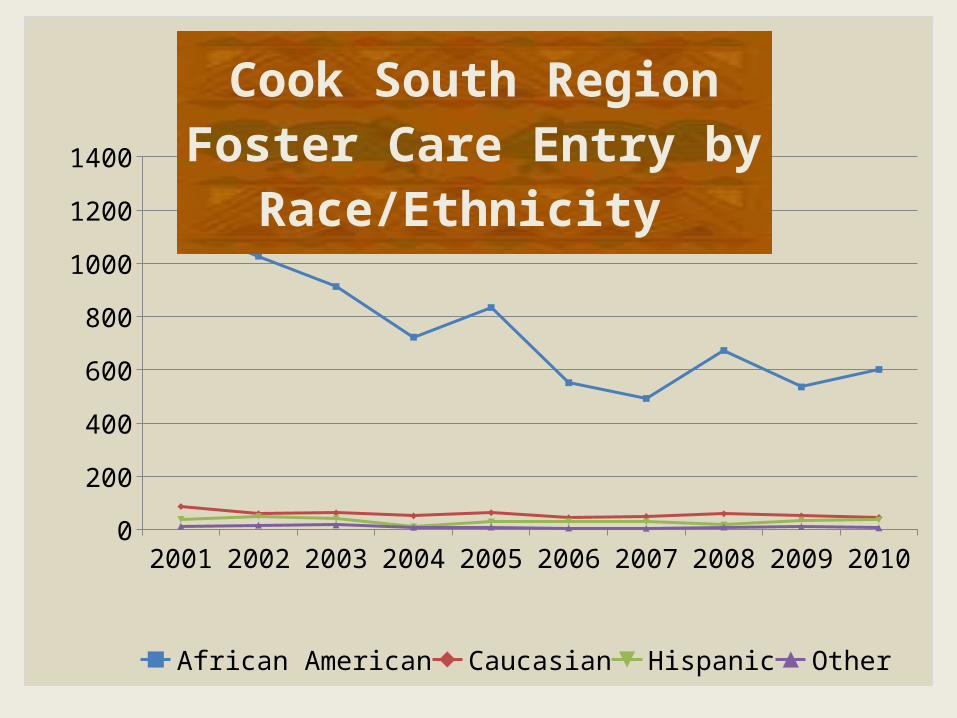
2001 2002 2003 2004 2005 2006 2007 2008 2009 20100
200
400
600
800
1000
1200
1400
Cook South RegionFoster Care Entry by Race/Ethnicity
African American Caucasian Hispanic Other
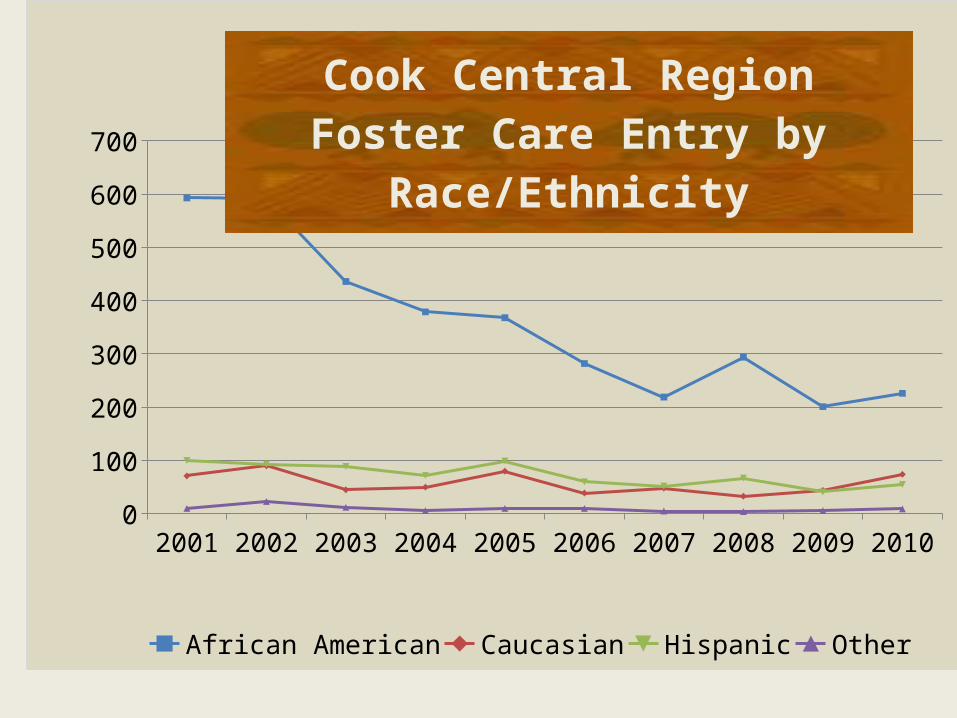
2001 2002 2003 2004 2005 2006 2007 2008 2009 20100
100
200
300
400
500
600
700
Cook Central RegionFoster Care Entry by Race/Ethnicity
African American Caucasian Hispanic Other

Next On the Horizon…
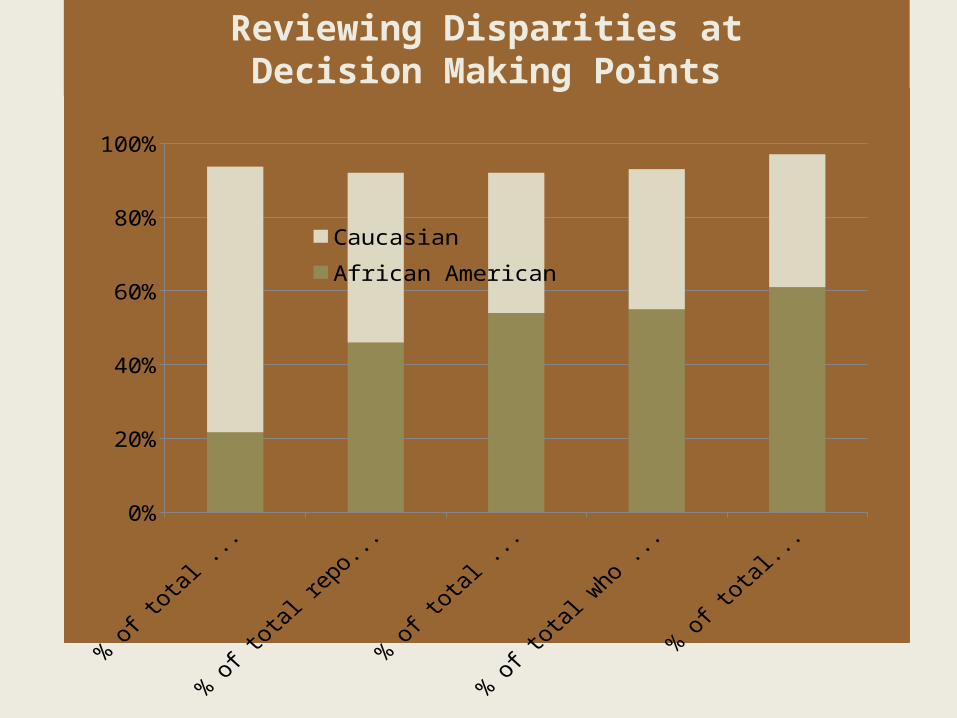
0%
20%
40%
60%
80%
100%
Caucasian African American
Reviewing Disparities atDecision Making Points
Tell YOUR Story of CHANGE…
http://adoptionresearch.illinoisstate.edu/PEP/
Recommended