矍诲 꿬矑 矓�矓�Ɉ╘+�Ɉ ″ 1
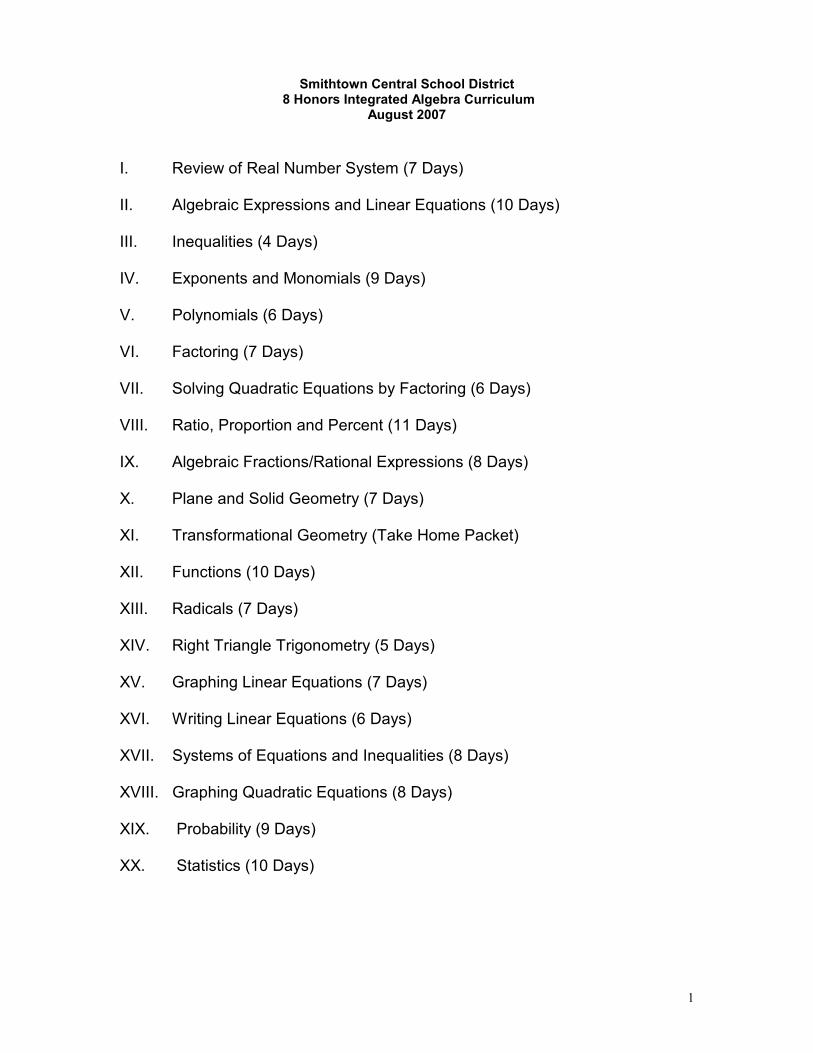
Smithtown Central School District 8 Honors Integrated Algebra Curriculum
August 2007
I. Review of Real Number System (7 Days)
II. Algebraic Expressions and Linear Equations (10 Days)
III. Inequalities (4 Days)
IV. Exponents and Monomials (9 Days)
V. Polynomials (6 Days)
VI. Factoring (7 Days)
VII. Solving Quadratic Equations by Factoring (6 Days)
VIII. Ratio, Proportion and Percent (11 Days)
IX. Algebraic Fractions/Rational Expressions (8 Days)
X. Plane and Solid Geometry (7 Days)
XI. Transformational Geometry (Take Home Packet)
XII. Functions (10 Days)
XIII. Radicals (7 Days)
XIV. Right Triangle Trigonometry (5 Days)
XV. Graphing Linear Equations (7 Days)
XVI. Writing Linear Equations (6 Days)
XVII. Systems of Equations and Inequalities (8 Days)
XVIII. Graphing Quadratic Equations (8 Days)
XIX. Probability (9 Days)
XX. Statistics (10 Days)
2
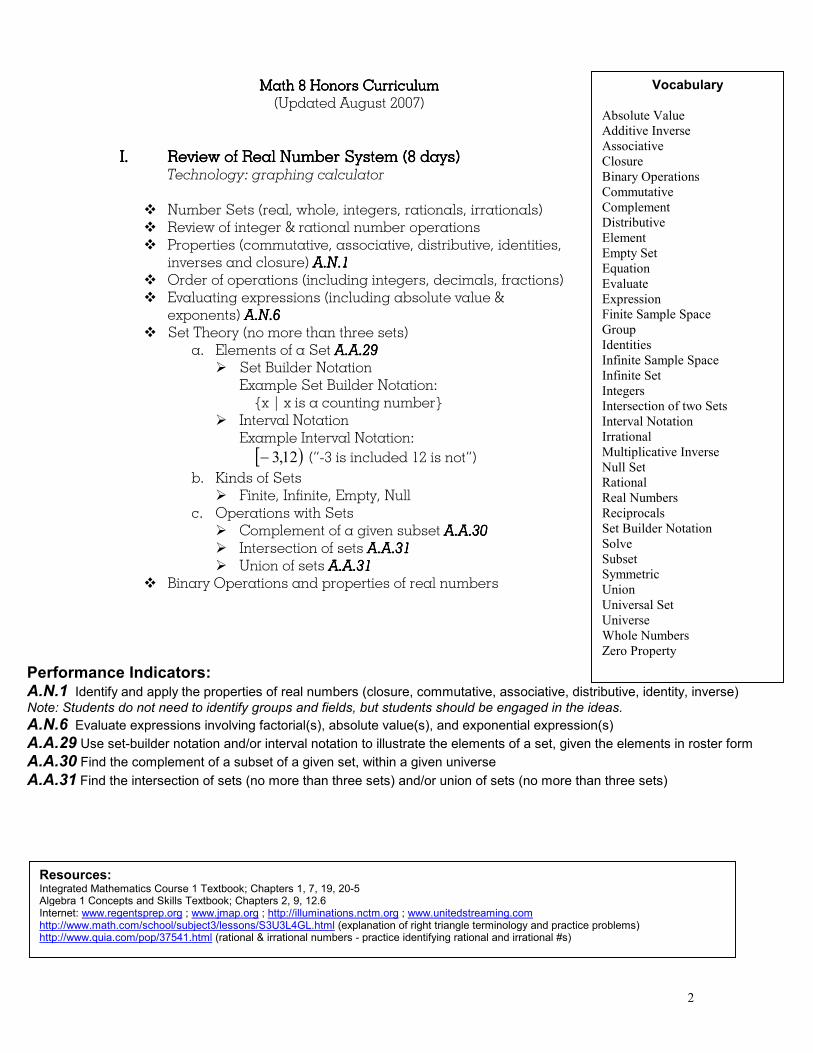
Math 8 Honors CurriculumMath 8 Honors CurriculumMath 8 Honors CurriculumMath 8 Honors Curriculum (Updated August 2007)
I.I.I.I. Review of Real Number System (8Review of Real Number System (8Review of Real Number System (8Review of Real Number System (8 days) days) days) days) Technology: graphing calculator
� Number Sets (real, whole, integers, rationals, irrationals) � Review of integer & rational number operations � Properties (commutative, associative, distributive, identities,
inverses and closure) A.N.1A.N.1A.N.1A.N.1 � Order of operations (including integers, decimals, fractions) � Evaluating expressions (including absolute value &
exponents) A.N.6 A.N.6 A.N.6 A.N.6 � Set Theory (no more than three sets)
a. Elements of a Set A.A.29 A.A.29 A.A.29 A.A.29 � Set Builder Notation
Example Set Builder Notation: {x | x is a counting number}
� Interval Notation Example Interval Notation:
[ )12,3− (“-3 is included 12 is not”)
b. Kinds of Sets � Finite, Infinite, Empty, Null
c. Operations with Sets � Complement of a given subset A.A.30 A.A.30 A.A.30 A.A.30 � Intersection of sets A.A.31 A.A.31 A.A.31 A.A.31 � Union of sets A.A.31 A.A.31 A.A.31 A.A.31
� Binary Operations and properties of real numbers
Performance Indicators: A.N.1 Identify and apply the properties of real numbers (closure, commutative, associative, distributive, identity, inverse) Note: Students do not need to identify groups and fields, but students should be engaged in the ideas.
A.N.6 Evaluate expressions involving factorial(s), absolute value(s), and exponential expression(s) A.A.29 Use set-builder notation and/or interval notation to illustrate the elements of a set, given the elements in roster form A.A.30 Find the complement of a subset of a given set, within a given universe
A.A.31 Find the intersection of sets (no more than three sets) and/or union of sets (no more than three sets)
Resources: Integrated Mathematics Course 1 Textbook; Chapters 1, 7, 19, 20-5 Algebra 1 Concepts and Skills Textbook; Chapters 2, 9, 12.6 Internet: www.regentsprep.org ; www.jmap.org ; http://illuminations.nctm.org ; www.unitedstreaming.com http://www.math.com/school/subject3/lessons/S3U3L4GL.html (explanation of right triangle terminology and practice problems) http://www.quia.com/pop/37541.html (rational & irrational numbers - practice identifying rational and irrational #s)
Vocabulary
Absolute Value
Additive Inverse
Associative
Closure
Binary Operations
Commutative
Complement
Distributive
Element
Empty Set
Equation
Evaluate
Expression
Finite Sample Space
Group
Identities
Infinite Sample Space
Infinite Set
Integers
Intersection of two Sets
Interval Notation
Irrational
Multiplicative Inverse
Null Set
Rational
Real Numbers
Reciprocals
Set Builder Notation
Solve
Subset
Symmetric
Union
Universal Set
Universe
Whole Numbers
Zero Property
3
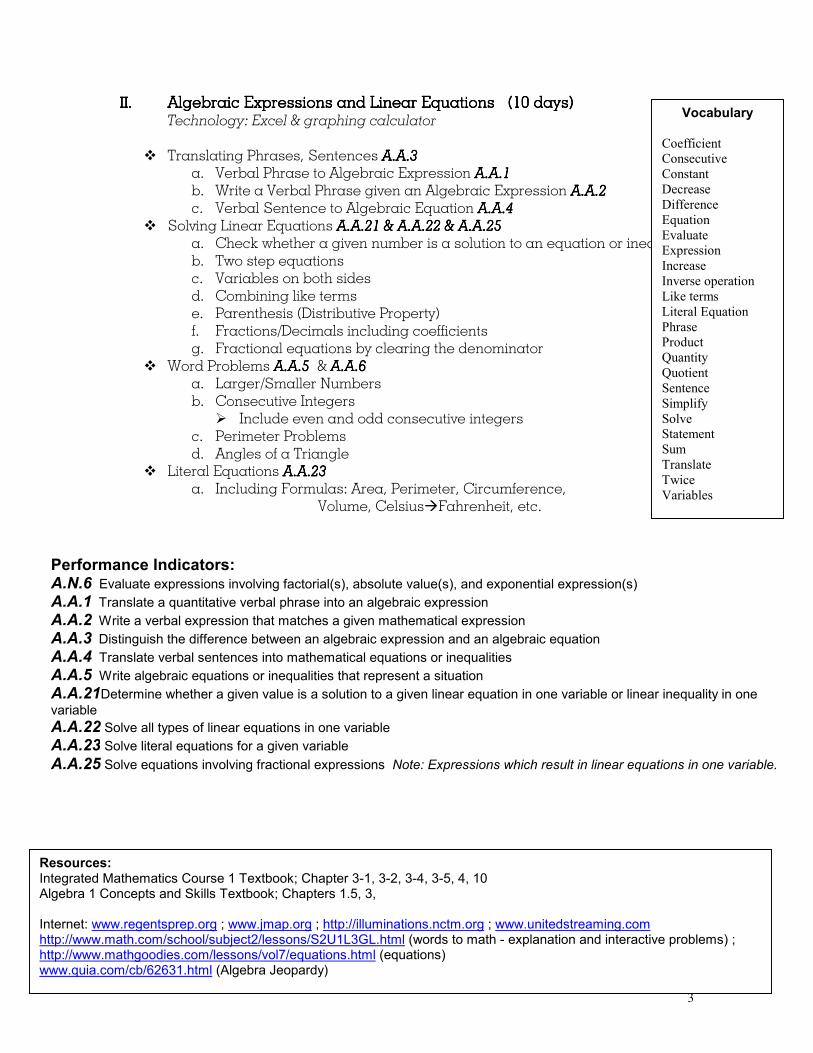
II.II.II.II. Algebraic ExpressionsAlgebraic ExpressionsAlgebraic ExpressionsAlgebraic Expressions and and and and Linear EquationsLinear EquationsLinear EquationsLinear Equations ((((10101010 days) days) days) days) Technology: Excel & graphing calculator
� Translating Phrases, Sentences A.A.3 A.A.3 A.A.3 A.A.3
a. Verbal Phrase to Algebraic Expression A.A.1 A.A.1 A.A.1 A.A.1 b. Write a Verbal Phrase given an Algebraic Expression A.A.2 A.A.2 A.A.2 A.A.2 c. Verbal Sentence to Algebraic Equation A.A.4 A.A.4 A.A.4 A.A.4
� Solving Linear Equations A.A.21 & A.A.22 & A.A.25 A.A.21 & A.A.22 & A.A.25 A.A.21 & A.A.22 & A.A.25 A.A.21 & A.A.22 & A.A.25 a. Check whether a given number is a solution to an equation or inequality b. Two step equations c. Variables on both sides d. Combining like terms e. Parenthesis (Distributive Property) f. Fractions/Decimals including coefficients g. Fractional equations by clearing the denominator
� Word Problems A.A.5 A.A.5 A.A.5 A.A.5 & A.A.6A.A.6A.A.6A.A.6 a. Larger/Smaller Numbers b. Consecutive Integers
� Include even and odd consecutive integers c. Perimeter Problems d. Angles of a Triangle
� Literal Equations A.A.23 A.A.23 A.A.23 A.A.23 a. Including Formulas: Area, Perimeter, Circumference, Volume, Celsius�Fahrenheit, etc.
Vocabulary
Coefficient
Consecutive
Constant
Decrease
Difference
Equation
Evaluate
Expression
Increase
Inverse operation
Like terms
Literal Equation
Phrase
Product
Quantity
Quotient
Sentence
Simplify
Solve
Statement
Sum
Translate
Twice
Variables
Performance Indicators: A.N.6 Evaluate expressions involving factorial(s), absolute value(s), and exponential expression(s) A.A.1 Translate a quantitative verbal phrase into an algebraic expression A.A.2 Write a verbal expression that matches a given mathematical expression A.A.3 Distinguish the difference between an algebraic expression and an algebraic equation A.A.4 Translate verbal sentences into mathematical equations or inequalities A.A.5 Write algebraic equations or inequalities that represent a situation A.A.21Determine whether a given value is a solution to a given linear equation in one variable or linear inequality in one variable A.A.22 Solve all types of linear equations in one variable A.A.23 Solve literal equations for a given variable
A.A.25 Solve equations involving fractional expressions Note: Expressions which result in linear equations in one variable.
Resources: Integrated Mathematics Course 1 Textbook; Chapter 3-1, 3-2, 3-4, 3-5, 4, 10 Algebra 1 Concepts and Skills Textbook; Chapters 1.5, 3, Internet: www.regentsprep.org ; www.jmap.org ; http://illuminations.nctm.org ; www.unitedstreaming.com http://www.math.com/school/subject2/lessons/S2U1L3GL.html (words to math - explanation and interactive problems) ; http://www.mathgoodies.com/lessons/vol7/equations.html (equations) www.quia.com/cb/62631.html (Algebra Jeopardy)
4
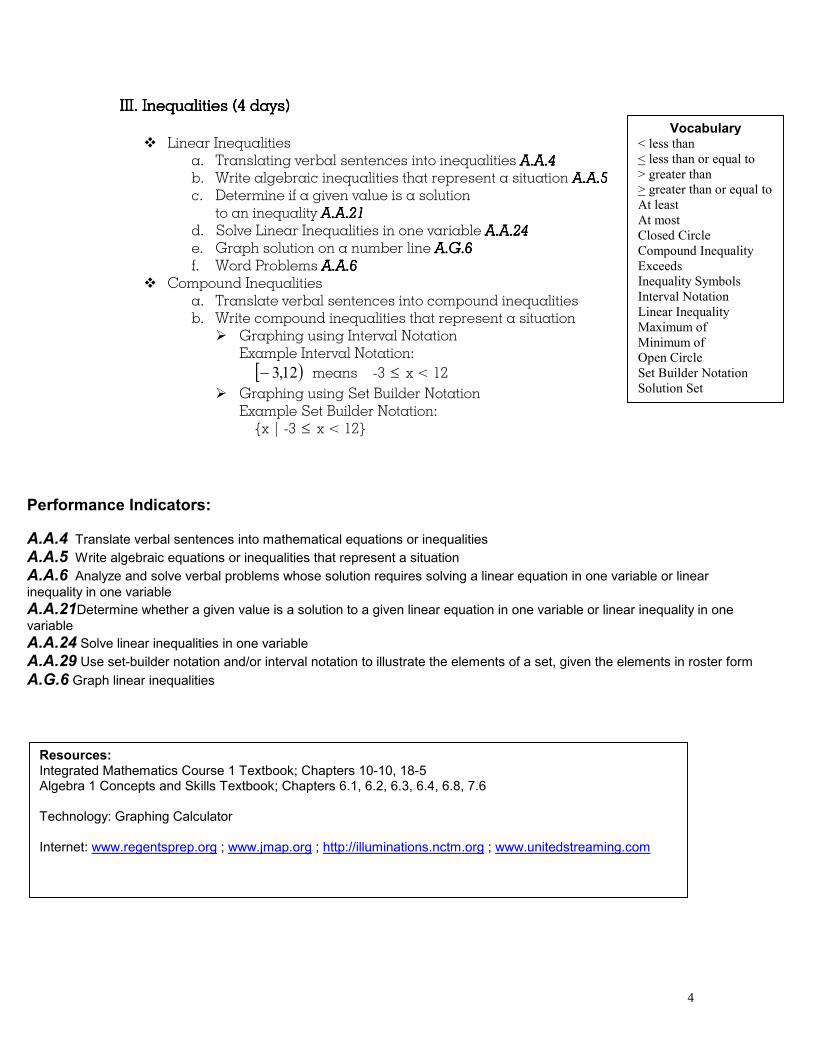
III. III. III. III. InequalitiesInequalitiesInequalitiesInequalities (4 d (4 d (4 d (4 days)ays)ays)ays)
� Linear Inequalities a. Translating verbal sentences into inequalities A.A.4A.A.4A.A.4A.A.4 b. Write algebraic inequalities that represent a situation A.A.5A.A.5A.A.5A.A.5 c. Determine if a given value is a solution
to an inequality A.A.21A.A.21A.A.21A.A.21 d. Solve Linear Inequalities in one variable A.A.24 A.A.24 A.A.24 A.A.24 e. Graph solution on a number line A.G.6A.G.6A.G.6A.G.6 f. Word Problems A.A.6A.A.6A.A.6A.A.6
� Compound Inequalities a. Translate verbal sentences into compound inequalities b. Write compound inequalities that represent a situation
� Graphing using Interval Notation Example Interval Notation:
[ )12,3− means -3 ≤ x < 12
� Graphing using Set Builder Notation Example Set Builder Notation:
{x | -3 ≤ x < 12}
Performance Indicators: A.A.4 Translate verbal sentences into mathematical equations or inequalities A.A.5 Write algebraic equations or inequalities that represent a situation A.A.6 Analyze and solve verbal problems whose solution requires solving a linear equation in one variable or linear inequality in one variable A.A.21Determine whether a given value is a solution to a given linear equation in one variable or linear inequality in one variable A.A.24 Solve linear inequalities in one variable A.A.29 Use set-builder notation and/or interval notation to illustrate the elements of a set, given the elements in roster form
A.G.6 Graph linear inequalities
Resources: Integrated Mathematics Course 1 Textbook; Chapters 10-10, 18-5 Algebra 1 Concepts and Skills Textbook; Chapters 6.1, 6.2, 6.3, 6.4, 6.8, 7.6 Technology: Graphing Calculator Internet: www.regentsprep.org ; www.jmap.org ; http://illuminations.nctm.org ; www.unitedstreaming.com
Vocabulary < less than
< less than or equal to
> greater than
> greater than or equal to
At least
At most
Closed Circle
Compound Inequality
Exceeds
Inequality Symbols
Interval Notation
Linear Inequality
Maximum of
Minimum of
Open Circle
Set Builder Notation
Solution Set
5
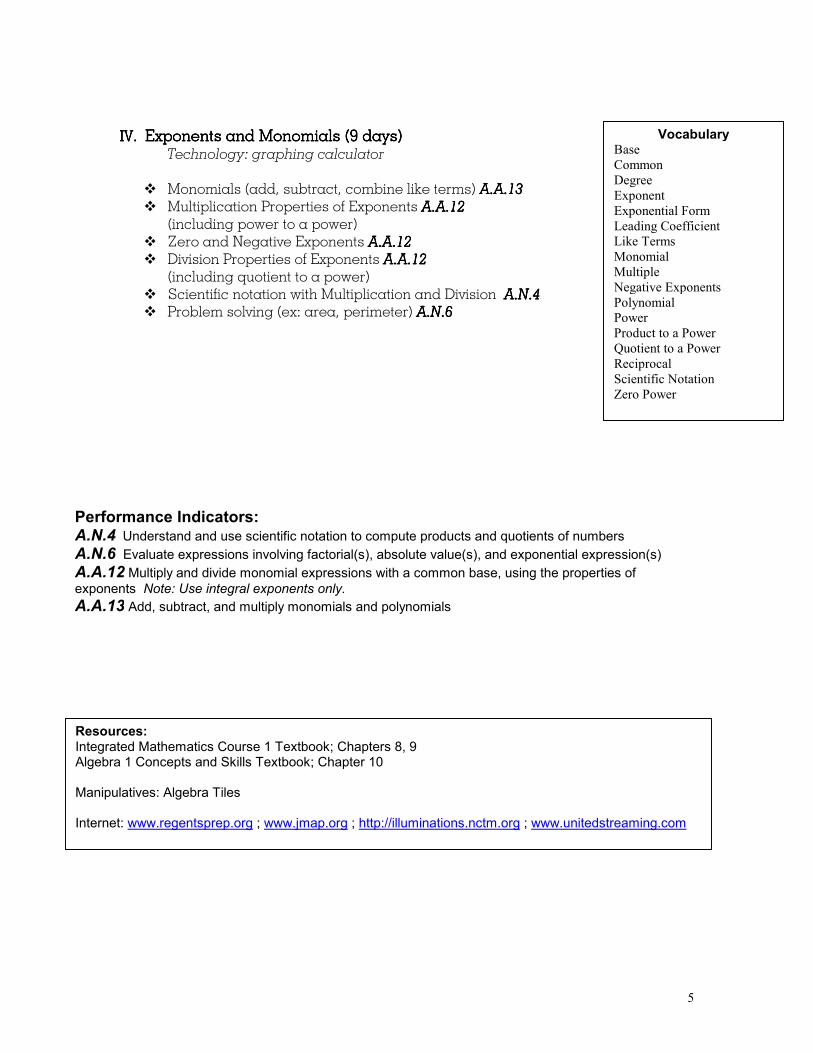
IV. IV. IV. IV. Exponents and Monomials (9 days)Exponents and Monomials (9 days)Exponents and Monomials (9 days)Exponents and Monomials (9 days) Technology: graphing calculator
� Monomials (add, subtract, combine like terms) A.A.13A.A.13A.A.13A.A.13 � Multiplication Properties of Exponents A.A.12A.A.12A.A.12A.A.12
(including power to a power) � Zero and Negative Exponents A.A.12A.A.12A.A.12A.A.12 � Division Properties of Exponents A.A.12A.A.12A.A.12A.A.12
(including quotient to a power) � Scientific notation with Multiplication and Division A.N.4A.N.4A.N.4A.N.4 � Problem solving (ex: area, perimeter) A.N.6A.N.6A.N.6A.N.6
Vocabulary Base
Common
Degree
Exponent
Exponential Form
Leading Coefficient
Like Terms
Monomial
Multiple
Negative Exponents
Polynomial
Power
Product to a Power
Quotient to a Power
Reciprocal
Scientific Notation
Zero Power
Performance Indicators: A.N.4 Understand and use scientific notation to compute products and quotients of numbers A.N.6 Evaluate expressions involving factorial(s), absolute value(s), and exponential expression(s) A.A.12 Multiply and divide monomial expressions with a common base, using the properties of exponents Note: Use integral exponents only. A.A.13 Add, subtract, and multiply monomials and polynomials
Resources: Integrated Mathematics Course 1 Textbook; Chapters 8, 9 Algebra 1 Concepts and Skills Textbook; Chapter 10 Manipulatives: Algebra Tiles Internet: www.regentsprep.org ; www.jmap.org ; http://illuminations.nctm.org ; www.unitedstreaming.com
6
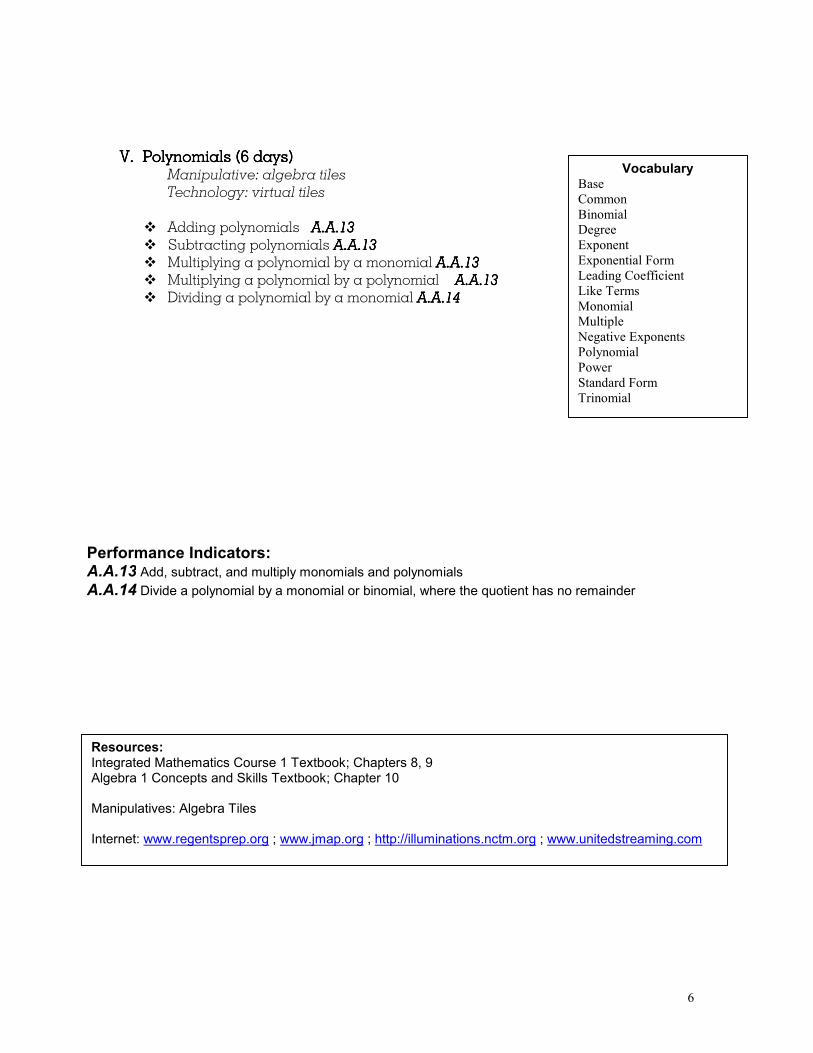
V. V. V. V. Polynomials (6Polynomials (6Polynomials (6Polynomials (6 days) days) days) days) Manipulative: algebra tiles
Technology: virtual tiles
� Adding polynomials A.A.13A.A.13A.A.13A.A.13 � Subtracting polynomials A.A.13A.A.13A.A.13A.A.13 � Multiplying a polynomial by a monomial A.A.13A.A.13A.A.13A.A.13 � Multiplying a polynomial by a polynomial A.A.13A.A.13A.A.13A.A.13 � Dividing a polynomial by a monomial A.A.14A.A.14A.A.14A.A.14
Vocabulary Base
Common
Binomial
Degree
Exponent
Exponential Form
Leading Coefficient
Like Terms
Monomial
Multiple
Negative Exponents
Polynomial
Power
Standard Form
Trinomial
Resources: Integrated Mathematics Course 1 Textbook; Chapters 8, 9 Algebra 1 Concepts and Skills Textbook; Chapter 10 Manipulatives: Algebra Tiles Internet: www.regentsprep.org ; www.jmap.org ; http://illuminations.nctm.org ; www.unitedstreaming.com
Performance Indicators: A.A.13 Add, subtract, and multiply monomials and polynomials
A.A.14 Divide a polynomial by a monomial or binomial, where the quotient has no remainder
7
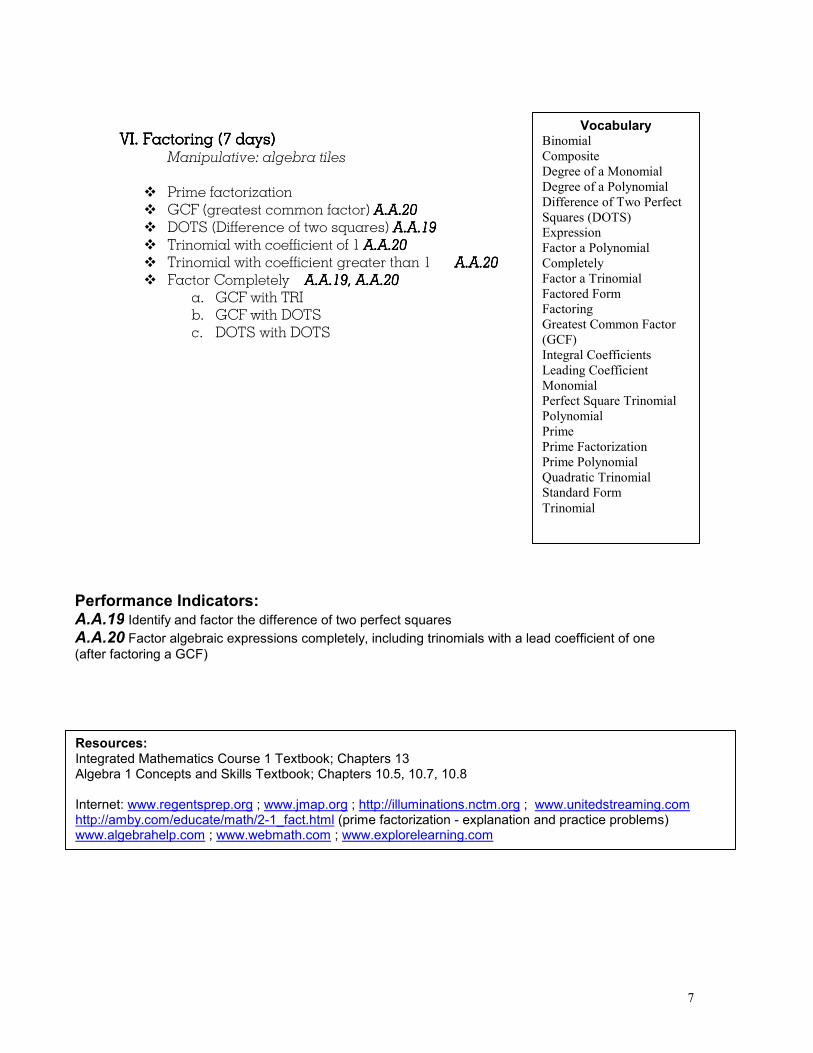
VI. VI. VI. VI. FactoringFactoringFactoringFactoring (7 (7 (7 (7 days) days) days) days) Manipulative: algebra tiles
� Prime factorization � GCF (greatest common factor) A.A.20A.A.20A.A.20A.A.20 � DOTS (Difference of two squares) A.A.19A.A.19A.A.19A.A.19 � Trinomial with coefficient of 1 A.A.20A.A.20A.A.20A.A.20 � Trinomial with coefficient greater than 1 A.A.20A.A.20A.A.20A.A.20 � Factor Completely AAAA.A.19, .A.19, .A.19, .A.19, A.A.20A.A.20A.A.20A.A.20
a. GCF with TRI b. GCF with DOTS c. DOTS with DOTS
Vocabulary Binomial
Composite
Degree of a Monomial
Degree of a Polynomial
Difference of Two Perfect
Squares (DOTS)
Expression
Factor a Polynomial
Completely
Factor a Trinomial
Factored Form
Factoring
Greatest Common Factor
(GCF)
Integral Coefficients
Leading Coefficient
Monomial
Perfect Square Trinomial
Polynomial
Prime
Prime Factorization
Prime Polynomial
Quadratic Trinomial
Standard Form
Trinomial
Performance Indicators: A.A.19 Identify and factor the difference of two perfect squares A.A.20 Factor algebraic expressions completely, including trinomials with a lead coefficient of one (after factoring a GCF)
Resources: Integrated Mathematics Course 1 Textbook; Chapters 13 Algebra 1 Concepts and Skills Textbook; Chapters 10.5, 10.7, 10.8 Internet: www.regentsprep.org ; www.jmap.org ; http://illuminations.nctm.org ; www.unitedstreaming.com http://amby.com/educate/math/2-1_fact.html (prime factorization - explanation and practice problems) www.algebrahelp.com ; www.webmath.com ; www.explorelearning.com
8
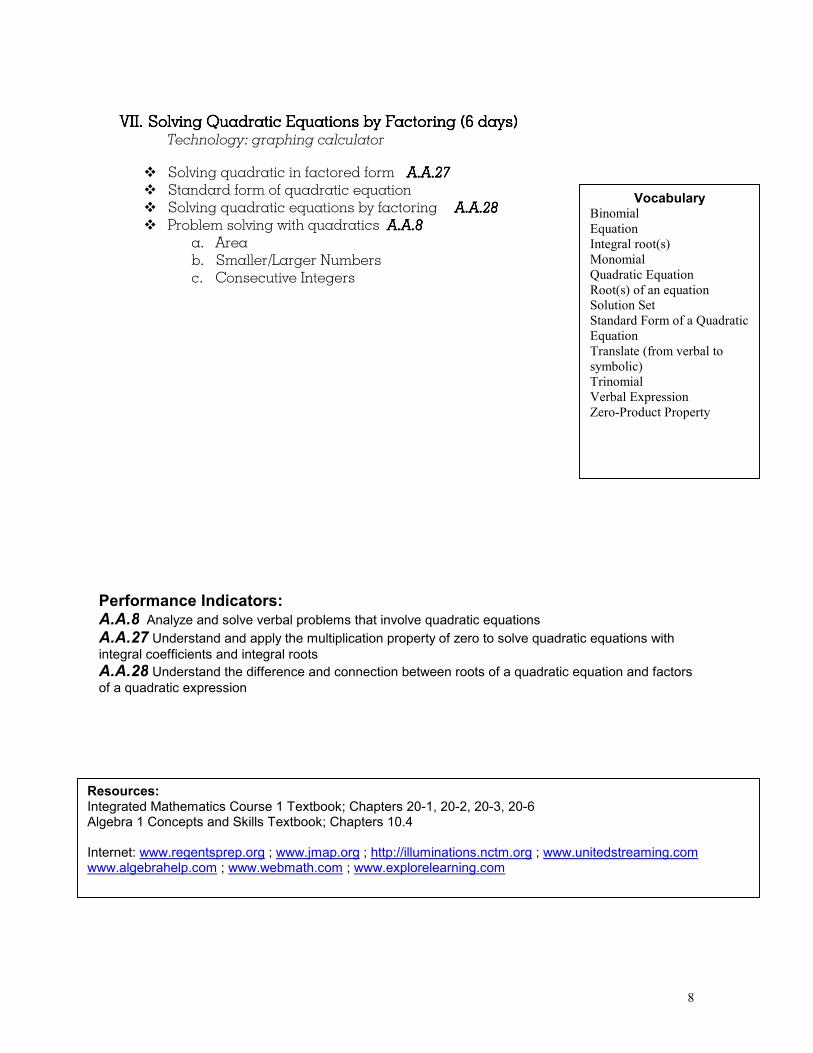
VII. VII. VII. VII. Solving Quadratic Equations by Factoring (6 days)Solving Quadratic Equations by Factoring (6 days)Solving Quadratic Equations by Factoring (6 days)Solving Quadratic Equations by Factoring (6 days) Technology: graphing calculator
� Solving quadratic in factored form A.A.27A.A.27A.A.27A.A.27 � Standard form of quadratic equation � Solving quadratic equations by factoring A.A.28A.A.28A.A.28A.A.28 � Problem solving with quadratics A.A.8A.A.8A.A.8A.A.8
a. Area b. Smaller/Larger Numbers c. Consecutive Integers
Performance Indicators: A.A.8 Analyze and solve verbal problems that involve quadratic equations A.A.27 Understand and apply the multiplication property of zero to solve quadratic equations with integral coefficients and integral roots A.A.28 Understand the difference and connection between roots of a quadratic equation and factors of a quadratic expression
Resources: Integrated Mathematics Course 1 Textbook; Chapters 20-1, 20-2, 20-3, 20-6 Algebra 1 Concepts and Skills Textbook; Chapters 10.4 Internet: www.regentsprep.org ; www.jmap.org ; http://illuminations.nctm.org ; www.unitedstreaming.com www.algebrahelp.com ; www.webmath.com ; www.explorelearning.com
Vocabulary Binomial
Equation
Integral root(s)
Monomial
Quadratic Equation
Root(s) of an equation
Solution Set
Standard Form of a Quadratic
Equation
Translate (from verbal to
symbolic)
Trinomial
Verbal Expression
Zero-Product Property
9
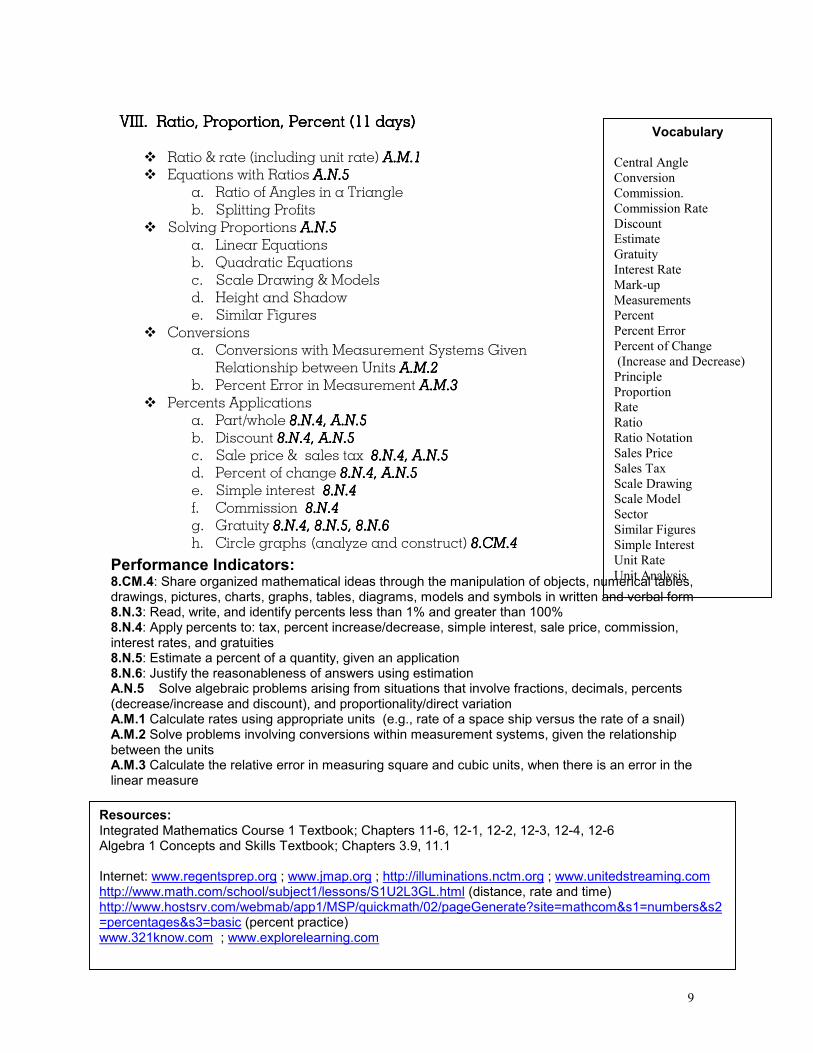
VIII. VIII. VIII. VIII. Ratio, Proportion, Percent (Ratio, Proportion, Percent (Ratio, Proportion, Percent (Ratio, Proportion, Percent (11111111 days) days) days) days)
� Ratio & rate (including unit rate) A.M.1A.M.1A.M.1A.M.1 � Equations with Ratios A.N.5A.N.5A.N.5A.N.5
a. Ratio of Angles in a Triangle b. Splitting Profits
� Solving Proportions A.N.5A.N.5A.N.5A.N.5 a. Linear Equations b. Quadratic Equations c. Scale Drawing & Models d. Height and Shadow e. Similar Figures
� Conversions a. Conversions with Measurement Systems Given
Relationship between Units A.M.2 A.M.2 A.M.2 A.M.2 b. Percent Error in Measurement A.M.3 A.M.3 A.M.3 A.M.3
� Percents Applications a. Part/whole 8.N.4, A.N.58.N.4, A.N.58.N.4, A.N.58.N.4, A.N.5 b. Discount 8.N.48.N.48.N.48.N.4, A.N.5, A.N.5, A.N.5, A.N.5 c. Sale price & sales tax 8.N.48.N.48.N.48.N.4, A.N.5, A.N.5, A.N.5, A.N.5 d. Percent of change 8.N.48.N.48.N.48.N.4, A.N.5, A.N.5, A.N.5, A.N.5 e. Simple interest 8.N.48.N.48.N.48.N.4 f. Commission 8.N.48.N.48.N.48.N.4 g. Gratuity 8.N.4, 8.N.5, 8.N.68.N.4, 8.N.5, 8.N.68.N.4, 8.N.5, 8.N.68.N.4, 8.N.5, 8.N.6 h. Circle graphs (analyze and construct) 8.CM.48.CM.48.CM.48.CM.4
Vocabulary
Central Angle
Conversion
Commission.
Commission Rate
Discount
Estimate
Gratuity
Interest Rate
Mark-up
Measurements
Percent
Percent Error
Percent of Change
(Increase and Decrease)
Principle
Proportion
Rate
Ratio
Ratio Notation
Sales Price
Sales Tax
Scale Drawing
Scale Model
Sector
Similar Figures
Simple Interest
Unit Rate
Unit Analysis
Performance Indicators: 8.CM.4: Share organized mathematical ideas through the manipulation of objects, numerical tables, drawings, pictures, charts, graphs, tables, diagrams, models and symbols in written and verbal form 8.N.3: Read, write, and identify percents less than 1% and greater than 100% 8.N.4: Apply percents to: tax, percent increase/decrease, simple interest, sale price, commission, interest rates, and gratuities 8.N.5: Estimate a percent of a quantity, given an application 8.N.6: Justify the reasonableness of answers using estimation A.N.5 Solve algebraic problems arising from situations that involve fractions, decimals, percents (decrease/increase and discount), and proportionality/direct variation A.M.1 Calculate rates using appropriate units (e.g., rate of a space ship versus the rate of a snail) A.M.2 Solve problems involving conversions within measurement systems, given the relationship between the units A.M.3 Calculate the relative error in measuring square and cubic units, when there is an error in the linear measure
Resources: Integrated Mathematics Course 1 Textbook; Chapters 11-6, 12-1, 12-2, 12-3, 12-4, 12-6 Algebra 1 Concepts and Skills Textbook; Chapters 3.9, 11.1 Internet: www.regentsprep.org ; www.jmap.org ; http://illuminations.nctm.org ; www.unitedstreaming.com http://www.math.com/school/subject1/lessons/S1U2L3GL.html (distance, rate and time) http://www.hostsrv.com/webmab/app1/MSP/quickmath/02/pageGenerate?site=mathcom&s1=numbers&s2=percentages&s3=basic (percent practice) www.321know.com ; www.explorelearning.com
10
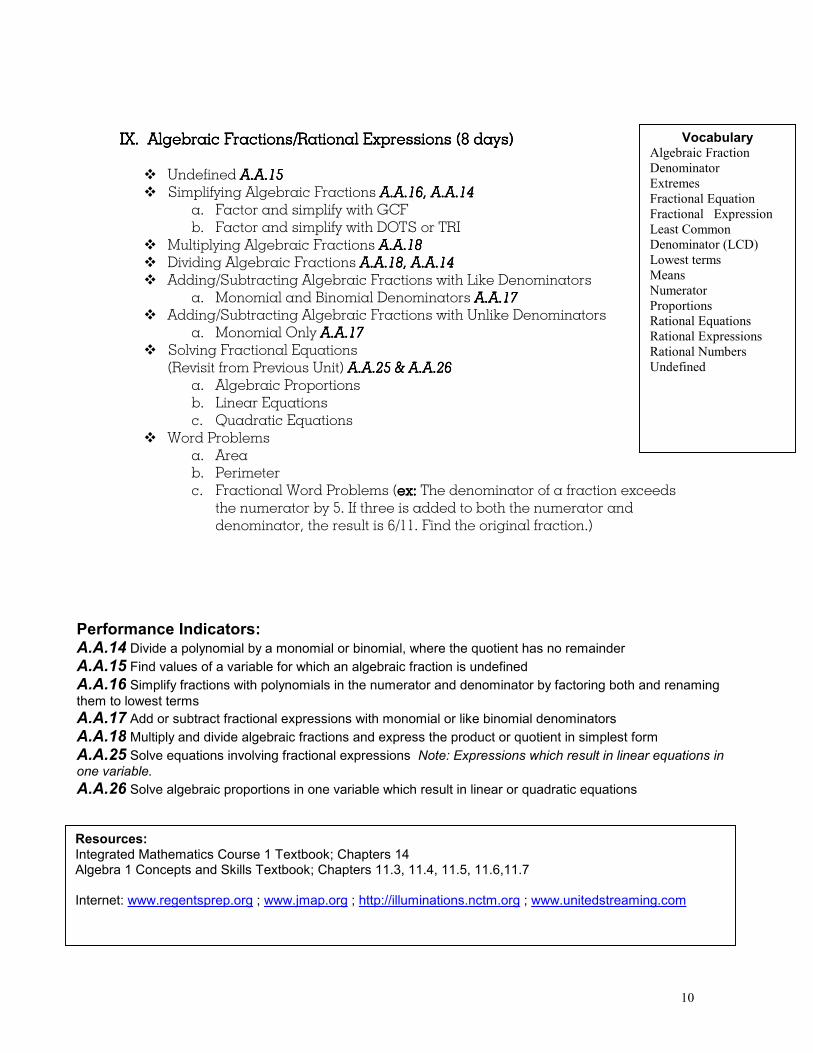
IX. IX. IX. IX. Algebraic FAlgebraic FAlgebraic FAlgebraic Fractions/Rational Expressions (8ractions/Rational Expressions (8ractions/Rational Expressions (8ractions/Rational Expressions (8 da da da days)ys)ys)ys) � Undefined A.A.15 A.A.15 A.A.15 A.A.15 � Simplifying Algebraic Fractions A.A.16 A.A.16 A.A.16 A.A.16, A.A.14, A.A.14, A.A.14, A.A.14
a. Factor and simplify with GCF b. Factor and simplify with DOTS or TRI
� Multiplying Algebraic Fractions A.A.18 A.A.18 A.A.18 A.A.18 � Dividing Algebraic Fractions A.A.18 A.A.18 A.A.18 A.A.18, A.A.14, A.A.14, A.A.14, A.A.14 � Adding/Subtracting Algebraic Fractions with Like Denominators
a. Monomial and Binomial Denominators A.A.17 A.A.17 A.A.17 A.A.17 � Adding/Subtracting Algebraic Fractions with Unlike Denominators
a. Monomial Only A.A.17 A.A.17 A.A.17 A.A.17 � Solving Fractional Equations
(Revisit from Previous Unit) A.A.25 & A.A.26 A.A.25 & A.A.26 A.A.25 & A.A.26 A.A.25 & A.A.26 a. Algebraic Proportions b. Linear Equations c. Quadratic Equations
� Word Problems a. Area b. Perimeter c. Fractional Word Problems (ex:ex:ex:ex: The denominator of a fraction exceeds
the numerator by 5. If three is added to both the numerator and denominator, the result is 6/11. Find the original fraction.)
Vocabulary Algebraic Fraction
Denominator
Extremes
Fractional Equation
Fractional Expression
Least Common
Denominator (LCD)
Lowest terms
Means
Numerator
Proportions
Rational Equations
Rational Expressions
Rational Numbers
Undefined
Performance Indicators: A.A.14 Divide a polynomial by a monomial or binomial, where the quotient has no remainder A.A.15 Find values of a variable for which an algebraic fraction is undefined A.A.16 Simplify fractions with polynomials in the numerator and denominator by factoring both and renaming them to lowest terms A.A.17 Add or subtract fractional expressions with monomial or like binomial denominators A.A.18 Multiply and divide algebraic fractions and express the product or quotient in simplest form A.A.25 Solve equations involving fractional expressions Note: Expressions which result in linear equations in one variable.
A.A.26 Solve algebraic proportions in one variable which result in linear or quadratic equations
Resources: Integrated Mathematics Course 1 Textbook; Chapters 14 Algebra 1 Concepts and Skills Textbook; Chapters 11.3, 11.4, 11.5, 11.6,11.7 Internet: www.regentsprep.org ; www.jmap.org ; http://illuminations.nctm.org ; www.unitedstreaming.com
11
X. X. X. X. Plane Plane Plane Plane & Solid & Solid & Solid & Solid Geometry (Geometry (Geometry (Geometry (7777 days)days)days)days) Manipulative: geoboards
Technology: Geometer’s Sketchpad
� Pairs of Angles a. Identify pairs of vertical angles as congruent (5-1) 8.G.18.G.18.G.18.G.1 b. Calculate missing angle measurements from intersecting
lines (5-1, 5-2) 8.G.68.G.68.G.68.G.6 c. Identify pairs of supplementary and complementary
angles (5-1) 8.G.28.G.28.G.28.G.2 d. Calculate the missing angle in a supplementary or
complementary pair (5-1) 8.G.38.G.38.G.38.G.3
e. Apply algebra to determine missing measures of above angles ♠ 8.A.128.A.128.A.128.A.12
� Parallel Lines Cut by a Transversal a. Determine angle pair relationships (5-2) 8.G.48.G.48.G.48.G.4
b. Calculate missing angle measurements (5-2) 8.G.58.G.58.G.58.G.5
c. Apply algebra to determine the measure of above angles ♠ 8.A.128.A.128.A.128.A.12
� Area and Perimeter of Figures A.G.1A.G.1A.G.1A.G.1 a. Composition of figures (See Performance Indicators below) b. Shaded Region
� Volume A.G.2A.G.2A.G.2A.G.2 a. Rectangular Solids and Cylinders
� Surface Area A.G.2A.G.2A.G.2A.G.2 a. Rectangular Solids and Cylinders
Vocabulary Adjacent Angles
Alternate Interior Angles
Alternate Exterior Angles
Area
Circle
Circumference
Complementary Angles
Congruent Angles
Corresponding Angles
Cylinder
Formula
Geometric Shape
Intersecting Angles
Linear Pair
Parallel Lines
Parallelogram
Perimeter
Perpendicular Lines
Polygon
Quarter Circle
Rectangle
Rectangular Solid
Regular Polygon
Rhombus
Same Side Interior Angles
Sector
Semi-Circle
Square
Surface Area
Supplementary Angles
Transversal
Trapezoid
Triangle
Vertical Angles
Volume
Performance Indicators: Performance Indicators: 8.A.12: Apply algebra to determine the measure of angles formed by or contained in parallel lines cut by a transversal and by intersecting lines 8.G.1: Identify pairs of angles as congruent 8.G.2: Identify pairs of angles as supplementary and complementary angles 8.G.3: Calculate the missing angles in a supplementary or complementary pair 8.G.4: Determine angle pair relationship when given two parallel lines cut by a transversal 8.G.5: Calculate the missing angle measurements when given two parallel lines cut by a transversal 8.G.6: Calculate the missing angle measurements when given two intersecting lines and an angle
A.G.1 Find the area and/or perimeter of figures composed of polygons and circles or sectors of a circle Note: Figures may include triangles, rectangles, squares, parallelograms, rhombuses, trapezoids, circles, semi-circles, quarter-circles, and regular polygons (perimeter only).
A.G.2 Use formulas to calculate volume and surface area of rectangular solids and cylinders
Resources: Integrated Mathematics Course 1 Textbook; Chapters 3-6, 19-13, 19-14 Internet: www.regentsprep.org ; www.jmap.org ; http://illuminations.nctm.org ; www.unitedstreaming.com
12
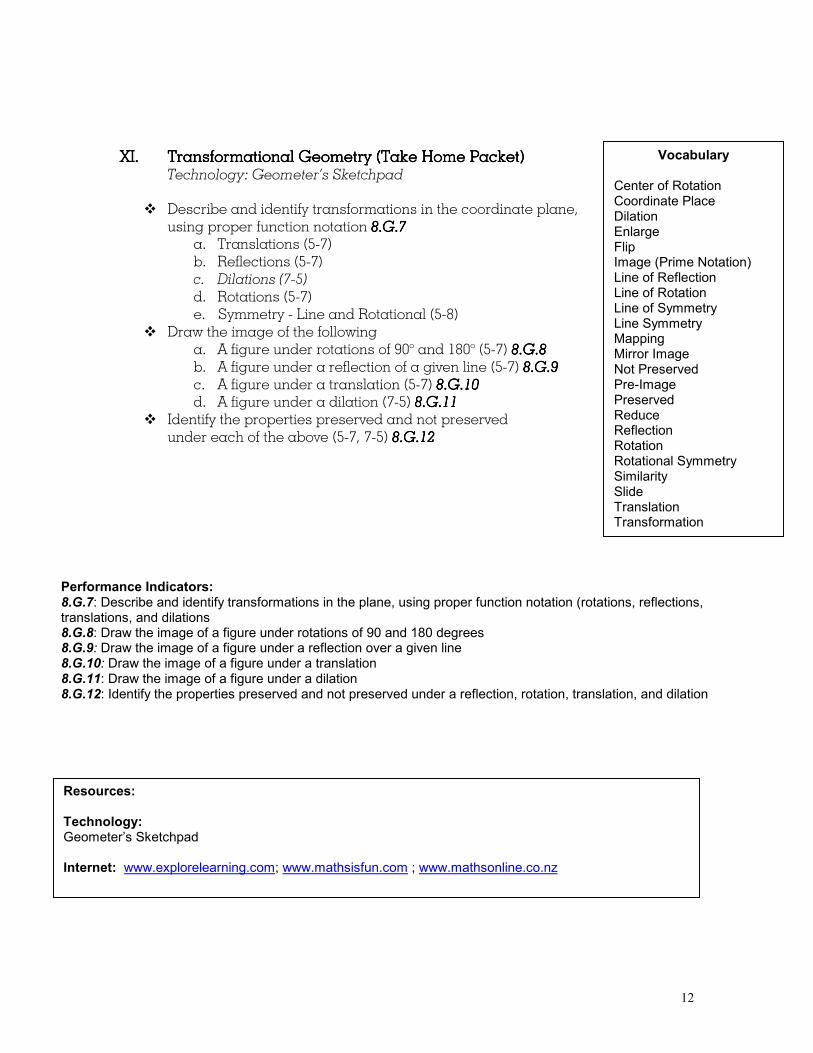
XI.XI.XI.XI. TTTTransformational ransformational ransformational ransformational Geometry (Take Home PacketGeometry (Take Home PacketGeometry (Take Home PacketGeometry (Take Home Packet)))) Technology: Geometer’s Sketchpad
� Describe and identify transformations in the coordinate plane, using proper function notation 8.G.78.G.78.G.78.G.7
a. Translations (5-7) b. Reflections (5-7) c. Dilations (7-5)
d. Rotations (5-7) e. Symmetry - Line and Rotational (5-8)
� Draw the image of the following a. A figure under rotations of 90o and 180o (5-7) 8.G.88.G.88.G.88.G.8 b. A figure under a reflection of a given line (5-7) 8.G.98.G.98.G.98.G.9 c. A figure under a translation (5-7) 8.G.108.G.108.G.108.G.10 d. A figure under a dilation (7-5) 8.G.118.G.118.G.118.G.11
� Identify the properties preserved and not preserved under each of the above (5-7, 7-5) 8.8.8.8.G.12G.12G.12G.12
Vocabulary
Center of Rotation Coordinate Place Dilation Enlarge Flip Image (Prime Notation) Line of Reflection Line of Rotation Line of Symmetry Line Symmetry Mapping Mirror Image Not Preserved Pre-Image Preserved Reduce Reflection Rotation Rotational Symmetry Similarity Slide Translation Transformation
Performance Indicators: 8.G.7: Describe and identify transformations in the plane, using proper function notation (rotations, reflections, translations, and dilations 8.G.8: Draw the image of a figure under rotations of 90 and 180 degrees 8.G.9: Draw the image of a figure under a reflection over a given line 8.G.10: Draw the image of a figure under a translation 8.G.11: Draw the image of a figure under a dilation 8.G.12: Identify the properties preserved and not preserved under a reflection, rotation, translation, and dilation
Resources: Technology: Geometer’s Sketchpad Internet: www.explorelearning.com; www.mathsisfun.com ; www.mathsonline.co.nz
13
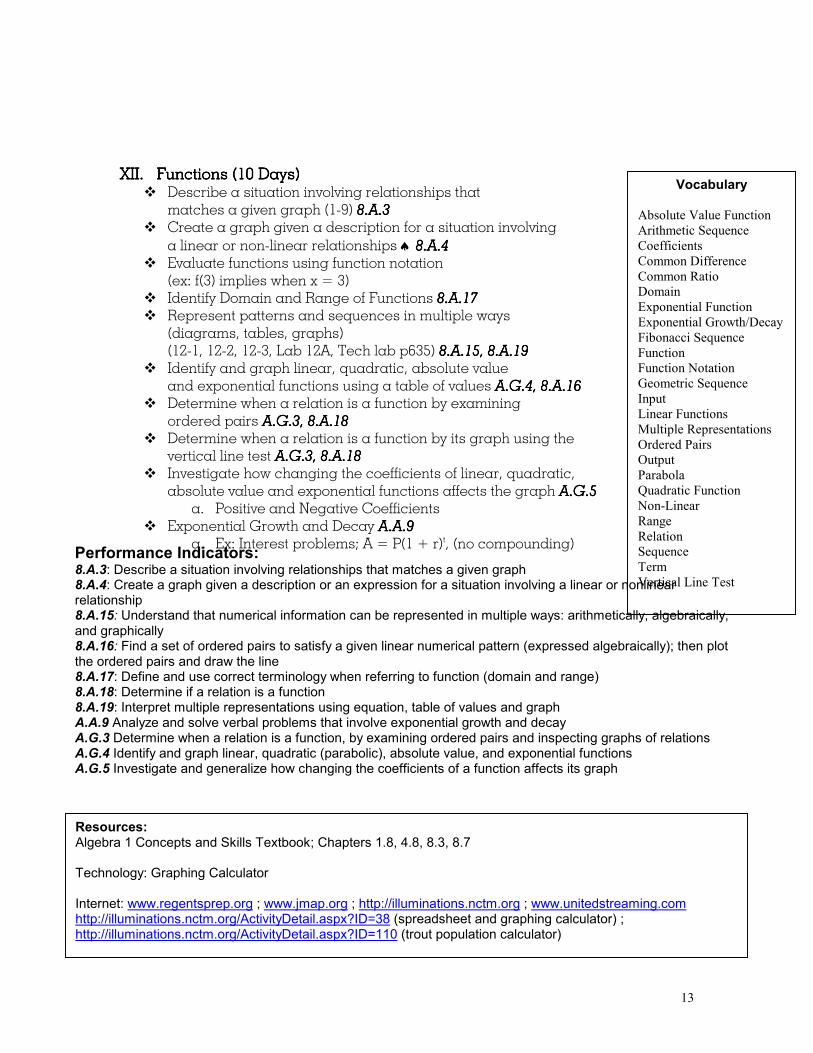
XIXIXIXIIIII. Functions. Functions. Functions. Functions (10 Days) (10 Days) (10 Days) (10 Days) � Describe a situation involving relationships that
matches a given graph (1-9) 8.A.38.A.38.A.38.A.3 � Create a graph given a description for a situation involving
a linear or non-linear relationships ♠ 8.A.48.A.48.A.48.A.4 � Evaluate functions using function notation
(ex: f(3) implies when x = 3) � Identify Domain and Range of Functions 8.A.178.A.178.A.178.A.17 � Represent patterns and sequences in multiple ways
(diagrams, tables, graphs) (12-1, 12-2, 12-3, Lab 12A, Tech lab p635) 8.A.18.A.18.A.18.A.15555, 8.A.19, 8.A.19, 8.A.19, 8.A.19
� Identify and graph linear, quadratic, absolute value and exponential functions using a table of values A.G.4 A.G.4 A.G.4 A.G.4, 8.A.16, 8.A.16, 8.A.16, 8.A.16
� Determine when a relation is a function by examining ordered pairs A.G.3A.G.3A.G.3A.G.3, 8.A.18, 8.A.18, 8.A.18, 8.A.18
� Determine when a relation is a function by its graph using the vertical line test A.G.3 A.G.3 A.G.3 A.G.3, 8.A.18, 8.A.18, 8.A.18, 8.A.18
� Investigate how changing the coefficients of linear, quadratic, absolute value and exponential functions affects the graph A.G.5A.G.5A.G.5A.G.5
a. Positive and Negative Coefficients � Exponential Growth and Decay A.A.9 A.A.9 A.A.9 A.A.9
a. Ex: Interest problems; A = P(1 + r)t, (no compounding)
Vocabulary
Absolute Value Function
Arithmetic Sequence
Coefficients
Common Difference
Common Ratio
Domain
Exponential Function
Exponential Growth/Decay
Fibonacci Sequence
Function
Function Notation
Geometric Sequence
Input
Linear Functions
Multiple Representations
Ordered Pairs
Output
Parabola
Quadratic Function
Non-Linear
Range
Relation
Sequence
Term
Vertical Line Test
Performance Indicators: 8.A.3: Describe a situation involving relationships that matches a given graph 8.A.4: Create a graph given a description or an expression for a situation involving a linear or nonlinear relationship 8.A.15: Understand that numerical information can be represented in multiple ways: arithmetically, algebraically, and graphically 8.A.16: Find a set of ordered pairs to satisfy a given linear numerical pattern (expressed algebraically); then plot the ordered pairs and draw the line 8.A.17: Define and use correct terminology when referring to function (domain and range) 8.A.18: Determine if a relation is a function 8.A.19: Interpret multiple representations using equation, table of values and graph A.A.9 Analyze and solve verbal problems that involve exponential growth and decay A.G.3 Determine when a relation is a function, by examining ordered pairs and inspecting graphs of relations A.G.4 Identify and graph linear, quadratic (parabolic), absolute value, and exponential functions A.G.5 Investigate and generalize how changing the coefficients of a function affects its graph
Resources: Algebra 1 Concepts and Skills Textbook; Chapters 1.8, 4.8, 8.3, 8.7 Technology: Graphing Calculator Internet: www.regentsprep.org ; www.jmap.org ; http://illuminations.nctm.org ; www.unitedstreaming.com http://illuminations.nctm.org/ActivityDetail.aspx?ID=38 (spreadsheet and graphing calculator) ; http://illuminations.nctm.org/ActivityDetail.aspx?ID=110 (trout population calculator)
14
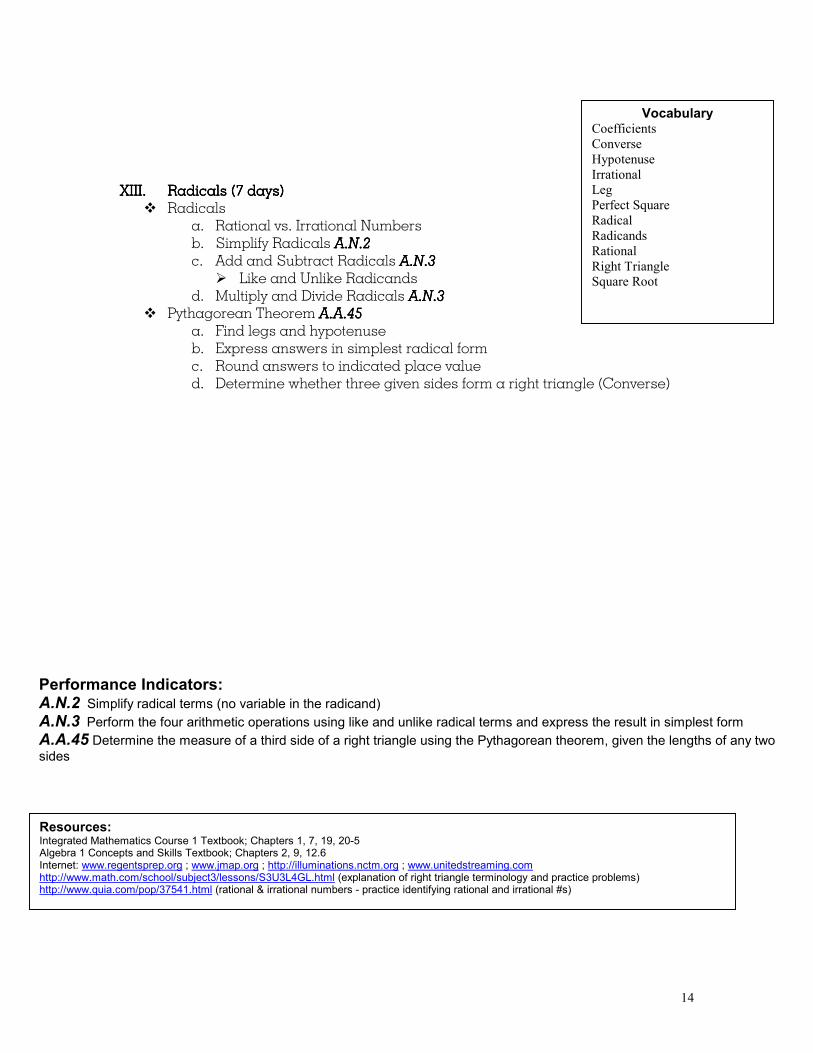
XXXXIIIIIIIIIIII. . . . Radicals (7 days)Radicals (7 days)Radicals (7 days)Radicals (7 days)
� Radicals a. Rational vs. Irrational Numbers b. Simplify Radicals A.N.2 A.N.2 A.N.2 A.N.2 c. Add and Subtract Radicals A.N.3 A.N.3 A.N.3 A.N.3
� Like and Unlike Radicands d. Multiply and Divide Radicals A.N.3 A.N.3 A.N.3 A.N.3
� Pythagorean Theorem A.A.45A.A.45A.A.45A.A.45 a. Find legs and hypotenuse b. Express answers in simplest radical form c. Round answers to indicated place value d. Determine whether three given sides form a right triangle (Converse)
Vocabulary Coefficients
Converse
Hypotenuse
Irrational
Leg
Perfect Square
Radical
Radicands
Rational
Right Triangle
Square Root
Performance Indicators: A.N.2 Simplify radical terms (no variable in the radicand) A.N.3 Perform the four arithmetic operations using like and unlike radical terms and express the result in simplest form A.A.45 Determine the measure of a third side of a right triangle using the Pythagorean theorem, given the lengths of any two sides
Resources: Integrated Mathematics Course 1 Textbook; Chapters 1, 7, 19, 20-5 Algebra 1 Concepts and Skills Textbook; Chapters 2, 9, 12.6 Internet: www.regentsprep.org ; www.jmap.org ; http://illuminations.nctm.org ; www.unitedstreaming.com http://www.math.com/school/subject3/lessons/S3U3L4GL.html (explanation of right triangle terminology and practice problems) http://www.quia.com/pop/37541.html (rational & irrational numbers - practice identifying rational and irrational #s)
15
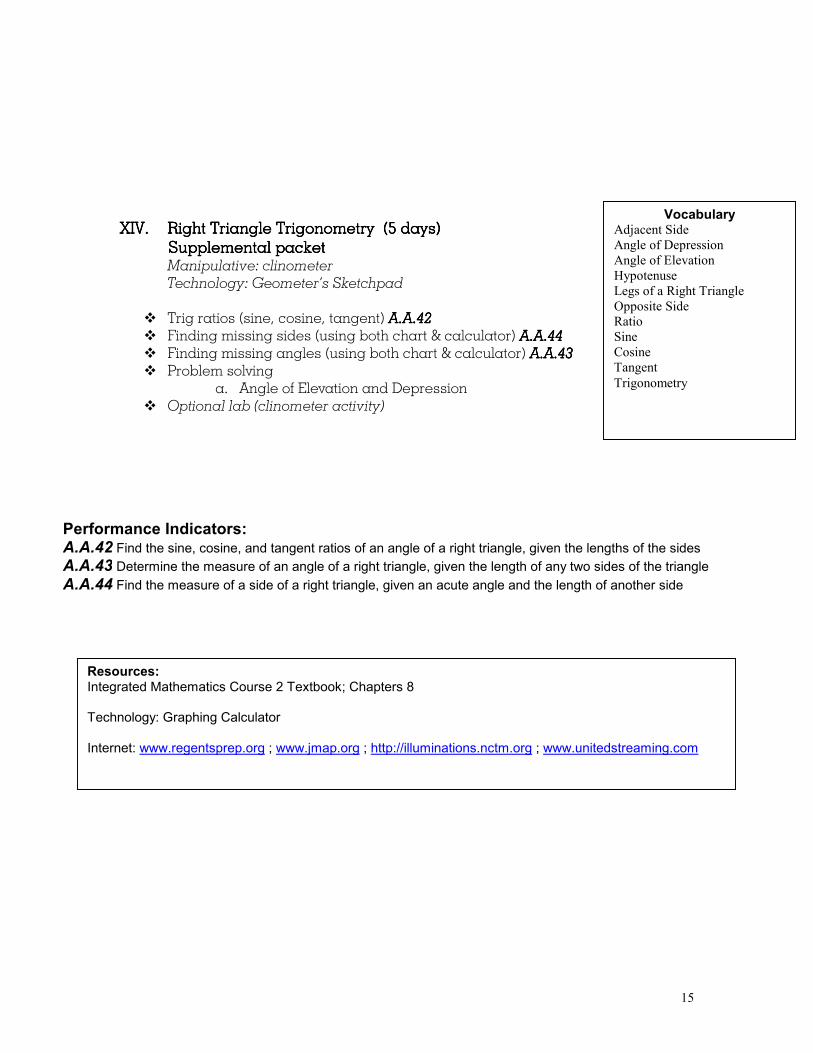
XIVXIVXIVXIV. . . . Right Triangle Trigonometry (5 days)Right Triangle Trigonometry (5 days)Right Triangle Trigonometry (5 days)Right Triangle Trigonometry (5 days)
Supplemental packetSupplemental packetSupplemental packetSupplemental packet Manipulative: clinometer
Technology: Geometer’s Sketchpad
� Trig ratios (sine, cosine, tangent) A.A.42A.A.42A.A.42A.A.42 � Finding missing sides (using both chart & calculator) A.A.44A.A.44A.A.44A.A.44 � Finding missing angles (using both chart & calculator) A.A.43A.A.43A.A.43A.A.43 � Problem solving
a. Angle of Elevation and Depression � Optional lab (clinometer activity)
Vocabulary Adjacent Side
Angle of Depression
Angle of Elevation
Hypotenuse
Legs of a Right Triangle
Opposite Side
Ratio
Sine
Cosine
Tangent
Trigonometry
Resources: Integrated Mathematics Course 2 Textbook; Chapters 8 Technology: Graphing Calculator Internet: www.regentsprep.org ; www.jmap.org ; http://illuminations.nctm.org ; www.unitedstreaming.com
Performance Indicators: A.A.42 Find the sine, cosine, and tangent ratios of an angle of a right triangle, given the lengths of the sides A.A.43 Determine the measure of an angle of a right triangle, given the length of any two sides of the triangle
A.A.44 Find the measure of a side of a right triangle, given an acute angle and the length of another side
16
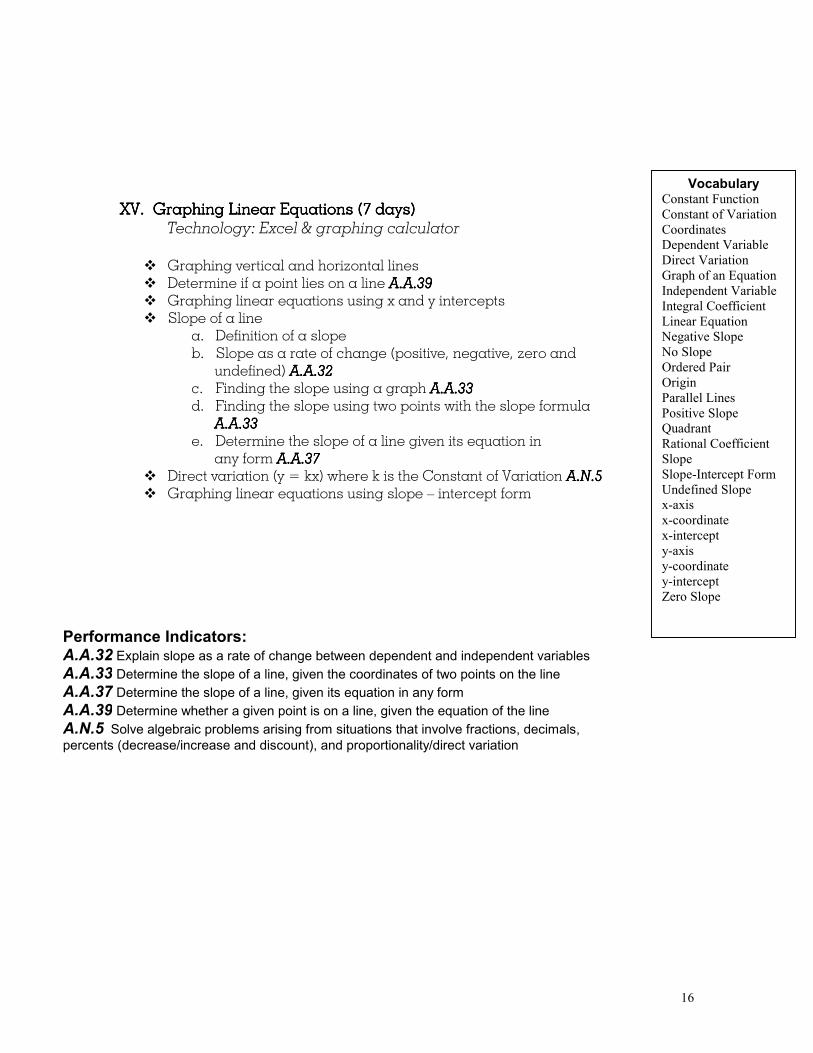
XV. XV. XV. XV. Graphing Linear Equations (7Graphing Linear Equations (7Graphing Linear Equations (7Graphing Linear Equations (7 days) days) days) days) Technology: Excel & graphing calculator
� Graphing vertical and horizontal lines � Determine if a point lies on a line A.A.39A.A.39A.A.39A.A.39 � Graphing linear equations using x and y intercepts � Slope of a line
a. Definition of a slope b. Slope as a rate of change (positive, negative, zero and undefined) A.A.32A.A.32A.A.32A.A.32 c. Finding the slope using a graph A.A.33A.A.33A.A.33A.A.33 d. Finding the slope using two points with the slope formula A.A.33A.A.33A.A.33A.A.33 e. Determine the slope of a line given its equation in any form A.A.37A.A.37A.A.37A.A.37
� Direct variation (y = kx) where k is the Constant of Variation A.N.5A.N.5A.N.5A.N.5 � Graphing linear equations using slope – intercept form
Vocabulary Constant Function
Constant of Variation
Coordinates
Dependent Variable
Direct Variation
Graph of an Equation
Independent Variable
Integral Coefficient
Linear Equation
Negative Slope
No Slope
Ordered Pair
Origin
Parallel Lines
Positive Slope
Quadrant
Rational Coefficient
Slope
Slope-Intercept Form
Undefined Slope
x-axis
x-coordinate
x-intercept
y-axis
y-coordinate
y-intercept
Zero Slope
Performance Indicators: A.A.32 Explain slope as a rate of change between dependent and independent variables A.A.33 Determine the slope of a line, given the coordinates of two points on the line A.A.37 Determine the slope of a line, given its equation in any form A.A.39 Determine whether a given point is on a line, given the equation of the line A.N.5 Solve algebraic problems arising from situations that involve fractions, decimals, percents (decrease/increase and discount), and proportionality/direct variation
17
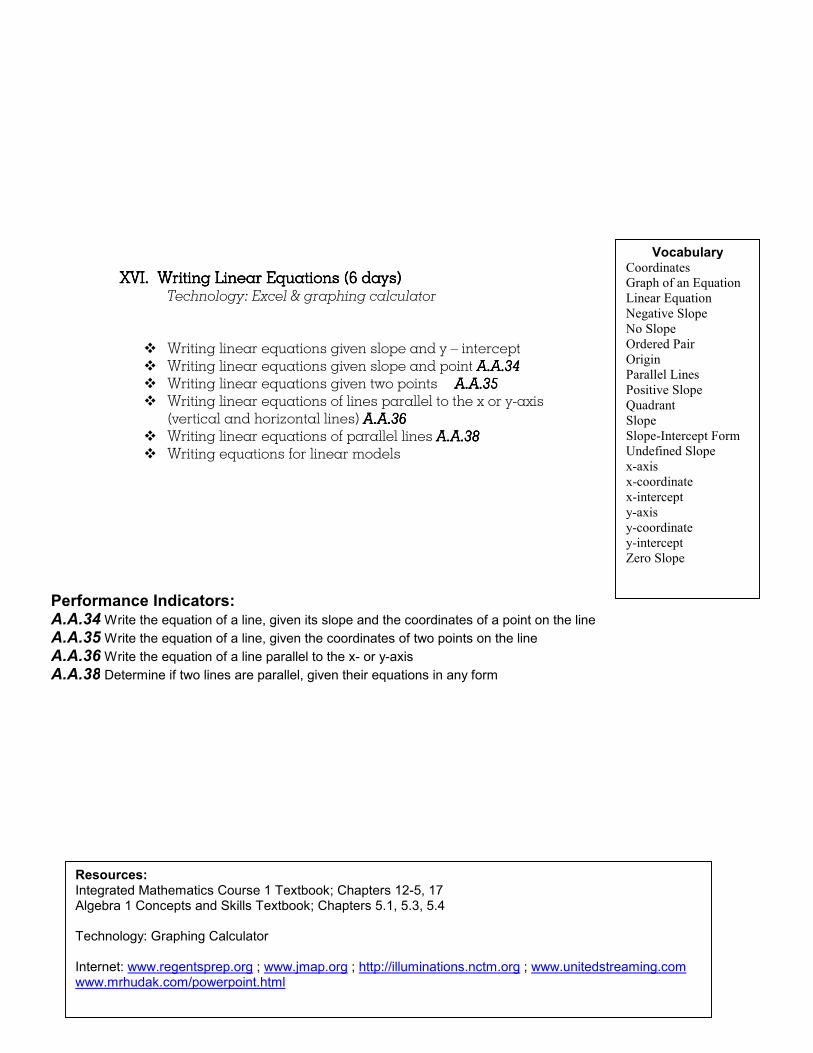
XVI. XVI. XVI. XVI. Writing Linear Equations (6 days)Writing Linear Equations (6 days)Writing Linear Equations (6 days)Writing Linear Equations (6 days)
Technology: Excel & graphing calculator
� Writing linear equations given slope and y – intercept � Writing linear equations given slope and point A.A.34A.A.34A.A.34A.A.34 � Writing linear equations given two points A.A.35A.A.35A.A.35A.A.35 � Writing linear equations of lines parallel to the x or y-axis
(vertical and horizontal lines) A.A.36A.A.36A.A.36A.A.36 � Writing linear equations of parallel lines A.A.A.A.A.A.A.A.38383838 � Writing equations for linear models
Resources: Integrated Mathematics Course 1 Textbook; Chapters 12-5, 17 Algebra 1 Concepts and Skills Textbook; Chapters 5.1, 5.3, 5.4 Technology: Graphing Calculator Internet: www.regentsprep.org ; www.jmap.org ; http://illuminations.nctm.org ; www.unitedstreaming.com www.mrhudak.com/powerpoint.html
Vocabulary Coordinates
Graph of an Equation
Linear Equation
Negative Slope
No Slope
Ordered Pair
Origin
Parallel Lines
Positive Slope
Quadrant
Slope
Slope-Intercept Form
Undefined Slope
x-axis
x-coordinate
x-intercept
y-axis
y-coordinate
y-intercept
Zero Slope
Performance Indicators: A.A.34 Write the equation of a line, given its slope and the coordinates of a point on the line A.A.35 Write the equation of a line, given the coordinates of two points on the line A.A.36 Write the equation of a line parallel to the x- or y-axis A.A.38 Determine if two lines are parallel, given their equations in any form
18
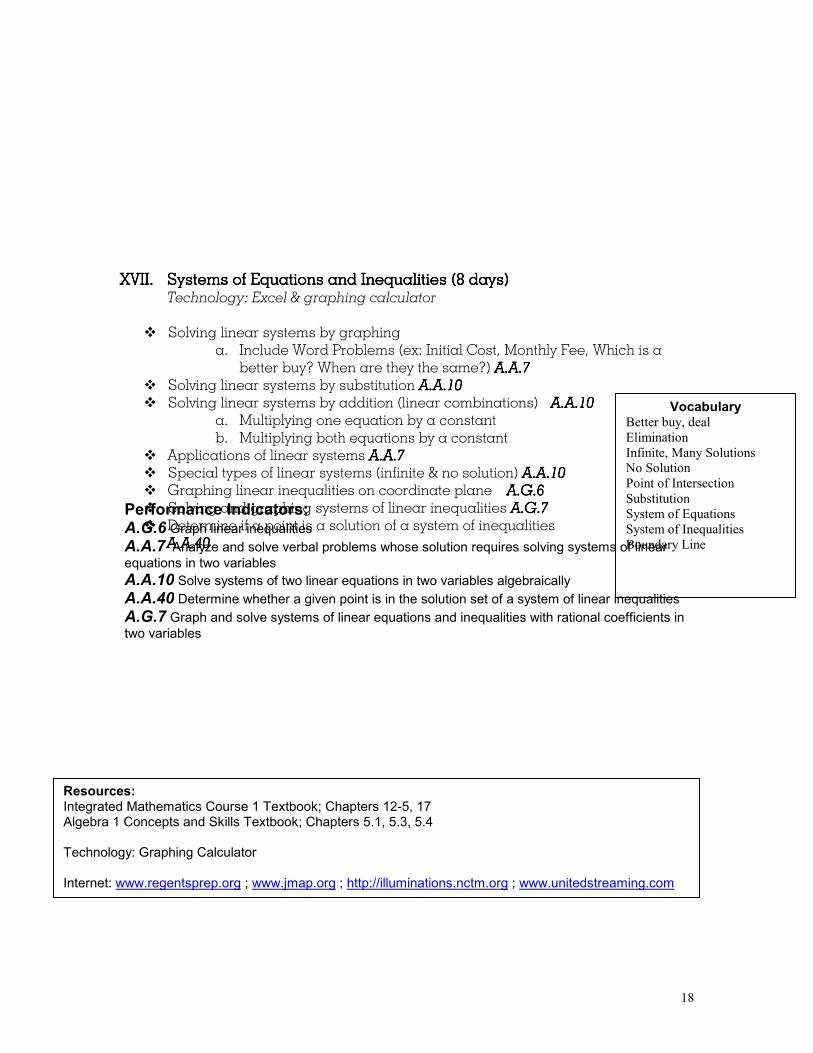
XVII. SXVII. SXVII. SXVII. Systems of Equations and Inequalities (8 days)ystems of Equations and Inequalities (8 days)ystems of Equations and Inequalities (8 days)ystems of Equations and Inequalities (8 days) Technology: Excel & graphing calculator
� Solving linear systems by graphing
a. Include Word Problems (ex: Initial Cost, Monthly Fee, Which is a better buy? When are they the same?) A.A.7 A.A.7 A.A.7 A.A.7
� Solving linear systems by substitution A.A.10A.A.10A.A.10A.A.10 � Solving linear systems by addition (linear combinations) A.A.10A.A.10A.A.10A.A.10
a. Multiplying one equation by a constant b. Multiplying both equations by a constant
� Applications of linear systems A.A.7A.A.7A.A.7A.A.7 � Special types of linear systems (infinite & no solution) A.A.10A.A.10A.A.10A.A.10 � Graphing linear inequalities on coordinate plane A.G.6A.G.6A.G.6A.G.6 � Solving and graphing systems of linear inequalities A.G.7A.G.7A.G.7A.G.7 � Determine if a point is a solution of a system of inequalities A.A.40A.A.40A.A.40A.A.40
Resources: Integrated Mathematics Course 1 Textbook; Chapters 12-5, 17 Algebra 1 Concepts and Skills Textbook; Chapters 5.1, 5.3, 5.4 Technology: Graphing Calculator Internet: www.regentsprep.org ; www.jmap.org ; http://illuminations.nctm.org ; www.unitedstreaming.com
Vocabulary Better buy, deal
Elimination
Infinite, Many Solutions
No Solution
Point of Intersection
Substitution
System of Equations
System of Inequalities
Boundary Line
Performance Indicators: A.G.6 Graph linear inequalities A.A.7 Analyze and solve verbal problems whose solution requires solving systems of linear equations in two variables A.A.10 Solve systems of two linear equations in two variables algebraically A.A.40 Determine whether a given point is in the solution set of a system of linear inequalities A.G.7 Graph and solve systems of linear equations and inequalities with rational coefficients in two variables
19
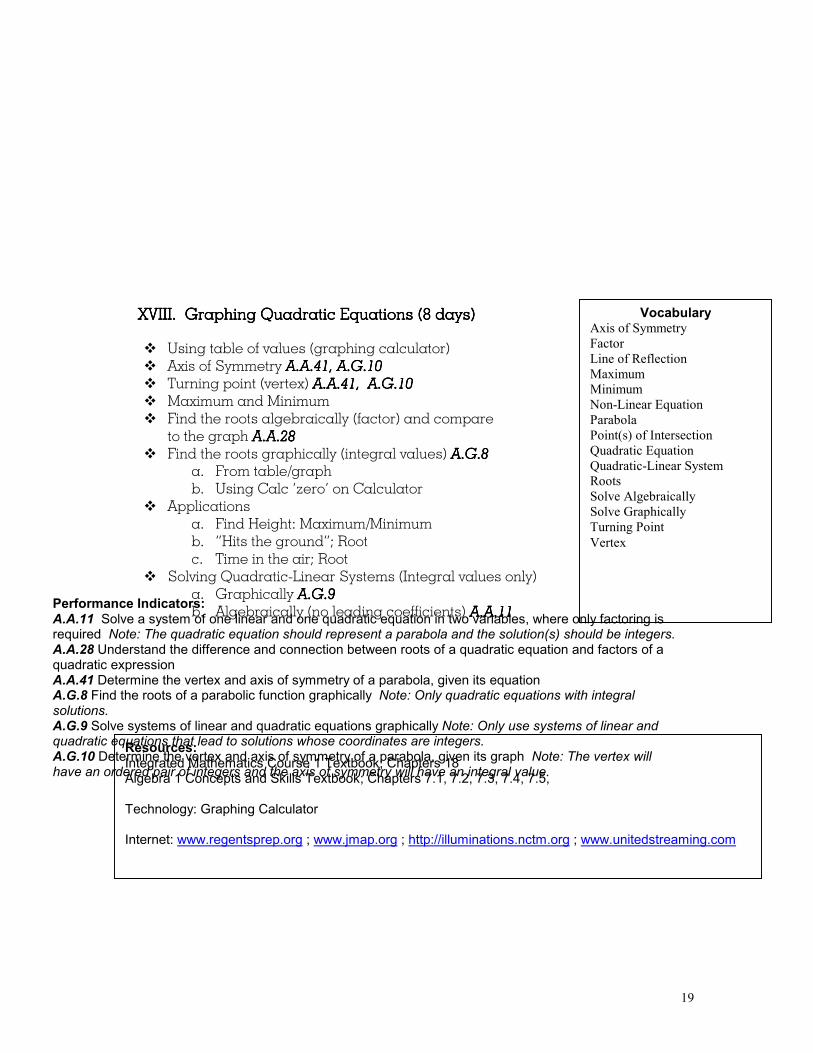
XVIII. XVIII. XVIII. XVIII. Graphing Quadratic EquationsGraphing Quadratic EquationsGraphing Quadratic EquationsGraphing Quadratic Equations (8 days) (8 days) (8 days) (8 days)
� Using table of values (graphing calculator) � Axis of Symmetry A.A.41 A.A.41 A.A.41 A.A.41,,,, A.G.10 A.G.10 A.G.10 A.G.10 � Turning point (vertex) A A A A.A.41.A.41.A.41.A.41, , , , A.G.10 A.G.10 A.G.10 A.G.10 � Maximum and Minimum � Find the roots algebraically (factor) and compare
to the graph A.A.28A.A.28A.A.28A.A.28 � Find the roots graphically (integral values) A.G.8 A.G.8 A.G.8 A.G.8
a. From table/graph b. Using Calc ‘zero’ on Calculator
� Applications a. Find Height: Maximum/Minimum b. “Hits the ground”; Root c. Time in the air; Root
� Solving Quadratic-Linear Systems (Integral values only) a. Graphically A.G.9A.G.9A.G.9A.G.9 b. Algebraically (no leading coefficients) A.A.11 A.A.11 A.A.11 A.A.11
Vocabulary Axis of Symmetry
Factor
Line of Reflection
Maximum
Minimum
Non-Linear Equation
Parabola
Point(s) of Intersection
Quadratic Equation
Quadratic-Linear System
Roots
Solve Algebraically
Solve Graphically
Turning Point
Vertex
Resources: Integrated Mathematics Course 1 Textbook; Chapters 18 Algebra 1 Concepts and Skills Textbook; Chapters 7.1, 7.2, 7.3, 7.4, 7.5, Technology: Graphing Calculator Internet: www.regentsprep.org ; www.jmap.org ; http://illuminations.nctm.org ; www.unitedstreaming.com
Performance Indicators: A.A.11 Solve a system of one linear and one quadratic equation in two variables, where only factoring is required Note: The quadratic equation should represent a parabola and the solution(s) should be integers. A.A.28 Understand the difference and connection between roots of a quadratic equation and factors of a quadratic expression A.A.41 Determine the vertex and axis of symmetry of a parabola, given its equation A.G.8 Find the roots of a parabolic function graphically Note: Only quadratic equations with integral solutions. A.G.9 Solve systems of linear and quadratic equations graphically Note: Only use systems of linear and quadratic equations that lead to solutions whose coordinates are integers. A.G.10 Determine the vertex and axis of symmetry of a parabola, given its graph Note: The vertex will have an ordered pair of integers and the axis of symmetry will have an integral value.
20
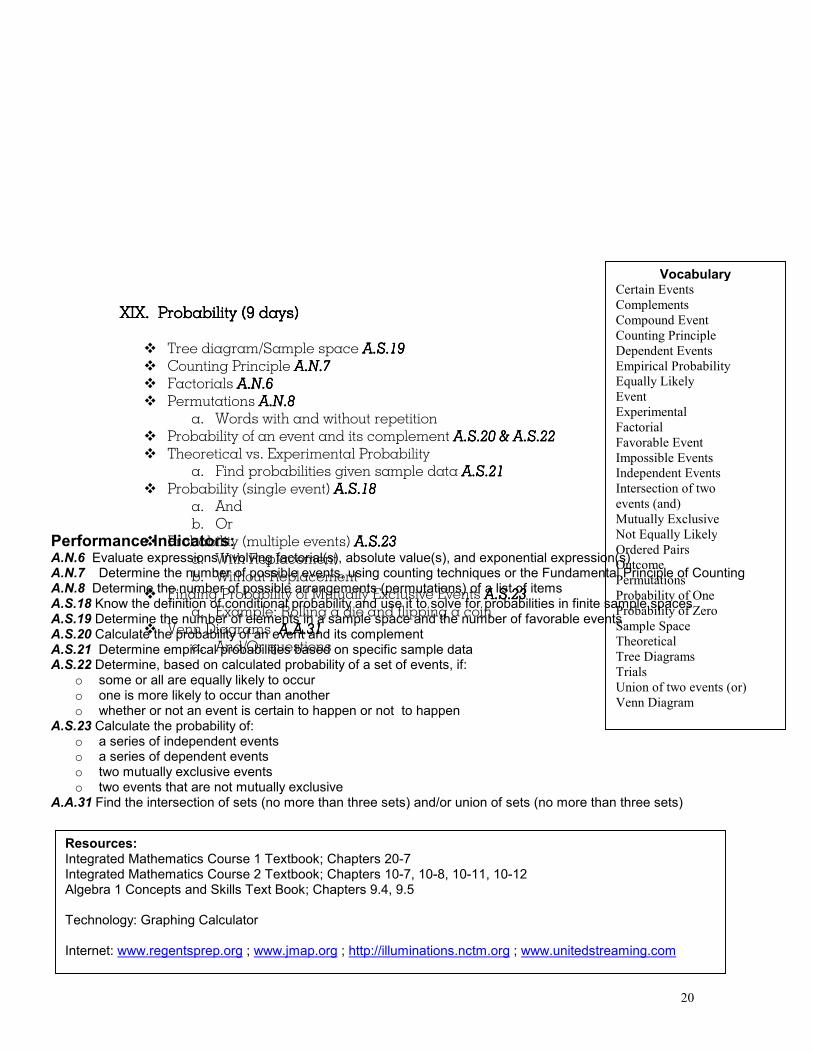
XIX. XIX. XIX. XIX. Probability (Probability (Probability (Probability (9999 days) days) days) days) � Tree diagram/Sample space A.A.A.A.S.19S.19S.19S.19 � Counting Principle A.N.7 A.N.7 A.N.7 A.N.7 � Factorials A.N.6 A.N.6 A.N.6 A.N.6 � Permutations A.N.8A.N.8A.N.8A.N.8
a. Words with and without repetition � Probability of an event and its complement A.S.20 & A.S.20 & A.S.20 & A.S.20 & A.S.22A.S.22A.S.22A.S.22 � Theoretical vs. Experimental Probability
a. Find probabilities given sample data A. A. A. A.S.21 S.21 S.21 S.21 � Probability (single event) A.S.18 A.S.18 A.S.18 A.S.18
a. And b. Or
� Probability (multiple events) A.S.23 A.S.23 A.S.23 A.S.23 a. With Replacement b. Without Replacement
� Finding Probability of Mutually Exclusive Events A.S.23 A.S.23 A.S.23 A.S.23 a. Example: Rolling a die and flipping a coin
� Venn Diagrams A.A.31A.A.31A.A.31A.A.31 a. And/Or questions
Resources: Integrated Mathematics Course 1 Textbook; Chapters 20-7 Integrated Mathematics Course 2 Textbook; Chapters 10-7, 10-8, 10-11, 10-12 Algebra 1 Concepts and Skills Text Book; Chapters 9.4, 9.5 Technology: Graphing Calculator Internet: www.regentsprep.org ; www.jmap.org ; http://illuminations.nctm.org ; www.unitedstreaming.com
Vocabulary Certain Events
Complements
Compound Event
Counting Principle
Dependent Events
Empirical Probability
Equally Likely
Event
Experimental
Factorial
Favorable Event
Impossible Events
Independent Events
Intersection of two
events (and)
Mutually Exclusive
Not Equally Likely
Ordered Pairs
Outcome
Permutations
Probability of One
Probability of Zero
Sample Space
Theoretical
Tree Diagrams
Trials
Union of two events (or)
Venn Diagram
Performance Indicators: A.N.6 Evaluate expressions involving factorial(s), absolute value(s), and exponential expression(s) A.N.7 Determine the number of possible events, using counting techniques or the Fundamental Principle of Counting A.N.8 Determine the number of possible arrangements (permutations) of a list of items A.S.18 Know the definition of conditional probability and use it to solve for probabilities in finite sample spaces A.S.19 Determine the number of elements in a sample space and the number of favorable events A.S.20 Calculate the probability of an event and its complement A.S.21 Determine empirical probabilities based on specific sample data A.S.22 Determine, based on calculated probability of a set of events, if:
o some or all are equally likely to occur o one is more likely to occur than another o whether or not an event is certain to happen or not to happen
A.S.23 Calculate the probability of: o a series of independent events o a series of dependent events o two mutually exclusive events o two events that are not mutually exclusive
A.A.31 Find the intersection of sets (no more than three sets) and/or union of sets (no more than three sets)
21
XX. XX. XX. XX. StatisticsStatisticsStatisticsStatistics (10 Days) (10 Days) (10 Days) (10 Days)
� Data a. Qualitative (descriptive) vs. Quantitative (numerical) A.S.1 A.S.1 A.S.1 A.S.1 b. Bivariate (2-Variables) vs. Univariate (1-Variable) A.S.2 A.S.2 A.S.2 A.S.2 c. Biased vs. Non-biased A.S.3 A.S.3 A.S.3 A.S.3,,,, A.S.10A.S.10A.S.10A.S.10, , , , A.S.15 A.S.15 A.S.15 A.S.15 d. Outliers
� Measures of Central Tendency and Range A.S.16A.S.16A.S.16A.S.16 a. Appropriateness of each A.S.4 A.S.4 A.S.4 A.S.4
� Construct and Interpret each of the following displays of data a. Frequency Histogram A.S.5 & A.S.9 A.S.5 & A.S.9 A.S.5 & A.S.9 A.S.5 & A.S.9
o Table o Graph o Percentiles and Quartiles A.S.11 A.S.11 A.S.11 A.S.11
b. Cumulative Frequency Histogram A.S.5 & A.S.9 A.S.5 & A.S.9 A.S.5 & A.S.9 A.S.5 & A.S.9 o Table o Graph o Percentiles and Quartiles A.S.11 A.S.11 A.S.11 A.S.11
c. Box and Whisker Plot A.S.5 & A.S.5 & A.S.5 & A.S.5 & A.S.6 & A.S.6 & A.S.6 & A.S.6 & A.S.9A.S.9A.S.9A.S.9 o Lower Quartile A.S.11 A.S.11 A.S.11 A.S.11 o Median A.S.11 A.S.11 A.S.11 A.S.11 o Upper Quartile A.S.11 A.S.11 A.S.11 A.S.11 o Minimum value o Maximum value
d. Scatter Plot A.S.7 A.S.7 A.S.7 A.S.7 o Independent vs. Dependent o Line of Best Fit (graphing calculator) A.S.8 A.S.8 A.S.8 A.S.8
� Make Predictions based on the line of best fit A.S.17A.S.17A.S.17A.S.17
o Correlation A.S.12 A.S.12 A.S.12 A.S.12 � Positive � Negative � Zero � Correlation vs. Causation A.S.13 & A.S.1 A.S.13 & A.S.1 A.S.13 & A.S.1 A.S.13 & A.S.14444
Resources: Integrated Mathematics Course 1 Textbook; Chapters 15 Technology: Graphing Calculator Internet: www.regentsprep.org; www.jmap.org ; http://illuminations.nctm.org ; www.unitedstreaming.com http://illuminations.nctm.org/ActivityDetail.aspx?ID=67 (random drawing tool – individual trials) ; http://illuminations.nctm.org/ActivityDetail.aspx?ID=159 (random drawing tool – sampling distribution) ; http://illuminations.nctm.org/ActivityDetail.aspx?ID=79 (adjustable spinner)
Vocabulary 5 number summary
Appropriateness
Bar Graph
Biased
Bi-modal
Bivariate
Box and whisker
Causation
Census
Central Angle
Central Tendency
Circle Graph
Correlation
Cumulative Frequency
Data
Extrapolation
Frequency Table
Histogram
Interpolation
Interquartile range
Interval
Line of best fit
Maximum
Mean
Median
Minimum
Misleading Statistics
Modal Interval
Mode
Outlier
Percentile
Population
Qualitative
Quantitative
Quartiles (specifically;
first, second, third, or
lower, middle, upper)
Random
Random Sample
Range
Sample
Scale
Scatter plot
Tally
Unbiased
Uni-variate
22
(Performance Indicators and Resources for this unit are on following page)
Performance Indicators: A.S.1 Categorize data as qualitative or quantitative A.S.2 Determine whether the data to be analyzed is univariate or bivariate A.S.3 Determine when collected data or display of data may be biased A.S.4 Compare and contrast the appropriateness of different measures of central tendency for a given data set A.S.5 Construct a histogram, cumulative frequency histogram, and a box-and-whisker plot, given a set of data A.S.6 Understand how the five statistical summary (minimum, maximum, and the three quartiles) is used to construct a box-and-whisker plot A.S.7 Create a scatter plot of bivariate data A.S.8 Construct manually a reasonable line of best fit for a scatter plot and determine the equation of that line A.S.9 Analyze and interpret a frequency distribution table or histogram, a cumulative frequency distribution table or histogram, or a box-and-whisker plot A.S.10 Evaluate published reports and graphs that are based on data by considering: experimental design, appropriateness of the data analysis, and the soundness of the conclusions A.S.11 Find the percentile rank of an item in a data set and identify the point values for first, second, and third quartiles A.S.12 Identify the relationship between the independent and dependent variables from a scatter plot (positive, negative, or none) A.S.13 Understand the difference between correlation and causation A.S.14 Identify variables that might have a correlation but not a causal relationship A.S.15 Identify and describe sources of bias and its effect, drawing conclusions from data A.S.16 Recognize how linear transformations of one-variable data affect the data’s mean, median, mode, and range A.S.17 Use a reasonable line of best fit to make a prediction involving interpolation or extrapolation
Resources: Integrated Mathematics Course 1 Textbook; Chapters 16 Technology: Graphing Calculator, Excel Internet: www.regentsprep.org ; www.jmap.org ; http://illuminations.nctm.org ; www.unitedstreaming.com http://nces.ed.gov/nceskids/Graphing/ (graphing scatter plots) ; http://illuminations.nctm.org/ActivityDetail.aspx?ID=160 (mean, median, box-and-whisker plot) ; http://illuminations.nctm.org/ActivityDetail.aspx?ID=82 (line of best fit) ; http://illuminations.nctm.org/ActivityDetail.aspx?ID=77 (box and whisker plot) ; http://illuminations.nctm.org/ActivityDetail.aspx?ID=146 (line of best fit)
Recommended