IIA Meeting – Measuring IA value and performance
February 12, 2016
Jen Carlson, EY Advisory Services Senior
Manager

Page 1 Measuring IA value and performance
Contents
► Introduction
► Defining the value of Internal Audit (IA)
► Measuring value and performance-metrics matter
► Communicating effectively
► Appendix

Page 2 Measuring IA value and performance
Polling question #1
► What is your current role?
A. Internal Audit leadership/(S)VP/director
B. Internal Audit manager/leader
C. Internal Audit staff
D. Internal Audit co-source provider

Page 3 Measuring IA value and performance
Introduction

Page 4 Measuring IA value and performance
What is value?
► How IA value is perceived by an organization can be
influenced by a number of factors:
► Corporate culture
► Scale, complexity and nature of the business
► Organizational structure
► Regulatory requirements
► Competitive pressures
Value is in the eye of the beholder!

Page 5 Measuring IA value and performance
The IA value proposition
Internal Audit:
► Provides assurance on the
organization’s governance, risk
management and control processes
to support the achievement of
enterprise goals
► Analyzes and assesses data and
business processes to offer insights
and recommendations for improved
efficiency and effectiveness
► Commits to honesty and integrity and
serves as an objective source of
independent advice
IIA Internal Audit value
proposition
Source: The IIA’s Internal Audit Value
Proposition graphic

Page 6 Measuring IA value and performance
What if Internal Audit was a valued business advisor?
Audit committee and executive
management expectations
Strategic and business
line goals
Mandate for Internal Audit
Strategic and valued advisor
Internal Audit function serves as a subject matter
specialist to business management around strategic
initiatives, challenges and changes in the organization.
The function has the people, knowledge and experiences
to effectively provide this level of service.
Business insight
In addition to covering the “basics,” the Internal Audit
function is designed to provide high-quality, relevant
business insight as an integral part of its activities.
Business insight is not a by-product, but an explicit
outcome from the function’s activities.
Non-negotiable
Control and compliance monitoring structure
Internal Audit function focused on evaluating the design
and the effectiveness of internal controls in those areas
outlined in their charter or mandate. Also includes focusing
on compliance with key regulations and policies.

Page 7 Measuring IA value and performance
Polling question #2
► How would you describe your IA department’s
focus today?
A. Offer strategic advice plus provide business insights and
cover control and compliance activities
B. Provide business insights plus cover control and
compliance activities
C. Evaluate control and compliance activities
Page 8 Measuring IA value and performance
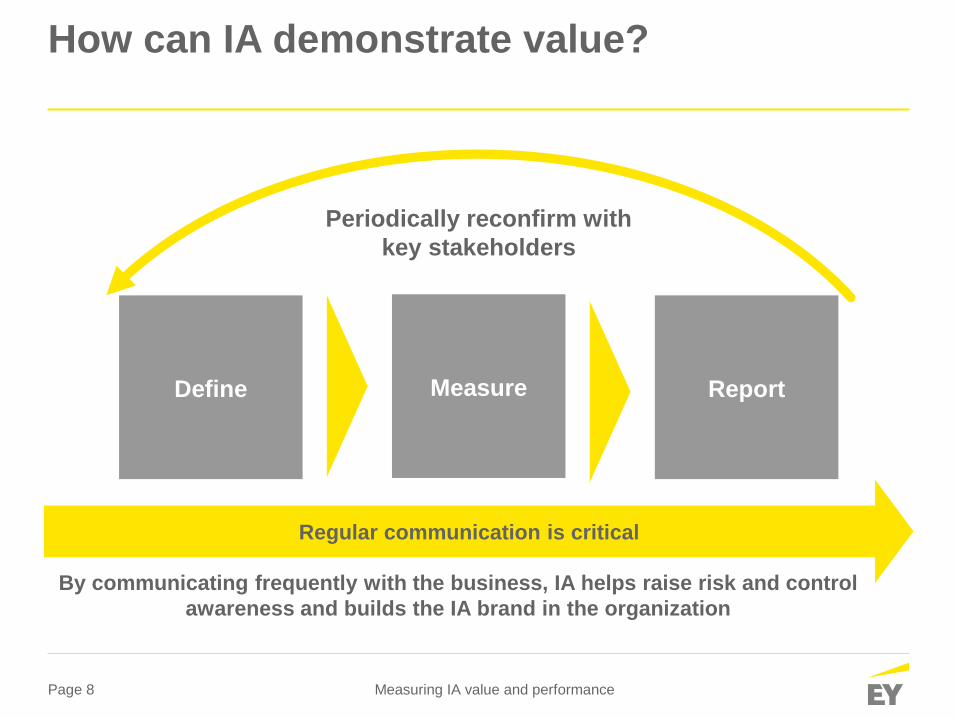
How can IA demonstrate value?
Regular communication is critical
Periodically reconfirm with
key stakeholders
Define Measure Report
By communicating frequently with the business, IA helps raise risk and control
awareness and builds the IA brand in the organization

Page 9 Measuring IA value and performance
Defining the value of IA

Page 10 Measuring IA value and performance
Defining value
► How can IA define its value?
► Understand who the stakeholders are, for example:
► Audit committee
► Executive management
► Business line management
► Other risk/insurance/compliance functions
► Regulators
► External auditors
► Conduct interviews to learn what they expect from IA:
► Not all stakeholders are created equal, but all perspectives are helpful
when defining value.
► Develop a list of value-adding activities based on input from
various stakeholders with special emphasis on key stakeholders
(e.g., audit committee and executive management)

Page 11 Measuring IA value and performance
Defining value
► How can IA define its value?
► Add proactive IA activities that go beyond core traditional IA
activities that will add value
► Validate the list with key stakeholders and agree on what
constitutes true value
► Agree on a mandate with the audit committee and
executive management
► Verify that the mandate is reflected in the IA Charter

Page 12 Measuring IA value and performance
A balancing act Meeting stakeholder expectations
► As stakeholders demand more, IA needs to align its focus to these expectations.
Focus will be balanced not just on the assurance activities historically incorporated in
audit plans, but also to continue to increase advisory activities that drive business
insights and serve as a source of independent advice.
► Finding that balance is unique to each organization and its strategic objectives.
► This balance does not become stagnant, but continually teeters between the two as
objectives change.
AdvisoryAssuranceInternal Audit
mandate
Internal Audit needs to be nimble and flexible in order to respond to the changing environment.

Page 13 Measuring IA value and performance
Value-add activities to consider
Case studyA global IA department includes time for a balanced set of activities in its
annual strategic plan. A sample of activities include:
► Factors strategic risks in its risk assessment and audit plan
► Proactively reviews control design during large system
development projects
► Conducts monthly lunch and learn events for the organization
► Offers internal online courses on risk and control
► Establishes regular meetings with stakeholders to keep abreast of
changing priorities and build relationships
Strategic transactions
Plan to participate, evaluate risks and/or
review the design of controls throughout
the project
Triggering events may include:
► Mergers, acquisitions or divestitures
► New product launch
► Patent expiry
► Litigation
Risk and control
awareness sessions
Provide periodic
sessions to the business
around risks and controls
of significance to the
organization
Strategic risks
There appears to be a
significant disconnect
between the risks that
can have the most
significant impact on
the organization and
the amount of time IA
spends on those risks. Source: Executive Guidance: Reducing Risk Management’s
Organizational Drag, CEB, Inc. 2014
% of strategic risk failure
leading to a significant
market decline
% of time IA
spends on
strategic risks
86% 6%

Page 14 Measuring IA value and performance
Value-add activities to consider
Case studyAn IA department in a large institution formally devotes a portion of its available hours to
identifying emerging risks and their implications to the business. IA then discusses the
issue, risk implications and opportunities with the business. A sample of the risk
categories include:
► Cyber threats and recent events in the marketplace
► Changes to the geopolitical and/or economic landscape that might
impact the organization
► Changes in emerging markets where the organization does business
► Competitor innovations and their implications to the organization
► Events that might impact the company’s reputation
Emerging risks
IA needs to become the
forward-looking “eyes” of
management and the
board, offering visibility not
only into the risks they
know and monitor today,
but also where risks may
emerge or evolve as the
business continues to
change, e.g., cyber, use of
third parties, social media
and business continuity.
Leading practice – IA
helps management seize
the upside potential
associated with
emerging risks by
working with them to
identify, assess and
determine risk
tolerances.
Source: “There’s no reward without risk: EY’s global governance, risk and compliance survey 2015”
of respondents evaluate their
organization’s risk profile on an annual
basis, limiting their ability to adjust their
business strategy based on changes to
their risk landscape.
77%
of respondents only prepare
management dashboards annually or
quarterly, indicating further opportunity
exists to provide decision-makers with
vital risk insights.
78%
of respondents do not
produce a report, or only
prepare an integrated risk
management
report annually.
65%
Page 15 Measuring IA value and performance
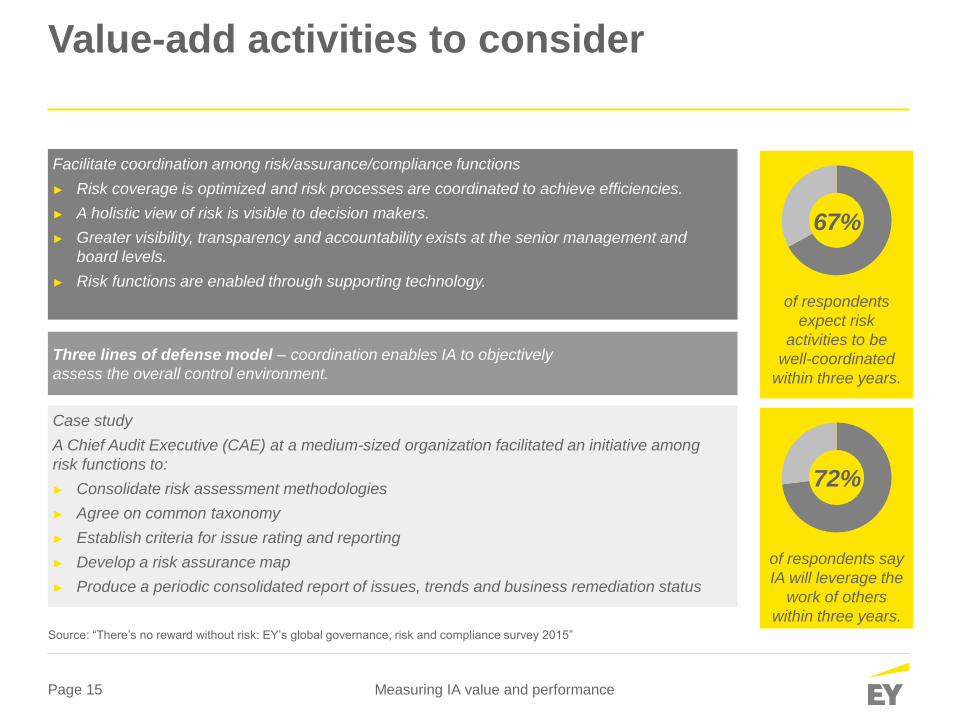
Value-add activities to consider
Case study
A Chief Audit Executive (CAE) at a medium-sized organization facilitated an initiative among
risk functions to:
► Consolidate risk assessment methodologies
► Agree on common taxonomy
► Establish criteria for issue rating and reporting
► Develop a risk assurance map
► Produce a periodic consolidated report of issues, trends and business remediation status
Facilitate coordination among risk/assurance/compliance functions
► Risk coverage is optimized and risk processes are coordinated to achieve efficiencies.
► A holistic view of risk is visible to decision makers.
► Greater visibility, transparency and accountability exists at the senior management and
board levels.
► Risk functions are enabled through supporting technology.
Three lines of defense model – coordination enables IA to objectively
assess the overall control environment.
of respondents say
IA will leverage the
work of others
within three years.
of respondents
expect risk
activities to be
well-coordinated
within three years.
Source: “There’s no reward without risk: EY’s global governance, risk and compliance survey 2015”
67%
72%

Page 16 Measuring IA value and performance
Measuring value – metrics matter

Page 17 Measuring IA value and performance
Metrics matter
“What gets measured gets done, what gets
measured and fed back gets done well, what
gets repeated gets rewarded.”John E. Jones, noted author and leadership trainer

Page 18 Measuring IA value and performance
Metrics matter
► Metrics do more than set goals:
► They effectively communicate priorities.
► They help drive behavior.
► Metrics that do not align with the organization’s goals can
make those goals harder to reach.
► Metrics should be aligned with IA’s mandate to facilitate
delivering value.
► Effective metrics increase employee motivation
and satisfaction.

Page 19 Measuring IA value and performance
Is there a measurement gap?
of CAEs surveyed say
informing and advising the
audit committee bring the
most value.
of CAEs surveyed say
they have no formal
measures of value.
1. Assuring the adequacy and
effectiveness of the internal
control system (86%)
2. Recommending business
improvement (55%)
3. Assuring the organization’s
risk management
processes (53%)
4. Assuring regulatory
compliance (50%)
5. Informing and advising
management (40%)
1. Percentage of audit plan
complete (66%)
2. Timely closure of
audit issues (42%)
3. Completion of mandated
coverage (41%)
4. Client satisfaction
goals (38%)
5. The fulfillment of specific
expectations set and agreed
to with key stakeholders
(32%)
Top five IA activities that bring
the most value*
Top five IA
performance measures*
* Chief audit executive responses
Source: Delivering on the promise: Measuring Internal Audit Value and Performance, IIA CBOK 2015
15%
28%
Page 20 Measuring IA value and performance
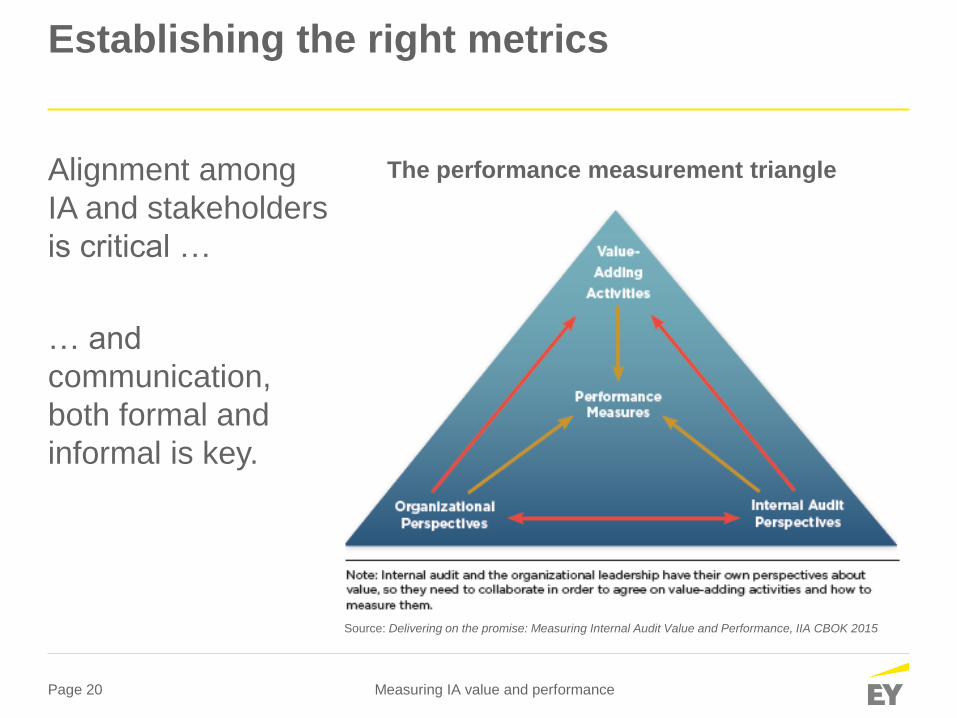
Establishing the right metrics
Alignment among
IA and stakeholders
is critical …
… and
communication,
both formal and
informal is key.
The performance measurement triangle
Source: Delivering on the promise: Measuring Internal Audit Value and Performance, IIA CBOK 2015

Page 21 Measuring IA value and performance
Closing the measurement gap
► Develop specific, measurable (quantitative and/or qualitative) metrics
that address stakeholder expectations and operational aspects of the
department (operate like a business)
Moving to a more balanced approach
► Traditional metrics:
► Audit plan completion
► Risk areas covered
► Utilization rate
► Training hours
► Audit cycle time
► Additional metrics:
► Leading practices shared
► Substantive conversations
► Design of
controls evaluation
► Leadership development
► Trends and issues identified

Page 22 Measuring IA value and performance
IA value scorecard Track and evaluate value delivered through KPIs
Utilization
Leading practices
implemented
Cost savings
realized
Training
Audit plan
completion
Tra
dit
ion
al IA
KP
IsE
me
rgin
g IA
KP
Is
Risk areas covered
At or above targetUnderutilized
100% complianceNo training
Compliance only Leading practices
above target
No quantified cost
savings
Cost savings above
target
Significantly delayed
program
100% audit completion
Compromised risk
coverage
100% risk coverage
Is our team fully utilized at all levels within the
IA function?
How many IA recommendations on leading
practices were implemented by business?
What cost savings has IA identified through
control efficiencies or operational
recommendations?
Has the IA team completed training, CPE
credits and appropriate certifications?
What percent of the audit plan been
completed?
Have all significant risks been monitored by IA
through the audit plan?
Benchmarking and
business insight
What type of external business insight and
industry benchmarking is brought to the
business by IA?
No external
insightsBenchmarking on all
targeted areas
Assessment of key performance indicator (KPI)
Subject-matter
resources
What percent of the audit plan makes use of
subject-matter resources to increase audit
depth/value?
General IA
team onlySMRs brought into all
targeted audits
Illustrative

Page 23 Measuring IA value and performance
Consider a self-assessment model
How is your IA function positioned to deliver and demonstrate value?
Focus area Basic Evolving Established Advanced Leading
Stakeholder
expectations
Expectations of IA stakeholders
may not be fully understood.
IA purpose and mandate is directly
aligned with stakeholder expectations.
Mandate IA strategy and objectives are
narrowly defined with little or no
input from executive management
or the audit committee.
IA strategy, objectives and value
contribution to the business are co-
developed with executive management
and the audit committee and are fully
aligned with organizational strategies
and business objectives.
Communication
with key
stakeholders
Communication may be limited,
infrequent and/or focused only on
IA results.
IA communication with the audit
committee, executive management and
the business occurs on a regular basis
and includes discussions of emerging
risks, trends and leading control
practices.
Leadership
development
Job rotation assignments between
internal audit and the business are
ad hoc.
IA plays a key role in the organization’s
leadership development program as
critical step of a formal job rotation
program.
Illustrative

Page 24 Measuring IA value and performance
Consider a self-assessment model
Focus area Basic Evolving Established Advanced Leading
IA enabled
business
performance
IA activities are primarily focused
on controls and compliance.
IA focuses on risks that would inhibit
achievement of business objectives,
enable value creation and support cost
reduction.
People IA does not utilize a people model
to identify and align skills with key
risk areas and internal/external
stakeholder expectations.
The IA function utilizes a formalized
people model to document skills by
level and align skills with key risk areas
and internal/external stakeholder
expectations.
Methods Audit needs assessment does not
reflect the business strategy and
risk profile.
Integration of risk assessment/audit
planning and IA activities including
periodic updates to the audit needs
assessment.
Technology
enablement
IA utilizes basic tools and
technology providing limited
efficiency and leverage.
IA utilizes leading edge tools and
technologies which enable
effective/efficient work streams,
collaborative efforts and efficient
knowledge exchange.
How is your IA function positioned to deliver and demonstrate value?
Illustrative

Page 25 Measuring IA value and performance
Communicating effectively

Page 26 Measuring IA value and performance
Communicating effectively
► Align with the IIA’s International Professional Practices Framework
(IPPF) Core Principles that call for IA to:
► Communicate effectively
► Be insightful, proactive and future-focused
► Align with the strategies, objectives and risks of the organization
► Consider these attributes of effective communication:
► Demonstrates and communicates that IA is bringing value to the table
► Is not an annual exercise – should be in the “rhythm of the business”
► Must be formal and informal – oral and “in writing”
► Must be at the level and depth of interest to the “audience”
► Establishes communication protocols that foster open discussions with
management and other key stakeholders
► Revisits expectations and discuss IA’s progress towards meeting them

Page 27 Measuring IA value and performance
Communicating effectively
Communication with the business and
other risk/compliance functions Communication with the IA staff
Benefits:
► Provides the opportunity to move
beyond IA’s traditional role
► Builds relationships and trust
► Encourages coordination
► Helps change the culture
Benefits:
► Explains the value of metrics
► Gains buy-in on performance metrics
► Builds relationships and trust among
the staff
► Encourages coordination with others
Consider:
► Planning regular meetings to discuss
the business
► Periodic written reports concerning
audit activities
Consider:
► Regular staff meetings to discuss the
“state of internal audit activities”
► Encouraging staff to participate in
Corporate activities (e.g., charitable
events to build relationships with
colleagues beyond IA)

Page 28 Measuring IA value and performance
Communicating effectively
Communication with the audit committee and executive management
Develop a communication plan to meet regularly with members of executive management
and the audit committee chair
Sample topics to be discussed:
► Discussion of major risk trends and their implications (e.g., external events, major
system development implementations, significant management changes)
► IA issue trends, remediation status and implications
► Business insights and improvement opportunities noted
► Notable IA accomplishments/changes
► Upcoming IA projects
► Changes to the business and their impact on the IA plan

Page 29 Measuring IA value and performance
Audit committee reporting considerations
► Consider corporate culture and reporting norms
► Address stakeholder expectations and call out as appropriate
► Include qualitative and quantitative information and metrics
► Reflect key issues, trends noted, emerging risks and areas of focus
► Keep report at a relatively high level and provide details in an appendix
► Consider using a balanced scorecard or dashboard
Tips for presentation and display
► Use graphics, e.g., pie charts, bar
charts, wherever possible to
concisely deliver the message
► Establish a calendar of information
to be reported, to whom and when
► Develop a template for consistency
and comparison

Page 30 Measuring IA value and performance
Appendix

Page 31 Measuring IA value and performance
Potential key performance indicators
Objective Category Measurement
Lead
ers
hip
/bu
sin
ess
ad
vis
or
Leader development ► # IA staff promoted within IA
► IA is active participant in a leadership rotation program
► # IA alumni promoted within company
► # IA alumni at XX rank or XX salary grade
► # company staff seconded to IA
► IA viewed as the steward and first rotation of college recruitment program
for finance
Strategic alignment ► # audits that are aligned with key strategic initiatives
Audit committee/executive management
satisfaction survey
► Average overall ratings from each group
► Improvement from prior year
Benchmarking and business insight ► What external business insights and industry benchmarking is brought to
the business by IA
Management requests ► # of ad hoc management requests added to audit plan
Leading practices implemented ► How many IA recommendations on leading practices were implemented by
business
Executive interaction ► # interactions of IA leaders (CAE, directors, managers) with key executives
(as defined)
► #/% AC meetings attended by IA
Items marked in bold indicate emerging KPIs

Page 32 Measuring IA value and performance
Potential key performance indicators
Objective Category Measurement
Au
dit
eff
ecti
ven
ess
Risk areas covered ► % significant risks (as defined) addressed by IA plan
► New key business risks identified by IA
► Percentage of high, medium and low risk areas covered
Risk assessment ► Risk assessment coordinated with other risk/control compliance functions
► Risk assessment refresh performed as defined
Involvement of subject matter
resources (SMR)
internal or external to the company
► # audits that include SMRs
► % of audits with SMRs
► SMR participation across audit life cycle (hrs/%)
Quality Assurance and Improvement
Program (QAIP)
Internal
► #/% audits reviewed
► #/% audits with findings
► #/% findings that remain unresolved
► #/% recurring findings
► Annual review of IA Charter
QAIP
External
► Conformance opinion
► External assessment conducted within five years
Customer satisfaction ► Results of interviews conducted by objective third party – internal or
external to the company
► Average satisfaction survey rating from customers
► Improvement over prior year
► Customer response rate
Items marked in bold indicate emerging KPIs

Page 33 Measuring IA value and performance
Potential key performance indicators
Objective Category Measurement
Au
dit
eff
icie
ncy
Audit plan completion ► # audits budgeted
► #/% of audit plan completed
► #/% of audits completed on time (as defined)
► # adjustments to the audit plan (add, cancel, defer, combine)
Audit cycle ► Total audit cycle time (days)
► Average # days for audit fieldwork (as defined)
► Average days to issue final report
► #/% audit results ratings (green, yellow, red)
Leverage ► # of findings that repeat across segments/business units
► # audits coordinated with other risk functions
► # repeat CAATs used by other audit teams
► # audits coordinated with external auditor
Audit costs ► Average costs per audit
► Average costs per auditor
► Travel as % of total department costs
► % of audits completed on budget (hrs and $)
► Actual hours as % of budgeted hours
► Actual $ as % of budgeted $
Technology enablement ► % of audits using data analytics
► % of audits using CAATs
Items marked in bold indicate emerging KPIs

Page 34 Measuring IA value and performance
Potential key performance indicators
Objective Category Measurement
Bu
sin
ess p
rocess im
pro
vem
en
t
Business process improvements
implemented
► %/# of process improvements recommended
► %/# of process improvements adopted by BU
► % of recommendations completed within agreed timing
► % of recommendations completed before original planned date
► # issues still open by audit plan year
► Average # days to close recommendations
► # of findings that repeat across segments/Bus
Cost savings realized ► Estimated $ cost savings identified through control efficiencies or
operational recommendations
► # recommendations that would result in cost reductions, stop revenue
leakage, improve working capital, control CAPEX, etc.
► Removal of redundant or ineffective controls
► # of audit procedures leveraging work of other risk/assurance/
compliance functions
Items marked in bold indicate emerging KPIs

Page 35 Measuring IA value and performance
Potential key performance indicators
Objective Category Measurement
Peo
ple
Utilization ► % of available hours on audits (by level)
► % of hours chargeable to audit project
► % of nights in hotel per five-day week
Certification ► % of staff certified
► Certifications held (by level)
Staff experience ► Years of experience in IA (by level)
► Years of industry experience (by level)
► % employees with industry experience
Turnover ► # staff transferred to roles in business
► # staff transferred from the business
► # staff leaving company
► # new hires
► Turnover rate (internal and external)
Staff development ► # hours training/CPE credits
► % feedback completed and delivered on time
► # “learning experiences” per auditor (e.g., participating in audit of particular BU
or around particular issue)
► # of business related courses attended
Employee satisfaction survey ► % satisfaction (by level)
► % improvement over prior year
Items marked in bold indicate emerging KPIs

Page 36 Measuring IA value and performance
Questions?
EY | Assurance | Tax | Transactions | Advisory
About EY
EY is a global leader in assurance, tax, transaction and advisory
services. The insights and quality services we deliver help build trust
and confidence in the capital markets and in economies the world
over. We develop outstanding leaders who team to deliver on our
promises to all of our stakeholders. In so doing, we play a critical role
in building a better working world for our people, for our clients and
for our communities.
EY refers to the global organization, and may refer to one
or more, of the member firms of Ernst & Young Global Limited,
each of which is a separate legal entity. Ernst & Young
Global Limited, a UK company limited by guarantee, does not
provide services to clients. For more information about our
organization, please visit ey.com.
Ernst & Young LLP is a client-serving member firm of
Ernst & Young Global Limited operating in the US.
© 2016 Ernst & Young LLP.
All Rights Reserved.
1602-1820683
ED None
This material has been prepared for general informational purposes
only and is not intended to be relied upon as accounting, tax or other
professional advice. Please refer to your advisors for specific advice.
ey.com
Recommended


![10. S · 10. s is - 2s - 1 (ia) _____ _____ 2 (iia) [ ] ns1 _____ _____ [ ] ns2+1 _____ _____ + 2](https://img.pdfslide.us/doc/110x75/5be5233109d3f2f9648d879f/10-s-10-s-is-2s-1-ia-2-iia-ns1-ns21.jpg)