Understanding undernutrition and its determinants at the district level:
The POSHAN District Nutrition Profiles
Purnima Menon with Abhilasha Vaid, Shruthi Cyriac, Suman Chakrabarti, Parul Tyagi, Aparna John and Neha Kohli
IFPRI, New Delhi
April 25, 2015
POSHAN is supported by the Bill & Melinda Gates Foundation

The state of nutrition in Bihar
Source: NFHS-3 (2005-06)Current nutrition situation remains unknown

What factors cause undernutriton?
Source: Gillespie et al. 2013

The most crucial period for child nutrition is from pre-pregnancy to the second year of life

What factors have led to improvements in undernutrition over time?
Global
(Smith & Haddad, 2014)
• Women’s education
• Sanitation
• Household assets
• Food security (energy and non-energy)
Brazil
(Monteiro et al., 2010)
• Equity in all underlying determinants
• Income
• Antenatal care
• Assets
Bangladesh
(Headey et al., 2014)
• Asset accumulation
• Antenatal care
• Fertility
• Decreasing open defecation
• Agricultural growth

Photo: P. Menon, UP, 2013
What does this mean for policy and programs?
Essential nutrition-specific
interventions to improve
essential actions within home
and community:
FeedingCare
Hygiene
Supportive environments at home and in communities through linking up with key sectors that are already
ramping up programs:
Social safety nets (PDS, MNREGA)Sanitation
Family planningSecondary education
Economic growth must continue because it has the potential to put
more resources in the hands of families.
Critical question is how to put in place *at the same time* and at the same place, for the same mother-child dyad* the conditions at both the underlying and
immediate levels to reach adolescents, women and children?

DISTRICT NUTRITION PROFILES (DNP): AN ATTEMPT TO PACKAGE DATA TO SUPPORT STRONGER DECENTRALIZED ACTION
Ph
oto
: Ap
arn
a Jo
hn
/IFP
RI-
ND
O/B
ihar
/20
14

District Nutrition Profiles (DNP)
• Draw on diverse sources of data to compile a set of indicators on the state of nutrition and its cross-sectoral determinants
• Aim to “bring people on the same page” about extent, causality and actions areas to address undernutrition• Serve as conversation –
starters

Indicator types
• Nutrition outcomes– Stunting; Underweight; Wasting; Anemia;
Underweight among women
• Determinants of undernutrition– Immediate
• IYCF practices; Immunization & supplementation; Disease burden; Adolescent & maternal health
– Underlying• Women’s status; WASH; Food security; Socio-economic
conditions
– Basic• Adult literacy rate• Access to services

AN EXAMPLE FROM GAYA, BIHARDEVELOPING DNPs

The nutrition situation
Data based on rural populationNO DATA AVAILABLE TO MAKE COMPARISONS!
^Children aged <5years; ^^Children aged <6years
Source: DLHS-2 (2002-04); NFHS-3 (2005-06); HUNGaMA (2011)
Anything on change?

Immediate determinants
22.2%18.6%
35.7%
48.3%
97.4% 98.5%
16.0%
31.0%
60.7%
10.0%
41.4%
51.8%
97.1% 99.2%
Early initiation ofbreastfeeding
Exclusivebreastfeeding
Children between6-8 mo whoreceived any
solid/semi solidfood in the last 24
hrs
Children between6-23 mo who
achieve minimumdiet diversity
Full immunizationcoverage
Children 12-35mo) who got
vitamin Asupplementation
Any anemiaamong adolescent
girls
Any anemiaamong pregnant
women
Gaya Bihar
Infant & Young Child Feeding Immunization & Supplementation
Adolescent & Maternal Health
NO DATA AVAILABLE TO MAKE COMPARISONS!
Source: DLHS-2 (2002-04); NFHS-3 (2005-06); DLHS-3 (2007-08); Census (2011)
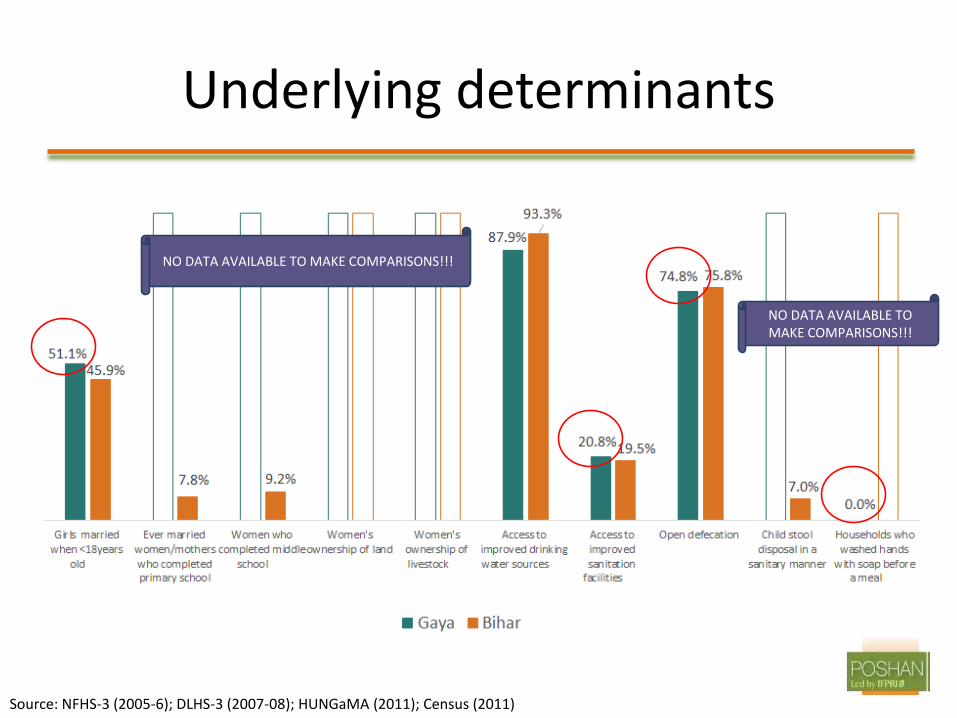
Underlying determinants
NO DATA AVAILABLE TO MAKE COMPARISONS!!!
NO DATA AVAILABLE TO MAKE COMPARISONS!!!
Source: NFHS-3 (2005-6); DLHS-3 (2007-08); HUNGaMA (2011); Census (2011)

Basic determinants
Source: DLHS-3 (2007-08); Census (2011); NSSO (2011-12)

A vast landscape of schemes to address immediate, underlying and basic causes
Immediate
• ICDS
• NHRM
• Use of Jeevika platform to strengthen health and nutrition behavior change
Underlying
• Beti Bachao (2015); Mukhyamantri Kanya Suraksha Yojana (2007); CM’s bicycle program for girls’ education
• National Food Security Act programs – PDS, MDM, others; Agriculture programs
• NRLM; Jeevika
• Swachh Bharat Mission (2014)
Basic
• Financial inclusion programs
• Economic growth efforts
• Infrastructure investments, including housing programs
• Agriculture subsidies, price policies

Challenges in developing District Nutrition Profiles
• Multiple data sources for indicators
• Temporal issues– Data collected from different reports; data collection years vary
• Indicator definitions
– Some definitions had to be altered slightly to the data available. • Ex: Vitamin A supplementation, for instance, used data for children aged 9 to 59
months in one official report and data for children aged 12 to 23 months in another.
• Sampling differences– Some of the data sources provided only rural data and used smaller samples
• Data skills– Some data, e.g., on food security and diet diversity, require the use of unit-level
information from large, complex data sources such as National Sample Survey Organization data.
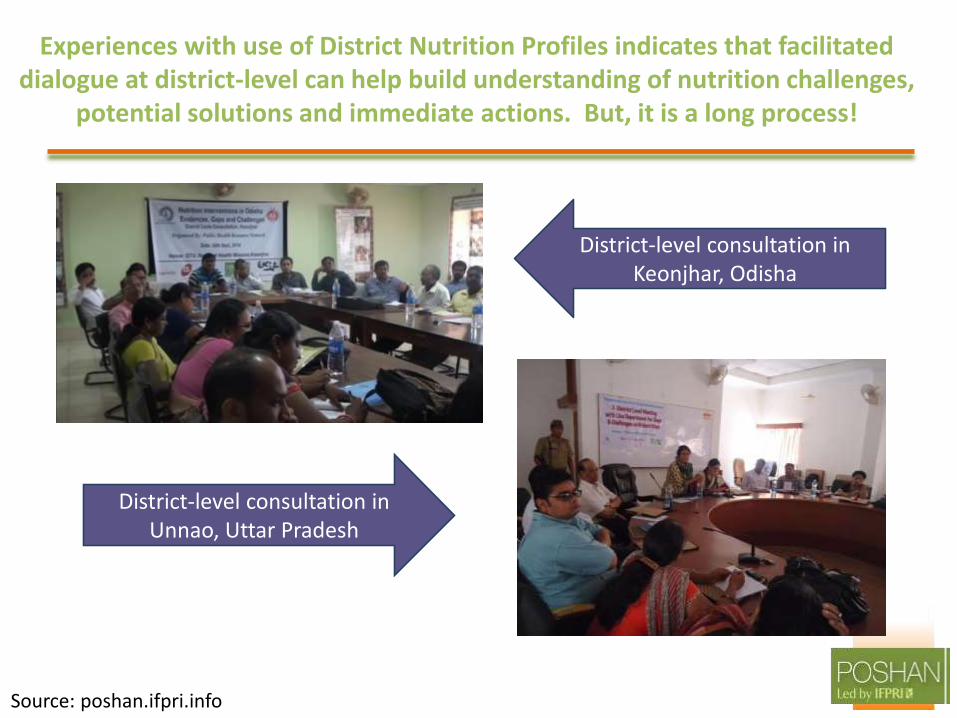
Experiences with use of District Nutrition Profiles indicates that facilitated dialogue at district-level can help build understanding of nutrition challenges,
potential solutions and immediate actions. But, it is a long process!
District-level consultation in Unnao, Uttar Pradesh
District-level consultation in Keonjhar, Odisha
Source: poshan.ifpri.info

Next steps in Bihar
• Refine indicators in the district nutrition profiles
• Develop profiles for all districts in Bihar
• Engage with Bihar nutrition technical support unit and other partners to strengthen district-level dialogue and action using nutrition profiles
Photo: P. Menon, W. Champaran, Bihar, Aug 2013
Recommended