CFA Institute Research ChallengeHosted in
CFA Spain Society (Madrid)IE Business School Team

Highlights
Forecast Summary, €M 2011 2012 2013E 2014E 2015E 2016E 2017E
Total Net Revenues 825.5 827.5 862.1 831.8 841.9 841.8 835.9
EBITDA 139.1 139.3 166.8 134.1 138.3 142.5 141.1
Net profit 41.2 43.0 52.1 43.3 40.8 43.2 41.6
Earnings per Share (€) 0.16 0.17 0.19 0.16 0.15 0.16 0.15
Dividend/Share (€) 0.1 0.07 0.08 0.06 0.06 0.06 0.06
We initiate our coverage of ENCE with a sell recommendation and a price target of EUR 2.26,
which represents a 12.3% downside potential from the current stock price. The Company’s business
model has suffered from recent regulations and we see an unfavorable market environment.
Pulp division: ENCE’s market share in pulp sales is diversified among European countries and the
Company has a good strategic positioning with respect to suppliers and customers. It has been
decreasing its exposure to the Spanish market, but Spain and Italy’s economies still represent a high
portion of sales of approximately 35%. As a result of South American pulp producers building up
capacities, we expect downward pressure on global pulp prices in the second half of 2014.
Energy division: The Royal Decree Act 9/2013 has heavily impacted the counter-cyclical energy
business, which has a stabilizing effect on Company revenues compared to the volatile pulp sales.
After the regulatory change, however, we project the NPV of cash flows to equity of this segment to
be equal to zero.
Financials: A reduced but stable operating cash flow generation of around EUR 50M is predicted
to continue going forward, attributed to a relatively stagnant pulp sector and the diminished but
stable effect of the renewables business. This sustainable ability of generating cash combined with
fewer predicted capital expenditures of around EUR 81M p.a. going forward result in relatively
high cash balances. Consequently, net financial debt is expected to halve in the years from 2014 to
2017, throughout being in line with the Company's target of maximum 2.5x Net Debt / EBITDA.
Market Snapshot
Market Capitalization (EM) 710
Shares Outstanding (M) 275
Main Shareholders
Alcor Holding 26.5%
Juan Luis Arregui 23.2%
Free Float 33.4%
52w Price Range (EUR) 1.90 - 3.13
Avg. monthly Volume (M shares) 1.308
Beta (to IBEX Mid Cap) 1.18
Relative Performance (to IBEX Mid Cap)
1 Month -13%
3 Months -27%
12 Months -37%
3 Years -21%
Key Ratios 2013
Debt / Equity 0.47
Net Debt / Equity 0.12
Net Debt / EBITDA 0.53
ROE 6.9%
ROA 3.7%
EV/EBITDA 4.96
P/E 13.03
P/CF 5.51
P/B 0.86
Valuation
Target (€) 2.26
DCF (€) 2.05
Multiples (€) 2.48
Downside -12%
WACC 6.7%
Cost of Equity 9.5%
Cost of Debt 4.7%
Target Leverage D/(D+E) 45%
Downside -12.3%
ENCE Energia y Celulosa S.A. Ticker: ENC:SM (Bloomberg)
Current price:
Target price:
Downside:
Recommendation:
€2.58
€2.26
-12.30%
SELL
IE Business School Research Team
Sector: Materials and Energy
Industry: Forest & Paper products and Renewable energy
Exchange: Madrid Stock Exchange
Akshay Dalmia, Fabian Dienemann,
Daniel Mirolli, Yehor Serdiuk, Viktor
Stoichkov
ENCE Energia y Celulosa | ENC
CFA Research Challenge | 2
Business Description
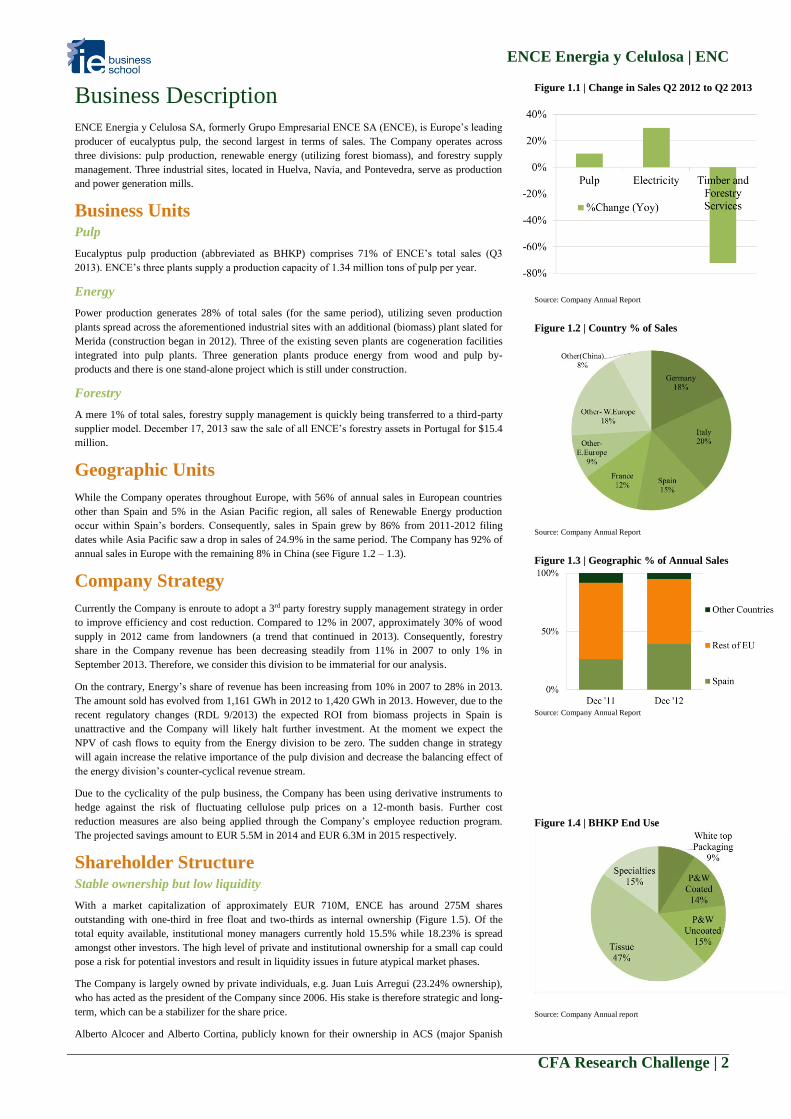
ENCE Energia y Celulosa SA, formerly Grupo Empresarial ENCE SA (ENCE), is Europe’s leading
producer of eucalyptus pulp, the second largest in terms of sales. The Company operates across
three divisions: pulp production, renewable energy (utilizing forest biomass), and forestry supply
management. Three industrial sites, located in Huelva, Navia, and Pontevedra, serve as production
and power generation mills.
Business Units Pulp
Eucalyptus pulp production (abbreviated as BHKP) comprises 71% of ENCE’s total sales (Q3
2013). ENCE’s three plants supply a production capacity of 1.34 million tons of pulp per year.
Energy
Power production generates 28% of total sales (for the same period), utilizing seven production
plants spread across the aforementioned industrial sites with an additional (biomass) plant slated for
Merida (construction began in 2012). Three of the existing seven plants are cogeneration facilities
integrated into pulp plants. Three generation plants produce energy from wood and pulp by-
products and there is one stand-alone project which is still under construction.
Forestry
A mere 1% of total sales, forestry supply management is quickly being transferred to a third-party
supplier model. December 17, 2013 saw the sale of all ENCE’s forestry assets in Portugal for $15.4
million.
Geographic Units
While the Company operates throughout Europe, with 56% of annual sales in European countries
other than Spain and 5% in the Asian Pacific region, all sales of Renewable Energy production
occur within Spain’s borders. Consequently, sales in Spain grew by 86% from 2011-2012 filing
dates while Asia Pacific saw a drop in sales of 24.9% in the same period. The Company has 92% of
annual sales in Europe with the remaining 8% in China (see Figure 1.2 – 1.3).
Company Strategy
Currently the Company is enroute to adopt a 3rd party forestry supply management strategy in order
to improve efficiency and cost reduction. Compared to 12% in 2007, approximately 30% of wood
supply in 2012 came from landowners (a trend that continued in 2013). Consequently, forestry
share in the Company revenue has been decreasing steadily from 11% in 2007 to only 1% in
September 2013. Therefore, we consider this division to be immaterial for our analysis.
On the contrary, Energy’s share of revenue has been increasing from 10% in 2007 to 28% in 2013.
The amount sold has evolved from 1,161 GWh in 2012 to 1,420 GWh in 2013. However, due to the
recent regulatory changes (RDL 9/2013) the expected ROI from biomass projects in Spain is
unattractive and the Company will likely halt further investment. At the moment we expect the
NPV of cash flows to equity from the Energy division to be zero. The sudden change in strategy
will again increase the relative importance of the pulp division and decrease the balancing effect of
the energy division’s counter-cyclical revenue stream.
Due to the cyclicality of the pulp business, the Company has been using derivative instruments to
hedge against the risk of fluctuating cellulose pulp prices on a 12-month basis. Further cost
reduction measures are also being applied through the Company’s employee reduction program.
The projected savings amount to EUR 5.5M in 2014 and EUR 6.3M in 2015 respectively.
Shareholder Structure Stable ownership but low liquidity
With a market capitalization of approximately EUR 710M, ENCE has around 275M shares
outstanding with one-third in free float and two-thirds as internal ownership (Figure 1.5). Of the
total equity available, institutional money managers currently hold 15.5% while 18.23% is spread
amongst other investors. The high level of private and institutional ownership for a small cap could
pose a risk for potential investors and result in liquidity issues in future atypical market phases.
The Company is largely owned by private individuals, e.g. Juan Luis Arregui (23.24% ownership),
who has acted as the president of the Company since 2006. His stake is therefore strategic and long-
term, which can be a stabilizer for the share price.
Alberto Alcocer and Alberto Cortina, publicly known for their ownership in ACS (major Spanish
Figure 1.1 | Change in Sales Q2 2012 to Q2 2013
Source: Company Annual Report
Figure 1.2 | Country % of Sales
Source: Company Annual Report
Figure 1.3 | Geographic % of Annual Sales
Source: Company Annual Report
Figure 1.4 | BHKP End Use
Source: Company Annual report

ENCE Energia y Celulosa | ENC
CFA Research Challenge | 3
construction company), form the largest shareholding party with a 26.52% stake through Alcor
Holding. Contrary to the stabilizing effect of Mr. Arregui’s stake, Alcor’s ownership might pose a
risk to the share price, citing dubious business activities in the past. This year they have been fined
EUR 10.8M plus EUR 14M in interest payable to the minority shareholders of Urbanor after being
found guilty of racketeering. As a consequence there are rumors of disinvesting activities in their
portfolio holdings.
In first half of 2013 the Company decreased its treasury shares that resulted from an issue premium.
Firstly, a stock dividend was distributed (1:25). Secondly, treasury stock representing 5% of total
equity was sold to private investors to further stabilize the shareholder structure. Also worth
mentioning, Liberbank (Spain based) recently liquidated its holdings that were later acquired by
Amber Capital (a British asset manager).
Corporate Governance and CSR Strategic importance for ENCE
ENCE's Corporate Governance (CG) policies and Corporate Social Responsibility (CSR) are
designed to help achieve its general objectives and to protect its shareholders. The board of
directors has established an executive, audit as well as appointments and remuneration committee.
The Management Committee, the Company's main decision-making body, is responsible for the
management of ENCE and is comprised of the directors of business and management. Although the
Company is not strictly following international guidelines such as the International Corporate
Governance Network, which can be attributed to its small size, we believe that their corporate
governance is sufficiently strong.
Total Quality Management was adopted in 2011 to develop a model of excellence in management
based on quality, efficiency, human capital and continuous improvement. The Company integrates
economic, social and environmental sustainability criteria into their activities and shows
commitment to all stakeholders, acting in accordance with the Ten Principles of the UN Global
Compact (which promote corporate social responsibility). The fundamental rules are established in
an internal code of conduct and since 2004 the Firm also publishes a yearly sustainability report
based on the Global Reporting Initiative.
Pulp
Industry Analysis Setting up the dominoes
Wood pulp comes from softwood trees such as spruce, pine, fir, larch and hemlock and hardwood
trees such as aspen, birch, and eucalyptus (the focus of ENCE’s production). China has been
leading in global pulp consumption growth since 2009.
Cool-down in China and bearish on commodities
China is a major market for pulp. We forecast China’s economy to slow and its demand for pulp to
decline on the premise of a declining macroeconomic outlook. China’s GDP saw only a 7.7%
growth in 2013 (while consensus estimates were 8%). China’s economic growth is a leading
indicator of global commodity markets (Figure 2.1), with a correlation of 84% in the period 2009-
2012. As China’s economic growth continues to slow, the commodity outlook is expected to be
bearish.
Pressure on Pulp Prices
We also find that (Figure 2.2) the Commodities Index is correlated (60%) with the price of pulp,
especially during bearish markets. While history shows growth well above the index average in bull
markets, following our expectation of China’s slowing growth, we are bearish on the price of
commodities and therefore the price of pulp. Furthermore, there is a strong correlation of 90.3%
between ENCE’s sales (delayed 6 months) and global pulp prices (Figure 2.3). It should be noted
that sales have been relatively stable since 2011 due to hedging strategies employed by ENCE (with
derivatives hedged on a twelve month basis).
Increasing Pulp Production in a Consolidating Industry
There is an increasing production trend (Figure 2.4) and decreasing trend in the number of pulp
mills for that same production (Figure 2.5). This indicates an increase in operating capacities for
pulp producers and a potential increasing maintenance CAPEX for the industry as a whole.
Global Pulp Supply Expected to Outstrip Demand
It is expected that in 2014 supply will outstrip demand by 0.6 million tons and between 2013-2016
Figure 1.5 | Share Ownership
Source: FactSet
“Although the Company is not strictly
following international guidelines…we
believe that their corporate governance is
sufficiently strong”
Figure 2.1 | China’s Real GDP vs Commodities Index
Source: FactSet
Figure 2.2 | CRB Index vs FOEX PIX BHKP Prices
Source: FactSet

ENCE Energia y Celulosa | ENC
CFA Research Challenge | 4
the supply will be (on average) in excess by 0.3 million tons (Figure 2.6). This shift in the supply
curve is mainly due to increased capacities of South American pulp producers who are going to
supply this excess quantity to the market in 2014. This further reinforces our bearish outlook on the
pulp market.
Pressure from Higher Production Costs
Wood and chemicals prices are the main cost drivers in pulp production. The Company expects
input prices to increase in the near future that will negatively affect industry margins.
Substitute Products
There is a growing threat from recycled paper as “world recovered paper demand has grown by
45% in the last 10 years” (RISI, global forestry industry data provider). As recycling and pressing
processes continue to improve, substitute products will pose a greater threat on the pulp industry.
High Pulp Inventories and Lower Consumption
It can be observed that over a 1-year period, levels of consumption and pulp prices have been on a
downtrend while inventory levels have been increasing (YoY basis). In the past year, the average
(YoY) change in prices and consumption has been -2.17% and -3.96%, respectively. Inventories
have increased 4.23% over the same period (Figure 2.7). Furthermore, the pulp inventory levels for
end consumers have been declining while the producers are stocking up excess production. This
reaffirms the downward pressure on pulp prices.
Competitive Position
ENCE enjoys several advantages over its European competitors in the pulp industry. Being based in
Spain and Portugal affords the Company the ability to produce pulp through eucalyptus wood, a
process resulting in a shorter rotation cycle per ton of pulp produced than other hardwoods. Spain is
one of the only countries in Europe whose climate can sustain eucalyptus pulp production (the
others being Portugal and parts of Italy).
ENCE already operates in a saturated market, as the 2nd largest supplier of pulp in Europe and its
location on the Iberian peninsula will continue to serve as a platform for substantial port-shipping
capabilities and a logistic advantage due to the proximity of production facilities to major ports.
These factors provide ENCE with strong competitive advantage within the European market. On a
global scale ENCE has 5% of the global BHKP market share. However, ENCE has higher cash
costs in comparison with pulp producers in LATAM as well as fewer opportunities for land
accretion. Moreover, ENCE is not well positioned for competing for the Chinese market, which is
the one with the highest global growth in pulp demand.
Renewable energy
Industry Analysis Promising industry subject to regulatory changes
The European Commission and many other private and public organizations believe that biomass
for energy production can play an important role in meeting Europe’s targets for renewable energy
generation. However, its potential is being realized at a slow pace, as the current growth rate is only
1/3 of EU projections. In Spain, biomass comprises the largest share of renewable electricity
production. Although 75% of all renewable electricity comes from biomass, there is still capacity
for growth. According to the European Climate Foundation, there is a large cost improvement
potential in biomass-generated power through economies of scale (15-40% compared to today).
Furthermore, biomass is the most reliable source of alternative energy for grid stability.
Political issues
The European market is currently governed by the EU Climate and Energy Package, which stipulate
that by the year 2020, 20% of all the energy produced within member countries should come from
renewables. Currently, 16.4% (Figure 3.1) of all energy generated in Spain comes from renewables,
9.5% of which is attributable to renewable-electrical and 6.5% to renewable-thermal, providing
limited room for growth.
Regulated prices
The new Royal Decree Law 9/2013 (RDL 09/13) governs all prices of renewable energy in Spain.
The political aim is to sustainably prevent future deficits in the electricity system. The previously
adopted tariff system was replaced with a system offering an internal rate of return based on the
average yield on Spanish 10-year government bonds plus a differential (currently 300bp). At the
Figure 2.3 | ENCE Sales vs BHKP Prices
Source: FactSet
Figure 2.4 | Production Trend
Source: PPPC
Figure 2.5 | Consolidating Industry Trend
Source: Company Annual Report and PPPC
Figure 2.6 | Evolution of Global Supply & Demand
Source: RISI (all figures in million tons)
Figure 2.7 | Inventory Trends (Consumption and
Prices)
Source: PPPC

ENCE Energia y Celulosa | ENC
CFA Research Challenge | 5
moment this adds to approximately 6.5%. The return received is calculated from the rate of return
obtained on renewable projects based on the “standard” sales income, operating costs and initial
investment. The law also removes the payments for efficiency and reactive bonuses. Effectively, the
law change has an extremely negative impact on biomass firms, that up to date is not easy to
quantify, however we expect prices to be around 15% below the old remuneration system.
Cost-efficiency
Approximately 60% of biomass electricity comes from cogeneration in production facilities or from
using by-products from manufacturing, allowing for very low costs. Moreover, integrated energy
facilities lead to higher cost-competitiveness, as energy can be both consumed internally while the
excess can be sold.
Competitive Position
ENCE owns seven energy generation facilities at four different locations across Spain with one still
under construction. These plants add up to c.300 MW of total installed capacity. This makes the
Company the nation's largest producer of renewables from biomass, which translates to a market
share of more than 50%. We believe that this dominant position is a strength and leads to economies
of scale. However, due to the recent regulatory changes, market-leadership cannot be seen as a
competitive advantage and the Company does not plan further growth investments into their energy
business in the coming years.
The Company benefits from synergies between their pulp and energy divisions as the energy comes
from co-generation (integration in pulp plants) or from wood and pulp by-products. Furthermore,
self-produced energy is used for their own pulp plants, reducing the costs of production. Currently,
around 230 MW comes from co-generation or by-products and only 70 MW of capacity is
contributed from standalone projects.
As the first Spanish producer of renewable energy from biomass, we believe that one competitive
advantage is ENCE's industry expertise. The firm’s experience combined with investments in R&D,
provides a higher productivity compared to competitors. This was shown by the higher than
expected efficiency of the Huelva plant that started its operations in 2012 (with more operating
hours and less self-consumption of energy). The previously estimated EBITDA for the 50 MW
plant in 2013 of EUR 17.5 M was improved to EUR 20.7 M.
Nevertheless, ENCE’s capital expenditures in the last two years were largely due to their energy
asset requirements (c. 80% of total CAPEX). We assume the investment approach to be above the
“standard” investment on which the target return of RDL 09/2013 will be applied and therefore
estimate an IRR of around 3% on their projects compared to the 6.5% on a “standard” investment.
Investment Summary
Bearish Outlook - Sell Recommendation
We initiate coverage of ENCE S.A. with a target price of €2.26 given a downside potential of
12.3% from the current market price €2.58. We therefore issue a SELL recommendation since the
downside potential exceeds our requirement of 10%. Our bearish outlook is founded on the
unfavourable market environment and disruption of the Company’s business model resulting from
recent regulatory changes.
Valuation Methods
The valuation target we obtained was by way of a Discounted Cash Flow analysis with a fair value
of EUR 2.05 and peer group multiples analysis with a target price of EUR 2.48. Both methods were
weighted equally and both indicate an overvaluation. Our selection criteria for equity multiples took
into account divergent capital structures and eliminated outliers.
Financial Position
Financial Health
ENCE's balance sheet in terms of solvency, liquidity, profitability and turnover ratios and margins
are superior compared to the industry. The financial health combined with the efficiency of the past
years provides a positive outlook for the Company. Furthermore, ENCE is sustainably financed
until 2020, which indicates that no major capital injections will be required in the next years. This
results in a BB rating by S&P thereby assigning ENCE the highest possible rating within the non-
investment grade category with a stable outlook. However, this corporate rating of S&P was
updated in last July and therefore does not incorporate the implications of the new energy
regulations.
Figure 3.1 | Distribution of energy production in
Spain, 2012
Source: Ministry of Industry, Energy and Tourism
Figure 3.2 | Porter’s Five Forces Analysis
ENCE Average 3.25 Source: Appendix 10.
“This results in a BB rating by S&P…with
a stable outlook.”

ENCE Energia y Celulosa | ENC
CFA Research Challenge | 6
Cash Flow Generation
The operating cash flow (CFO) has seen a positive development in the past years, rising from EUR
88M in 2009 to EUR 112M in 2012. Mainly due to the adverse effect of the energy reforms, going
forward our financial model predicts a sharp drop in CFO to levels around EUR 50M in 2014 and a
stable development in the following years.
EBITDA development
The EBITDA was negative in 2009 and went up to EUR 178M in 2010. For FY 2013 we forecast
an EBITDA of EUR 167M and again a sharp decline due to lower energy revenues in 2014 to an
expected value of EUR 134M, recovering slightly in the following years.
Market Prospects Stable global demand and increasing supply
We expect prices of pulp to go down by around 1% annually in the next five years due to a stable
European market combined with our negative outlook on China and shifts in the supply curve
resulting from new capacities in South America (both of which serve as a catalysts in the downward
pulp price trend). We do not see significant growth potential for total revenues in the pulp
producing industry.
Unprofitable Energy Business
By comparing Spain's current share of renewables in total energy consumption to the goals set by
the European Union to be reached in 2020 one could get a bullish view on the market. Due to high
subsidies resulting in a tariff deficit, companies have been overinvesting into the sector in the past
few years. Recently, the government changed the regulation, which has substantial negative impact
for the industry and results in a decrease in renewable energy prices of around 15% compared to the
previous remuneration system according to our estimate.
Risks
Investors should be aware of a stock-overhang risk based on the relatively high percentage of
portfolio holdings of the main investors in the Company and liquidity issues due to the low amount
of free-float shares. Additionally, they should be aware of the adverse influences of Latin American
producers who are building up capacities thus increasing the world supply of pulp and creating
downward pressure in pulp prices. An unexpectedly high slowdown of Chinese growth is another
factor that might negatively affect the Company, as China is one of the main absorbers of pulp
supplied to the market. We identify the main risks in our Potential Risks section.
Valuation
To determine our valuation of ENCE, we used a combination of two approaches with equal
weights: The Discounted Cash Flow (DCF) and Multiples Pricing Approach. Our technical analysis
coincides with aforementioned valuation methods and suggests several bearish indicators including
negative momentum and candlestick patterns as well as a potential downside to the next major
support line.
DCF Analysis
Our DCF values ENCE at EUR 2.05/share. Our two-stage model consists of forecasts to 2017, after
which we apply a terminal value to our calculations. The revenue figures are broken down into the
two divisions: pulp and energy.
Terminal Value
We assume a terminal growth rate of 1.5% in Free Cash Flow to Firm, which coincides with our
long-term inflation rate expectations.
Sales
The Royal Decree is expected to have a one time negative impact on the price of energy to the tune
of -15%. The new price is expected to be EUR 97.10/MWh. Also, we expect pulp prices to be in a
downtrend and use a price reduction of around 1% (YoY) going forward. The impact on sales is
however mitigated partly by the increase in production capacity from pulp (1% YoY) given that
ENCE operates at 95% capacity and no major CAPEX is planned going forward apart from energy
due to a one time 158,000 MWh increase in 2015 due to the new plant in Merida and 2% increase
YoY due to efficiency gains.
“We expect prices of pulp to go down by
around 1% annually in the next years…”
“Due to high subsidies… companies have
been overinvesting into the sector…”
Figure 5.1 | Total Net Turnover, in € millions
Source: Appendix Financial Model

ENCE Energia y Celulosa | ENC
CFA Research Challenge | 7
COGS
We are expecting a 0.5% increase in cost of inputs YoY due to slightly higher timber and chemical
prices in the market.
WACC
Our cost of capital calculations are obtained using a weighted average of cost of debt and equity
using a long-term target structure of 55% equity and 45% debt. For our cost of equity, we used the
CAPM with the 10-year German Bunds rate of 1.68% as a risk-free rate (Figure 6.2) benchmark and
market return of 8.26% using a 10-year period for the return on the IBEX Medium Cap Index. The
cost of debt is based on the high yield bond issued by the Company and the option-adjusted spread
over the risk-free benchmark to produce a value of 4.72%. The tax rate applied in our model is 30%
based on the historical average of the past two fiscal years.
Dividends
The Company has firmly established its stance on dividend policy given that it is in its mature and
arguably decline phase of growth. We expect the firm to maintain a 40-50% payout ratio going
forward given the limited growth opportunities for the corporation.
Multiples analysis
Philosophy
We calculated a target price by relative valuation to companies that we considered to be appropriate
comparables and have similar business drivers. Instead of valuing ENCE as the sum of its two
businesses (Pulp and Energy) we forecast the importance of its energy business to decrease over
time and expect the NPV of this division’s cash flows to equity to be zero. We also believe that
comparing relative stock prices of energy companies across borders is irrelevant given the diversity
of regulatory forces in different regions. Therefore, we are focused on finding competitors in the
pulp industry.
Comparable Entities
ENCE's business mix and European presence is unique and makes it hard to find perfect
comparables. For the European market we found UPM (a Finnish pulp manufacturer that is also
engaged in renewables) and Portucel (a Portuguese pulp and paper company) to be appropriate
peers. Furthermore, we are using the South American pulp producers Fibria, Altri and CMPC as
comparables, citing the global pulp industry’s tendency to correlate across similar business cycles.
Multiples Selection
We believe that EV/EBITDA gives the best approximation for value since we are able to compare
companies with different depreciation and amortization schedules independently of their capital
structure. We therefore assign 50% weight to this EV-based multiplier. The other 50% will be
distributed evenly between P/B, P/CF and P/E. Since theses equity based multipliers can only be
used for companies with a similar capital structure like ENCE, we decided to exclude Fibria and
Altri, which both have significantly higher leverage ratios (Figure 6.3).
We investigate the years 2009 to 2012 to find an average difference at which ENCE is trading
relative to its peers. Based on this analysis, in the past ENCE traded at a discount of 32% using P/B,
31% using P/CF, 20% using P/E and 29% according to EV/EBITDA. We furthermore assume this
discount to stay stable in the future. Consequently, we come up with a target multiple for ENCE
using the historical discounts and compare this value to the consensus estimate for ENCE to finally
get a target share price.
After calculating equity value from enterprise value we come up with a fair price of EUR
2.71/Share from EV/EBITDA. The three equity-based multipliers suggest a downside development
of 13% on average, which with a share price of EUR 2.585 at the time of analysis results in a target
price of EUR 2.24. Applying the aforementioned weights for enterprise and equity based multipliers
we receive a target price of EUR 2.48 for ENCE's share.
Financial Statement Analysis
DuPont
Since the return on equity measures the rate of return that is attributable to stockholders and is
therefore an important ratio the development of ROE will be analyzed over the past three years
starting in FQ3 2010 to identify the drivers. We will make use of the three-stage DuPont model,
which breaks down the ROE into profit margin (net income/sales), asset turnover (sales/assets) and
financial leverage (assets/equity). It can easily be identified that the ROE developed positively from
Figure 6.2 | WACC Calculation
Ratio Value
Levered Beta 1.179
Tax rate 30%
Rf 1.68%
ERP 8.3%
D/D+E 45%
E/D+E 55%
Ke 9.48%
Kd 4.72%
WACC 6.68%
Source: WACC Appendix
Figure 6.3 | D/E Criteria for Equity Multiples
Source: Appendix Multiples Analysis
Figure 7.1 | DuPont Analysis
Source: Company Annual Report
Ratio 09/13 09/12 09/11 09/10
Profit Margin 5.9% 4.0% 5.8% 5.0%
Asset Turnover 0.64 0.59 0.61 0.55
Fin. Leverage 1.84 1.86 1.81 1.90
ROE 0.07 0.04 0.07 0.05
ENCE Energia y Celulosa | ENC
CFA Research Challenge | 8
5.22% to 6.95% (+33%). However, the highest return was realized in the first quarter of 2011 with
around 10%. The positive development was supported by an increase in profitability and operating
efficiency. The profit margin was the biggest contributor to the increase in ROE over the last three
years since it developed from 5% to 5.9% (+18%) whereas the asset turnover ratio increased 16%.
The increase in profit margin and asset turnover was partly offset by the decrease of the financial
leverage of 3%. However, the deleveraging process benefits shareholders in a way that financial
risk is decreased.
In summary, the DuPont analysis gives a favorable picture of the Company that has been able to
increase its ROE with a lower share of debt in its capital structure by becoming more profitable
through increased efficiency. This can be interpreted as fundamental backup for the positive share
price development in the investigated period.
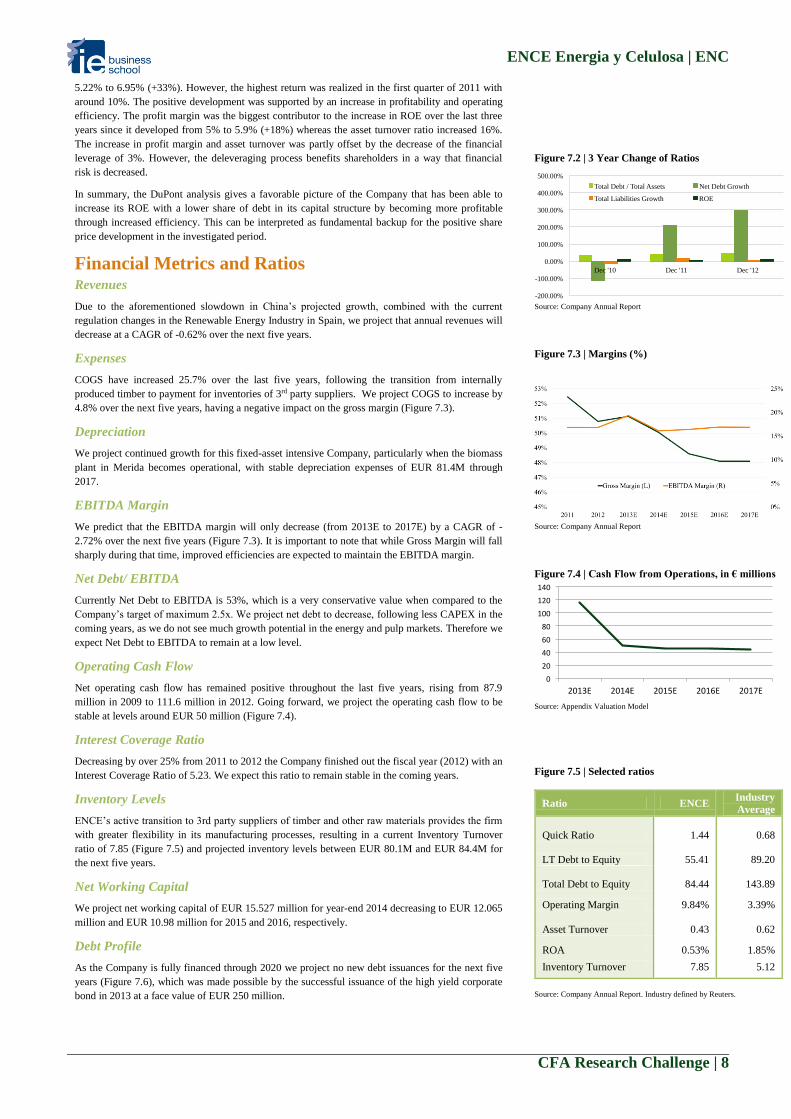
Financial Metrics and Ratios Revenues
Due to the aforementioned slowdown in China’s projected growth, combined with the current
regulation changes in the Renewable Energy Industry in Spain, we project that annual revenues will
decrease at a CAGR of -0.62% over the next five years.
Expenses
COGS have increased 25.7% over the last five years, following the transition from internally
produced timber to payment for inventories of 3rd party suppliers. We project COGS to increase by
4.8% over the next five years, having a negative impact on the gross margin (Figure 7.3).
Depreciation
We project continued growth for this fixed-asset intensive Company, particularly when the biomass
plant in Merida becomes operational, with stable depreciation expenses of EUR 81.4M through
2017.
EBITDA Margin
We predict that the EBITDA margin will only decrease (from 2013E to 2017E) by a CAGR of -
2.72% over the next five years (Figure 7.3). It is important to note that while Gross Margin will fall
sharply during that time, improved efficiencies are expected to maintain the EBITDA margin.
Net Debt/ EBITDA
Currently Net Debt to EBITDA is 53%, which is a very conservative value when compared to the
Company’s target of maximum 2.5x. We project net debt to decrease, following less CAPEX in the
coming years, as we do not see much growth potential in the energy and pulp markets. Therefore we
expect Net Debt to EBITDA to remain at a low level.
Operating Cash Flow
Net operating cash flow has remained positive throughout the last five years, rising from 87.9
million in 2009 to 111.6 million in 2012. Going forward, we project the operating cash flow to be
stable at levels around EUR 50 million (Figure 7.4).
Interest Coverage Ratio
Decreasing by over 25% from 2011 to 2012 the Company finished out the fiscal year (2012) with an
Interest Coverage Ratio of 5.23. We expect this ratio to remain stable in the coming years.
Inventory Levels
ENCE’s active transition to 3rd party suppliers of timber and other raw materials provides the firm
with greater flexibility in its manufacturing processes, resulting in a current Inventory Turnover
ratio of 7.85 (Figure 7.5) and projected inventory levels between EUR 80.1M and EUR 84.4M for
the next five years.
Net Working Capital
We project net working capital of EUR 15.527 million for year-end 2014 decreasing to EUR 12.065
million and EUR 10.98 million for 2015 and 2016, respectively.
Debt Profile
As the Company is fully financed through 2020 we project no new debt issuances for the next five
years (Figure 7.6), which was made possible by the successful issuance of the high yield corporate
bond in 2013 at a face value of EUR 250 million.
Figure 7.2 | 3 Year Change of Ratios
Source: Company Annual Report
Figure 7.3 | Margins (%)
Source: Company Annual Report
Figure 7.4 | Cash Flow from Operations, in € millions
Source: Appendix Valuation Model
Figure 7.5 | Selected ratios
Ratio ENCE Industry
Average
Quick Ratio
1.44
0.68
LT Debt to Equity
55.41
89.20
Total Debt to Equity
84.44
143.89
Operating Margin 9.84% 3.39%
Asset Turnover
0.43
0.62
ROA 0.53% 1.85%
Inventory Turnover 7.85 5.12
Source: Company Annual Report. Industry defined by Reuters.
-200.00%
-100.00%
0.00%
100.00%
200.00%
300.00%
400.00%
500.00%
Dec '10 Dec '11 Dec '12
Total Debt / Total Assets Net Debt Growth
Total Liabilities Growth ROE

ENCE Energia y Celulosa | ENC
CFA Research Challenge | 9
Dividends
With an official dividend policy of 40%-50% payout ratio, the firm ended the 2012 fiscal year with
a Dividend Yield of 3.29%. We expect the future five-year dividend growth rate to decrease (in
absolute terms) due to a lower projected level of net income.
CAPEX/Revenue
Due to the highly intensive capital requirements of ENCE’s industry, CAPEX/Revenue was taken
to find the proportion of revenue relative to long-term capital requirements. We project CAPEX to
remain stable over the next five years but at lower levels compared to the previous years. As
mentioned before, we project revenues to decrease by -0.62% per annum for the next five years.
Therefore, from 2014 onwards, we project this ratio to remain stable at around 10%.
Financial Health
Despite the grim outlook of the industry, ENCE is currently operated with very healthy balance
sheets. Comparable quick ratios, long-term debt to equity, debt to equity, operating margin, and
ROA all provide a positive outlook for ENCE’s future, relative to the competition.
Investment Risks
In this section we identify the main risks that could negatively affect our target price. The risks are
divided into four main categories: Macroeconomic, Industry, Operational and Shareholder Risks.
Macroeconomic Risks GDP Growth Rate
ENCE has exposure to the cyclical pulp market and the paper sector, which is sensitive to economic
growth expectations. China is a major market for pulp and main driver of demand. Besides stable
markets in Asia, ENCE is dependent on a strong European demand where they generate around
90% of revenues. The forces of supply and demand determine the prices in the pulp market and
ENCE’s revenues are highly correlated to price movements. Consequently, adverse shifts in the
macroeconomic environment will have negative impact on prices, revenue generation and hence
ENCE’s stock value.
Currency/Exchange Rate Risk
Pulp prices are globally denominated in US dollars and influenced by supply and demand dynamics
and foreign exchange rates against the dollar. An appreciation of the US dollar with respect to the
Euro makes European producers more competitive since their exports become relatively cheaper
and they therefore have higher sales. Moreover, revenues in dollar are worth more in euro. In case
of depreciation of the dollar/euro exchange rate the opposite is observed.
Interest Rate Risk
The Company has been using debt to finance its energy plants in Huelva and Merida. If expansion
and investment is financed by debt, interest rate increase can have an impact on the debt and interest
coverage ratios of ENCE. However, the Company makes usage of derivatives to partly hedge this
risk (on a 12-month basis). Furthermore, the Company is sustainably financed until 2020 (Figure
10.1), so we assume no further major debt injections in the next years.
Cost Inflation
ENCE is a company that mainly transforms wood into pulp and is therefore dependent on price
increases of this commodity. Because the firm is reducing their ownership in forests they are
becoming increasingly exposed to price changes affecting their suppliers in Spain. Moreover a
domestic inflationary environment, that raises the cost of wages and energy consumed, would
damage the Company’s gross margin since prices are denominated in USD and given by the market.
Country risk
ENCE is exposed to weaker European economies as approximately 35% of pulp revenues are
attributed to Spain and Italy and all its renewable energy sales go to the domestic grid (though this
might change, citing aforementioned legislation). The Company is heavily exposed to the Southern
European economies and therefore suffers more than others from decreasing demand in times of
crisis. The firm has realized this issue and tries to increase the revenue shares of countries like
Germany. However, it can be criticized that ENCE does not plan to diversify its revenue streams by
heavily entering emerging economies, namely China.
Industry Risks
Figure 7.6 | Debt Maturity Profile, in € millions
Source: Company Annual Report
“…adverse shifts in the macroeconomic
environment will have negative impact
on…ENCE’s stock value”
“…a domestic inflationary
environment…would damage the
Company’s gross margin…”

ENCE Energia y Celulosa | ENC
CFA Research Challenge | 10
New manufacturing capacities in South America
South American competitors have been building capacity, which will affect cellulose prices if the
excess capacity is not absorbed by growth in demand, which is a likely scenario.
Competitive LATAM if Oil Falls
A decrease in the price of oil could drive LATAM exporters to be more cost competitive on the
global stage through reduced transportation costs, resulting in either increased margins for LATAM
producers of pulp or decreased market share for European-based producers.
Renewable energy sector regulations
Political reforms and new legislations regarding remuneration on renewable energy projects can
have an adverse impact on cash flow generation from ENCE’s plants and diminish the buffering
effect of those plants during pulp cycle troughs.
Substitute recycle paper
There are two phenomena that have a negative effect on ENCE's business. Firstly, it can be seen
that during times of high pulp prices customers switch to recycled paper to minimize costs.
Secondly, there is a sustainability movement in the developed world towards the usage of recycled
paper instead of newly produced pulp-based paper. If these trends continue, they will certainly have
an impact on ENCE.
Competition from Other Renewables
As mentioned earlier, biomass has the biggest share in electricity production from renewables in
Spain. If research or technological developments make other sources of renewables, relative to
biomass, more cost effective, ENCE will have a competitive disadvantage being highly engaged in
this sector and not diversified through additional energy generation from wind or solar.
Operational risks Strikes
ENCE has been able to improve its cost structure during the last years, which is partly due to
employment reduction plans. As this is positive on the one side, however, the Company should be
careful with further savings on cost of their employees. The overall staff sentiment is important
since it could be very harmful for the business even if only some key divisions lay down work and
thereby stop the whole production process. Given the currently high unemployment rate in Spain,
we do not see a high risk of employee unrest.
Production Process
Due to the high fixed costs resulting from running big plants, it is important to always make use of
full capacities and reduce non-operating hours to a small extent. Every hour of interruption in the
production process means a loss of money and therefore implies a risk for ENCE's shareholders.
Furthermore, ENCE will do well by investing enough into their factories (CAPEX) to keep
efficiencies at high levels.
Shareholder Risks Stock Overhang
As mentioned above, there is a high percentage of insider and institutional ownership of ENCE’s
stock (e.g. Alcor Holding 26.52%), which results in a potential risk of stock overhang for common
stock shareholders. In general, the big owners seem to be long-term investors. However, in the case
of a sale of a big stake to the market, the prices of ENCE's shares will be under huge pressure in the
short-term.
Liquidity risk
Linked to the shareholder structure of below 20% free float in combination with the relatively small
market cap there exists a significant liquidity risk. We believe that the resulting low turnover of
traded shares will push prices further down in turbulent market phases and sell-offs. We interpret
this as one of the reasons why ENCE is traded at a discount to its peers (see multiples valuation).
Dividend Policy
In the past years shareholders have been remunerated well through cash and stock dividends. In
terms of dividend yield over the last three years ENCE delivered 3.57% whereas the average in the
IBEX Mid Cap lies around 2.63%. If the Company decides to finance its investments through
retained earnings, historic payout ratios will be decreasing. However, we believe that the
management will sustainably deliver higher dividend yields than the national average.
“…during times of high pulp prices
customers switch to recycled paper to
minimize costs…”
“…a high percentage of insider and
institutional ownership…[is] a potential
risk of stock overhang for common stock
shareholders”

ENCE Energia y Celulosa | ENC
CFA Research Challenge | 11
Appendix 1: Income Statement
Figures in € Millions 2011 2012 2013E 2014E 2015E 2016E 2017E
Pulp sales 596.9 596.9 616.1 599.9 588.0 588.0 582.1
Electricity sales 184.3 208.4 238.5 225.5 247.4 247.4 247.4
Other 44.3 22.3 6.6 6.4 6.5 6.5 6.4
Total Net Turnover 825.5 827.5 862.1 831.8 841.9 841.8 835.9
Sales growth n/a 0.25% 4.17% -3.51% 1.21% -0.01% -0.70%
Supplies -390.8 -408.0 -419.7 -415.5 -432.7 -436.9 -433.8
Change in stocks of finished
products -1.7 0.8 1.5 0.0 0.0 0.0 0.0
Gross margin 433.0 420.4 440.9 416.3 409.2 404.9 402.1
Gross margin (%) 52.5% 50.8% 51.1% 50.0% 48.6% 48.1% 48.1%
Result from hedging operations -10.4 -27.6 8.7 0.0 0.0 0.0 0.0
Personnel -89.4 -82.1 -77.5 -72.0 -65.7 -65.7 -65.7
Other operating expenses -194.0 -171.4 -208.2 -210.2 -205.2 -196.7 -195.2
EBITDA 139.1 139.3 166.8 134.1 138.3 142.5 141.1
EBITDA margin 16.9% 16.8% 19.4% 16.1% 16.4% 16.9% 16.9%
Depreciation of fixed assets -63.5 -63.4 -78.9 -81.4 -81.4 -81.4 -81.4
Impairment and result from sales
of fixed assets 4.4 6.3 -0.2 0.0 0.0 0.0 0.0
EBIT 80.1 82.2 87.8 52.7 56.9 61.1 59.7
EBIT margin 9.7% 9.9% 10.2% 6.3% 6.8% 7.3% 7.1%
Net financial income -23.1 -18.6 -11.3 8.9 1.2 0.3 -0.5
Non-Current Assets Result
Classified as kept for Sale 0.0 -0.7 -2.6 0.0 0.0 0.0 0.0
Profit before tax 57.0 62.9 73.9 61.5 58.1 61.4 59.2
Margin 6.9% 7.6% 8.6% 7.4% 6.9% 7.3% 7.1%
Corporate tax -15.8 -19.9 -21.8 -18.3 -17.3 -18.3 -17.6
Net profit 41.2 43.0 52.1 43.3 40.8 43.2 41.6
Margin 5.0% 5.2% 6.0% 5.2% 4.9% 5.1% 5.0%
Source: Company Data and Team Estimates
ENCE Energia y Celulosa | ENC
CFA Research Challenge | 12
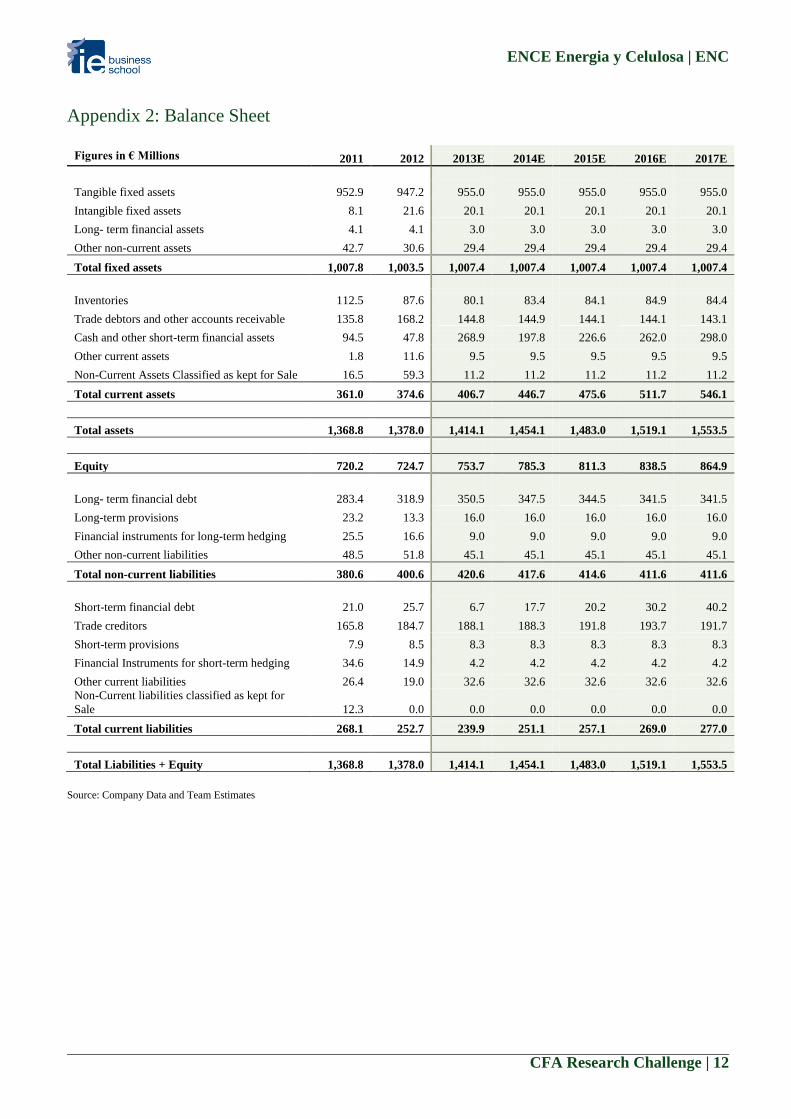
Appendix 2: Balance Sheet
Source: Company Data and Team Estimates
Figures in € Millions 2011 2012 2013E 2014E 2015E 2016E 2017E
Tangible fixed assets 952.9 947.2 955.0 955.0 955.0 955.0 955.0
Intangible fixed assets 8.1 21.6 20.1 20.1 20.1 20.1 20.1
Long- term financial assets 4.1 4.1 3.0 3.0 3.0 3.0 3.0
Other non-current assets 42.7 30.6 29.4 29.4 29.4 29.4 29.4
Total fixed assets 1,007.8 1,003.5 1,007.4 1,007.4 1,007.4 1,007.4 1,007.4
Inventories 112.5 87.6 80.1 83.4 84.1 84.9 84.4
Trade debtors and other accounts receivable 135.8 168.2 144.8 144.9 144.1 144.1 143.1
Cash and other short-term financial assets 94.5 47.8 268.9 197.8 226.6 262.0 298.0
Other current assets 1.8 11.6 9.5 9.5 9.5 9.5 9.5
Non-Current Assets Classified as kept for Sale 16.5 59.3 11.2 11.2 11.2 11.2 11.2
Total current assets 361.0 374.6 406.7 446.7 475.6 511.7 546.1
Total assets 1,368.8 1,378.0 1,414.1 1,454.1 1,483.0 1,519.1 1,553.5
Equity 720.2 724.7 753.7 785.3 811.3 838.5 864.9
Long- term financial debt 283.4 318.9 350.5 347.5 344.5 341.5 341.5
Long-term provisions 23.2 13.3 16.0 16.0 16.0 16.0 16.0
Financial instruments for long-term hedging 25.5 16.6 9.0 9.0 9.0 9.0 9.0
Other non-current liabilities 48.5 51.8 45.1 45.1 45.1 45.1 45.1
Total non-current liabilities 380.6 400.6 420.6 417.6 414.6 411.6 411.6
Short-term financial debt 21.0 25.7 6.7 17.7 20.2 30.2 40.2
Trade creditors 165.8 184.7 188.1 188.3 191.8 193.7 191.7
Short-term provisions 7.9 8.5 8.3 8.3 8.3 8.3 8.3
Financial Instruments for short-term hedging 34.6 14.9 4.2 4.2 4.2 4.2 4.2
Other current liabilities 26.4 19.0 32.6 32.6 32.6 32.6 32.6
Non-Current liabilities classified as kept for
Sale 12.3 0.0 0.0 0.0 0.0 0.0 0.0
Total current liabilities 268.1 252.7 239.9 251.1 257.1 269.0 277.0
Total Liabilities + Equity 1,368.8 1,378.0 1,414.1 1,454.1 1,483.0 1,519.1 1,553.5
ENCE Energia y Celulosa | ENC
CFA Research Challenge | 13
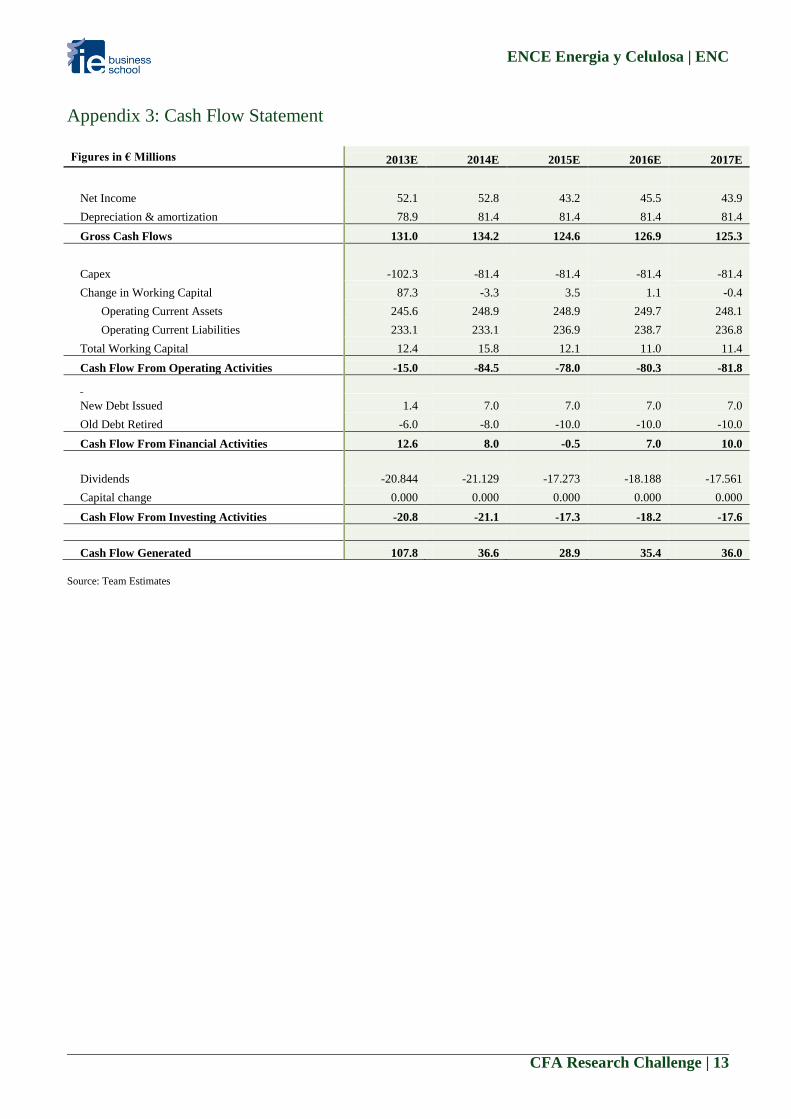
Appendix 3: Cash Flow Statement
Source: Team Estimates
Figures in € Millions 2013E 2014E 2015E 2016E 2017E
Net Income 52.1 52.8 43.2 45.5 43.9
Depreciation & amortization 78.9 81.4 81.4 81.4 81.4
Gross Cash Flows 131.0 134.2 124.6 126.9 125.3
Capex -102.3 -81.4 -81.4 -81.4 -81.4
Change in Working Capital 87.3 -3.3 3.5 1.1 -0.4
Operating Current Assets 245.6 248.9 248.9 249.7 248.1
Operating Current Liabilities 233.1 233.1 236.9 238.7 236.8
Total Working Capital 12.4 15.8 12.1 11.0 11.4
Cash Flow From Operating Activities -15.0 -84.5 -78.0 -80.3 -81.8
New Debt Issued 1.4 7.0 7.0 7.0 7.0
Old Debt Retired -6.0 -8.0 -10.0 -10.0 -10.0
Cash Flow From Financial Activities 12.6 8.0 -0.5 7.0 10.0
Dividends -20.844 -21.129 -17.273 -18.188 -17.561
Capital change 0.000 0.000 0.000 0.000 0.000
Cash Flow From Investing Activities -20.8 -21.1 -17.3 -18.2 -17.6
Cash Flow Generated 107.8 36.6 28.9 35.4 36.0

ENCE Energia y Celulosa | ENC
CFA Research Challenge | 14
Appendix 4: Key Financial Ratios
Source: Company Data and Team Estimates
Liquidity Ratios 2011 2012 2013E 2014E 2015E 2016E 2017E
Current Ratio 1.35 1.5 1.70 1.78 1.85 1.90 1.97
Quick Ratio 0.87 0.9 1.32 1.40 1.48 1.55 1.63
Cash Ratio 0.35 0.2 1.12 0.79 0.88 0.97 1.08
Efficiency Ratios
Total Asset Turnover 0.60 0.6 0.61 0.57 0.57 0.55 0.54
Fixed Asset Turnover 0.82 0.8 0.86 0.83 0.84 0.84 0.83
Net Working Capital Turnover 8.88 6.8 5.17 4.25 3.85 3.47 3.11
Days Sales Outstanding 60.05 74.2 61.33 63.56 62.49 62.49 62.49
Days Inventory Outstanding 105.05 78.3 69.64 73.27 70.97 70.97 70.97
Days Payables Outstanding 154.83 165.2 163.55 165.43 161.77 161.80 161.27
Cash Conversion Cycle 10.26 -12.6 (32.58) (28.59) (28.31) (28.34) (27.82)
Profitability Ratios
Gross Margins (%) 52.5% 0.5 51.1% 50.0% 48.6% 48.1% 48.1%
EBITDA Margins (%) 16.9% 0.2 19.4% 16.1% 16.4% 16.9% 16.9%
Net Profit Margins 5.0% 0.1 6.0% 5.2% 4.9% 5.1% 5.0%
ROA 3.01% 0.0 3.68% 2.97% 2.75% 2.84% 2.68%
ROE 5.72% 0.1 6.91% 5.51% 5.03% 5.15% 4.81%
Solvency Ratios
Leverage Ratio (Debt/Assets) 0.47 0.47 0.47 0.46 0.45 0.45 0.45
Debt to Equity Ratio 0.9 0.9 0.88 0.85 0.81 0.81 0.81
ENCE Energia y Celulosa | ENC
CFA Research Challenge | 15
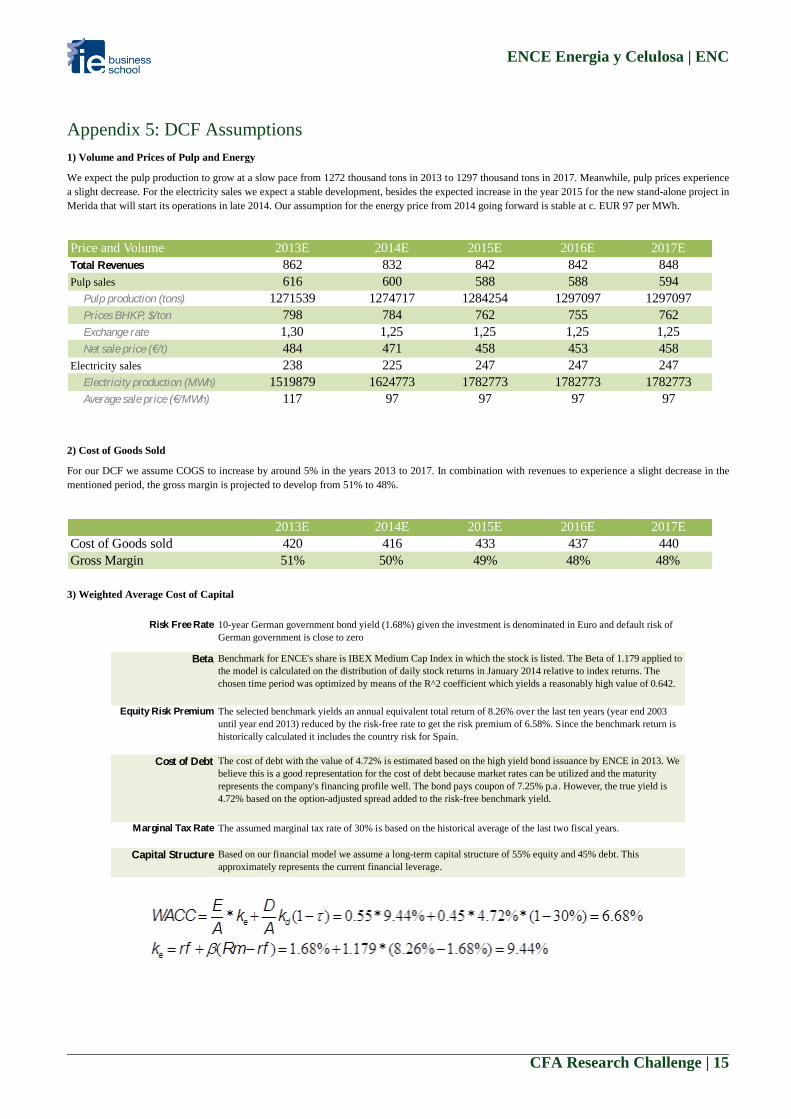
Appendix 5: DCF Assumptions
1) Volume and Prices of Pulp and Energy
We expect the pulp production to grow at a slow pace from 1272 thousand tons in 2013 to 1297 thousand tons in 2017. Meanwhile, pulp prices experience
a slight decrease. For the electricity sales we expect a stable development, besides the expected increase in the year 2015 for the new stand-alone project in
Merida that will start its operations in late 2014. Our assumption for the energy price from 2014 going forward is stable at c. EUR 97 per MWh.
2) Cost of Goods Sold
For our DCF we assume COGS to increase by around 5% in the years 2013 to 2017. In combination with revenues to experience a slight decrease in the
mentioned period, the gross margin is projected to develop from 51% to 48%.
3) Weighted Average Cost of Capital
Price and Volume 2013E 2014E 2015E 2016E 2017E
Total Revenues 862 832 842 842 848
Pulp sales 616 600 588 588 594
Pulp production (tons) 1271539 1274717 1284254 1297097 1297097
Prices BHKP, $/ton 798 784 762 755 762
Exchange rate 1,30 1,25 1,25 1,25 1,25
Net sale price (€/t) 484 471 458 453 458
Electricity sales 238 225 247 247 247
Electricity production (MWh) 1519879 1624773 1782773 1782773 1782773
Average sale price (€/MWh) 117 97 97 97 97
2013E 2014E 2015E 2016E 2017E
Cost of Goods sold 420 416 433 437 440
Gross Margin 51% 50% 49% 48% 48%
Risk Free Rate
Beta
Equity Risk Premium
Cost of Debt
Marginal Tax Rate
Capital Structure
10-year German government bond yield (1.68%) given the investment is denominated in Euro and default risk of
German government is close to zero
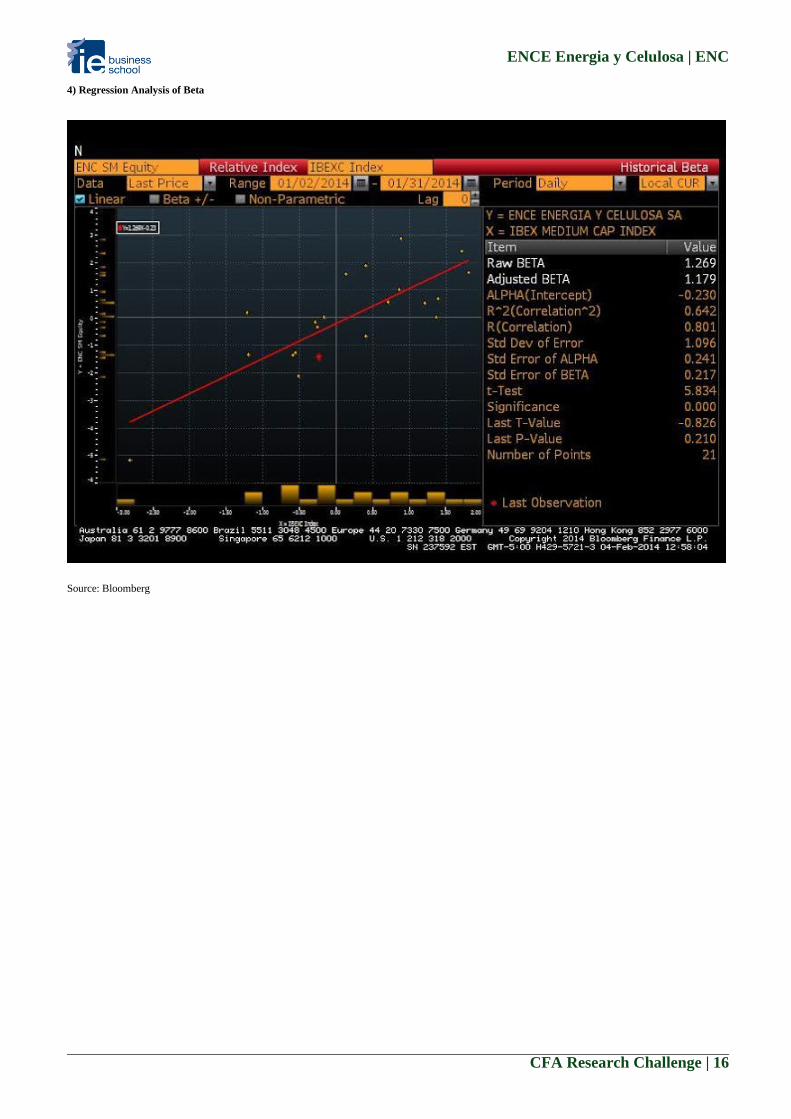
Benchmark for ENCE's share is IBEX Medium Cap Index in which the stock is listed. The Beta of 1.179 applied to
the model is calculated on the distribution of daily stock returns in January 2014 relative to index returns. The
chosen time period was optimized by means of the R^2 coefficient which yields a reasonably high value of 0.642.
The selected benchmark yields an annual equivalent total return of 8.26% over the last ten years (year end 2003
until year end 2013) reduced by the risk-free rate to get the risk premium of 6.58%. Since the benchmark return is
historically calculated it includes the country risk for Spain.
The cost of debt with the value of 4.72% is estimated based on the high yield bond issuance by ENCE in 2013. We
believe this is a good representation for the cost of debt because market rates can be utilized and the maturity
represents the company's financing profile well. The bond pays coupon of 7.25% p.a. However, the true yield is
4.72% based on the option-adjusted spread added to the risk-free benchmark yield.
The assumed marginal tax rate of 30% is based on the historical average of the last two fiscal years.
Based on our financial model we assume a long-term capital structure of 55% equity and 45% debt. This
approximately represents the current financial leverage.
ENCE Energia y Celulosa | ENC
CFA Research Challenge | 16
4) Regression Analysis of Beta
Source: Bloomberg
ENCE Energia y Celulosa | ENC
CFA Research Challenge | 17
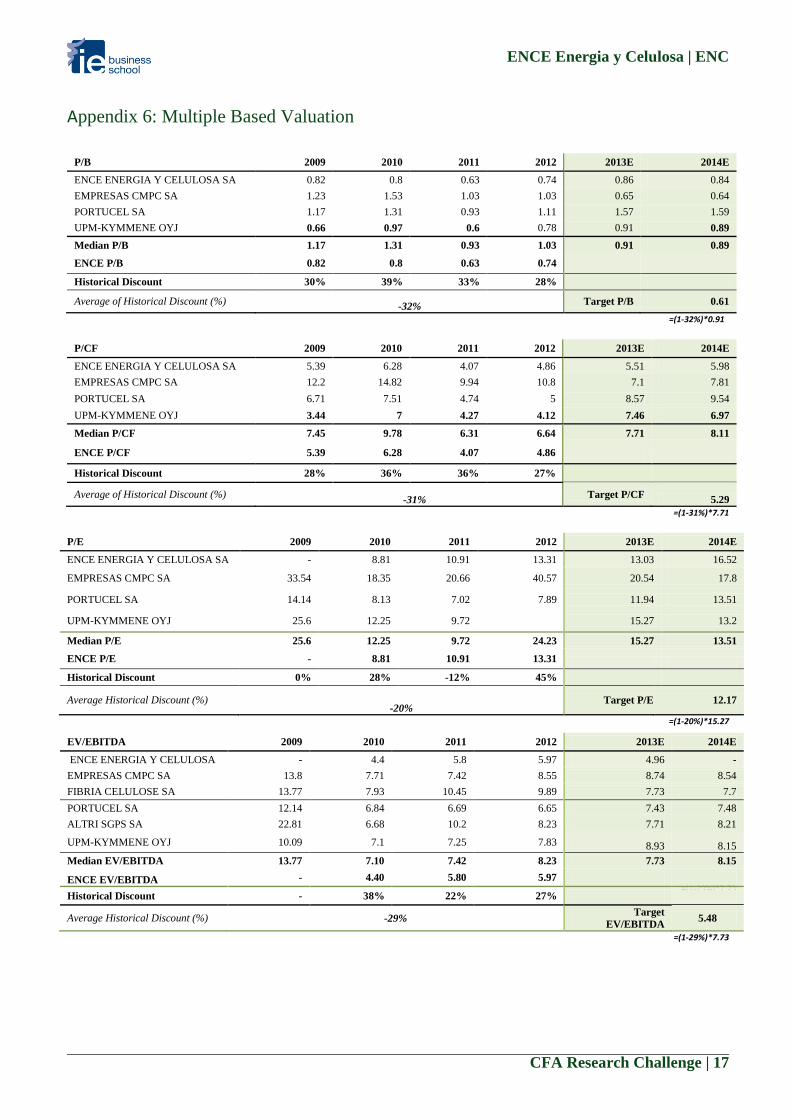
Appendix 6: Multiple Based Valuation
P/B 2009 2010 2011 2012 2013E 2014E
ENCE ENERGIA Y CELULOSA SA 0.82 0.8 0.63 0.74 0.86 0.84
EMPRESAS CMPC SA 1.23 1.53 1.03 1.03 0.65 0.64
PORTUCEL SA 1.17 1.31 0.93 1.11 1.57 1.59
UPM-KYMMENE OYJ 0.66 0.97 0.6 0.78 0.91 0.89
Median P/B 1.17 1.31 0.93 1.03 0.91 0.89
ENCE P/B 0.82 0.8 0.63 0.74
Historical Discount 30% 39% 33% 28%
Average of Historical Discount (%) -32%
Target P/B 0.61
=(1-32%)*0.91
P/CF 2009 2010 2011 2012 2013E 2014E
ENCE ENERGIA Y CELULOSA SA 5.39 6.28 4.07 4.86 5.51 5.98
EMPRESAS CMPC SA 12.2 14.82 9.94 10.8 7.1 7.81
PORTUCEL SA 6.71 7.51 4.74 5 8.57 9.54
UPM-KYMMENE OYJ 3.44 7 4.27 4.12 7.46 6.97
Median P/CF 7.45 9.78 6.31 6.64 7.71 8.11
ENCE P/CF 5.39 6.28 4.07 4.86
Historical Discount 28% 36% 36% 27%
Average of Historical Discount (%) -31%
Target P/CF 5.29
=(1-31%)*7.71
P/E 2009 2010 2011 2012 2013E 2014E
ENCE ENERGIA Y CELULOSA SA - 8.81 10.91 13.31 13.03 16.52
EMPRESAS CMPC SA 33.54 18.35 20.66 40.57 20.54 17.8
PORTUCEL SA 14.14 8.13 7.02 7.89 11.94 13.51
UPM-KYMMENE OYJ 25.6 12.25 9.72 15.27 13.2
Median P/E 25.6 12.25 9.72 24.23 15.27 13.51
ENCE P/E - 8.81 10.91 13.31
Historical Discount 0% 28% -12% 45%
Average Historical Discount (%) -20%
Target P/E 12.17
=(1-20%)*15.27
=(1-29%)*7.73
=(1-29%)*7.73
EV/EBITDA 2009 2010 2011 2012 2013E 2014E
ENCE ENERGIA Y CELULOSA - 4.4 5.8 5.97 4.96 -
EMPRESAS CMPC SA 13.8 7.71 7.42 8.55 8.74 8.54
FIBRIA CELULOSE SA 13.77 7.93 10.45 9.89 7.73 7.7
PORTUCEL SA 12.14 6.84 6.69 6.65 7.43 7.48
ALTRI SGPS SA 22.81 6.68 10.2 8.23 7.71 8.21
UPM-KYMMENE OYJ 10.09 7.1 7.25 7.83 8.93 8.15
Median EV/EBITDA 13.77 7.10 7.42 8.23 7.73 8.15
ENCE EV/EBITDA - 4.40 5.80 5.97
Historical Discount - 38% 22% 27%
Average Historical Discount (%) -29% Target
EV/EBITDA 5.48
ENCE Energia y Celulosa | ENC
CFA Research Challenge | 18
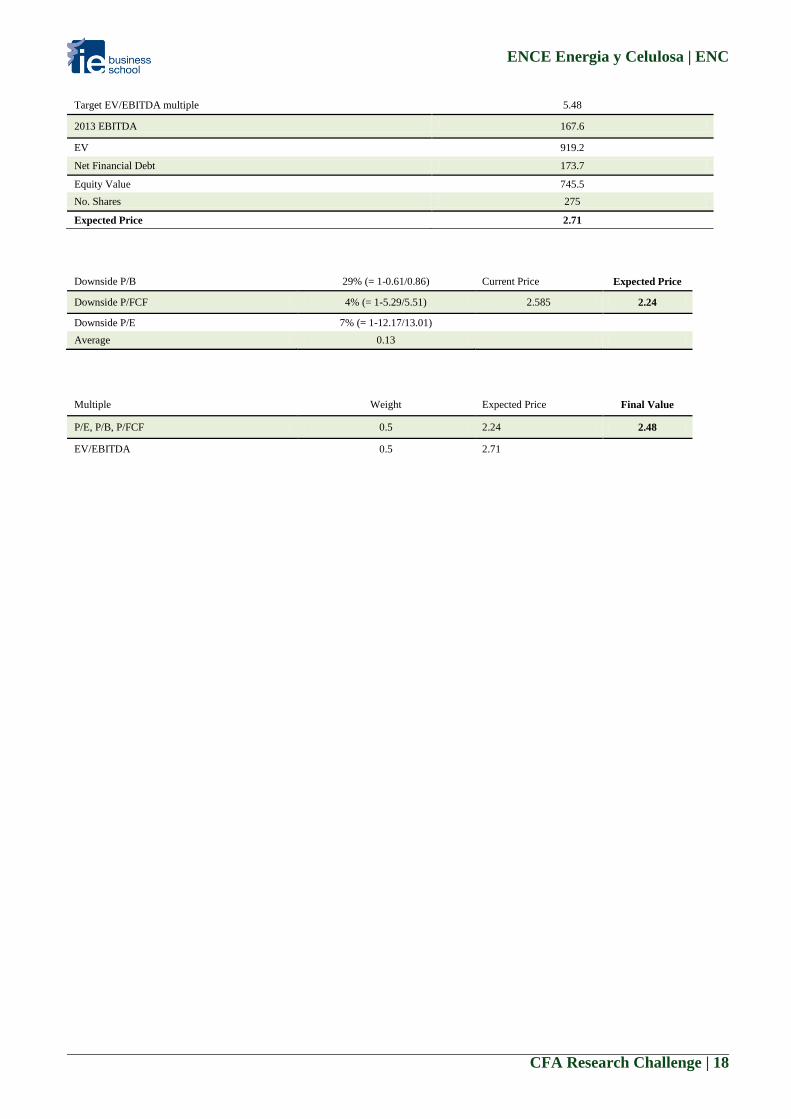
Target EV/EBITDA multiple 5.48
2013 EBITDA 167.6
EV 919.2
Net Financial Debt 173.7
Equity Value 745.5
No. Shares 275
Expected Price 2.71
Downside P/B 29% (= 1-0.61/0.86) Current Price Expected Price
Downside P/FCF 4% (= 1-5.29/5.51) 2.585 2.24
Downside P/E 7% (= 1-12.17/13.01)
Average 0.13
Multiple Weight Expected Price Final Value
P/E, P/B, P/FCF 0.5 2.24 2.48
EV/EBITDA 0.5 2.71

ENCE Energia y Celulosa | ENC
CFA Research Challenge | 19
Appendix 7: Porter’s Five Forces
CompanyAverage= 0.75*Pulp+0.25*Renewables= 3.25
Source: Team estimates
0
1
2
3
4
5Threat of New Entrants
Bargaining Power of Suppliers
Competition in the IndustryThreat of Substitute Products
Bargaining Power of Buyers
Pulp
Renewables
Pulp Renewables
Threat of New Entrants 4 3
Bargaining Power of Suppliers 2 2
Competition in the Industry 5 1
Threat of Substitute Products 4 3
Bargaining Power of Buyers 2 5
3.4 2.8
Scale of Interaction
0 No interaction 1 Insignificant 2 Low
3 Average 4 High 5 Very High
3.25
Company Specific Average

ENCE Energia y Celulosa | ENC
CFA Research Challenge | 20
Appendix 8: Peer Group Selection
Source: Bloomberg and Team Estimates
ENCE Energia y Celulosa | ENC
CFA Research Challenge | 21
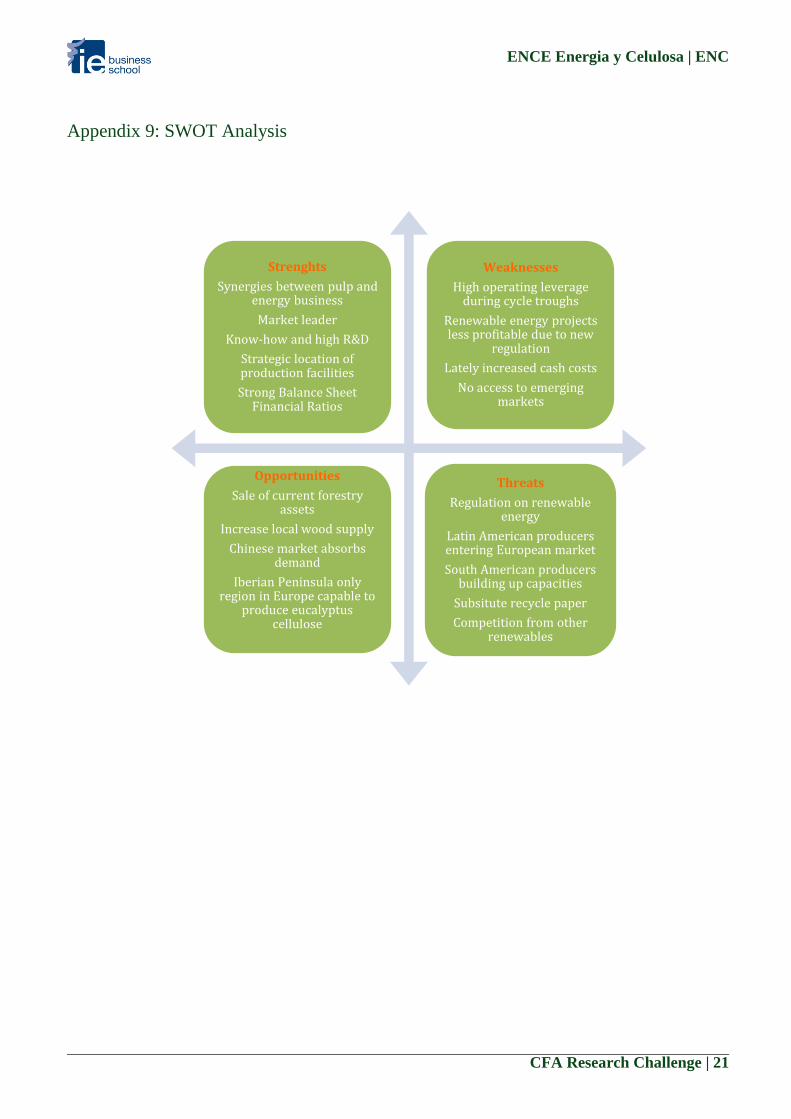
Appendix 9: SWOT Analysis
Strenghts
Synergies between pulp and energy business
Market leader
Know-how and high R&D
Strategic location of production facilities
Strong Balance Sheet Financial Ratios
Weaknesses
High operating leverage during cycle troughs
Renewable energy projects less profitable due to new
regulation
Lately increased cash costs
No access to emerging markets
Opportunities
Sale of current forestry assets
Increase local wood supply
Chinese market absorbs demand
Iberian Peninsula only region in Europe capable to
produce eucalyptus cellulose
Threats
Regulation on renewable energy
Latin American producers entering European market
South American producers building up capacities
Subsitute recycle paper
Competition from other renewables

ENCE Energia y Celulosa | ENC
CFA Research Challenge | 22
Appendix 10: Shareholding Structure
Top 10 Institutional Holders Position (Shares) Market Value O/S
Amber Capital (UK) LLP 10,070,000 25,980,600 3.65%
Norges Bank Investment Management 7,576,352 19,546,988 2.75%
Dimensional Fund Advisors LP 5,602,146 14,453,537 2.03%
JPMorgan Asset Management (UK) Ltd. 1,646,400 4,247,712 0.6%
Banco Madrid Gestion de Activos SGIIC SA 1,401,511 3,615,898 0.51%
Guggenheim Funds Investment Advisors LLC 1,249,612 3,223,999 0.45%
Barclays Wealth Managers Espana SGIIC SA 1,229,316 3,171,635 0.45%
Batterymarch Financial Management, Inc. 983,246 2,536,775 0.36%
Mellon Capital Management Corp. 801,987 2,069,126 0.29%
S.W. Mitchell Capital LLP 797,305 2,057,047 0.29%
Board member Function
D. Juan Luis Arregui Ciarsolo Chairman
D. Ignacio de Colmenares y Brunet CEO
D. Pedro Barato Triguero Director
D. José Guillermo Zubía Guinea Director
D. Gustavo Matías Clavero Director
D. José Manuel Serra Peris Director
D. José Carlos del Álamo Jiménez Director
Retos Operativos XXI, S.L.(represented by D. Óscar Arregui Abendivar) Director
D. Pascual Fernández Martínez Director
D. Javier Echenique Landiríbar Director
D. Fernando Abril-Martorell Hernández Director
Dña. Isabel Tocino Biscarolasaga Director
D. José Antonio Escalona de Molina Secretary
D. Guillermo Medina Ors Vice Secretary
Insiders Position (Shares) Market Value O/S
Retos Operativos (Juan Luis Arregui) 64,046,105 165,238,949.86 23.24%
Alcor Holding (Alberto Alcocer y Alberto Cortina) 73,085,314 188,560,109.73 26.52%
Lopez Jimenez Pedro Jose 13,338,345 34,412,931.04 4.84%
DE URRUTIA VAL VICTOR JUAN 12,511,588 32,279,898.12 4.54%
COMENGE SANCH JOSE IGNACIO 12,511,588 32,279,898.12 4.54%
Treasury Stocks 8,047,101 20,761,520.38 2.92%
ENCE Energia y Celulosa | ENC
CFA Research Challenge | 23
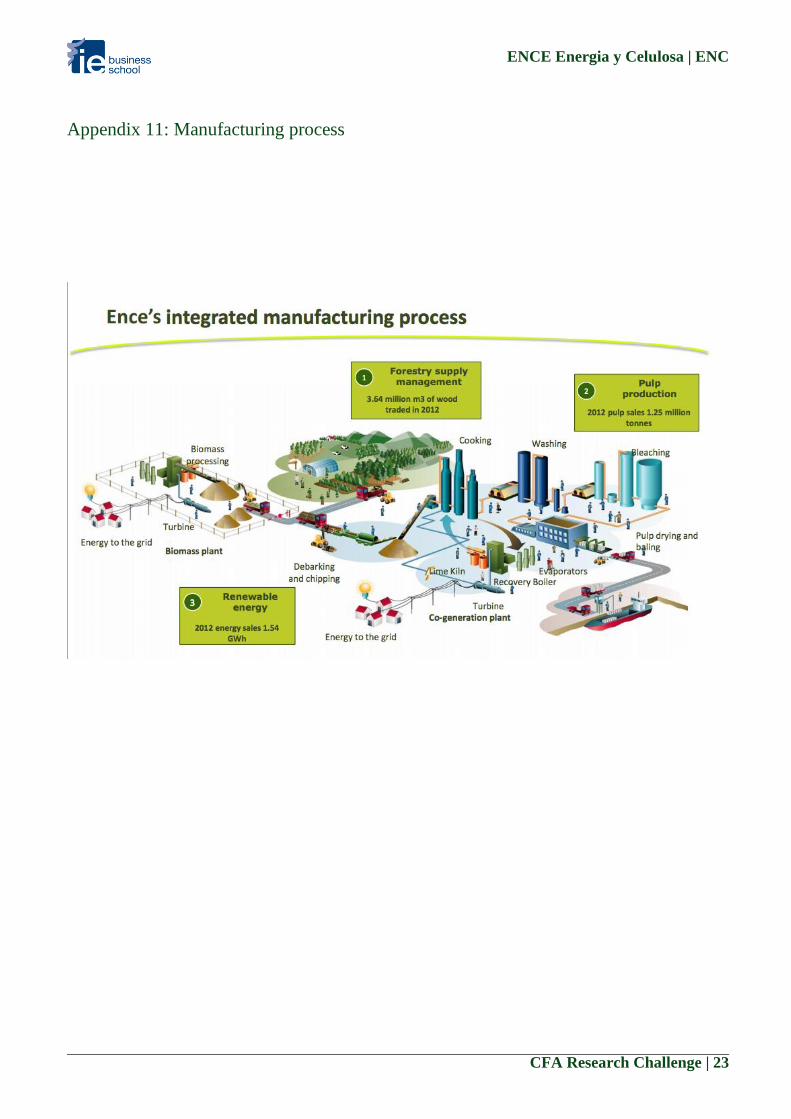
Appendix 11: Manufacturing process
ENCE Energia y Celulosa | ENC
CFA Research Challenge | 24
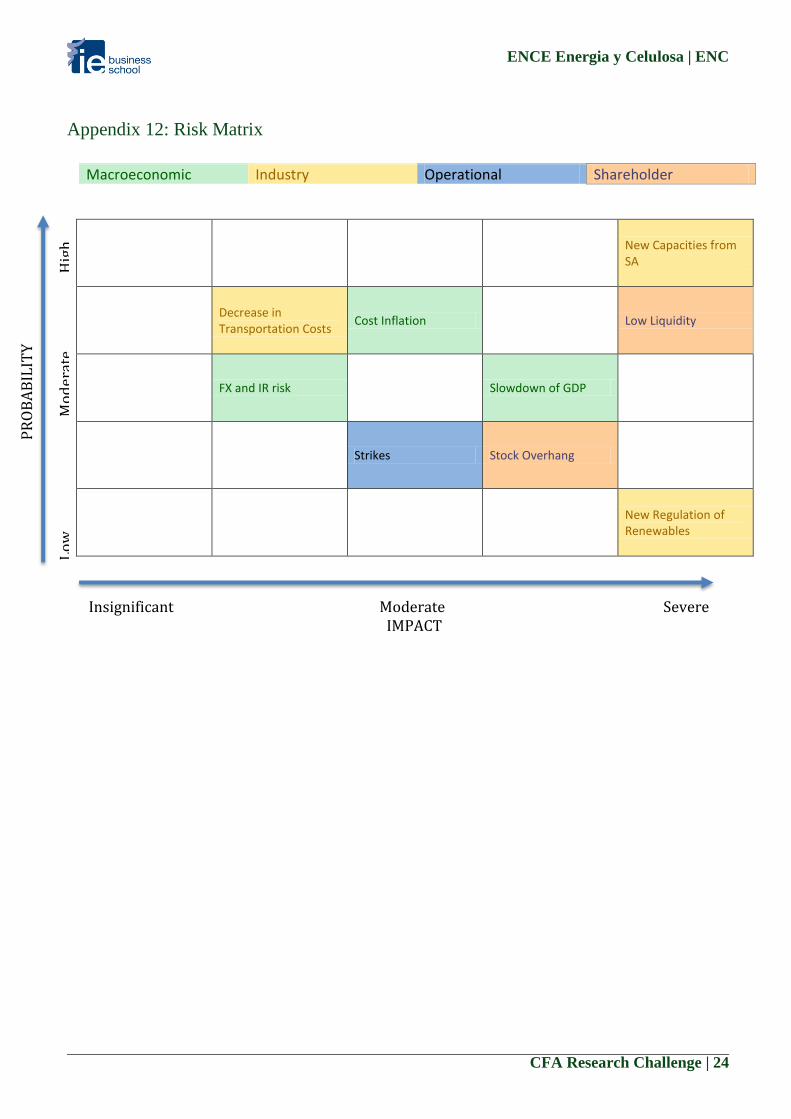
Appendix 12: Risk Matrix
Macroeconomic Industry Operational Shareholder
New Capacities from SA
Decrease in Transportation Costs
Cost Inflation Low Liquidity
FX and IR risk Slowdown of GDP
Strikes Stock Overhang
New Regulation of Renewables
PR
OB
AB
ILIT
Y
Lo
w
Mo
der
ate
H
igh
Insignificant Moderate Severe IMPACT
ENCE Energia y Celulosa | ENC
CFA Research Challenge | 25
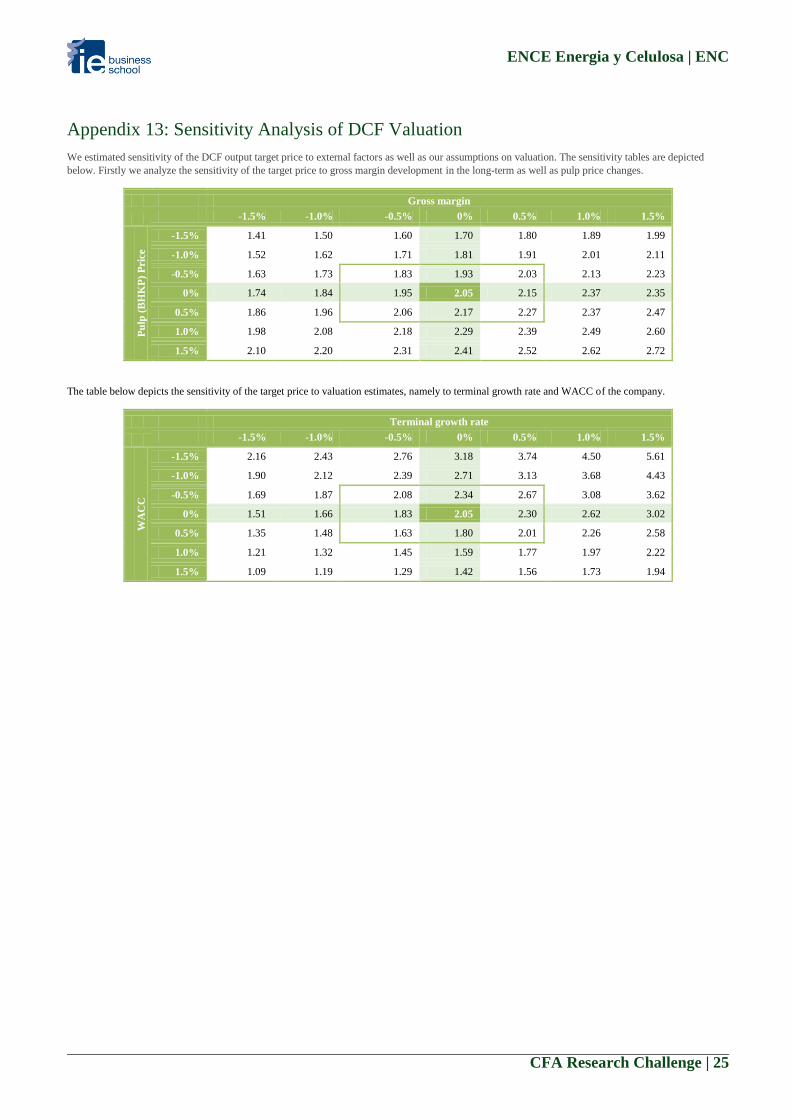
Appendix 13: Sensitivity Analysis of DCF Valuation
We estimated sensitivity of the DCF output target price to external factors as well as our assumptions on valuation. The sensitivity tables are depicted
below. Firstly we analyze the sensitivity of the target price to gross margin development in the long-term as well as pulp price changes.
Gross margin
-1.5% -1.0% -0.5% 0% 0.5% 1.0% 1.5%
Pu
lp (
BH
KP
) P
ric
e
-1.5% 1.41 1.50 1.60 1.70 1.80 1.89 1.99
-1.0% 1.52 1.62 1.71 1.81 1.91 2.01 2.11
-0.5% 1.63 1.73 1.83 1.93 2.03 2.13 2.23
0% 1.74 1.84 1.95 2.05 2.15 2.37 2.35
0.5% 1.86 1.96 2.06 2.17 2.27 2.37 2.47
1.0% 1.98 2.08 2.18 2.29 2.39 2.49 2.60
1.5% 2.10 2.20 2.31 2.41 2.52 2.62 2.72
The table below depicts the sensitivity of the target price to valuation estimates, namely to terminal growth rate and WACC of the company.
Terminal growth rate
-1.5% -1.0% -0.5% 0% 0.5% 1.0% 1.5%
WA
CC
-1.5% 2.16 2.43 2.76 3.18 3.74 4.50 5.61
-1.0% 1.90 2.12 2.39 2.71 3.13 3.68 4.43
-0.5% 1.69 1.87 2.08 2.34 2.67 3.08 3.62
0% 1.51 1.66 1.83 2.05 2.30 2.62 3.02
0.5% 1.35 1.48 1.63 1.80 2.01 2.26 2.58
1.0% 1.21 1.32 1.45 1.59 1.77 1.97 2.22
1.5% 1.09 1.19 1.29 1.42 1.56 1.73 1.94
ENCE Energia y Celulosa | ENC
CFA Research Challenge | 26
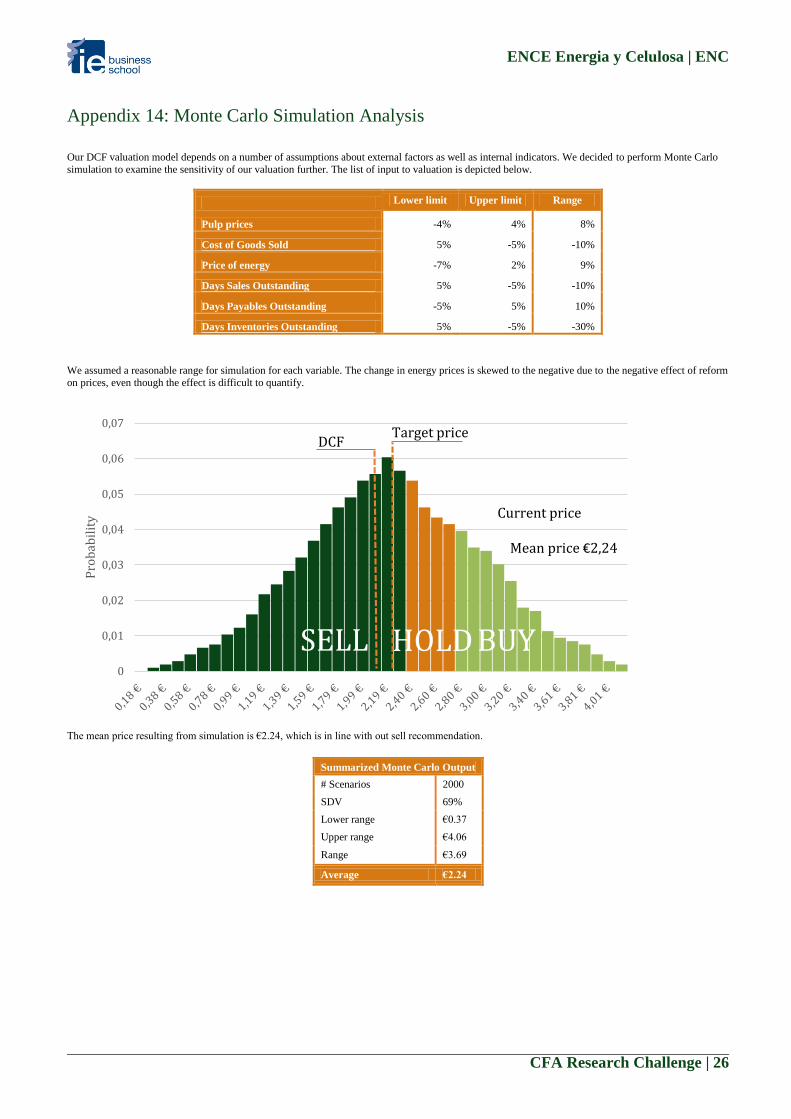
Appendix 14: Monte Carlo Simulation Analysis
Our DCF valuation model depends on a number of assumptions about external factors as well as internal indicators. We decided to perform Monte Carlo
simulation to examine the sensitivity of our valuation further. The list of input to valuation is depicted below.
Lower limit Upper limit Range
Pulp prices -4% 4% 8%
Cost of Goods Sold 5% -5% -10%
Price of energy -7% 2% 9%
Days Sales Outstanding 5% -5% -10%
Days Payables Outstanding -5% 5% 10%
Days Inventories Outstanding 5% -5% -30%
We assumed a reasonable range for simulation for each variable. The change in energy prices is skewed to the negative due to the negative effect of reform
on prices, even though the effect is difficult to quantify.
The mean price resulting from simulation is €2.24, which is in line with out sell recommendation.
0
0,01
0,02
0,03
0,04
0,05
0,06
0,07
Pro
bab
ilit
y Current price
Mean price €2,24
DCF Target price
BUYHOLDSELL
Summarized Monte Carlo Output
# Scenarios 2000
SDV 69%
Lower range €0.37
Upper range €4.06
Range €3.69
Average €2.24

ENCE Energia y Celulosa | ENC
CFA Research Challenge | 27
Appendix 15: Technical Analysis
Number Technical Analysis Description
1 Support/Resistance Lines The technical indicators generally point towards a downwards potential in price movement. The
long term support line now acts as a resistance line to prices. The upper price range is bound at
€3.20 and the lower price is bounded by two major support lines at €2.30 and €1.90
respectively. The stock is in a downtrend and has the potential to go down by €0.25 from
trading price as of 17/02/2014.
2 Relative Strengh Index The RSI is just under 40 and can go lower before it reaches "oversold" territory.
3 Candlestick Patterns There was a formation of a bearish "evening star" pattern recently which signals negative
sentiment in price charts of ENCE.
4 MACD / MACD Signal The MACD is still below the MACD signal indicating a strong sell signal. This would change
when MACD crosses above MACD Signal

Disclosures:Ownership and material conflicts of interest:The author(s), or a member of their household, of this report does not hold a financial interest in the securities of this company.The author(s), or a member of their household, of this report does not know of the existence of any conflicts of interest that might biasthe content or publication of this report.Receipt of compensation:Compensation of the author(s) of this report is not based on investment banking revenue.Position as a officer or director:The author(s), or a member of their household, does not serve as an officer, director or advisory board member of the subjectcompany.Market making:The author(s) does not act as a market maker in the subject company’s securities.Disclaimer:The information set forth herein has been obtained or derived from sources generally available to the public and believed by theauthor(s) to be reliable, but the author(s) does not make any representation or warranty, express or implied, as to its accuracy orcompleteness. The information is not intended to be used as the basis of any investment decisions by any person or entity. Thisinformation does not constitute investment advice, nor is it an offer or a solicitation of an offer to buy or sell any security. This reportshould not be considered to be a recommendation by any individual affiliated with CFA Society Spain, CFA Institute or the CFAInstitute Research Challenge with regard to this company’s stock.
CFA Institute Research Challenge
Recommended