Summary. . . . . . . . . .Introduction
. . . . . . . . . . .Kiyota and Maruyama (2016)
. . .Conclusion
. .Appendix
.
......
ICT, Offshoring, and the Demand forPart-time Workers:
The Case of Japanese Manufacturing
Kozo KiyotaKeio University
Sawako MaruyamaKobe University
June 1, 2016
Kozo Kiyota and Sawako Maruyama Trilateral Workshop, PRI – 6/1/2016 1 / 27

Summary. . . . . . . . . .Introduction
. . . . . . . . . . .Kiyota and Maruyama (2016)
. . .Conclusion
. .Appendix
Introduction
Kozo Kiyota and Sawako Maruyama Trilateral Workshop, PRI – 6/1/2016 2 / 27
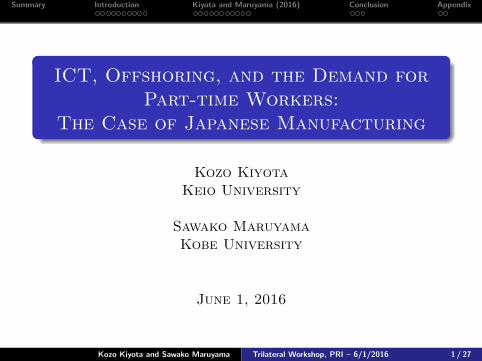
Source: Ministry of Finance (2015) International Investment Position of Japan .
30.6 39.1
119.3
143.9
0.0
20.0
40.0
60.0
80.0
100.0
120.0
140.0
160.0
19
96
19
97
19
98
19
99
20
00
20
01
20
02
20
03
20
04
20
05
20
06
20
07
20
08
20
09
20
10
20
11
20
12
20
13
20
14
Inv
est
me
nt
Po
siti
on
(T
rill
ion
JP
Y)
Source: Ministry of Finance (2015) International Investment Position of Japan.
Japanese outward foreign direct investment (FDI) is expanding rapidly.
Summary. . . . . . . . . .Introduction
. . . . . . . . . . .Kiyota and Maruyama (2016)
. . .Conclusion
. .Appendix
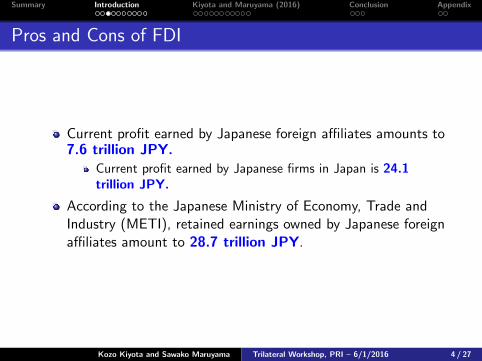
Pros and Cons of FDI
Current profit earned by Japanese foreign affiliates amounts to7.6 trillion JPY.
Current profit earned by Japanese firms in Japan is 24.1trillion JPY.
According to the Japanese Ministry of Economy, Trade andIndustry (METI), retained earnings owned by Japanese foreignaffiliates amount to 28.7 trillion JPY.
Kozo Kiyota and Sawako Maruyama Trilateral Workshop, PRI – 6/1/2016 4 / 27

Notes: Trillion JPY. Others include such items as income.
Source: Ministry of Finance (2016) Balance of Payments Statistics
2.3 5.8
9.5 7.9 7.4
3.2 6.5
8.4 10.2
7.7 7.3 9.8
1.9 2.1
6.9
-3.1
-8.1
-12.3 -13.5
-2.2
1.5
1.3
0.8
0.4 1.8
1.3
1.0
1.3
2.4
2.7 3.5
3.6
2.0 3.3
4.1
4.4 3.9 6.1 6.5
8.3
7.5
11.6
15.0
13.0 14.1
10.5
13.7
16.1
19.7 18.7
20.3
24.9
14.9 13.6
19.4
10.4 4.8
3.9 2.6
16.6
-20.0
-15.0
-10.0
-5.0
0.0
5.0
10.0
15.0
20.0
25.0
30.0
1996 1997 1998 1999 2000 2001 2002 2003 2004 2005 2006 2007 2008 2009 2010 2011 2012 2013 2014 2015
Goods and services Direct investment Others Current account
Notes: Trillion JPY. Others include such items as income.
Source: Ministry of Finance (2016) Balance of Payments Statistics.
Negative trade balance is offset by direct investment income in recentyears.
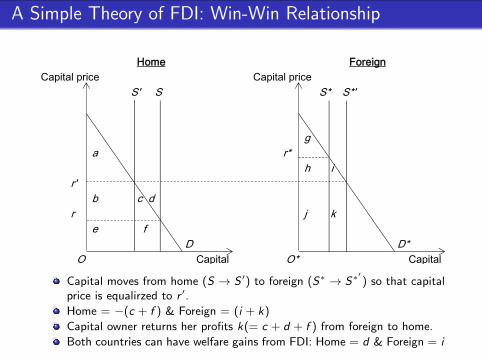
A Simple Theory of FDI: Win-Win Relationship
Home ForeignCapital price Capital price
S' S S* S*'
g a r*
h i r'
b c d r j k
e fD D*
O Capital O* Capital
Capital moves from home (S → S ′) to foreign (S∗ → S∗′) so that capitalprice is equalirzed to r ′.
Home = −(c + f ) & Foreign = (i + k)
Capital owner returns her profits k(= c + d + f ) from foreign to home.
Both countries can have welfare gains from FDI: Home = d & Foreign = i
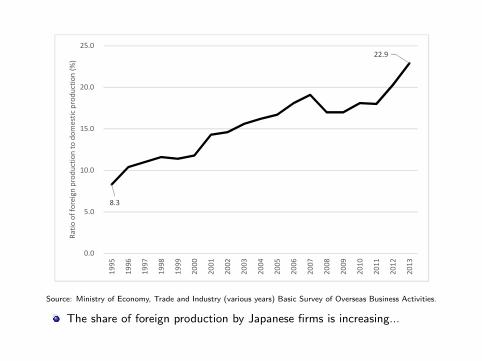
8.3
22.9
0.0
5.0
10.0
15.0
20.0
25.0
19
95
19
96
19
97
19
98
19
99
20
00
20
01
20
02
20
03
20
04
20
05
20
06
20
07
20
08
20
09
20
10
20
11
20
12
20
13
Ra
tio
of
fore
ign
pro
du
ctio
n t
o d
om
est
ic p
rod
uct
ion
(%
)
Source: Ministry of Economy, Trade and Industry (various years) Basic Survey of Overseas Business Activities.
The share of foreign production by Japanese firms is increasing...
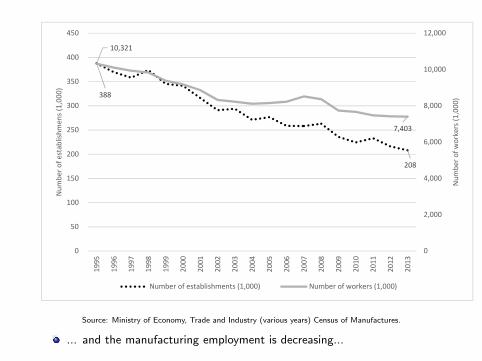
388
208
10,321
7,403
0
2,000
4,000
6,000
8,000
10,000
12,000
0
50
100
150
200
250
300
350
400
450
19
95
19
96
19
97
19
98
19
99
20
00
20
01
20
02
20
03
20
04
20
05
20
06
20
07
20
08
20
09
20
10
20
11
20
12
20
13
Nu
mb
er
of
wo
rke
rs (
1,0
00
)
Nu
mb
er
of
est
ab
lish
me
ns
(1,0
00
)
Number of establishments (1,000) Number of workers (1,000)
Source: Ministry of Economy, Trade and Industry (various years) Census of Manufactures.
... and the manufacturing employment is decreasing...
Pros and Cons of FDI
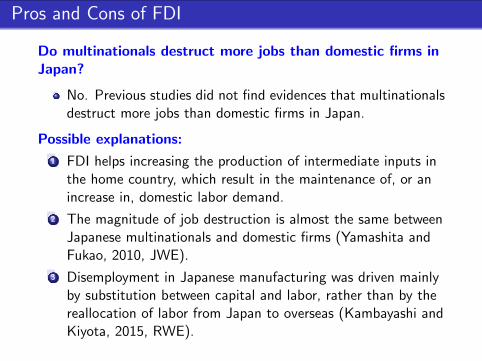
Do multinationals destruct more jobs than domestic firms inJapan?
No. Previous studies did not find evidences that multinationalsdestruct more jobs than domestic firms in Japan.
Possible explanations:...1 FDI helps increasing the production of intermediate inputs inthe home country, which result in the maintenance of, or anincrease in, domestic labor demand.
...2 The magnitude of job destruction is almost the same betweenJapanese multinationals and domestic firms (Yamashita andFukao, 2010, JWE).
...3 Disemployment in Japanese manufacturing was driven mainlyby substitution between capital and labor, rather than by thereallocation of labor from Japan to overseas (Kambayashi andKiyota, 2015, RWE).
Summary. . . . . . . . . .Introduction
. . . . . . . . . . .Kiyota and Maruyama (2016)
. . .Conclusion
. .Appendix
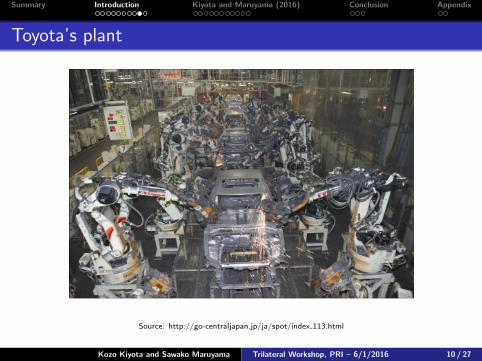
Toyota’s plant
Source: http://go-centraljapan.jp/ja/spot/index 113.html
Kozo Kiyota and Sawako Maruyama Trilateral Workshop, PRI – 6/1/2016 10 / 27
Summary. . . . . . . . . .Introduction
. . . . . . . . . . .Kiyota and Maruyama (2016)
. . .Conclusion
. .Appendix
Pros and Cons of FDI
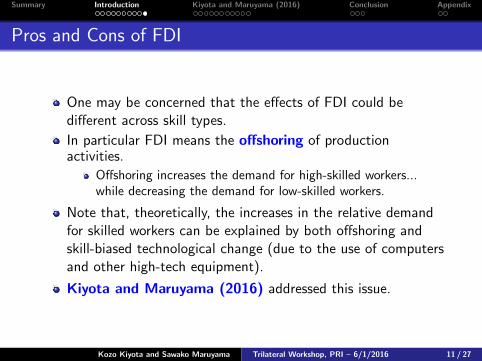
One may be concerned that the effects of FDI could bedifferent across skill types.
In particular FDI means the offshoring of productionactivities.
Offshoring increases the demand for high-skilled workers...while decreasing the demand for low-skilled workers.
Note that, theoretically, the increases in the relative demandfor skilled workers can be explained by both offshoring andskill-biased technological change (due to the use of computersand other high-tech equipment).
Kiyota and Maruyama (2016) addressed this issue.
Kozo Kiyota and Sawako Maruyama Trilateral Workshop, PRI – 6/1/2016 11 / 27
Summary. . . . . . . . . .Introduction
. . . . . . . . . . .Kiyota and Maruyama (2016)
. . .Conclusion
. .Appendix
Kozo Kiyota and Sawako Maruyama (2016)
“ICT, Offshoring, and the Demand forPart-time Workers: The Case of Japanese
Manufacturing”
Kozo Kiyota and Sawako Maruyama Trilateral Workshop, PRI – 6/1/2016 12 / 27

Summary
What we do?
This paper examines the effects of information andcommunication technology (ICT) and offshoring on the skilldemand in Japanese manufacturing.
What’s new?
This paper focuses explicitly on the demand for low-wagepart-time workers, which we call low skilled workers.
Summary. . . . . . . . . .Introduction
. . . . . . . . . . .Kiyota and Maruyama (2016)
. . .Conclusion
. .Appendix
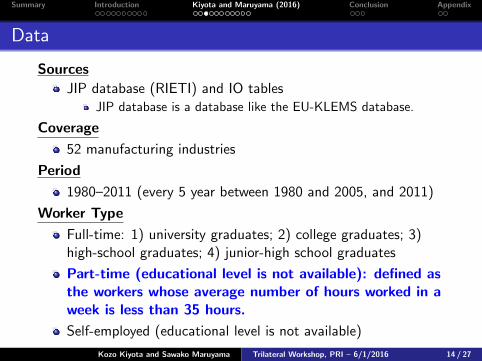
Data
Sources
JIP database (RIETI) and IO tablesJIP database is a database like the EU-KLEMS database.
Coverage
52 manufacturing industries
Period
1980–2011 (every 5 year between 1980 and 2005, and 2011)
Worker Type
Full-time: 1) university graduates; 2) college graduates; 3)high-school graduates; 4) junior-high school graduates
Part-time (educational level is not available): defined asthe workers whose average number of hours worked in aweek is less than 35 hours.
Self-employed (educational level is not available)
Kozo Kiyota and Sawako Maruyama Trilateral Workshop, PRI – 6/1/2016 14 / 27
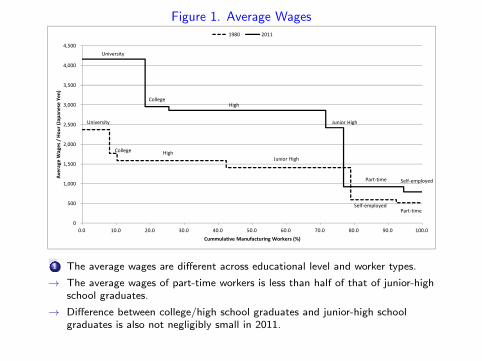
Figure 1. Average WagesFigure 1. Average Wages in Japanese Labor Markets, 1980 and 2011
Source: JIP database 2014.
Note: More detailed figures on the average wage and the employment share of each group are reported in Figure 2 and Figure A1, respectively.
University
CollegeHigh
Junior High
Self-employedPart-time
University
CollegeHigh
Junior High
Part-time Self-employed
0
500
1,000
1,500
2,000
2,500
3,000
3,500
4,000
4,500
0.0 10.0 20.0 30.0 40.0 50.0 60.0 70.0 80.0 90.0 100.0
Av
era
ge
Wa
ge
s /
Ho
ur
(Ja
pa
ne
se Y
en
)
Cummulative Manufacturing Workers (%)
1980 2011
...1 The average wages are different across educational level and worker types.
→ The average wages of part-time workers is less than half of that of junior-highschool graduates.
→ Difference between college/high school graduates and junior-high schoolgraduates is also not negligibly small in 2011.
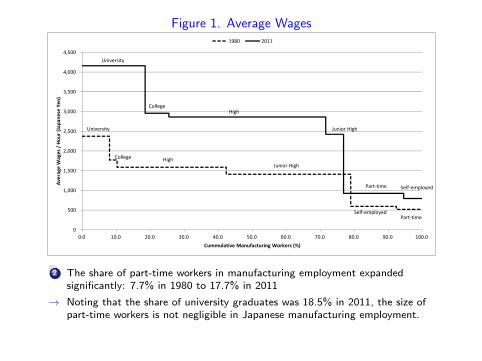
Figure 1. Average WagesFigure 1. Average Wages in Japanese Labor Markets, 1980 and 2011
Source: JIP database 2014.
Note: More detailed figures on the average wage and the employment share of each group are reported in Figure 2 and Figure A1, respectively.
University
CollegeHigh
Junior High
Self-employedPart-time
University
CollegeHigh
Junior High
Part-time Self-employed
0
500
1,000
1,500
2,000
2,500
3,000
3,500
4,000
4,500
0.0 10.0 20.0 30.0 40.0 50.0 60.0 70.0 80.0 90.0 100.0
Av
era
ge
Wa
ge
s /
Ho
ur
(Ja
pa
ne
se Y
en
)
Cummulative Manufacturing Workers (%)
1980 2011
...2 The share of part-time workers in manufacturing employment expandedsignificantly: 7.7% in 1980 to 17.7% in 2011
→ Noting that the share of university graduates was 18.5% in 2011, the size ofpart-time workers is not negligible in Japanese manufacturing employment.
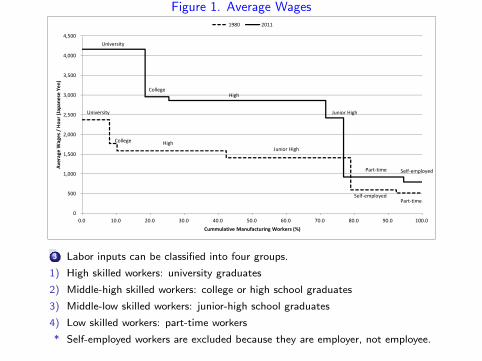
Figure 1. Average WagesFigure 1. Average Wages in Japanese Labor Markets, 1980 and 2011
Source: JIP database 2014.
Note: More detailed figures on the average wage and the employment share of each group are reported in Figure 2 and Figure A1, respectively.
University
CollegeHigh
Junior High
Self-employedPart-time
University
CollegeHigh
Junior High
Part-time Self-employed
0
500
1,000
1,500
2,000
2,500
3,000
3,500
4,000
4,500
0.0 10.0 20.0 30.0 40.0 50.0 60.0 70.0 80.0 90.0 100.0
Av
era
ge
Wa
ge
s /
Ho
ur
(Ja
pa
ne
se Y
en
)
Cummulative Manufacturing Workers (%)
1980 2011
...3 Labor inputs can be classified into four groups.
1) High skilled workers: university graduates
2) Middle-high skilled workers: college or high school graduates
3) Middle-low skilled workers: junior-high school graduates
4) Low skilled workers: part-time workers
* Self-employed workers are excluded because they are employer, not employee.
Summary. . . . . . . . . .Introduction
. . . . . . . . . . .Kiyota and Maruyama (2016)
. . .Conclusion
. .Appendix
Methodology
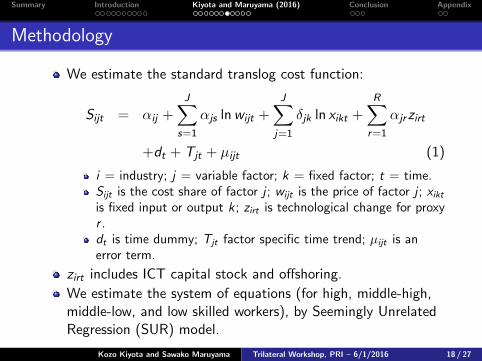
We estimate the standard translog cost function:
Sijt = αij +J∑
s=1
αjs lnwijt +J∑
j=1
δjk ln xikt +R∑
r=1
αjrzirt
+dt + Tjt + µijt (1)
i = industry; j = variable factor; k = fixed factor; t = time.Sijt is the cost share of factor j ; wijt is the price of factor j ; xiktis fixed input or output k; zirt is technological change for proxyr .dt is time dummy; Tjt factor specific time trend; µijt is anerror term.
zirt includes ICT capital stock and offshoring.
We estimate the system of equations (for high, middle-high,middle-low, and low skilled workers), by Seemingly UnrelatedRegression (SUR) model.
Kozo Kiyota and Sawako Maruyama Trilateral Workshop, PRI – 6/1/2016 18 / 27
Summary. . . . . . . . . .Introduction
. . . . . . . . . . .Kiyota and Maruyama (2016)
. . .Conclusion
. .Appendix
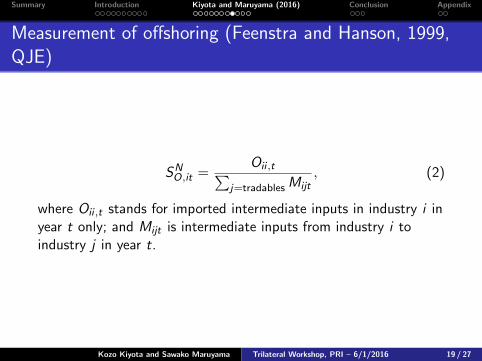
Measurement of offshoring (Feenstra and Hanson, 1999,QJE)
SNO,it =
Oii ,t∑j=tradablesMijt
, (2)
where Oii ,t stands for imported intermediate inputs in industry i inyear t only; and Mijt is intermediate inputs from industry i toindustry j in year t.
Kozo Kiyota and Sawako Maruyama Trilateral Workshop, PRI – 6/1/2016 19 / 27
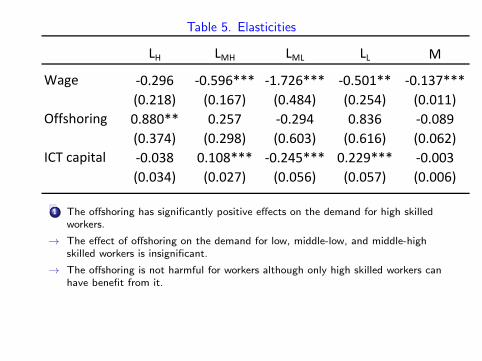
Table 5. Elasticities
Table 6. Factor Demand and Other Elasticities, 1980-2011: Baseline Results
LH LMH LML LL M
Wage -0.296 -0.596*** -1.726*** -0.501** -0.137***
(0.218) (0.167) (0.484) (0.254) (0.011)
Offshoring 0.880** 0.257 -0.294 0.836 -0.089
(0.374) (0.298) (0.603) (0.616) (0.062)
ICT capital -0.038 0.108*** -0.245*** 0.229*** -0.003
(0.034) (0.027) (0.056) (0.057) (0.006)
...1 The offshoring has significantly positive effects on the demand for high skilledworkers.
→ The effect of offshoring on the demand for low, middle-low, and middle-highskilled workers is insignificant.
→ The offshoring is not harmful for workers although only high skilled workers canhave benefit from it.

Table 5. Elasticities
Table 6. Factor Demand and Other Elasticities, 1980-2011: Baseline Results
LH LMH LML LL M
Wage -0.296 -0.596*** -1.726*** -0.501** -0.137***
(0.218) (0.167) (0.484) (0.254) (0.011)
Offshoring 0.880** 0.257 -0.294 0.836 -0.089
(0.374) (0.298) (0.603) (0.616) (0.062)
ICT capital -0.038 0.108*** -0.245*** 0.229*** -0.003
(0.034) (0.027) (0.056) (0.057) (0.006)
...2 The effect of the ICT capital on the demand for middle-high, middle-low, andlow skilled workers is significantly positive, significantly negative, andsignificantly positive, respectively.
→ ICT has different effects across skills: it complements the middle-high and lowskilled workers but substitutes for the middle-low skilled workers.
→ Industries with higher ICT stock shifted demand from middle-low skilled workersto middle-high and low skilled workers, which is consistent with ICT–based “jobpolarization” (Autor, 2015, JEP).
Summary
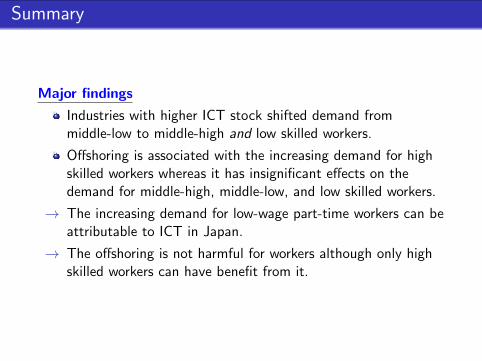
Major findings
Industries with higher ICT stock shifted demand frommiddle-low to middle-high and low skilled workers.
Offshoring is associated with the increasing demand for highskilled workers whereas it has insignificant effects on thedemand for middle-high, middle-low, and low skilled workers.
→ The increasing demand for low-wage part-time workers can beattributable to ICT in Japan.
→ The offshoring is not harmful for workers although only highskilled workers can have benefit from it.

Summary. . . . . . . . . .Introduction
. . . . . . . . . . .Kiyota and Maruyama (2016)
. . .Conclusion
. .Appendix
Conclusion
Kozo Kiyota and Sawako Maruyama Trilateral Workshop, PRI – 6/1/2016 23 / 27

Conclusion
What we did?
This paper examines the effects of information and communicationtechnology (ICT) and offshoring on the skill demand in Japanesemanufacturing.
Contribution
This paper focuses explicitly on the demand for low-wage part-timeworkers (i.e., low skilled workers).
Data
Industry-level data for the period 1980–2011.
Conclusion
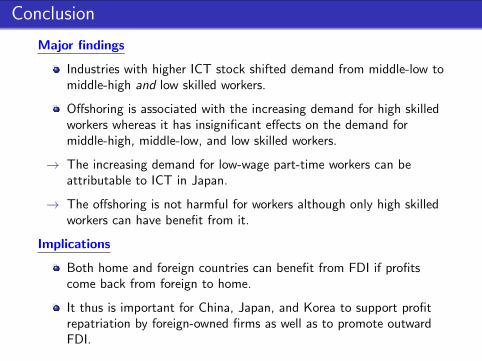
Major findings
Industries with higher ICT stock shifted demand from middle-low tomiddle-high and low skilled workers.
Offshoring is associated with the increasing demand for high skilledworkers whereas it has insignificant effects on the demand formiddle-high, middle-low, and low skilled workers.
→ The increasing demand for low-wage part-time workers can beattributable to ICT in Japan.
→ The offshoring is not harmful for workers although only high skilledworkers can have benefit from it.
Implications
Both home and foreign countries can benefit from FDI if profitscome back from foreign to home.
It thus is important for China, Japan, and Korea to support profitrepatriation by foreign-owned firms as well as to promote outwardFDI.

Summary. . . . . . . . . .Introduction
. . . . . . . . . . .Kiyota and Maruyama (2016)
. . .Conclusion
. .Appendix
Appendix
Kozo Kiyota and Sawako Maruyama Trilateral Workshop, PRI – 6/1/2016 26 / 27
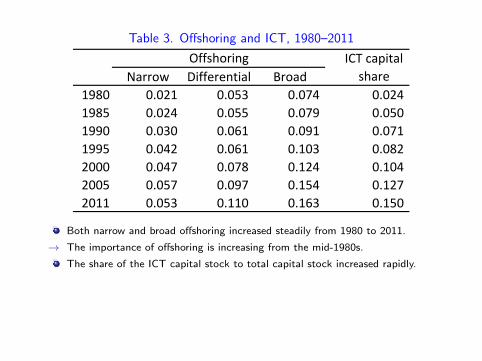
Table 3. Offshoring and ICT, 1980–2011Table 3. Offshoring and ICT, 1980-2011
Narrow Differential Broad
1980 0.021 0.053 0.074 0.024
1985 0.024 0.055 0.079 0.050
1990 0.030 0.061 0.091 0.071
1995 0.042 0.061 0.103 0.082
2000 0.047 0.078 0.124 0.104
2005 0.057 0.097 0.154 0.127
2011 0.053 0.110 0.163 0.150
Offshoring ICT capital
share
Both narrow and broad offshoring increased steadily from 1980 to 2011.
→ The importance of offshoring is increasing from the mid-1980s.
The share of the ICT capital stock to total capital stock increased rapidly.
Recommended