HyMap Hyperspectral Surveys for Mineral Exploration
HyVista Corporation
11/10 Gladstone Rd., Castle Hill, NSW, AUSTRALIA
www.hyvista.com
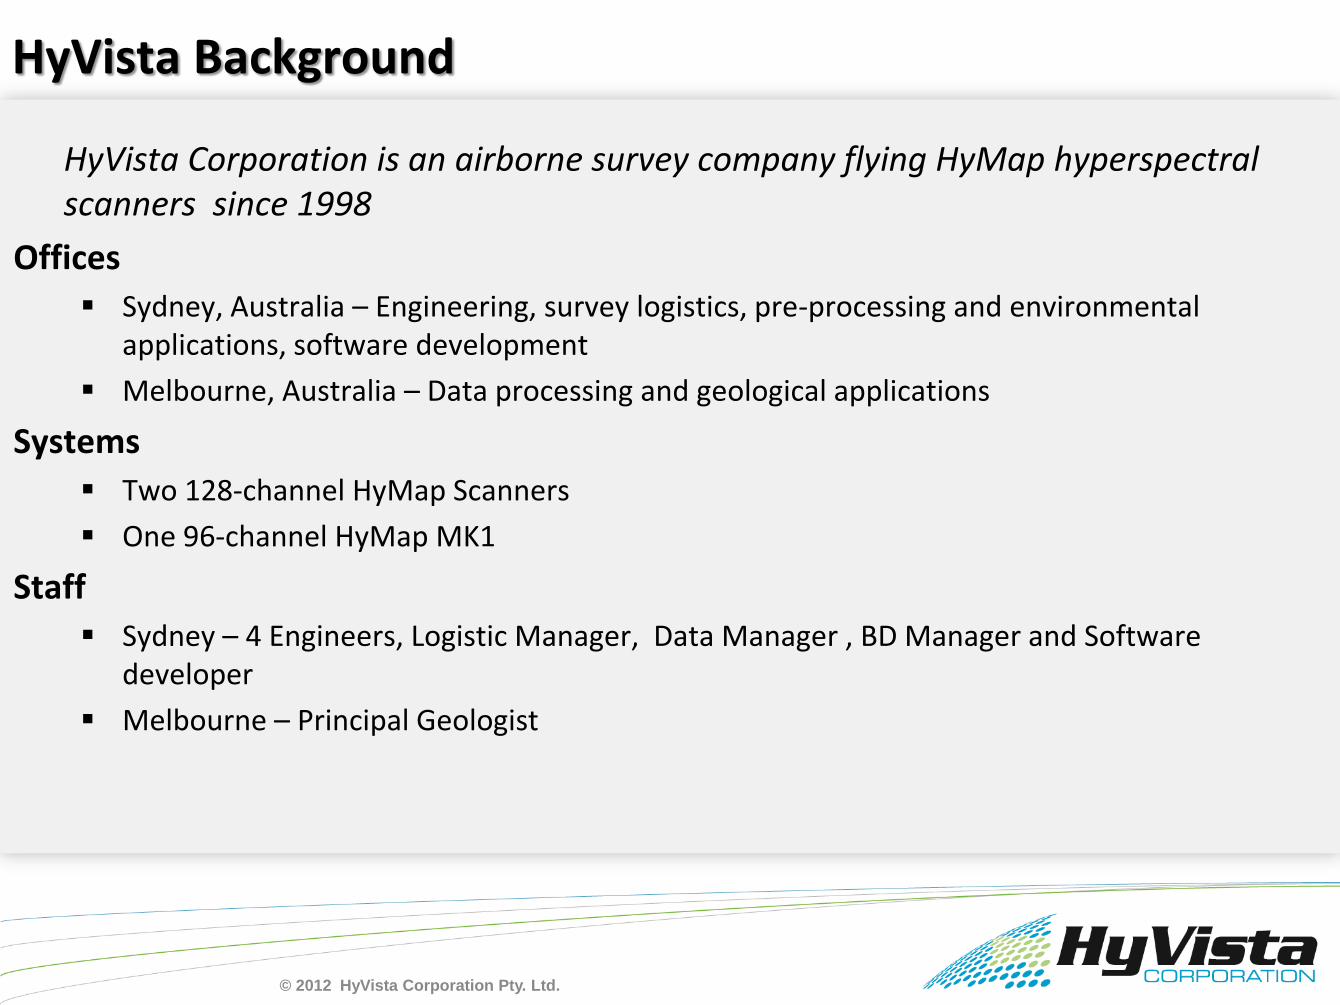
HyVista Background
HyVista Corporation is an airborne survey company flying HyMap hyperspectral scanners since 1998
Offices
Sydney, Australia – Engineering, survey logistics, pre-processing and environmental applications, software development
Melbourne, Australia – Data processing and geological applications
Systems
Two 128-channel HyMap Scanners
One 96-channel HyMap MK1
Staff
Sydney – 4 Engineers, Logistic Manager, Data Manager , BD Manager and Software developer
Melbourne – Principal Geologist
© 2012 HyVista Corporation Pty. Ltd.

Spectral Geology
Spectral geology is used to identify minerals
Indicators of primary rock type
Signatures of alteration in mineralised environments
Indicators of weathering regimes and processes
Indicators of mineral chemistry & formation temperature.
Spectral Geology is the fundamental background for interpretation of Remotely Sensed Images
Hyperspectral images map areas that are spectrally unique at the surface
Mineral maps can be produced from hyperspectral images
© 2012 HyVista Corporation Pty. Ltd.

Spectral Geology Concept - Recording Spectra
VNIR SWIR1 SWIR2
© 2012 HyVista Corporation Pty. Ltd.

Spectral Regions Relevant to Geology
Visible and near infrared 400 - 1000 nm (VNIR) Iron oxides and iron bearing minerals (Hematite, Goethite, Jarosite) Rare Earth Minerals Vegetation
Shortwave Infrared 1000 - 2500 nm (SWIR) OH-bearing minerals
Clay Minerals Micas Amphiboles Serpentine, Talc, Chlorites, Epidote
Phosphates Sulfates Carbonates Hydrocarbons
Cellulose (Vegetation) Oils and Waxes (Petroleum and Vegetation) Plastics Methane
© 2012 HyVista Corporation Pty. Ltd.
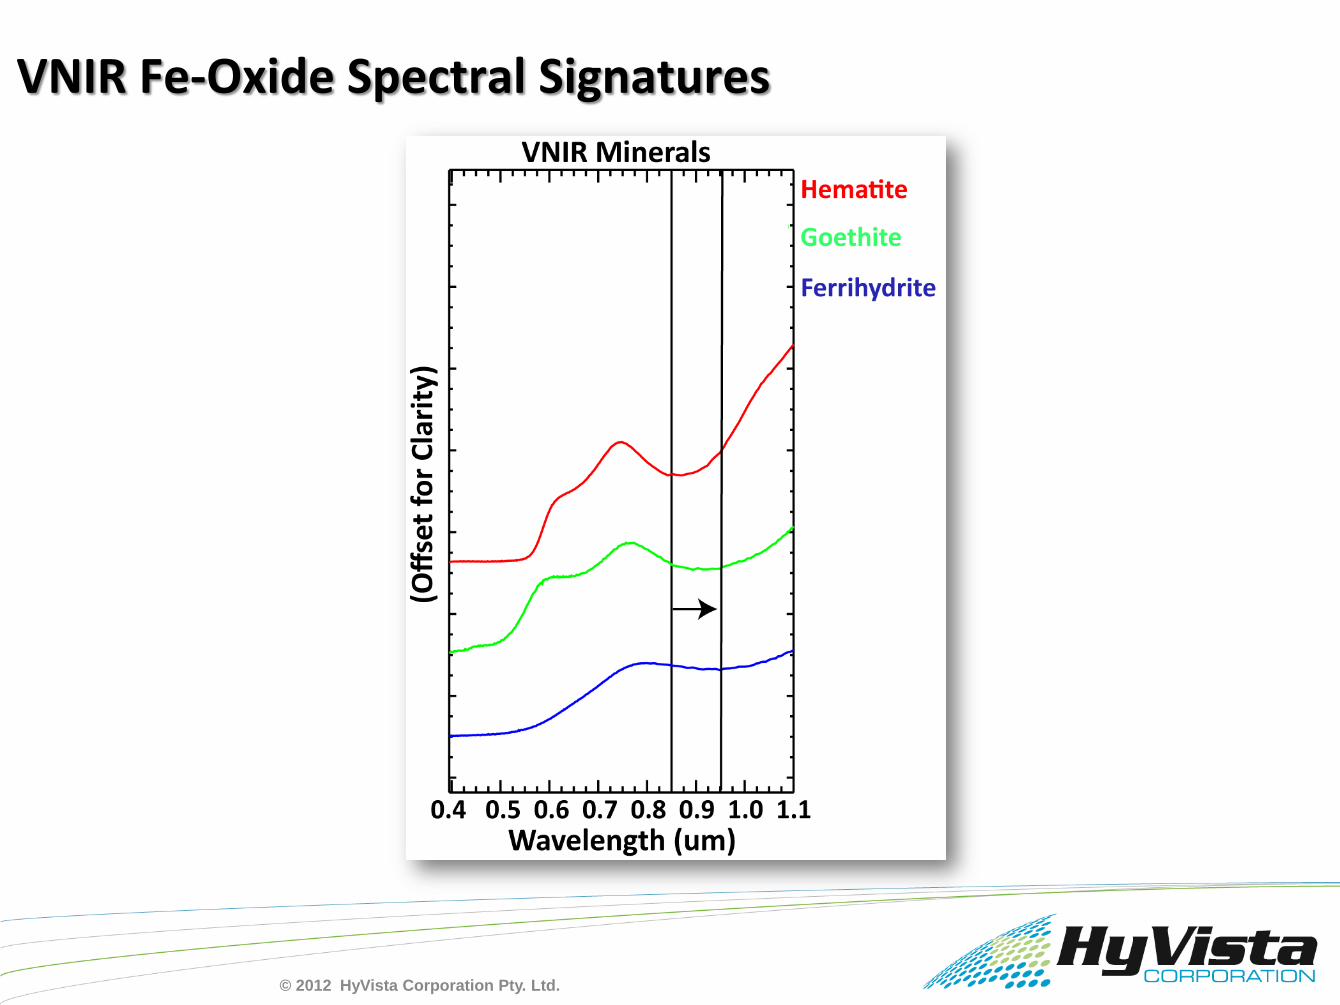
VNIR Fe-Oxide Spectral Signatures
© 2012 HyVista Corporation Pty. Ltd.

Al - OH (2170 - 2210 nm) Pyrophyllite, Kaolinite, Montmorillonite, Muscovite + Illite (White Micas)
Fe – OH (2250 - 2300 nm) Nontronite, Fe Smectite
Mg – OH (2300 - 2400 nm) Chlorite, Talc, Epidote, Amphiboles, Serpentines, Phlogopite, Saponite, Vermiculite
Si – OH (2240 nm -broad) Opaline Silica, Hemimorphite (Zn silicate)
Carbonates (2310nm-2340nm) Calcite, Dolomite, Magnesite, Siderite, Sauconite (Ferroan species show broad absorption
< 1000 nm)
Sulphates (1700nm and 2160nm) Jarosite, Alunite, Gypsum, Anhydrite
SWIR Minerals
© 2012 HyVista Corporation Pty. Ltd.
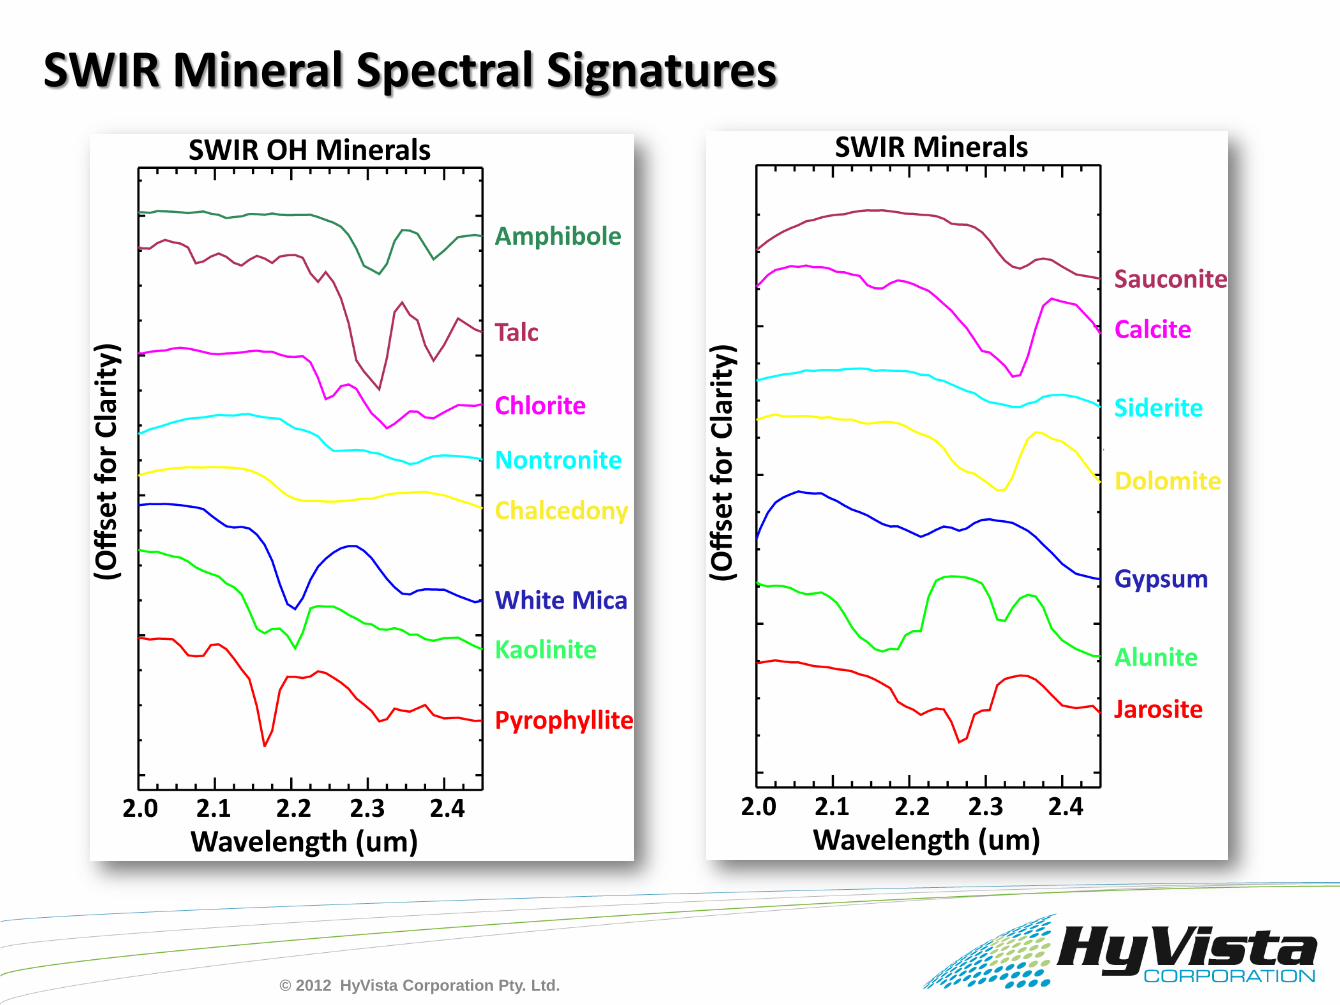
SWIR Mineral Spectral Signatures
© 2012 HyVista Corporation Pty. Ltd.

Hyperspectral and Multispectral DifferencesHyperspectral imaging is part of a class of techniques commonly referred to as spectral
imaging or spectral analysis. Hyperspectral imaging is related to multispectral imaging. The
distinction between hyper- and multi-spectral is sometimes based on an arbitrary "number of bands"
or on the type of measurement, depending on what is appropriate to the purpose.
ASTER MINERAL MAP HyMap MINERAL MAP
Why Hyperspectral?
© 2012 HyVista Corporation Pty. Ltd.

Hyperspectral Imaging – Spectrometry From The Air
© 2012 HyVista Corporation Pty. Ltd.

HyMap Imaging System Aircraft Mounting & SpecificationsSPECIFICATIONS
IFOV: 2.5 Mr Along Track, 2.0 Mr Across Track
FOV: 61.3o (512 Pixels)
GIFOV: 3m-15m (Flying Heights 2,000m-7,000m)
Spectral Bands: 128
Band Width: ~14nm-17nm
•VNIR: ~400-1000nm
•SWIR: ~1000-1400nm
•Swir1:~1400-1995nm
•Swir2:~2014-2488nm
SNR: > 800:1 ( 50% Reflector At Noon)
Data Collection Rate: 4 Gigabyte/Hour
Daily Cover: 1200km2- 2500km2 (5m - 10m Pixels)
Data Collection +/- 2 Hours Solar Noon
Zeiss Stablised Platform to Minimise Distortions
Geometric Correction:
+/- 10m ( IMU/GPS)
The system is flown in a light aircraft at 1750m to
5,000m A.G.L. And can collect data up to 2200
km2 per survey day.
© 2012 HyVista Corporation Pty. Ltd.

HyMap Hyperspectral Scanner – Optimal Survey Conditions
Sun angle >40o
Less than 25% cloud cover
Dry surface
>30% Bare ground
No No No
Yes
YesYes
Yes
© 2012 HyVista Corporation Pty. Ltd.
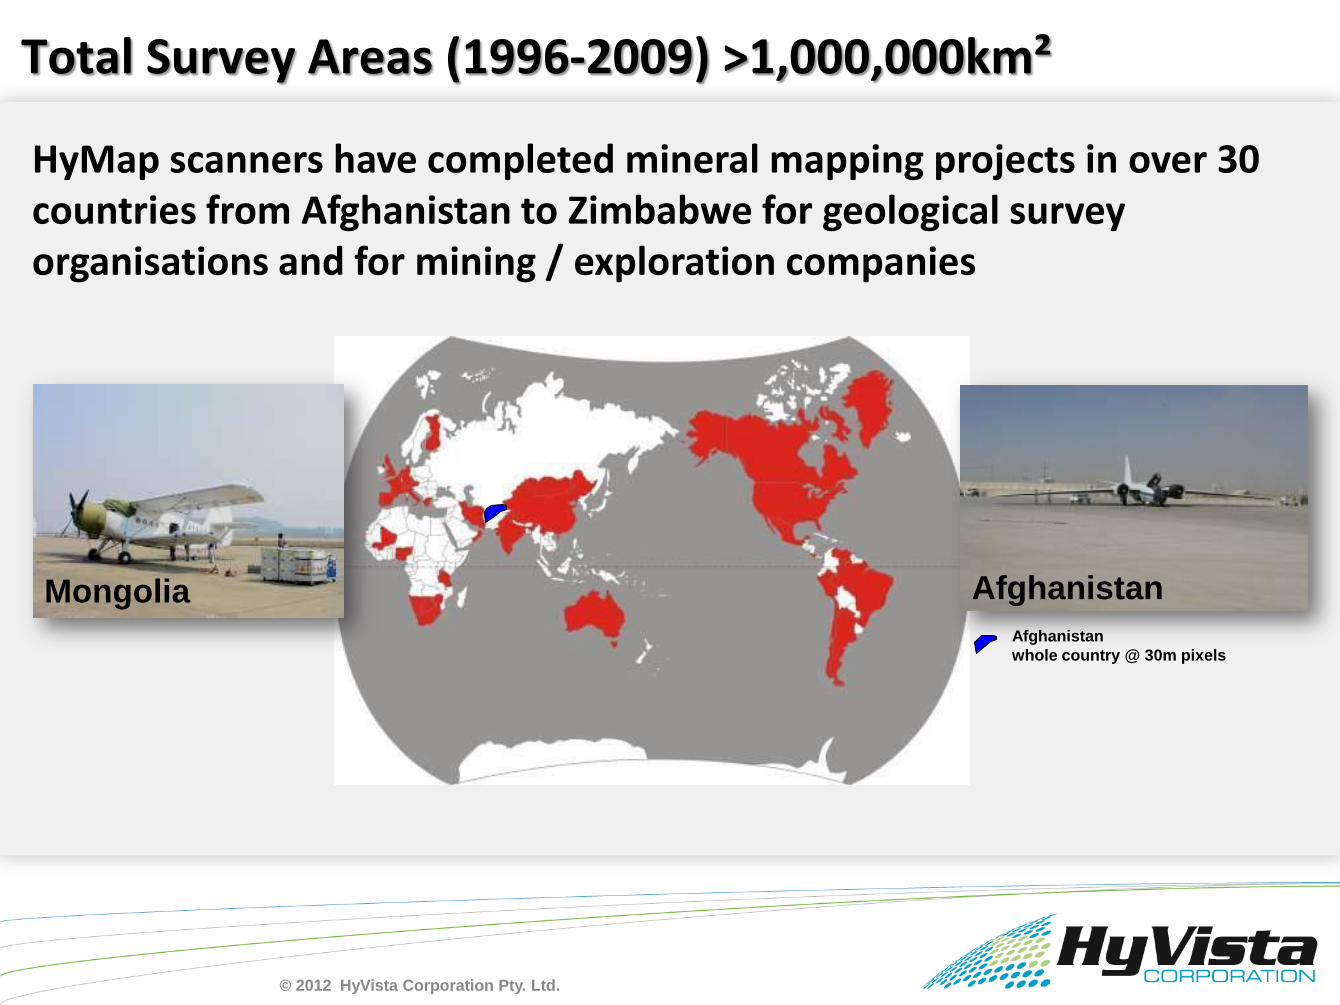
HyMap scanners have completed mineral mapping projects in over 30 countries from Afghanistan to Zimbabwe for geological survey organisations and for mining / exploration companies
Mongolia Afghanistan
Afghanistan
whole country @ 30m pixels
Total Survey Areas (1996-2009) >1,000,000km²
© 2012 HyVista Corporation Pty. Ltd.

Spectral Processing and Mineral Mapping -Converting Reflectance Images Into Mineral Maps
Unsupervised Endmember Unmixing
Identifies specific spectra from within the data and maps
Supervised Spectral Matching (LO, MF,MTMF,SAM)
Maps the distribution of a specified spectrum
Reflectance Images
32 Bands 15 EM
Mineral MapImages
Identified Spectra
© 2012 HyVista Corporation Pty. Ltd.

Processing Flow Chart
DCS CC Carbonate (Red)FeOH (Green)MgOH (Blue)
MNF CCBand 2 (Red)Band 3 (Green)Band 4 (Blue)
Mineral Map CCKaolinite (Red)Paragonite - White Mica (Green)Muscovite - White Mica (Blue)
Overview CCBand 28 (Red)Band 15 (Green)Band 3 (Blue)
Level 1A Mosaic
Level 1B Data Cube
►Pre-processing on a strip by strip basis produces radiance and apparent reflectance Level 1A Mosaic.►Reflectance images are cross track, level corrected and geo-corrected.►Corrected strips are mosaiced into a seamless, homogeneous Level 1B data cube.►The data-cube is processed to produce various band colour composite (CC), minimum noise fraction (MNF), band ratio index images and image maps that highlight mineralogical and geological / chemical variations.
© 2012 HyVista Corporation Pty. Ltd.
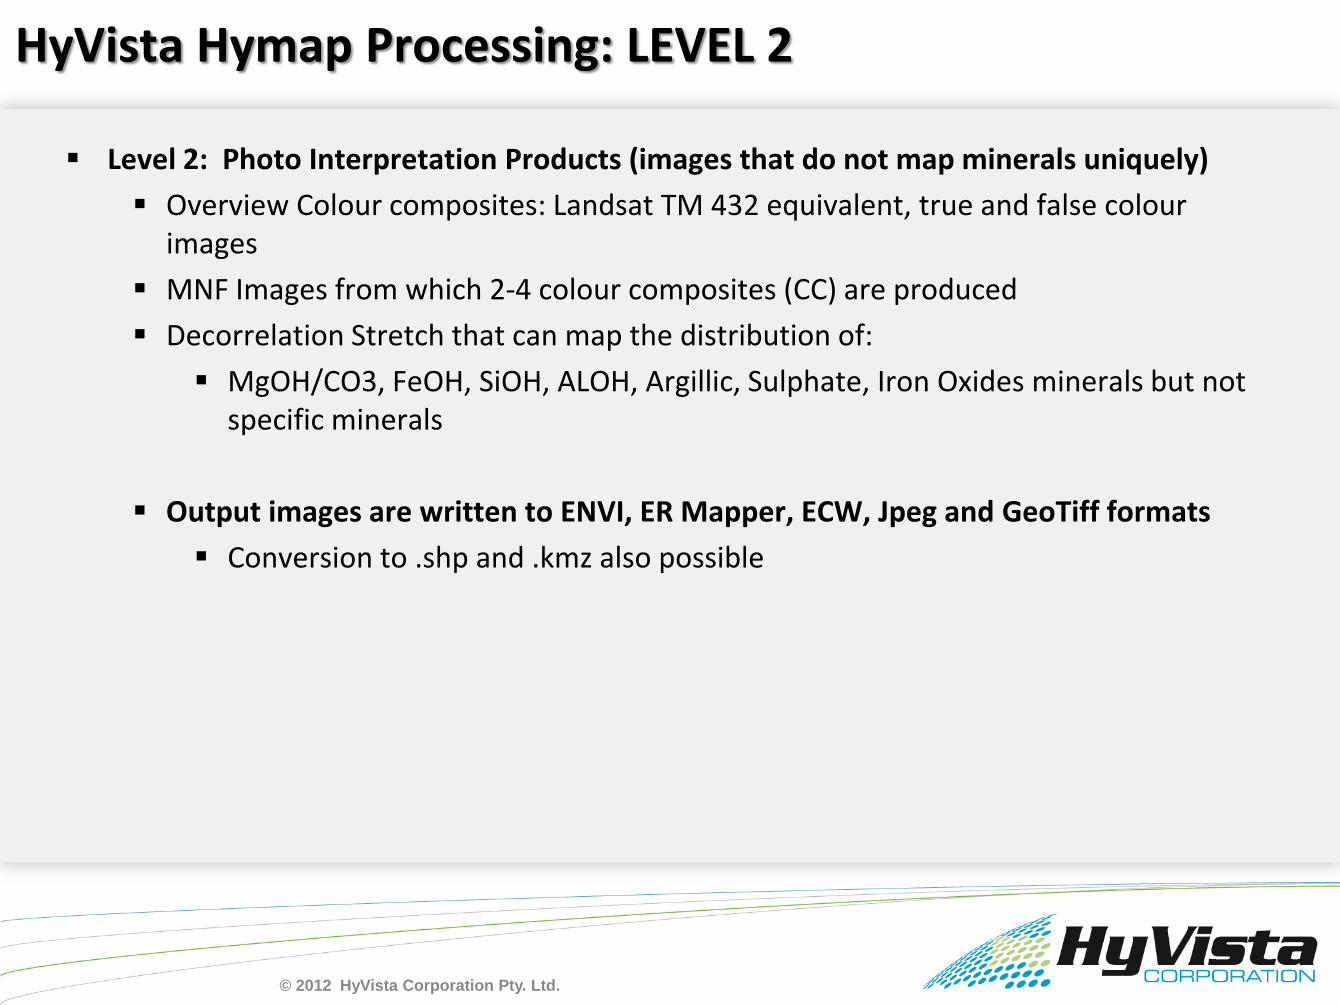
Level 2: Photo Interpretation Products (images that do not map minerals uniquely)
Overview Colour composites: Landsat TM 432 equivalent, true and false colour images
MNF Images from which 2-4 colour composites (CC) are produced
Decorrelation Stretch that can map the distribution of:
MgOH/CO3, FeOH, SiOH, ALOH, Argillic, Sulphate, Iron Oxides minerals but not specific minerals
Output images are written to ENVI, ER Mapper, ECW, Jpeg and GeoTiff formats
Conversion to .shp and .kmz also possible
HyVista Hymap Processing: LEVEL 2
© 2012 HyVista Corporation Pty. Ltd.

Overview Colour Composite
RGB 108, 28,03
MNF Colour Composite
RGB 2,3,4
Mount Whale Back Iron Ore Mine, Hamersley Region, Western Australia (3.5m Pixel Resolution)
HyVista Hymap Processing: LEVEL 2
© 2012 HyVista Corporation Pty. Ltd.
Decorrelation Composite
RGB 0.9um, 0.87um 2.32um
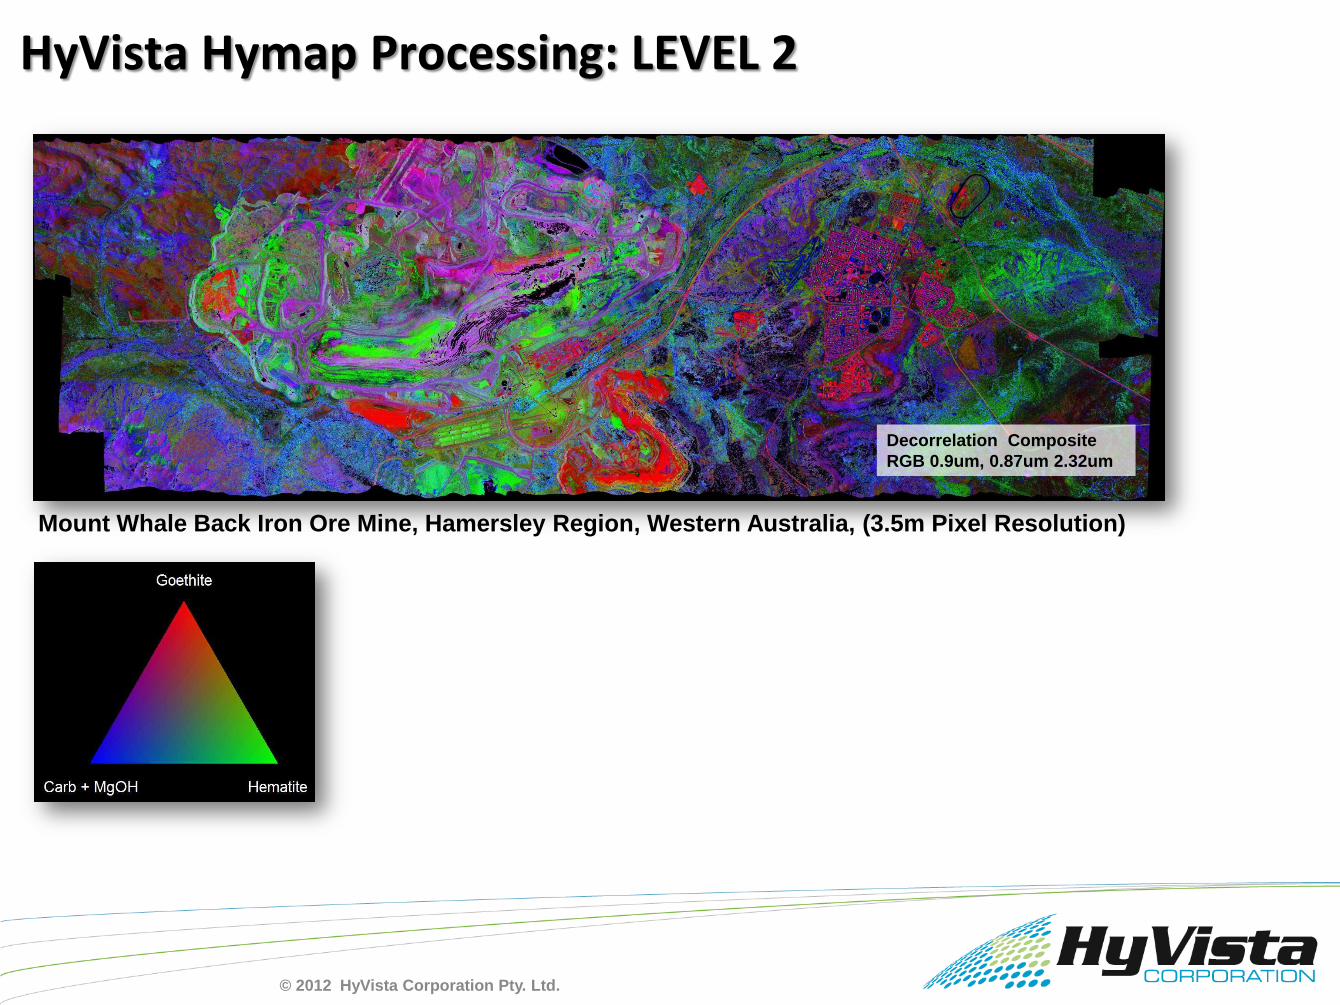
HyVista Hymap Processing: LEVEL 2
Mount Whale Back Iron Ore Mine, Hamersley Region, Western Australia, (3.5m Pixel Resolution)
© 2012 HyVista Corporation Pty. Ltd.
Decorrelation Composite
RGB 0.9um, 0.87um 2.32um
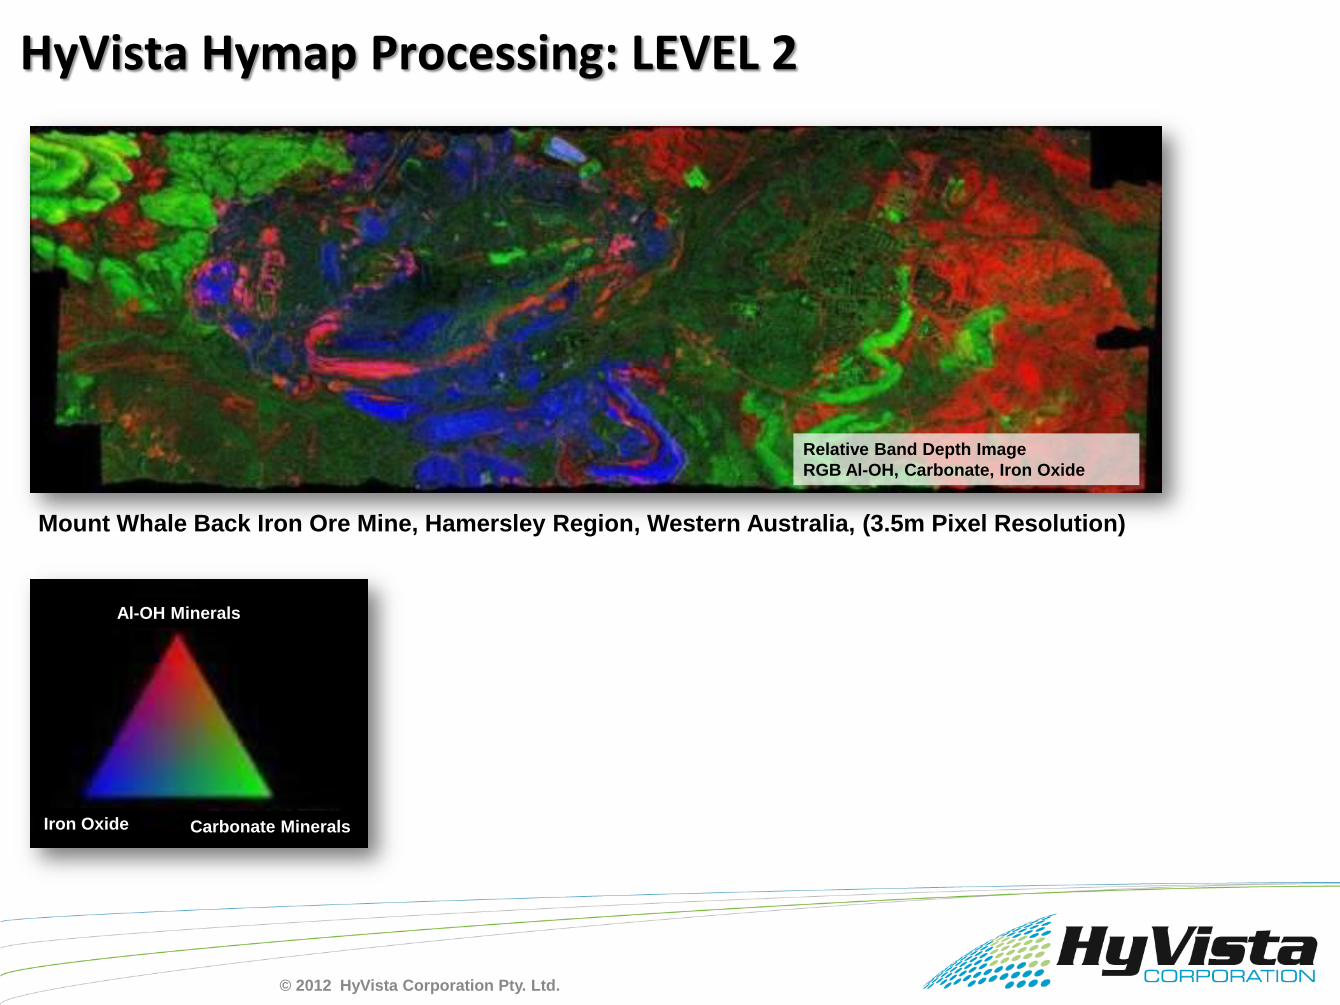
HyVista Hymap Processing: LEVEL 2
Mount Whale Back Iron Ore Mine, Hamersley Region, Western Australia, (3.5m Pixel Resolution)
Relative Band Depth Image
RGB Al-OH, Carbonate, Iron Oxide
Al-OH Minerals
Iron Oxide Carbonate Minerals
© 2012 HyVista Corporation Pty. Ltd.
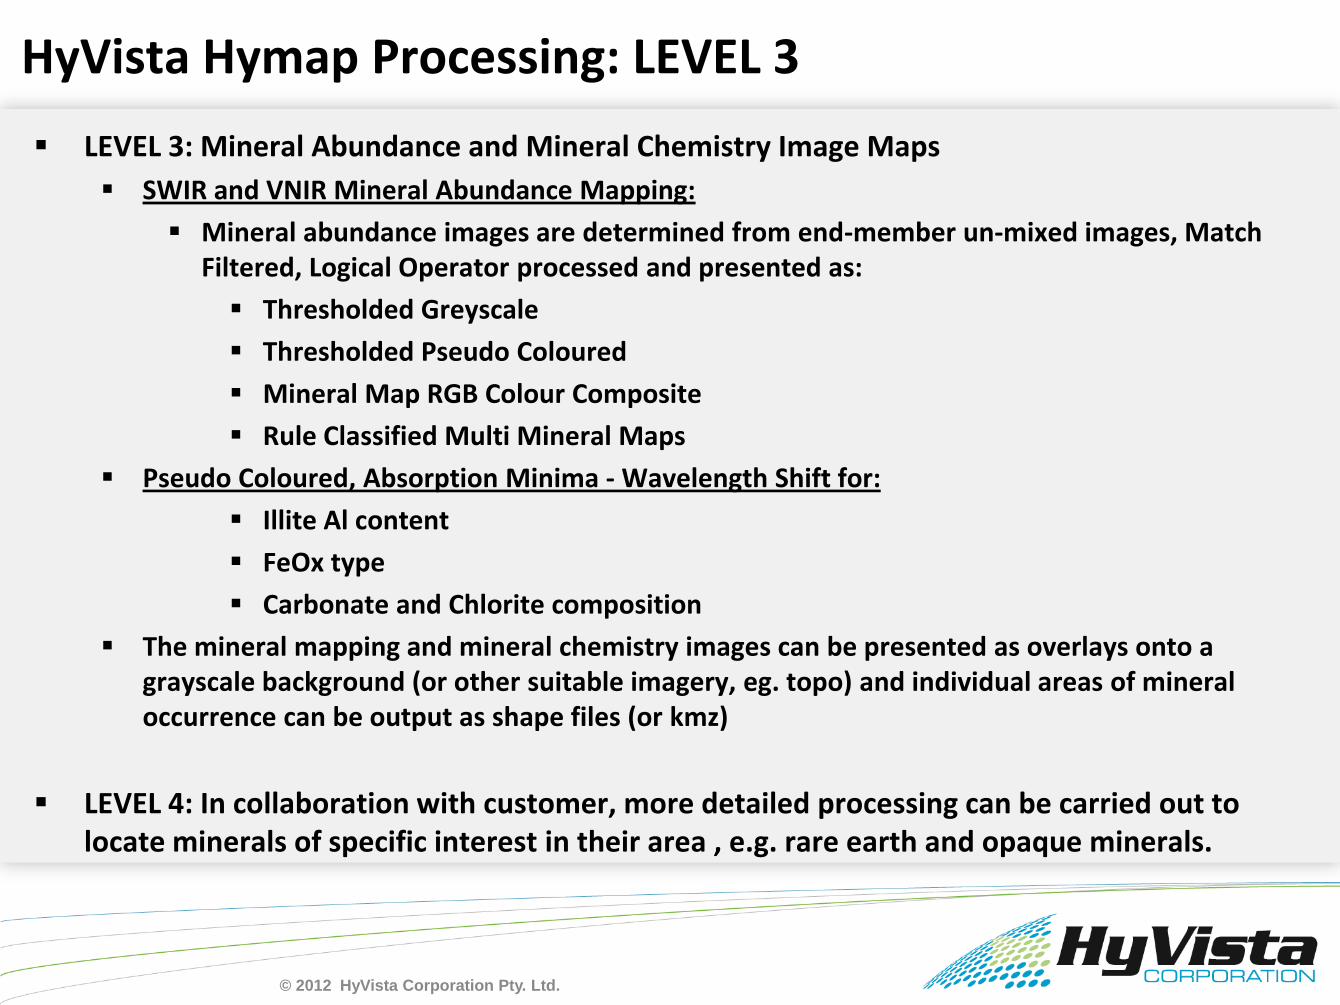
LEVEL 3: Mineral Abundance and Mineral Chemistry Image Maps
SWIR and VNIR Mineral Abundance Mapping:
Mineral abundance images are determined from end-member un-mixed images, Match Filtered, Logical Operator processed and presented as:
Thresholded Greyscale
Thresholded Pseudo Coloured
Mineral Map RGB Colour Composite
Rule Classified Multi Mineral Maps
Pseudo Coloured, Absorption Minima - Wavelength Shift for:
Illite Al content
FeOx type
Carbonate and Chlorite composition
The mineral mapping and mineral chemistry images can be presented as overlays onto a grayscale background (or other suitable imagery, eg. topo) and individual areas of mineral occurrence can be output as shape files (or kmz)
LEVEL 4: In collaboration with customer, more detailed processing can be carried out to locate minerals of specific interest in their area , e.g. rare earth and opaque minerals.
HyVista Hymap Processing: LEVEL 3
© 2012 HyVista Corporation Pty. Ltd.

Mount Whale Back Iron Ore Mine, Hamersley Region, Western Australia, (3.5m Pixel Resolution)
Greyscale Mineral Abundance Map
Goethite Threshold 90%
Pseudo Colour Mineral Abundance Map
Goethite Threshold 90%
HyVista Hymap Processing: LEVEL 3 Products
© 2012 HyVista Corporation Pty. Ltd.

Mineral Map Colour Composite
RGB Goethite, Hematite, Chlorite
Rule Classified Mineral Map
HyVista Hymap Processing: LEVEL 3 Products
Mount Whale Back Iron Ore Mine, Hamersley Region, Western Australia, (3.5m Pixel Resolution)
© 2012 HyVista Corporation Pty. Ltd.
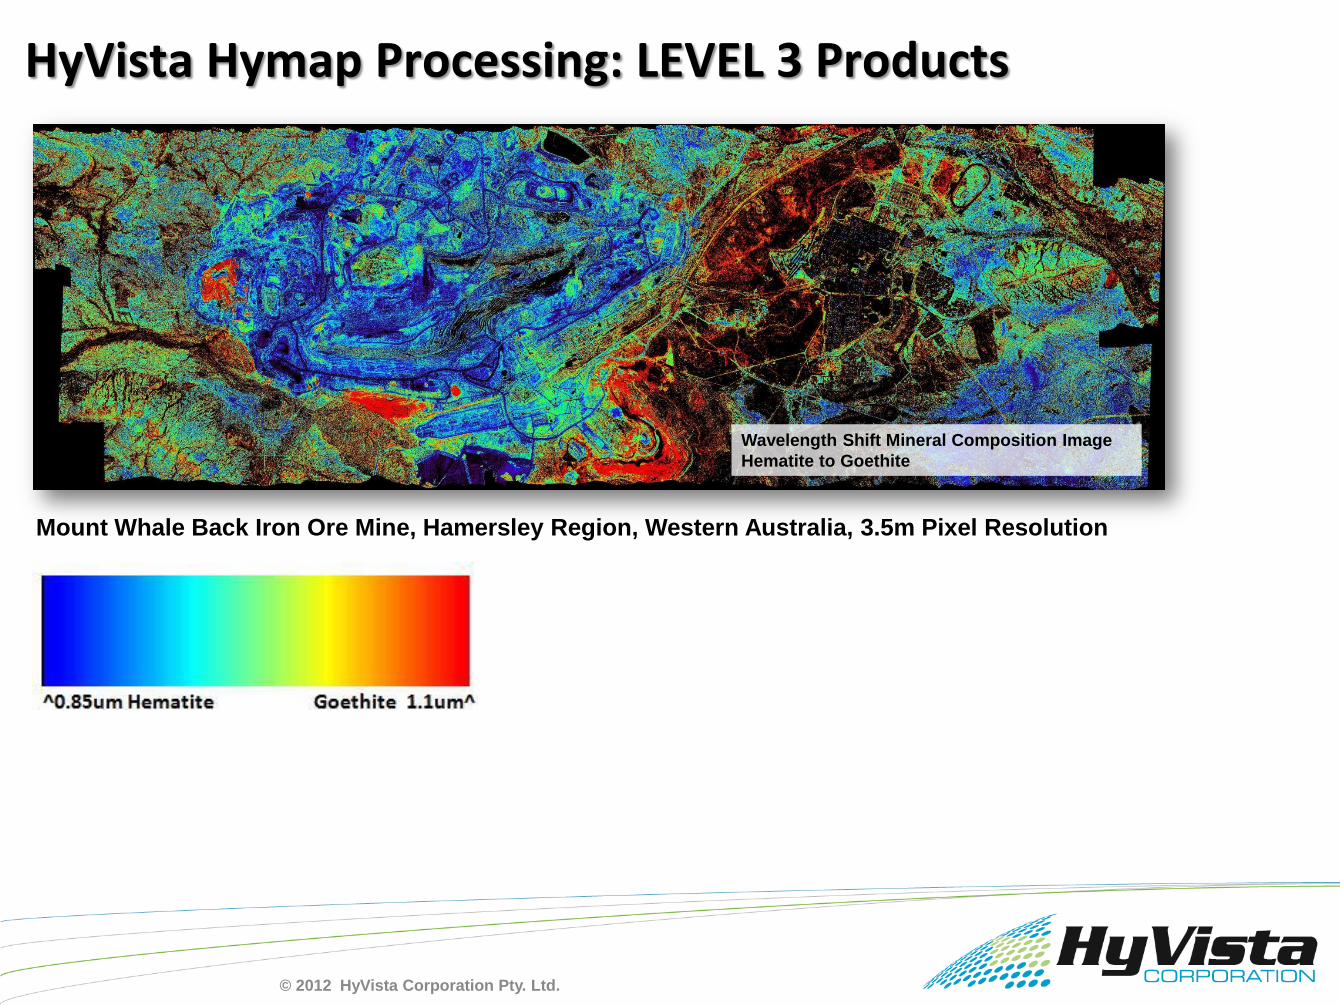
Wavelength Shift Mineral Composition Image
Hematite to Goethite
HyVista Hymap Processing: LEVEL 3 Products
Mount Whale Back Iron Ore Mine, Hamersley Region, Western Australia, 3.5m Pixel Resolution
© 2012 HyVista Corporation Pty. Ltd.

HyVista HyMap Test Site Surveys: Porphyry and other Alteration System Deposits
USA
OATMAN (ARIZONA)
YERINGTON (NEVADA)
MEXICO
NW MEXICO SILVER-GOLD BELT
NAMIBIA
HAIB PROTEROZOIC Cu/Au PORPHYRY
AUSTRALIA
HALLS CREEK MOBILE BELT ARGILLIC ALTERATION
NULLAGINE
© 2012 HyVista Corporation Pty. Ltd.

HYVISTA HYMAP SURVEY TEST SITE SURVEYS: Au OATMAN
Oatman Survey, Arizona, USA. HyMap Imagery, 5m pixels, Acquired 2003
Geology: Lies at the centre of a trachyte, latite, rhyolite fault-bounded, typical Basin and Range Tertiary volcanic complex.
Mineralisation: Epithermal vein deposit centred upon advanced argillic / argillic style hydrothermal alteration and radiating auriferous qtz-calcite±adularia veins. Ore deposited in dilatational zones as vein filling and complex stockworks.
Mineral Mapping: Identifying and mapping the minerals that characterise the alteration associated with the mineral occurrences at Oatman using HyMap imagery and comparison with results from ASTER Imagery.
© 2012 HyVista Corporation Pty. Ltd.

EPITHERMAL GOLD Oatman Arizona
Colour Composite Ternary RGB Mineral Map Rule Class Mineral Map
© 2012 HyVista Corporation Pty. Ltd.

Epithermal Gold Oatman Arizona: ASTER vs. HyMap
*Processed by M Brown
mappa mundi / Infoterra Ltd,
United Kingdom
GSRG Conference 2008
Mineral Mapping at Oatman, using
ASTER and HyMap
ASTER Mineral Map HyMap Mineral Map
© 2012 HyVista Corporation Pty. Ltd.

HyVista HyMap Test Survey Sites: Porphyry System –Yerington, NV, USA
Yerington Survey, Nevada, USA. HyMap Imagery, 3.5m pixels, Acquired August 2009
© 2012 HyVista Corporation Pty. Ltd.
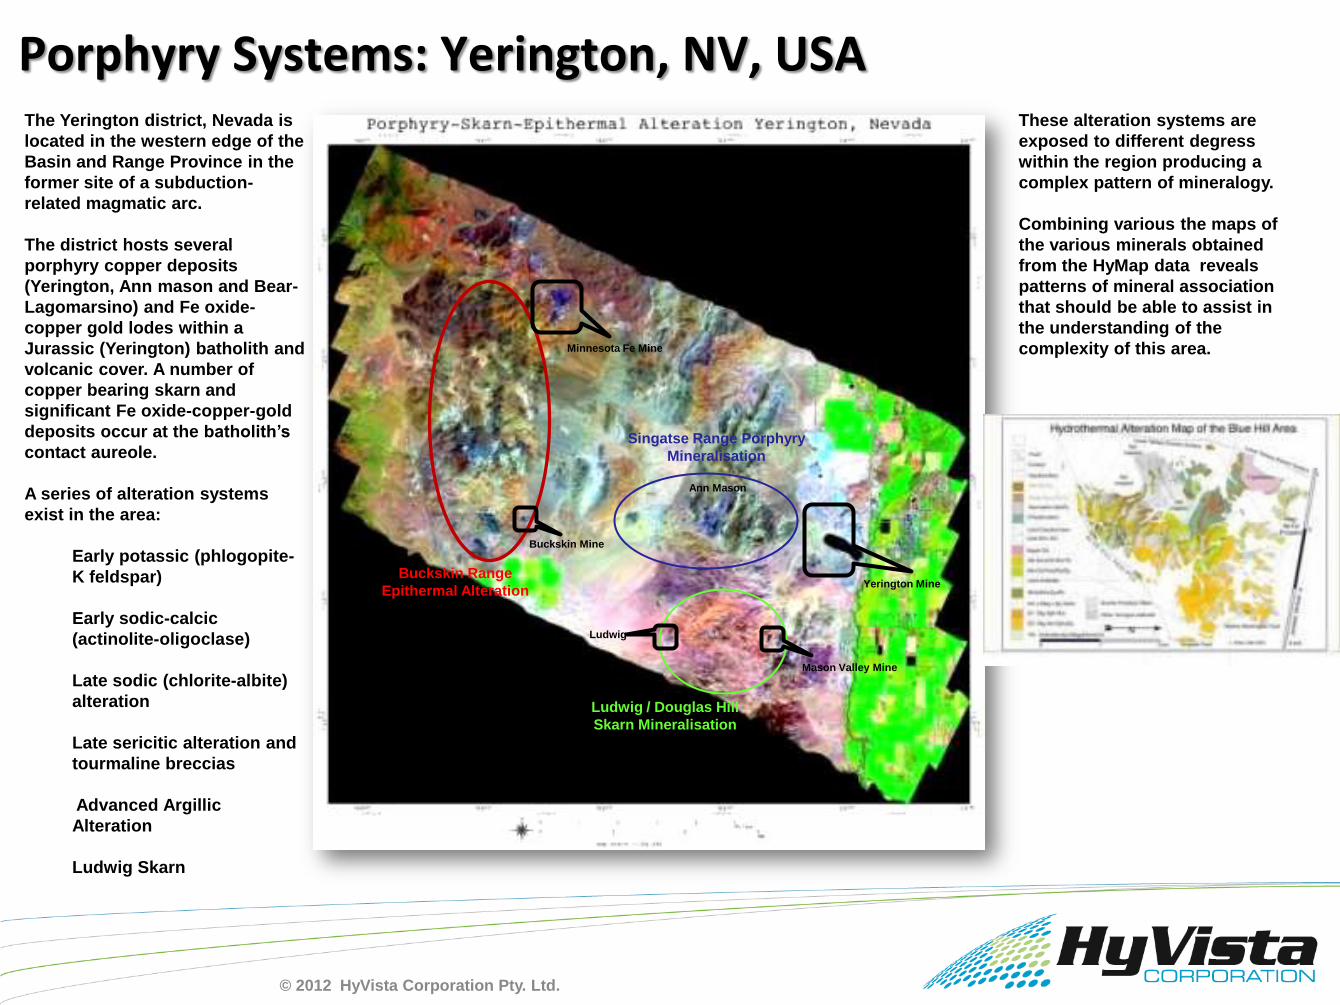
Porphyry Systems: Yerington, NV, USA
Buckskin Range
Epithermal Alteration
Singatse Range Porphyry
Mineralisation
Ludwig / Douglas Hill
Skarn Mineralisation
Ann Mason
Minnesota Fe Mine
Buckskin Mine
Ludwig
Mason Valley Mine
Yerington Mine
The Yerington district, Nevada is
located in the western edge of the
Basin and Range Province in the
former site of a subduction-
related magmatic arc.
The district hosts several
porphyry copper deposits
(Yerington, Ann mason and Bear-
Lagomarsino) and Fe oxide-
copper gold lodes within a
Jurassic (Yerington) batholith and
volcanic cover. A number of
copper bearing skarn and
significant Fe oxide-copper-gold
deposits occur at the batholith’s
contact aureole.
A series of alteration systems
exist in the area:
Early potassic (phlogopite-
K feldspar)
Early sodic-calcic
(actinolite-oligoclase)
Late sodic (chlorite-albite)
alteration
Late sericitic alteration and
tourmaline breccias
Advanced Argillic
Alteration
Ludwig Skarn
These alteration systems are
exposed to different degress
within the region producing a
complex pattern of mineralogy.
Combining various the maps of
the various minerals obtained
from the HyMap data reveals
patterns of mineral association
that should be able to assist in
the understanding of the
complexity of this area.
© 2012 HyVista Corporation Pty. Ltd.

Minimum Noise Fraction (MNF) transform hasbeen applied to the HyMap reflectance data(vegetation and shadow masked). From thesetransform images, colour composites havebeen produced.
The bands selected (1, 2 and 3) highlight thebleached epithermal altered terrain (light blue)along the Buckskin Range. Dumps associatedwith the Yerington mine are depicted in lightgreen hues. Similar hues are observed in theSingatse Range. Darker green hues appear tohighlight skarn terrain.
MNF COLOUR COMPOSITE
Porphyry Systems: Yerington, NV, USA
© 2012 HyVista Corporation Pty. Ltd.

Amphibole is probably Actinolite and highlights sediments / volcanics hosting skarn style mineralisation in the Ludwig / Douglas hill / Mason Valley area.
Highlights sediments / volcanics hosting skarn style mineralisation in the Ludwig / Douglas hill / Mason Valley area, southern margin of the Yerington batholith.
Mineral Map Colour Composite Mineral Map Colour Composite
Porphyry Systems: Yerington, NV, USA
© 2012 HyVista Corporation Pty. Ltd.

Porphyry Systems: Yerington, NV, USA
Mineral Map Colour Composite
Longer wave Illite relatively widely distributed in the area and possibly related to sericite and / or sodic overprints. Shorter wave Illite appears to favour lower pH environments along the Buckskin Range; flanks advanced argillic alteration. Kaolinite highlights alteration in the Buckskin Range.
Mineral Map Colour Composite
Illite 2190nm
Illite
Kaolinite 2
Advanced argillic alteration minerals highlight alteration in the Buckskin Range
© 2012 HyVista Corporation Pty. Ltd.
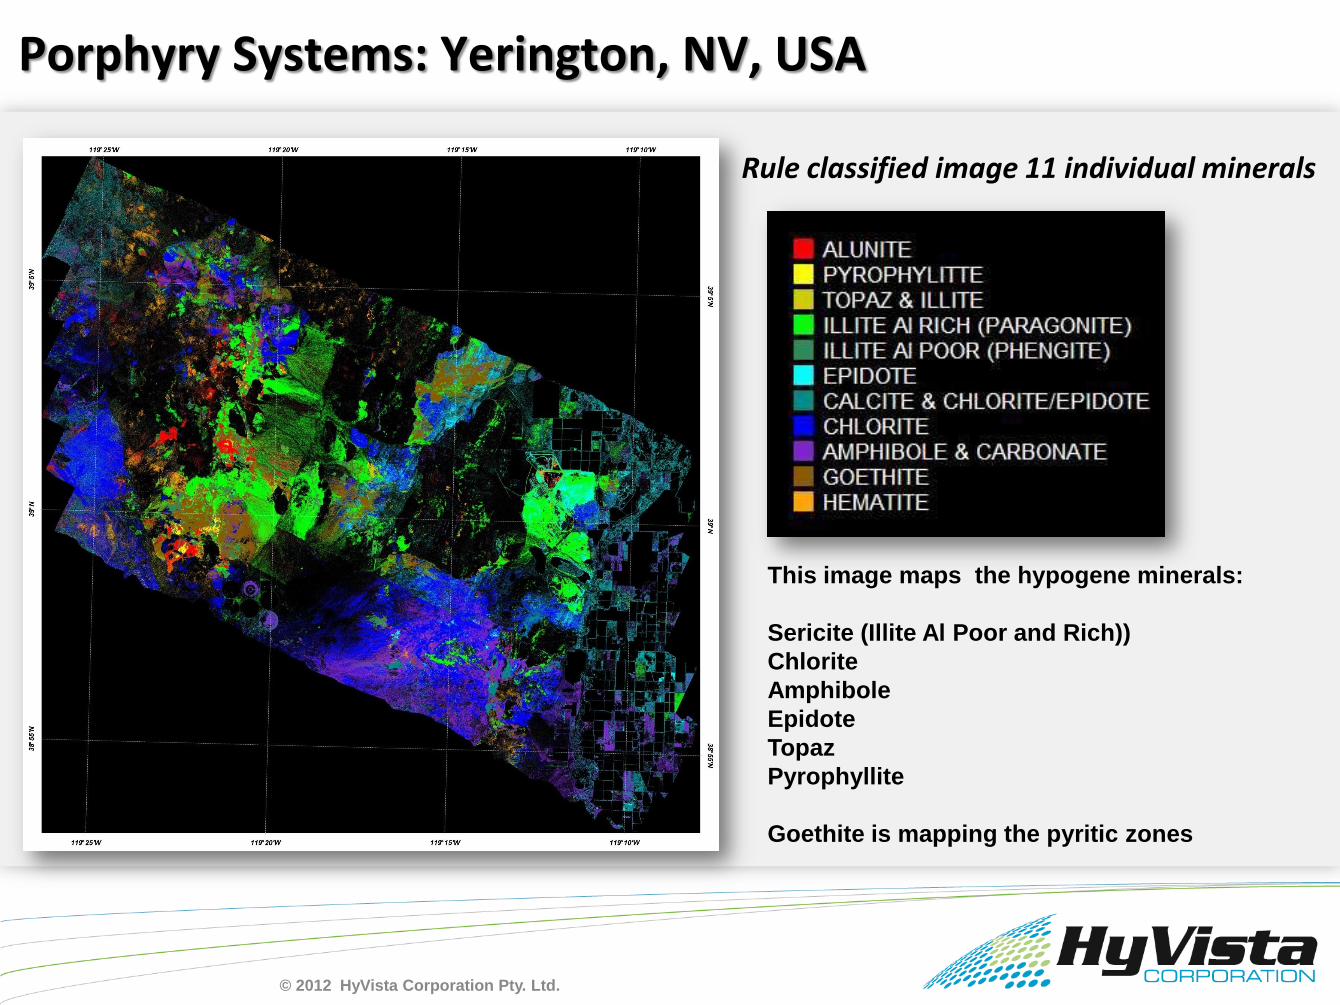
Rule classified image 11 individual minerals
This image maps the hypogene minerals:
Sericite (Illite Al Poor and Rich))
Chlorite
Amphibole
Epidote
Topaz
Pyrophyllite
Goethite is mapping the pyritic zones
Porphyry Systems: Yerington, NV, USA
© 2012 HyVista Corporation Pty. Ltd.

Epithermal Gold and Silver Exploration, Mexico
RADADERO
TONICHI
Surveys flown May 2007; pixel size of ~5m
© 2012 HyVista Corporation Pty. Ltd.
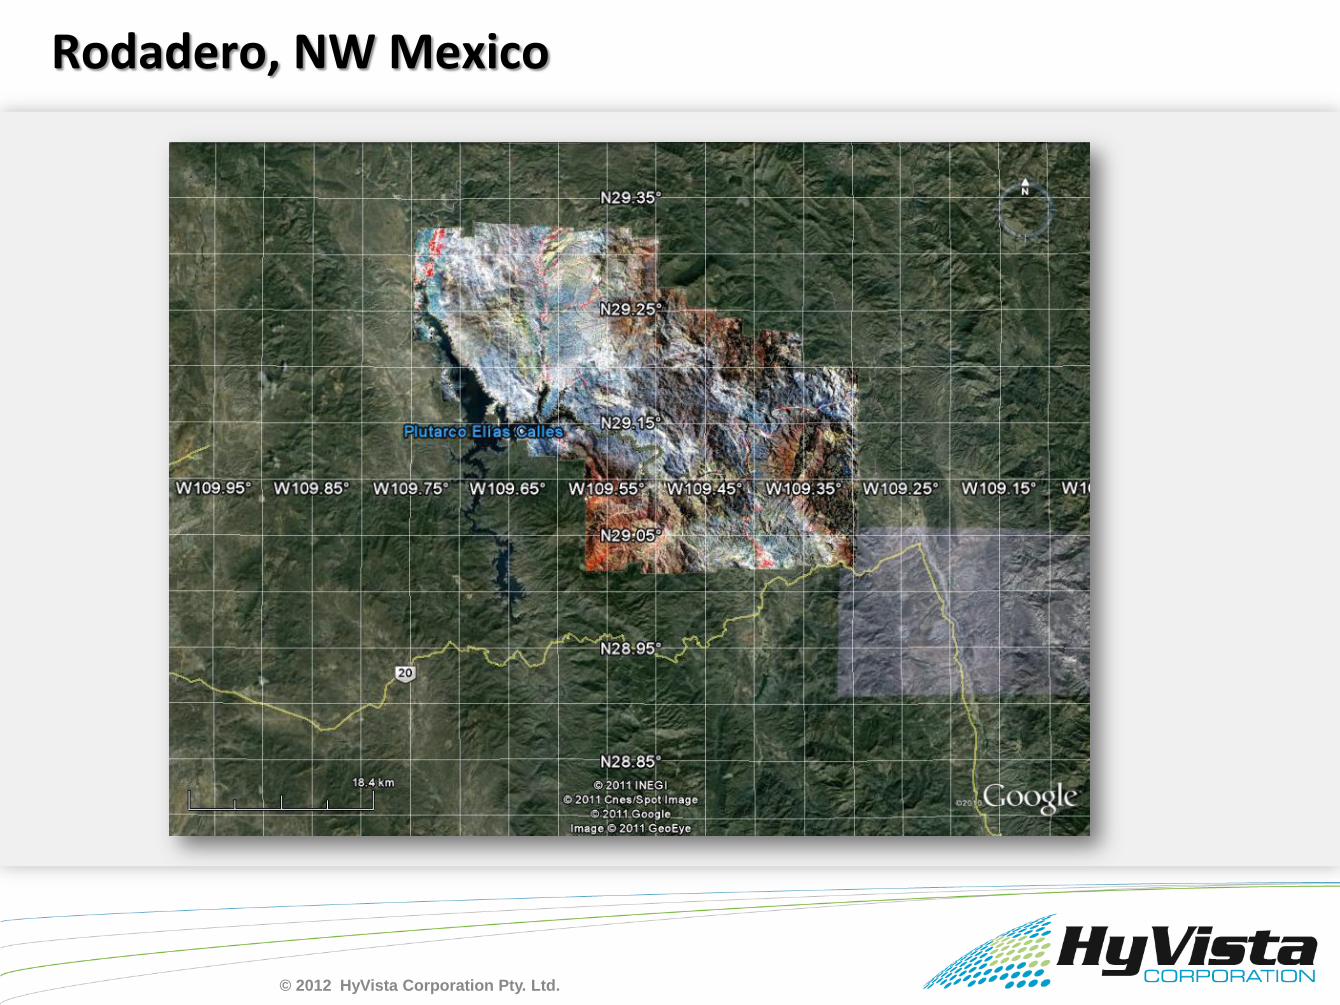
Rodadero, NW Mexico
© 2012 HyVista Corporation Pty. Ltd.
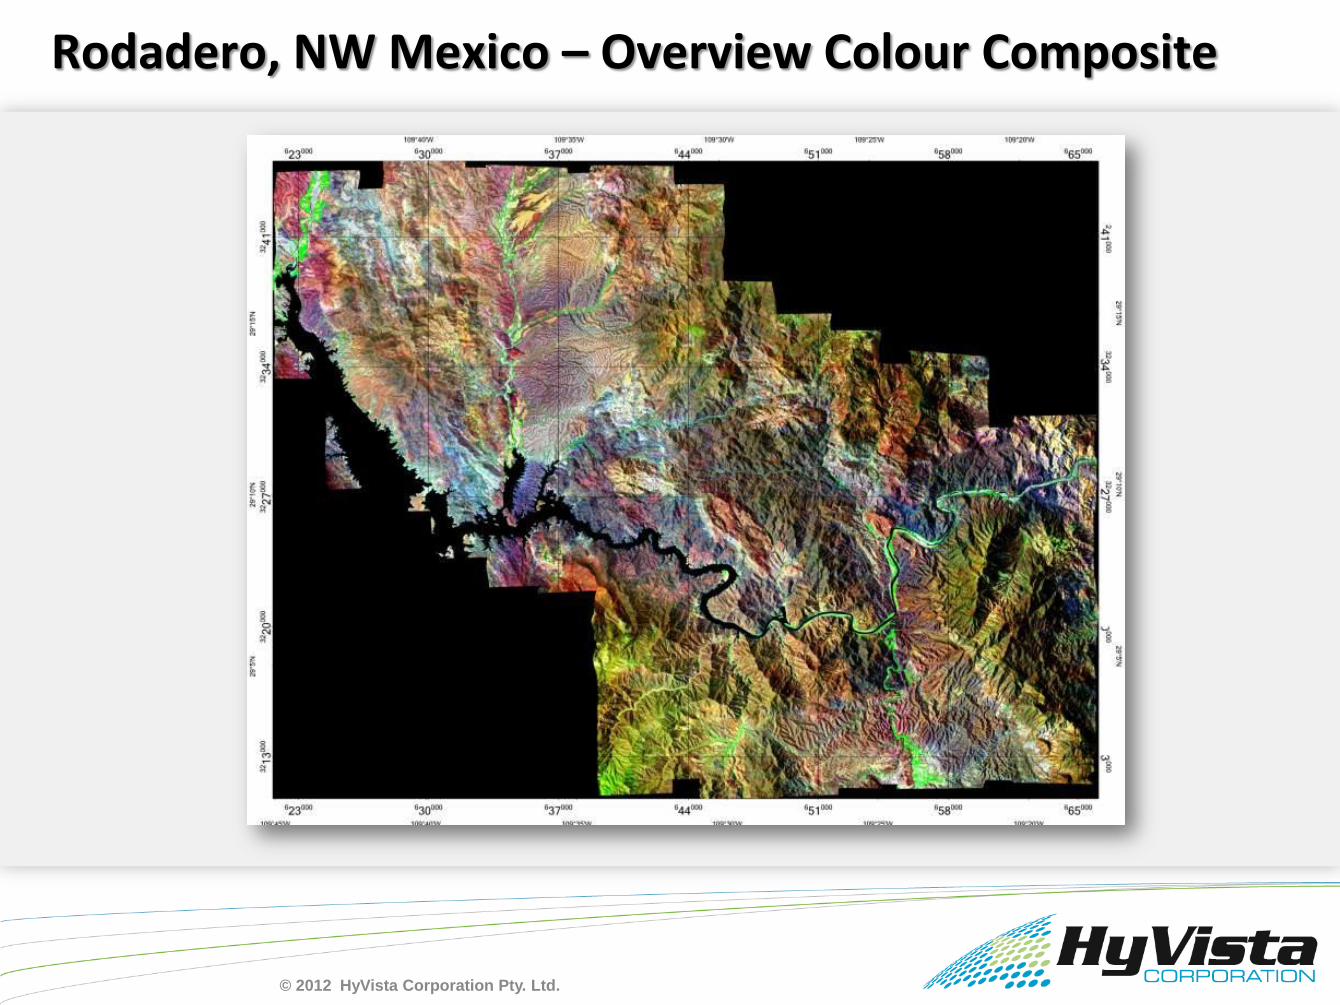
Rodadero, NW Mexico – Overview Colour Composite
© 2012 HyVista Corporation Pty. Ltd.

DCS RGB Band 108 (Al-OH), Band 114 (Mg-OH and Carbonate), Band 30 (Fe Oxide)
Maps general distribution of main mineral classes in area
Rodadero Processing – Decorrelation Stretch Image
© 2012 HyVista Corporation Pty. Ltd.
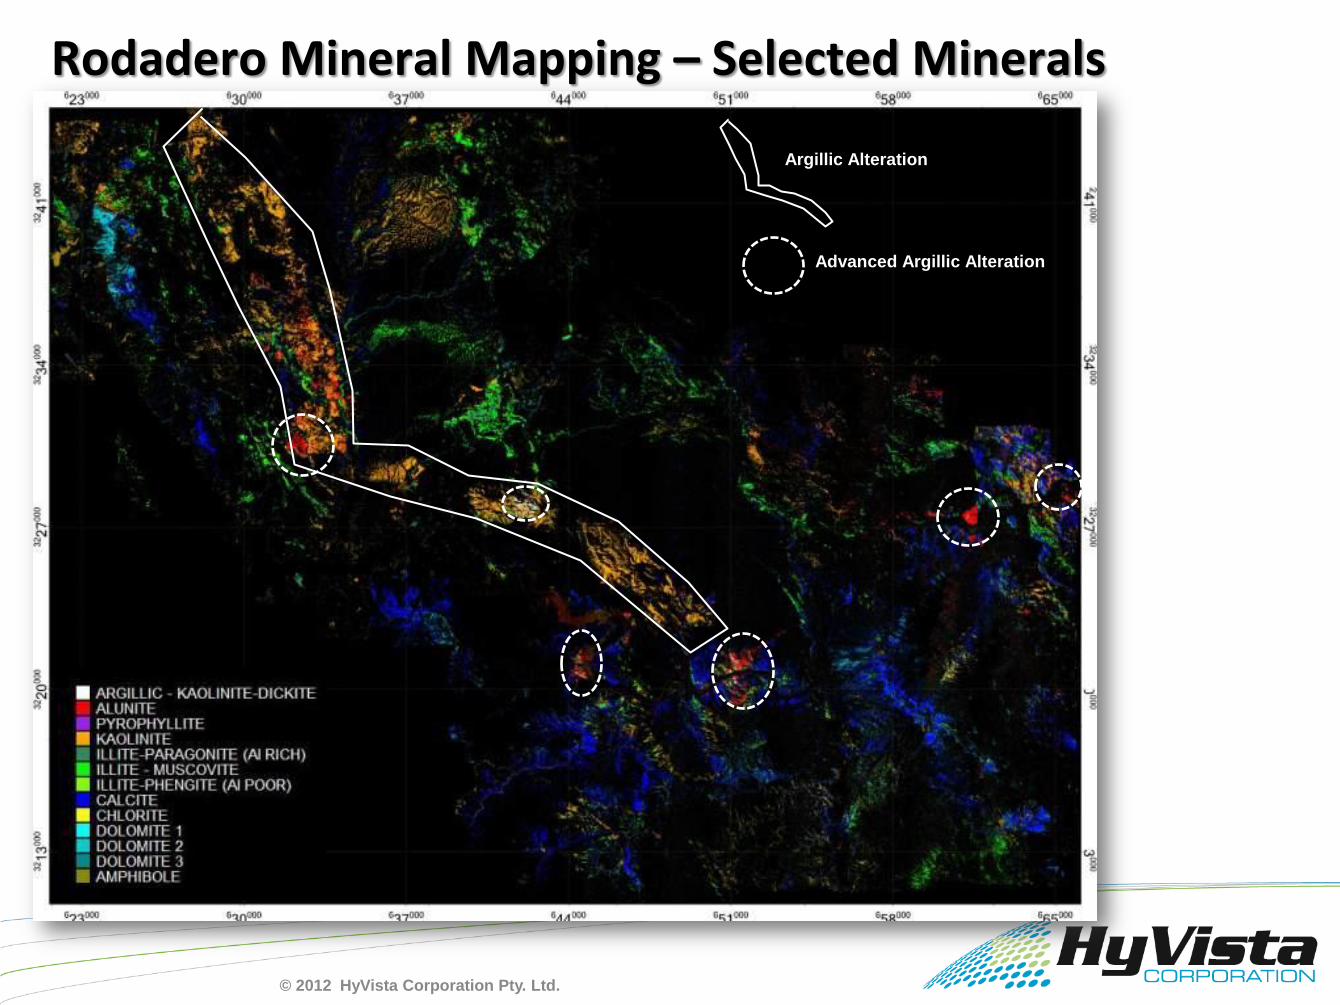
Argillic Alteration
Advanced Argillic Alteration
Rodadero Mineral Mapping – Selected Minerals
© 2012 HyVista Corporation Pty. Ltd.

Rodadero Processing – Mineral Map
© 2012 HyVista Corporation Pty. Ltd.
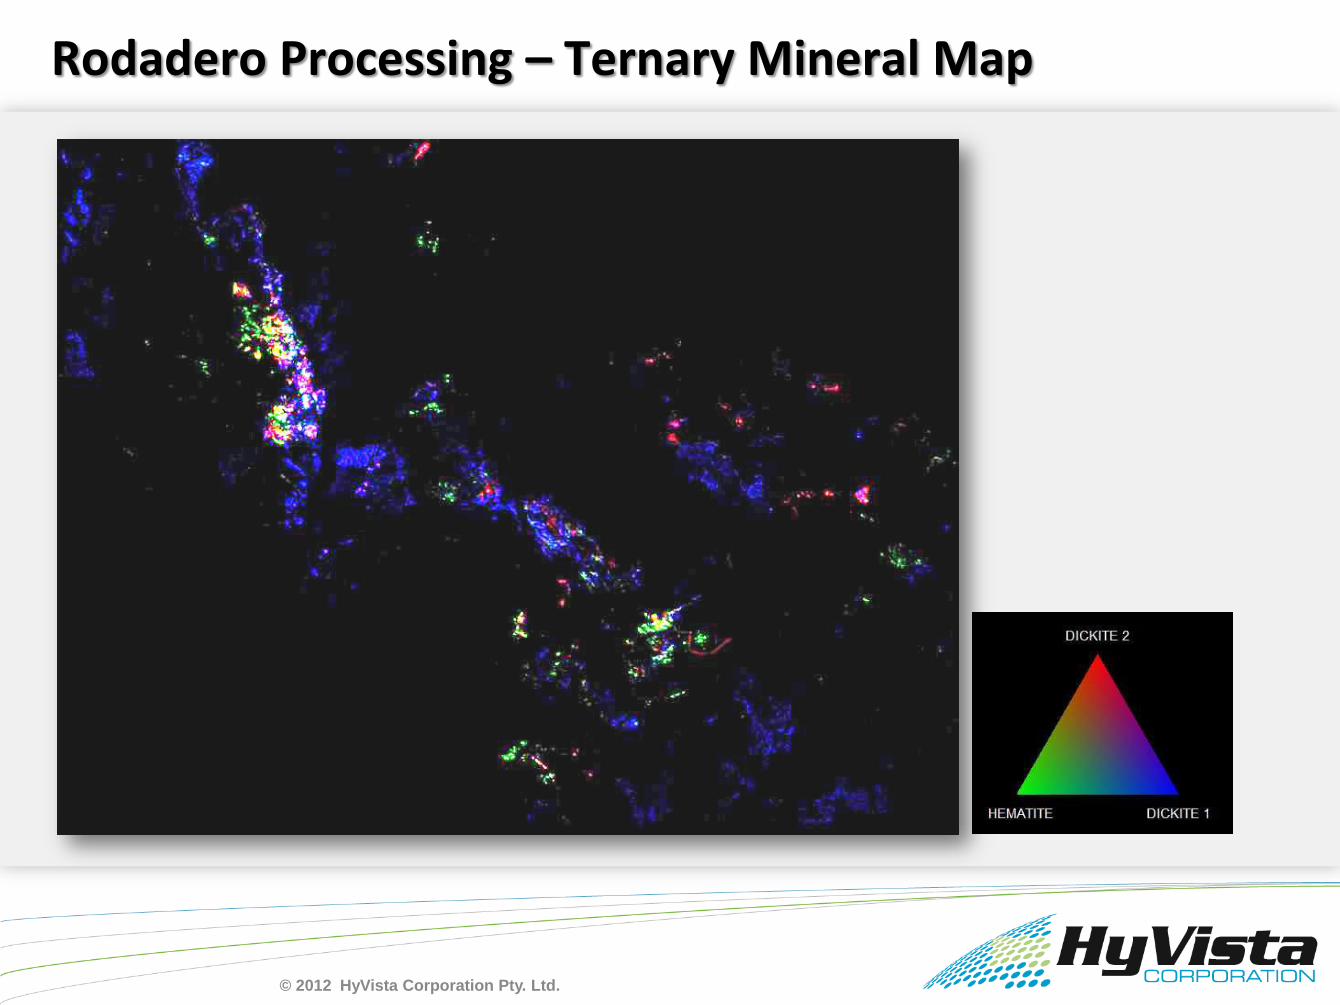
Rodadero Processing – Ternary Mineral Map
© 2012 HyVista Corporation Pty. Ltd.

Tonichi, NW Mexico – Overview Colour Composite
© 2012 HyVista Corporation Pty. Ltd.

Advanced Argillic
Alteration
Tonichi Mineral Mapping – Selected Minerals
© 2012 HyVista Corporation Pty. Ltd.

Haib Survey, Namibia. HyMap Imagery, 5m pixels, Acquired October 2006
The early Proterozoic Haib porphyry copper deposit in Namibia clearly shows alteration zonation typical of this type of deposit.
Porphyry System Exploration, Haib, Nambia
© 2012 HyVista Corporation Pty. Ltd.
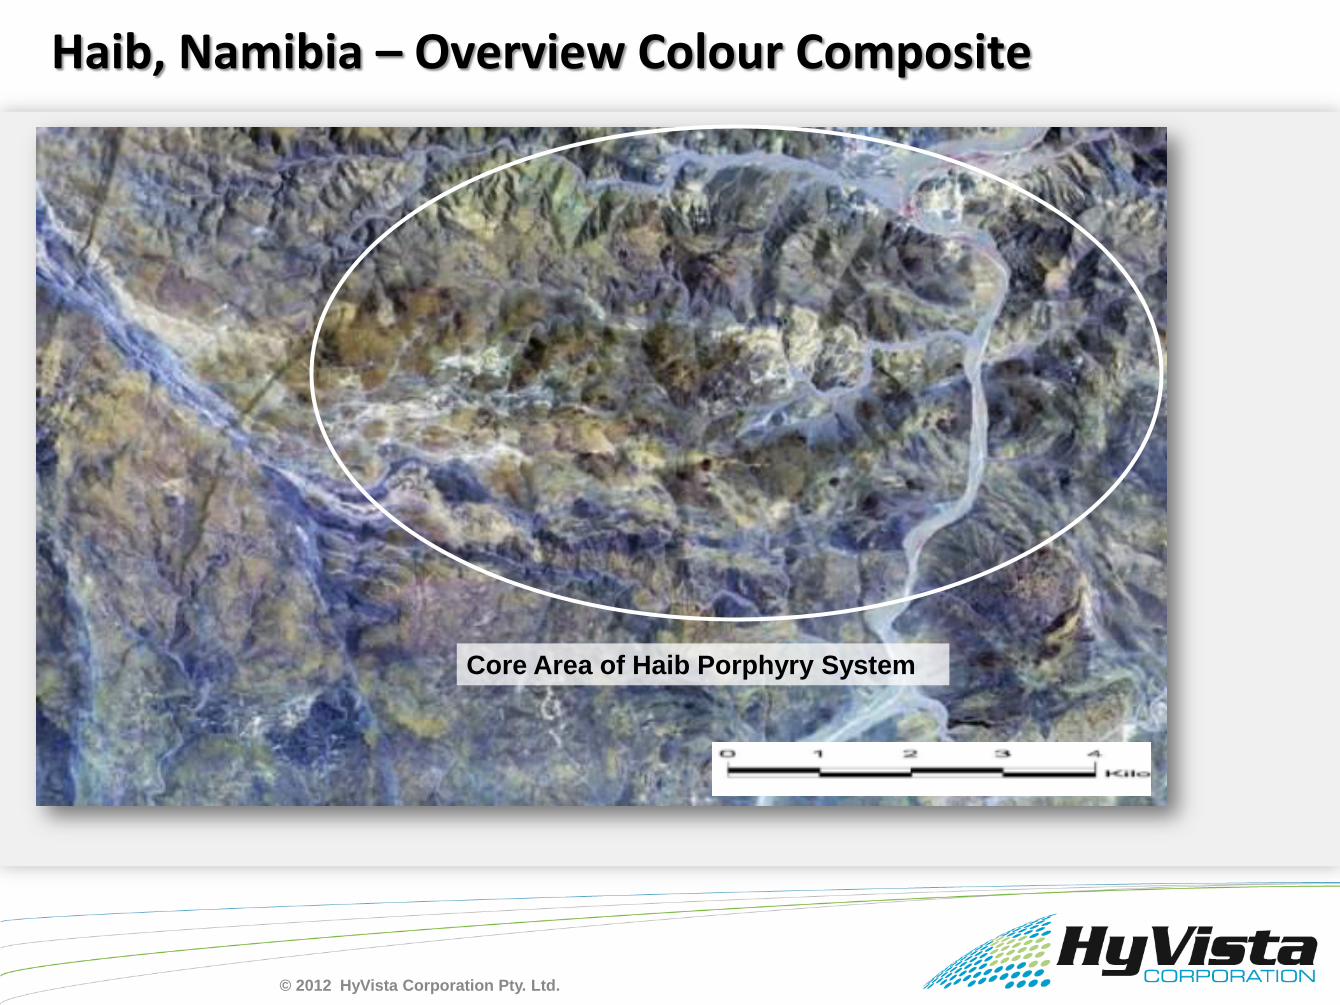
Haib, Namibia – Overview Colour Composite
Core Area of Haib Porphyry System
© 2012 HyVista Corporation Pty. Ltd.
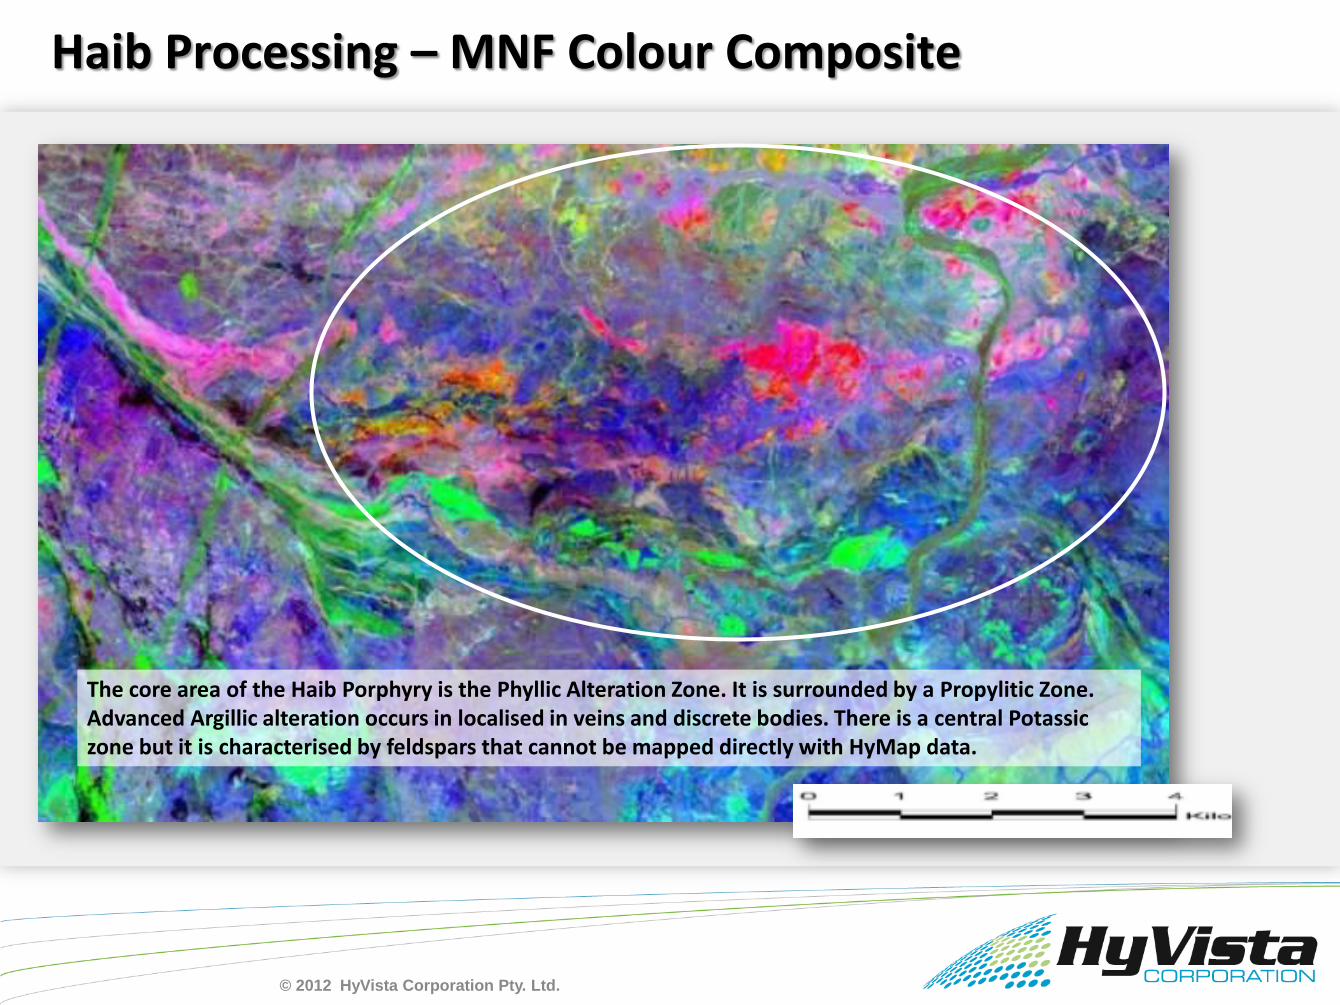
The core area of the Haib Porphyry is the Phyllic Alteration Zone. It is surrounded by a Propylitic Zone. Advanced Argillic alteration occurs in localised in veins and discrete bodies. There is a central Potassiczone but it is characterised by feldspars that cannot be mapped directly with HyMap data.
Haib Processing – MNF Colour Composite
© 2012 HyVista Corporation Pty. Ltd.

Haib Processing – Mineral Map – Propalytic Alteration
© 2012 HyVista Corporation Pty. Ltd.

Haib Processing – Ternary Map – Phyllic Alteration
Phyllic characterised by Illites (White Mica) identified as Paragonite-Muscovite-Phengite from shift in main absorption feature
© 2012 HyVista Corporation Pty. Ltd.

Haib Processing – Ternary Map – Argillic Alteration
Pyrophyllite identifies the argillic alteration within the phylliczone; tourmaline occurs in veins and some country-rock units
© 2012 HyVista Corporation Pty. Ltd.
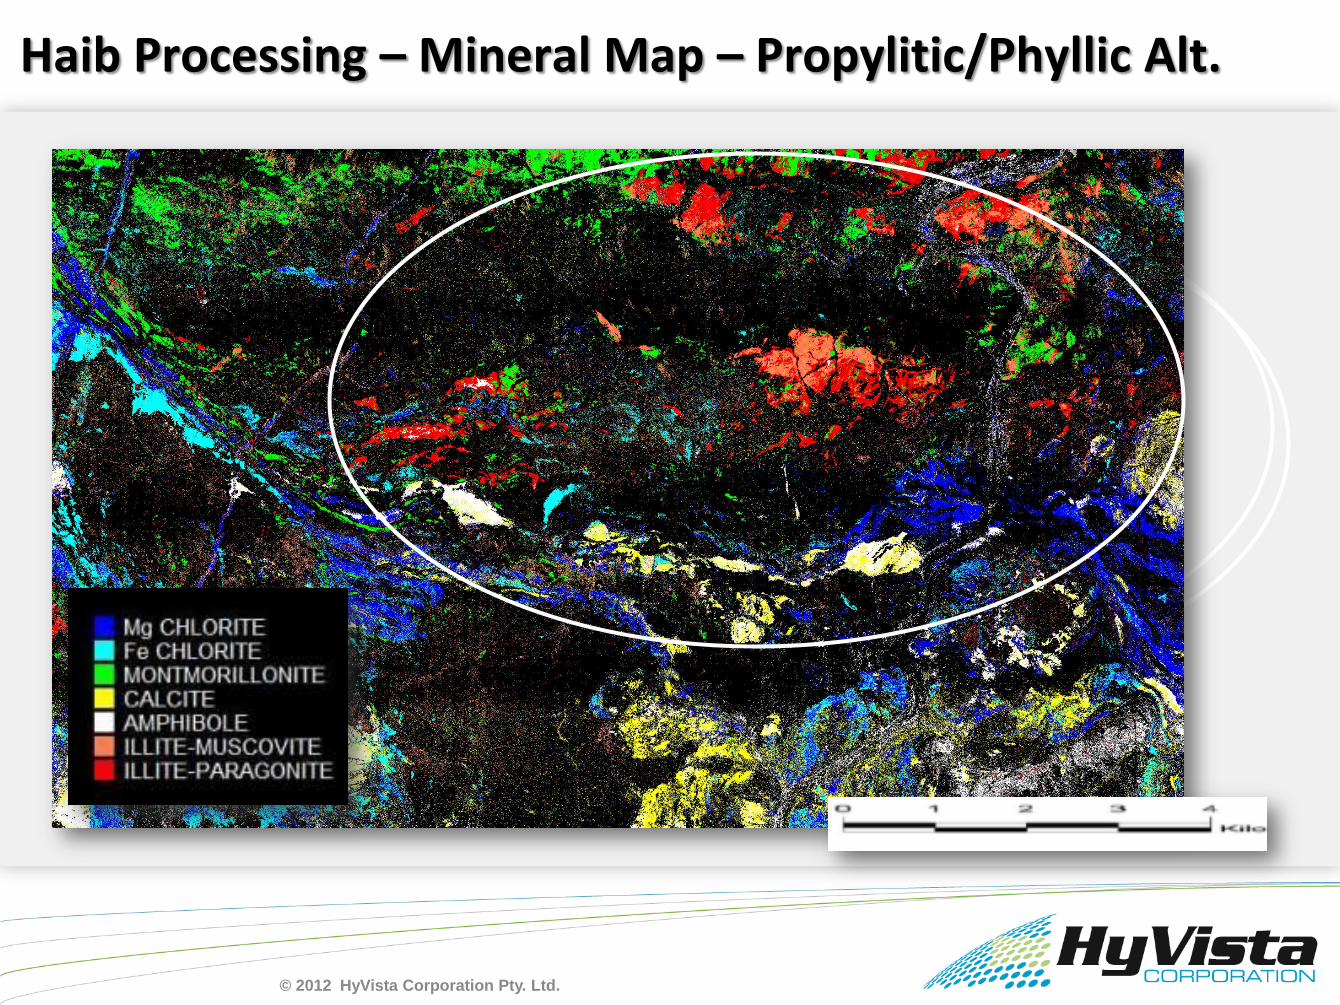
Haib Processing – Mineral Map – Propylitic/Phyllic Alt.
© 2012 HyVista Corporation Pty. Ltd.

Halls Creek Mobile Belt, Kimberley Region, Western Australia. HyMap MKI Imagery, 5m pixels, Acquired Sept 2004
Regional Alteration Mapping, Halls Creek, WA, Australia
© 2012 HyVista Corporation Pty. Ltd.

Area of Geology Map
X Cu/Pb/Zn
The images indicate that geology of
the area is more complex than existing
mapping indicates. However, these
images do not indicate the presence of
any alteration. There is one recorded
Cu/Pb/Zn prospect and the Grants
Creek Goldfield lies immediately to the
north of the area. The Halls Creek Gold
Field, Nicholson’s Find Gold Mine and
Angelo Gold Prospect area all located
less than 45Km SW of this area.
Halls Creek Processing
Overview Colour Composite Geology Map MNF Colour Composite
© 2012 HyVista Corporation Pty. Ltd.

There are Four main areas of argillic alteration
in this area:
SE (SE) – occurs in an Al rich white mica unit
that corresponds to an granite unit and is
expressed as a marker unit showing zoning
within the granite.
Little Mount Isa (LMI) - area that is associated
with a ridge, within this unit, which is mainly
pyrophyllite, are zones of iron oxide., these
could be gossan; yellow on mineral map
colour composite
Halls Creek Fault Zone (HCF) - area of
alteration that lies along Halls creek fault north
of LMI..
Western Zone (WZ) – that is truncated by a
north south trending fault.
The LMI, HCF and WZ alteration lie to the east
and west of a unit that is dominated by Al poor
white mica but immediately bounded by
muscovite white mica.
This alteration probably results from a large
hydrothermal event possibly structurally
associated with the Halls Creek Fault, though
large hydrothermal events do occur elsewhere
in the Kimberley region.
SE
LMI
HCF
WZ
LMI
Halls Creek Processing: Mineral Maps
Mineral Map Colour Composite Rule Classified Mineral Map
© 2012 HyVista Corporation Pty. Ltd.

Nullagine Survey, Hamersley Region, Western Australia. HyMap Imagery, 5m pixels, Acquired August 2009
Gold Exploration, Nullagine, WA, Australia
© 2012 HyVista Corporation Pty. Ltd.

Part of SF5105 Geology Map (HyMap data extends beyond map to west and south).
To the south of the Middle Creek Line (southern set of mineral occurrences) upper greenschist facies metamorphic rock dominates the Mosquito Creek Formation (AM). These higher grade rocks include mylonite, phyllite, mica schist, and chlorite magnetite schist, as well as mafic and felsic intrusive rocks.
To the north of the Middle Creek Line, the Mosquito Creek Formation (AM) is dominated by poorly sorted wacke-siltstone and wacke-sandstone interbedded with more pelitic rock types ieCoarser grained rock types. The Blue Spec Line (northern set of mineral occurrences) is located about 6 km north of, and parallel to, the Middle Creek Line. The Kurrana Shear Zone defines the southern margin of the belt with granite (Agg).
Blue Spec Mine
Nullagine Mine
Golden Eagle Mine
Blue Spec Line
Mosquito CK Line
Gold Exploration, Nullagine, WA, Australia
MNF Colour Composite Geological Map
Colour Composite Site with Gold Occurences
© 2012 HyVista Corporation Pty. Ltd.

Northwest Resources PIMA analysis study indicates that the Illite is an Al-rich muscovite (possibly paragonite) and develops proximal to the mineralisation (relatively acid epithermal environments). Chlorite is observed more distal to the mineralisation. These minerals are well represented in the HyMap derived mineralogy.
Also near Nullagine, pyrophyllite is observed in the HyMap mineralogy suggesting the presence of a relatively acid, highertemperature fluid flow zone.
The distribution of the Al-rich white mica is relatively widespread which is presumably related to the porosity / permeability of the Mosquito Creek Belt metasediments to the mineralising fluid (s). The Al-rich white mica is not restricted to the trace of the Blue Spec Line suggesting the potential for mineralisation elsewhere provided suitable structural sites or other focusing mechanism exists.
PIMA studies at Golden Eagle confirm that a muscovite-phengite-chlorite assemblage host the mineralisation
Au mineralisation along the Middle Creek and Blue Spec Lines is localised to structural sites
arising from contrasting competencies between psammite - pelite units during deformation.
Along the Blue Spec Line, hydrothermal alteration mineralogy associated with these structural
sites includes quartz, pyrite, white mica, chlorite and carbonate.
Nullagine Processing: Mineral Maps
Mineral Map Colour Composite Rule Classified Mineral Map
© 2012 HyVista Corporation Pty. Ltd.

Image depicts the wavelength of the white mica absorption band scaled from 2.185um in blue through to 2.215um absorptions in red ; cool colours represent paragonite, intermediate colours muscovite and warm colours phengite. Mineral occurrences of the Middle Creek and Blue Spec lines are shown.
Changes in Illite (White mica) Al chemistry can vary from paragonite(Al-rich) to muscovite to phengite (Al-poor) are mappable directly with HyMap by tracking the wavelength position of the principal absorption band. The Blue Spec Line is characterised by strongly developed Al-rich white mica. The HyMap derived mineralogy suggests that the Line is continuous from near the Nullagine town ship eastwards.
2.185um 2.215um
Nullagine Processing: White Mica Wavelength Shift
© 2012 HyVista Corporation Pty. Ltd.

Calcrete Hosted
Yeleerrie, Western Australia, Australia
Langer Heinrich, Namibia
Unconformity Associated
Ranger, Northern Territory, Australia
HyVista HyMap Test Site Surveys: Uranium Deposits
© 2012 HyVista Corporation Pty. Ltd.

Lake Mason Survey, Yilgarn Region , Western Australia. HyMap Imagery, 4m pixels, Acquired November 2010
Uranium Exploration (Calcrete), Lake Mason, WA, Australia
© 2012 HyVista Corporation Pty. Ltd.

The Lake Mason U deposit lies 40km to the south west of the Yeelirrie.
The Lake Mason and Yeelirrie lake systems developed during similar climatic conditions over a similar granitoid basement. The Lake Mason palaeodrainage system has uranium channel radiometric data anomalies drilling of which has indentified mineralisation of approximately 1 million tonnes at an average grade of 170ppm uranium.(Source: Prime Minerals Ltd. Website: Www.primeminerals.com.au – 2007)
COLOUR COMPOSITE DCS COLOUR COMPOSITE
Hyperspectral images map regolith and highlight the calcretised paleodrainage.
The mineral maps show that the paleochannels contain calcite, dolomite, Mg-smectite and gypsum.
Dolomite can weather into Mg-smectite, thus the presence of this clay may indicate un-exposed dolomitic calcrete
Lake Mason Processing
© 2012 HyVista Corporation Pty. Ltd.

Lake Mason Processing: Mineral Ternary Maps
© 2012 HyVista Corporation Pty. Ltd.

Lake Mason Processing: Mineral Maps
© 2012 HyVista Corporation Pty. Ltd.
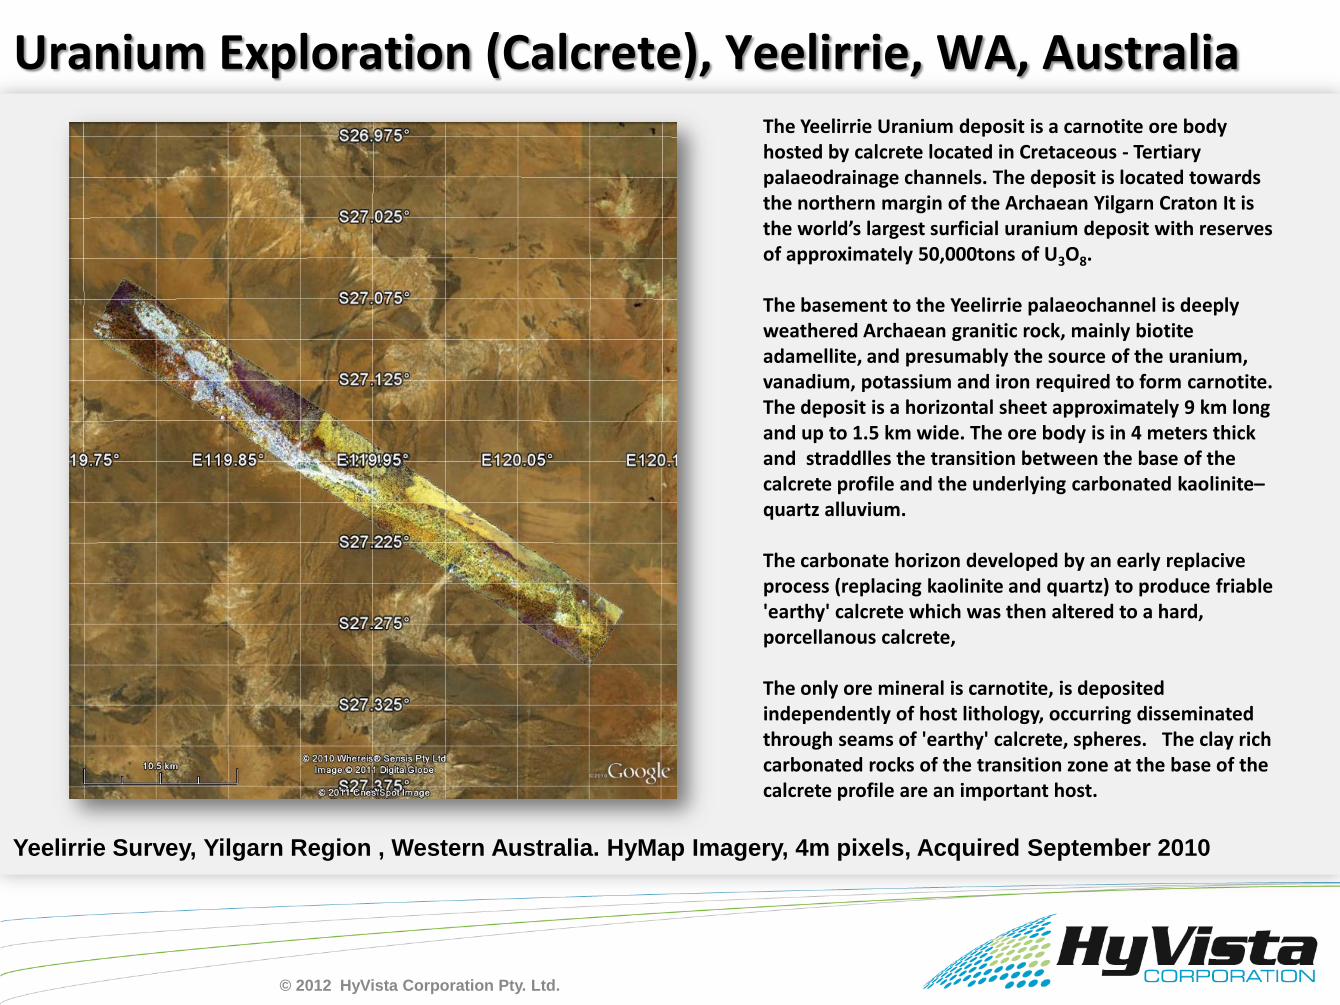
Yeelirrie Survey, Yilgarn Region , Western Australia. HyMap Imagery, 4m pixels, Acquired September 2010
The Yeelirrie Uranium deposit is a carnotite ore body hosted by calcrete located in Cretaceous - Tertiary palaeodrainage channels. The deposit is located towards the northern margin of the Archaean Yilgarn Craton It is the world’s largest surficial uranium deposit with reserves of approximately 50,000tons of U3O8.
The basement to the Yeelirrie palaeochannel is deeply weathered Archaean granitic rock, mainly biotiteadamellite, and presumably the source of the uranium, vanadium, potassium and iron required to form carnotite. The deposit is a horizontal sheet approximately 9 km long and up to 1.5 km wide. The ore body is in 4 meters thick and straddlles the transition between the base of the calcrete profile and the underlying carbonated kaolinite–quartz alluvium.
The carbonate horizon developed by an early replaciveprocess (replacing kaolinite and quartz) to produce friable 'earthy' calcrete which was then altered to a hard, porcellanous calcrete,
The only ore mineral is carnotite, is deposited independently of host lithology, occurring disseminated through seams of 'earthy' calcrete, spheres. The clay rich carbonated rocks of the transition zone at the base of the calcrete profile are an important host.
Uranium Exploration (Calcrete), Yeelirrie, WA, Australia
© 2012 HyVista Corporation Pty. Ltd.

Uranium Exploration (Calcrete), Yeelirrie, WA, Australia
© 2012 HyVista Corporation Pty. Ltd.
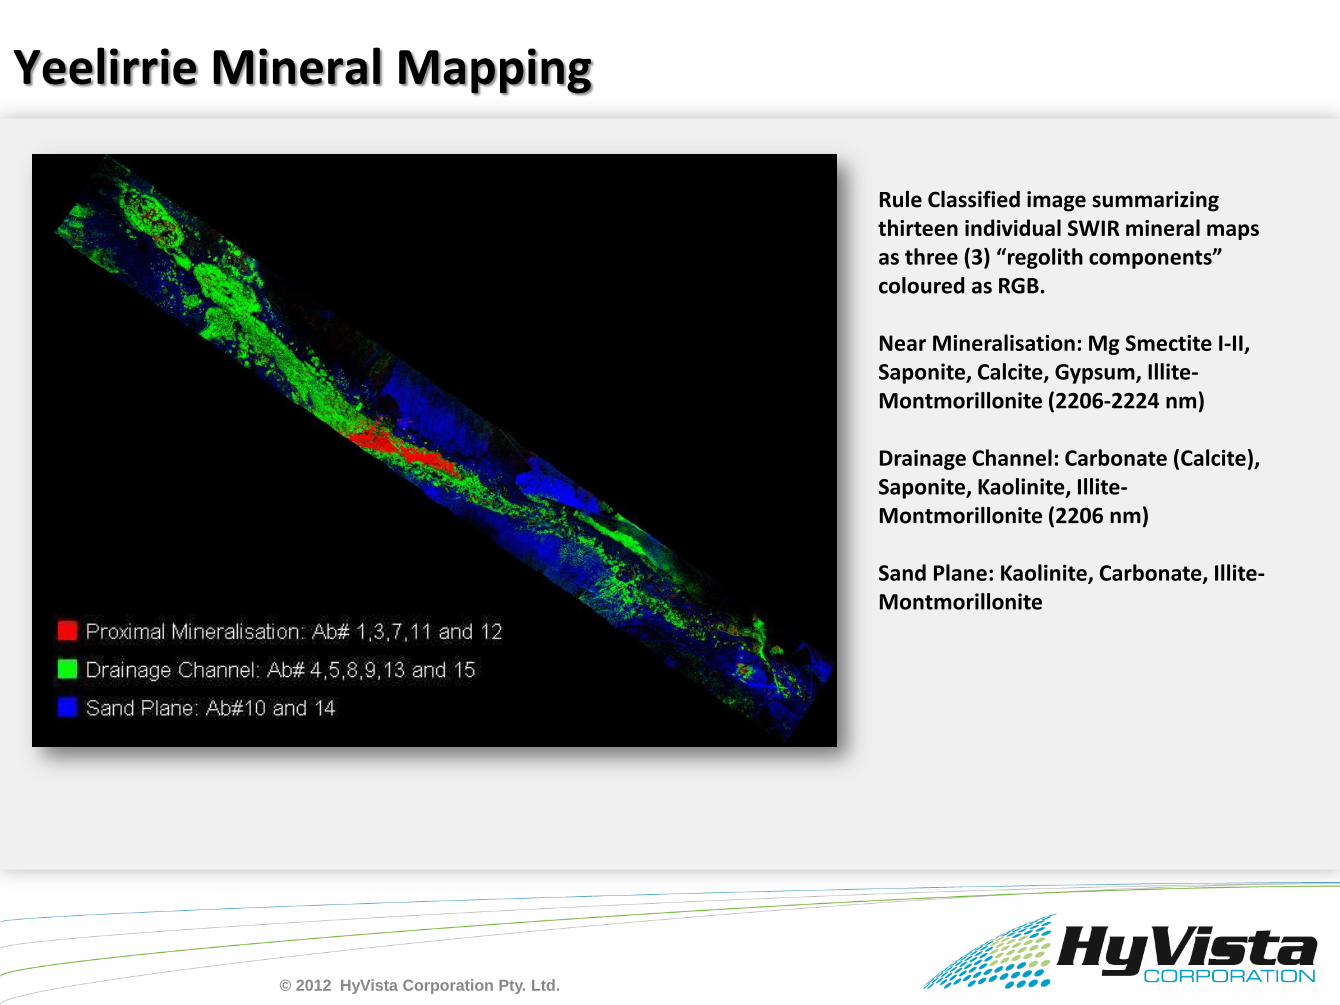
Rule Classified image summarizing thirteen individual SWIR mineral maps as three (3) “regolith components” coloured as RGB.
Near Mineralisation: Mg Smectite I-II, Saponite, Calcite, Gypsum, Illite-Montmorillonite (2206-2224 nm)
Drainage Channel: Carbonate (Calcite), Saponite, Kaolinite, Illite-Montmorillonite (2206 nm)
Sand Plane: Kaolinite, Carbonate, Illite-Montmorillonite
Yeelirrie Mineral Mapping
© 2012 HyVista Corporation Pty. Ltd.

Rule Classified image of 8 individual mineral maps highlights mineralogical differences in the palaeodrainage channel and surrounding sand plane. North of the Yeelirrie mineralisation, the channel is depicted by a distinctive ridge / mound pattern typical of valley calcrete and has strong carbonate-saponite (red hues) mineralogy. Presumably the carbonated loam component of the overburden described by Cameron, E., (1990).
South of the mineralisation the channel is less distinctive; the texture is more like the surrounding sand plane. Carbonates (green hues) are abundant in areas but the clay minerals are aluminum rich (Illite, montmorillonite and kaolinite). Presumably the sandy soil / hardpan component of the overburden is dominant here.
The sand plane is dominated by a kaolinite, illite-montmorillonite and / or carbonate assemblage.
Yeelirrie Mineral Mapping
© 2012 HyVista Corporation Pty. Ltd.

Yeelirrie Mineral Mapping
The local surficial expression of the palaeodrainage channel hosting the Yeelirrie uranium deposit is mineralogically distinctive. It is unclear whether the observed contrast is due to better exposure (surface disturbance during the evaluation programme; note the drilling pattern visible in the overview colour composite image) and / or some variation in the chemical-physical properties of the environment hosting the ore body.
© 2012 HyVista Corporation Pty. Ltd.

Uranium Exploration (Calcrete), Langer Heinrich, Namibia
Langer Heinrich Survey, Namibia. HyMap Imagery, 4.6m pixels, Acquired August 2006
© 2012 HyVista Corporation Pty. Ltd.

COLOUR COMPOSITE
Uranium Exploration (Calcrete), Langer Heinrich, Namibia
MNF COLOUR COMPOSITE
© 2012 HyVista Corporation Pty. Ltd.

RULE CLASS MINERAL MAP
The boundaries of the mineralized calcrete at Langer Heinrich are shown as white polygons.
The predominant mineral that defines these calcretes is calcite mapped in red. Residual illite
partially covers some of the calcrete and in the eastern most polygon the presence of
dolomite may show a change in calcrete facies. There are areas of calcite that are not
mapped as calcrete, those to the south of the eastern most polygons may be of interest.
Langer Heinrich Processing: Mineral Map
© 2012 HyVista Corporation Pty. Ltd.

Ranger Survey, Arnhemland, Northern Territory. HyMap Imagery, 5m pixels, Acquired 2005
Uranium Exploration (Unconformity), Ranger, NT, Australia
© 2012 HyVista Corporation Pty. Ltd.

NATURAL COLOUR COMPOSITE MNF COLOUR COMPOSITE
RANGER MINERALOGY
Footwall sequence comprising a variable mixture metamorphic rocks, which have been chloritised and sericitised.
Lower Mine sequence - interceded carbonates (magenesite to dolomite), schists and cherts. The schist consists of quartz, chlorite and sericite. Below the mineralised zone the carbonate has been silicified to produce a jasperoid chert. Uranium mineralisation in the Lower Mine Sequence is restricted to the zones of chlorite alteration and the schist.
Upper Mine sequence - comprises a thick sequence of quartz-feldspar-biotite schists, micro-gneisses (altered to quartz-chloriteschist) and irregular carbonates. Graphiticschists in the central disturbed zone contain high grade uranium mineralisation.
Hanging wall sequence - a group of micaceous quartz-feldspar schists with intercalated amphibolitic units and garnetiferous horizons.
Intrusives - in the mine area are largely pegmatite and dolerite dykes. The alteration that can be mapped from HyMap data (italics/underlined) are:
Amphibole, Chert, Chlorite, Dolomite, Graphic schist, Magnesite, Sericite (white mica / illite).
Tourmaline occurs within the pegmatitesthat are intruded into the U deposits. Tourmaline (Dravite) is known to be associated with unconformity style U deposits.
Extensive areas of alluvial deposits, green and dry
vegetation occur within the valley around the Ranger
Mine. The black pixels are where vegetation and water
have been masked out the data.
Ranger Processing
© 2012 HyVista Corporation Pty. Ltd.

Ranger Mineral Mapping
Halloysite (disordered kaolinite) is the dominant mineral in the wider area away from the mine which indicates surficial cover with illite and illite mixed with calcite also occurring in the in these regions.
The dense vegetation and cover in the area limits the extent to which the alteration minerals, chlorite, sericite and tourmaline can be detected from hyperspectral imagery. However, it is possible to distinguish the illite associated with the mineralisation from the back ground, WM2212 (illite) shown in cyan. The presence of this mineral to the south west of the mine area and in the north of the area, as well as localised chlorite occurrences, may be of interest
Ranger Processing: Mineral Maps
© 2012 HyVista Corporation Pty. Ltd.

In the mine pit there is a clear boundary between chlorite and tourmaline in the SW corner and illites(WM units) in the remainder of the pit.
The illites also show zoning and there are zones of illite mixed with carbonate within the pit. It appears that this illite mixed with carbonate
has been widely distributed around the mine site on haul roads and dumps, though it also occurs in the background of the area. In the SW
corner of the pit the tourmaline bearing pegmatite is highlighted and it is dumps containing this unit that accounts for the tourmaline signature
elsewhere in the mine site.
4 of the 7 minerals reported as associated with the Ranger U deposit have been indentified from the HyMap imagery:
chlorite (Mg), sericite (4 varieties of white mica)tourmaline (dravite and elbaite)dolomite (white mica mixed with carbonate)
Ranger Processing: Mineral Maps
© 2012 HyVista Corporation Pty. Ltd.
Beltana, South Australia
HyVista HyMap Test Site Surveys: MVT Zinc Deposits
© 2012 HyVista Corporation Pty. Ltd.

Beltana Mine, South Australia, MVT Zn , 5m pixels, Acquired March 2002
MVT Zinc Exploration: Beltana Mine, South Australia
© 2012 HyVista Corporation Pty. Ltd.
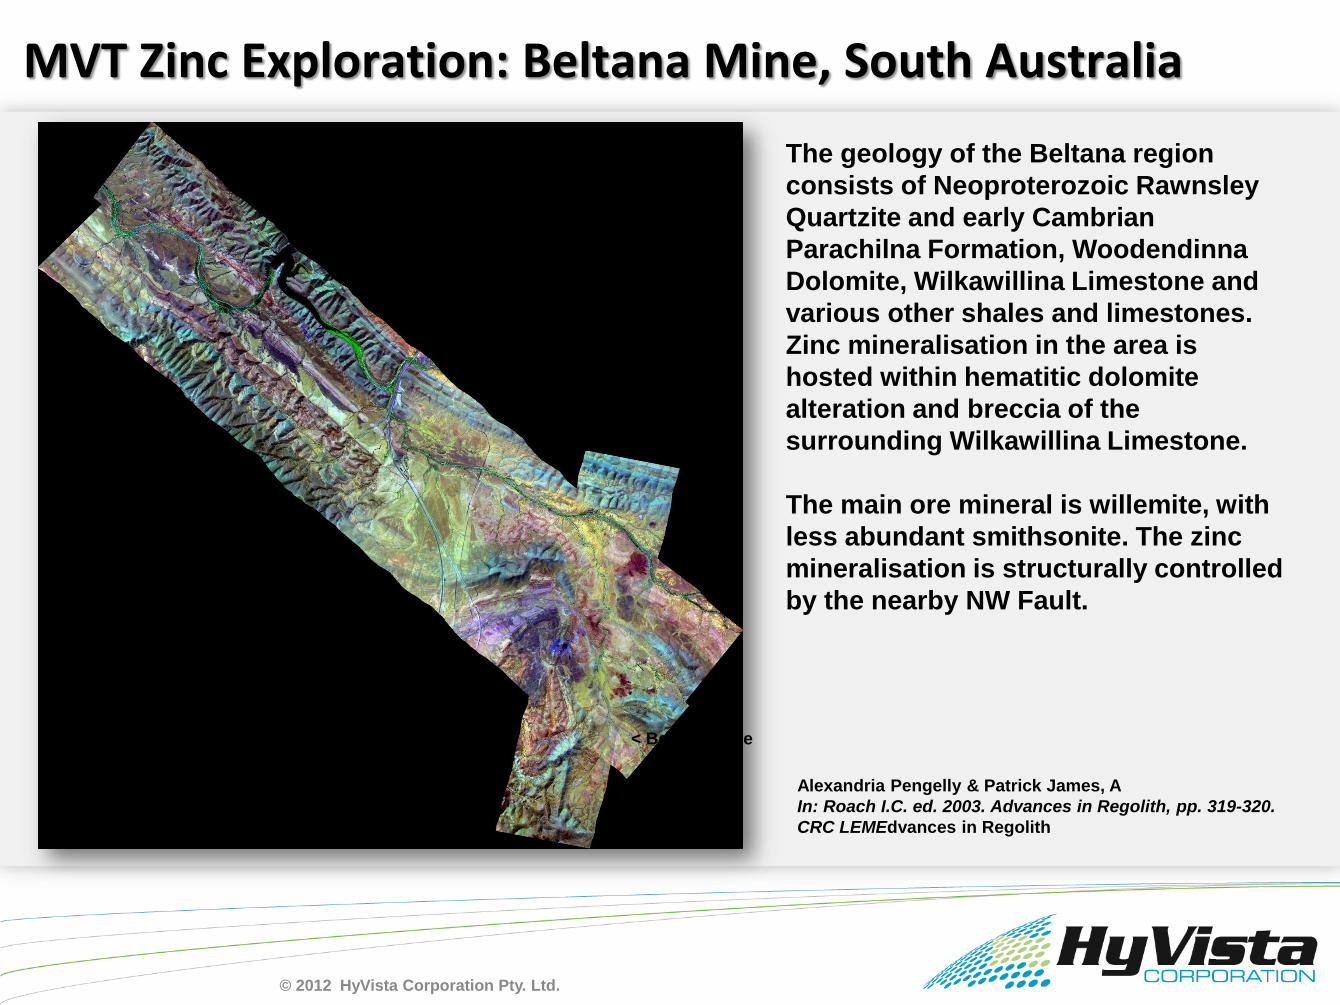
The geology of the Beltana region
consists of Neoproterozoic Rawnsley
Quartzite and early Cambrian
Parachilna Formation, Woodendinna
Dolomite, Wilkawillina Limestone and
various other shales and limestones.
Zinc mineralisation in the area is
hosted within hematitic dolomite
alteration and breccia of the
surrounding Wilkawillina Limestone.
The main ore mineral is willemite, with
less abundant smithsonite. The zinc
mineralisation is structurally controlled
by the nearby NW Fault.
Alexandria Pengelly & Patrick James, A
In: Roach I.C. ed. 2003. Advances in Regolith, pp. 319-320.
CRC LEMEdvances in Regolith
< Beltana Mine
MVT Zinc Exploration: Beltana Mine, South Australia
© 2012 HyVista Corporation Pty. Ltd.
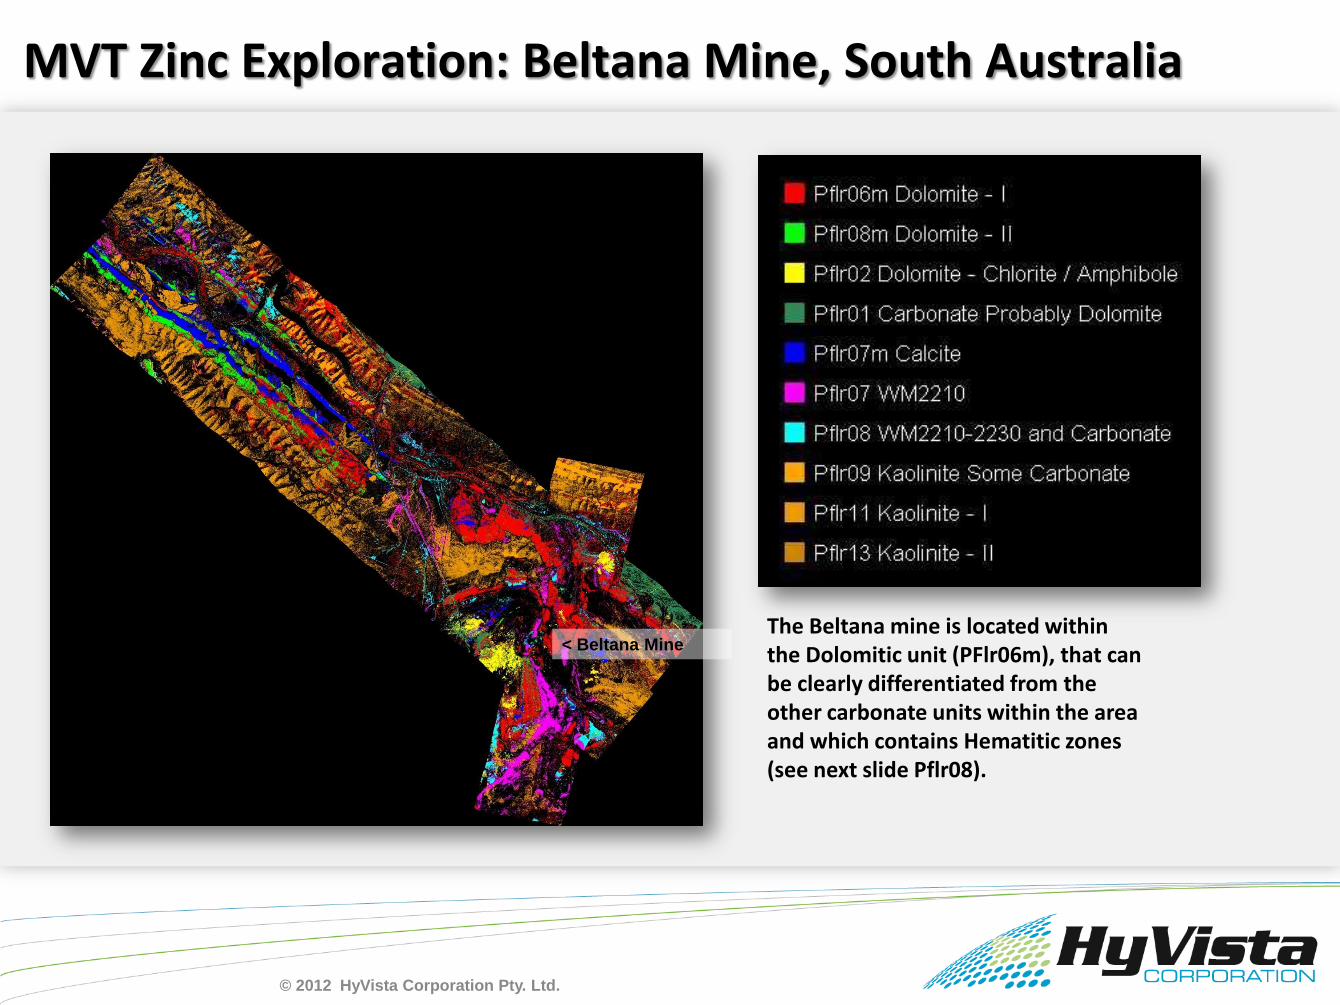
MVT Zinc Exploration: Beltana Mine, South Australia
< Beltana MineThe Beltana mine is located within the Dolomitic unit (PFlr06m), that can be clearly differentiated from the other carbonate units within the area and which contains Hematitic zones (see next slide Pflr08).
© 2012 HyVista Corporation Pty. Ltd.

MVT Zinc Exploration: Beltana Mine, South Australia
© 2012 HyVista Corporation Pty. Ltd.
Gove, Northern Territory, Australia
HyVista HyMap Test Site Surveys: Bauxite Deposits
© 2012 HyVista Corporation Pty. Ltd.

Bauxite Exploration: Gove, Northern Territory, Australia
© 2012 HyVista Corporation Pty. Ltd.
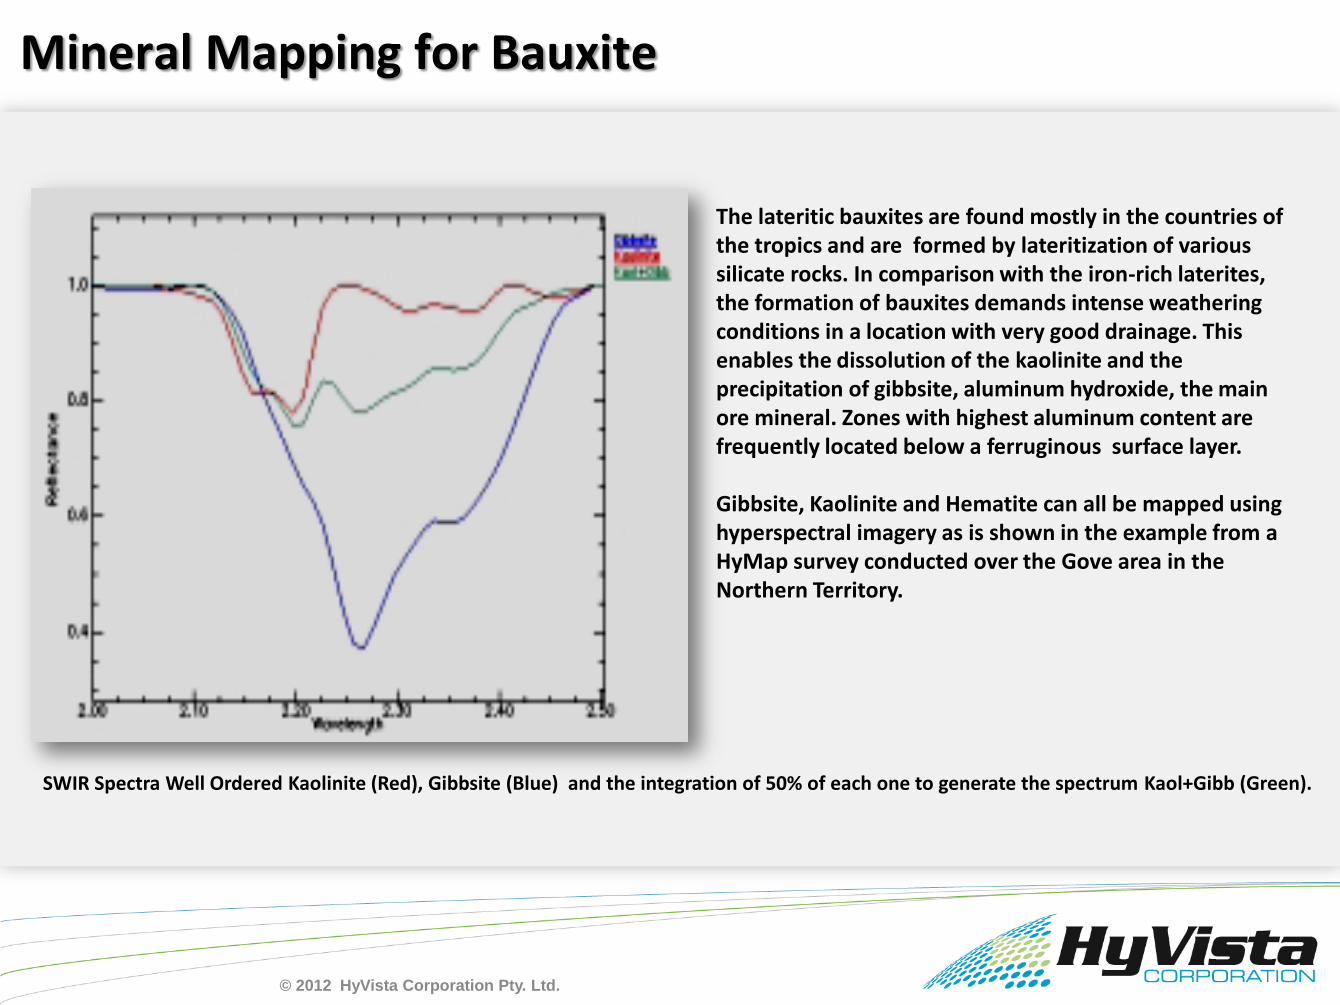
The lateritic bauxites are found mostly in the countries of the tropics and are formed by lateritization of various silicate rocks. In comparison with the iron-rich laterites, the formation of bauxites demands intense weathering conditions in a location with very good drainage. This enables the dissolution of the kaolinite and the precipitation of gibbsite, aluminum hydroxide, the main ore mineral. Zones with highest aluminum content are frequently located below a ferruginous surface layer.
Gibbsite, Kaolinite and Hematite can all be mapped using hyperspectral imagery as is shown in the example from a HyMap survey conducted over the Gove area in the Northern Territory.
SWIR Spectra Well Ordered Kaolinite (Red), Gibbsite (Blue) and the integration of 50% of each one to generate the spectrum Kaol+Gibb (Green).
Mineral Mapping for Bauxite
© 2012 HyVista Corporation Pty. Ltd.
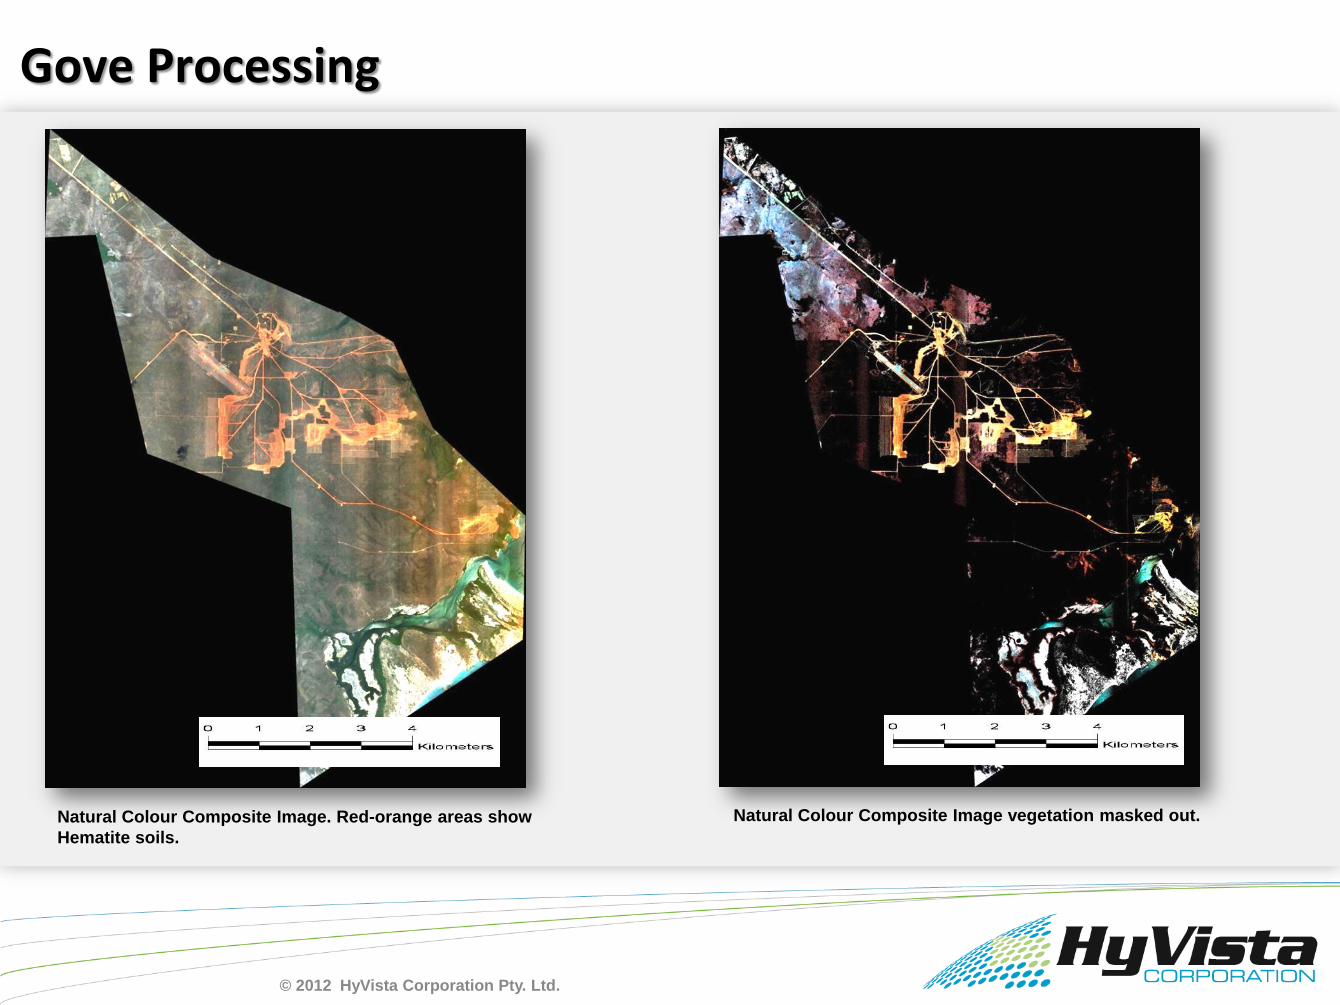
Natural Colour Composite Image. Red-orange areas show
Hematite soils.
Natural Colour Composite Image vegetation masked out.
Gove Processing
© 2012 HyVista Corporation Pty. Ltd.

Kaolinite (disordered) Spectrum USGS Lab. Gibbsite Spectrum USGS Lab.
Kaolinite (disordered) Spectrum HyMap Image Gibbsite Spectrum HyMap Image
Gibbsite and Kaolinite: HyMap vs. Lab Spectra
© 2012 HyVista Corporation Pty. Ltd.
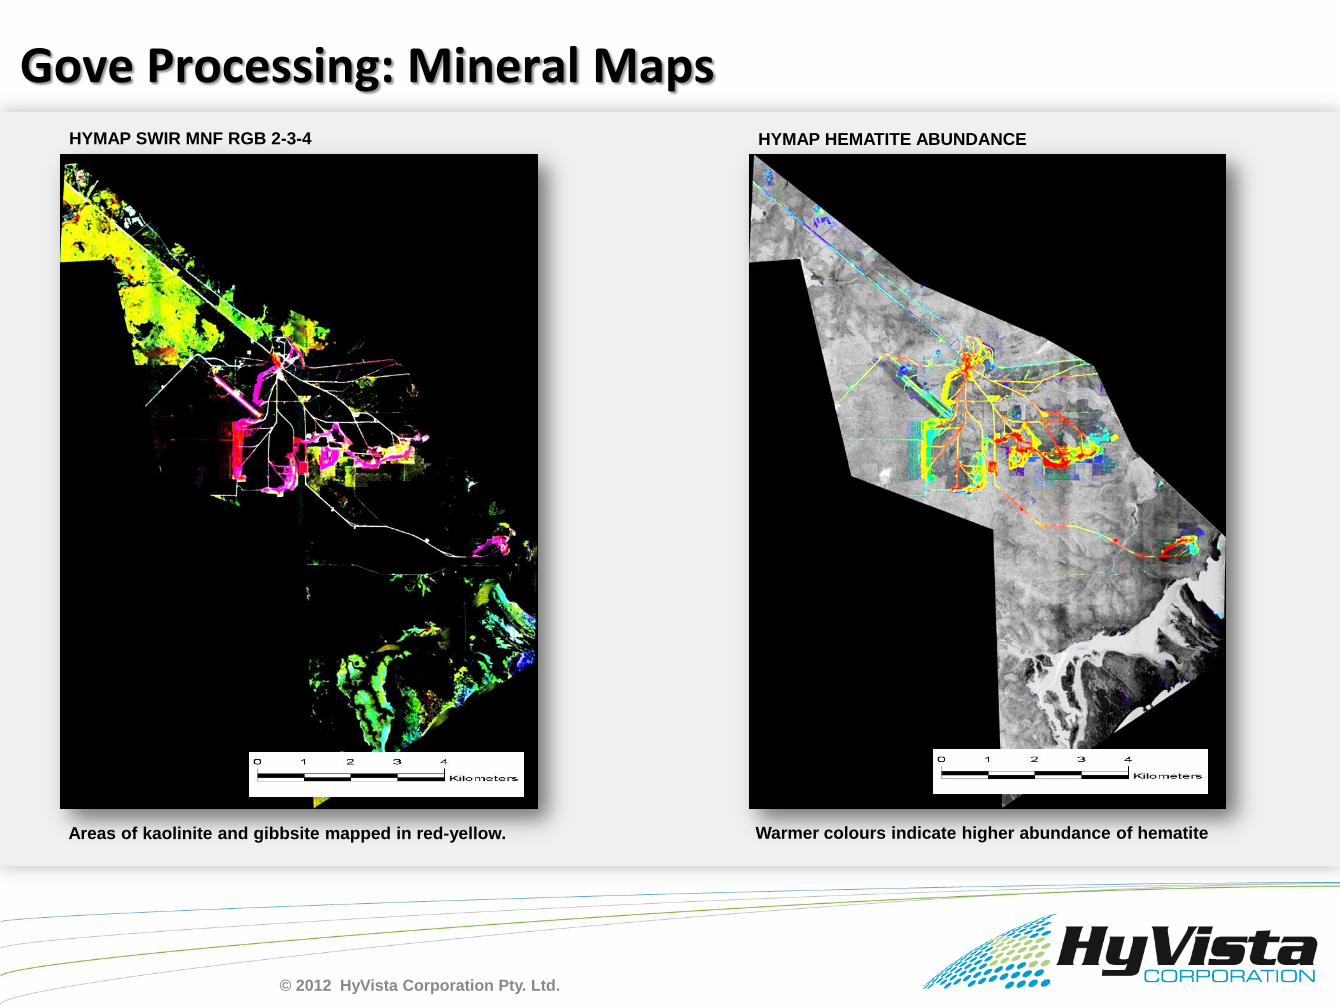
HYMAP SWIR MNF RGB 2-3-4
Areas of kaolinite and gibbsite mapped in red-yellow. Warmer colours indicate higher abundance of hematite
HYMAP HEMATITE ABUNDANCE
Gove Processing: Mineral Maps
© 2012 HyVista Corporation Pty. Ltd.

HYMAP GIBBSITE ABUNDANCE HYMAP RULE CLASSIFIED MINERAL MAP GIBBSITE AND KAOLINITE
Mineral map derived from spectral classification showing
most abundant occurrences of kaolinite and gibbsite.Warmer colours indicate higher abundance of Gibbsite
Gove Processing: Mineral Maps
© 2012 HyVista Corporation Pty. Ltd.

Warmer colours indicate higher abundance of Gibbsite.
Note scattering of purple pixels away from mine site-disturbed ground indicating presence of gibbsite at low surface abundance.
Gove Processing: Gibbsite Abundance
© 2012 HyVista Corporation Pty. Ltd.

Gove Processing: Gibbsite and Kaolinite Abundance
© 2012 HyVista Corporation Pty. Ltd.

HyVista HyMap Test Site Surveys: Iron Deposits
West Angelas, Western Australia
© 2012 HyVista Corporation Pty. Ltd.
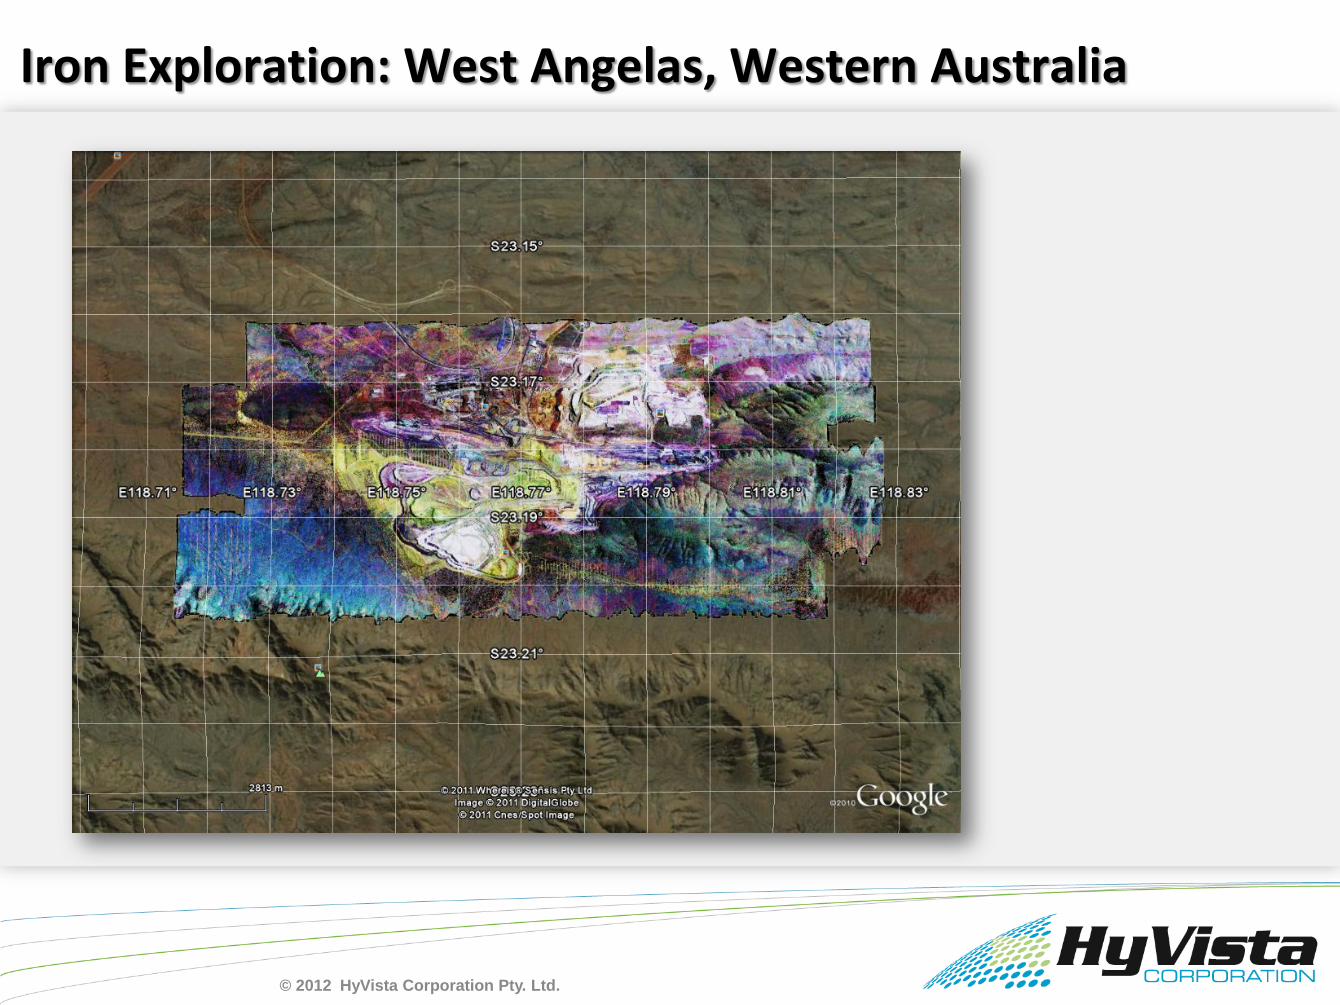
Iron Exploration: West Angelas, Western Australia
© 2012 HyVista Corporation Pty. Ltd.

West Angelas: Overview Colour Composite
© 2012 HyVista Corporation Pty. Ltd.

West Angelas Processing: VNIR MNF RGB 3-4-5
© 2012 HyVista Corporation Pty. Ltd.
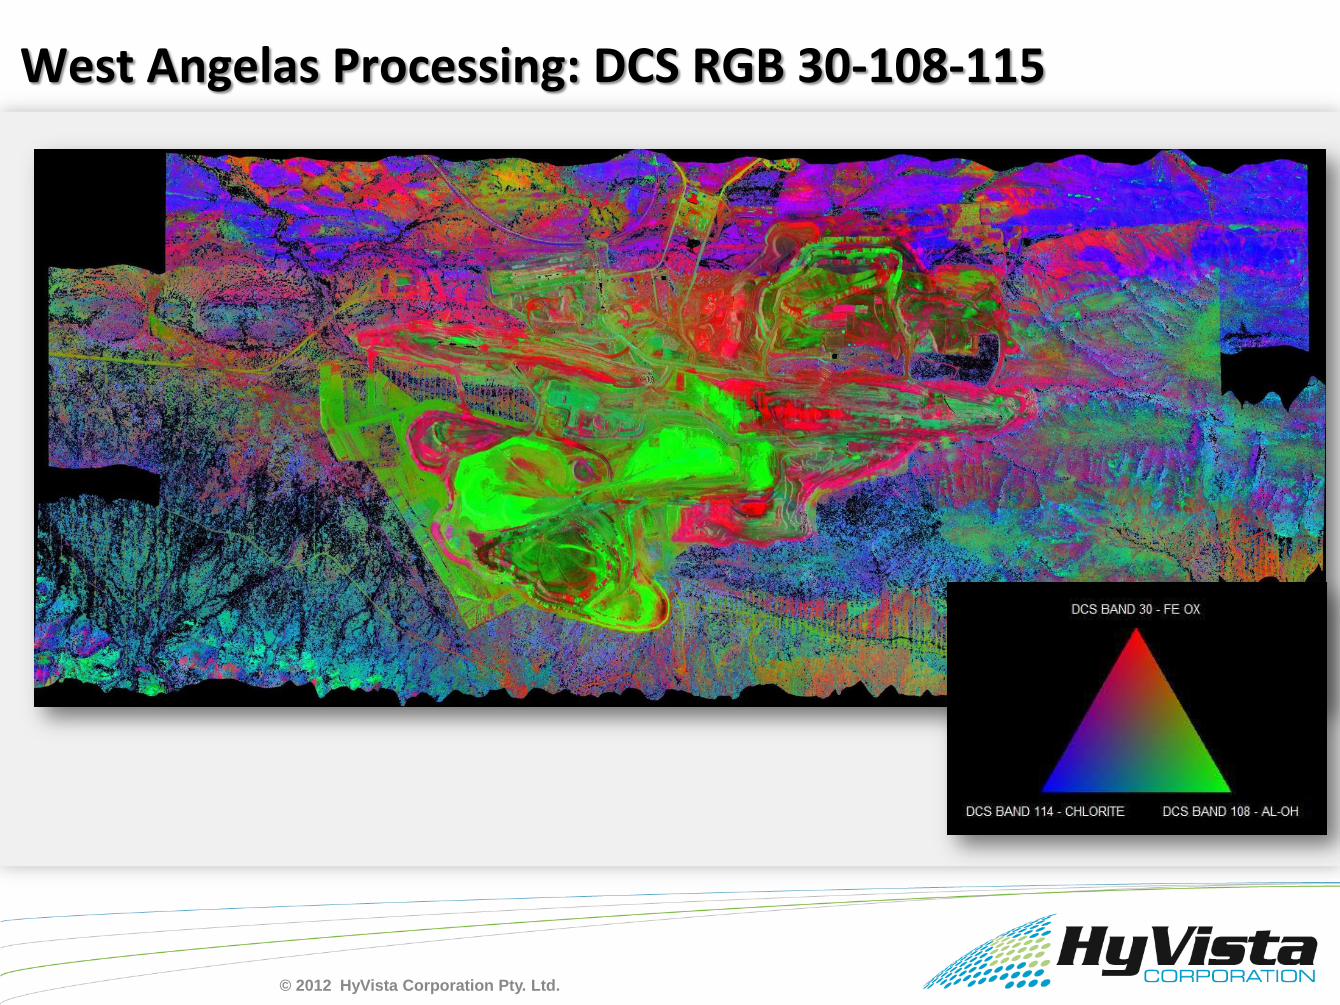
West Angelas Processing: DCS RGB 30-108-115
© 2012 HyVista Corporation Pty. Ltd.

^ 70> %
West Angelas Processing: MM FeOx 1
© 2012 HyVista Corporation Pty. Ltd.
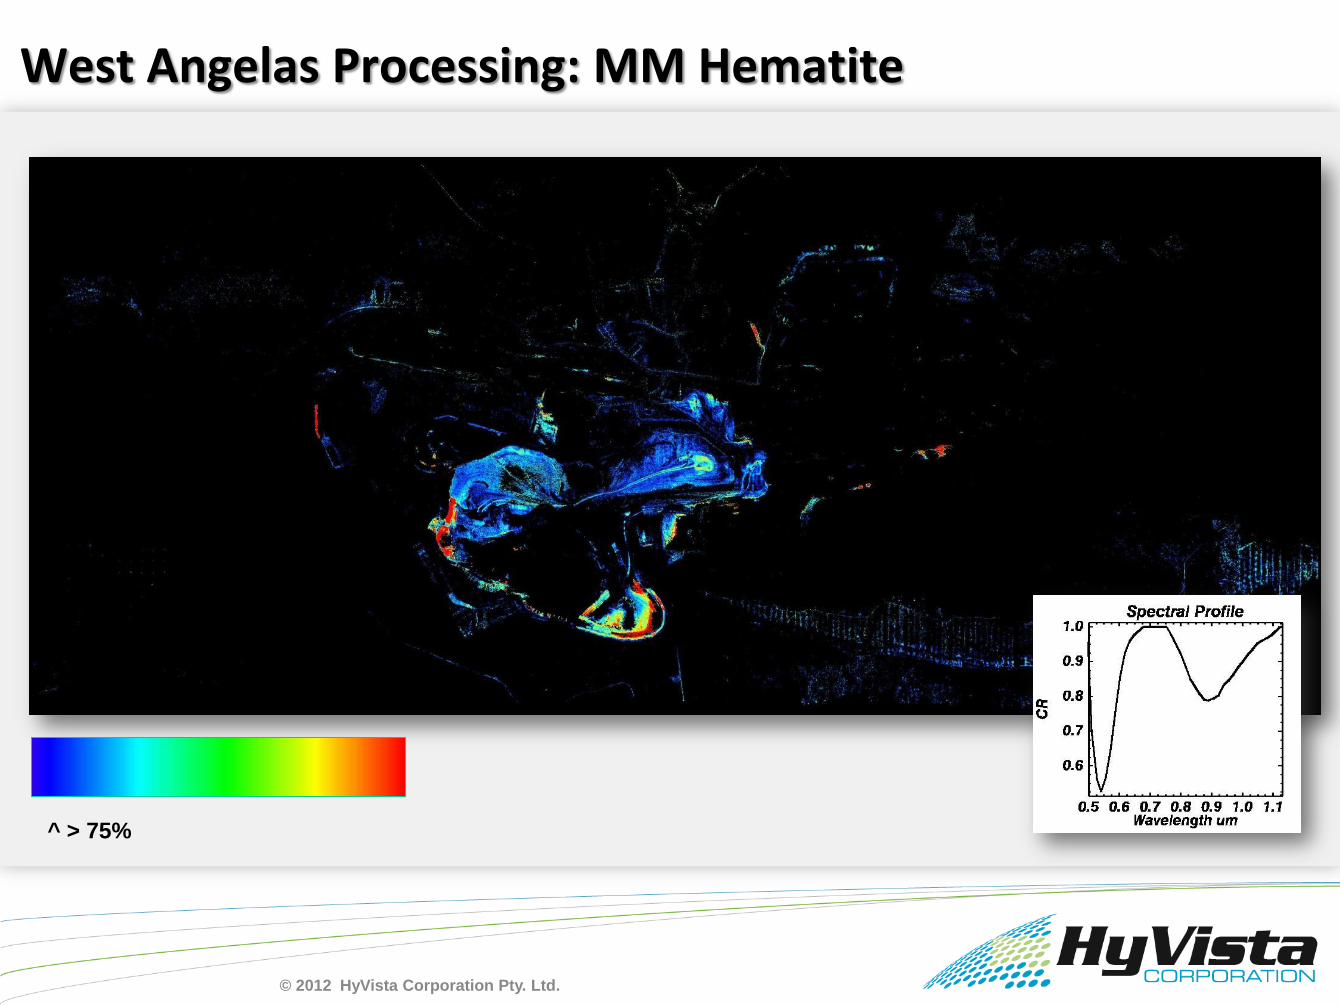
^ > 75%
West Angelas Processing: MM Hematite
© 2012 HyVista Corporation Pty. Ltd.

^ > 24%
West Angelas Processing: MM Goethite
© 2012 HyVista Corporation Pty. Ltd.

^ 60> %
West Angelas Processing: MM Kaolinite & Muscovite
© 2012 HyVista Corporation Pty. Ltd.
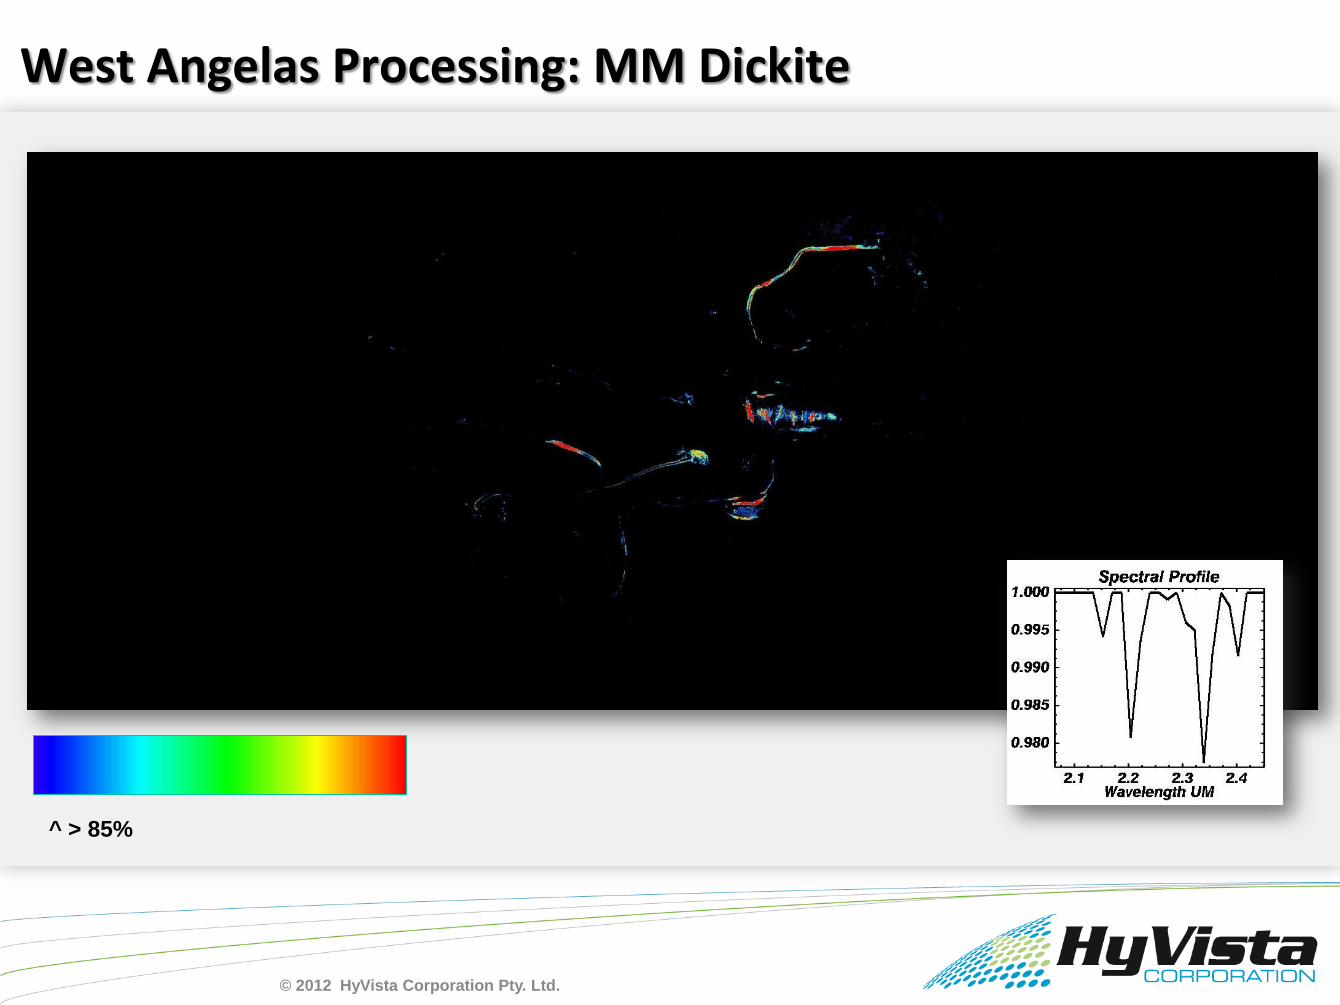
^ > 85%
West Angelas Processing: MM Dickite
© 2012 HyVista Corporation Pty. Ltd.

^ 84> %
West Angelas Processing: MM Chlorite
© 2012 HyVista Corporation Pty. Ltd.

West Angelas Processing: MM RGB Goe-Hem-Epi
© 2012 HyVista Corporation Pty. Ltd.

West Angelas Processing: MM RC RGB
© 2012 HyVista Corporation Pty. Ltd.
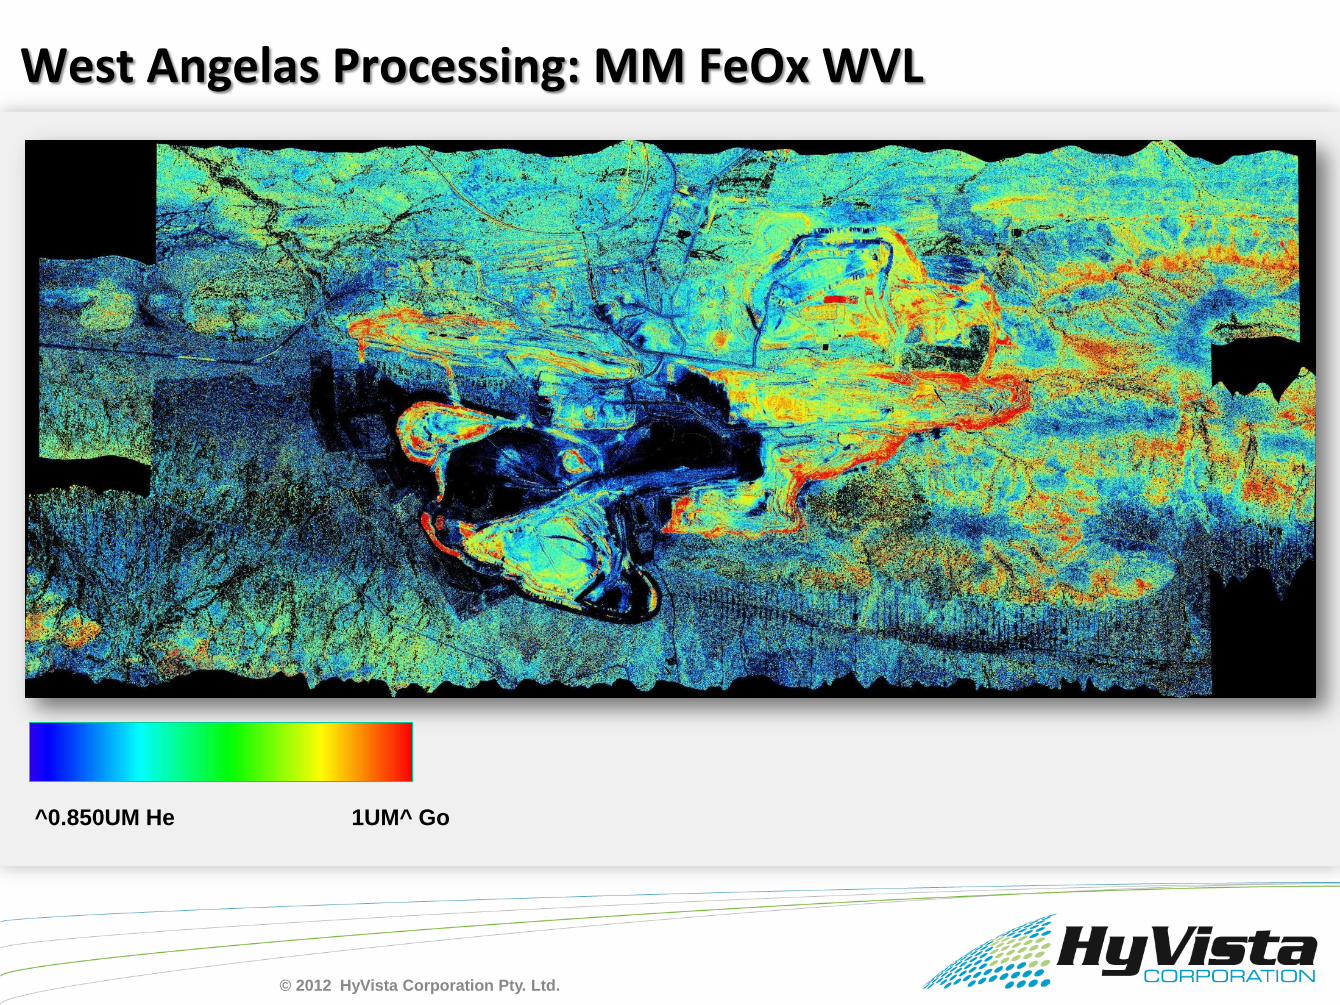
^0.850UM He 1UM^ Go
West Angelas Processing: MM FeOx WVL
© 2012 HyVista Corporation Pty. Ltd.
HyMap Hyperspectral Surveys for Mineral Exploration
END
HyVista Corporation
11/10 Gladstone Rd., Castle Hill, NSW, AUSTRALIA
www.hyvista.com
Recommended