C A R B O N 7 0 ( 2 0 1 4 ) 1 3 0 – 1 4 1
.sc iencedi rect .com
Avai lab le at wwwScienceDirect
journal homepage: www.elsev ier .com/ locate /carbon
Hydrothermal synthesis and activation ofgraphene-incorporated nitrogen-rich carboncomposite for high-performance supercapacitors
0008-6223/$ - see front matter � 2014 Elsevier Ltd. All rights reserved.http://dx.doi.org/10.1016/j.carbon.2013.12.081
* Corresponding author.E-mail address: [email protected] (J. Qiu).
Xiaoming Fan, Chang Yu, Juan Yang, Zheng Ling, Jieshan Qiu *
Carbon Research Laboratory, Liaoning Key Lab for Energy Materials and Chemical Engineering, State Key Lab of Fine Chemicals,
Dalian University of Technology, Dalian 116024, PR China
A R T I C L E I N F O
Article history:
Received 3 October 2013
Accepted 25 December 2013
Available online 8 January 2014
A B S T R A C T
Graphene-incorporated nitrogen-rich carbon composite with nitrogen content of ca.
10 wt.% has been synthesized by an effective yet simple hydrothermal reaction of glucosa-
mine in the presence of graphene oxide (GO). The nitrogen content of carbon composite is
nearly twice as high as that of hydrothermal carbon without graphene. GO is favorable for
the high nitrogen doping in the carbon composite by the reaction between the glucosa-
mine-released ammonia and GO. The hydrothermal carbon composite is further activated
by KOH, and graphene in the activated carbon composite demonstrates a positive effect of
increasing specific surface area, pore volume and electrical conductivity, resulting in supe-
rior electrochemical performance. The activated carbon composite with higher specific sur-
face area and micropore volume possesses higher specific capacitance with a value of
300 F g�1 at 0.1 A g�1 in 6 M KOH aqueous solution in the two electrode cell. Larger meso-
pore volume and higher conductivity of the activated carbon composite will provide fast
ion and electron transfer, thus leading to higher rate capacity with a capacitance retention
of 76% at 8 A g�1 in comparison to the activated hydrothermal carbon without graphene.
� 2014 Elsevier Ltd. All rights reserved.
1. Introduction
Carbon electrode materials for supercapacitors have been
studied extensively in past decades due to their low cost, high
surface area, excellent electrochemical stability and electrical
conductivity [1–3]. Capacitive behavior on the carbon based
supercapacitors can be mainly classified into electrical dou-
ble-layer capacitance, which arises from the electrostatic
attraction between ions and the charged surface of carbon
electrode. However, these pure carbon-based electrical
double-layer capacitors (EDLC) cannot meet the requirements
in high energy storage field. An efficient approach to solve
this problem is to incorporate heteroatoms into carbon
materials to enhance the capacitance, in which additional
contributions derived from pseudocapacitance associated
with Faradaic charge transfer reactions between the heteroat-
oms and the electrolytes are present. It has been found that
heteroatom dopants such as oxygen, nitrogen, boron, phos-
phorus and sulfur can improve the capacitance to a certain
degree [4–12]. Of these available dopants, nitrogen doping
has attracted much attention and shows a significant
improvement for higher energy storage ability. Nitrogen spe-
cies in the carbon materials can not only act as an electron
donor due to its five valence electrons which result in a
shift of the Fermi level to the valence band but also introduce
functional groups containing nitrogen and oxygen atoms
[13–16]. Moreover, the combined and positive effects of nitro-
gen and oxygen containing groups on the electrochemical
C A R B O N 7 0 ( 2 0 1 4 ) 1 3 0 – 1 4 1 131
performance are also present in the microporous activated
carbon electrode for supercapacitors [5].
Functional carbon materials can be synthesized using vari-
ous carbon-containing sources such as hydrocarbon, polymer,
biomass and so on. From the point of view of sustainable chem-
istry, biomass and its derivatives are considered as one of highly
potential candidates for the production of functional carbon
materials. To convert biomass to nanostructured carbon, hydro-
thermal carbonization has been considered as an efficient
method operated in an environmentally friendly process
[17,18]. Nitrogen-containing hydrothermal carbons (HTCs) have
been prepared from different types of biomasses or derivatives
such as chitin, chitosan, glucosamine (GA), microalgae and so
on [19–21]. Moreover, the nitrogen-free biomass and nitrogen-
containing molecules such as ovalbumin, glycine, and ethy-
lenediamine are also employed to fabricate nitrogen-containing
HTCs [22–24]. It has also been demonstrated that HTCs are rich
in oxygen groups and the oxygen content can be tuned by dif-
ferent operating conditions. With this in mind, HTCs have been
considered as a promising candidate of electrode materials for
supercapacitors. Titirici et al. recently found that GA-derived
nitrogen-containing HTCs chemically activated by KOH exhib-
ited superior performance in supercapacitors [25]. Interestingly,
HTCs with the networks of uniformly distributed oxygen-con-
taining groups can be efficiently transformed into microporous
carbons with the optimum pore size distribution by chemically
activation. The activated carbon materials from natural poly-
saccharides-derived HTCs exhibited excellent potential for sup-
ercapacitor applications with rather high specific capacitance
and rapid charging–discharging capability [26].
Graphene is a two dimensional carbon material with
high surface area, electrical conductivity, mechanical
strength and chemical stability, and considered as a prom-
ising candidate of electrode materials for supercapacitors
[27,28]. Graphene has also been used as an additive in
the activated carbon, mesoporous carbon, carbon nanofiber
to improve their electrochemical performance in superca-
pacitors [29–32]. Chen et al. also reported porous graph-
ene-based bulk materials produced by KOH activation of
the sucrose-derived HTCs and graphene composite. Graph-
ene in the graphene-based bulk materials is in favor of
increasing their surface area and electrical conductivity,
resulting in superior supercapacitve performance in the io-
nic liquid electrolyte [33]. Nevertheless, few work has been
reported to investigate the role of graphene oxide (GO) as
an additive in the hydrothermal reaction of nitrogen-con-
taining carbohydrate.
Herein, we report an effective yet simple hydrothermal
method to fabricate nitrogen-rich graphene-incorporated
HTC (GHTC) using GA as a nitrogen-containing carbohy-
drate precursor (Fig. S1). GO is in favor of increasing the
nitrogen content of the GHTC (ca. 10 wt.%) to a great degree
in the hydrothermal process. The HTC and GHTC were fur-
ther activated by KOH, and the electrochemical perfor-
mance of the activated products as electrode materials
for supercapacitors was investigated. It was found that
graphene demonstrates a positive effect of increasing the
surface area, pore volume and electrical conductivity of
the activated GHTC, leading to high specific capacitance
and rate capacity.
2. Experimental
2.1. Sample preparation
2.1.1. Synthesis of the HTC and GHTCGO was prepared according a modified Hummers method
which has been described in the previous reports [34–36].
The GHTC composite was synthesized by a hydrothermal
method, the details of which are described below. A 30 mL
GO solution (3 mg mL�1) was mixed with a solution which
contained 8 g GA hydrochloride (C6H13NO5ÆHCl) dissolved in
60 mL deionized water. The pH of the reaction system was ad-
justed to 11 with NaOH aqueous solution to obtain well-
dispersed mixture [37], and then the mixture was transferred
to a Teflon autoclave and treated at 180 �C for 12 h. After cool-
ing, the product was washed with deionized water and dried
at 80 �C. For comparison, the nitrogen-doped HTC without
graphene was also prepared by directly hydrothermal treat-
ment of GA at 180 �C for 12 h.
2.1.2. Activation of the HTC and GHTC by KOHThe HTC and GHTC samples were activated by KOH at 600 �Cfor 4 h in a nitrogen atmosphere with a mass ratio of KOH to
carbonaceous materials 2:1. The as-obtained products were
then treated with diluted hydrochloric acid and deionized
water and then dried at 80 �C overnight. The activated sam-
ples were denoted as HTC-a and GHTC-a, respectively.
2.2. Characterization methods
Morphologies and microstructures of samples before and
after KOH activation were observed by field emission scan-
ning electron microscopy (FESEM) (FEI NOVA NanoSEM 450)
at 3 kV and transmission electron microscopy (TEM) (FEI Tec-
nai G220 and TF30). Specific surface area and pore size distri-
bution were calculated based on the data recorded on
physical sorption instrument (Micromeritics ASAP 2020).
The samples were degassed at 150 �C prior to nitrogen sorp-
tion measurement. Element compositions were measured
using Elementar varioEL III. The data of X-ray photoelectron
spectroscopy were collected on Thermo ESCALAB 250. The
electrical conductivities were calculated according the results
measured by the four-probe method using a S-2A four-probe
station and Keithley 2400 Sourcemeter.
2.3. Electrochemical measurements
Active materials and binder poly(tetrafluoroethylene) with
the mass ratio of 95:5 pressed onto the nickel foam were used
as the working electrode. Hg/HgO electrode and Pt foil elec-
trode were used as reference electrode and counter electrode,
respectively. Working electrodes mentioned above with the
same mass were symmetrically assembled to two electrode
cell. Cyclic voltammetry was carried out using a CHI 660D
(Shanghai Chenhua, China) electrochemical workstation in
a three electrode cell with 6 M KOH as electrolyte solution.
Galvanostatic charge–discharge profiles and electrochemical
impedance spectroscopy were also recorded in a two elec-
trode cell with 6 M KOH as electrolyte solution using a CHI
132 C A R B O N 7 0 ( 2 0 1 4 ) 1 3 0 – 1 4 1
660D electrochemical workstation. Gravimetric specific
capacitances of the cells Ccell were calculated at different cur-
rent densities according to galvanostatic charge/discharge
profiles based on the following equations:
Ccell ¼I
mtotal � ðdv=dtÞ ð1Þ
where Ccell is the specific capacitance of the two electrode
cell, I is the discharge current, dv/dt is the average slope of
the discharge curve, and mtotal is the total mass of active
materials in the two electrode cell. The specific capacitance
of single electrode could be obtained by multiplying the Ccell
by four. Energy density and power density of the cells were
calculated based on the following equations:
Ecell ¼Ccell � DV2 � 1000
2� 3600ð2Þ
Pcell ¼Ecell
Dt� 3600 ð3Þ
where Ecell and Pcell are the energy density and power density
of two electrode cell, respectively, DV is the voltage window
from the end of IR drop to the end of discharge and Dt is
the discharge time. Galvanostatic cycling was performed by
1000 cycles at the current density of 1 A g�1.
3. Results and discussion
3.1. Enhanced nitrogen doping in GHTC composite
Great changes occur during the hydrothermal reaction of GA
in the presence of a small amount of GO, in which GA was
transformed to carbonaceous materials and GO was reduced
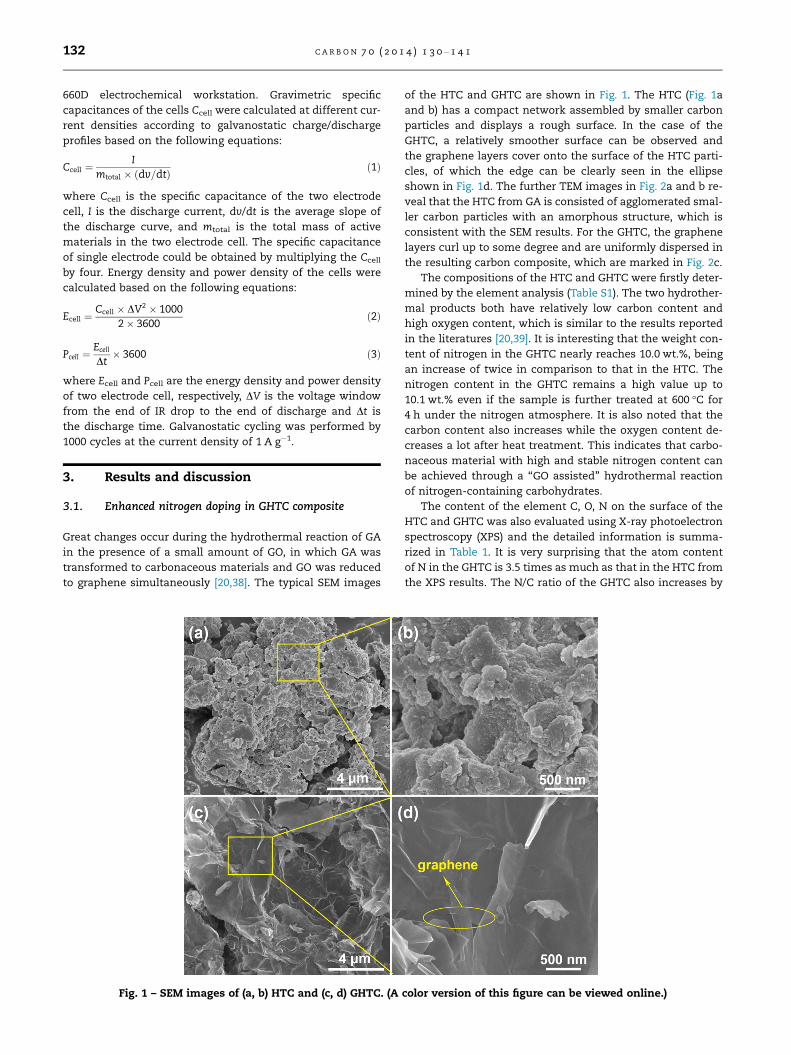
to graphene simultaneously [20,38]. The typical SEM images
Fig. 1 – SEM images of (a, b) HTC and (c, d) GHTC. (A
of the HTC and GHTC are shown in Fig. 1. The HTC (Fig. 1a
and b) has a compact network assembled by smaller carbon
particles and displays a rough surface. In the case of the
GHTC, a relatively smoother surface can be observed and
the graphene layers cover onto the surface of the HTC parti-
cles, of which the edge can be clearly seen in the ellipse
shown in Fig. 1d. The further TEM images in Fig. 2a and b re-
veal that the HTC from GA is consisted of agglomerated smal-
ler carbon particles with an amorphous structure, which is
consistent with the SEM results. For the GHTC, the graphene
layers curl up to some degree and are uniformly dispersed in
the resulting carbon composite, which are marked in Fig. 2c.
The compositions of the HTC and GHTC were firstly deter-
mined by the element analysis (Table S1). The two hydrother-
mal products both have relatively low carbon content and
high oxygen content, which is similar to the results reported
in the literatures [20,39]. It is interesting that the weight con-
tent of nitrogen in the GHTC nearly reaches 10.0 wt.%, being
an increase of twice in comparison to that in the HTC. The
nitrogen content in the GHTC remains a high value up to
10.1 wt.% even if the sample is further treated at 600 �C for
4 h under the nitrogen atmosphere. It is also noted that the
carbon content also increases while the oxygen content de-
creases a lot after heat treatment. This indicates that carbo-
naceous material with high and stable nitrogen content can
be achieved through a ‘‘GO assisted’’ hydrothermal reaction
of nitrogen-containing carbohydrates.
The content of the element C, O, N on the surface of the
HTC and GHTC was also evaluated using X-ray photoelectron
spectroscopy (XPS) and the detailed information is summa-
rized in Table 1. It is very surprising that the atom content
of N in the GHTC is 3.5 times as much as that in the HTC from
the XPS results. The N/C ratio of the GHTC also increases by
color version of this figure can be viewed online.)
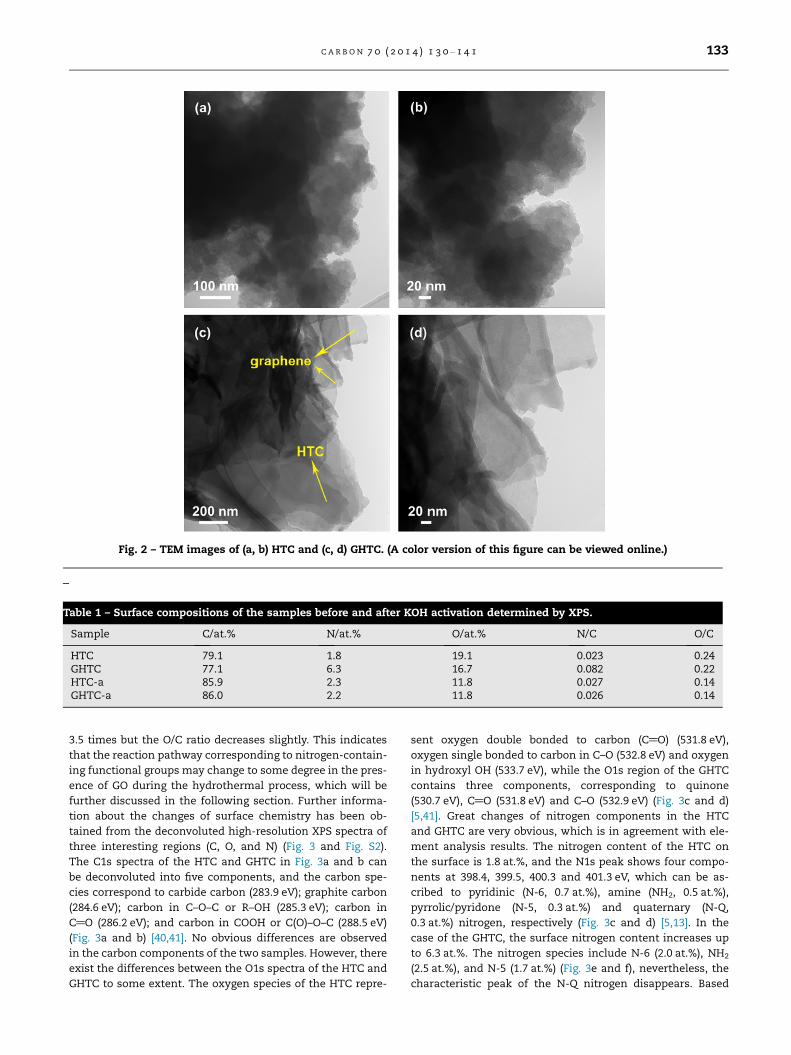
Table 1 – Surface compositions of the samples before and after KOH activation determined by XPS.
Sample C/at.% N/at.% O/at.% N/C O/C
HTC 79.1 1.8 19.1 0.023 0.24GHTC 77.1 6.3 16.7 0.082 0.22HTC-a 85.9 2.3 11.8 0.027 0.14GHTC-a 86.0 2.2 11.8 0.026 0.14
Fig. 2 – TEM images of (a, b) HTC and (c, d) GHTC. (A color version of this figure can be viewed online.)
C A R B O N 7 0 ( 2 0 1 4 ) 1 3 0 – 1 4 1 133
3.5 times but the O/C ratio decreases slightly. This indicates
that the reaction pathway corresponding to nitrogen-contain-
ing functional groups may change to some degree in the pres-
ence of GO during the hydrothermal process, which will be
further discussed in the following section. Further informa-
tion about the changes of surface chemistry has been ob-
tained from the deconvoluted high-resolution XPS spectra of
three interesting regions (C, O, and N) (Fig. 3 and Fig. S2).
The C1s spectra of the HTC and GHTC in Fig. 3a and b can
be deconvoluted into five components, and the carbon spe-
cies correspond to carbide carbon (283.9 eV); graphite carbon
(284.6 eV); carbon in C–O–C or R–OH (285.3 eV); carbon in
C@O (286.2 eV); and carbon in COOH or C(O)–O–C (288.5 eV)
(Fig. 3a and b) [40,41]. No obvious differences are observed
in the carbon components of the two samples. However, there
exist the differences between the O1s spectra of the HTC and
GHTC to some extent. The oxygen species of the HTC repre-
sent oxygen double bonded to carbon (C@O) (531.8 eV),
oxygen single bonded to carbon in C–O (532.8 eV) and oxygen
in hydroxyl OH (533.7 eV), while the O1s region of the GHTC
contains three components, corresponding to quinone
(530.7 eV), C@O (531.8 eV) and C–O (532.9 eV) (Fig. 3c and d)
[5,41]. Great changes of nitrogen components in the HTC
and GHTC are very obvious, which is in agreement with ele-
ment analysis results. The nitrogen content of the HTC on
the surface is 1.8 at.%, and the N1s peak shows four compo-
nents at 398.4, 399.5, 400.3 and 401.3 eV, which can be as-
cribed to pyridinic (N-6, 0.7 at.%), amine (NH2, 0.5 at.%),
pyrrolic/pyridone (N-5, 0.3 at.%) and quaternary (N-Q,
0.3 at.%) nitrogen, respectively (Fig. 3c and d) [5,13]. In the
case of the GHTC, the surface nitrogen content increases up
to 6.3 at.%. The nitrogen species include N-6 (2.0 at.%), NH2
(2.5 at.%), and N-5 (1.7 at.%) (Fig. 3e and f), nevertheless, the
characteristic peak of the N-Q nitrogen disappears. Based
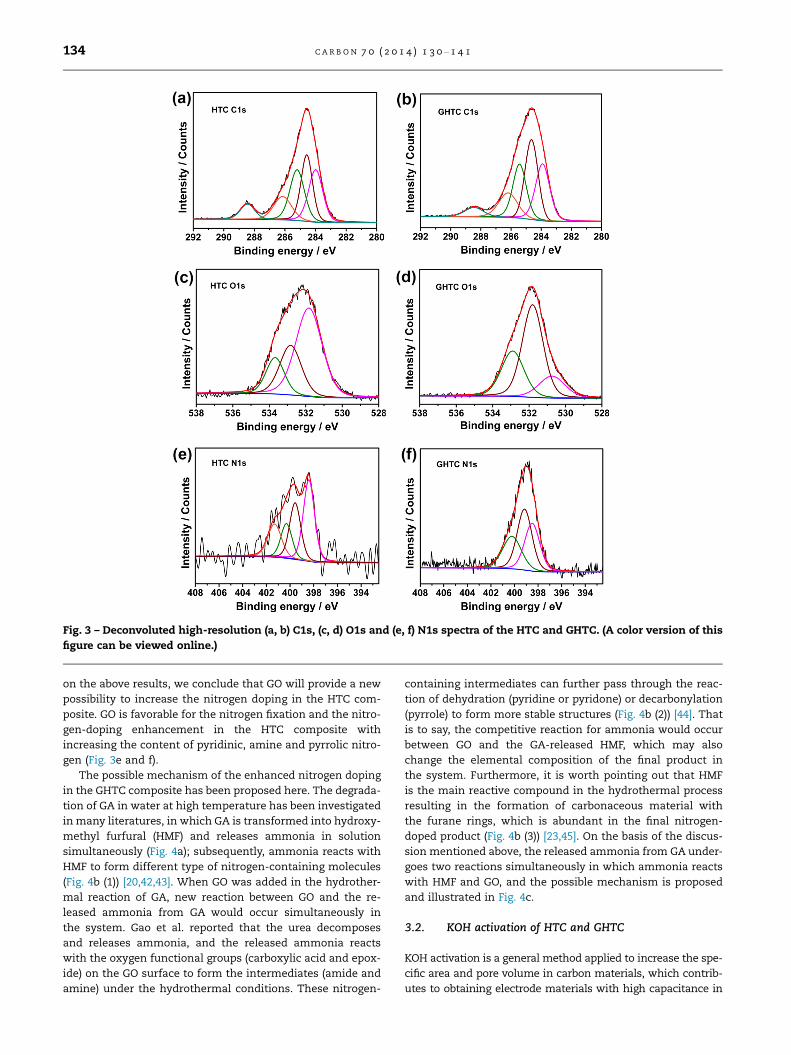
Fig. 3 – Deconvoluted high-resolution (a, b) C1s, (c, d) O1s and (e, f) N1s spectra of the HTC and GHTC. (A color version of this
figure can be viewed online.)
134 C A R B O N 7 0 ( 2 0 1 4 ) 1 3 0 – 1 4 1
on the above results, we conclude that GO will provide a new
possibility to increase the nitrogen doping in the HTC com-
posite. GO is favorable for the nitrogen fixation and the nitro-
gen-doping enhancement in the HTC composite with
increasing the content of pyridinic, amine and pyrrolic nitro-
gen (Fig. 3e and f).
The possible mechanism of the enhanced nitrogen doping
in the GHTC composite has been proposed here. The degrada-
tion of GA in water at high temperature has been investigated
in many literatures, in which GA is transformed into hydroxy-
methyl furfural (HMF) and releases ammonia in solution
simultaneously (Fig. 4a); subsequently, ammonia reacts with
HMF to form different type of nitrogen-containing molecules
(Fig. 4b (1)) [20,42,43]. When GO was added in the hydrother-
mal reaction of GA, new reaction between GO and the re-
leased ammonia from GA would occur simultaneously in
the system. Gao et al. reported that the urea decomposes
and releases ammonia, and the released ammonia reacts
with the oxygen functional groups (carboxylic acid and epox-
ide) on the GO surface to form the intermediates (amide and
amine) under the hydrothermal conditions. These nitrogen-
containing intermediates can further pass through the reac-
tion of dehydration (pyridine or pyridone) or decarbonylation
(pyrrole) to form more stable structures (Fig. 4b (2)) [44]. That
is to say, the competitive reaction for ammonia would occur
between GO and the GA-released HMF, which may also
change the elemental composition of the final product in
the system. Furthermore, it is worth pointing out that HMF
is the main reactive compound in the hydrothermal process
resulting in the formation of carbonaceous material with
the furane rings, which is abundant in the final nitrogen-
doped product (Fig. 4b (3)) [23,45]. On the basis of the discus-
sion mentioned above, the released ammonia from GA under-
goes two reactions simultaneously in which ammonia reacts
with HMF and GO, and the possible mechanism is proposed
and illustrated in Fig. 4c.
3.2. KOH activation of HTC and GHTC
KOH activation is a general method applied to increase the spe-
cific area and pore volume in carbon materials, which contrib-
utes to obtaining electrode materials with high capacitance in
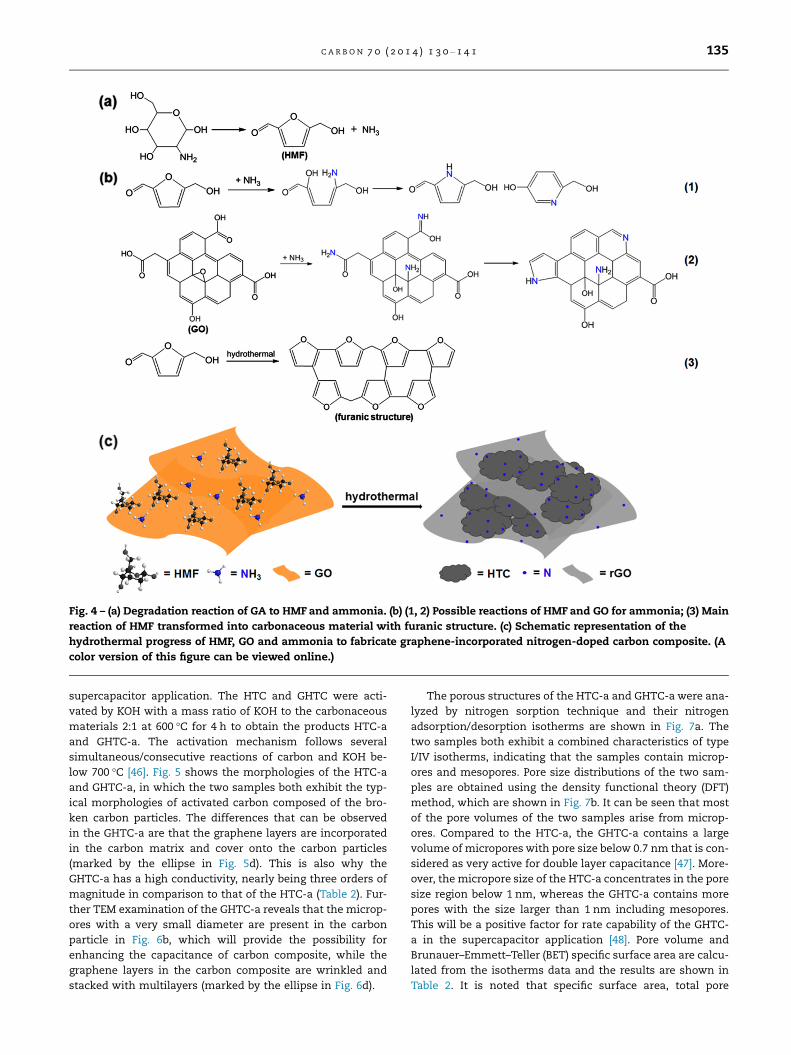
Fig. 4 – (a) Degradation reaction of GA to HMF and ammonia. (b) (1, 2) Possible reactions of HMF and GO for ammonia; (3) Main
reaction of HMF transformed into carbonaceous material with furanic structure. (c) Schematic representation of the
hydrothermal progress of HMF, GO and ammonia to fabricate graphene-incorporated nitrogen-doped carbon composite. (A
color version of this figure can be viewed online.)
C A R B O N 7 0 ( 2 0 1 4 ) 1 3 0 – 1 4 1 135
supercapacitor application. The HTC and GHTC were acti-
vated by KOH with a mass ratio of KOH to the carbonaceous
materials 2:1 at 600 �C for 4 h to obtain the products HTC-a
and GHTC-a. The activation mechanism follows several
simultaneous/consecutive reactions of carbon and KOH be-
low 700 �C [46]. Fig. 5 shows the morphologies of the HTC-a
and GHTC-a, in which the two samples both exhibit the typ-
ical morphologies of activated carbon composed of the bro-
ken carbon particles. The differences that can be observed
in the GHTC-a are that the graphene layers are incorporated
in the carbon matrix and cover onto the carbon particles
(marked by the ellipse in Fig. 5d). This is also why the
GHTC-a has a high conductivity, nearly being three orders of
magnitude in comparison to that of the HTC-a (Table 2). Fur-
ther TEM examination of the GHTC-a reveals that the microp-
ores with a very small diameter are present in the carbon
particle in Fig. 6b, which will provide the possibility for
enhancing the capacitance of carbon composite, while the
graphene layers in the carbon composite are wrinkled and
stacked with multilayers (marked by the ellipse in Fig. 6d).
The porous structures of the HTC-a and GHTC-a were ana-
lyzed by nitrogen sorption technique and their nitrogen
adsorption/desorption isotherms are shown in Fig. 7a. The
two samples both exhibit a combined characteristics of type
I/IV isotherms, indicating that the samples contain microp-
ores and mesopores. Pore size distributions of the two sam-
ples are obtained using the density functional theory (DFT)
method, which are shown in Fig. 7b. It can be seen that most
of the pore volumes of the two samples arise from microp-
ores. Compared to the HTC-a, the GHTC-a contains a large
volume of micropores with pore size below 0.7 nm that is con-
sidered as very active for double layer capacitance [47]. More-
over, the micropore size of the HTC-a concentrates in the pore
size region below 1 nm, whereas the GHTC-a contains more
pores with the size larger than 1 nm including mesopores.
This will be a positive factor for rate capability of the GHTC-
a in the supercapacitor application [48]. Pore volume and
Brunauer–Emmett–Teller (BET) specific surface area are calcu-
lated from the isotherms data and the results are shown in
Table 2. It is noted that specific surface area, total pore
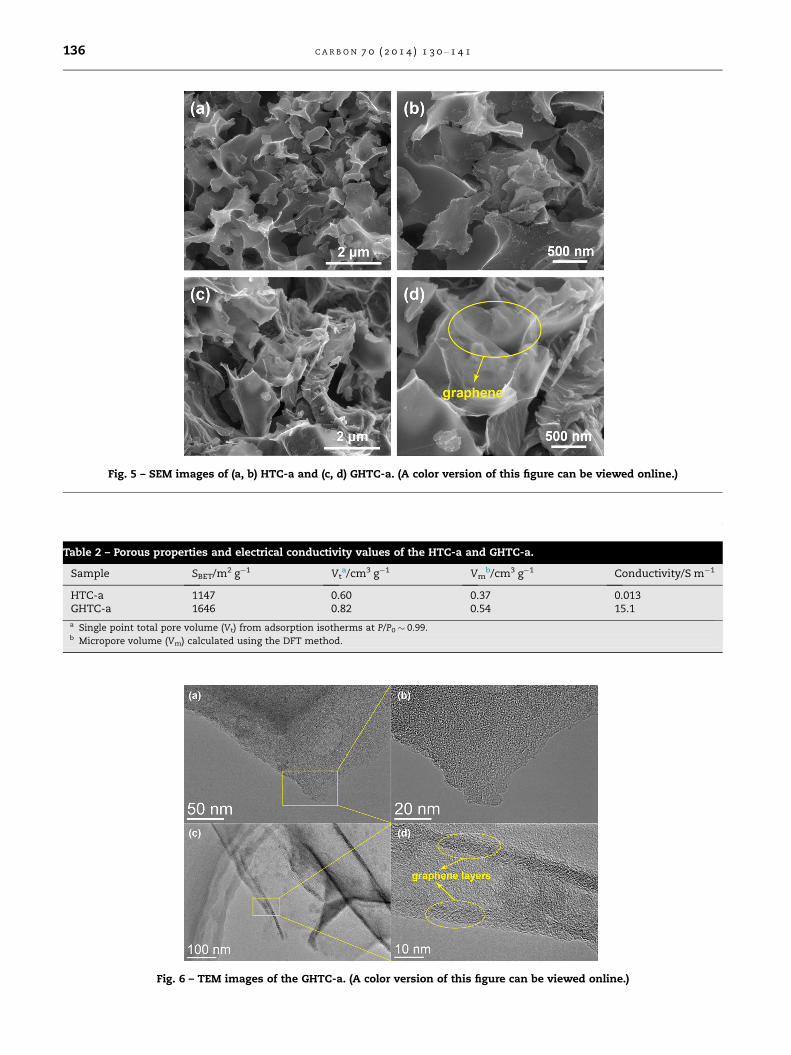
Fig. 5 – SEM images of (a, b) HTC-a and (c, d) GHTC-a. (A color version of this figure can be viewed online.)
Fig. 6 – TEM images of the GHTC-a. (A color version of this figure can be viewed online.)
Table 2 – Porous properties and electrical conductivity values of the HTC-a and GHTC-a.
Sample SBET/m2 g�1 Vta/cm3 g�1 Vm
b/cm3 g�1 Conductivity/S m�1
HTC-a 1147 0.60 0.37 0.013GHTC-a 1646 0.82 0.54 15.1a Single point total pore volume (Vt) from adsorption isotherms at P/P0 � 0.99.b Micropore volume (Vm) calculated using the DFT method.
136 C A R B O N 7 0 ( 2 0 1 4 ) 1 3 0 – 1 4 1
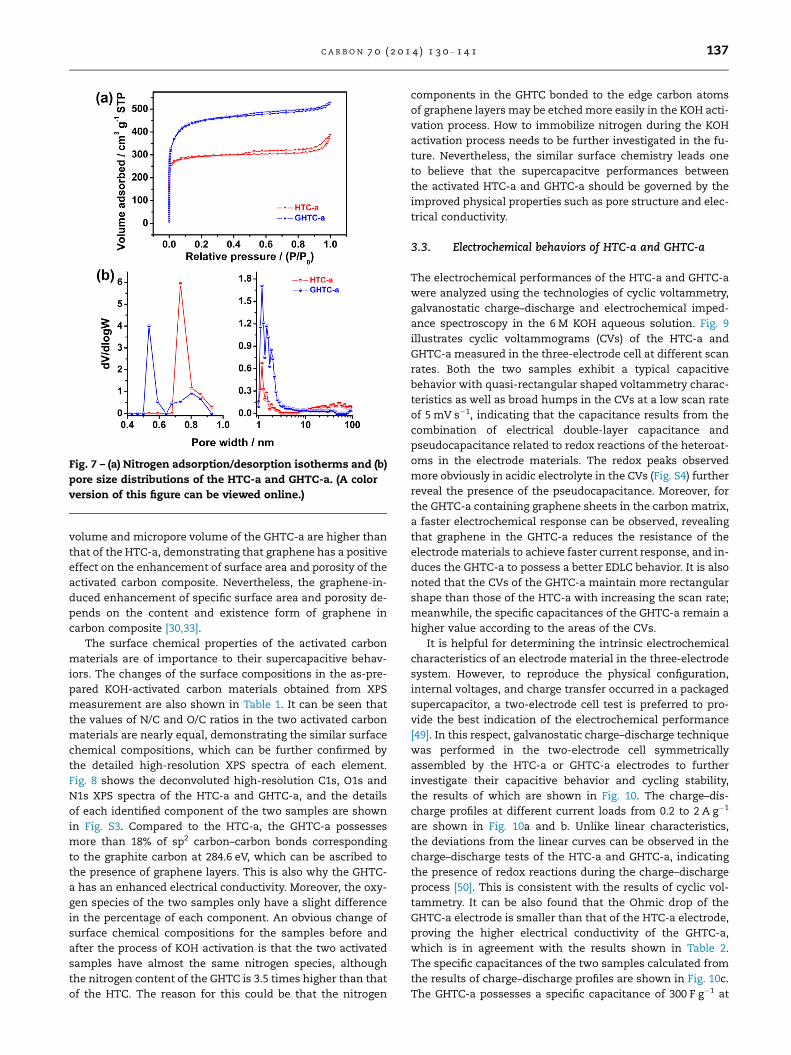
Fig. 7 – (a) Nitrogen adsorption/desorption isotherms and (b)
pore size distributions of the HTC-a and GHTC-a. (A color
version of this figure can be viewed online.)
C A R B O N 7 0 ( 2 0 1 4 ) 1 3 0 – 1 4 1 137
volume and micropore volume of the GHTC-a are higher than
that of the HTC-a, demonstrating that graphene has a positive
effect on the enhancement of surface area and porosity of the
activated carbon composite. Nevertheless, the graphene-in-
duced enhancement of specific surface area and porosity de-
pends on the content and existence form of graphene in
carbon composite [30,33].
The surface chemical properties of the activated carbon
materials are of importance to their supercapacitive behav-
iors. The changes of the surface compositions in the as-pre-
pared KOH-activated carbon materials obtained from XPS
measurement are also shown in Table 1. It can be seen that
the values of N/C and O/C ratios in the two activated carbon
materials are nearly equal, demonstrating the similar surface
chemical compositions, which can be further confirmed by
the detailed high-resolution XPS spectra of each element.
Fig. 8 shows the deconvoluted high-resolution C1s, O1s and
N1s XPS spectra of the HTC-a and GHTC-a, and the details
of each identified component of the two samples are shown
in Fig. S3. Compared to the HTC-a, the GHTC-a possesses
more than 18% of sp2 carbon–carbon bonds corresponding
to the graphite carbon at 284.6 eV, which can be ascribed to
the presence of graphene layers. This is also why the GHTC-
a has an enhanced electrical conductivity. Moreover, the oxy-
gen species of the two samples only have a slight difference
in the percentage of each component. An obvious change of
surface chemical compositions for the samples before and
after the process of KOH activation is that the two activated
samples have almost the same nitrogen species, although
the nitrogen content of the GHTC is 3.5 times higher than that
of the HTC. The reason for this could be that the nitrogen
components in the GHTC bonded to the edge carbon atoms
of graphene layers may be etched more easily in the KOH acti-
vation process. How to immobilize nitrogen during the KOH
activation process needs to be further investigated in the fu-
ture. Nevertheless, the similar surface chemistry leads one
to believe that the supercapacitve performances between
the activated HTC-a and GHTC-a should be governed by the
improved physical properties such as pore structure and elec-
trical conductivity.
3.3. Electrochemical behaviors of HTC-a and GHTC-a
The electrochemical performances of the HTC-a and GHTC-a
were analyzed using the technologies of cyclic voltammetry,
galvanostatic charge–discharge and electrochemical imped-
ance spectroscopy in the 6 M KOH aqueous solution. Fig. 9
illustrates cyclic voltammograms (CVs) of the HTC-a and
GHTC-a measured in the three-electrode cell at different scan
rates. Both the two samples exhibit a typical capacitive
behavior with quasi-rectangular shaped voltammetry charac-
teristics as well as broad humps in the CVs at a low scan rate
of 5 mV s�1, indicating that the capacitance results from the
combination of electrical double-layer capacitance and
pseudocapacitance related to redox reactions of the heteroat-
oms in the electrode materials. The redox peaks observed
more obviously in acidic electrolyte in the CVs (Fig. S4) further
reveal the presence of the pseudocapacitance. Moreover, for
the GHTC-a containing graphene sheets in the carbon matrix,
a faster electrochemical response can be observed, revealing
that graphene in the GHTC-a reduces the resistance of the
electrode materials to achieve faster current response, and in-
duces the GHTC-a to possess a better EDLC behavior. It is also
noted that the CVs of the GHTC-a maintain more rectangular
shape than those of the HTC-a with increasing the scan rate;
meanwhile, the specific capacitances of the GHTC-a remain a
higher value according to the areas of the CVs.
It is helpful for determining the intrinsic electrochemical
characteristics of an electrode material in the three-electrode
system. However, to reproduce the physical configuration,
internal voltages, and charge transfer occurred in a packaged
supercapacitor, a two-electrode cell test is preferred to pro-
vide the best indication of the electrochemical performance
[49]. In this respect, galvanostatic charge–discharge technique
was performed in the two-electrode cell symmetrically
assembled by the HTC-a or GHTC-a electrodes to further
investigate their capacitive behavior and cycling stability,
the results of which are shown in Fig. 10. The charge–dis-
charge profiles at different current loads from 0.2 to 2 A g�1
are shown in Fig. 10a and b. Unlike linear characteristics,
the deviations from the linear curves can be observed in the
charge–discharge tests of the HTC-a and GHTC-a, indicating
the presence of redox reactions during the charge–discharge
process [50]. This is consistent with the results of cyclic vol-
tammetry. It can be also found that the Ohmic drop of the
GHTC-a electrode is smaller than that of the HTC-a electrode,
proving the higher electrical conductivity of the GHTC-a,
which is in agreement with the results shown in Table 2.
The specific capacitances of the two samples calculated from
the results of charge–discharge profiles are shown in Fig. 10c.
The GHTC-a possesses a specific capacitance of 300 F g�1 at
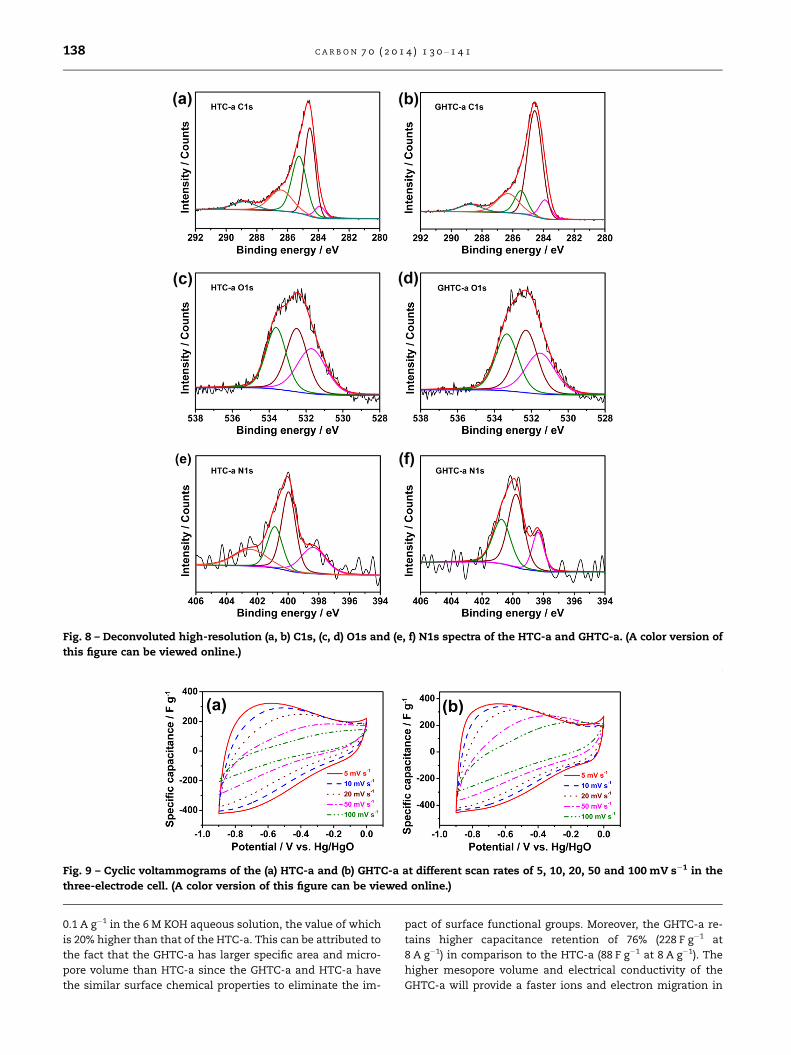
Fig. 8 – Deconvoluted high-resolution (a, b) C1s, (c, d) O1s and (e, f) N1s spectra of the HTC-a and GHTC-a. (A color version of
this figure can be viewed online.)
Fig. 9 – Cyclic voltammograms of the (a) HTC-a and (b) GHTC-a at different scan rates of 5, 10, 20, 50 and 100 mV s�1 in the
three-electrode cell. (A color version of this figure can be viewed online.)
138 C A R B O N 7 0 ( 2 0 1 4 ) 1 3 0 – 1 4 1
0.1 A g�1 in the 6 M KOH aqueous solution, the value of which
is 20% higher than that of the HTC-a. This can be attributed to
the fact that the GHTC-a has larger specific area and micro-
pore volume than HTC-a since the GHTC-a and HTC-a have
the similar surface chemical properties to eliminate the im-
pact of surface functional groups. Moreover, the GHTC-a re-
tains higher capacitance retention of 76% (228 F g�1 at
8 A g�1) in comparison to the HTC-a (88 F g�1 at 8 A g�1). The
higher mesopore volume and electrical conductivity of the
GHTC-a will provide a faster ions and electron migration in
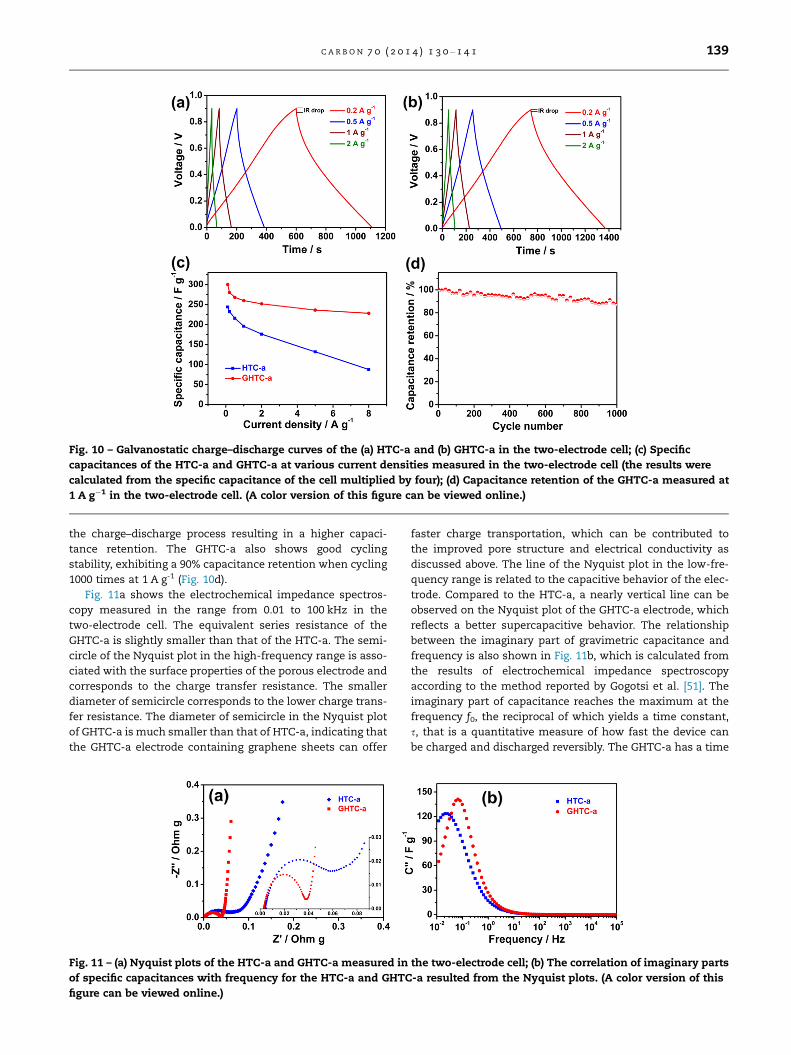
Fig. 10 – Galvanostatic charge–discharge curves of the (a) HTC-a and (b) GHTC-a in the two-electrode cell; (c) Specific
capacitances of the HTC-a and GHTC-a at various current densities measured in the two-electrode cell (the results were
calculated from the specific capacitance of the cell multiplied by four); (d) Capacitance retention of the GHTC-a measured at
1 A g�1 in the two-electrode cell. (A color version of this figure can be viewed online.)
C A R B O N 7 0 ( 2 0 1 4 ) 1 3 0 – 1 4 1 139
the charge–discharge process resulting in a higher capaci-
tance retention. The GHTC-a also shows good cycling
stability, exhibiting a 90% capacitance retention when cycling
1000 times at 1 A g-1 (Fig. 10d).
Fig. 11a shows the electrochemical impedance spectros-
copy measured in the range from 0.01 to 100 kHz in the
two-electrode cell. The equivalent series resistance of the
GHTC-a is slightly smaller than that of the HTC-a. The semi-
circle of the Nyquist plot in the high-frequency range is asso-
ciated with the surface properties of the porous electrode and
corresponds to the charge transfer resistance. The smaller
diameter of semicircle corresponds to the lower charge trans-
fer resistance. The diameter of semicircle in the Nyquist plot
of GHTC-a is much smaller than that of HTC-a, indicating that
the GHTC-a electrode containing graphene sheets can offer
Fig. 11 – (a) Nyquist plots of the HTC-a and GHTC-a measured in
of specific capacitances with frequency for the HTC-a and GHTC
figure can be viewed online.)
faster charge transportation, which can be contributed to
the improved pore structure and electrical conductivity as
discussed above. The line of the Nyquist plot in the low-fre-
quency range is related to the capacitive behavior of the elec-
trode. Compared to the HTC-a, a nearly vertical line can be
observed on the Nyquist plot of the GHTC-a electrode, which
reflects a better supercapacitive behavior. The relationship
between the imaginary part of gravimetric capacitance and
frequency is also shown in Fig. 11b, which is calculated from
the results of electrochemical impedance spectroscopy
according to the method reported by Gogotsi et al. [51]. The
imaginary part of capacitance reaches the maximum at the
frequency f0, the reciprocal of which yields a time constant,
s, that is a quantitative measure of how fast the device can
be charged and discharged reversibly. The GHTC-a has a time
the two-electrode cell; (b) The correlation of imaginary parts
-a resulted from the Nyquist plots. (A color version of this
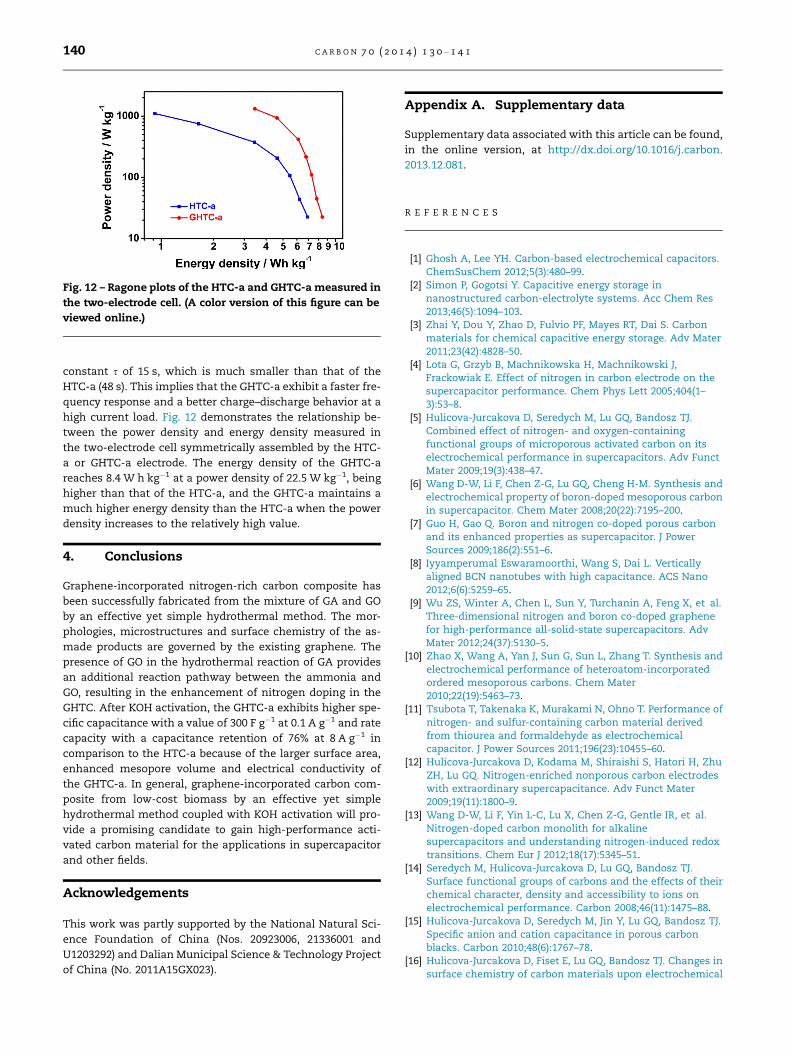
Fig. 12 – Ragone plots of the HTC-a and GHTC-a measured in
the two-electrode cell. (A color version of this figure can be
viewed online.)
140 C A R B O N 7 0 ( 2 0 1 4 ) 1 3 0 – 1 4 1
constant s of 15 s, which is much smaller than that of the
HTC-a (48 s). This implies that the GHTC-a exhibit a faster fre-
quency response and a better charge–discharge behavior at a
high current load. Fig. 12 demonstrates the relationship be-
tween the power density and energy density measured in
the two-electrode cell symmetrically assembled by the HTC-
a or GHTC-a electrode. The energy density of the GHTC-a
reaches 8.4 W h kg�1 at a power density of 22.5 W kg�1, being
higher than that of the HTC-a, and the GHTC-a maintains a
much higher energy density than the HTC-a when the power
density increases to the relatively high value.
4. Conclusions
Graphene-incorporated nitrogen-rich carbon composite has
been successfully fabricated from the mixture of GA and GO
by an effective yet simple hydrothermal method. The mor-
phologies, microstructures and surface chemistry of the as-
made products are governed by the existing graphene. The
presence of GO in the hydrothermal reaction of GA provides
an additional reaction pathway between the ammonia and
GO, resulting in the enhancement of nitrogen doping in the
GHTC. After KOH activation, the GHTC-a exhibits higher spe-
cific capacitance with a value of 300 F g�1 at 0.1 A g�1 and rate
capacity with a capacitance retention of 76% at 8 A g�1 in
comparison to the HTC-a because of the larger surface area,
enhanced mesopore volume and electrical conductivity of
the GHTC-a. In general, graphene-incorporated carbon com-
posite from low-cost biomass by an effective yet simple
hydrothermal method coupled with KOH activation will pro-
vide a promising candidate to gain high-performance acti-
vated carbon material for the applications in supercapacitor
and other fields.
Acknowledgements
This work was partly supported by the National Natural Sci-
ence Foundation of China (Nos. 20923006, 21336001 and
U1203292) and Dalian Municipal Science & Technology Project
of China (No. 2011A15GX023).
Appendix A. Supplementary data
Supplementary data associated with this article can be found,
in the online version, at http://dx.doi.org/10.1016/j.carbon.
2013.12.081.
R E F E R E N C E S
[1] Ghosh A, Lee YH. Carbon-based electrochemical capacitors.ChemSusChem 2012;5(3):480–99.
[2] Simon P, Gogotsi Y. Capacitive energy storage innanostructured carbon-electrolyte systems. Acc Chem Res2013;46(5):1094–103.
[3] Zhai Y, Dou Y, Zhao D, Fulvio PF, Mayes RT, Dai S. Carbonmaterials for chemical capacitive energy storage. Adv Mater2011;23(42):4828–50.
[4] Lota G, Grzyb B, Machnikowska H, Machnikowski J,Frackowiak E. Effect of nitrogen in carbon electrode on thesupercapacitor performance. Chem Phys Lett 2005;404(1–3):53–8.
[5] Hulicova-Jurcakova D, Seredych M, Lu GQ, Bandosz TJ.Combined effect of nitrogen- and oxygen-containingfunctional groups of microporous activated carbon on itselectrochemical performance in supercapacitors. Adv FunctMater 2009;19(3):438–47.
[6] Wang D-W, Li F, Chen Z-G, Lu GQ, Cheng H-M. Synthesis andelectrochemical property of boron-doped mesoporous carbonin supercapacitor. Chem Mater 2008;20(22):7195–200.
[7] Guo H, Gao Q. Boron and nitrogen co-doped porous carbonand its enhanced properties as supercapacitor. J PowerSources 2009;186(2):551–6.
[8] Iyyamperumal Eswaramoorthi, Wang S, Dai L. Verticallyaligned BCN nanotubes with high capacitance. ACS Nano2012;6(6):5259–65.
[9] Wu ZS, Winter A, Chen L, Sun Y, Turchanin A, Feng X, et al.Three-dimensional nitrogen and boron co-doped graphenefor high-performance all-solid-state supercapacitors. AdvMater 2012;24(37):5130–5.
[10] Zhao X, Wang A, Yan J, Sun G, Sun L, Zhang T. Synthesis andelectrochemical performance of heteroatom-incorporatedordered mesoporous carbons. Chem Mater2010;22(19):5463–73.
[11] Tsubota T, Takenaka K, Murakami N, Ohno T. Performance ofnitrogen- and sulfur-containing carbon material derivedfrom thiourea and formaldehyde as electrochemicalcapacitor. J Power Sources 2011;196(23):10455–60.
[12] Hulicova-Jurcakova D, Kodama M, Shiraishi S, Hatori H, ZhuZH, Lu GQ. Nitrogen-enriched nonporous carbon electrodeswith extraordinary supercapacitance. Adv Funct Mater2009;19(11):1800–9.
[13] Wang D-W, Li F, Yin L-C, Lu X, Chen Z-G, Gentle IR, et al.Nitrogen-doped carbon monolith for alkalinesupercapacitors and understanding nitrogen-induced redoxtransitions. Chem Eur J 2012;18(17):5345–51.
[14] Seredych M, Hulicova-Jurcakova D, Lu GQ, Bandosz TJ.Surface functional groups of carbons and the effects of theirchemical character, density and accessibility to ions onelectrochemical performance. Carbon 2008;46(11):1475–88.
[15] Hulicova-Jurcakova D, Seredych M, Jin Y, Lu GQ, Bandosz TJ.Specific anion and cation capacitance in porous carbonblacks. Carbon 2010;48(6):1767–78.
[16] Hulicova-Jurcakova D, Fiset E, Lu GQ, Bandosz TJ. Changes insurface chemistry of carbon materials upon electrochemical
C A R B O N 7 0 ( 2 0 1 4 ) 1 3 0 – 1 4 1 141
measurements and their effects on capacitance in acidic andneutral electrolytes. ChemSusChem 2012;5(11):2188–99.
[17] Hu B, Wang K, Wu L, Yu SH, Antonietti M, Titirici M-M.Engineering carbon materials from the hydrothermalcarbonization process of biomass. Adv Mater2010;22(7):813–28.
[18] Titirici M-M, Antonietti M. Chemistry and materials optionsof sustainable carbon materials made by hydrothermalcarbonization. Chem Soc Rev 2010;39(1):103–16.
[19] White RJ, Antonietti M, Titirici M-M. Naturally inspirednitrogen doped porous carbon. J Mater Chem2009;19(45):8645–50.
[20] Zhao L, Baccile N, Gross S, Zhang Y, Wei W, Sun Y, et al.Sustainable nitrogen-doped carbonaceous materials frombiomass derivatives. Carbon 2010;48(13):3778–87.
[21] Falco C, Sevilla M, White RJ, Rothe R, Titirici M-M. Renewablenitrogen-doped hydrothermal carbons derived frommicroalgae. ChemSusChem 2012;5(9):1834–40.
[22] Baccile N, Antonietti M, Titirici M-M. One-step hydrothermalsynthesis of nitrogen-doped nanocarbons: albuminedirecting the carbonization of glucose. ChemSusChem2010;3(2):246–53.
[23] Baccile N, Laurent G, Coelho C, Babonneau F, Zhao L, TitiriciM-M. Structural insights on nitrogen-containinghydrothermal carbon using solid-state magic angle spinning13C and 15N nuclear magnetic resonance. J Phys Chem C2011;115(18):8976–82.
[24] Liu Z, Zhang C, Luo L, Chang Z, Sun X. One-pot synthesis andcatalyst support application of mesoporous N-dopedcarbonaceous materials. J Mater Chem 2012;22(24):12149–54.
[25] Zhao L, Fan LZ, Zhou MQ, Guan H, Qiao S, Antonietti M, et al.Nitrogen-containing hydrothermal carbons with superiorperformance in supercapacitors. Adv Mater2010;22(45):5202–6.
[26] Wei L, Sevilla M, Fuertes AB, Mokaya R, Yushin G.Hydrothermal carbonization of abundant renewable naturalorganic chemicals for high-performance supercapacitorelectrodes. Adv Energy Mater 2011;1(3):356–61.
[27] Zhu Y, Murali S, Stoller MD, Ganesh KJ, Cai W, Ferreira PJ,et al. Carbon-based supercapacitors produced by activationof graphene. Science 2011;332(6037):1537–41.
[28] El-Kady MF, Strong V, Dubin S, Kaner RB. Laser scribing ofhigh-performance and flexible graphene-basedelectrochemical capacitors. Science 2012;335(6074):1326–30.
[29] Zhang K, Ang BT, Zhang LL, Zhao XS, Wu J. Pyrolyzedgraphene oxide/resorcinol-formaldehyde resin compositesas high-performance supercapacitor electrodes. J MaterChem 2011;21(8):2663–70.
[30] Seredych M, Chen R, Bandosz TJ. Effects of the addition ofgraphite oxide to the precursor of a nanoporous carbon onthe electrochemical performance of the resultingcarbonaceous composites. Carbon 2012;50(11):4144–4154.
[31] Tai Z, Yan X, Lang J, Xue Q. Enhancement of capacitanceperformance of flexible carbon nanofiber paper by addinggraphene nanosheets. J Power Sources 2012;199:373–8.
[32] Lei Z, Zhang J, Zhao XS. Ultrathin MnO2 nanofibers grown ongraphitic carbon spheres as high-performance asymmetricsupercapacitor electrodes. J Mater Chem 2012;22(1):153–60.
[33] Zhang L, Zhang F, Yang X, Long G, Wu Y, Zhang T, et al.Porous 3D graphene-based bulk materials with exceptionalhigh surface area and excellent conductivity forsupercapacitors. Sci Rep 2013;3:1408.
[34] Hummers Jr WS, Offeman RE. Preparation of graphitic oxide. JAm Chem Soc 1958;80(6):1339.
[35] Stankovich S, Dikin DA, Piner RD, Kohlhaas KA,Kleinhammes A, Jia Y, et al. Synthesis of graphene-basednanosheets via chemical reduction of exfoliated graphiteoxide. Carbon 2007;45(7):1558–65.
[36] Li D, Muller MB, Gilje S, Kaner RB, Wallace GG. Processableaqueous dispersions of graphene nanosheets. NatNanotechnol 2008;3(2):101–5.
[37] Bai Y, Rakhi RB, Chen W, Alshareef HN. Effect of pH-inducedchemical modification of hydrothermally reduced grapheneoxide on supercapacitor performance. J Power Sources2013;233:313–9.
[38] Zhou Y, Bao Q, Tang LAL, Zhong Y, Loh KP. Hydrothermaldehydration for the ‘‘green’’ reduction of exfoliated grapheneoxide to graphene and demonstration of tunable opticallimiting properties. Chem Mater 2009;21(13):2950–6.
[39] Yu L, Falco C, Weber J, White RJ, Howe JY, Titirici M-M.Carbohydrate-derived hydrothermal carbons: a thoroughcharacterization study. Langmuir 2012;28(33):12373–83.
[40] Puziy AM, Poddubnaya OI, Socha RP, Gurgul J, Wisniewski M.XPS and NMR studies of phosphoric acid activated carbons.Carbon 2008;46(15):2113–23.
[41] Arrigo R, Vecker MH, Wrabetz S, Blume R, Lerch M, McGregorJ, et al. Tuning the acid-base properties of nanocarbons byfunctionalization via amination. J Am Chem Soc2010;132(28):9616–30.
[42] Shu C-K. Degradation products formed from glucosamine inwater. J Agric Food Chem 1998;46(3):1129–31.
[43] Jun M, Shao Y, Ho C-T, Koetter U, Lech S. Structuralidentification of nonvolatile dimerization products ofglucosamine by gas chromatography–mass spectrometry,liquid chromatography–mass spectrometry, and nuclearmagnetic resonance analysis. J Agric Food Chem2003;51(21):6340–6.
[44] Sun L, Wang L, Tian C, Tan T, Xie Y, Shi K, et al. Nitrogen-doped graphene with high nitrogen level via a one-stephydrothermal reaction of graphene oxide with urea forsuperior capacitive energy storage. RSC Adv2012;2(10):4498–506.
[45] Falco C, Perez Caballero F, Babonneau F, Gervais C, Laurent G,Titirici M-M, et al. Hydrothermal carbon from biomass:structural differences between hydrothermal and pyrolyzedcarbons via 13C solid state NMR. Langmuir2011;27(23):14460–71.
[46] Otowa T, Tanibata R, Itoh M. Production and adsorptioncharacteristics of MAXSORB: high-surface-area activecarbon. Gas Sep Purif 1993;7(4):241–5.
[47] Seredych M, Koscinski M, Sliwinska-Bartkowiak M, BandoszTJ. Active pore space utilization in nanoporous carbon-basedsupercapacitors: effects of conductivity and poreaccessibility. J Power Sources 2012;220:243–52.
[48] Wang D-W, Li F, Liu M, Lu GQ, Cheng H-M. 3D Aperiodichierarchical porous graphitic carbon material for high-rateelectrochemical capacitive energy storage. Angew Chem IntEd 2007;47(2):373–6.
[49] Stoller MD, Ruoff RS. Best practice methods for determiningan electrode material’s performance for ultracapacitors.Energy Environ Sci 2010;3(9):1294–301.
[50] Gu W, Sevilla M, Magasinski A, Fuertes AB, Yushin G. Sulfur-containing activated carbons with greatly reduced content ofbottle neck pores for double-layer capacitors: a case study forpseudocapacitance detection. Energy Environ Sci2013;6(8):2465–76.
[51] Chmiola J, Yushin G, Dash R, Gogotsi Y. Effect of pore size andsurface area of carbide derived carbons on specificcapacitance. J Power Sources 2006;158(1):765–72.
Recommended