4/21/12
1
Renewable Energy, Peak Load and Market Penetra9on Issues
Tutorial Prof. Saifur Rahman
Tutorial Prof. Saifur Rahman Virginia Tech, USA
IEEE PES ISGT 19-21 Oct 2010
Medellin, Columbia
Tutorial Prof. Saifur Rahman Virginia Tech, USA
CII 03 April 2012
Hyderabad, India
Part B
(c) Saifur Rahman 1
(c) Saifur Rahman
Tutorial B
Part 3: Demand Response Technologies • Peak load characteris9cs • Demand response and demand side management (DSM) • Demand response technologies – supply side and demand side • Performance of demand response technologies Part 4: Demand Response Planning and Opera9ons • Sample demand response programs in opera9on • Customer incen9ves and par9cipa9on • Impact of demand response on the electrical load shape
2
4/21/12
2
3
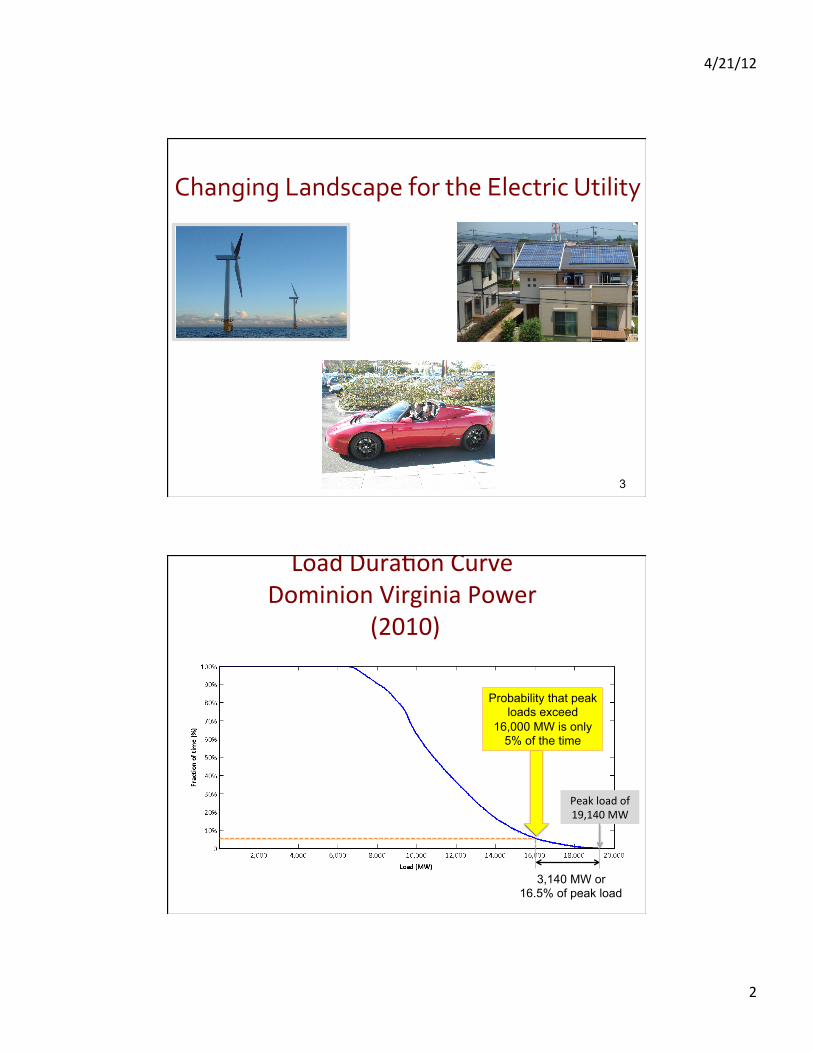
Changing Landscape for the Electric Utility
Load Dura9on Curve Dominion Virginia Power
(2010)
Peak load of 19,140 MW
Probability that peak loads exceed
16,000 MW is only 5% of the time
3,140 MW or 16.5% of peak load
4/21/12
3
Peak load and its duration
• In the US 20% of the load happens 5% of the 9me
• In Australia 15% of the load happens 2.5 days in a year or less than 1% of the 9me
• In Egypt 15% of the load happens 1% of the 9me
Potential Savings from Peak Load Reduction
US has an installed genera9on capacity of 1,000,000 megawaXs
20% or 200,000 megawaXs of genera9on capacity and associated transmission and distribu9on assets are worth over 300 billion dollars
4/21/12
4
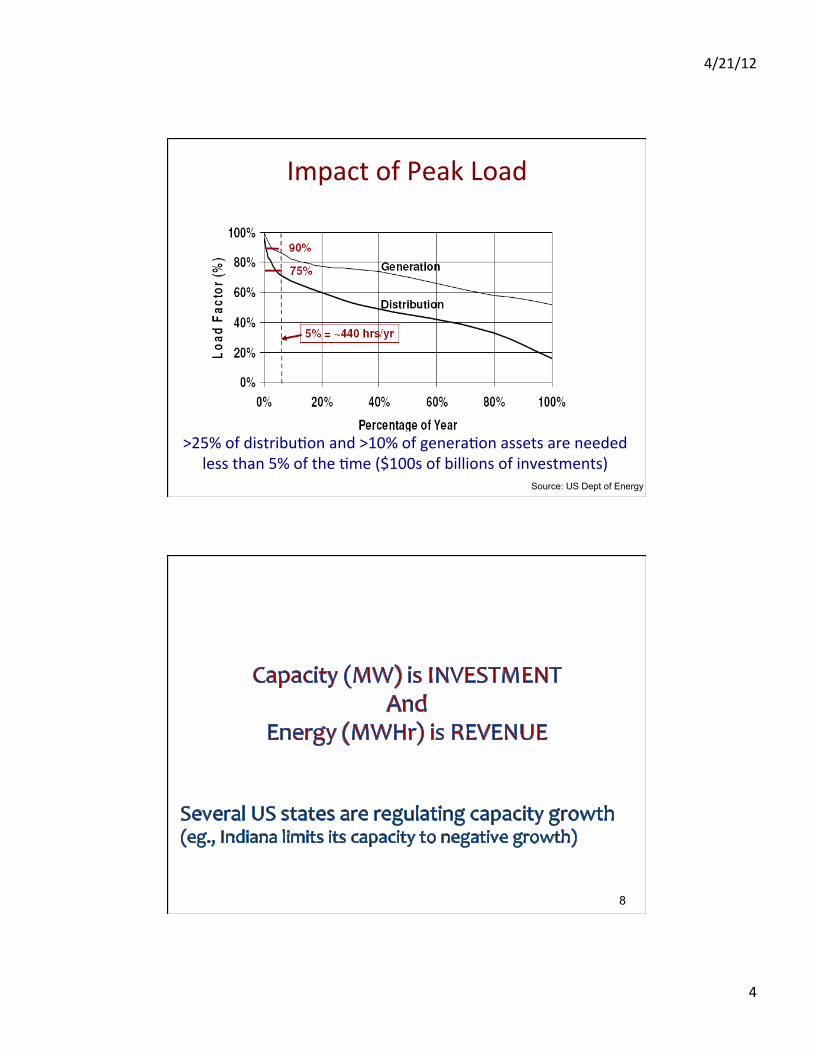
Impact of Peak Load
Hourly Loads as Frac9on of Peak, Sorted from Highest to Lowest
>25% of distribu9on and >10% of genera9on assets are needed less than 5% of the 9me ($100s of billions of investments)
Source: US Dept of Energy
8
4/21/12
5
Basic Defini9ons
Peak Load Reduc,on Ac9ons taken to modify the level and paXern electricity consump9on of consumers during “peak hours” or periods of very high demand: • minimize the opera9on of expensive peaking units
• avoid transmission conges9on costs • defer the building of new genera9on and transmission capaci9es.
(c) Saifur Rahman 9
Basic Defini9ons, contd.
Demand Side Management (DSM) Ac9vi9es and incen9ve programs implemented and administered by u9li9es to modify energy consump9on and load shape of customers. These include: load control, load shibing, energy efficiency and conserva9on. Demand Response (DR) Demand Response can be seen as Demand Side Management but on the customer’s terms, i.e. , the customer decides on what loads to control and for how long, oben in response to a economic/price signals or special requests by u9lity.
(c) Saifur Rahman 10
4/21/12
6
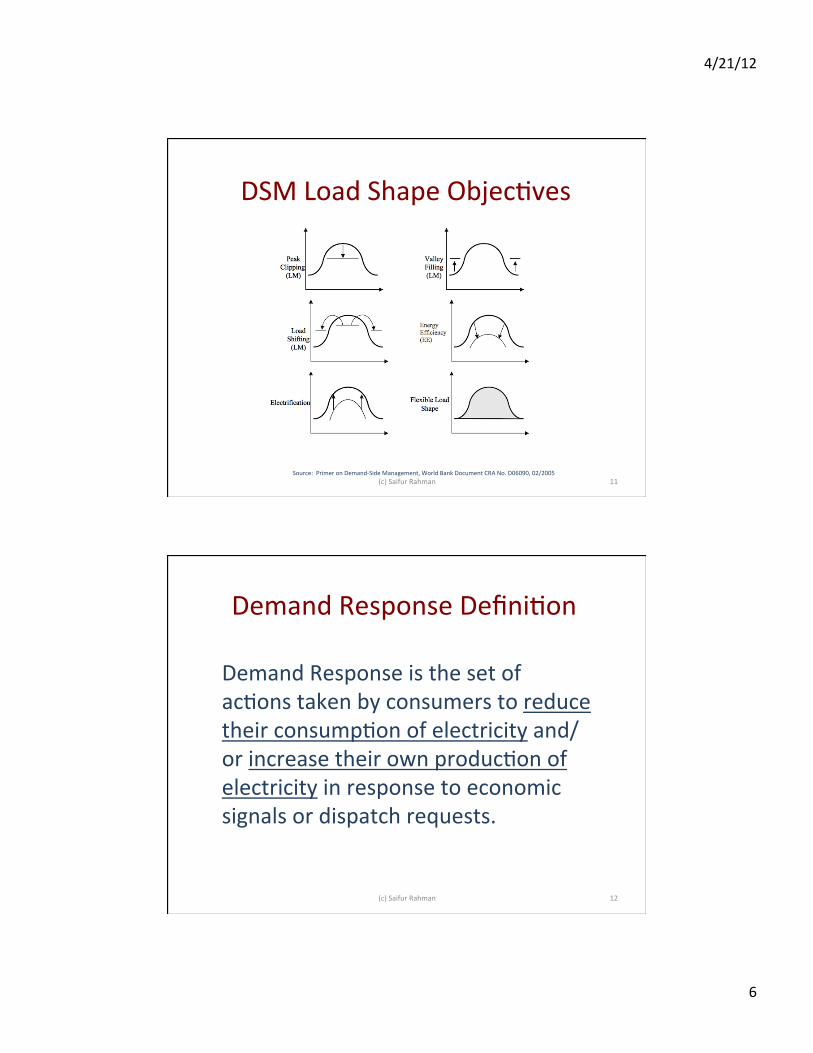
DSM Load Shape Objec9ves
Source: Primer on Demand-‐Side Management, World Bank Document CRA No. D06090, 02/2005 (c) Saifur Rahman 11
Demand Response Defini9on
Demand Response is the set of ac9ons taken by consumers to reduce their consump9on of electricity and/or increase their own produc9on of electricity in response to economic signals or dispatch requests.
(c) Saifur Rahman 12
4/21/12
7
Demand Response Examples
Examples of Demand Response ac9ons include: • reducing the duty-‐cycles of HVAC and water heaters,
• shedding load or shibing electricity usage to off-‐peak hours and,
• turning on the onsite back-‐up genera9on (diesel or renewables).
Demand Response is considered capacity, i.e., equivalent to a generator that can be dispatched by the u9lity to keep the grid in balance and maintain its reliability. (c) Saifur Rahman 13
Energy Efficiency as Demand Response Energy Efficiency (EE) measures, such as one-‐off installa9on of efficient devices and appliances as well as adop9on of efficient processes and systems that provide long-‐term and con9nuous reduc9on in electricity demand can be considered as a form of Demand Response.
(c) Saifur Rahman 14
4/21/12
8
Energy Efficiency as Demand Response, contd.
EE measures require no ac9on by customer once installed. Examples include: replacing incandescent ligh9ng with compact fluorescent or solid-‐state ligh9ng, installing building automa9on, installing adjustable speed drives for electric motors used in HVAC and industrial processes. However, EE measures need to be updated to the best-‐available technologies every few years to qualify as Demand Response.
(c) Saifur Rahman 15
Benefits of Demand Response • Demand Response is far cheaper than dispatching the peaking unit, oben a natural gas-‐fired turbine plant.
• Demand Response can be dispatched and realized within 5-‐10 minutes as compared to the 20-‐30 minutes needed by a peaking unit turbine to ram up to full capacity.
• Demand Response helps reduce transmission conges9ons and electricity price vola9li9es thus enabling power exchanges in the wholesale market from regions with surplus to regions with shortage and ensuring the reliability of the system.
(c) Saifur Rahman 16
4/21/12
9
Benefits of Demand Response, contd.
• Demand Response, unlike peaking thermal units, does not emit greenhouse gases and can be considered as clean energy.
• Demand Response is more reliable than the capacity obtained from a single peaking power sta9on, as it can be sourced from a large and distributed popula9on.
(c) Saifur Rahman 17
Some major benefits of DR are: q Saving in genera9on investment, deferring T&D upgrades
q Energy efficiency
q Facilita9ng renewable energy integra9on
q BeXer equipment use (e.g. increase in load factor)
q DR and Smart Grid: Smart Grid technologies (e.g. smart meter) facilitate DR
Benefits & Potential in the US Market
(c) Saifur Rahman 18
4/21/12
10
Poten,al (US Federal Energy Regulatory Commission, FERC):
q Exis9ng DR capability: Can reduce 4% of US peak demand (810,000 MW in 2009)
q DR could shave about 32,000 MW off US peak load in 2010
q Based on current industry best prac9ces: 9% US electricity demand can be saved
q With improved DR: peak shaving could reach 14-‐20% of the peak
Benefits & Potential in the US Market, contd.
(c) Saifur Rahman 19
Types of Demand Response
Economic Response: Capacity available on a day-‐to-‐day
basis created through price signals to the consumer. Response is voluntary.
Reliability Response: Capacity on standby that can be called upon to maintain system reliability, also referred to as Con9ngency or Emergency Response. Response can be both voluntary and obligatory (direct load control, interrup9ble load etc.)
Demand Response can be broadly classified into two:
(c) Saifur Rahman 20
4/21/12
11
Demand Response Enabling Technologies
Some technologies enabling the Smart Grid • Distribu9on Automa9on • Automated Metering Infrastructure (AMI) • Home/Building Energy Management • Programmable Ligh9ng and Load Controllers • Embedded Controls and Communica9ons • Home Area Networks (HAN) • Wide Area Networks (WAN) (c) Saifur Rahman 21
How is Demand Response Marketed? • Demand Response capaci9es are considered same as genera9on capaci9es and are therefore being traded the same way, i.e., on day-‐ahead markets operated by power exchanges, RTOs and ISOs.
• Aggregators can offer demand response capacity to the market. If cleared, customers will be paid the market clearing price.
• Demand Response capaci9es now fetch, by rule, the market price for electricity, known as the loca9onal marginal price (LMP), when it is established to be cost-‐effec9ve to use them to cover for genera9on shortage. (FERC Order 745, Docket No. RM10-‐17-‐000)
(c) Saifur Rahman 22
4/21/12
12
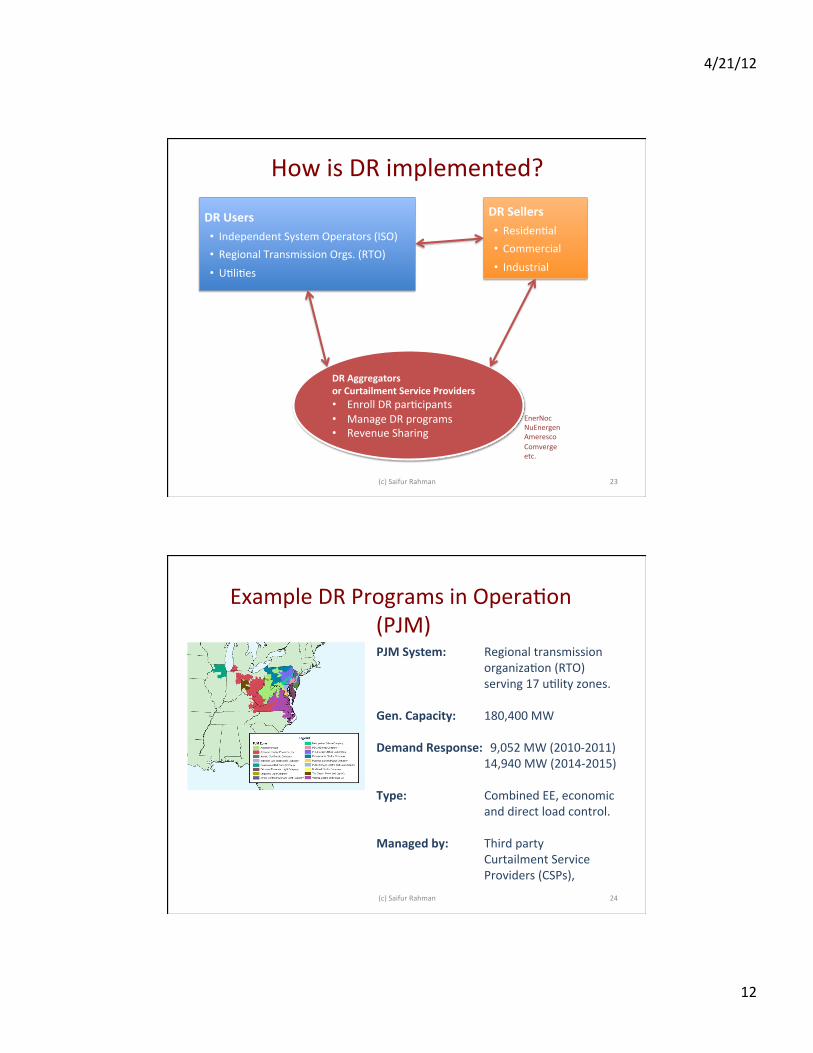
How is DR implemented?
DR Users • Independent System Operators (ISO) • Regional Transmission Orgs. (RTO) • U9li9es
DR Sellers • Residen9al • Commercial • Industrial
DR Aggregators or Curtailment Service Providers • Enroll DR par9cipants • Manage DR programs • Revenue Sharing
EnerNoc NuEnergen Ameresco Comverge etc.
(c) Saifur Rahman 23
Example DR Programs in Opera9on (PJM) PJM System: Regional transmission
organiza9on (RTO) serving 17 u9lity zones.
Gen. Capacity: 180,400 MW Demand Response: 9,052 MW (2010-‐2011)
14,940 MW (2014-‐2015) Type: Combined EE, economic
and direct load control. Managed by: Third party
Curtailment Service Providers (CSPs),
(c) Saifur Rahman 24
4/21/12
13
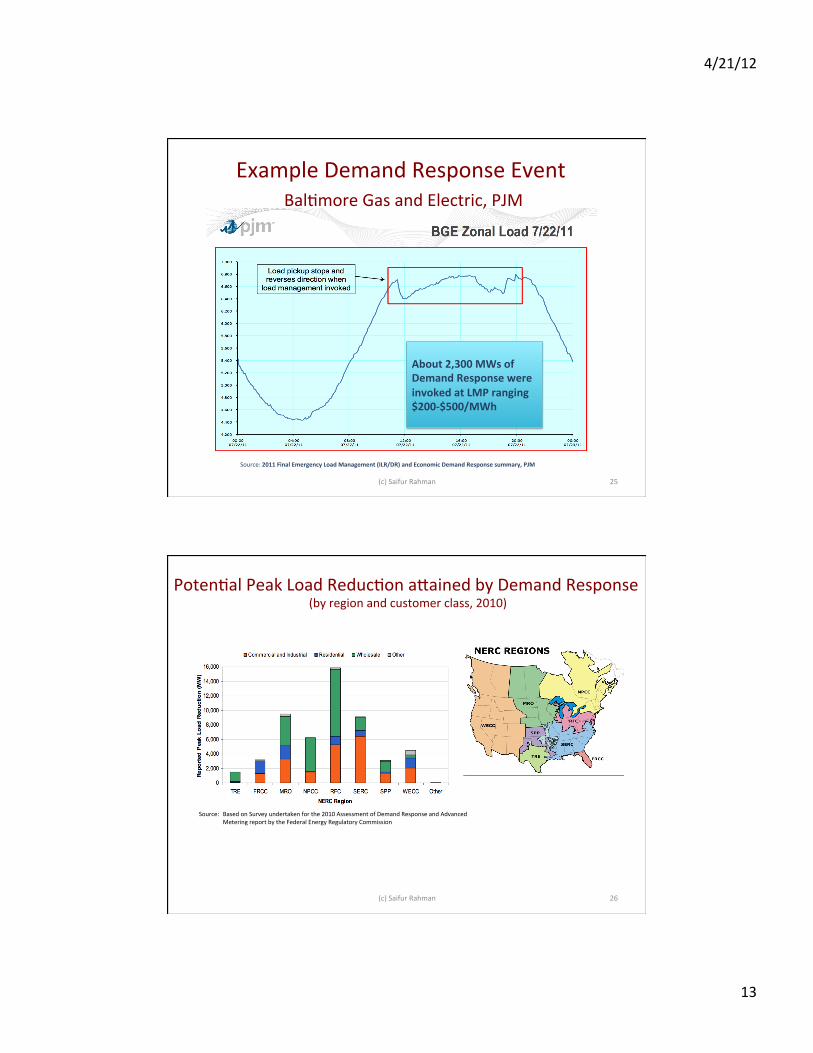
Example Demand Response Event Bal9more Gas and Electric, PJM
Source: 2011 Final Emergency Load Management (ILR/DR) and Economic Demand Response summary, PJM
About 2,300 MWs of Demand Response were invoked at LMP ranging $200-‐$500/MWh
(c) Saifur Rahman 25
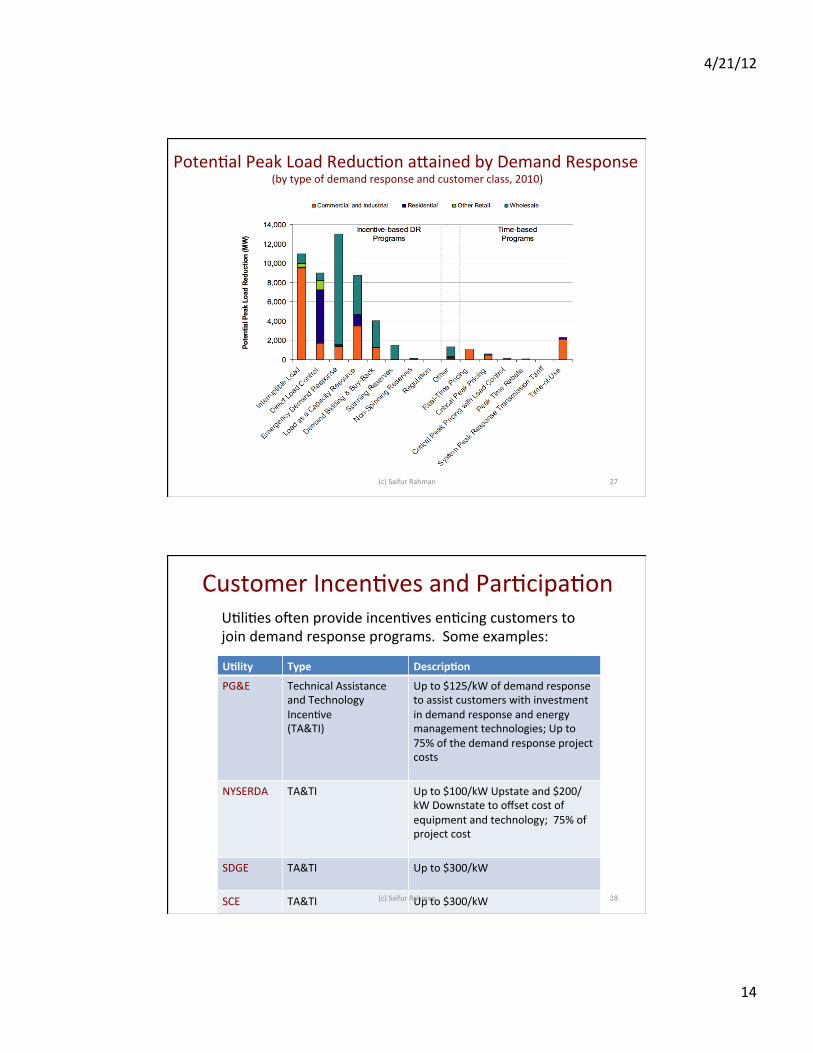
Poten9al Peak Load Reduc9on aXained by Demand Response (by region and customer class, 2010)
Source: Based on Survey undertaken for the 2010 Assessment of Demand Response and Advanced Metering report by the Federal Energy Regulatory Commission
(c) Saifur Rahman 26
4/21/12
14
Poten9al Peak Load Reduc9on aXained by Demand Response (by type of demand response and customer class, 2010)
(c) Saifur Rahman 27
Customer Incen9ves and Par9cipa9on U9li9es oben provide incen9ves en9cing customers to join demand response programs. Some examples:
U,lity Type Descrip,on
PG&E Technical Assistance and Technology Incen9ve (TA&TI)
Up to $125/kW of demand response to assist customers with investment in demand response and energy management technologies; Up to 75% of the demand response project costs
NYSERDA TA&TI Up to $100/kW Upstate and $200/kW Downstate to offset cost of equipment and technology; 75% of project cost
SDGE TA&TI
Up to $300/kW
SCE TA&TI
Up to $300/kW
(c) Saifur Rahman 28
4/21/12
15
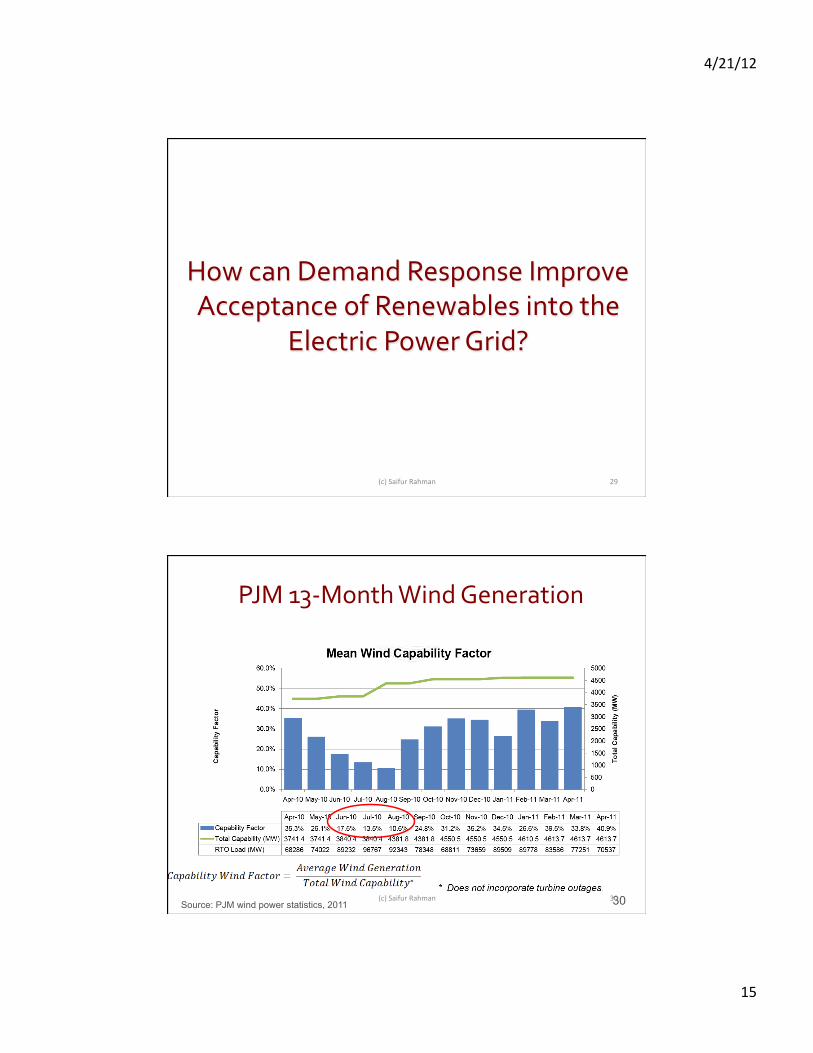
How can Demand Response Improve Acceptance of Renewables into the
Electric Power Grid?
(c) Saifur Rahman 29
PJM 13-‐Month Wind Generation
30 Source: PJM wind power statistics, 2011 (c) Saifur Rahman 30
4/21/12
16
10700 MW Peak Saving
13700 MW Peak Saving w/ DR
(c) Saifur Rahman 31
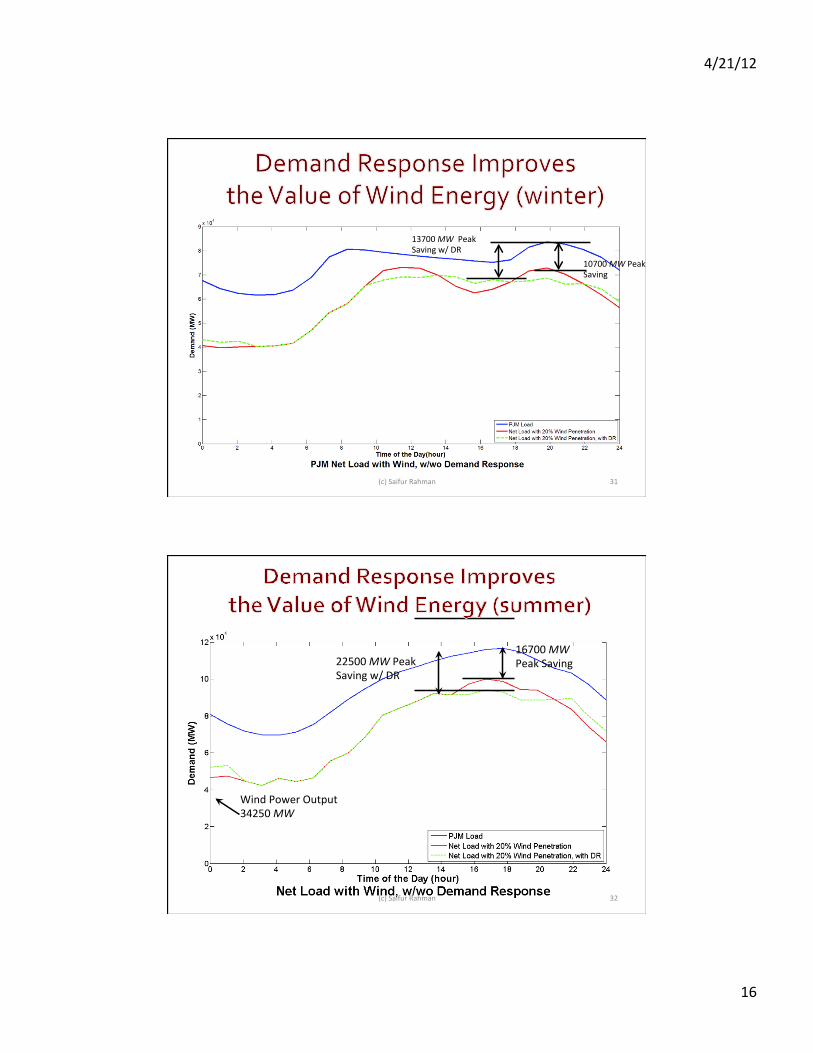
16700 MW Peak Saving 22500 MW Peak
Saving w/ DR
Wind Power Output 34250 MW
(c) Saifur Rahman 32
4/21/12
17
How can the Smart Grid Help?
33
Peak load reduction, generator efficiency
improvements and DER integration are major benefits of the smart grid
Load control at the customer level can provide
significant peak load reductions
How to incentivize the customer? (c) Saifur Rahman 33
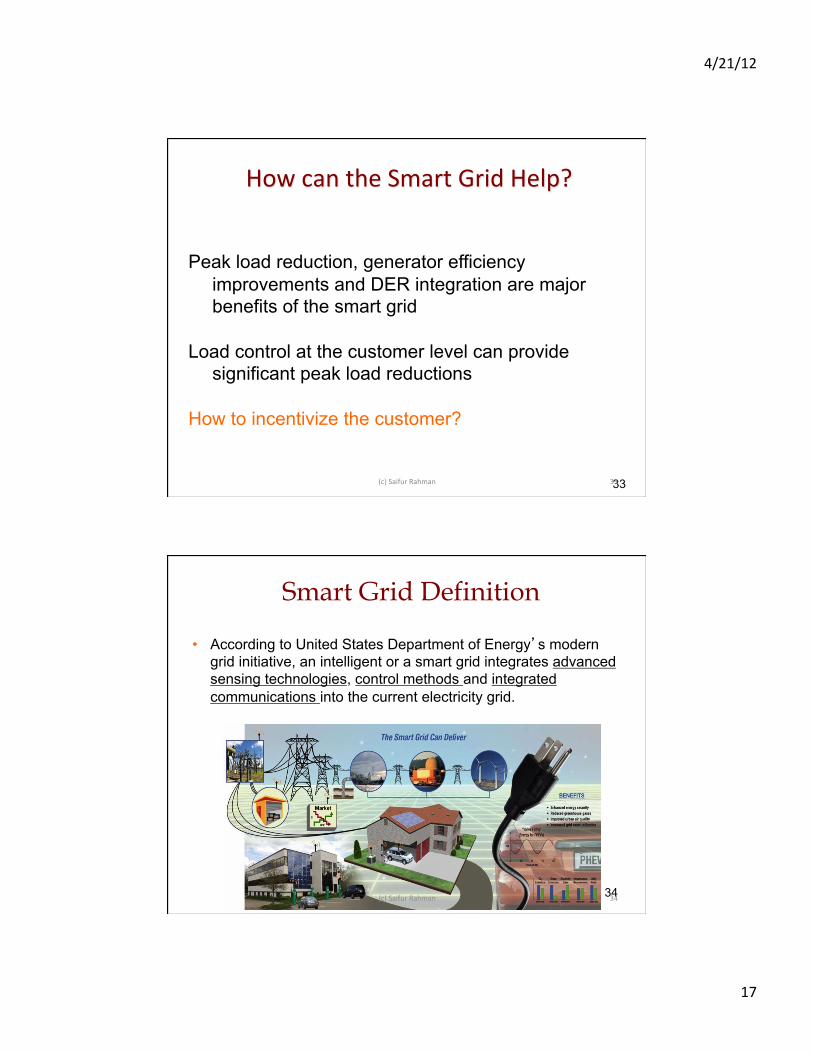
Smart Grid Definition
• According to United States Department of Energy’s modern grid initiative, an intelligent or a smart grid integrates advanced sensing technologies, control methods and integrated communications into the current electricity grid.
34 (c) Saifur Rahman 34
4/21/12
18
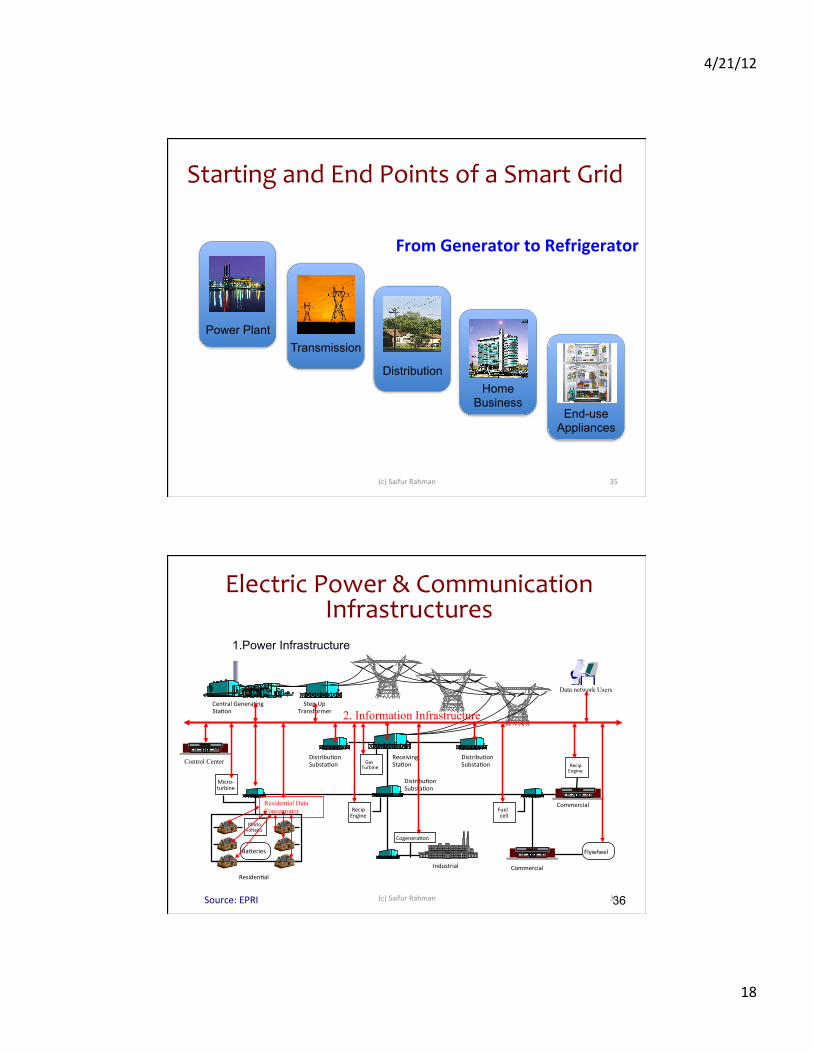
Power Plant Transmission
Distribution Home
Business End-use
Appliances
Starting and End Points of a Smart Grid
From Generator to Refrigerator
(c) Saifur Rahman 35
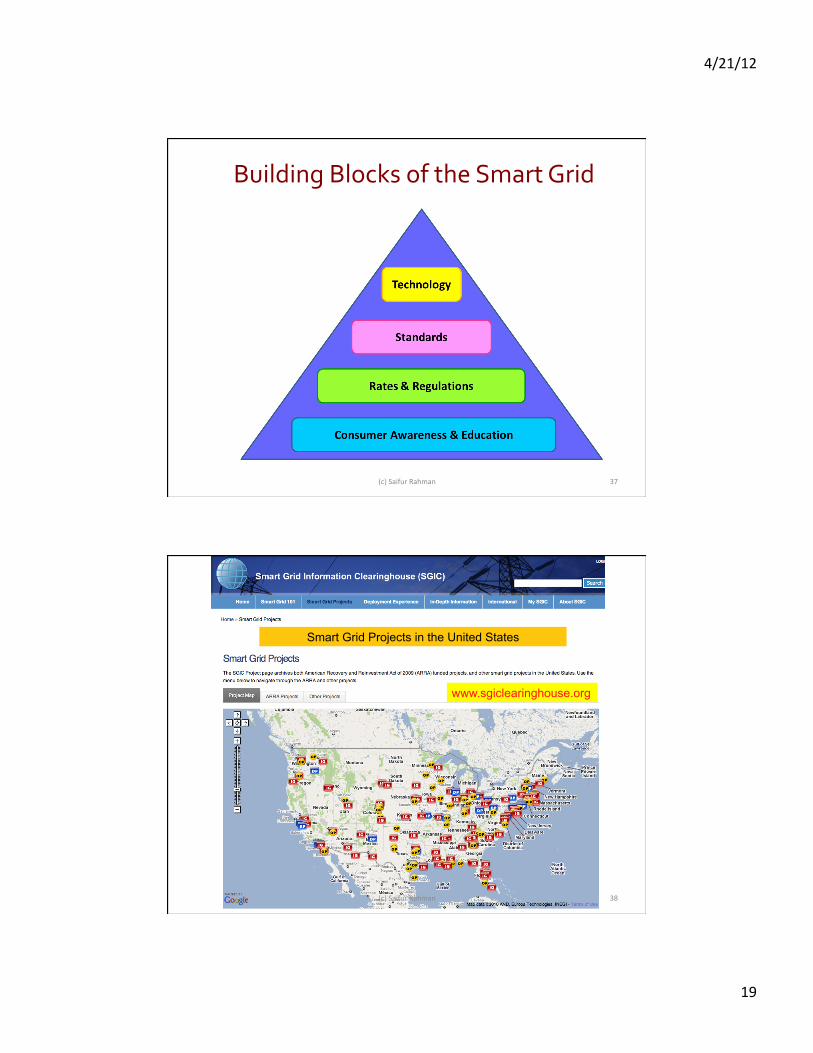
Electric Power & Communication Infrastructures
Central Genera9ng Sta9on Step-‐Up
Transformer
Distribu9on Substa9on Receiving
Sta9on Distribu9on Substa9on
Distribu9on Substa9on
Commercial
Industrial Commercial
Gas Turbine
Recip Engine
Cogenera9on
Recip Engine
Fuel cell
Micro-‐ turbine
Flywheel Residen9al
Photo voltaics
BaXeries
Residential Data Concentrator
Control Center
Data network Users
2. Information Infrastructure
1.Power Infrastructure
Source: EPRI 36 (c) Saifur Rahman 36
4/21/12
19
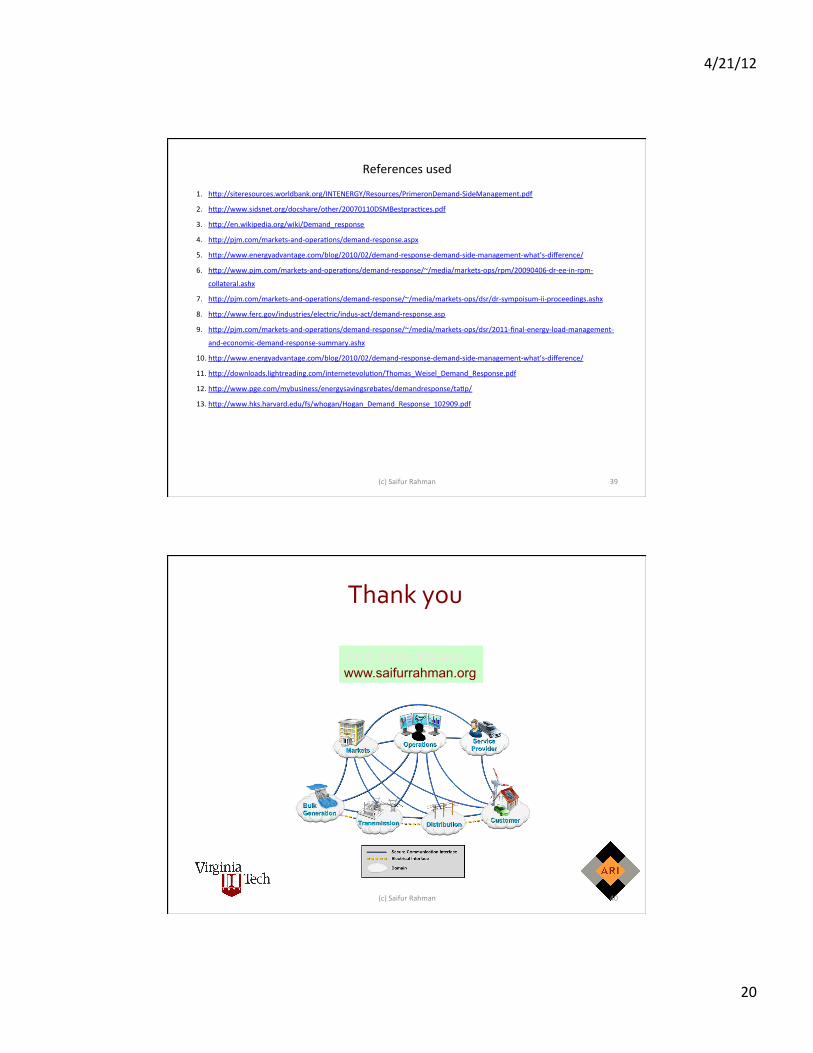
Building Blocks of the Smart Grid
© Saifur Rahman
(c) Saifur Rahman 37
Smart Grid Projects in the United States
www.sgiclearinghouse.org
(c) Saifur Rahman 38
4/21/12
20
References used
1. hXp://siteresources.worldbank.org/INTENERGY/Resources/PrimeronDemand-‐SideManagement.pdf
2. hXp://www.sidsnet.org/docshare/other/20070110DSMBestprac9ces.pdf
3. hXp://en.wikipedia.org/wiki/Demand_response
4. hXp://pjm.com/markets-‐and-‐opera9ons/demand-‐response.aspx
5. hXp://www.energyadvantage.com/blog/2010/02/demand-‐response-‐demand-‐side-‐management-‐what’s-‐difference/
6. hXp://www.pjm.com/markets-‐and-‐opera9ons/demand-‐response/~/media/markets-‐ops/rpm/20090406-‐dr-‐ee-‐in-‐rpm-‐
collateral.ashx
7. hXp://pjm.com/markets-‐and-‐opera9ons/demand-‐response/~/media/markets-‐ops/dsr/dr-‐sympoisum-‐ii-‐proceedings.ashx
8. hXp://www.ferc.gov/industries/electric/indus-‐act/demand-‐response.asp
9. hXp://pjm.com/markets-‐and-‐opera9ons/demand-‐response/~/media/markets-‐ops/dsr/2011-‐final-‐energy-‐load-‐management-‐
and-‐economic-‐demand-‐response-‐summary.ashx
10. hXp://www.energyadvantage.com/blog/2010/02/demand-‐response-‐demand-‐side-‐management-‐what’s-‐difference/
11. hXp://downloads.lightreading.com/internetevolu9on/Thomas_Weisel_Demand_Response.pdf
12. hXp://www.pge.com/mybusiness/energysavingsrebates/demandresponse/ta9p/
13. hXp://www.hks.harvard.edu/fs/whogan/Hogan_Demand_Response_102909.pdf
(c) Saifur Rahman 39
Thank you
Prof. Saifur Rahman www.saifurrahman.org
(c) Saifur Rahman 40
Recommended