HUAWEI TECHNOLOGIES CO., LTD.
Making the World Smaller with Small Cell
David Zheng
Vice President, Huawei SmallCell Product Line
4st March 2015
Page 2
Content 1. Industry & Market Trend 2. Scenario & Solution 3. Successful Cases
Page 3
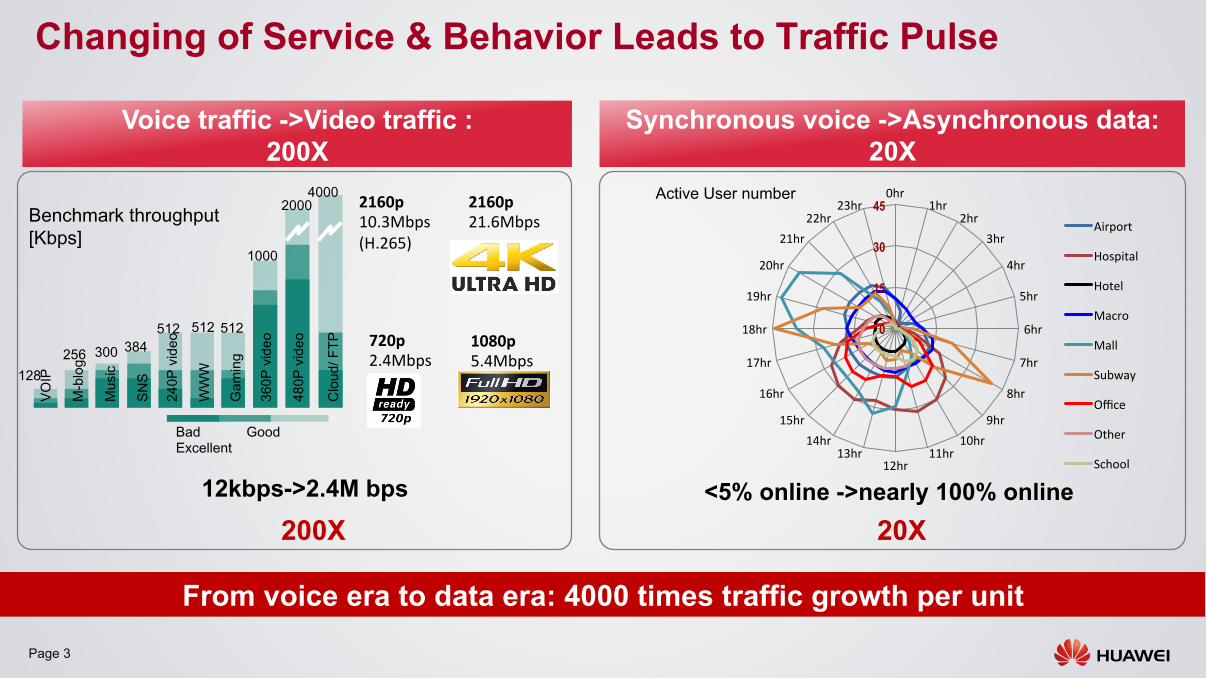
Changing of Service & Behavior Leads to Traffic Pulse
From voice era to data era: 4000 times traffic growth per unit
Benchmark throughput [Kbps]
128 256
512 512 512
2000
300 384
4000
1000
Mus
ic
VOIP
M-b
log
SNS
WW
W
Gam
ing
240P
vid
eo
480P
vid
eo
360P
vid
eo
Clo
ud/ F
TP
Bad Good Excellent
720p 2.4Mbps
1080p 5.4Mbps
2160p 21.6Mbps
2160p 10.3Mbps (H.265)
12kbps->2.4M bps <5% online ->nearly 100% online 200X 20X
0
15
30
45 0hr
1hr 2hr
3hr
4hr
5hr
6hr
7hr
8hr
9hr 10hr
11hr 12hr
13hr 14hr
15hr
16hr
17hr
18hr
19hr
20hr
21hr 22hr
23hr
Airport
Hospital
Hotel
Macro
Mall
Subway
Office
Other
School
Active User number
Voice traffic ->Video traffic : 200X
Synchronous voice ->Asynchronous data: 20X
Page 4
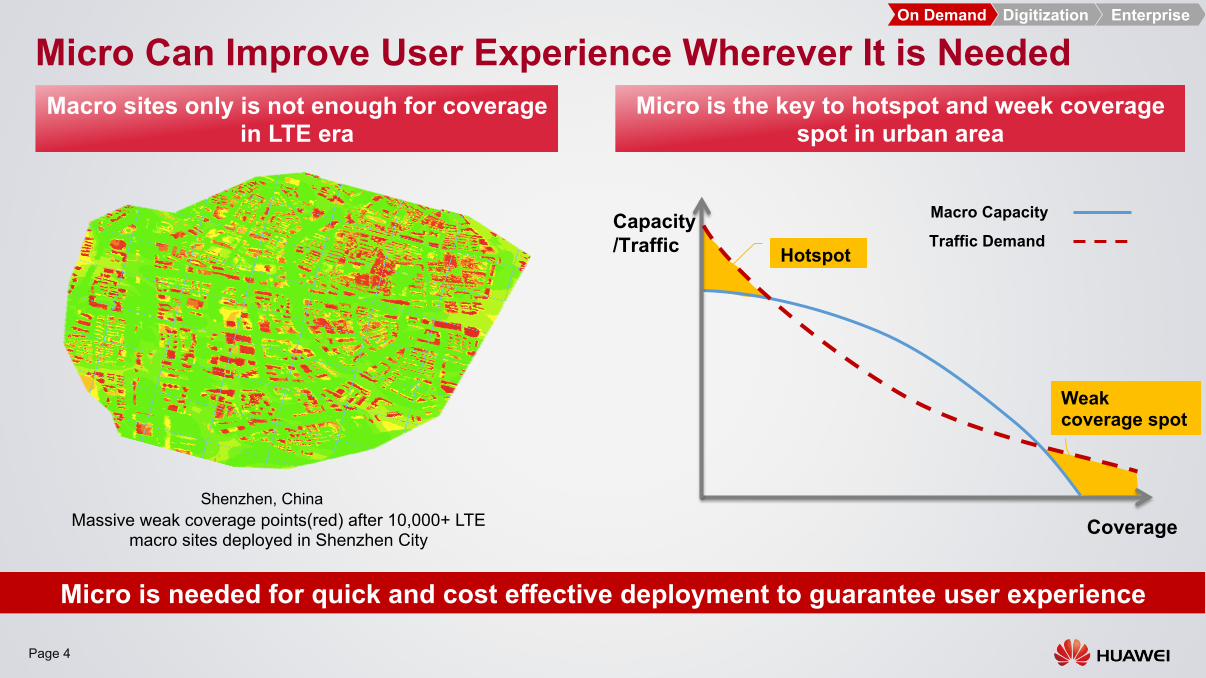
Micro Can Improve User Experience Wherever It is Needed On Demand Enterprise Digitization
Macro sites only is not enough for coverage in LTE era
Micro is the key to hotspot and week coverage spot in urban area
Macro Capacity
Traffic Demand Capacity /Traffic
Micro is needed for quick and cost effective deployment to guarantee user experience
Hotspot
Weak coverage spot
Coverage Massive weak coverage points(red) after 10,000+ LTE macro sites deployed in Shenzhen City
Shenzhen, China
Page 5
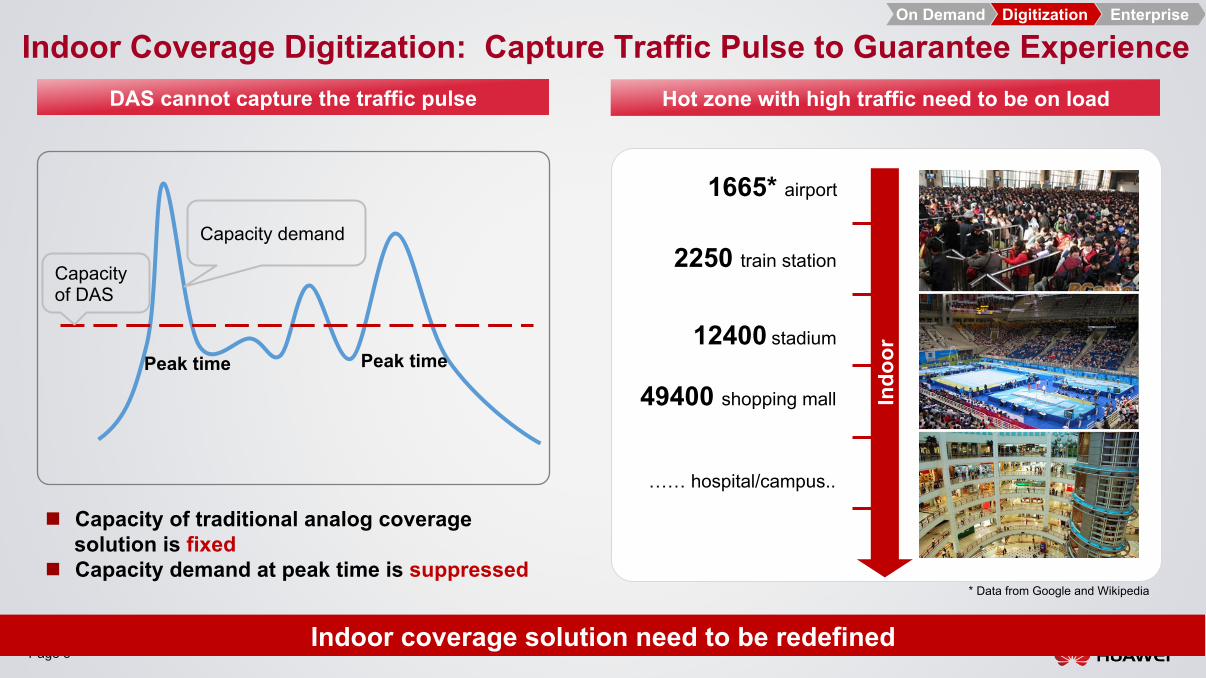
Indoor Coverage Digitization: Capture Traffic Pulse to Guarantee Experience
Indoor coverage solution need to be redefined
On Demand Enterprise Digitization
Capacity of DAS
n Capacity of traditional analog coverage solution is fixed
n Capacity demand at peak time is suppressed
Capacity demand
Peak time Peak time
Indo
or 12400 stadium
1665* airport
2250 train station
49400 shopping mall
…… hospital/campus..
Hot zone with high traffic need to be on load
* Data from Google and Wikipedia
DAS cannot capture the traffic pulse
Page 6
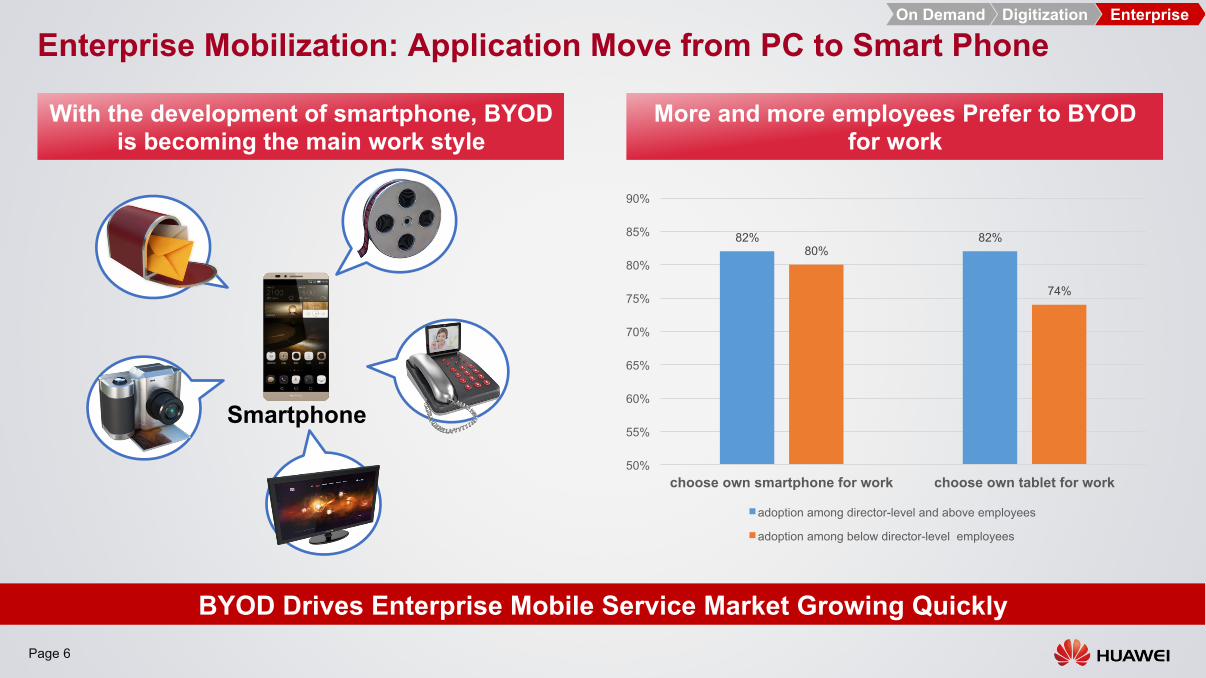
Enterprise Mobilization: Application Move from PC to Smart Phone
BYOD Drives Enterprise Mobile Service Market Growing Quickly
With the development of smartphone, BYOD is becoming the main work style
More and more employees Prefer to BYOD for work
On Demand Enterprise Digitization
Smartphone
82% 82% 80%
74%
50%
55%
60%
65%
70%
75%
80%
85%
90%
choose own smartphone for work choose own tablet for work
adoption among director-level and above employees
adoption among below director-level employees
Page 7
Content 1. Industry & Market Trend 2. Scenario & Solution 3. Successful Cases

Page 8
Increase ROI by Increasing Revenue and Decreasing TCO
Revenue - TCO
TCO ROI =

Page 9
Outdoor On Demand Network with Small Cell
Revenue - TCO
TCO ROI =
Revenue = Traffic + New Service TCO = Site + Backhaul + BOX+ Others
On Demand Enterprise Digitization
21%
15% 5% 35%
15% 9%
TCO Analysis of Micro BTS in Europe
Site BOX NRO Backhaul Maintenance Others
Page 10
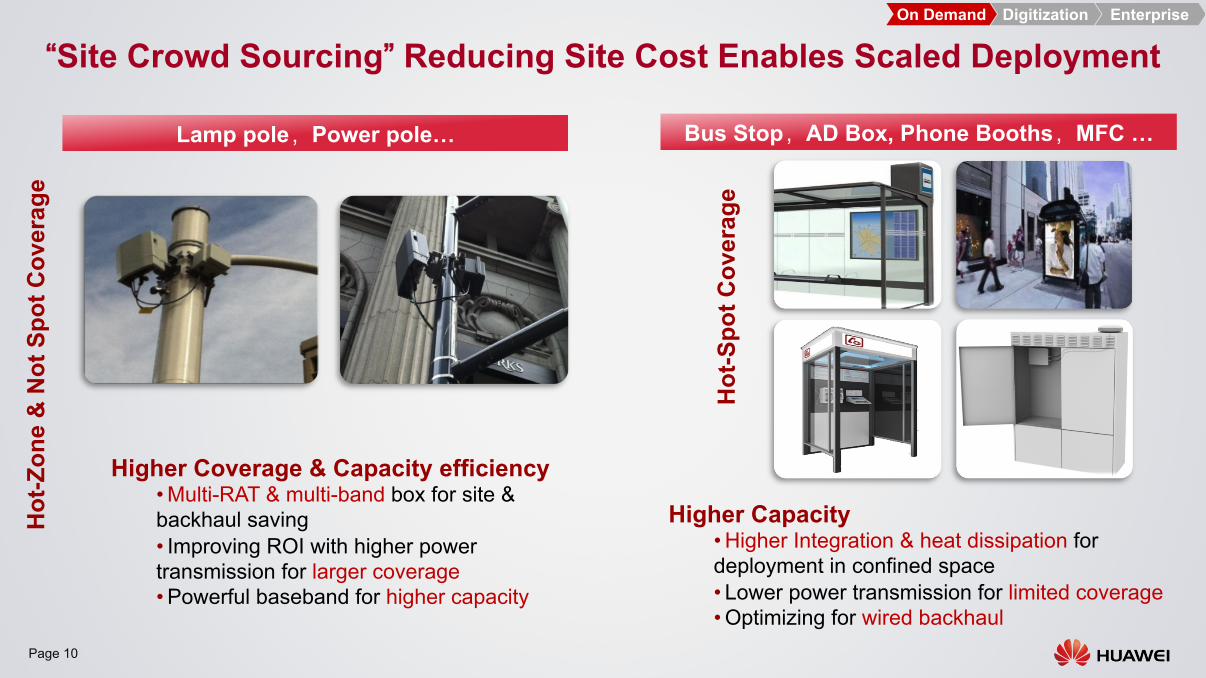
“Site Crowd Sourcing” Reducing Site Cost Enables Scaled Deployment On Demand Enterprise Digitization
Higher Coverage & Capacity efficiency • Multi-RAT & multi-band box for site & backhaul saving • Improving ROI with higher power transmission for larger coverage • Powerful baseband for higher capacity
Hot
-Zon
e &
Not
Spo
t Cov
erag
e
Hot
-Spo
t Cov
erag
e
Higher Capacity • Higher Integration & heat dissipation for deployment in confined space • Lower power transmission for limited coverage • Optimizing for wired backhaul
Lamp pole,Power pole… Bus Stop,AD Box, Phone Booths,MFC …
Page 11
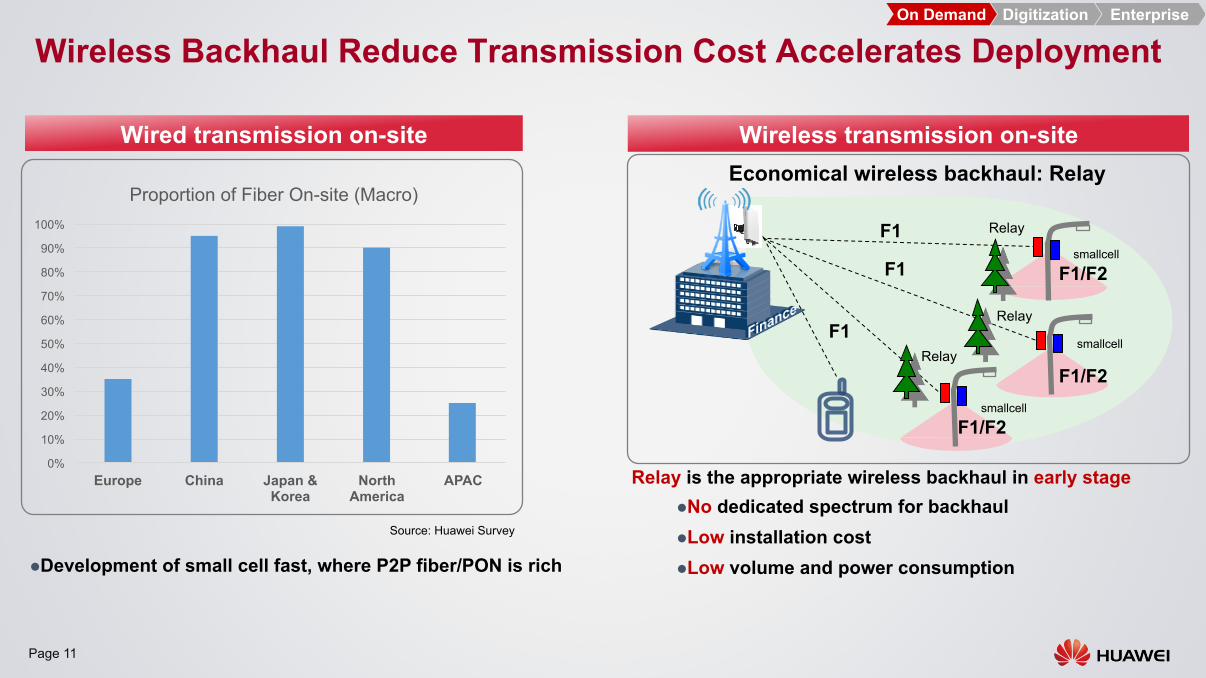
l Development of small cell fast, where P2P fiber/PON is rich
Relay is the appropriate wireless backhaul in early stage l No dedicated spectrum for backhaul l Low installation cost l Low volume and power consumption
Wireless Backhaul Reduce Transmission Cost Accelerates Deployment
Wired transmission on-site Wireless transmission on-site
smallcell �
smallcell �
smallcell �
Relay �
Relay �
Relay �
F1
F1
F1
F1/F2
F1/F2
F1/F2
On Demand Enterprise Digitization
Economical wireless backhaul: Relay
0%
10%
20%
30%
40%
50%
60%
70%
80%
90%
100%
Europe China Japan & Korea
North America
APAC
Proportion of Fiber On-site (Macro)
Source: Huawei Survey
Page 12
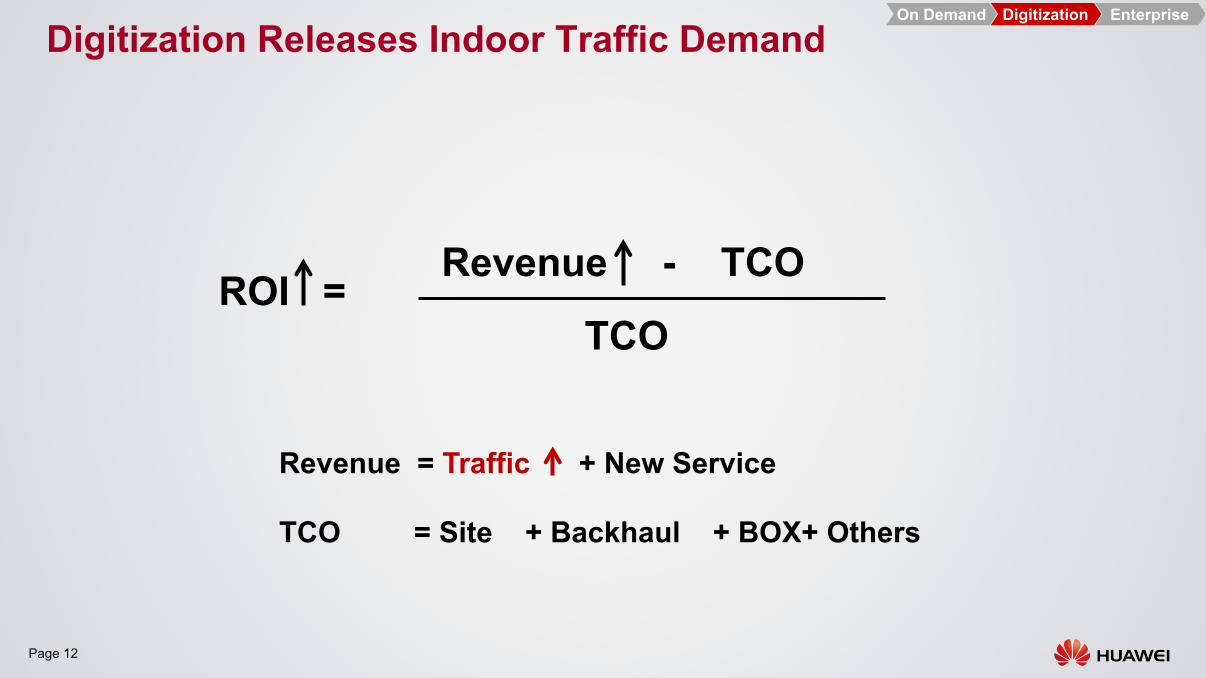
Revenue - TCO
TCO ROI =
Revenue = Traffic + New Service TCO = Site + Backhaul + BOX+ Others
On Demand Enterprise Digitization
Digitization Releases Indoor Traffic Demand
Page 13
On Demand Enterprise Digitization
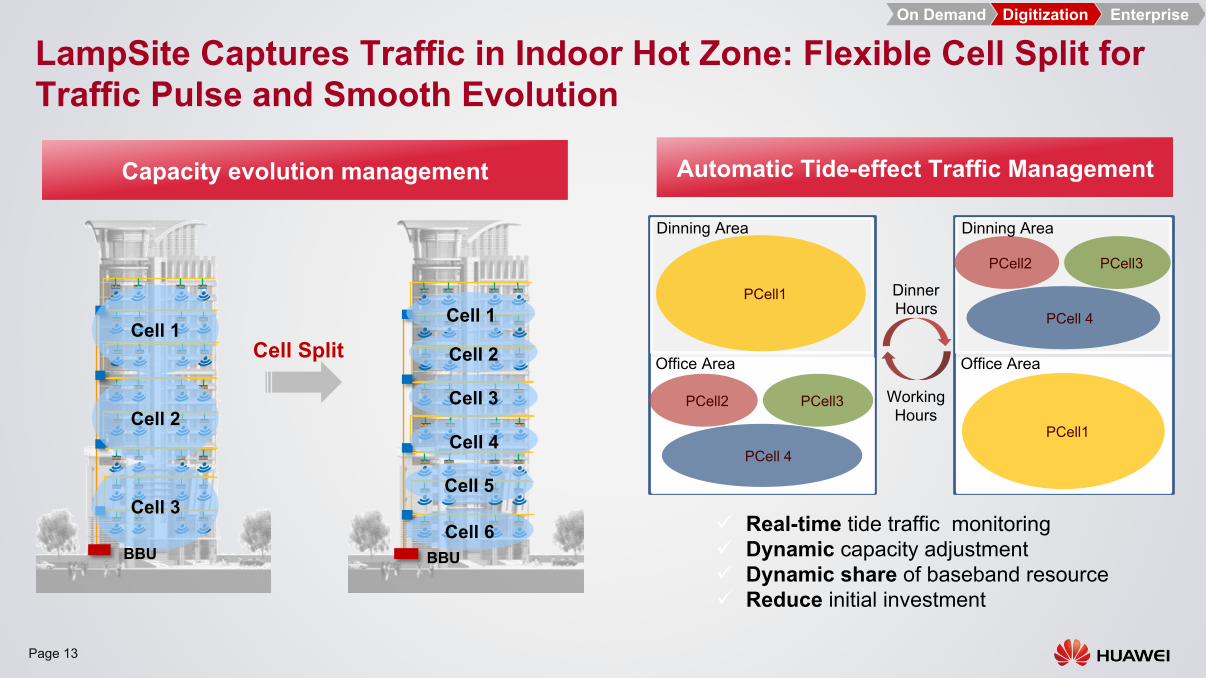
LampSite Captures Traffic in Indoor Hot Zone: Flexible Cell Split for Traffic Pulse and Smooth Evolution
Capacity evolution management
Cell Split
Cell 4
Cell 3
Cell 2
Cell 1
Cell 5
Cell 6 BBU
Cell 1
Cell 2
Cell 3
BBU
ü Real-time tide traffic monitoring ü Dynamic capacity adjustment ü Dynamic share of baseband resource ü Reduce initial investment
PCell1
PCell3 PCell2
PCell 4
Dinning Area
Office Area
PCell1
PCell3 PCell2
PCell 4
Dinning Area
Office Area
Working Hours
Dinner Hours
Automatic Tide-effect Traffic Management
Page 14
On Demand Enterprise Digitization
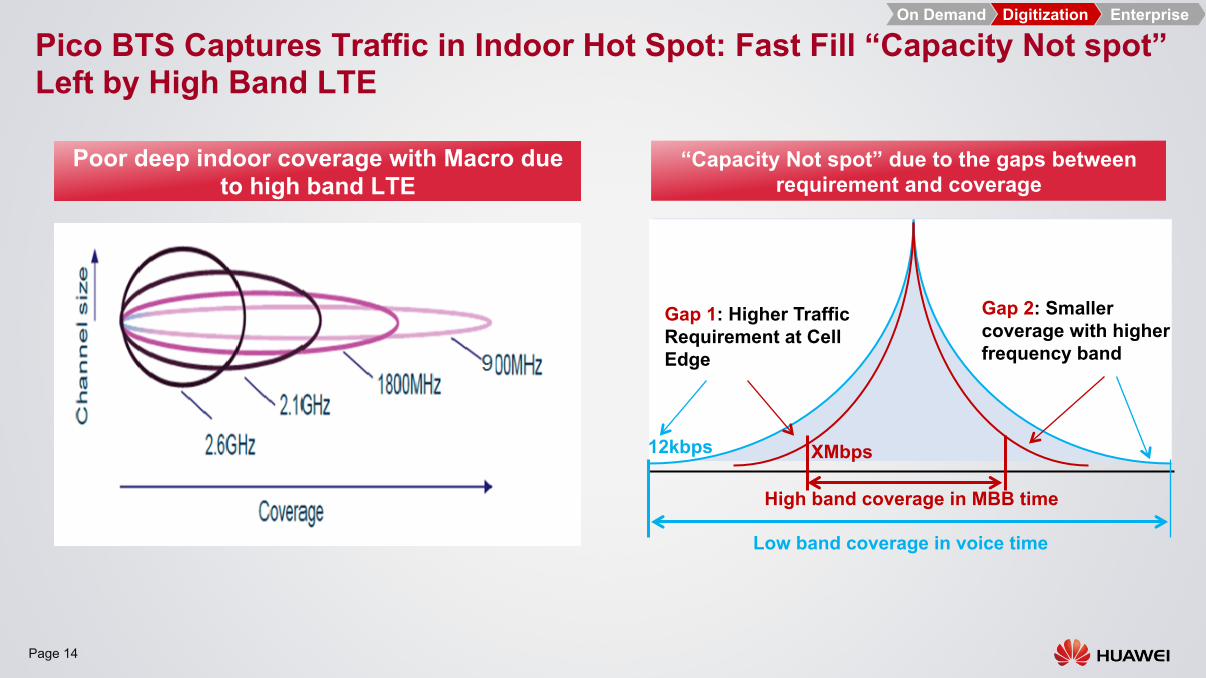
Pico BTS Captures Traffic in Indoor Hot Spot: Fast Fill “Capacity Not spot” Left by High Band LTE
12kbps XMbps
Low band coverage in voice time
High band coverage in MBB time
Gap 1: Higher Traffic Requirement at Cell Edge
Gap 2: Smaller coverage with higher frequency band
Poor deep indoor coverage with Macro due to high band LTE
“Capacity Not spot” due to the gaps between requirement and coverage
Page 15
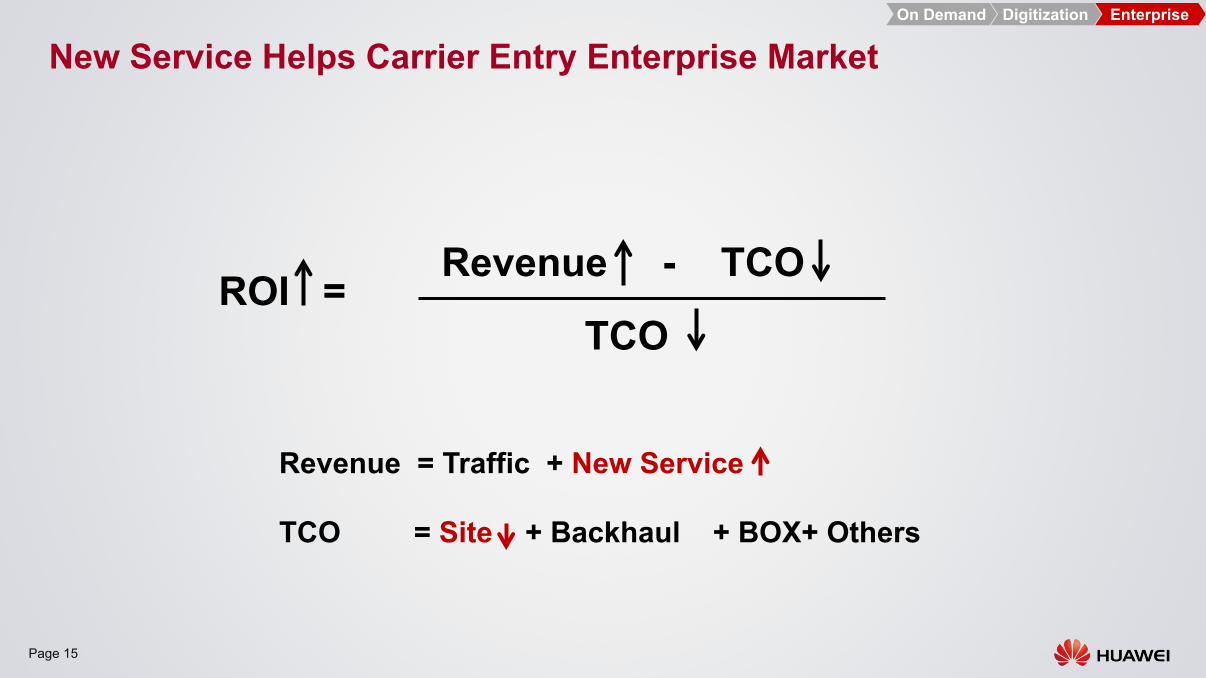
New Service Helps Carrier Entry Enterprise Market
Revenue - TCO
TCO ROI =
Revenue = Traffic + New Service TCO = Site + Backhaul + BOX+ Others
On Demand Enterprise Digitization
Page 16
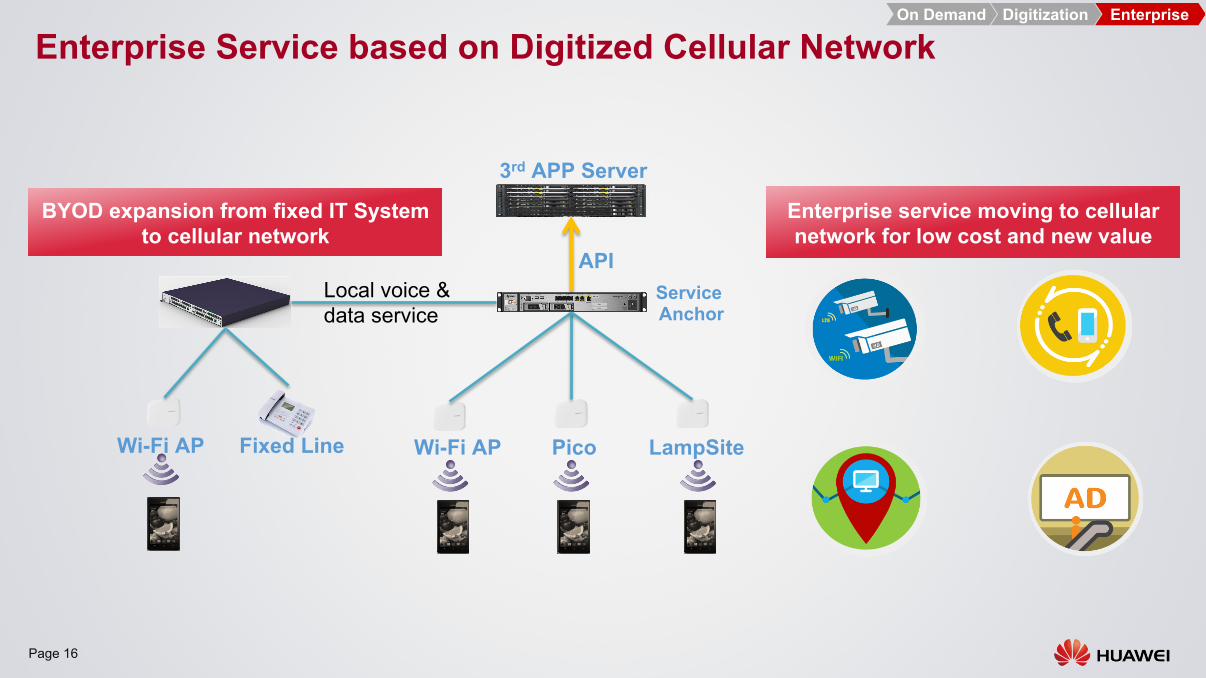
Enterprise Service based on Digitized Cellular Network
Service Anchor
3rd APP Server
API
Wi-Fi AP Pico LampSite Wi-Fi AP Fixed Line
Local voice & data service
BYOD expansion from fixed IT System to cellular network
Enterprise service moving to cellular network for low cost and new value
On Demand Enterprise Digitization
Page 17
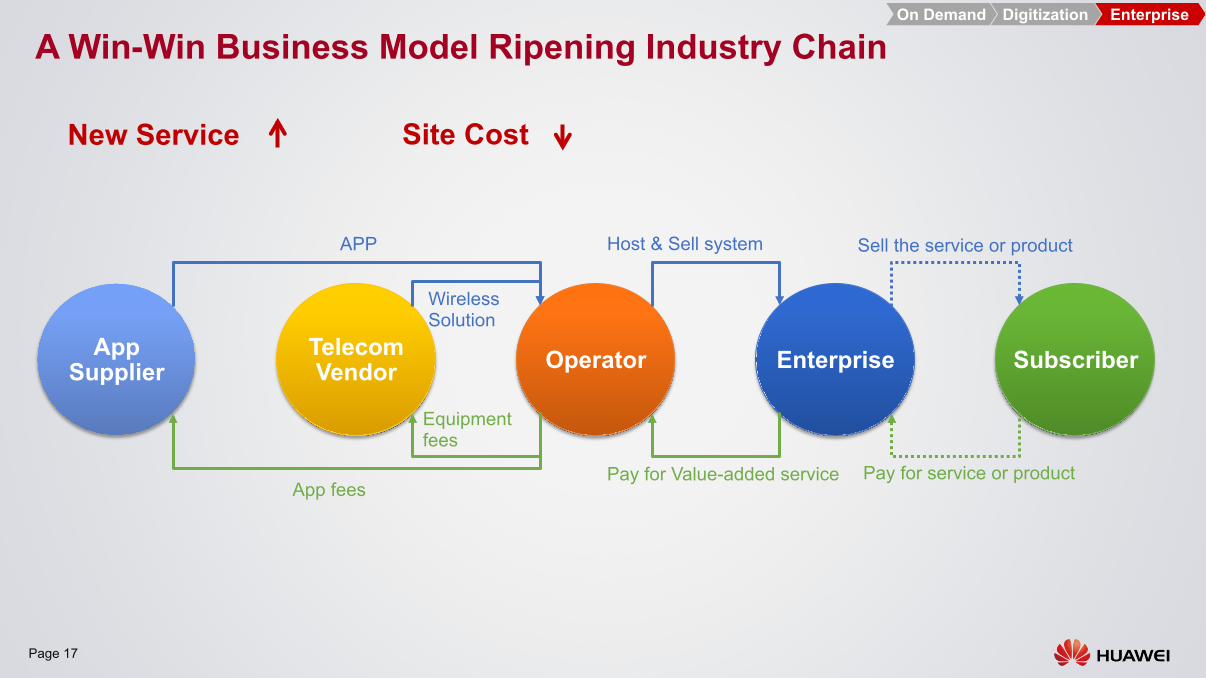
A Win-Win Business Model Ripening Industry Chain
Operator Enterprise Subscriber App Supplier
Telecom Vendor
APP
Wireless Solution
Host & Sell system Sell the service or product
Pay for Value-added service
Equipment fees
App fees Pay for service or product
On Demand Enterprise Digitization
New Service
Site Cost

Page 18
Content 1. Industry & Market Trend 2. Scenario & Solution 3. Successful Cases
Page 19
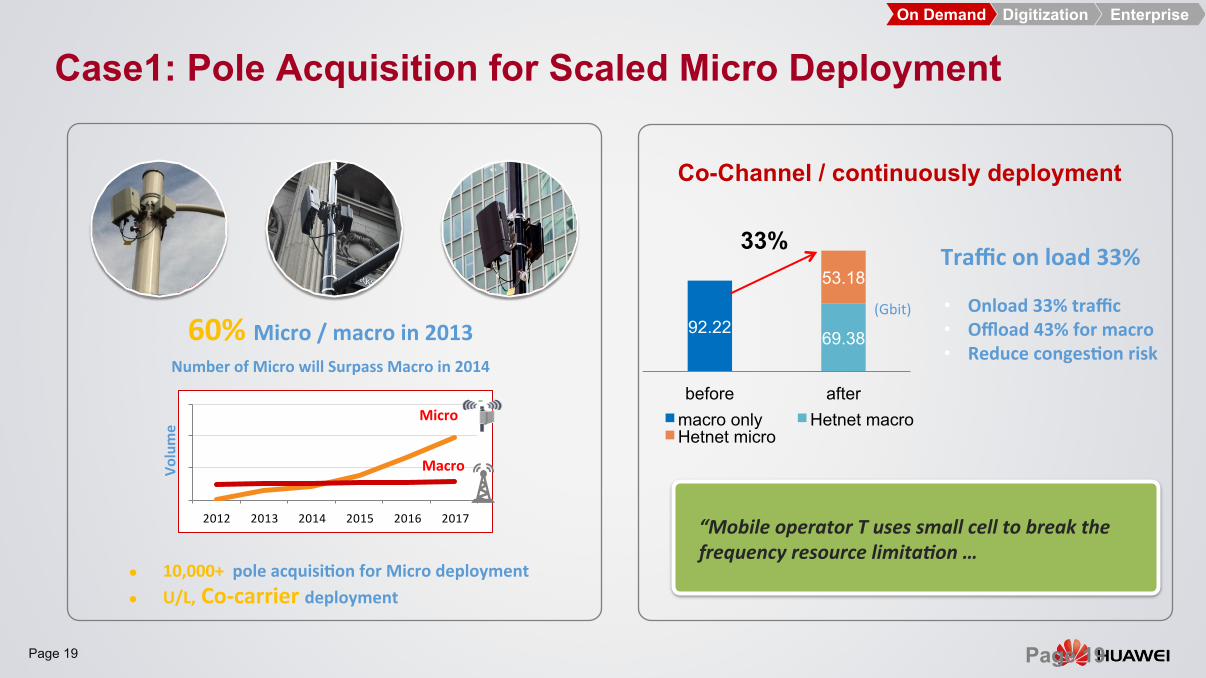
Case1: Pole Acquisition for Scaled Micro Deployment
“Mobile operator T uses small cell to break the frequency resource limita8on …
60% Micro / macro in 2013 Number of Micro will Surpass Macro in 2014
2012 2013 2014 2015 2016 2017
Volume
Macro
Micro
l 10,000+ pole acquisiBon for Micro deployment l U/L, Co-‐carrier deployment
92.22 69.38
53.18
before after macro only Hetnet macro Hetnet micro
(Gbit)
Traffic on load 33%
• Onload 33% traffic • Offload 43% for macro • Reduce congesBon risk
Co-Channel / continuously deployment
Page 19
On Demand Enterprise Digitization
33%
Page 20
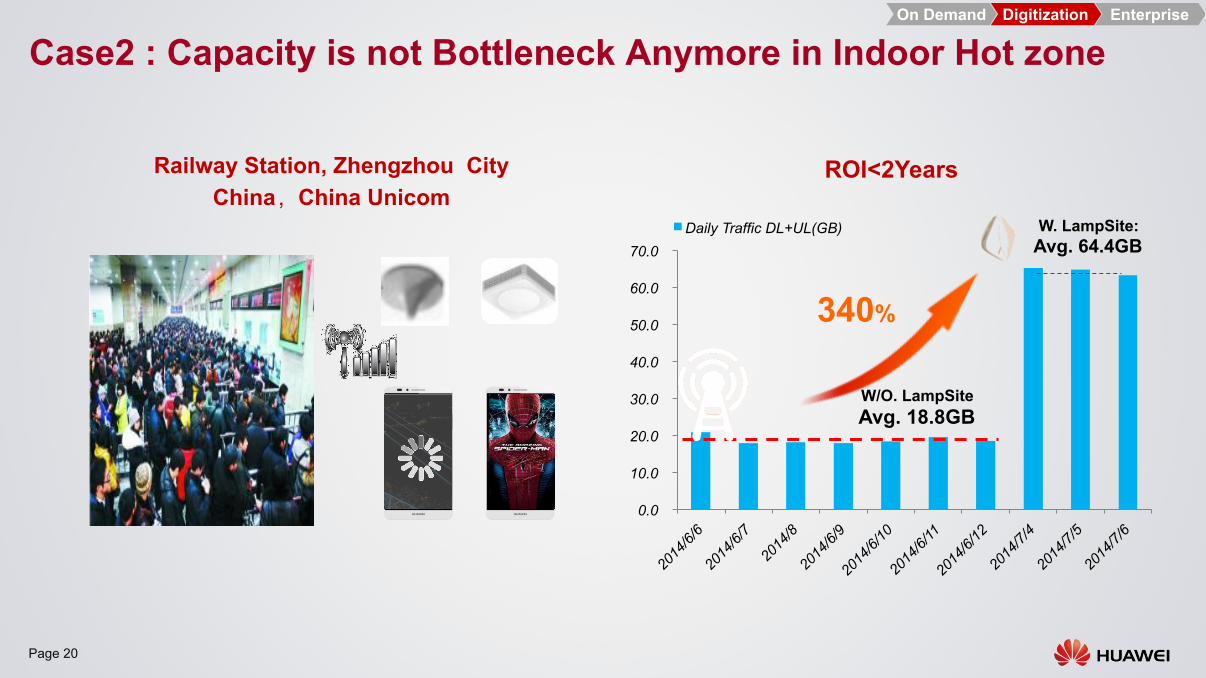
ROI<2Years
0.0
10.0
20.0
30.0
40.0
50.0
60.0
70.0 Daily Traffic DL+UL(GB)
W/O. LampSite Avg. 18.8GB
W. LampSite: Avg. 64.4GB
340%
Railway Station, Zhengzhou City China,China Unicom
Case2 : Capacity is not Bottleneck Anymore in Indoor Hot zone On Demand Enterprise Digitization
Page 21
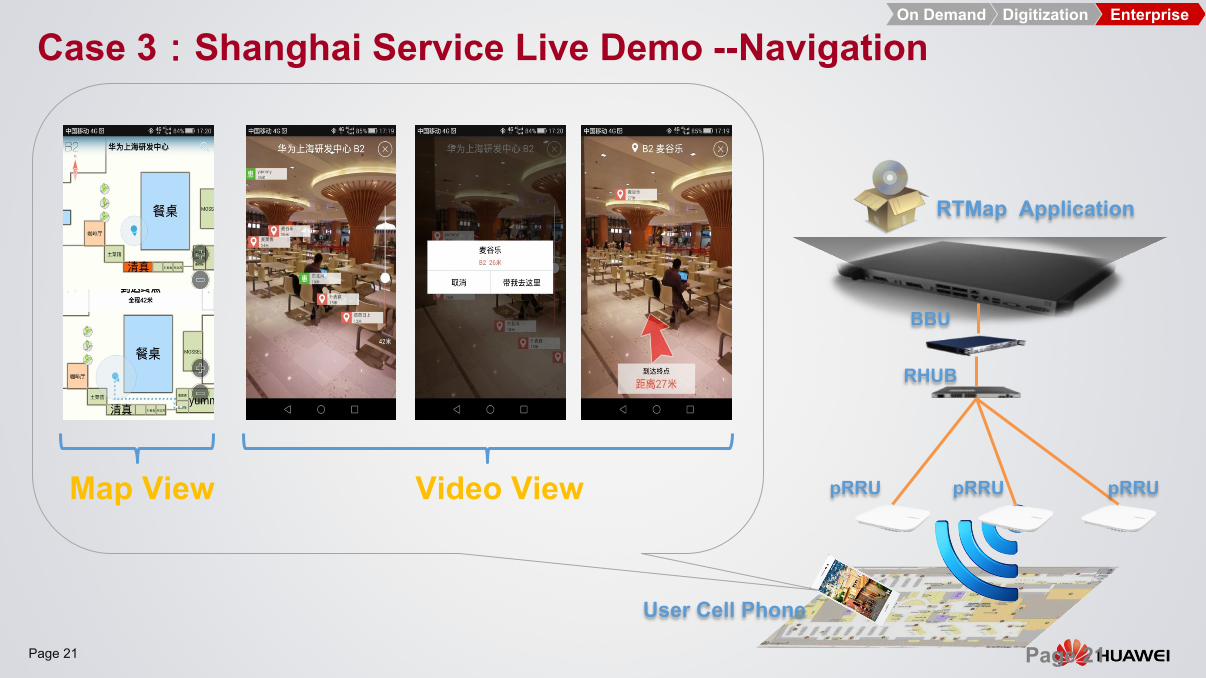
Case 3:Shanghai Service Live Demo --Navigation
Map View Video View
RHUB
BBU
pRRU pRRU pRRU
RTMap Application
User Cell Phone
Page 21
On Demand Enterprise Digitization
THANK YOU www.huawei.com
Copyright©2014 Huawei Technologies Co., Ltd. All Rights Reserved. The information in this document may contain predictive statements including, without limitation, statements regarding the future financial and operating results, future product portfolio, new technology, etc. There are a number of factors that could cause actual results and developments to differ materially from those expressed or implied in the predictive statements. Therefore, such information is provided for reference purpose only and constitutes neither an offer nor an acceptance. Huawei may change the information at any time without notice.
Recommended


![RESEARCH Open Access Uplink interference protection and ... · quently, smaller cell sizes, femto-cell deployment, relays [3,4] and especially inter-cell interference coordination](https://img.pdfslide.us/doc/110x75/5f5c780d18ab1f7ff537e043/research-open-access-uplink-interference-protection-and-quently-smaller-cell.jpg)


![Huawei Dual Cell HSDPA Technology White Paper V1[1].0(20100128)](https://img.pdfslide.us/doc/110x75/542c0f3b219acd9f178b458e/huawei-dual-cell-hsdpa-technology-white-paper-v11020100128.jpg)