Water Treatment Plant Process Audit
Zulkifli Hashim
Objectives
• Quality – to supply a treated water in compliance with WHO standards.
• Quantity – to bring all plants up to at least design capacity, still maintaining the required quality.
Plant Status Survey
• To establish the Plant Status Reports:
i. Equipment.ii. Process.iii. Operation.iv. Maintenance.
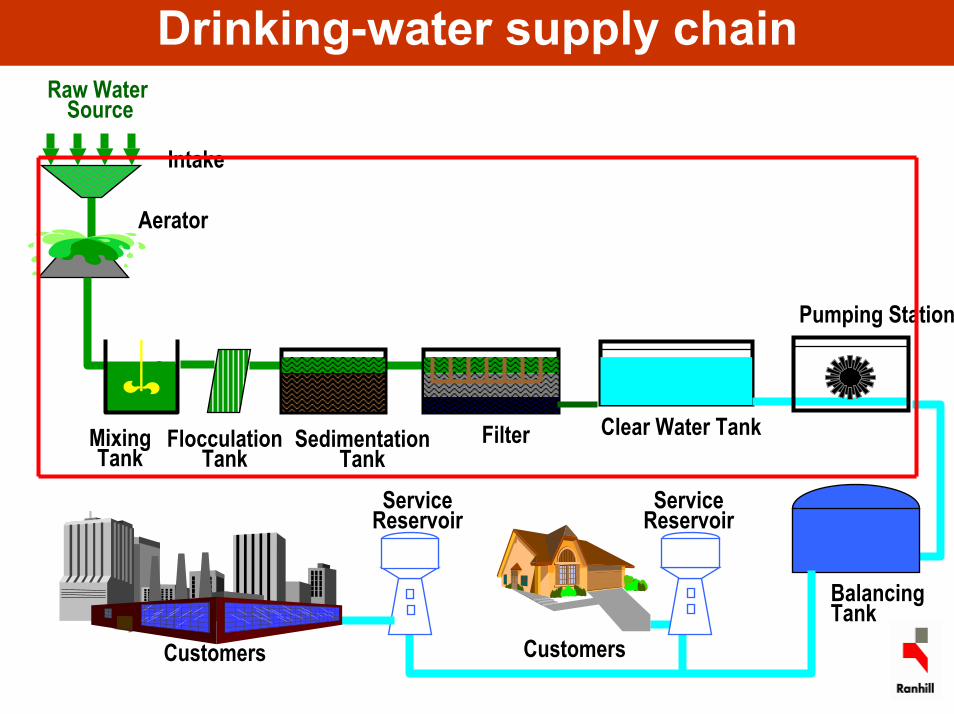
Drinking-water supply chain
Clear Water TankFilterFlocculationTank
Customers
Pumping Station
BalancingTank
Aerator
ServiceReservoir
ServiceReservoir
Customers
MixingTank
Intake
SedimentationTank
Raw Water Source
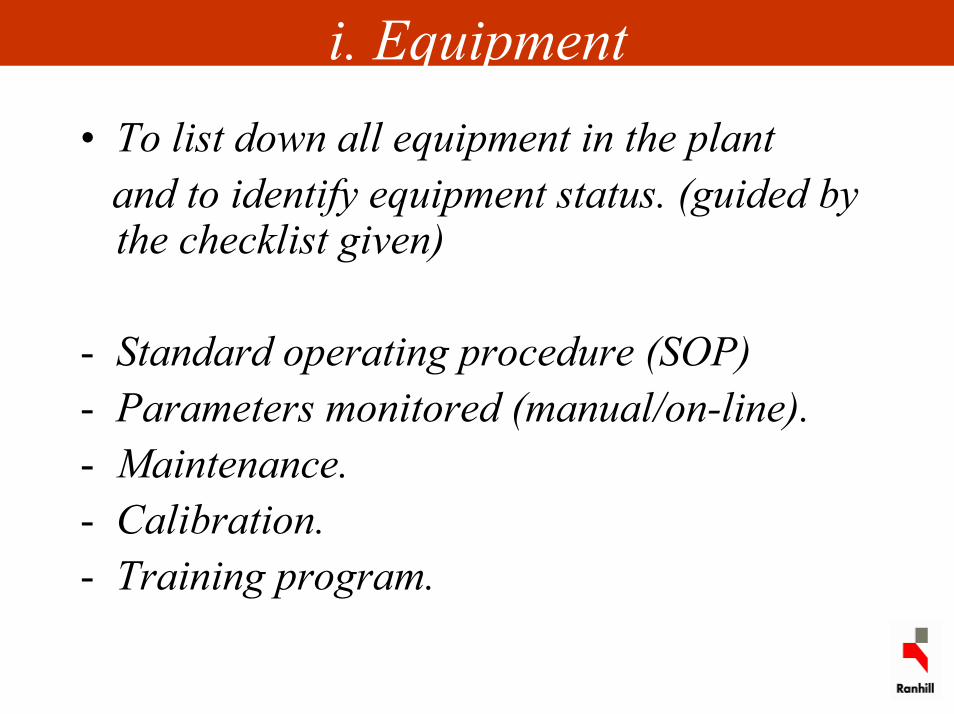
i. Equipment• To list down all equipment in the plant
and to identify equipment status. (guided by the checklist given)
- Standard operating procedure (SOP)- Parameters monitored (manual/on-line).- Maintenance.- Calibration.- Training program.
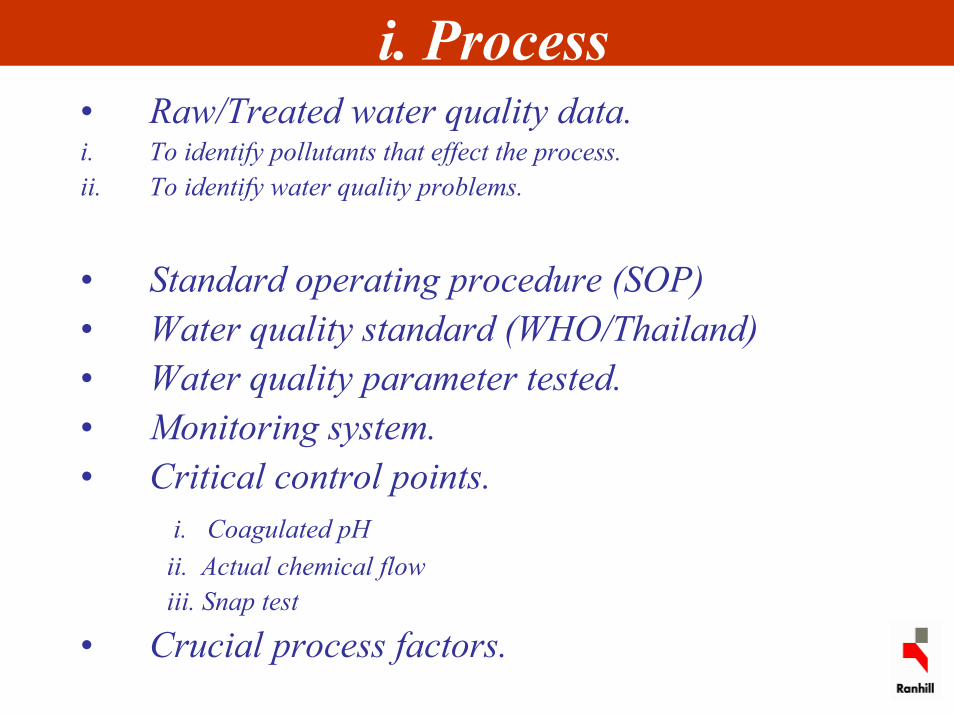
i. Process• Raw/Treated water quality data.i. To identify pollutants that effect the process.ii. To identify water quality problems.
• Standard operating procedure (SOP)• Water quality standard (WHO/Thailand)• Water quality parameter tested.• Monitoring system.• Critical control points.
i. Coagulated pHii. Actual chemical flowiii. Snap test
• Crucial process factors.
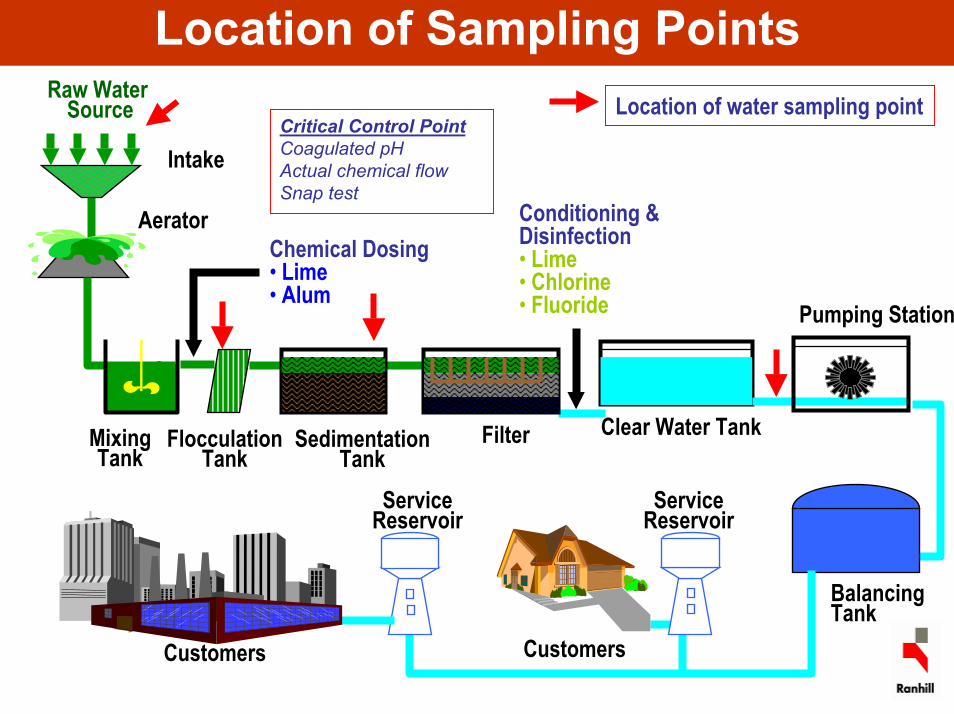
Location of Sampling Points
Clear Water Tank
Conditioning &Disinfection• Lime• Chlorine• Fluoride
FilterFlocculationTank
Customers
Pumping Station
BalancingTank
Aerator
ServiceReservoir
ServiceReservoir
Customers
MixingTank
Chemical Dosing• Lime• Alum
Raw Water Source
Intake
SedimentationTank
Location of water sampling pointCritical Control PointCoagulated pH Actual chemical flowSnap test
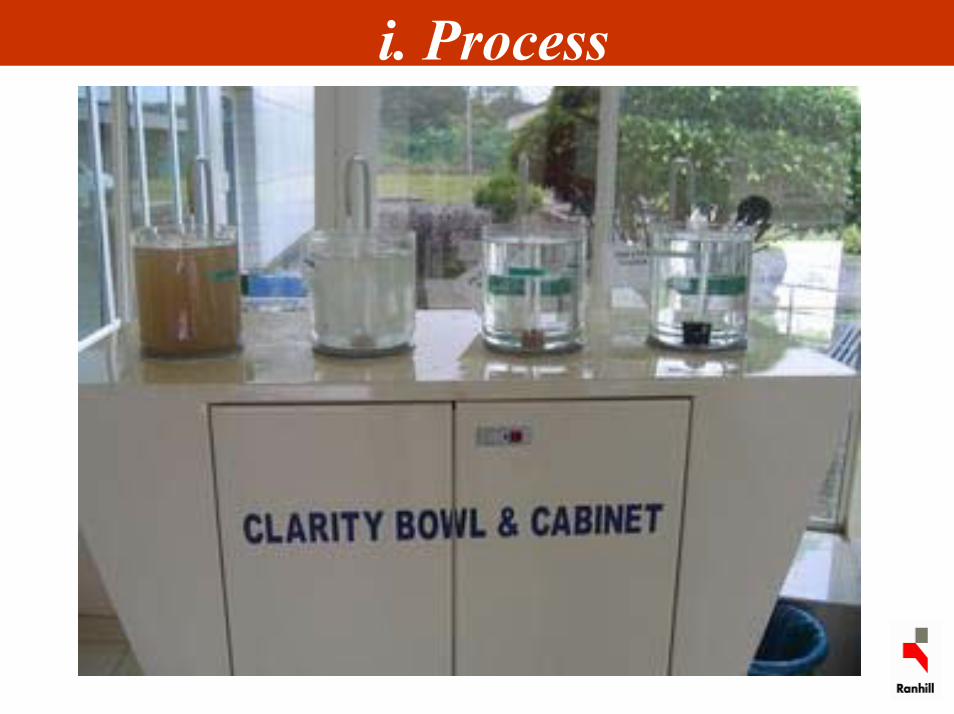
i. Process
Process-cont’
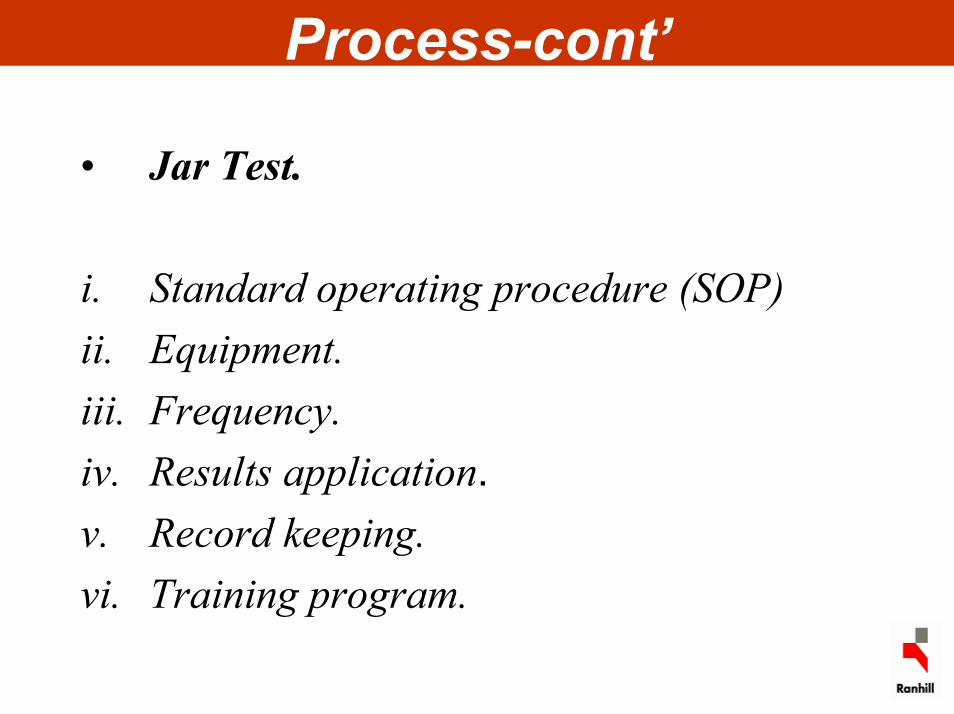
• Jar Test.
i. Standard operating procedure (SOP)ii. Equipment.iii. Frequency.iv. Results application.v. Record keeping.vi. Training program.
Process-cont’
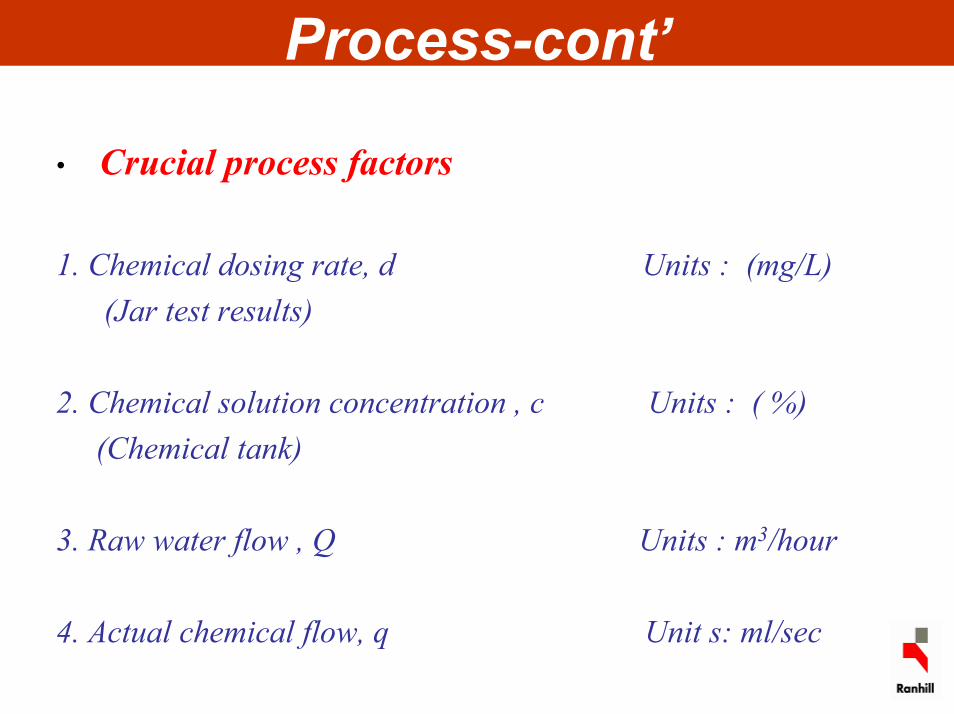
• Crucial process factors
1. Chemical dosing rate, d Units : (mg/L)(Jar test results)
2. Chemical solution concentration , c Units : ( %)(Chemical tank)
3. Raw water flow , Q Units : m3/hour
4. Actual chemical flow, q Unit s: ml/sec
Process-cont’
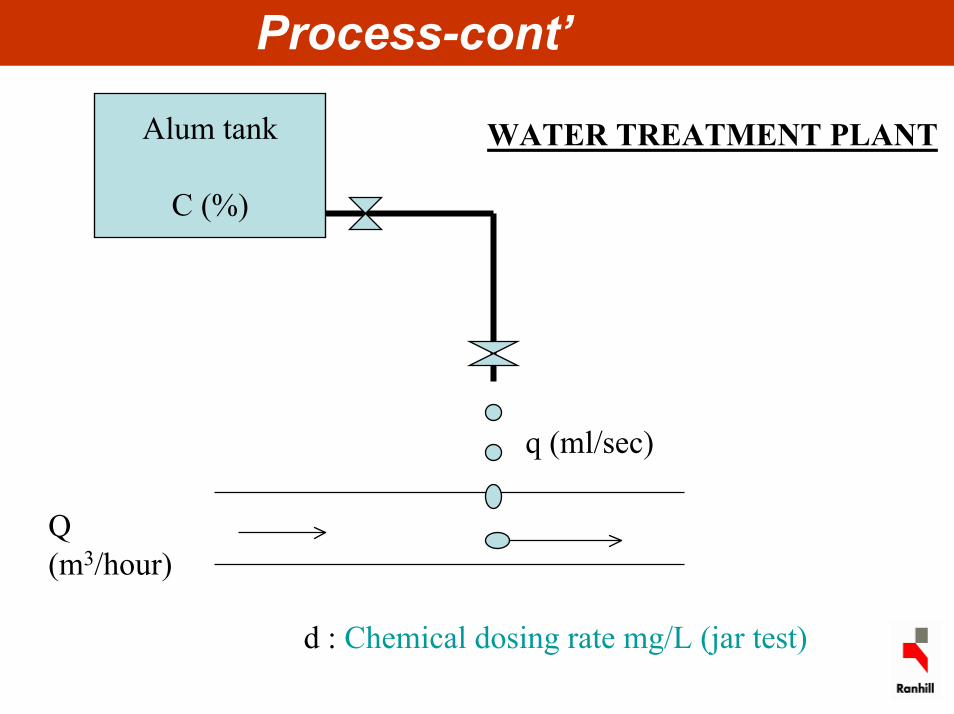
Alum tank
C (%)
WATER TREATMENT PLANT
q (ml/sec)
Q (m3/hour)
d : Chemical dosing rate mg/L (jar test)
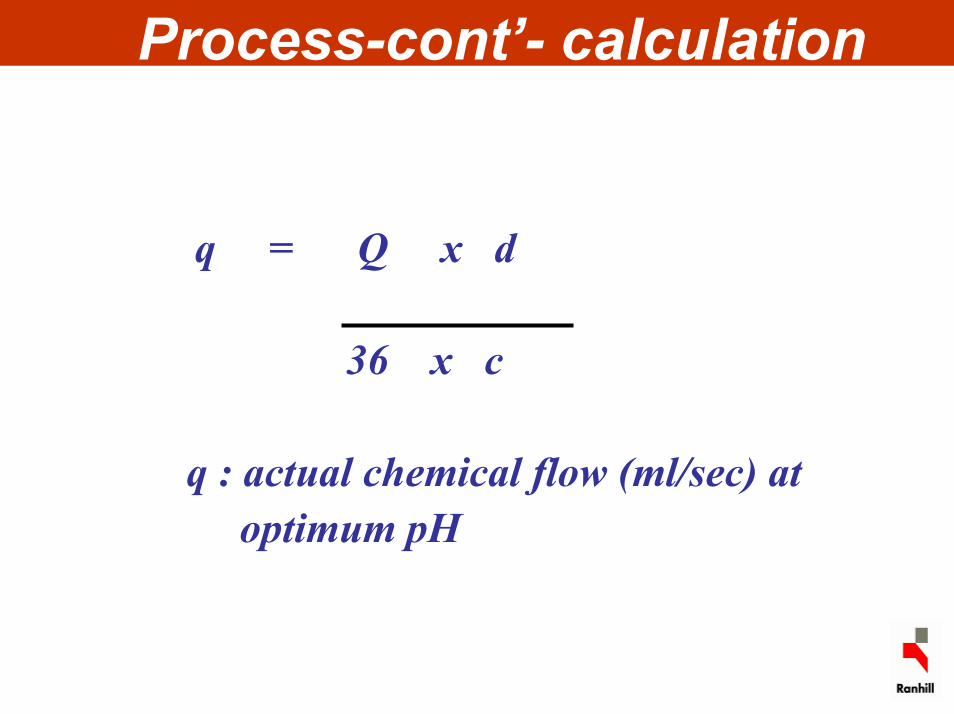
Process-cont’- calculationCalculation
q = Q x d
36 x c
q : actual chemical flow (ml/sec) atoptimum pH
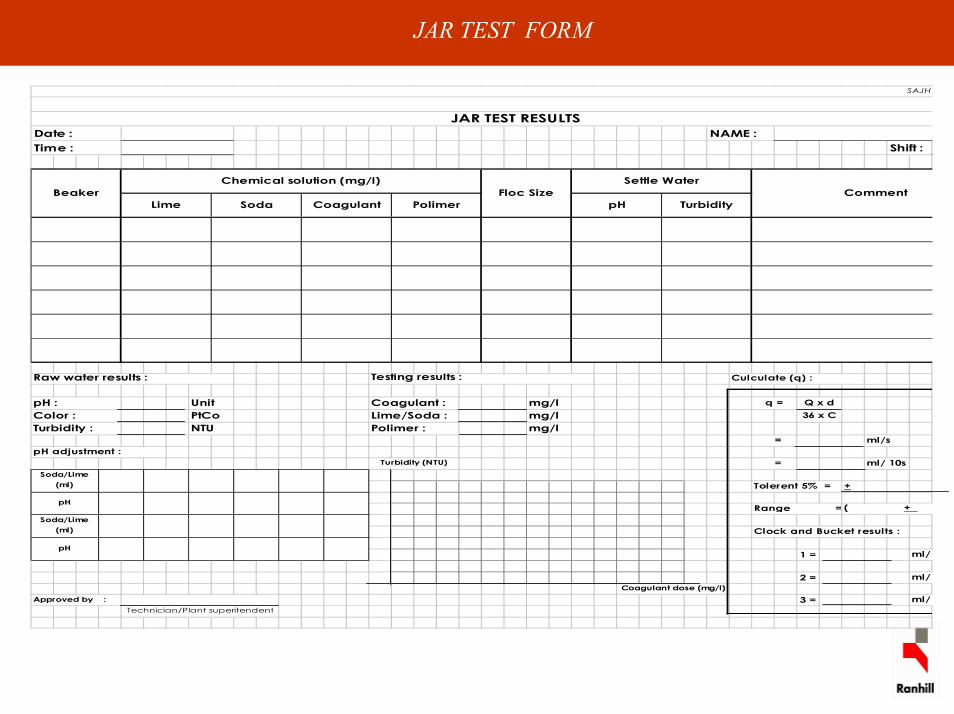
JAR TEST FORM
Unit mg/lPtCo mg/lNTU mg/l
ml/s
ml/ 10s
+
Clock and Bucket results :
1 = ml/
2 = ml/ Coagulant dose (mg/l)
3 = ml/
=
Tolerent 5% =
Range =
Settle WaterComment
Turbidity
Q x d36 x C
q =
Culculate (q) :
pH adjustment : =
( +
Turbidity (NTU)
Soda/Lime (ml)
pH
BeakerLime Soda Coagulant
Chemical solution (mg/l)
Polimer
JAR TEST RESULTS
Shift :
Floc SizepH
SAJH
Raw water results : Testing results :
Date :Time :
NAME :
Technician/Plant superitendentApproved by :
Soda/Lime (ml)
pH
Turbidity :Color :pH : Coagulant :
Lime/Soda :Polimer :
/
Process-cont’
• ‘Clock’ and ‘Bucket’ Test .• Calibration curve (individual metering pump)• Snap Test.• Dosing point location.• Water sampling and testing.• Laboratory facilities.• Record keeping.
iii. Operation• Plant operation.
- Man power set up.(operator/shift) - Operation and Maintenance. (O&M)- Standard operating procedure. (SOP)
(Equipment operation, chemical preparation, sedimentation tank operation.filter operation, etc)
- Record keeping.- Training program.
iv.Maintenance
• Man power set-up.• Operation and Maintenance. (O&M)• Standard operating procedure. (SOP)• Maintenance routines program. • Records keeping.• Training program.
WATER SAFETY PLAN
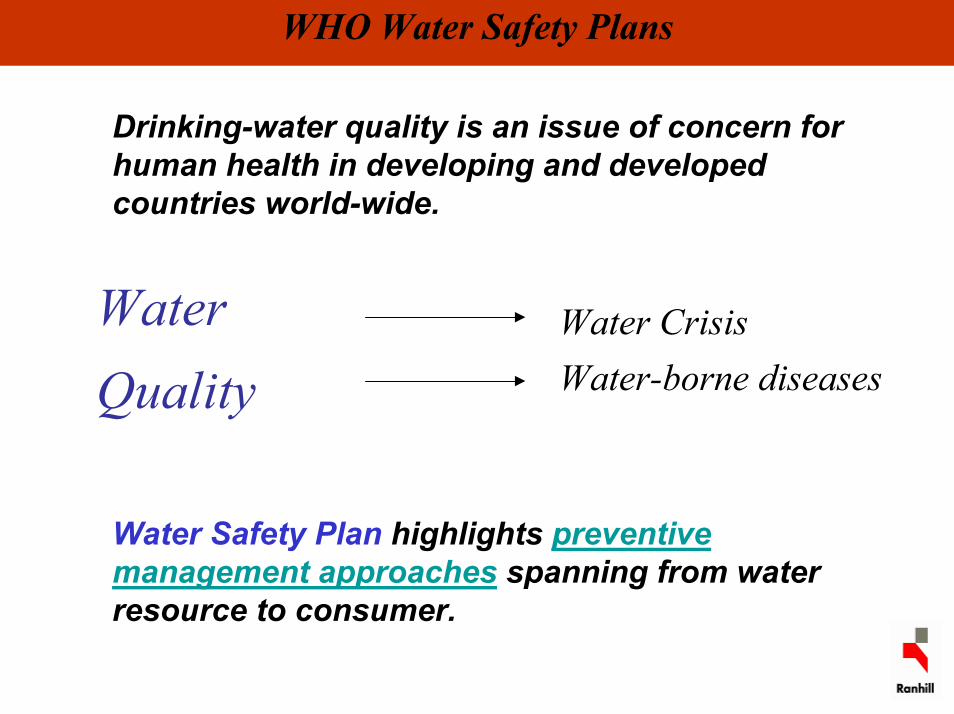
WHO Water Safety Plans
Drinking-water quality is an issue of concern for human health in developing and developed countries world-wide.
Water Quality
Water CrisisWater-borne diseases
Water Safety Plan highlights preventive management approaches spanning from water resource to consumer.
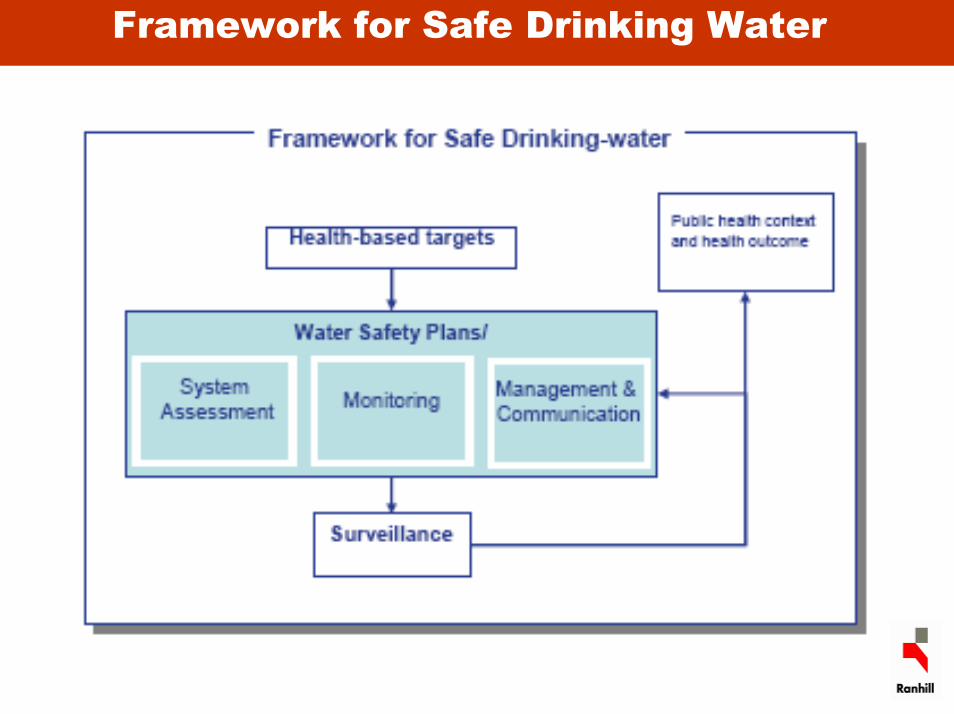
Framework for Safe Drinking Water
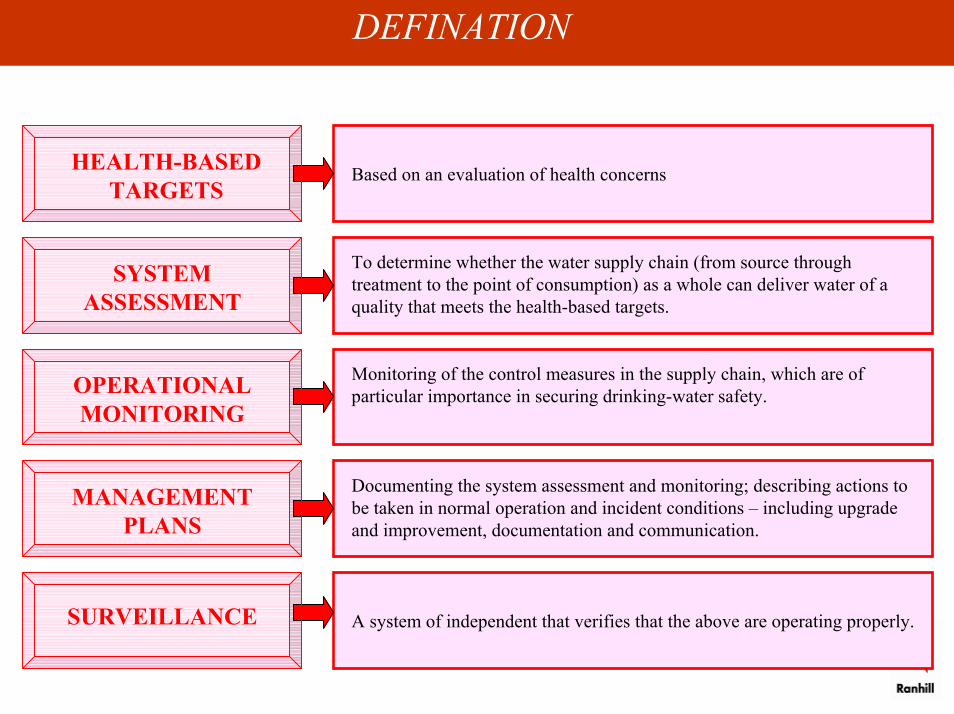
DEFINATION
Based on an evaluation of health concernsHEALTH-BASED TARGETS
To determine whether the water supply chain (from source throughtreatment to the point of consumption) as a whole can deliver water of a quality that meets the health-based targets.
SYSTEM ASSESSMENT
Monitoring of the control measures in the supply chain, which are of particular importance in securing drinking-water safety.OPERATIONAL
MONITORING
Documenting the system assessment and monitoring; describing actions to be taken in normal operation and incident conditions – including upgrade and improvement, documentation and communication.
MANAGEMENT PLANS
A system of independent that verifies that the above are operating properly.SURVEILLANCE
OBJECTIVES
The objectives of a water safety plan are to ensure safe drinking-water through good water supply practice, that is:
• To prevent contamination of sources waters;
• To treat the water to reduce or remove contamination in order to meet the water quality targets; and
• To prevent re-contamination during storage, distribution and handling of drinking-water.
Why WSPs
- Traditional approach
Curative, reactive
- WSPs
Preventive, proactive
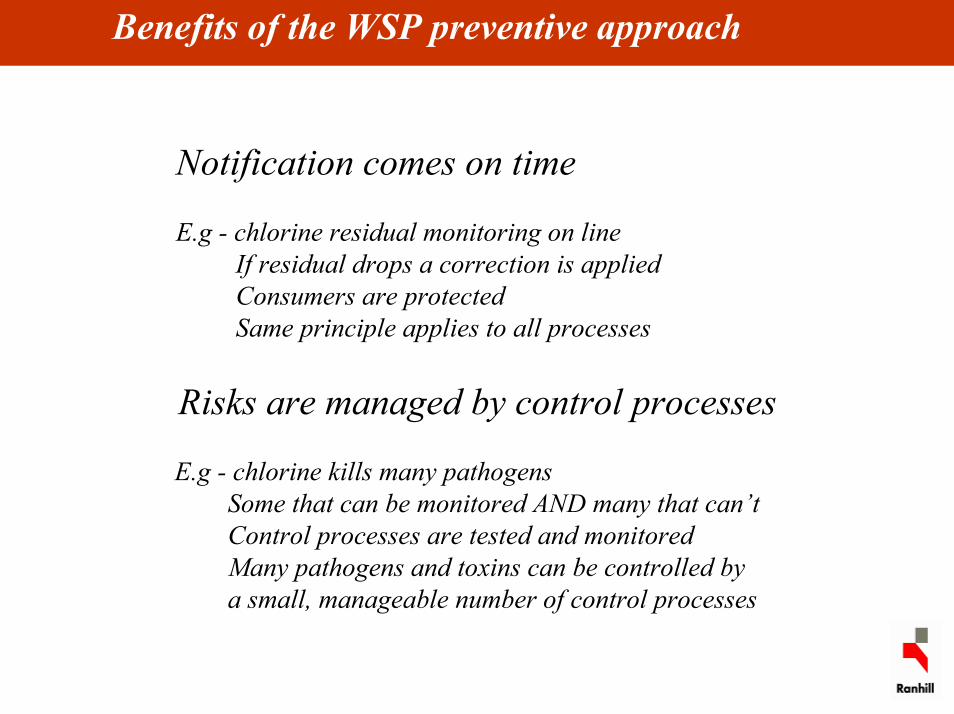
Benefits of the WSP preventive approach
Notification comes on time
E.g - chlorine residual monitoring on lineIf residual drops a correction is appliedConsumers are protectedSame principle applies to all processes
Risks are managed by control processes
E.g - chlorine kills many pathogensSome that can be monitored AND many that can’tControl processes are tested and monitoredMany pathogens and toxins can be controlled bya small, manageable number of control processes
Important WSP Concepts
Prevent contamination, don’t wait for it to happen
Use multiple barriers so that if one barrier fails the water stays safe
Use management systems to make water safety management reliable
Every improvement is worth it and helps improve public health
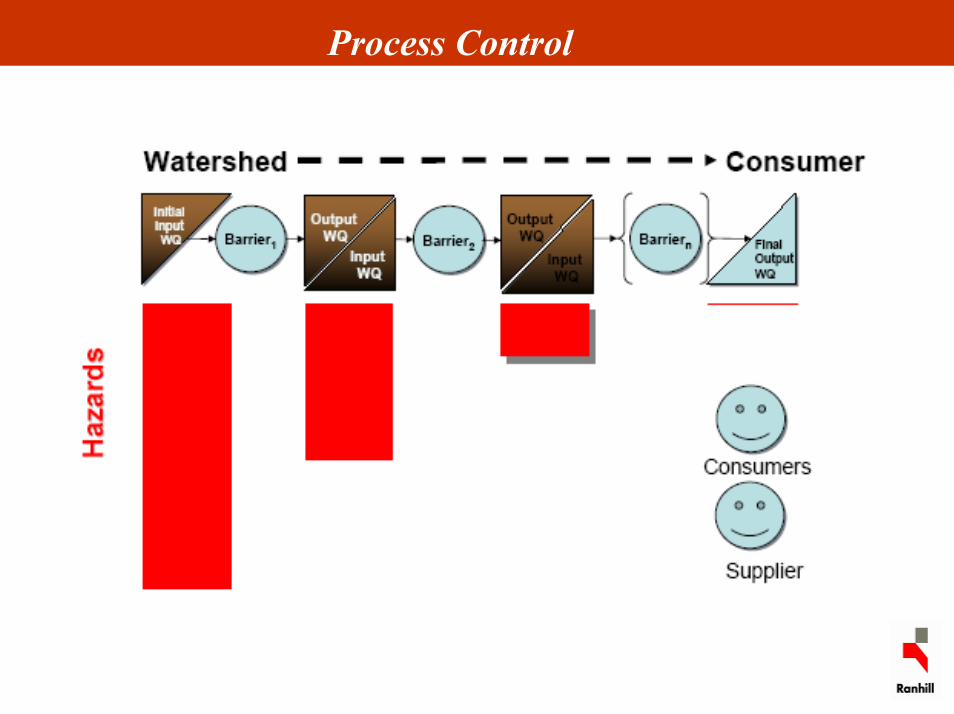
Process Control
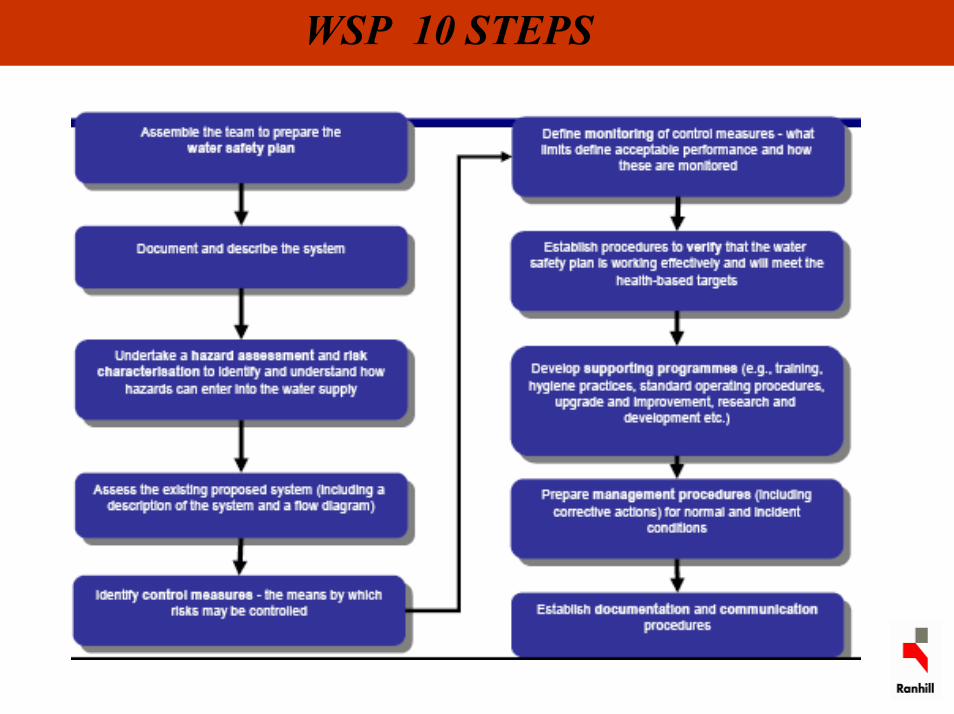
WSP 10 STEPS
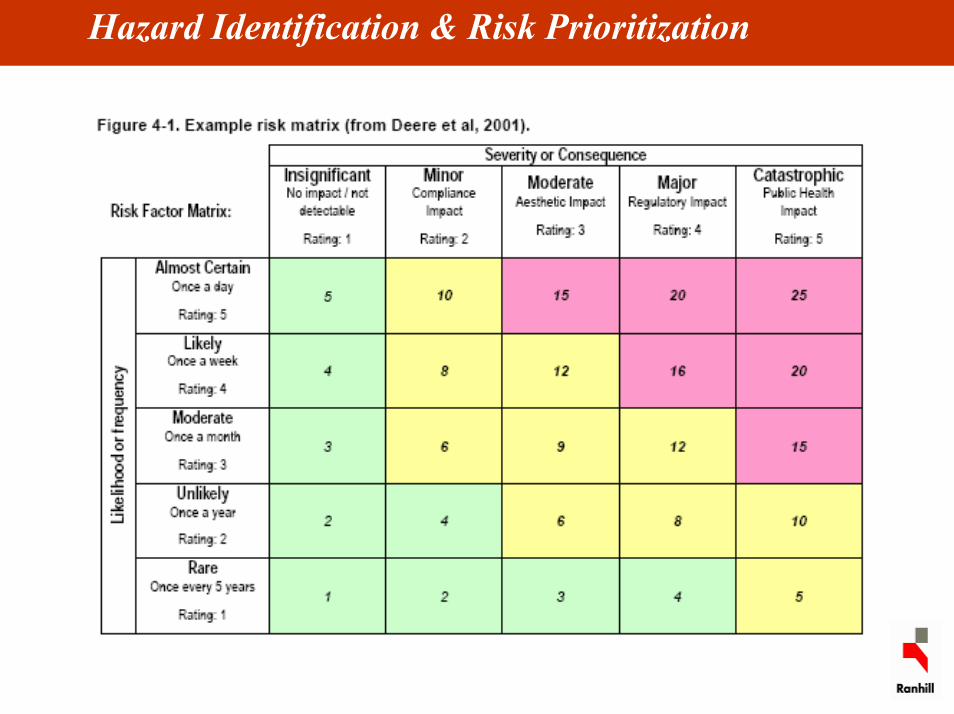
Hazard Identification & Risk Prioritization
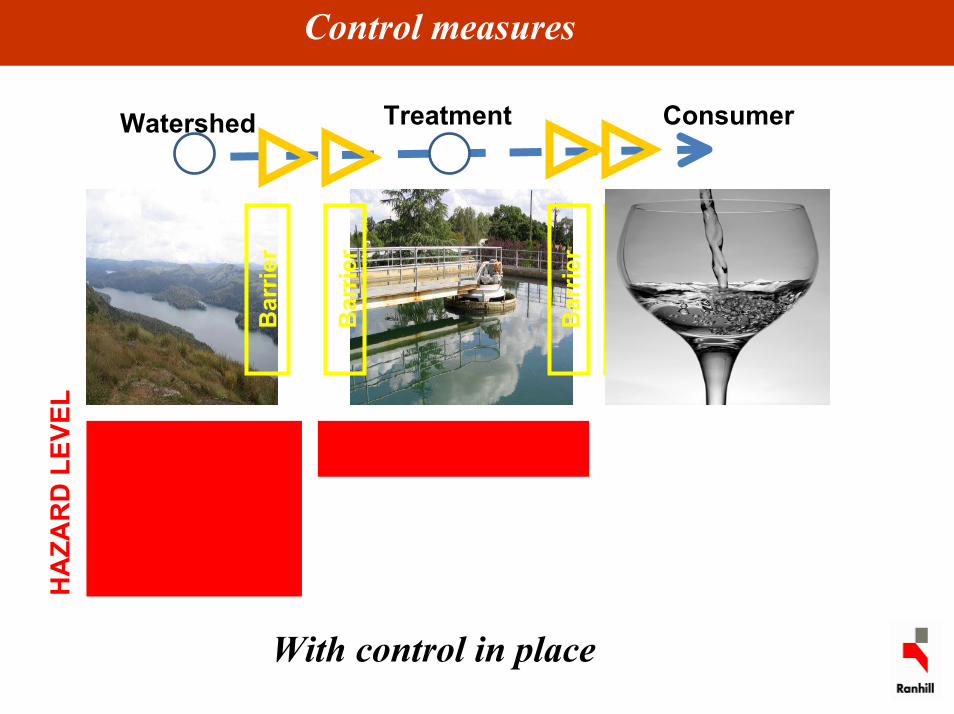
Control measures
Bar
rier
Bar
rier
Bar
rier
HA
ZAR
D L
EVEL
Bar
rier
With control in place
Watershed Treatment Consumer
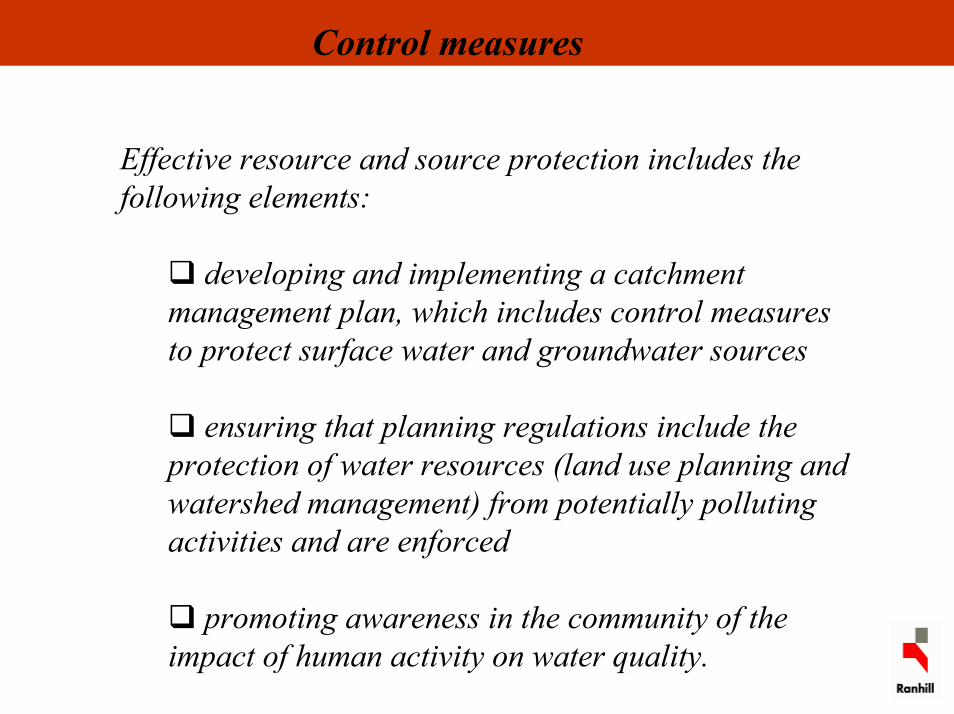
Control measures
Effective resource and source protection includes the following elements:
developing and implementing a catchmentmanagement plan, which includes control measures to protect surface water and groundwater sources
ensuring that planning regulations include the protection of water resources (land use planning and watershed management) from potentially polluting activities and are enforced
promoting awareness in the community of the impact of human activity on water quality.
Control measures
Control measures may include pretreatment, coagulation/flocculation/sedimentation, filtration and disinfection.
Examples of treatment control measures include:coagulation/flocculation and sedimentation;use of approved water treatment chemicals and materials;control of water treatment chemicals;process controls;availability of backup systems;water treatment process optimization, includingchemical dosingfilter backwashingflow rateuse of water in storage in periods of poor-quality raw water; andsecurity to prevent unauthorized access and tampering.
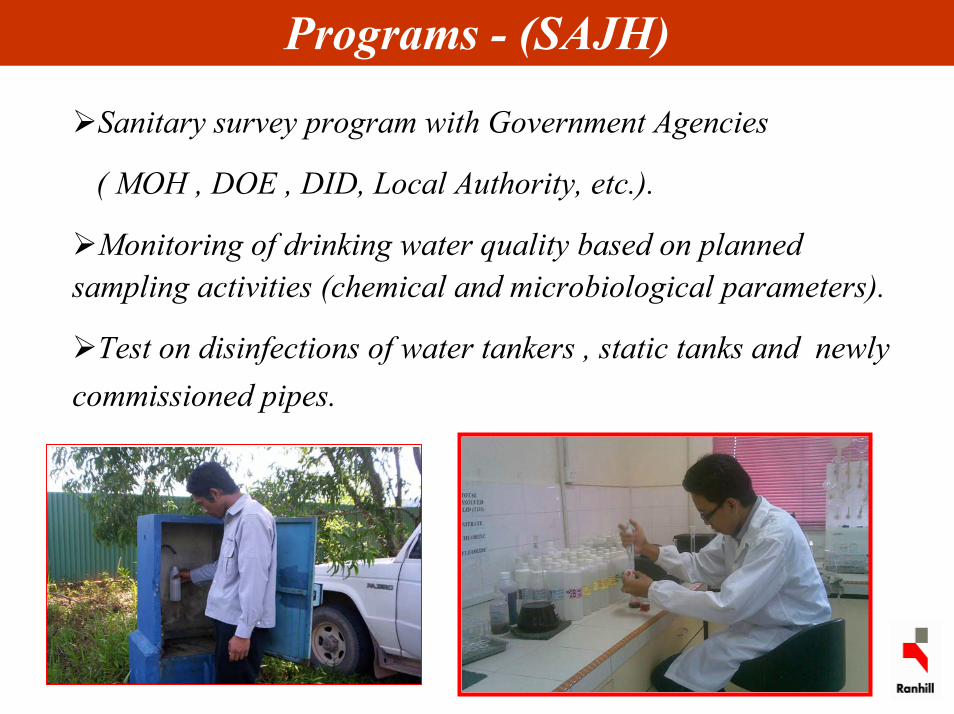
Programs - (SAJH)s
Sanitary survey program with Government Agencies
( MOH , DOE , DID, Local Authority, etc.).
Monitoring of drinking water quality based on planned sampling activities (chemical and microbiological parameters).
Test on disinfections of water tankers , static tanks and newlycommissioned pipes.
Programs – Cont’
Random tests on completed repaired mains.
Respond to any internal/external customers enquiries regarding water quality issues.
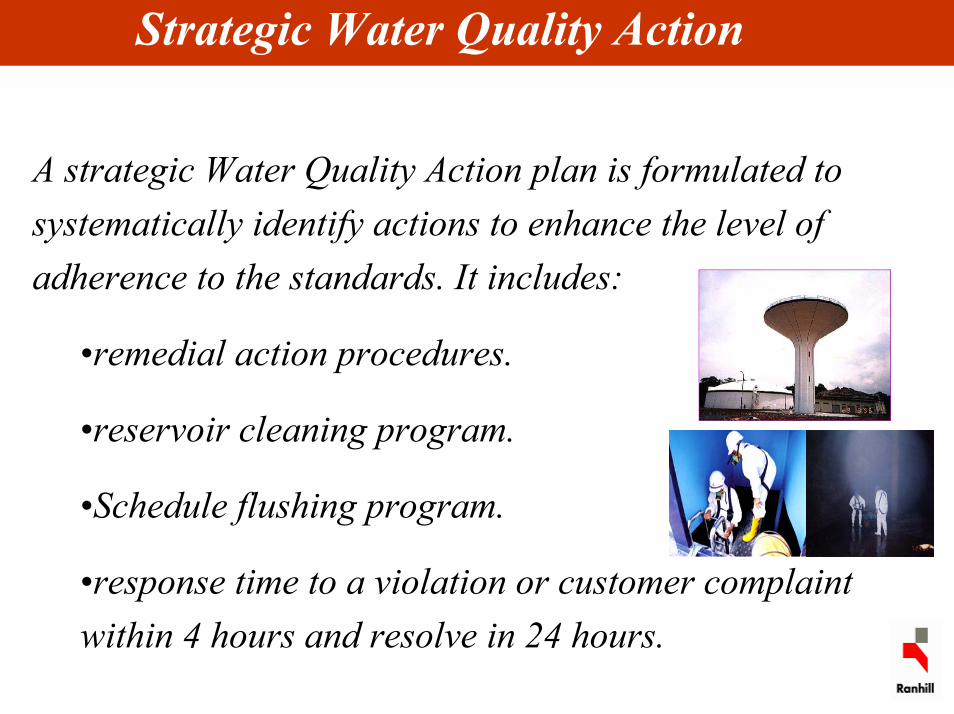
Strategic Water Quality Action
A strategic Water Quality Action plan is formulated to systematically identify actions to enhance the level of adherence to the standards. It includes:
•remedial action procedures.
•reservoir cleaning program.
•Schedule flushing program.
•response time to a violation or customer complaint within 4 hours and resolve in 24 hours.
Thank You
Recommended

![Orientation%20to%20 report%20writing writing%20process[1]](https://img.pdfslide.us/doc/110x75/559995c51a28abe5278b46aa/orientation20to20-report20writing-writing20process1.jpg)