IMAGE HERE INTO GREY AREA.Consumer
Confidence
Tracker
November 2010
Prepared by Luke Reaper &
John Clarke
J.1814
2J.1814
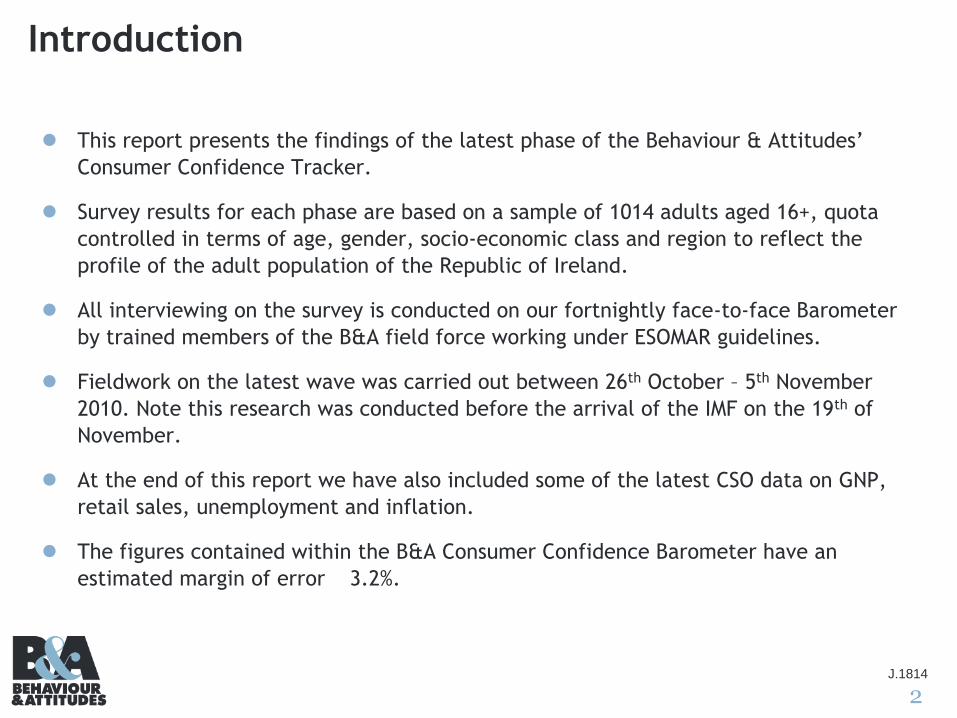
Introduction
This report presents the findings of the latest phase of the Behaviour & Attitudes’
Consumer Confidence Tracker.
Survey results for each phase are based on a sample of 1014 adults aged 16+, quota
controlled in terms of age, gender, socio-economic class and region to reflect the
profile of the adult population of the Republic of Ireland.
All interviewing on the survey is conducted on our fortnightly face-to-face Barometer
by trained members of the B&A field force working under ESOMAR guidelines.
Fieldwork on the latest wave was carried out between 26th October – 5th November
2010. Note this research was conducted before the arrival of the IMF on the 19th of
November.
At the end of this report we have also included some of the latest CSO data on GNP,
retail sales, unemployment and inflation.
The figures contained within the B&A Consumer Confidence Barometer have an
estimated margin of error 3.2%.

3J.1814
About Behaviour & Attitudes
Behaviour and Attitudes is Ireland’s largest and most experienced independently
owned research company. We have 30 permanent staff members which includes 10
directors, the most experienced team in the Irish market. In addition, we have a
team of over 150 experienced, fully trained face-to-face interviewers nationwide.
Our Dublin CATI (telephone) Unit is based in our offices in Milltown and has a
capacity for over 60 interviewers.
Established 25 years ago, Behaviour and Attitudes provides a full range of market
research services, ranging from CAPI (Computer Aided Personal Interviewing),
through to standard face-to-face interviewing surveys, CATI (Computer Aided
Telephone Interviewing), central location interviewing, as well as an in-house CAWI
(Computer Aided Web Interviewing) Unit. The company would be well known for
having pioneered the development of qualitative research in Ireland.
Despite being the second largest market research company in Ireland, Behaviour &
Attitudes has a very well defined and tight company structure which is built around
excellent client service delivery principles.
Behaviour & Attitudes is fully owned by its 10 Directors. These Directors are fully
involved in day-to-day research on behalf of their clients. Hence our clients have
access to the most senior team in the Irish marketplace.
For more information please visit our website at: www.banda.ie

4J.1814
Summary
In the last Behaviour & Attitudes Consumer Confidence Barometer in July 2010, we
saw indications that some consumer optimism was returning, with the most positive
sentiments recorded since June 2007. Unfortunately in the interim period, increasing
levels of uncertainty related to financial and political stability have seen confidence
levels decline dramatically to the lowest levels recorded this year.
Consumer perceptions of the year ahead are distinctly pessimistic this wave, following
four waves of regression in negative sentiment. Consumer confidence in this measure
is now at its lowest point since May 2009.
Fears related to the upcoming budget, the security of the banking sector and the
country’s fiscal demands have seen concern related to personal finances increase
dramatically over the last quarter, to levels seen in September 2009.
In parallel to the decrease in confidence in personal finances; intentions to purchase
goods and services, in the year ahead, have decreased significantly this wave. This is
a possible reaction to the increasing levels of uncertainty about the impact of
forthcoming budgetary measures on take home pay and household income. Levels of
concern related to the political and economic future of the State regarding the
proposed IMF/EU recapitalisation at the time of interviewing are reflected in the
sustained negative trend among consumer perceptions.

5J.1814
Summary
The table below summarises the net scores for each element of the October/November
survey compared to previous waves.
Pre 2008
Historic Low2009 2010
DateNet
ScoreNet Scores Net Scores
UNWTD. SAMPLE Date Score Mar May Sept Nov March July November
% % % % % % % % %
Economy - looking back
a yearNov '02 -62 -88 -93 -91 -86 -81 -50 -82
Economy - looking
forward one yearNov '02 -63 -74 -76 -65 -58 -54 -20 -74
Personal finance -
looking back a yearNov '02 -40 -57 -62 -67 -63 -65 -43 -67
Personal income -
looking forward a yearNov '02 -20 -54 -63 -63 -55 -54 -33 -65
Personal assets - looking
forward one year Jan'02 -2 -55 -53 -55 -47 -49 -26 -55
Purchasing intentions -
the year aheadNov '02 -24 -61 -55 -60 -53 -51 -36 -56
Savings - the year aheadNov '02 -35 -56 -56 -60 -51 -53 -37 -54
The improved mood in the Summer, has now declined to 2009 levels.

6J.1814Q.1 Thinking about the economy as a whole, do you think that the country is better off,
worse off, or about the same as last year?
Economy – Looking Back
Better off
Same
Worse off
COUNTRY
IS NOW …
GAP -40 -59 -13 +3 +8 -6 -64 -89 -88 -93 -91 -86 -81 -50 -82
LONG TERM 2009
2002 20052003 2004 2006 2007 2008 Mar May Sept Nov
2010
Mar2009
July
53%
66%
35%26% 23%
28%
70%
91% 90% 94% 92% 88% 84%
61%
84%
34%
27%
42%
45%46%
50%
23%
7% 8%5% 7%
10%13%
28%
14%13%
7%
23%29% 31%
22%
6% 2% 2% 1% 1% 2% 3%11%
2%
Nov

7J.1814
Economy – Looking Forward
Better off
Same
Worse off
GAP -36 -50 -17 -2 = -15 -59 -68 -74 -76 -65 -58 -54 -20 -74
Country
will be …
Q.2 And what about the coming year, do you think that the country will be better off, worse
off or about the same as this year?
49%59%
37%27% 26%
34%
67%74% 77% 80%
73%66% 63%
42%
78%
38%
32%
43%
48% 48%
47%
25%20%
20% 16%
19%25%
28%
36%
17%
13% 9%
20%25% 26%
19%
8% 6% 3% 4% 8% 8% 9%
22%
4%
LONG TERM 2009
2002 20052003 2004 2006 2007 2008 Mar May Sept Nov
2010
Mar2009
July Nov

8J.1814
Balance Of Opinion
Economy
Long Term Short Term
Balance +/-
-40
-59
-13
38
-6
-64
-41
-55
-69-73 -77 -79
-88-93 -91 -86
-81
-50
-82
-36
-50
-17
-2 0
-15
-59 -42-56
-66 -67 -65-69
-74-76
-65
-58-54
-20
-74
-100
-90
-80
-70
-60
-50
-40
-30
-20
-10
0
10
2002 2003 2004 2005 2006 2007 2008 Jan Mar July Sept Oct Dec Mar May Sept Nov Mar July Nov
Looking Back
Looking Forward
YEARLY AVERAGES 20092008 2010
Most significant drop in economic opinion on both measures, in one period, across all data.

9J.1814
Q.3 Do you feel better off financially, worse off financially or about the same compared to
last year?
Personal Finances – Looking Back
Better off
Same
Worse off
Now feel …
GAP -23 -34 -11 +1 +4 +4 -35 -63 -57 -62 -67 -63 -65 -43 -67
38%44%
32%24% 22% 20%
44%
65%60%
64%69%
66% 67%
50%
69%
47%
45%
47%
51% 52% 56%
46%
32%37%
34%28%
31% 31%
43%
28%
15%11%
21%25% 26% 24%
9%2% 3% 2% 2% 3% 2%
7%2%
LONG TERM 2009
2002 20052003 2004 2006 2007 2008 Mar May Sept Nov
2010
Mar2009
July Nov

10J.1814
Q.5 Do you expect your income in the next year, after inflation and taxes,
to be higher, lower or the same as in the last twelve months?
Personal Finances – Looking Forward
Higher
The same
Lower
Expect it to
be …
GAP -2 -8 +8 +16 +18 +15 -21 -59 -54 -63 -63 -55 -54 -33 -65
24% 27%
17% 13% 12% 13%
34%
64%60%
67% 67%62%
58%
44%
70%
54% 54%
58%58%
58% 59%
52%
30%34%
29% 29%31% 38%
46%
24%
22% 22%25% 25%
30% 28%
13%5% 6% 4% 4% 7% 4%
11%5%
LONG TERM 2009
2002 20052003 2004 2006 2007 2008 Mar May Sept Nov
2010
Mar2009
July Nov

11J.1814
Balance Of Opinion - Personal Finances
Balance +/-
-23
-34
-11
14 4
-35
-12-9
-32
-48-43
-50
-57-62
-67 -63 -65
-43
-67
-2
-8
8
16 18
15
-21
3
-1
-20-26
-38-44
-54
-63
-61
-55-54
-33
-65
-70
-60
-50
-40
-30
-20
-10
0
10
20
2002 2003 2004 2005 2006 2007 2008 Jan Mar July Sept Oct Dec Mar May Sept Nov Mar Jul Nov
Looking Back
Looking Forward
Long Term Short Term
YEARLY AVERAGES 20092008 2010

12J.1814
Q.6 Do you expect your assets (your house, shares, pension entitlements, savings)
In the next year to be higher, lower or the same as in the past year? PROBE: A lot or a little
Personal Assets– Looking Forward
More
No change
Less
Expect them to
be …
Difference +6 +9 +21 +31 +33 +20 -20 -53 -55 -53 -55 -47 -49 -26 -55
13% 13%7% 5% 5% 8%
35%
55% 57% 55% 57%50% 52%
33%
57%
68% 65%
65%
59% 57%
64%
55%
42% 41% 43% 41%47% 45%
60%
40%
19% 22%28%
36% 38%
28%
10%2% 2% 2% 2% 3% 3%
7%2%
LONG TERM 2009
2002 20052003 2004 2006 2007 2008 Mar May Sept Nov
2010
Mar2009
July Nov

13J.1814
Q.7 In the year ahead, do you expect to purchase more, less or the same amount of goods
and services as in the past year?
Purchasing Goods And Services – Looking Forward
More
The same
Less
Expect to
purchase …
Difference -10 -12 = +4 +7 +5 -29 -63 -61 -55 -60 -53 -51 -36 -56
26% 27%
18% 16% 14% 15%
39%
66% 64%59% 63%
57% 55%
42%
60%
58% 58%
64%64% 65% 65%
50%
31% 33%37%
35%39% 40%
52%
36%
16% 15% 18% 20% 21% 20%
10%3% 3% 4% 3% 4% 4% 6% 4%
LONG TERM 2009
2002 20052003 2004 2006 2007 2008 Mar May Sept Nov
2010
Mar2009
July Nov

14J.1814
Q.8 Do you expect to save more, less or the same amount in the year ahead compared with
the last twelve months?
Savings – Looking Forward
More
The same
Less
Expect to
save …
Difference -23 -28 -8 -5 -1 -5 -34 -56 -56 -56 -60 -51 -53 -37 -54
36% 39%
25% 23%19%
23%
44%
62% 62% 62%66%
57% 60%
44%
62%
51%50%
58% 59%63%
59%
46%
32% 31% 32%28%
37% 33%
50%
30%
13% 11%17% 18% 18% 18%
10%6% 6% 6% 6% 6% 7% 7% 8%
LONG TERM 2009
2002 20052003 2004 2006 2007 2008 Mar May Sept Nov
2010
Mar2009
July Nov

15J.1814
Balance Of OpinionExpectations in regard to assets, purchases, and savings
Balance +/-
69
21
3133
20
-25
-4
-20
-19
-27
-38-39
-55 -53-55
-47 -49
-26
-55
-10
-12
-12
4 7 5
-29
-5-13
-28-34
-43-51
-61
-55
-60
-53-51
-36
-56
-23-28
-8
-5-1
-5
-34
-13
-4
-35 -34
-50 -52-56
-56 -60
-51
-53
-37
-54
-70
-60
-50
-40
-30
-20
-10
0
10
20
30
40
2002 2003 2004 2005 2006 2007 2008 Jan Mar July Sept Oct Dec Mar May Sept Nov Mar Jul Nov
Assets
Purchase
Savings
Long Term Short Term
YEARLY AVERAGES 20092008 2010

16J.1814
CSO DATA(latest estimates 2010)

17J.1814
Initial Estimates: Quarterly Increase in GDP but
GNP down slightly% Change on previous quarter
-6
-5
-4
-3
-2
-1
0
1
2
3
4
GDP
GNP
2008
Q1
2008
Q3
2008
Q2
2008
Q4
2009
Q1
2009
Q2
2009
Q3
*Source: CSO Estimates as of 23rd September 2010
%
Initial estimates for the second quarter of 2010 show a decrease, on a seasonally adjusted basis, of 1.2 per cent in GDP and a decline of 0.3 per cent in GNP compared with the previous quarter. In comparison with the corresponding quarter of 2009, GDP at constant prices was 1.8 per cent lower while GNP was 4.1 per cent lower.
2009
Q4*
2008 2009 2010
2010
Q1
Figures – GDP and GNP at constant market prices seasonally adjusted.
2010
Q2

18J.1814
Unemployment RatesSeasonally adjusted
% of labour force
2008
The unemployment rate does not take into account reduced working hours up to 3 days a
week, etc as does the Live Register
2008Average for ’08 was 6.3
2009Average for ‘09 was 11.6%
*Source: Line chart relates to CSO latest estimates published June 2010 (seasonally adjusted standardised unemployed rates (SUR)
2009
4.4 4.4 4.6 4.8 4.95.2 5.2
5.55.9
6.36.8
7.17.6
8.18.6
9.5
10.210.8
11.211.6
11.912.2 12.3
12.7 12.913.3 13.1 13.1 12.9 13 13 13.2 13.4
13.7 13.8 13.7
0
2
4
6
8
10
12
14
16
18
20
2010
2010
QNHS July – Sept 09 = 12.3%
QNHS Oct – Dec ‘09 = 13.3%
QNHS Jan-Mar ’10 = 12.9%
QNHS Apr-Jun ’10 = 13.2%

19J.1814
162,700
166,000
167,000
171,300
173,200
179,300186,300
197,900
198,400
205,900215,100
225,900
236,100
245,800
261,800
278,300
294,300
325,700
351,000
371,000
387,200
400,900
412,900
423,400
426,200427,400
425,400
426,800
428,900434,700
432,400
433,000
432,500
439,100444,900
454,500455,000
449,600
443,000
150,000
200,000
250,000
300,000
350,000
400,000
450,000
Aug Sept Oct Nov Dec Jan Feb Mar Apr May Jun Jul Aug Sept Oct Nov Dec Jan Feb Mar Apr May Jun Jul Aug Sept Oct Nov Dec Jan Feb Mar Apr May June July Aug Sept Oct
The Live Register Seasonally adjusted
* The Live Register is not designed to measure unemployment. It includes part-time work e.g. seasonal & casual workers who work up to 3 days per week
Total PersonsPersons on live
Register
Month
*Source: CSO latest estimates November 2010
20092007 20102008
Live Register figures
have modestly reduced
in the last two months.

20J.1814
Duration of Time on Live Register
324993 322158328477 333979 329211 323388
315266 311857 315687322270 318520
294636281945
87414 91347 95118102957 107745 111733 117391
126065137195
144554 148402 147781 147608
0
50000
100000
150000
200000
250000
300000
350000
400000
Oct-09 Nov-09 Dec-09 Jan-10 Feb-10 Mar-10 Apr-10 May-10 Jun-10 Jul-10 Aug-10 Sep-10 Oct-10
Less than one year More than one year
-1%2%
2% -1%-2%
-3%-1%
1%2% -1%
-7%
-4%
4% 4%8% 5%
4%5%
7%9%
5%3% 0% 0%
*Source: CSO, Latest Estimates November 2010.
Short term unemployment has seen modest reductions since August, while long term
unemployment appears to have plateaued.

21J.1814
Actual Redundancies January - December 2010 Monthly Redundancy comparison 2009 vs 2010
% diff. -0.3% -9.7% -29.4% -20.0% -37.3% -21.7% -15.8% -24.9% -29.6% -40.4%
6588
6212
7680
7131
7948
6764
6285
58315989
6561
5891
4121
6571
56115421
5705
49875297 5290
43794214
3910
0
1000
2000
3000
4000
5000
6000
7000
8000
9000
Jan Feb Mar Apr May Jun Jul Aug Sep Oct Nov Dec
While redundancy continues to be a key driver of individual uncertainty, year on year comparisons show the rate of redundancy decreasing.
*Source: DETI, Redundancy Statistics October 2010.
Key
‘09
‘10
22J.1814
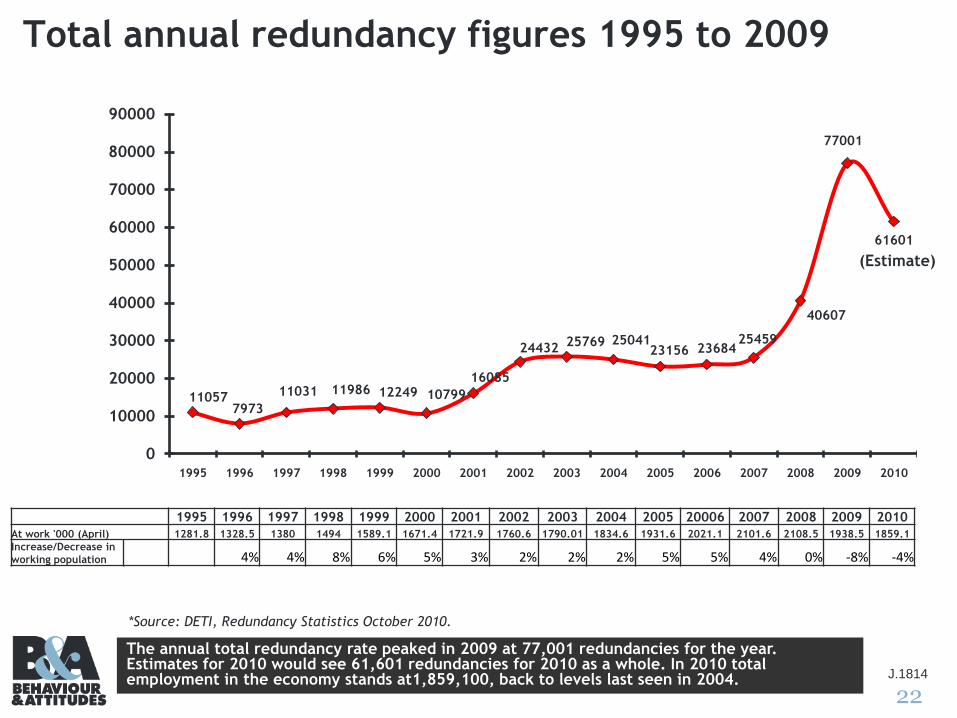
Total annual redundancy figures 1995 to 2009
1995 1996 1997 1998 1999 2000 2001 2002 2003 2004 2005 20006 2007 2008 2009 2010
At work '000 (April) 1281.8 1328.5 1380 1494 1589.1 1671.4 1721.9 1760.6 1790.01 1834.6 1931.6 2021.1 2101.6 2108.5 1938.5 1859.1
Increase/Decrease in
working population 4% 4% 8% 6% 5% 3% 2% 2% 2% 5% 5% 4% 0% -8% -4%
Actual redundancies 2010The annual total redundancy rate peaked in 2009 at 77,001 redundancies for the year. Estimates for 2010 would see 61,601 redundancies for 2010 as a whole. In 2010 total employment in the economy stands at1,859,100, back to levels last seen in 2004.
110577973
11031 11986 12249 10799
16085
24432 25769 2504123156 23684
25459
40607
77001
61601
0
10000
20000
30000
40000
50000
60000
70000
80000
90000
1995 1996 1997 1998 1999 2000 2001 2002 2003 2004 2005 2006 2007 2008 2009 2010
(Estimate)
*Source: DETI, Redundancy Statistics October 2010.

23J.1814
Actual Redundancies January - December 2010 Cumulative Redundancy comparison 2009 vs 2010
% diff. -0.3% -4.8% -14.0% -15.6% -20.4% -20.6% -20.0% -20.5% -21.4% -23.3% est -24% est -24%
The rate of redundancies, while still above average on an annual basis has decreased for the first time in 3 years.
6588
12800
20480
27611
35559
42323
48608
54439
60428
66989
72880
77001
6571
12182
17603
23308
28295
3359238882
43261
4747551385
55328
61601
0
10000
20000
30000
40000
50000
60000
70000
80000
90000
Jan Feb Mar Apr May Jun Jul Aug Sep Oct Nov Dec
2009 2010
*Source: DETI, Redundancy Statistics October 2010.

24J.1814
Note the value of retail sales
decreased annually by
-4.1% in the latest month
(excluding Motor Trade)
Value of Retail Sales (Excluding Motor Trade)
Seasonally Adjusted Annual % ChargeBase: Year 2005 = 100
%
2008 2009 2010
* Source: CSO latest estimates October, 2010. Base year : 2005 = 100
-9.5 -9.8-10.7
-12.2
-13.2
-10.8
-11.4
-10.2
-11.6-12.0
-11.2-11.3
-8.1-7.6
-4.7
-3.0-3.5
-5.0 -4.9
-3.9 -4.1
-15
-10
-5
0
5
10
15
Jan-08
Feb '08
Mar '08
Apr '08
May '08
June '08
Jul '08
Aug '08
Sept '08
Oct '08
Nov '08
Dec '08
Jan '09
Feb '09
Mar '09
Apr '09
May '09
Jun '09
Jul '09
Aug '09
Sept '09
Oct '09
Nov '09
Dec '09
Jan '10
Feb '10
Mar '10
Apr '10
May '10
Jun '10
Jul '10
Aug '10
Sept '10

25J.1814
Retail SalesValue & Volume Growth: 2010 vs 2005 (= 100). Seasonally adjusted.
*Source: CSO latest estimates June 2010 (seasonally adjusted).
Retail Business – NACE REV 2
Value Volume
Period September 2010
Index
Annual
% Ch Index
Most recent %
annual vol.
Change
Motor Trades 64.6 7.0 68.7 13.2
Department Stores 88.8 2.0 115.6 8.5
Food beverages & Tobacco 90.3 -7.2 89.4 -4.2
Fuel 105.3 0.6 85.5 -8.9
Pharmaceuticals Medical & Cosmetic Articles 110.1 -0.6 120.7 4.6
Clothing, footwear & textiles 85.5 -3.2 116.9 3.7
Furniture and Lighting 59.9 -14.4 77.1 -9.0
Hardware, Paints and Glass 76.9 -10.9 80.2 -8.7
Electrical Goods 76.2 -2.9 125.1 5.5
Books, Newspapers and Stationery 75.3 -12.1 71.9 -9.4
Other retail sales 79.1 -12.2 96.2 -12.4
Bars 77.9 -13.8 71.6 -11.6
The bar trade and the home improvement sector have been hit this wave. Retail sales of newspapers/books and ancillary goods also declining dramatically in terms of value & volume.

26J.1814
Inflation Reported for First Time since December
2008
4.34.0
2.5
1.1
-0.1
-1.7
-2.6
-3.5
-4.7-5.4
-5.9 -5.9-6.5 -6.6
-5.7
-5.0
-3.9-3.2
-3.1
-2.1
-1.1
-0.9
-0.1
0.20.5 0.7
-7
-5
-3
-1
1
3
5
Sept Oct Nov Dec Jan Feb Mar April May Jun Jul Aug Sept Oct Nov Dec Jan '10
Feb '10
Mar '10
Apr '10
May '10
June '10
July '10
Aug '10
Sept '10
Oct '10
% Annual Change
Prices rise by 0.7% in the year to October, driven by energy/communication, transport and health cost increases.
2008 2009 2010
27J.1814
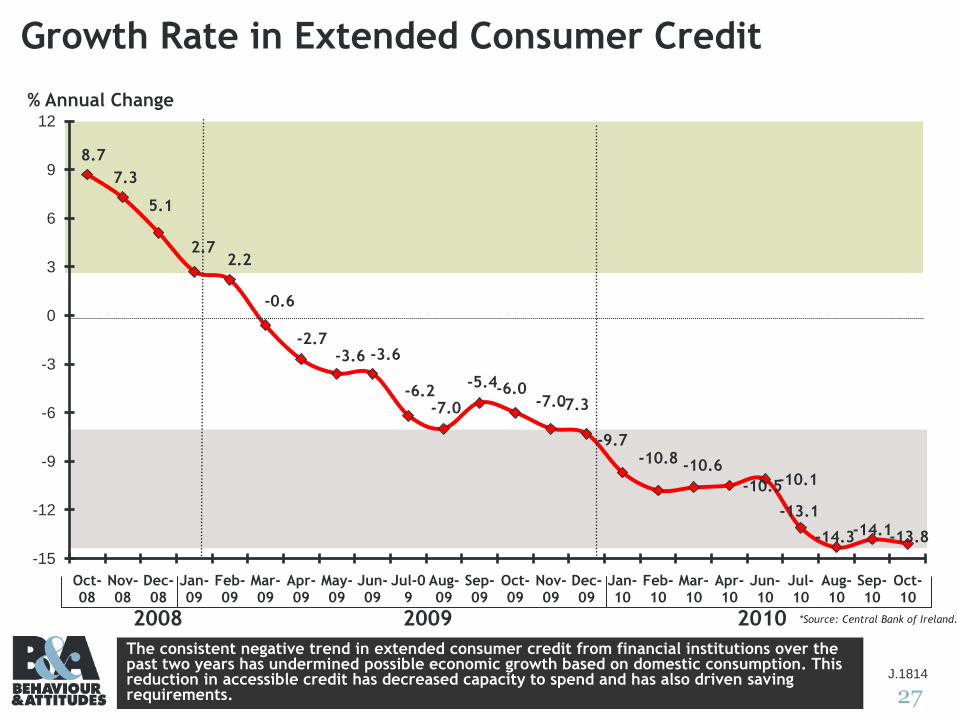
Growth Rate in Extended Consumer Credit
8.7
7.3
5.1
2.72.2
-0.6
-2.7-3.6 -3.6
-6.2-7.0
-5.4-6.0-7.0-7.3
-9.7-10.8 -10.6
-10.5-10.1
-13.1
-14.3 -13.8-14.1
-15
-12
-9
-6
-3
0
3
6
9
12
Oct-08
Nov-08
Dec-08
Jan-09
Feb-09
Mar-09
Apr-09
May-09
Jun-09
Jul-09
Aug-09
Sep-09
Oct-09
Nov-09
Dec-09
Jan-10
Feb-10
Mar-10
Apr-10
Jun-10
Jul-10
Aug-10
Sep-10
Oct-10
% Annual Change
2008 2009 2010
Source: Central Bank
The consistent negative trend in extended consumer credit from financial institutions over the past two years has undermined possible economic growth based on domestic consumption. This reduction in accessible credit has decreased capacity to spend and has also driven saving requirements.
*Source: Central Bank of Ireland.

28J.1814
APPENDICESThe Questionnaire
29J.1814
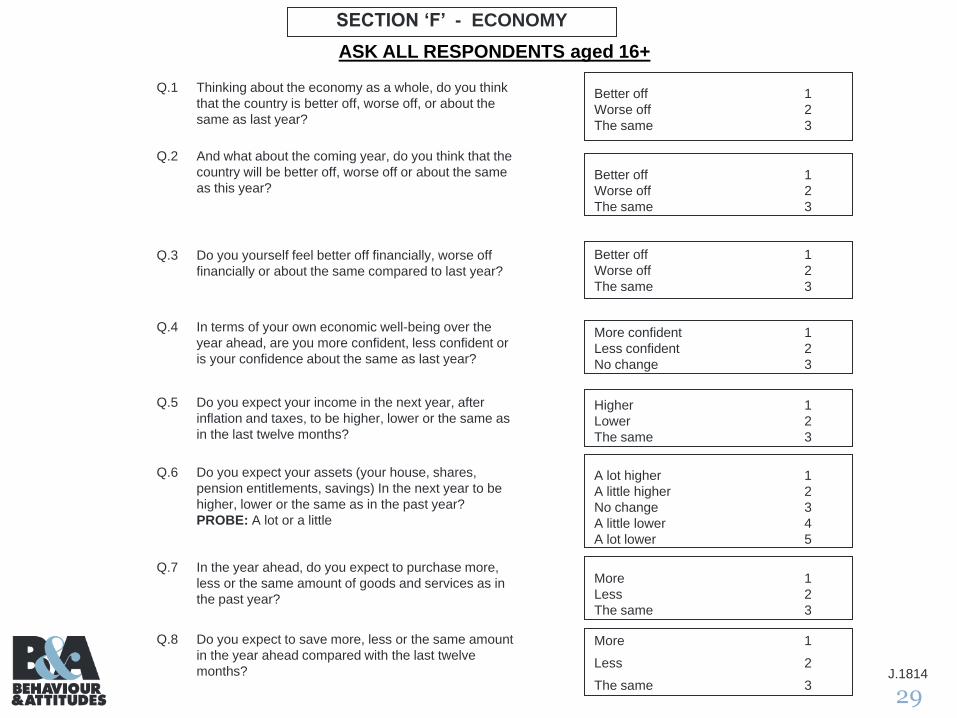
SECTION ‘F’ - ECONOMY
ASK ALL RESPONDENTS aged 16+
Better off 1
Worse off 2
The same 3
Q.1 Thinking about the economy as a whole, do you think
that the country is better off, worse off, or about the
same as last year?
Q.2 And what about the coming year, do you think that the
country will be better off, worse off or about the same
as this year?Better off 1
Worse off 2
The same 3
Better off 1
Worse off 2
The same 3
Q.3 Do you yourself feel better off financially, worse off
financially or about the same compared to last year?
More confident 1
Less confident 2
No change 3
Q.4 In terms of your own economic well-being over the
year ahead, are you more confident, less confident or
is your confidence about the same as last year?
Higher 1
Lower 2
The same 3
Q.5 Do you expect your income in the next year, after
inflation and taxes, to be higher, lower or the same as
in the last twelve months?
A lot higher 1
A little higher 2
No change 3
A little lower 4
A lot lower 5
Q.6 Do you expect your assets (your house, shares,
pension entitlements, savings) In the next year to be
higher, lower or the same as in the past year?
PROBE: A lot or a little
More 1
Less 2
The same 3
Q.7 In the year ahead, do you expect to purchase more,
less or the same amount of goods and services as in
the past year?
More 1
Less 2
The same 3
Q.8 Do you expect to save more, less or the same amount
in the year ahead compared with the last twelve
months?
Recommended