HSBC Global Investment FundsAudited Report for the year from1 April 2010 to 31 March 2011
R.C.S. Luxembourg B 25 087
HSBc m Global Asset Management
HSBc m Global Asset Management

1
Audited report for the year from 1 April 2010 to 31 March 2011
Société d’Investissement à Capital Variable (SICAV), Luxembourg
2
Information concerning the distribution of shares of HSBC Global Investment Funds in or from Switzerland. HSBC Private Bank (Suisse) SA, Quai du Général Guisan 2, case postale 3580 CH-1211 Geneva 3, is the legal representative of the Company in Switzerland and the Company’s paying agent in that country. The Prospectus, simplified Prospectuses, Articles and annual and semi-annual reports of the Company may be obtained free of charge upon request from the HSBC Private Bank (Suisse) S.A. A breakdown of all transactions carried out on behalf of each sub-fund of HSBC Global Investment Funds for the period under review can be obtained, free of charge, from the Company’s representative in Switzerland. Information concerning the distribution of shares of HSBC Global Investment Funds in or from Germany.
HSBC Trinkaus & Burkhardt AG, 21-23 Königsallee, D-40212 Düsseldorf, is the legal representative of the Company in Germany and the Company’s paying agent in that country. The Prospectus, simplified Prospectuses, Articles and annual and semi-annual reports of the Company may be obtained free of charge upon request from the HSBC Trinkaus & Burkhardt AG. A breakdown of all transactions carried out on behalf of each sub-fund of HSBC Global Investment Funds for the period under review can be obtained, free of charge, from the Company’s representative in Germany.
No subscription can be received on the basis of financial reports. Subscriptions are only valid if made on the basis of the current Prospectus accompanied by the latest annual and the most recent semi-annual report, if published thereafter. Audited report for the year from 1 April 2010 to 31 March 2011

Table of Contents
3
Board of Directors 4 Management and Administration 5 Directors’ Report 8 Report of the Réviseur d’Entreprises agréé 26 Statement of Net Assets as at 31 March 2011 28 Key Figures as at 31 March 2011 39 Statement of Operations and Changes in Net Assets 66 Notes to the Financial Statements 77 Comparative Table of Net Assets 191 Portfolio of Investments and Other Net Assets 208 Currency Conversion Table 353 Dealing Days of the Fund 354 Holiday calendar 355
Board of Directors
4
BOARD OF DIRECTORS OF THE COMPANY Didier Deleage (Chairman), Chief Operating Officer, HSBC Global Asset Management (France) Immeuble Ile de France, 4, Place de la Pyramide, La Défense 9, 92800 Puteaux, France. James Boucher, Managing Director, HSBC Bank (Mauritius) Limited 6th Floor, HSBC Centre, 18 CyberCity, Ebene, Mauritius (appointed on 30 April 2010). Thies Clemenz, Chief Executive Officer, HSBC Trinkaus Investment Managers S.A. 8, rue Lou Hemmer, L-1748 Luxembourg-Findel, Grand Duchy of Luxembourg. David Dibben, Chief Operating Officer - Global Funds, HSBC Global Asset Management Limited 8 Canada Square, London E14 5HQ, United Kingdom (resigned on 30 July 2010). George Efthimiou, Global Chief Operating Officer, HSBC Global Asset Management Limited 8 Canada Square, London E14 5HQ, United Kingdom. David Silvester, Head of Product Management - Global Funds, HSBC Global Asset Management Limited 8 Canada Square, London E14 5HQ, United Kingdom. Sylvie Vigneaux, Head of Regulatory and Wealth Engineering, HSBC Global Asset Management (France) Immeuble Ile de France, 4, Place de la Pyramide, La Défense 9, 92800 Puteaux, France. Edgar Ng, Director, Head of Business Support Asia Pacific, HSBC Global Asset Management (Hong Kong) Limited HSBC Main Building, 1 Queen's Road Central, Hong Kong.
Management and Administration
5
Registered Office
16, boulevard d'Avranches, L-1160 Luxembourg, Grand Duchy of Luxembourg. R.C.S. Luxembourg N° B-25087 Management Company
HSBC Investment Funds (Luxembourg) S.A., 16, boulevard d'Avranches, L-1160 Luxembourg, Grand Duchy of Luxembourg. Custodian, Administration Agent, Transfer Agent and Central Paying Agent
RBC Dexia Investor Services Bank S.A. 14, Porte de France, L- 4360 Esch-sur-Alzette, Grand Duchy of Luxembourg. Investment Advisers
Halbis Capital Management (France), Immeuble Ile de France, 4, Place de la Pyramide, La Défense 9, 92800 Puteaux, France. HSBC Global Asset Management (Hong Kong) Limited (previously Halbis Capital Management (Hong Kong) Limited and Sinopia Asset Management (Asia Pacific) Limited until 31 December 2010), Level 22, HSBC Main Building, 1, Queen’s Road Central, Hong Kong. HSBC Global Asset Management (USA) Inc. (previously Halbis Capital Management (USA) Inc. until 31 December 2010), 452 Fifth Avenue, 18th Floor, New York, NY 10018, USA. HSBC Global Asset Management (UK) Limited (previously Halbis Capital Management (UK) Limited until 31 December 2010), 8, Canada Square, London E14 5HQ, United Kingdom. Sinopia Asset Management, 4, Place de la Pyramide, La Défense 9, 92800 Puteaux, France. Sinopia Asset Management (UK) Limited, 8, Canada Square, London E14 5HQ, United Kingdom. HSBC Global Asset Management (France), Immeuble Ile de France, 4, Place de la Pyramide, La Défense 9, 92800 Puteaux, France. HSBC Global Asset Management (Singapore) Limited, 21 Collyer Quay, #15-02 HSBC Building, Singapore 049320, Singapore. HSBC Bank Brazil S.A. - Banco Múltiplo, Travessa Oliviera Belo, 11-B, 80020-030 Curitiba, Brazil. HSBC Portfoy Yonetimi A.S., Esentepe Mahallesi, Büyükdere Caddesi, No:128, 34394 Sisli, Istanbul, Turkey.
Management and Administration (continued)
6
Share Distributors
Global Distributor HSBC Investment Funds (Luxembourg) S.A., 16, boulevard d’Avranches, L-1160 Luxembourg, Grand Duchy of Luxembourg. Austria, Eastern Europe and Germany Distributor HSBC Trinkaus & Burkhardt AG, Königsallee 21/23, D-40212 Düsseldorf, Germany. Hong Kong Representative and Distributor HSBC Investment Funds (Hong Kong) Limited, HSBC Main Building, 1 Queen's Road Central, Hong Kong. United Kingdom Representative and Distributor HSBC Global Asset Management (UK) Limited, 8, Canada Square, London E14 5HQ, United Kingdom. Republic of Ireland Distributor HSBC Global Asset Management (UK) Limited, 8, Canada Square, London E14 5HQ, United Kingdom. Republic of Ireland Representative HSBC Securities Services (Ireland) Limited, HSBC House, 1 Grand Canal Square, Grand Canal Harbour, Dublin 2, Ireland. Jersey Representative and Distributor HSBC Global Asset Management (International) Limited, HSBC House, Esplanade, St Helier, Jersey, JE1 1HS Channel Islands. Singapore Representative and Distributor HSBC Global Asset Management (Singapore) Limited, 21, Collyer Quay, #15-02 HSBC Building, Singapore 049320, Singapore. Swiss Representative and Paying Agent in Switzerland HSBC Private Bank (Suisse) S.A., Quai du Général Guisan 2, Case postale 3580, CH-1211 Geneva 3, Switzerland. Korea Representative and Distributor HSBC Korea Ltd, HSBC Building #25, 1-Ka, Bongrae-Dong, Chung-Ku, Seoul, Korea. Distributor for Continental Europe HSBC Global Asset Management (France), Immeuble Ile de France, 4, Place de la Pyramide, La Défense 9, 92800 Puteaux, France.
Management and Administration (continued)
7
Paying Agent in Hong Kong
The Hong Kong and Shanghai Banking Corporation Limited, HSBC Main Building, 1, Queen’s Road Central, Hong Kong. Representative and Paying Agent in Poland
HSBC Bank Polska S.A., Kraków Business Park 200, Ul. Krakowska 280, 32-080 Zabierzów, Poland.
Réviseur d'Entreprises Agréé
KPMG Audit S. à r. l. 9, allée Scheffer, L-2520 Luxembourg, Grand Duchy of Luxembourg. Legal Adviser Elvinger, Hoss & Prussen, 2, place Winston Churchill, L - 1340 Luxembourg, Grand Duchy of Luxembourg.
Directors’ Report
8
Directors’ Comments
The Board of Directors present the Audited Annual Report for HSBC Global Investment Funds (the “Company”) for the year ending 31 March 2011. The Fund
The Company is a variable capital investment company, incorporated under the laws of the Grand Duchy of Luxembourg and is organized as an “umbrella” with a number of sub-funds, each of which has their own investment policies and restrictions. At present, the Company has issued shares in 52 sub-funds. During the year, the total net assets of the Company increased from USD 24.2 billion to USD 27.5 billion at year end. The Company qualifies as an Undertaking for Collective Investments in Transferable Securities under the amended EC Directive 85/611 of 20 December 1985 and may therefore be offered for sale in European Union Member States, subject to registration in countries other than the Grand Duchy of Luxembourg. In addition, applications to register the Company and its sub-funds may be made in other countries. The Company and its sub-funds are currently registered for offer and distribution in the Grand Duchy of Luxembourg and in the following jurisdictions: Austria, Bahrain, Belgium, Brunei, Chile, Colombia, Costa Rica, Czech Republic, Denmark, Estonia, Finland, France, Germany, Greece, Hong Kong, Hungary, Ireland, Italy, Japan, Jersey, Jordan, Korea, Lebanon, Macau, Malta, Mauritius, Netherlands, Norway, Oman, Panama, Peru, Poland, Portugal, Qatar, Singapore, Slovakia, Spain, Sweden, Switzerland, Taiwan, United Arab Emirates and United Kingdom. Responsibility of the Directors
The responsibility of the Directors of the Company is governed exclusively by Luxembourg law. With respect to these financial statements, the duties of the Directors are governed by general corporate law and the law of 19 December 2002 on, inter alia, the accounting and annual accounts of undertakings and by the law of 20 December 2002 relating to undertakings for collective investments. Annual General Meeting
The next Annual General Meeting of the Company will be held on Friday, 29 July 2011. Investment Manager’s comments regarding sub-fund performance during the year.
Reserve Sub-Fund
HGIF Euro Reserve
For the year ending 31 March 2011, the Fund delivered a return of 0.33% (net of fees, share class AC), compared with a benchmark return of 0.52% (European Overnight Index Average-EONIA). Eurozone news was dominated by sovereign debt issues; following the Greek bail-out, there were fears that Spain and Portugal might experience similar problems with their deficits. The economic uncertainty surrounding the turmoil in the Middle East and North Africa, the tragic disaster in Japan, ongoing debt worries within peripheral European countries, and rising commodity prices and inflation, kept central Banks focused on balancing policy decisions during the period under review. Therefore, the European Central Bank (ECB) maintained its key interest rate at 1.00%. In this context, the strategy of the Fund has been to remain cautious and to maintain liquidity for shareholders by investing a majority of the Fund in government bonds. The remainder of the Fund was mainly invested in other bonds within the one and three month duration.
Directors’ Report (continued)
9
Bond Sub-Funds
HGIF Brazil Bond
For the year ending 31 March 2011, the Fund delivered a return of 17.6% (net of fees share class AC, not considering the swing price effect on that date) compared with a benchmark return of 20.3% (Brazilian Interbank Rate). The local currency had a positive performance after a volatile period in second quarter of 2010, on the back of the worries of the European crisis. The strong flows led the Central Bank to raise the IOF flat fee on foreign fixed income investors from 2% to 6% in October, prompting a mild correction, after which the currency slowly drifted upwards, as the Central Bank continues to buy US dollars, absorbing flows and reducing volatility.
The basic interest rate was hiked from 8.75% to 10.75% in July, as the strong pick-up in activity prompted deterioration in inflation expectations. A series of very low inflation prints caused the Central Bank to abort the cycle in August. This proved to be only a seasonal adjustment within an environment of very strong demand, and inflation expectations shot up again, with consequent resumption of the hiking cycle in January taking rates to 11,75% in March. In this period, the interest rate curve moved up, adjusting to the new reality.
In this period, the Fund kept a low exposure to duration, which was increased marginally as the period approached the end of 2010.
HGIF Euro Bond (formerly, Euro Core Bond)
For the year ending 31 March 2011, the Fund delivered a return of –0.09% (net of fees, share class AC) outperforming the benchmark return of –1.19% (100% Barclays Euro Aggregate Bond Index).
The Fund benefited from an investment strategy focusing around the following three points: An overweight towards credit versus government bonds as we were convinced that most corporates and many banks were fundamentally much more sound than some European governments; an overweight towards selective subordinated financials bonds versus senior issues as new regulations should incite issuers to call their bonds at first date; and, numerous optional strategies on duration and curve to optimise tactical bets with limited losses.
For the last 6 months, exposure to Ireland or Portugal was limited or negated and the exposure to Spain was underweighted. On duration, we were short or neutral during the first quarter versus benchmark, which is the Fund’s current position today.
HGIF Euro Credit Bond (formerly, Euro Core Credit Bond)
For the year ending 31 March 2011, the Fund delivered a return of 1.70% (net of fees, share class AC) compared with a benchmark return of 1.41% (100% Iboxx Euro Corporate).
The main performance drivers were the decisions to keep an overweight towards subordinated financials and towards defensive high yield credit. Underweight positions were also kept on names; in particular financial institutions from peripheral European countries. The investment decision on subordinated debt was based on two factors; strong technicals (after the draft of Basel 3 regulation) and strong fundamentals, as investments were made in national champions and defensive retail banks with strong balance sheets. On xover names and corporate hybrids, these names continue to perform as investors look for yields in an improving macro economic environment.
HGIF Euro High Yield Bond
For the year ending 31 March 2011, the Fund delivered a return of 7.99% (net of fees, share class AC) underperforming the benchmark return of 8.58% (100% MERRILL LYNCH Euro High Yield Constraint BB-B). The performance level was in line with the average yield of the portfolio, meaning that capital gains and losses were minimal. The absence of any significant capital loss results from the good credit quality of the euro high yield market over the period. The default rate amongst high yield issuers over the period has been very low as the economic recovery and the cost-cutting plans implemented during the downturn allowed the majority of issuers to post strong results.
The Fund maintained an investment strategy around the following three points: firstly, a high investment ratio as there was a large number of investment opportunities in this environment of strong credit quality and relatively attractive valuations; secondly, an underweight on the lower rated issuers as their risk/return profile appeared less compelling to us; and thirdly, an overweight on the financial sector because credit fundamentals continued to improve strongly in this sector while valuations were very attractive.
Directors’ Report (continued)
10
HGIF Global Bond (formerly, Global Core Plus Bond)
For the period 1 April 2010 to 31 March 2011, the Fund returned 6.1% (net of fees, Class A), compared to a benchmark return of 8.7% (Barclays Global Aggregate)
Global bond markets continued to rally over this period despite the low yields at the start of the period and further strength in the global economy. A lacklustre employment market in the US encouraged the US Federal Reserve to leave policy rates at historic low levels. Europe had a two stage economy with Northern Europe performing well, with strong exports to emerging economies, and peripheral countries such as Ireland, Greece and Portugal struggling with significant fiscal issues. The Fund underperformed largely because of a short duration position in the second half of 2010. The manager was concerned that yields would rise, affected the capital value of the Fund. Yields fell over this period, so the Fund did not fully participate in the subsequent rally. There was also a positive effect from the overweight position in credit and financials. The manager expects that yields will rise modestly over the medium-term.
HGIF Global Credit Bond (formerly, Global Core Credit Bond)
For the year ending 31 March 2011, the Fund delivered a return of 2.54% (net of fees, share class AC) compared with a benchmark return of 4.14% (50% Merrill Lynch Euro Corporate (USD hedged) + 50% Merril Lynch Euro US Corporates 1-10yr). The Fund maintained a strategic overweight towards credit positions and overweight positions on subordinated financials across the euro and US dollar sleeves and increased exposures to xover names.
The underperformance against the benchmark came from an underweight duration position on the US dollar sleeve; however, this position should pay off as strong economic figures hint at interest rate hikes by central banks. Overweight positions were maintained on tier 1 and lower tier 2 financials, as strong technical are likely to drive these bonds tighter as fundamental improve.
GIF Global Emerging Markets Bond
For the year ending 31 March 2011, the Fund delivered a return of 8.59% (net of fees, Class IC), compared with a benchmark return of 8.65% (JPMorgan Emerging Markets Bond Index Global).
The asset class performed well as a whole, with small drops in May and towards the end of the calendar year as concerns around the Eurozone debt crisis caused sell offs in the market. Positive attribution was driven primarily by overweight holdings in high yield countries which outperformed the investment grade sector over the period as the global recovery gained momentum and risk assets were back in favour. Additionally, asset allocations into off benchmark corporate debt and local currency debt contributed to outperformance in the first half of the period but local currency exposure cost the Fund over the three months from November to January as the asset class underperformed. At the end of the period, the Fund was positioned with calculated risk positions in higher beta external credits such as Venezuela and Argentina, and the team held had a cautious view on emerging currencies with minimal exposure in the Fund. The Fund closed the period fully invested and with slightly underweight duration.
GIF Global Emerging Markets Corporate Debt
For the three months ending 31 March 2011, the Fund returned 1.52% (net of fees, Class IC), compared with a benchmark return of 1.43% (JPMorgan CEMBI Diversified Composite).
The teams investment process dictates top down fundamental country analysis to decide country positioning, combined with bottom up fundamental research for security selection, which both drove positive attribution over the short time period, with the strongest gains at the beginning of the year. The Fund is positioned with an overall lower credit quality that the benchmark as the lower credit quality instruments in the index offer more compelling investment opportunities and suitable compensation for the liquidity risk that the fund incurs. The Fund closed the period fully invested with a higher yield than that of the index.
Directors’ Report (continued)
11
GIF Global Emerging Markets Investment Grade Bond
For the three months ending 31 March 2011, the Fund returned 1.63% (net of fees, Class IC), compared with a benchmark return of 2.15% (Blended 50/50 JPMorgan GBI-EM Global Diversified Investment Grade / JPMorgan EMBI Global Investment Grade).
In the short time period since launch the Fund saw minor underperformance against the benchmark due to an underweight allocation to emerging market local currency denominated debt, an asset class which saw sharp gains in the early part of the year. The Fund still drew some positive attribution from country selection and security selection, but the asset class allocation decision detractor outweighed the positives. At the end of the period, the Fund was fully invested and maintained an overweight to hard currency debt and an underweight to local currency debt.
GIF Global Emerging Markets Local Debt
For the year ending 31 March 2011, the Fund returned 10.61% (net of fees, Class IC), compared with a benchmark return of 13.09% (the benchmark for this Fund changed on January 1st 2011 from the JPMorgan GBI-EM Global Diversified Composite to a blended 50/50 JPMorgan GBI-EM Global Diversified Composite/JPMorgan ELMI+ Composite).
The Fund holdings continued to shift away from bonds/interest rates and into foreign exchange in the first half of the period leading to an underweight in duration and yield when compared to the benchmark. This duration and yield underweight hurt the Funds’ relative performance. The team increased duration exposure and was able to better keep pace with the benchmark in the fourth quarter. In the first months of 2011, the Fund marginally underperformed the benchmark in rising markets due to the team’s cautious view on emerging market currencies. The Fund remains fully invested with a small duration overweight position.
HGIF Global High Income Bond
For the period 28 July 2010 to 31 March 2011, the Fund returned 5.6% (net of fees, Class A), compared to a benchmark return of 5.0% (Barclays Composite Index (15% Barclays Euro Aggregate Corporate Baa Hedged USD + 15% Barclays Euro High Yield BB Only Hedged (USD) + 20% Barclays US Aggregate Corporate Baa + 35% Barclays US Emerging Markets Unhedged (USD) + 15% Barclays US High Yield Ba).
The Fund started on 28 July 2010. Since inception, the markets in the benchmark have performed well, especially the high yield markets in the US and Europe. The credit markets in the US and Europe have experienced falling spreads, especially in the lower rated bonds in which the Fund invests. In addition, emerging market government and corporate debt benefited from stronger national metrics and good corporate performance. The Fund also had a 10% allocation to asset backed securities (ABS). These bonds were largely US Commercial Mortgage Backed Securities which performed well with the underlying commercial real estate markets benefiting from the stronger economy and health of the corporate sector. The Fund relative performance benefited from an overweight in European financials and within emerging markets an overweight position in corporates versus government bonds. In addition, the ABS investments rose 16%, well ahead of the benchmark. The manager believes that credit spreads can fall further in the US and European bond markets and that strong fundamentals should support positive returns in emerging market debt.
HGIF Global Inflation Linked Bond
Since inception on 30 June 2010 through to 31 March 2011, the Fund returned 3.70% (net of fees, Class I USD) outperforming its benchmark the Barclays World Government Inflation-Linked Bond hedged US dollar Index, which posted a performance of 3.26%. During the period under review, upward surprises on economic data and the rally in the oil and agricultural commodities’ prices contributed to higher inflation figures and expectations.
In this context, international inflation linked bonds strongly outperformed nominal bonds in the main developed countries. The active management of the duration and the country allocation both contributed positively to the relative performance. In particular, the overweight bets on Japanese ILBs and TIPS, which outperformed, and the underweight bet on Eurozone linkers who underperformed were successful. Moreover, the US short-term breakeven long position benefited from both the higher than expected US inflation releases and economists' upward revision to US inflation. At the end of the period, the portfolio remained slightly underexposed in sensitivity compared to the benchmark (-4%) and the country allocation favours US, Japan and Australia against Eurozone, UK, Canada and Sweden.
Directors’ Report (continued)
12
HGIF US Dollar Bond (formerly, US Dollar Core Plus Bond)
For the period 1 April 2010 to 31 March 2011, the Fund returned 3.0% (net of fees, Class P), compared to a benchmark return of 8.7% (Barclays US Aggregate).
US bond markets continued to rally over this period despite the stronger economy. The Federal Reserve maintained policy rates at historic low levels with the labour market showing few signs of meaningful recovery. Corporate bonds outperformed government bonds with falling credit spreads. The corporate sector reported strong results with limited capital expenditures helping to strengthen balance sheets. In addition, financials have continued to recover with rising profitability and higher bank capital ratios. Despite the economic recovery, house prices continued to fall in most areas and mortgage foreclosures have continued. The Fund underperformed largely because of a short duration position in the second half of 2010. The manager was concerned that yields would rise, affecting the capital value of the Fund. Yields fell over this period, so the Fund did not fully participate in the subsequent rally. There was also a positive effect from the overweight position in credit and financials. The manager expects that yields will rise modestly over the medium-term.
Equity Sub-Funds
International and Regional Equity Sub-Funds
HGIF Asia ex Japan Equity
For the year ending 31 March 2011, the Fund delivered a return of 23.04% (gross of fee), compared with a benchmark return of 19.80% (MSCI Asia ex-Japan). The strong outperformance was mostly driven by superior stock selections. Active positions in Korea and India contributed positively to Fund performance, while stock-picking in China detracted from returns. Allocation effects were positive in Korea, where the Fund was overweight. The Fund’s underweight in Hong Kong also had a positive impact to performance. At a sector level, active positions in the financials, materials and consumer discretionary sectors were positive contributors, while telecommunication stocks detracted from Fund performance. The Fund’s aggregate overweight in materials sector and underweight in utilities contributed to the performance. Residual cash levels caused some performance drag in the rising market.
HGIF Asia ex Japan Equity Smaller Companies
For the year ending 31 March 2011, the Fund delivered a return of 20.63% (gross of fees), compared with a benchmark return of 16.22% (MSCI Asia ex-Japan Small Cap). The strong outperformance was mostly driven by superior stock selections. Active positions in a number of markets helped drive performance, with Hong Kong, Taiwan and Korea being the largest contributors. Stock picking in India detracted from the Fund’s return. At an allocation level, the Fund’s overweight position in the Philippines was positive, while residual cash levels caused some performance drag in the rising market. At a sector level, stock selection was very positive overall, particularly in the information technology and industrials sectors, while materials holdings were negative for performance. An overweight allocation to the consumer staples sector and an underweight in utilities contributed positively to the Fund’s performance.
HGIF Asia Pacific ex Japan Equity High Dividend
For the year ending 31 March 2011, the Fund delivered a return of 17.99% (gross of fees), compared with a benchmark return of 18.38% (MSCI Asia Pacific ex-Japan).
At a country level, allocation effect was positive while stock selection was mixed. Active positions in India outperformed strongly while stock picking in Taiwan and Thailand detracted from performance. The Fund was overweight Thailand and underweight India, which contributed positively to performance. At a sector level, stock selection contributed positively, where stock picking in financials, energy and materials added value. Allocation effect was mixed among sectors. An underweight in financials contributed to performance while an overweight in telecommunication sector detracted from returns.
Directors’ Report (continued)
13
HGIF BRIC Equity
For the year ending 31 March 2011, the Fund returned 17.47% (net of fees, share class AC) compared with the benchmark return of 14.99% (custom BRIC benchmark – 25% equal weighting to MSCI Brazil, Russia, India and China).
In 2010 we saw BRIC markets continue their positive run but the returns were, on the face of it, less dramatic than 2009. During the year, concerns over a number of issues, such as the outlook for China growth and European Sovereign risk, had an impact on emerging equity markets. In 2010, Brazil and China were up modestly (3.8% and 2.3% respectively) whilst Russia returned 17.2% and India delivered 19.4%.
In 2010, the Fund performed strongly relative to peers delivering first quartile performance. Stock selection contributed positively, with the Fund’s positions in Brazil working particularly well. Petrobras was the top contributor to performance at the stock level, because of the Fund’s large underweight to the stock (Petrobras shares fell over the year because of a huge equity issuance). Concerning allocation, performance was initially detracted because of the Fund’s underweight to India (which performed best in absolute terms in 2010) and the Fund’s overweight to Russian energy names. Both were selected in line with the Fund’s valuation-oriented approach. However, in the fourth quarter of 2010 and in first quarter of 2011, these positions were the Fund’s principal contributors. The Fund’s focus is on mid and long-term returns and the Fund is prepared to take large conviction relative positions.
In first quarter 2011, the Fund performed strongly both in absolute terms and relative to its benchmark and peers. Over the quarter, the primary contributions to performance came from the Fund’s allocation to, and stock selection in, Russia and India. In Russia, the top performing BRIC country over first quarter, the Fund’s large overweight (averaging +8% in the first quarter relative to the benchmark) added significant value. The market was particularly strong and benefited from a combination of factors, not least attractive valuations, oil prices in excess of $100 and strong expected earnings revisions. In particular, the Fund’s overweight to the energy sector, which benefited from all of the aforementioned reasons, was positive. Elsewhere, the Fund’s underweight through the quarter to India, especially in January and February when the market suffered a correction, was favourable. India finished the quarter with returns of -5.2%. The Fund’s underweight allocations to ‘expensive’ names such Infosys Technology, Icici Bank and Reliance Industries contributed well. Subsequent to the market’s performance in January and February, the Fund’s exposure to the Indian market was incrementally increased, and it was roughly neutral at quarter end. Contribution to relative performance was marginally positive from China and marginally negative from Brazil.
HGIF BRIC Markets
For the year ending 31 March 2011, the Fund delivered a return of 13.91% (net of fees, share class AC) in US dollar terms compared with a benchmark return of 9.56% (MSCI BRIC).
Russia was the stand-out performer over the year, as investors were attracted by its low valuation and its exposure to the record oil price. The other three markets performed more or less in line with each other. Markets initially dipped because of concerns over monetary policy tightening in China and sovereign debt problems in the peripheral countries of the Eurozone. They then recovered as global economic data continued to be beat expectations and risk appetite returned to the markets. Emerging market equities strongly outperformed developed market equities, and there were substantial inflows into the asset class. Towards the end of the period, markets weakened again, as all the BRIC markets raised interest rates in response to ongoing inflationary pressures, and there was a general switch out of emerging markets and into developed markets. Volatility continued to the period end because of the unrest in the Middle East and North Africa, and the earthquake and tsunami in Japan.
Directors’ Report (continued)
14
HGIF BRIC Markets Equity
For the year ending 31 March 2011, the Fund returned +11.75% (net of fees, share class AC) in US dollar compared with the benchmark, which rose +12.0% in US dollar (MSCI BRIC, net total return) over the same period.
BRIC equities underperformed the developed markets, which rose +13.4% according to the MSCI World, net total return, in US dollar. Emerging equities remained in a large trading range over the year. The European debt crisis and the end to Quantitative Easing 1 led stocks lower in the second quarter of 2010, but emerging equities rallied sharply in the second-half of 2010 following the announcement of Quantitative Easing 2 and the fall of risk aversion. The first quarter of 2011 ended positive. Despite concerns about inflation in emerging economies, Middle East and North African countries’ political changes and the Japanese earthquake triggered a pullback in emerging returns in March. The Brent and the CRB index surged respectively +44% and +32% over the year. Brazil, China and India registered similar performances, while Russia outperformed, given the appreciation in oil and commodity prices.
The country allocation had a positive impact on the Fund’s relative performance as the Fund was overexposed on Russia over the year. The active stock selection was globally positive, thanks to the Fund’s value-added scoring model. The exposure management had no significant impact on the performance, as the Fund’s exposure remained close to 100% over the year.
HGIF Climate Change
From 31 March 2010 to 31 March 2011, the Fund posted a +5.79% performance (A share, net of fees) vs. a +8.34% performance for its benchmark.
Equity markets began the year on a downbeat tone amidst European countries default fears and while macro data confirmed the economic recovery is uneven. Record corporate earnings and improving economic indicators gradually rekindled investors’ optimism during the summer. Over the second half, the recovery theme underpinned market sentiment. Markets traded up despite lingering concerns over inflation and Europe’s sovereign-debt woes, unrest in the Middle East and North Africa and a nuclear crisis risk in Japan. Indeed a second round of quantitative easing, encouraging economic data, record corporate earnings and ongoing merger-and-acquisition activity were supportive. The MSCI World index ended the year up +14.08% (net return), while light crude prices surged 27% to $107. Climate change related stocks underperformed developed markets. Industrial and transport efficiency names displayed the best performances. At the other end of the spectrum, wind names were dragged down by the underperformance of heavyweight Vestas Wind. Integrated power names significantly lagged.
HGIF Emerging Wealth
For the year ending 31 March 2011, the Fund returned +13.91% (net of fees, share class AC) in US dollar terms compared with the reference index, which rose +13.64 % over the same period. Emerging equities remained in a large trading range over the year. The European debt crisis and the end to Quantitative Easing 1 led stocks lower in the second quarter of 2010, but emerging equities rallied sharply in the second half of 2010 following the announcement of Quantitative Easing 2 and the fall of risk-aversion. The first quarter of 2011 ended on a positive note. Despite concerns on inflation in emerging economies, Middle-East countries’ political changes and the Japanese earthquake triggered a pull-back in emerging returns in March. Over the year, the Brent and the CRB index surged by +44% and +32% respectively. Given the economic rebound, consumption and especially car producers outperformed, supporting the Fund return.
Directors’ Report (continued)
15
HGIF Euroland Equity
For the year ending 31 March 2011, the Fund delivered a return of 5.3% (net of fees, share class AC) compared with a benchmark return of 5.8% (MSCI EMU (NR)). The year was dominated initially by the fear of the impact of the sovereign debacle on European economies. However, the size of the response by governments and central bankers and the surprisingly strong profitability improvement of corporate Europe were sufficient to calm most deflation fear during summer. Investors started pricing some form of economic normalisation in the third quarter, initially driven by strong emerging economies but with a gradual contagion to developed economies.
Economically sensitive companies benefited strongly from the economic rebound and their operational leverage. Automobile, capital goods and chemicals were the strongest sectors. As the other hand of the spectrum, the banking sector suffered a lot as a natural holder of sovereign debt under a lot of regulatory pressure. Defensive sectors also lagged as should be expected in a year of positive economic surprise. Geography also played a key role in the market performance with Germany up close to 15% and Greece down by around 30%.
Stock selection outperformed slightly the overall market over the period notably in banks (Deutsche Bank), energy (Repsol) and transportation (Ferrovial). Selection equally detracted from performance in auto (BMW) and material (BASF) and having no exposure to luxury goods, which outperformed strongly. Geography there was no impact on relative performance as an under-weight stance in Germany was compensated by the limited exposure to Ireland and Italy. During the last 12 months exposure to cyclicals such as capital goods (Siemens, consumer services (Accor) or material (Umicore) were reduced and positions in food (Unilever, Kerry Group) and healthcare (Synthes, Grifols) were raised.
The prospects for European equities remain favourable. Valuations do not reflect the strong improvement in profitability currently engineered by Corporate Europe. Rising M&A activity could serve as a catalyst for a correction of this undervaluation. The economic backdrop although less of a support given the raw material price increase, the higher euro and slightly rising interest rates should remain sufficiently robust to ensure further equity market progress over the next 12-months.
HGIF Euroland Equity Smaller Companies
For the year ending 31 March 2011, the Fund delivered a return of 19.74% (gross of fees), against a benchmark (MSCI EMU Small Cap) return of 14.57%; ending the year ranked 11th in its peer group.
The Fund performed well despite a very difficult trading environment. Fortunately, quantitative easing in the US, low short and long-term interest rates, improving macroeconomic figures in the US and Europe, favourable banking sector stress tests and upward revisions of expected profits in the small and mid-Cap segment reassured the financial markets. The Fund benefited from its large exposure to companies invested in the emerging countries, or exposed to energy and materials, and from its strong underweight position in PIIGS stock markets.
Privatisations expectations led the manager to buy Greek utilities. A holding was maintained in a paper and packaging company in Ireland, as the valuation was found attractive. There was no exposure to Portugal, whilst Italy was underweight during 2010/11. The underweight position in domestic consumption has been reduced at the beginning of 2011. Financials and pharmaceuticals have been and are still underweight due to a very selective stock-picking approach. Industrials and the Netherlands were the great winners of the year; outperformance being mainly due to stock-picking (75%) and country and sector allocation (25%).
HGIF Euroland Growth
For the year ending 31 March 2011, the Fund delivered a return of 2.60% (net of fees, share class M1D) compared with a benchmark return of 5.31% (100% MSCI EMU (EUR) NR).
The underperformance of the Fund is largely concentrated in the month of April 2010. For the rest of the period, performance was on average flat, despite the growth style outperforming broad indices. The negative contribution to relative performance came from a strong defensive stance taken early in 2010 on the back of declining macroeconomic figures. The implementation of the second wave of quantitative easing in the summer has allowed economic momentum to reaccelerate as well as reignited appetite for risk. The cyclical growth theme was the key beneficiary in this environment, of which we were underweight. Positive contribution came from pure growth stories in the technology and healthcare sector.
Turnover was modest. The defensive/quality bias of the Fund is maintained as cyclical indicators seem to be topping-out, margins in most cyclical sectors are at all-time highs and stable growth seems significantly undervalued.
Directors’ Report (continued)
16
HGIF European Equity
For the period 1 April 2010 to 31 March 2011, the Fund returned 11.1% (net of fees, Class P), compared to a benchmark return of 8.2% (the FTSE World Europe (RI)).
European equity markets rose over the 12-month period, largely driven by strong rises in corporate earnings. The economic situation was broadly positive with good economic growth in Northern Europe. Some countries such as Greece, Ireland and Portugal had significant fiscal issues which were reflected in government bond yields well above equivalent yields in Germany. Over this period, the corporate sector has continued to perform well with profits rising strongly. Capital expenditure has been modest and many companies have increased dividend payments. The Fund holdings have concentrated on companies with sustainable cash flows and good balance sheets. The Fund performance was led by companies releasing good results. The valuation of the equity market is well below 15-year averages. With corporate earnings expected to grow through 2011, we believe that investors should receive modest gains from equities over the medium-term.
HGIF Global Emerging Markets Elite
For the year ending 31 March 2011, the Fund returned 16.46% (net of fees, Class YC) compared with the benchmark return of 18.46% (MSCI Emerging Markets).
On a quarter-by-quarter basis, in Q2 2010, the MSCI Emerging Markets index returned -8.4% in second quarter, amid concerns over the global recovery and worries over the sovereign debt outlook in the Eurozone. Market sentiment deteriorated and the Fund underperformed by 3.3% (gross). The Fund’s overweight to Korean industrials, a play on global economic growth, detracted from relative performance. Increased risk aversion also hurt the Fund’s positions in Russia and Taiwan. However, over the quarter, allocation to Russia was increased in light of the attractive valuations the market is trading at. The Fund benefited from stock selection in India, notably in energy name Oil & Natural Gas Corp.
In the third quarter of 2010, emerging markets rose 18%, with the Fund outperforming by 0.8% (gross). Turkey and Korea, the Fund’s second and third largest country overweights, were the top two contributors on a relative basis. In Turkey, which rose 32% over the quarter, we benefited from a combination of allocation and stock selection. The Fund’s positions in airline name Turk Hava Yollari and Tupras, a petrochemical conglomerate, contributed most significantly at the stock level. In Korea, stock selection in industrials names, which are highly linked to the global recovery, proved particularly profitable. The Fund’s positions in Daewoo Shipbuilding, Hyundai Mipo Dock and Samsung Heavy Industries were the top performers. The Fund’s exposure to China, Thailand and South Africa also contributed strongly. In the fourth quarter of 2010, emerging markets moved 7.3% higher, with the Fund outperforming by 1.0% (gross). The Fund’s valuation oriented approach worked well. Underweight allocations to Brazil and India, which looked expensive based on the Fund’s valuation and profitability metrics, generated strong relative performance. Both markets underperformed over the quarter. The Fund’s underweight in Brazilian large cap names such as CVRD and Petrobras was particularly profitable. The Fund’s exposure to Korea and South Africa also contributed strongly. Both markets outperformed relative to the broader EM index. The Fund’s overweight to Russia, which staged a strong rally in December, was also beneficial. At the sector level, materials and financials stocks contributed most positively.
In the first quarter, emerging market equities rose 2.3%, with the Fund outperforming by 0.2% (gross). The Fund’s conviction in Russia, the Fund’s largest overweight, contributed significantly, in particular the Fund’s exposure to energy names such as Gazprom, Rosneft and Sistema. Korea was again strong. The Fund’s underweight to India, a position aligned with the Fund’s valuation approach, also contributed positively, as the markets returned -5.2% in the first quarter.
Directors’ Report (continued)
17
HGIF Global Emerging Markets Equity
For the year ending 31 March 2011, the Fund returned 14.91% (net of fees, share class AC) compared with the benchmark return of 18.46% (MSCI Emerging Markets). On a quarter-by-quarter basis, in second quarter of 2010, the MSCI Emerging Markets index returned -8.4% in the second quarter, amid concerns over the global recovery and worries over the sovereign debt outlook in the Eurozone. Market sentiment deteriorated and the Fund underperformed by 3.3% (gross). The Fund’s overweight to Korean industrials, a play on global economic growth, detracted from relative performance. Increased risk-aversion also hurt the Fund’s positions in Russia and Taiwan. However, over the quarter, allocation to Russia was increased in light of the attractive valuations the market is trading at. The Fund benefited from stock selection in India, notably in energy name Oil & Natural Gas Corp. In the third quarter of 2010, emerging markets rose 18%, with the Fund outperforming by 0.8% (gross). Turkey and Korea, the Fund’s second and third largest country overweights, were the top two contributors on a relative basis. In Turkey, which rose 32% over the quarter, we benefited from a combination of allocation and stock selection. The Fund’s positions in airline name Turk Hava Yollari and Tupras, a petrochemical conglomerate, contributed most significantly at the stock level. In Korea, stock selection in industrials names, which are highly linked to the global recovery, proved particularly profitable. The Fund’s positions in Daewoo Shipbuilding, Hyundai Mipo Dock and Samsung Heavy Industries were the top performers. The Fund’s exposure to China, Thailand and South Africa also contributed strongly. In the fourth quarter of 2010, emerging markets moved 7.3% higher, with the Fund outperforming by 1.0% (gross). The Fund’s valuation oriented approach worked well. Underweight allocations to Brazil and India, which looked expensive based on the Fund’s valuation and profitability metrics, generated strong relative performance. Both markets underperformed over the quarter. The Fund’s underweight in Brazilian large cap names such as CVRD and Petrobras was particularly profitable. The Fund’s exposure to Korea and South Africa also contributed strongly. Both markets outperformed relative to the broader EM index. The Fund’s overweight to Russia, which staged a strong rally in December, was also beneficial. At the sector level, materials and financials stocks contributed most positively. In the first quarter, emerging market equities rose 2.3%, with the Fund outperforming by 0.2% (gross). The Fund’s conviction in Russia, the Fund’s largest overweight, contributed significantly, in particular the Fund’s exposure to energy names such as Gazprom, Rosneft and Sistema. Korea was again strong. The Fund’s underweight to India, a position aligned with the Fund’s valuation approach, also contributed positively, as the markets returned -5.2% in the first quarter. HGIF Global Equity
For the year ending 31 March 2011, the Fund returned +10.6% (net of fees, share class AC) in US dollar compared with the benchmark, which rose +13.45% in US dollar (MSCI World, net total return) over the same period.
Global equities remained in a large trading range over the year. The European debt crisis and the end to Quantitative Easing 1 led stocks lower in the second quarter of 2010, but equities rallied sharply in the second-half of 2010 following the announcement of Quantitative Easing 2 and the fall of risk aversion. The first quarter of 2011 ended on a positive note. Despite concerns about inflation in emerging economies, Middle East and North African countries’ political changes and the Japanese earthquake, risk-appetite remained stable thanks to improving macro and micro economic fundamentals. Over the year, North America outperformed. Asia underperformed, hurt by the Japanese counter-performance.
Over the year, the country allocation had a positive impact on the Fund’s relative performance, in particular in the Fund’s European allocations where the Fund was underexposed on Southern Europe and overexposed in Germany. The stock selection was negative, in particular in the Fund’s North American exposures. Our long-term value-added inputs (valuation and momentum) counter-performed as investors were not focused on the prospective fundamentals. The exposure management had no significant impact on the performance, as the Fund’s exposure remained close to 100% over the year.
Directors’ Report (continued)
18
HGIF Latin American Equity
For the year ending 31 March 2011, the Fund outperformed its benchmark, the MSCI World Index.
Equities were hit by the worsening of the European sovereign credit crisis, whilst EM policy tightened and Chinese and US growth slowed down. In terms of valuations, the Fund continued to trade at relative attractive multiples. Despite this, Latin American equities surged, beating emerging market equities, Asian (ex-Japan) and developed markets. By year end, the Fund had outperformed its benchmark. The announcement of the second wave of quantitative easing in the US, the expansion of commodities, the overall better-than-expected economic data and a slightly weaker US dollar supported the performance of equities around the globe. From a sector perspective, overweights in financials, industrials and consumer discretionary and underweights in steel (in Brazil) contributed positively. Stock selection worked well across the board. In general, throughout the region, the latest increase in volatility has created opportunities which are being captured, although the benefit had yet to be seen. HGIF Middle East and North Africa Equity
For the year ending 31 March 2011, the Fund delivered a return of 0.30% (net of fees, share class AC) compared with a benchmark return of 1.82% (75% S&P Pan-Arab Investable Large and Mid, Net USD (TR) / 25% S&P Saudi Arabia Large and Mid, Net USD (TR) Index). Following Dubai’s debt restructuring announcement in Q4 2009 the MENA markets recovered in 2010. Visibility and confidence were improving in the region and in 2010, a number of IPO’s and corporate bond issuances were announced, a sign of improved sentiment. Commodities were also supportive. The Fund benefited in particular from its positions in Kuwait, Saudi Arabia, Egypt and Oman. In Kuwait, the Fund’s more positive outlook on the country (compared with peers) has been the right decision whilst in Saudi Arabia, the Fund’s exposure to financials like Samba group worked well. Furthermore, in Egypt we bought into the second tier mid-cap stocks, a strategy that has also paid off well. From October we reduced the Fund’s weighting in Egypt and ended the year with a neutral weighting. In 2011 the Middle East and North Africa (MENA) market equities started the year by under performing both emerging and developed markets in a tumultuous month for the asset class. In the second part of January markets were subject to a strong sell off. Political uprisings in Tunisia were later followed by more aggravated and contracted protests in Egypt which led to the ousting of President Mubarak and the Egypt stock exchange to close on 27 January for almost two months. After falls in February of 5.4% MENA Equities rose 3.4% in March. From an investment perspective, whilst recent events are a reminder of the risks of investing in MENA markets, many of which are going through important phases of their evolution, ultimately we continue to see interesting opportunities for investment in the region. In Egypt’s case for example, we believe that ultimately, change should be favourable for the mid and long-term outlook of the economy. The Fund slightly under performed the benchmark in a volatile market but took advantage of the rebound in the market especially by the Fund’s overweights in UAE and Qatar. Although we were underweight on aggregate in Egypt the Fund’s allocation to some of the smaller more illiquid names hurt relative performance.
Directors’ Report (continued)
19
Market Specific Equity Sub-Funds
HGIF Brazil Equity
For the year ending 31 March 2011, the Fund outperformed its benchmark, the MSCI Brazil 10/40 Index. In Brazil, the most important event took place on 3 September with the second quarter of 2010 GDP release. Brazil’s GDP expanded 1.2% quarter-on-quarter, above market expectations implying GDP growth of 5.1% in annualised terms. From a sector perspective, overweights in industrials and zero exposure to utilities did not disappoint. However, exposure within consumer discretionary and staples as well as financials did work as well as expected. By year end, the Fund had outperformed its benchmark by 3.93%. The announcement of the second wave of quantitative easing in the US, the expansion of commodities, the overall better-than-expected economic data and a slightly weaker US dollar supported the performance of equities around the globe. Brazil continued to present a strong household consumption (supported by healthy credit expansion, unemployment rate at record lows and real wage gain) and the impressive recovery of investments. In general, the latest increase in volatility has created some opportunities which are being captured, although the benefit has not yet been realised.
HGIF Chinese Equity
For the year ending 31 March 2010, the Fund delivered a return of 9.22%, compared with a benchmark return of 9.44% (MSCI China 10/40).
Stock selection contributed positively to performance over the period, especially active positions in the Consumer Discretionary and Financials sectors. Xinyi Glass (Consumer Discretionary) was the largest contributing stock to performance. In the financials sector, the Fund's underweight in insurance names such as Ping An Insurance also helped performance. Allocation effect was mixed over the period. An average overweight in IT added value, whilst an average overweight in consumer discretionary cost performance. Residual cash detracted from returns.
HGIF Hong Kong Equity
For the year ended 31 March 2011, the Fund delivered a return of 12.76% (net of fees, share class AC), compared with a benchmark return of 14.16% (Hang Seng Index). The market rebounded during the first half of the reporting period primarily driven by ample liquidity, solid corporate earnings and improving macro sentiment, but remained range bound during the latter half of the reporting period due to the market's concerns over inflation and the adverse impact from interest rate hikes.
Positive stock selection in energy and consumer discretionary sectors added value. However, the Fund’s overweight in materials and information technology sectors hurt performance.
HGIF Indian Equity
For the year ending 31 March 2011, the Fund delivered a positive return of 2.20% compared with a benchmark return of 8.07% (S&P/IFCI Investable India). This comes on the back of a strong performance for the preceding year, where the Fund returned 147.89% (Benchmark: 110.68%).
The Fund’s performance was positive in five sectors and negative in another five. The top contributors were energy (+139bps) and information technology (+99bps) and utilities (+62 bps). The sectors which hurt performance the most were Financials (-392bps), Industrials (-221bps) and consumer staples (-152bps). 74% of the total effect was from stock selection, while the rest was from sector selection.
The third and fourth quarters of calendar year 2011 saw record Foreign Institutional Investor (FII) inflows, with flows going to a select group of index names, especially banks. Underweight positions in some index heavyweights in financials were the key reason for underperformance. We did not consider them as good value, as other large cap stocks (just below the level of the mega large caps) offered better valuation.
Directors’ Report (continued)
20
HGIF Japanese Equity
For the year ending 31 March 2011, the Fund delivered a return of -3.2% (net of fees, share class AC, USD) compared with a benchmark return of 1.45% (MSCI Japan NR USD). The Japanese equity market enjoyed a strong recovery during the fourth quarter of 2010 and the beginning of 2011, as the global economy exhibited a strong recovery. The earthquake and subsequent nuclear disaster in March caused an initial fall of almost 20% in the Japan equity market, less than half of which has been recovered. The strong performance of the Yen over the period has made Japanese exports less competitive than rivals such as Germany and China. The manager’s strategy of favouring companies which are cheap relative to their peers, and with positive earnings sentiment, is not yet bearing fruit. However, there has been positive signs of a turn in performance in recent quarters.
HGIF Korean Equity
For the year ending 31 March 2011, the Fund delivered a return of 30.55% (net of fees, share class AD), compared with a benchmark return of 31.47% (MSCI Korea). After a very strong rally in the previous twelve months, the Korean markets did not lose the momentum thanks to strong upgrades in earnings expectations, recovered export competitiveness, government stimulus measures, low interest rates and improved global sentiment. Market performance was highly correlated with the strong foreign buying, with top performing sectors being the heaviest foreign net bought ones. HGIF Russia Equity
For the year ending 31 March 2011, the HGIF Russia Fund returned 25.39% (net of fees, share class AC) compared with the benchmark return of 29.38% (MSCI Russia 10/40 index). During 2010, Russian equities displayed a high correlation to global markets and to commodities, which make up roughly 2/3 of the index. The MSCI Russia index moved higher and was largely driven by global risk appetite, itself the result of global growth expectations on one hand and risk factors on the other. Growth expectations were predominantly dominated by US and China data, and whether the recovery or the high demand can be sustained respectively. The sovereign debt crisis in the Eurozone was also an ever-present theme in 2010, coming to the fore notably in April when Greece required debt assistance and later, towards the end of the summer, when Ireland followed. Russia equities are high beta and for much of the year underperformed emerging markets until a strong up tick occurred in December. In terms of the macro economy, the recovery has been late compared with much of the world and as a result, is still playing catch up. Inflation is at historically low levels and interest rates are also low. In the fourth quarter, the market benefited from a number of recent positive catalysts, especially the 2018 World Cup win, enhanced merger and acquisition activity (e.g. Wimm Bill Dann), privatisation plans and various reform announcements. The valuation argument, with Russia still trading at a 30-40% discount to emerging markets, also remains and appears supportive. In terms of performance, the Fund was hurt during 2010 from its bias to value. Value was found predominantly in the energy sector (35% of the benchmark) and the Fund’s overweight to the sector, which underperformed over the year, detracted from relative performance. Furthermore, the Fund’s underweight to gold, which looked expensive, also detracted as gold continued to rally higher. Overall, the top market performers were insulated domestic stocks (expensive) rather than stocks linked to global growth. In the first quarter of 2011, the Fund’s overweight towards energy names paid off as the market moved higher, led by the increasing commodity prices.
Directors’ Report (continued)
21
HGIF Singapore Equity
For the year ending March 31, 2011, the Fund returned 17.78% in USD terms, while the benchmark MSCI Singapore returned 22.95%, underperforming by 5.16%.
The sector allocation effect accounted for 61% of the total effect, with the rest coming from the stock selection and interaction effect.
An overweight position in telecom helped performance (+79bps), while overweight positions in industrials (-101bps), energy (-58bps) and information technology (-42bps) hurt performance. An underweight position in consumer staples helped performance (+55bps) while in financials, the underweight cost 45 basis points of performance. Against a rising market, the Fund's cash position acted as a drag. The average cash weight of 2.6% during the year cost about 78 basis points of performance.
HGIF Taiwan Equity
For the year ending 31 March 2011, the Fund delivered a return of 23.29%, compared with a benchmark return of 22.19% (MSCI Taiwan).
The outperformance was mostly driven by superior stock selection. Active positions in the information technology sector added much value to returns. Largan Precision and Chimei Innolux are the top two contributors to performance over the period. From an allocation perspective, an overweight in Industrials contributed positively while an average underweight of consumer discretionary cost performance.
HGIF Thai Equity
For the year ended March 31, 2011, the Fund returned 40.83%, while its benchmark, the Thailand SET Index, returned 48.69%, underperforming by 7.86%.
Sector allocation effect contributed to 38% of the total effect, while the rest came from the stock effect. The Fund’s underweight in energy added to performance (+0.99%). Other underweight sectors such as consumer staples, industrials and telecom detracted from performance. Among the overweight sectors, financials was the worst performer (-2.54%), where the Fund’s stock-picking hurt performance the most. Overweight in information technology and utilities also took away from performance.
HGIF Turkey Equity
For the year ending 31 March 2011, the Fund returned 5.47% (net of fees, share class AC) compared with a benchmark performance of 4.72% (MSCI Turkey Gross Index).
Overweight positions in selected industrial companies were the main contributors. From April until mid-November Turkish equity market outperformed both developed markets and emerging peers and reached all-time-high levels. In the first half of the year, European sovereign debt sustainability was on markets' focus and concerns related to this issue led to a sell-off while Turkish equities remained resilient given strong fiscal performance, robust growth prospects led by domestic demand, historically low interest rates along with political stability. However, by mid-November, with the implementation of unconventional monetary measures by the Central Bank of Turkey, Turkish equities started to underperform emerging markets until March 2011. These measures consisted of decreasing policy rates and increasing reserve requirements for banks simultaneously and resulted in deterioration of banks' future profit estimates, sharp depreciation of TRY and foreign Fund outflows. In addition to these factors, social unrest in the Middle East and North Africa region and rising food and oil prices hurt Turkey's performance due to high sensitivity of its current account deficit to oil prices and trade relations with the MENA region.
Directors’ Report (continued)
22
HGIF UK Equity
For the period 1 April 2010 to 31 March 2011, the Fund returned 12.2% (net of fees, Class A), compared to a benchmark return of 8.7% (the FTSE All Share (TR)).
The UK equity market rose over the 12-month period, largely driven by strong rise in corporate earnings. The UK economy continued to recover for most of 2010, but growth halted in fourth quarter, affected by the very severe weather. The UK economy has benefited from growth elsewhere in Europe, the US and emerging economies such as China. Sentiment in the equity market was also affected by the continued fiscal problems in countries such as Greece, Ireland and Portugal. Over this period, the corporate sector has continued to perform well with profits rising strongly. Capital expenditure has been modest and many companies have increased dividend payments. The Fund holdings have concentrated on companies with sustainable cash flows and good balance sheets. The Fund performance was led by companies releasing good results. The valuation of the equity market is well below 15-year averages. With corporate earnings expected to grow through 2011, we believe that investors should receive modest gains from equities over the medium-term.
HGIF US Equity
For the year ending 31 March 2011, the Fund returned 13.93% (net of fees, share AC) in US dollar terms compared with the benchmark return of 15.65% (S&P 500 Composite (RI)). During the first half of the year, macro data confirmed the recovery was uneven. Better than expected earnings seasons in the US rekindled investors’ optimism, sending equity markets up and volatility down. In the wake of a sluggish August, equities recorded their best September month in 7 decades. Upbeat macro data eased concerns regarding the pace of the economic recovery. However, rising oil prices and inflation during the first quarter 2011 could affect the growth in consumer spending and business investment, as well as US long-term fiscal problems. Standard &Poor’s revised its outlook on the country’s long term credit rating to negative from stable.
The Fund benefited from a strong stock selection. Most of the gains came from the financial and healthcare sectors. Stock selection within oil, gas & consumer fuels sector also contributed positively to the Fund performance (Overweight position on Conoco Phillips +62%) The Fund suffered from a negative sector allocation. The overweight position on Diversified Financials (-1.04%) generated part of the losses. The energy equipment & services was the best performing industry over the period (+56%) while the diversified financials recorded the sole negative performance. The gains issued from the overweight on the automobile sector (+24%) helped the Fund in limiting its underperformance. As numbers of uncertainties kept weighing on the market, the Fund remained cautious and maintained a 100% market exposure over the period.
Other Sub-Funds
HGIF European Equity Absolute Return Fund (formerly, European Equity Alpha)
For the year ended 31 Mar 2011, the Fund returned -2.69%. The long positions achieved a return of 3.76%, compared with 3.41% for MSCI Europe Index. However, a number of positions in the short portfolio rallied strongly and the short portfolio lost -6.45%. The Fund had started well, returning +5.6% by the end of last August when the market struggled under the European sovereign crisis, sluggish recovery in the U.S. and a lingering fear of deflation. All of this gain was reversed after investors were enticed back to the market by the US Federal Reserve Chairman Bernanke’s second quarter earnings announcement. The ensuing rally favoured low quality and more financially geared companies, which has proven very damaging to the short portfolio. Short positions comprised names with poor quality and valuation metrics. These names, however, were the ones, which rallied quickly based on earnings upgrades. Although the rally is a little long in the tooth, it has appeared fairly resilient so far. Signs have recently emerged that investors are becoming hesitant (cue the recent wild swings in commodity markets). The strategy of the Fund remains the same – the manager continues to look for companies with strong profitability at cheap valuations, and vice versa for the shorts.
Directors’ Report (continued)
23
HGIF GEM Debt Total Return (formerly, New World Income)
For the year ending 31 March 2011, the Fund delivered a return of 4.04% (net of fees, share class M1C) compared with a return of 0.56% for the benchmark (3 Month USD LIBOR Constant Maturity).The Global Emerging Markets Debt Total Return strategy maintains its place as one performing emerging markets debt products available on a risk adjusted basis.
Absolute performance was strong for the first seven months of the period as both hard currency and local currency debt performed well. However, in November, and through to January, the asset class faltered, as concerns around the Eurozone debt crisis caused a sell off. The Fund maintained a net invested position of around 60% - 70% for the majority of the year, ensuring that the Fund captured the majority of market gains, but still maintained protection against any losses in the markets and controlled volatility. A significant amount of performance has been driven by country selection, with gains from both external debt and local currency exposure. Overall, the Fund remained constructive on emerging markets debt, amid improving fundamentals, but took a short term cautious stance regarding emerging market local currencies. The Fund maintained high levels of liquidity and stood ready to add aggressively when compelling investment opportunities presented themselves.
HGIF GEM Equity Absolute Return (formerly, Global Emerging Markets Equity Alpha)
The inception date for this Fund was 16 April 2010. From this point to 31 March 2011, the Fund delivered a return of 6.8% (net of fees, class L1) in USD, against a benchmark return of 0.3% (1 month USD Libor).
The GEM Equity Absolute Return Fund employs a value-driven long-short approach to exploit the inefficiencies inherent in emerging markets, selecting around 35 long and 35 short stock positions based upon fundamental analysis, from a universe of over 700 stocks, thereby aiming to generate ‘double alpha’ through managing both sides of the book. Over the period, gross exposure for the Fund varied between 90% and 150%. Net exposure varied from -8% to +8% over this period. The Fund’s current position reflects the net exposures of those stocks identified from Fundamental analysis that provide mismatches of price-to-book value ratios and returns on equity; in particular, those stocks with low price-to-book value ratios and high return on equity for the long book and high price-to-book value ratios and low return on equity for the short book. Currently, with market valuations in a neutral zone, the Fund managers are focusing on individual stocks (both long and short) to drive the portfolio and the net position of the Fund is close to zero. Gross exposure is near the steady state level of 150%.
HGIF Global Bond Market Neutral
For the year ending 31 March 2011, the Fund delivered a return of 1.49% (net of fees, share class L1C) against a benchmark return of 0.52% (EONIA).
Ten-year government nominal yields declined noticeably, especially over the first part of the fiscal year, following poor economic data and renewed woes on sovereign credit risk. In addition to their natural propensity to amplify the general trend, US treasuries were supported by disappointing economic data combined with the fact that the Federal Reserve reaffirmed its pledge to maintain rates at a record low for an extended period. In this environment, the relative value on nominal bonds driver especially benefited from its +22% average long position on the US market. At the end of March, main active positions concern the UK (short), Canada (short), Germany (short), Switzerland (long) and the US (long). Shorter maturities now price European Central Bank and Bank of England hikes before year-end since hawkish comments from both Central Banks.
In the foreign exchange market, investors were torn between the volatility in risk-aversion, the rise of commodity prices and monetary policy expectations. The US dollar dropped against the currencies of its major trade partners as a result of the Fed’s monetary policy. Dollar bloc currencies delivered a higher performance than European currencies due to higher commodity prices. Within the European bloc, the Swiss franc strongly outperformed the euro on peripherals concerns. In this environment, the fund benefited from the overall short exposure on the US dollar, especially against dollar bloc currencies but was penalised by its short position on the Swiss franc. The major part of the driver’s risk budget is currently dedicated to i) short exposure on the Swiss franc vs. other European currencies and ii) global short exposure on the US dollar vs. all other OECD currencies. At the end of March, and since the beginning of the crisis, the rise of the Swiss franc is still quite large (between 15% and 45%) compared to other European currencies and cannot be explained only by changes in fundamentals. The US dollar may continue to suffer from the accommodative monetary policy from the Fed.
Directors’ Report (continued)
24
HGIF Global Currency
For the year ending 31 March 2011, the Fund delivered a return of, -4.80% (net of fees, Class L1) USD Institutional share class, against a benchmark return of 0.11 % (3-month USD T-bill). The year of 2010 was a difficult year in the FX Market. The difficulties started with the European Sovereign Debt Crisis and continued with the second round of Quantitative Easing in the US (QE2) in August 2010. Central Banks around the world left interest rates low and they remained fairly static throughout the year. FX Markets remained volatile in the first quarter of 2011 based on tragic event in Japan, an earthquake in New Zealand, the Libya crisis and inflationary pressures in Europe. The European Central Bank has signalled a gradual pace of interest rate hikes for the remainder of the year. It appears that global Interest Rates have started to increase, and yield curves are indicating future interest rates increases. The manager uses a quantitatively-based methodology and employs both short-term and long-term investment strategies. The latter focused on carry effects (differences in interest rates between currencies) whilst the former aimed to exploit predictability in short-term spot foreign exchange moves. The period of the report was characterised by difficult and volatile financial markets, which are a continuation of the financial crisis of 2007-2008.
HGIF Global Flex Allocation
For the year ending 31 March 2011, the Fund delivered a return of –0.71% (net of fees, share class AC) in line with the benchmark return of –0.66 % (60% CG EGBI + 40 % MSCI World).
The Fund benefited from an investment strategy focused around the following three points: firstly, a large investment in equities up to end mid-January, which was then reduced (as it was thought that despite an attractive valuation after more than a 6-month rally, equities were sensitive to higher macro and micro risk); secondly, preferred equities markets being UK, Switzerland, Russia, Korea and Canada; and thirdly, the portfolio being invested in various bonds with a median risk exposure. A balanced credit risk of between AAA euro government bonds and non-financial euro-denominated bonds were held. The next period is commencing with low-beta equity risk and a cautious stance in credit selection.
HGIF Global Macro
For the year ending 31 March 2011, the Fund delivered a return of 0.64% (net of fees, share class L1C).
This period was marked by a continuation of the recovery in the global economy and financial markets, notwithstanding a discernible phase of mid-year slowdown in the economy and heightened market volatility during the summer months. Global equities gained 13.2% as measured by MSCI AC World Total Return Index in US dollar, whilst global government bonds returned 6-7% across the three major markets (US, Eurozone and UK) as measured by JP Morgan Government Bond Indices in local currency terms. Though a extension of the positive track record in 2008 and 2009, we fell short of the Fund’s target alpha return. Equity strategies provided recurring positive returns with diversified and relative value bets. Results were mixed in bonds and currencies. In bonds, we suffered losses, primarily in the discretionary sleeve, owing to a short duration exposure. It was driven by the view that bonds were overvalued relative to other asset classes and under-compensate investors for risks. The Fund has managed its risk budget prudently when high frequency swings in market prices did not produce any significant signal in either valuation or sentiment extremes. By year-end, its risk profile converged back towards the target volatility.
Directors’ Report (continued)
25
HGIF Global Macro II
The Macro II Fund was launched on 4th October 2011. For the period up to 31 March 2011, the Fund delivered a return of 3.44% (net of fees, share class L1C).
This period was marked by a continuation of the recovery in the global economy and financial markets. Global equities gained 13.9% as measured by MSCI AC World Total Return Index in USD. Though positive, we fell short of the Fund’s target alpha return. Equity strategies provided positive returns with diversified and relative value bets. Results were mixed in bonds and currencies. In bonds, we suffered losses, primarily in the discretionary sleeve, owing to a short duration exposure. It was driven by the view that bonds were overvalued relative to other asset classes and under-compensate investors for risks. The Fund has managed its risk budget prudently when high frequency swings in market prices did not produce any significant signal in either valuation or sentiment extremes. By year-end, its risk profile converged back towards the target volatility.
Report of the Reviseur d'Entreprises agree
To the Shareholders of HSBC Global Investment Funds 16, Boulevard d'Avranches L -1 160 Luxembourg Grand Duchy 01 Luxembourg
REPORT OF THE REviSEUR O'ENTREPRISES AGREE
Following our appointment by the Annual General Meeting of the shareholders dated 30 July 2010, we have audited the accompanying financial statements of H$BC Global Investment Funds ("the CompanyH) and each of its sub-funds, which comprise the statement of nel assets and the statement of investments in securities and other net assets as at 31 March 2011 and the statement of operations and changes in net assets for the year then ended, and a summary of significant accounting policies and other explanatory information.
Board of Directors of the Company responsibility for the financial statements
The Board of Directors of the Company is responsible for the preparation and fair presentation of these financial statements in accordance with luxembourg legal and regulatory requirements relating to the preparation of the financial statements, and for such internal control as the Board of Directors of the Company determines is necessary to enable the preparation of financial statements that are free from material misstatement whether due to fratKf or error.
Responsibility of the Reviseur d'Entreprises agree
Our responsibility is to express an opinion on these financial statements based on our audit. We conducted our audit in accordance with International Standards on Auditing as adopted for luxembourg by the Commission de Surveillance du Secteur Financier. Those standards require that we comply with ethical requirements and plan and perform the audit to obtain reasonable assurance about whether the financial statements are free from material misstatement.
An audit involves performing procedures to obtain audit evidence about the amounts and disclosures in the financial statemems. The procedures selected depend on the judgment of the Reviseur d'Enueprises agree, including the assessment of the risks of matenal misstatement of the financial statements, whether due to fraud or error. In making those risk assessments, the Aeviseur d'Entreprises agree considers internal control relevant to the entity's preparation and fair presentation of the financial statements in OHler to design audit procedures that are appropriate in the circumstances, but not for the purpose of expressing an opinion on the effectiveness of the entity 's internal control.
An audit also includes evaluating the appropriateness of accounting policies used and the reasonableness of accounting estimates made by the Board of Directors of the Company, as well as evaluating the overall presentation of the financial statements.
We believe that the audit evidence we have obtained is sufficient and appropriate to provide a basis for our audit opinion.
Opinion
In our opinion, the financial statements give a true and fair view of the financial position of HSBC Global Investment Funds and each of its sub-funds as of 31 March 2011, and of the results of tlleir operations and changes in their net assets for the year then ended in accordance with Luxembourg legal and regulatory requirements relating to the preparation of the financial statements.
Orher matter
Supplementary information included in the annual report has been reviewed in the context of our mandate but has not been subject to specific audit procedures carried out in accordance with the standards described above. Consequently, we express no opinion on such information. However, we have no observation to mak.e cooc:erning such information in the context of the financial statements tak.en as a whole.
Luxembourg, 11 Jut'( 20 11
KPMG Audit S.a r.l. cabinet de revision agree
A. Beegun
26

27
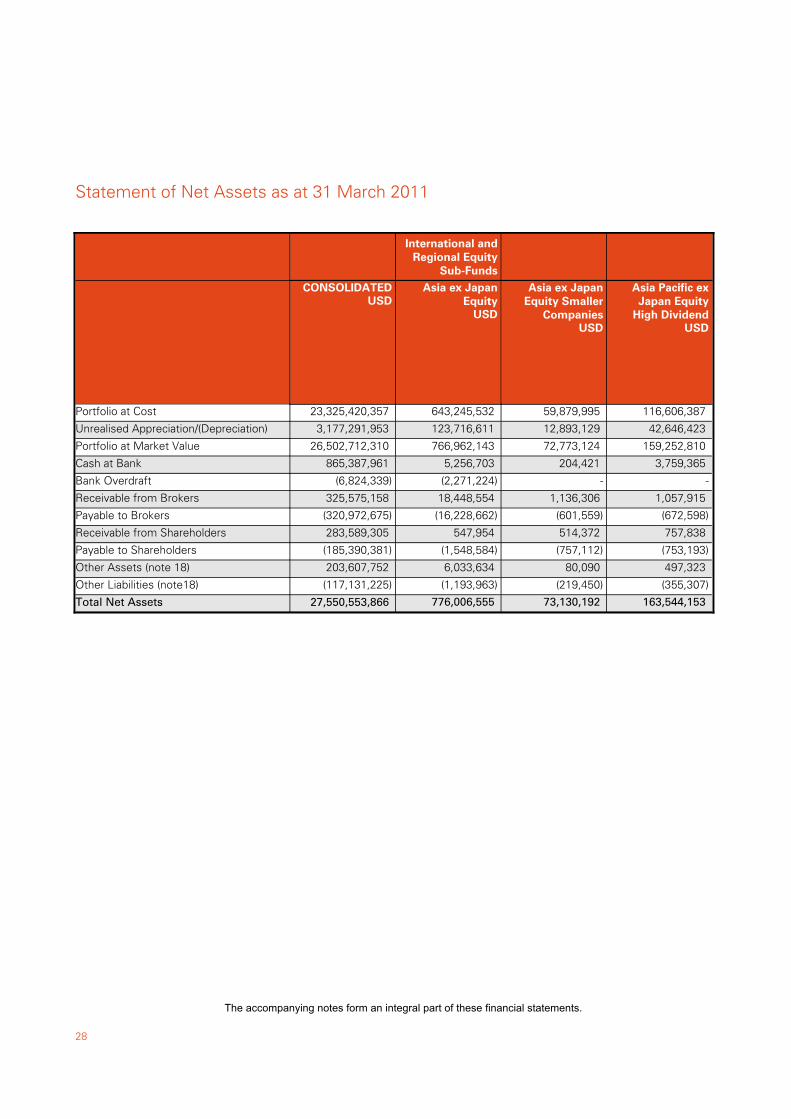
28
Statement of Net Assets as at 31 March 2011
The accompanying notes form an integral part of these financial statements.
Portfolio at Cost
Unrealised Appreciation/(Depreciation)
Portfolio at Market Value
Cash at Bank
Bank Overdraft
Receivable from Brokers
Payable to Brokers
Receivable from Shareholders
Payable to Shareholders
Other Assets (note 18)
Other Liabilities (note18)
Total Net Assets
CONSOLIDATEDUSD
23,325,420,357
3,177,291,953
26,502,712,310
865,387,961
(6,824,339)
325,575,158
(320,972,675)
283,589,305
(185,390,381)
203,607,752
(117,131,225)
27,550,553,866
USD
Asia ex JapanEquity
643,245,532
123,716,611
766,962,143
5,256,703
(2,271,224)
18,448,554
(16,228,662)
547,954
(1,548,584)
6,033,634
(1,193,963)
776,006,555
International andRegional Equity
Sub-Funds
USD
Asia ex JapanEquity Smaller
Companies
59,879,995
12,893,129
72,773,124
204,421
-
1,136,306
(601,559)
514,372
(757,112)
80,090
(219,450)
73,130,192
USD
Asia Pacific exJapan Equity
High Dividend
116,606,387
42,646,423
159,252,810
3,759,365
-
1,057,915
(672,598)
757,838
(753,193)
497,323
(355,307)
163,544,153

29
Statement of Net Assets as at 31 March 2011
USDBRIC Equity
1,669,677,527
380,320,091
2,049,997,618
28,510,108
(7)
21,452,067
(19,215,180)
3,861,463
(6,616,435)
1,324,347
(2,281,069)
2,077,032,912
USDBRIC Markets
30,723,086
11,185,372
41,908,458
40,334
-
-
-
-
-
50,378
(44,117)
41,955,053
USD
BRIC MarketsEquity
532,559,347
136,100,866
668,660,213
36,060,253
-
-
-
1,917,647
(1,321,106)
2,391,770
(887,238)
706,821,539
USDClimate Change
38,009,067
210,265
38,219,332
3,124,599
-
1,401,768
(312,648)
155,827
(1,736,436)
78,866
(64,694)
40,866,614
USDEmerging Wealth
27,376,253
2,250,116
29,626,369
2,392,916
(6,482)
-
-
127,455
(754,592)
149,434
(55,196)
31,479,904
EUREuroland Equity
1,020,309,930
(18,882,329)
1,001,427,601
2,042,023
-
-
-
25,055,848
(15,099,719)
295,921
(1,322,111)
1,012,399,563
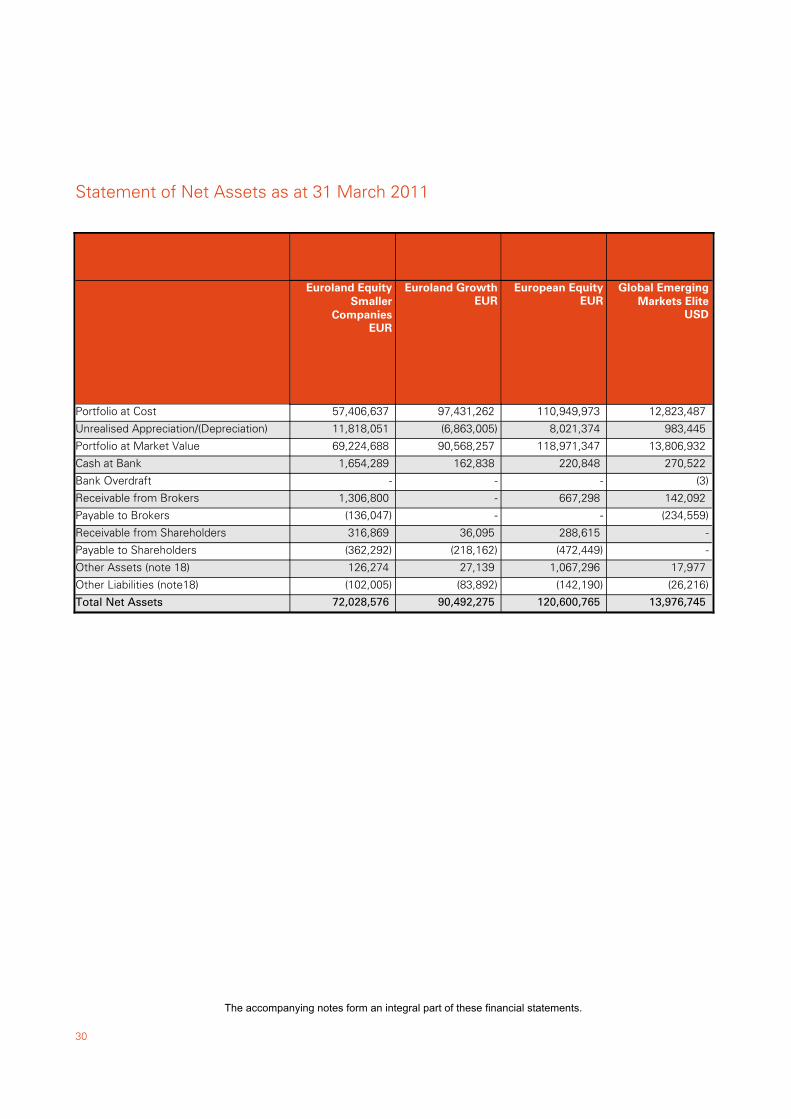
30
Statement of Net Assets as at 31 March 2011
The accompanying notes form an integral part of these financial statements.
Portfolio at Cost
Unrealised Appreciation/(Depreciation)
Portfolio at Market Value
Cash at Bank
Bank Overdraft
Receivable from Brokers
Payable to Brokers
Receivable from Shareholders
Payable to Shareholders
Other Assets (note 18)
Other Liabilities (note18)
Total Net Assets
EUR
Euroland EquitySmaller
Companies
57,406,637
11,818,051
69,224,688
1,654,289
-
1,306,800
(136,047)
316,869
(362,292)
126,274
(102,005)
72,028,576
EUREuroland Growth
97,431,262
(6,863,005)
90,568,257
162,838
-
-
-
36,095
(218,162)
27,139
(83,892)
90,492,275
EUREuropean Equity
110,949,973
8,021,374
118,971,347
220,848
-
667,298
-
288,615
(472,449)
1,067,296
(142,190)
120,600,765
USD
Global EmergingMarkets Elite
12,823,487
983,445
13,806,932
270,522
(3)
142,092
(234,559)
-
-
17,977
(26,216)
13,976,745
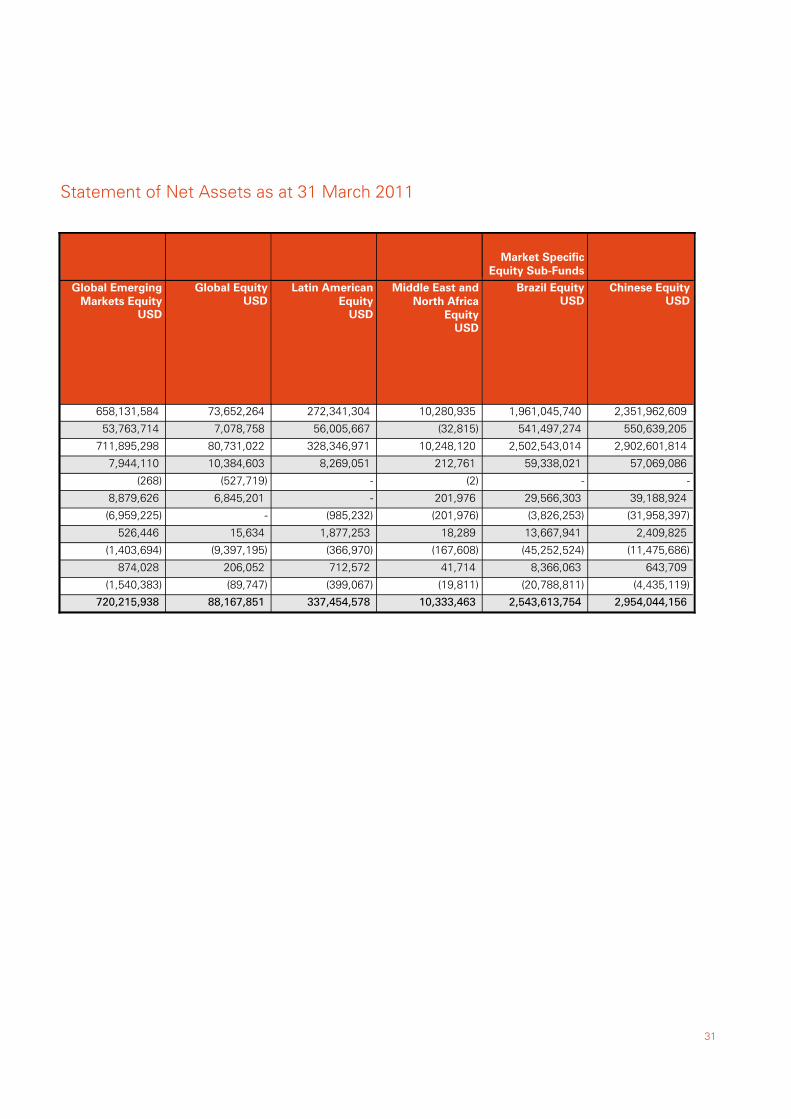
31
Statement of Net Assets as at 31 March 2011
USD
Global EmergingMarkets Equity
658,131,584
53,763,714
711,895,298
7,944,110
(268)
8,879,626
(6,959,225)
526,446
(1,403,694)
874,028
(1,540,383)
720,215,938
USDGlobal Equity
73,652,264
7,078,758
80,731,022
10,384,603
(527,719)
6,845,201
-
15,634
(9,397,195)
206,052
(89,747)
88,167,851
USD
Latin AmericanEquity
272,341,304
56,005,667
328,346,971
8,269,051
-
-
(985,232)
1,877,253
(366,970)
712,572
(399,067)
337,454,578
USD
Middle East andNorth Africa
Equity
10,280,935
(32,815)
10,248,120
212,761
(2)
201,976
(201,976)
18,289
(167,608)
41,714
(19,811)
10,333,463
USDBrazil Equity
1,961,045,740
541,497,274
2,502,543,014
59,338,021
-
29,566,303
(3,826,253)
13,667,941
(45,252,524)
8,366,063
(20,788,811)
2,543,613,754
Market SpecificEquity Sub-Funds
USDChinese Equity
2,351,962,609
550,639,205
2,902,601,814
57,069,086
-
39,188,924
(31,958,397)
2,409,825
(11,475,686)
643,709
(4,435,119)
2,954,044,156
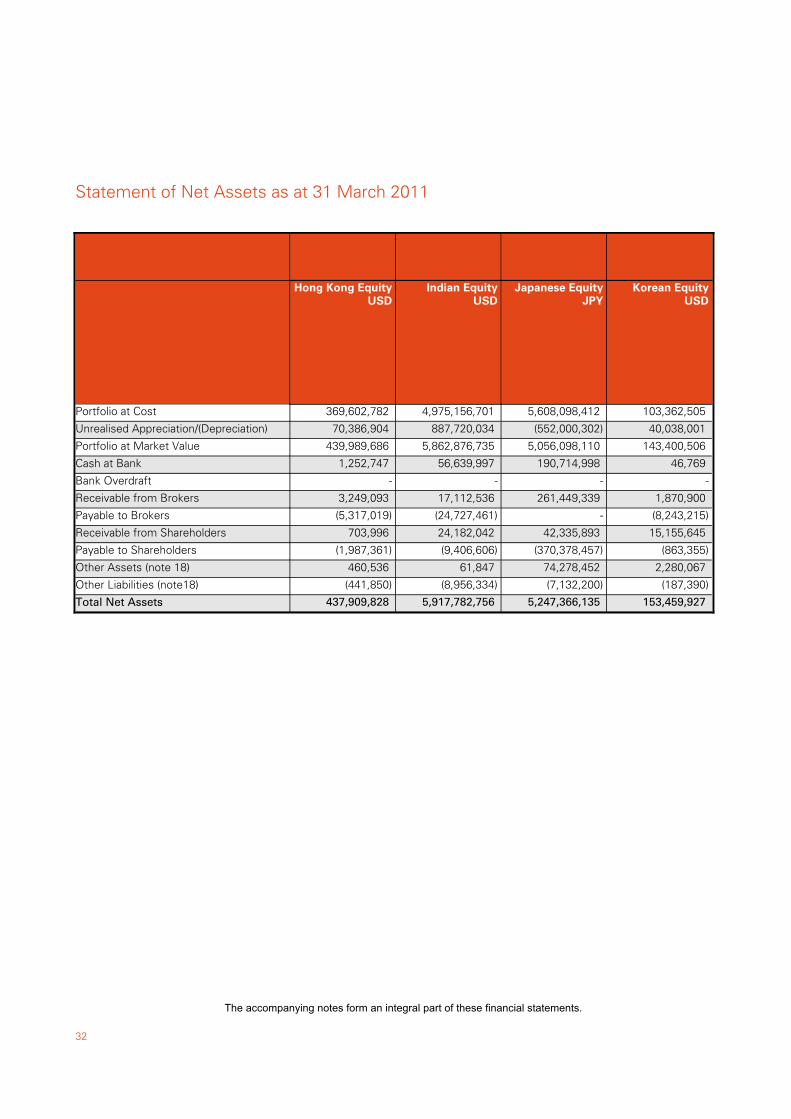
32
Statement of Net Assets as at 31 March 2011
The accompanying notes form an integral part of these financial statements.
Portfolio at Cost
Unrealised Appreciation/(Depreciation)
Portfolio at Market Value
Cash at Bank
Bank Overdraft
Receivable from Brokers
Payable to Brokers
Receivable from Shareholders
Payable to Shareholders
Other Assets (note 18)
Other Liabilities (note18)
Total Net Assets
USDHong Kong Equity
369,602,782
70,386,904
439,989,686
1,252,747
-
3,249,093
(5,317,019)
703,996
(1,987,361)
460,536
(441,850)
437,909,828
USDIndian Equity
4,975,156,701
887,720,034
5,862,876,735
56,639,997
-
17,112,536
(24,727,461)
24,182,042
(9,406,606)
61,847
(8,956,334)
5,917,782,756
JPYJapanese Equity
5,608,098,412
(552,000,302)
5,056,098,110
190,714,998
-
261,449,339
-
42,335,893
(370,378,457)
74,278,452
(7,132,200)
5,247,366,135
USDKorean Equity
103,362,505
40,038,001
143,400,506
46,769
-
1,870,900
(8,243,215)
15,155,645
(863,355)
2,280,067
(187,390)
153,459,927

33
Statement of Net Assets as at 31 March 2011
USDRussia Equity
412,177,248
82,282,856
494,460,104
11,100,770
-
-
(1,408,145)
17,830,046
(17,296,886)
57,116
(859,870)
503,883,135
USDSingapore Equity
59,144,411
10,373,570
69,517,981
3,504,141
-
-
-
144,362
(280,718)
1
(106,207)
72,779,560
USDTaiwan Equity
33,450,664
1,439,978
34,890,642
57,615
-
728,194
(4,115,209)
3,990,909
(309,937)
1,410
(48,343)
35,195,281
USDThai Equity
108,356,618
28,220,713
136,577,331
2,357,868
-
-
-
1,126,631
(4,740,008)
1,116,161
(208,510)
136,229,473
EURTurkey Equity
154,499,722
(15,089,138)
139,410,584
2,360,846
-
118,822
-
1,588,237
(753,623)
224,836
(233,926)
142,715,776
GBPUK Equity
40,624,653
7,200,624
47,825,277
627,951
-
-
(59,742)
243,682
(152,870)
214,718
(74,597)
48,624,419
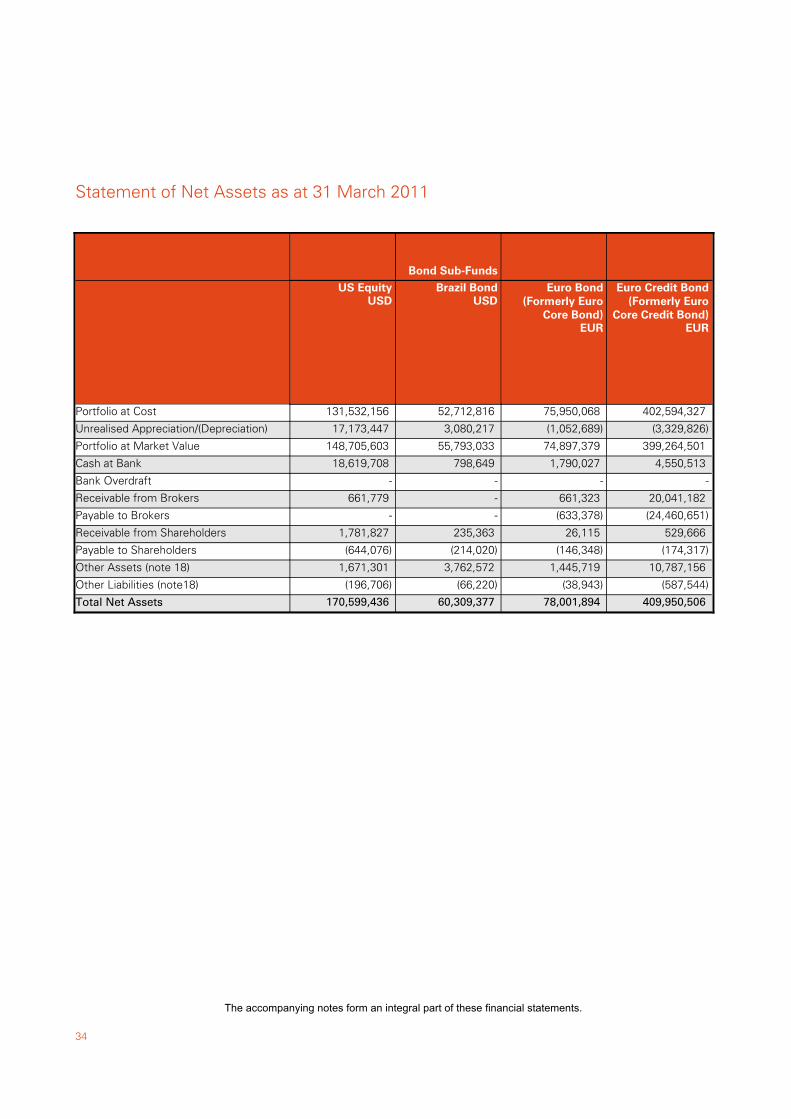
34
Statement of Net Assets as at 31 March 2011
The accompanying notes form an integral part of these financial statements.
Portfolio at Cost
Unrealised Appreciation/(Depreciation)
Portfolio at Market Value
Cash at Bank
Bank Overdraft
Receivable from Brokers
Payable to Brokers
Receivable from Shareholders
Payable to Shareholders
Other Assets (note 18)
Other Liabilities (note18)
Total Net Assets
USDUS Equity
131,532,156
17,173,447
148,705,603
18,619,708
-
661,779
-
1,781,827
(644,076)
1,671,301
(196,706)
170,599,436
USDBrazil Bond
52,712,816
3,080,217
55,793,033
798,649
-
-
-
235,363
(214,020)
3,762,572
(66,220)
60,309,377
Bond Sub-Funds
EUR
Euro Bond(Formerly Euro
Core Bond)
75,950,068
(1,052,689)
74,897,379
1,790,027
-
661,323
(633,378)
26,115
(146,348)
1,445,719
(38,943)
78,001,894
EUR
Euro Credit Bond(Formerly Euro
Core Credit Bond)
402,594,327
(3,329,826)
399,264,501
4,550,513
-
20,041,182
(24,460,651)
529,666
(174,317)
10,787,156
(587,544)
409,950,506
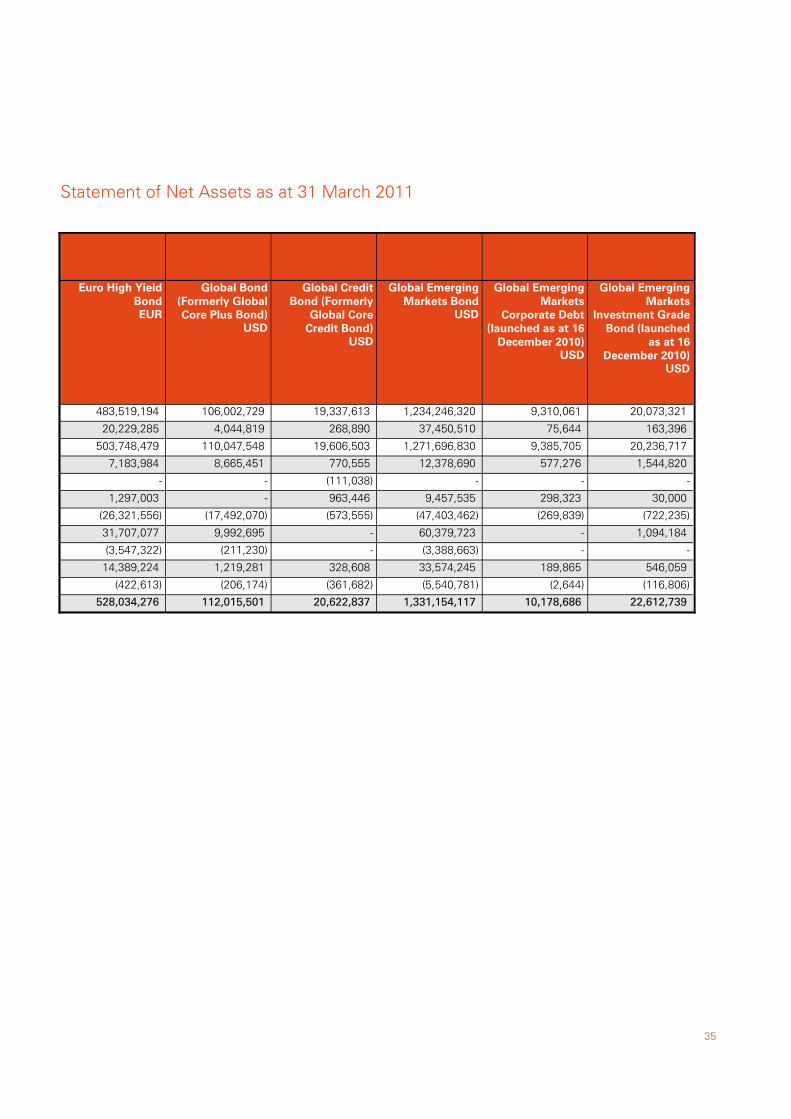
35
Statement of Net Assets as at 31 March 2011
EUR
Euro High YieldBond
483,519,194
20,229,285
503,748,479
7,183,984
-
1,297,003
(26,321,556)
31,707,077
(3,547,322)
14,389,224
(422,613)
528,034,276
USD
Global Bond(Formerly GlobalCore Plus Bond)
106,002,729
4,044,819
110,047,548
8,665,451
-
-
(17,492,070)
9,992,695
(211,230)
1,219,281
(206,174)
112,015,501
USD
Global CreditBond (Formerly
Global CoreCredit Bond)
19,337,613
268,890
19,606,503
770,555
(111,038)
963,446
(573,555)
-
-
328,608
(361,682)
20,622,837
USD
Global EmergingMarkets Bond
1,234,246,320
37,450,510
1,271,696,830
12,378,690
-
9,457,535
(47,403,462)
60,379,723
(3,388,663)
33,574,245
(5,540,781)
1,331,154,117
USD
Global EmergingMarkets
Corporate Debt(launched as at 16
December 2010)
9,310,061
75,644
9,385,705
577,276
-
298,323
(269,839)
-
-
189,865
(2,644)
10,178,686
USD
Global EmergingMarkets
Investment GradeBond (launched
as at 16December 2010)
20,073,321
163,396
20,236,717
1,544,820
-
30,000
(722,235)
1,094,184
-
546,059
(116,806)
22,612,739
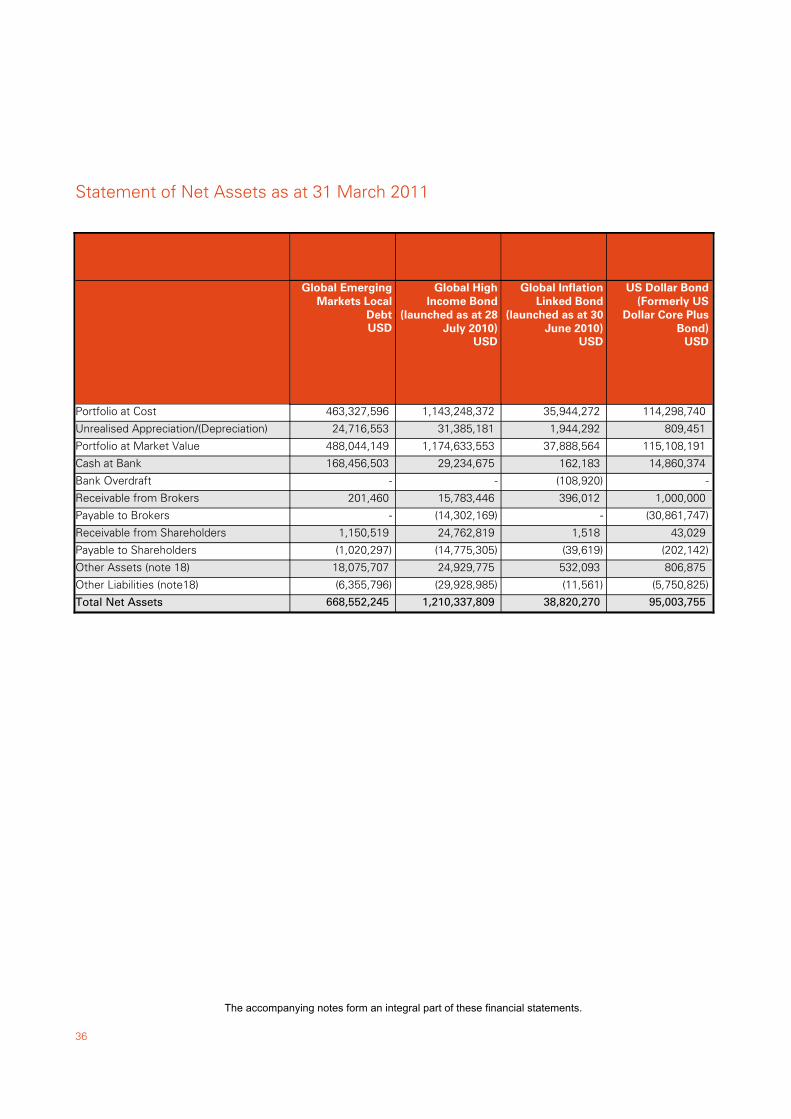
36
Statement of Net Assets as at 31 March 2011
The accompanying notes form an integral part of these financial statements.
Portfolio at Cost
Unrealised Appreciation/(Depreciation)
Portfolio at Market Value
Cash at Bank
Bank Overdraft
Receivable from Brokers
Payable to Brokers
Receivable from Shareholders
Payable to Shareholders
Other Assets (note 18)
Other Liabilities (note18)
Total Net Assets
USD
Global EmergingMarkets Local
Debt
463,327,596
24,716,553
488,044,149
168,456,503
-
201,460
-
1,150,519
(1,020,297)
18,075,707
(6,355,796)
668,552,245
USD
Global HighIncome Bond
(launched as at 28July 2010)
1,143,248,372
31,385,181
1,174,633,553
29,234,675
-
15,783,446
(14,302,169)
24,762,819
(14,775,305)
24,929,775
(29,928,985)
1,210,337,809
USD
Global InflationLinked Bond
(launched as at 30June 2010)
35,944,272
1,944,292
37,888,564
162,183
(108,920)
396,012
-
1,518
(39,619)
532,093
(11,561)
38,820,270
USD
US Dollar Bond(Formerly US
Dollar Core PlusBond)
114,298,740
809,451
115,108,191
14,860,374
-
1,000,000
(30,861,747)
43,029
(202,142)
806,875
(5,750,825)
95,003,755
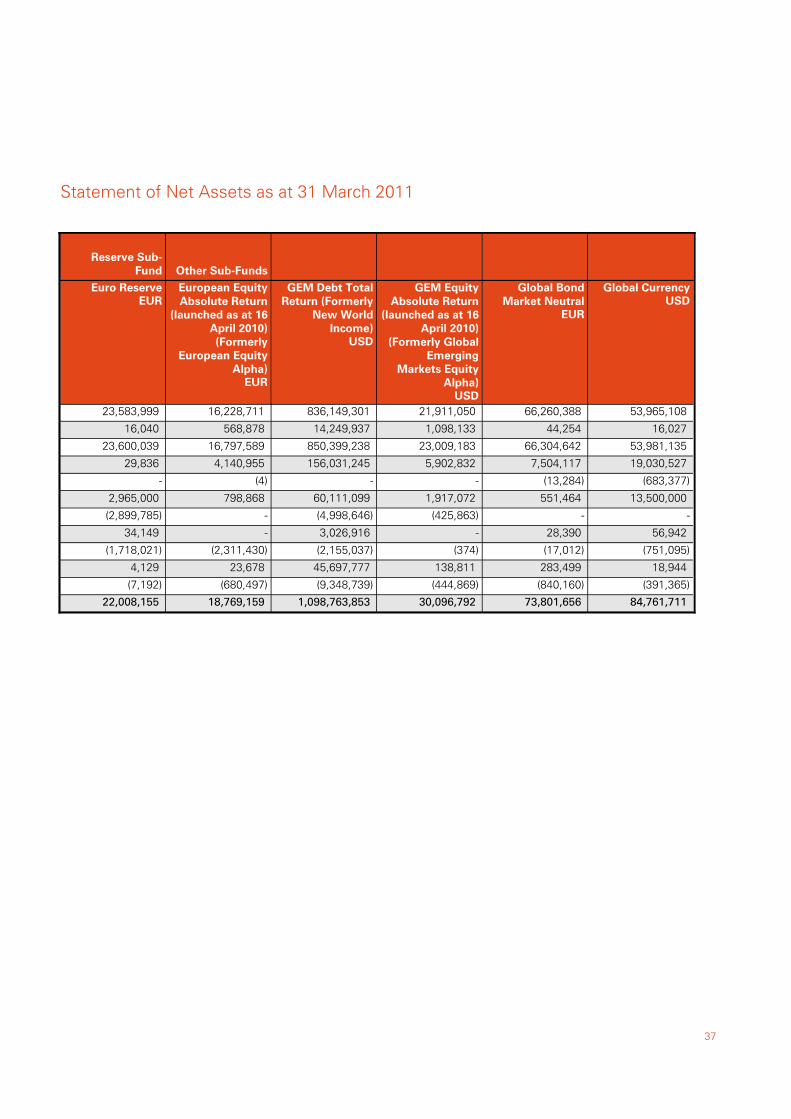
37
Statement of Net Assets as at 31 March 2011
EUREuro Reserve
23,583,999
16,040
23,600,039
29,836
-
2,965,000
(2,899,785)
34,149
(1,718,021)
4,129
(7,192)
22,008,155
Reserve Sub-Fund
EUR
European EquityAbsolute Return
(launched as at 16April 2010)(Formerly
European EquityAlpha)
16,228,711
568,878
16,797,589
4,140,955
(4)
798,868
-
-
(2,311,430)
23,678
(680,497)
18,769,159
Other Sub-Funds
USD
GEM Debt TotalReturn (Formerly
New WorldIncome)
836,149,301
14,249,937
850,399,238
156,031,245
-
60,111,099
(4,998,646)
3,026,916
(2,155,037)
45,697,777
(9,348,739)
1,098,763,853
USD
GEM EquityAbsolute Return
(launched as at 16April 2010)
(Formerly GlobalEmerging
Markets EquityAlpha)
21,911,050
1,098,133
23,009,183
5,902,832
-
1,917,072
(425,863)
-
(374)
138,811
(444,869)
30,096,792
EUR
Global BondMarket Neutral
66,260,388
44,254
66,304,642
7,504,117
(13,284)
551,464
-
28,390
(17,012)
283,499
(840,160)
73,801,656
USDGlobal Currency
53,965,108
16,027
53,981,135
19,030,527
(683,377)
13,500,000
-
56,942
(751,095)
18,944
(391,365)
84,761,711
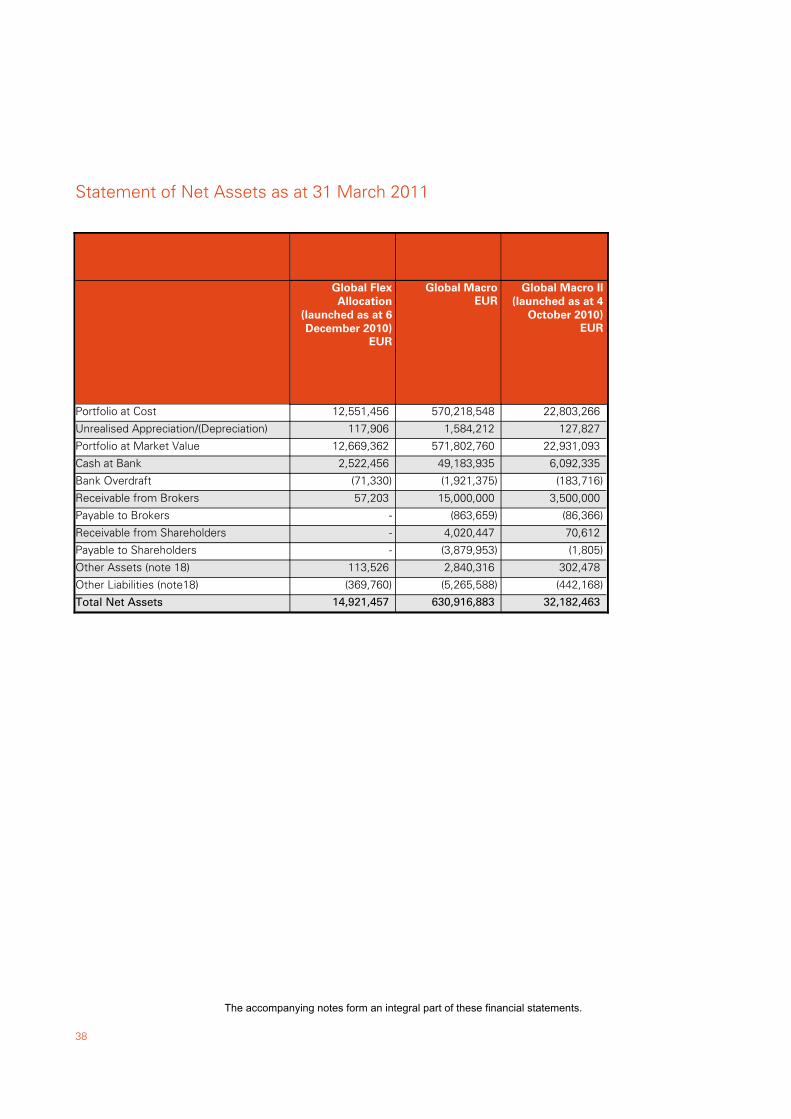
38
Statement of Net Assets as at 31 March 2011
The accompanying notes form an integral part of these financial statements.
Portfolio at Cost
Unrealised Appreciation/(Depreciation)
Portfolio at Market Value
Cash at Bank
Bank Overdraft
Receivable from Brokers
Payable to Brokers
Receivable from Shareholders
Payable to Shareholders
Other Assets (note 18)
Other Liabilities (note18)
Total Net Assets
EUR
Global FlexAllocation
(launched as at 6December 2010)
12,551,456
117,906
12,669,362
2,522,456
(71,330)
57,203
-
-
-
113,526
(369,760)
14,921,457
EURGlobal Macro
570,218,548
1,584,212
571,802,760
49,183,935
(1,921,375)
15,000,000
(863,659)
4,020,447
(3,879,953)
2,840,316
(5,265,588)
630,916,883
EUR
Global Macro II(launched as at 4
October 2010)
22,803,266
127,827
22,931,093
6,092,335
(183,716)
3,500,000
(86,366)
70,612
(1,805)
302,478
(442,168)
32,182,463
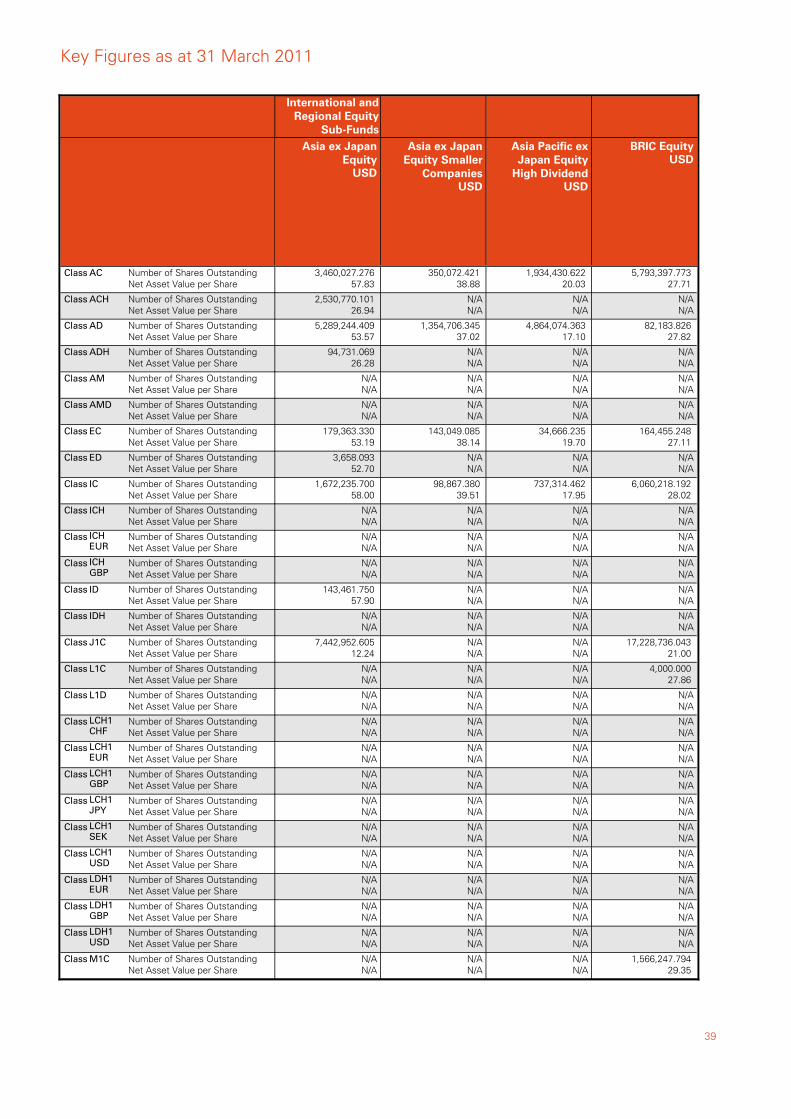
39
Class AC Number of Shares OutstandingNet Asset Value per Share
3,460,027.276 57.83
Class ACH Number of Shares OutstandingNet Asset Value per Share
2,530,770.101 26.94
Class AD Number of Shares OutstandingNet Asset Value per Share
5,289,244.409 53.57
Class ADH Number of Shares OutstandingNet Asset Value per Share
94,731.069 26.28
Class AM Number of Shares OutstandingNet Asset Value per Share
N/AN/A
Class AMD Number of Shares OutstandingNet Asset Value per Share
N/AN/A
Class EC Number of Shares OutstandingNet Asset Value per Share
179,363.330 53.19
Class ED Number of Shares OutstandingNet Asset Value per Share
3,658.093 52.70
Class IC Number of Shares OutstandingNet Asset Value per Share
1,672,235.700 58.00
Class ICH Number of Shares OutstandingNet Asset Value per Share
N/AN/A
Class ICHEUR
Number of Shares OutstandingNet Asset Value per Share
N/AN/A
Class ICHGBP
Number of Shares OutstandingNet Asset Value per Share
N/AN/A
Class ID Number of Shares OutstandingNet Asset Value per Share
143,461.750 57.90
Class IDH Number of Shares OutstandingNet Asset Value per Share
N/AN/A
Class J1C Number of Shares OutstandingNet Asset Value per Share
7,442,952.605 12.24
Class L1C Number of Shares OutstandingNet Asset Value per Share
N/AN/A
Class L1D Number of Shares OutstandingNet Asset Value per Share
N/AN/A
Class LCH1CHF
Number of Shares OutstandingNet Asset Value per Share
N/AN/A
Class LCH1EUR
Number of Shares OutstandingNet Asset Value per Share
N/AN/A
Class LCH1GBP
Number of Shares OutstandingNet Asset Value per Share
N/AN/A
Class LCH1JPY
Number of Shares OutstandingNet Asset Value per Share
N/AN/A
Class LCH1SEK
Number of Shares OutstandingNet Asset Value per Share
N/AN/A
Class LCH1USD
Number of Shares OutstandingNet Asset Value per Share
N/AN/A
Class LDH1EUR
Number of Shares OutstandingNet Asset Value per Share
N/AN/A
Class LDH1GBP
Number of Shares OutstandingNet Asset Value per Share
N/AN/A
Class LDH1USD
Number of Shares OutstandingNet Asset Value per Share
N/AN/A
Class M1C Number of Shares OutstandingNet Asset Value per Share
N/AN/A
International andRegional Equity
Sub-Funds
USD
Asia ex JapanEquity
350,072.421 38.88
N/AN/A
1,354,706.345 37.02
N/AN/A
N/AN/A
N/AN/A
143,049.085 38.14
N/AN/A
98,867.380 39.51
N/AN/A
N/AN/A
N/AN/A
N/AN/A
N/AN/A
N/AN/A
N/AN/A
N/AN/A
N/AN/A
N/AN/A
N/AN/A
N/AN/A
N/AN/A
N/AN/A
N/AN/A
N/AN/A
N/AN/A
N/AN/A
USD
Asia ex JapanEquity Smaller
Companies
1,934,430.622 20.03
N/AN/A
4,864,074.363 17.10
N/AN/A
N/AN/A
N/AN/A
34,666.235 19.70
N/AN/A
737,314.462 17.95
N/AN/A
N/AN/A
N/AN/A
N/AN/A
N/AN/A
N/AN/A
N/AN/A
N/AN/A
N/AN/A
N/AN/A
N/AN/A
N/AN/A
N/AN/A
N/AN/A
N/AN/A
N/AN/A
N/AN/A
N/AN/A
USD
Asia Pacific exJapan Equity
High Dividend
5,793,397.773 27.71
N/AN/A
82,183.826 27.82
N/AN/A
N/AN/A
N/AN/A
164,455.248 27.11
N/AN/A
6,060,218.192 28.02
N/AN/A
N/AN/A
N/AN/A
N/AN/A
N/AN/A
17,228,736.043 21.00
4,000.000 27.86
N/AN/A
N/AN/A
N/AN/A
N/AN/A
N/AN/A
N/AN/A
N/AN/A
N/AN/A
N/AN/A
N/AN/A
1,566,247.794 29.35
USDBRIC Equity
Key Figures as at 31 March 2011
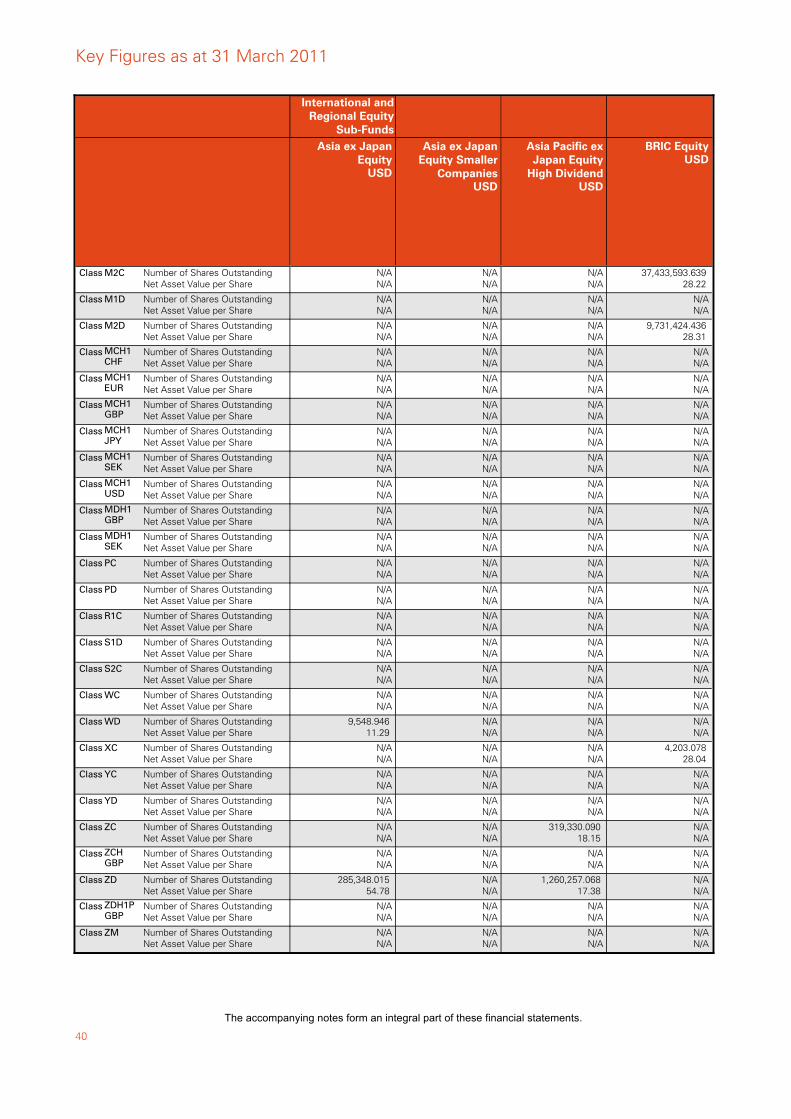
40
Class M2C Number of Shares OutstandingNet Asset Value per Share
N/AN/A
Class M1D Number of Shares OutstandingNet Asset Value per Share
N/AN/A
Class M2D Number of Shares OutstandingNet Asset Value per Share
N/AN/A
Class MCH1CHF
Number of Shares OutstandingNet Asset Value per Share
N/AN/A
Class MCH1EUR
Number of Shares OutstandingNet Asset Value per Share
N/AN/A
Class MCH1GBP
Number of Shares OutstandingNet Asset Value per Share
N/AN/A
Class MCH1JPY
Number of Shares OutstandingNet Asset Value per Share
N/AN/A
Class MCH1SEK
Number of Shares OutstandingNet Asset Value per Share
N/AN/A
Class MCH1USD
Number of Shares OutstandingNet Asset Value per Share
N/AN/A
Class MDH1GBP
Number of Shares OutstandingNet Asset Value per Share
N/AN/A
Class MDH1SEK
Number of Shares OutstandingNet Asset Value per Share
N/AN/A
Class PC Number of Shares OutstandingNet Asset Value per Share
N/AN/A
Class PD Number of Shares OutstandingNet Asset Value per Share
N/AN/A
Class R1C Number of Shares OutstandingNet Asset Value per Share
N/AN/A
Class S1D Number of Shares OutstandingNet Asset Value per Share
N/AN/A
Class S2C Number of Shares OutstandingNet Asset Value per Share
N/AN/A
Class WC Number of Shares OutstandingNet Asset Value per Share
N/AN/A
Class WD Number of Shares OutstandingNet Asset Value per Share
9,548.946 11.29
Class XC Number of Shares OutstandingNet Asset Value per Share
N/AN/A
Class YC Number of Shares OutstandingNet Asset Value per Share
N/AN/A
Class YD Number of Shares OutstandingNet Asset Value per Share
N/AN/A
Class ZC Number of Shares OutstandingNet Asset Value per Share
N/AN/A
Class ZCHGBP
Number of Shares OutstandingNet Asset Value per Share
N/AN/A
Class ZD Number of Shares OutstandingNet Asset Value per Share
285,348.015 54.78
Class ZDH1PGBP
Number of Shares OutstandingNet Asset Value per Share
N/AN/A
Class ZM Number of Shares OutstandingNet Asset Value per Share
N/AN/A
International andRegional Equity
Sub-Funds
USD
Asia ex JapanEquity
N/AN/A
N/AN/A
N/AN/A
N/AN/A
N/AN/A
N/AN/A
N/AN/A
N/AN/A
N/AN/A
N/AN/A
N/AN/A
N/AN/A
N/AN/A
N/AN/A
N/AN/A
N/AN/A
N/AN/A
N/AN/A
N/AN/A
N/AN/A
N/AN/A
N/AN/A
N/AN/A
N/AN/A
N/AN/A
N/AN/A
USD
Asia ex JapanEquity Smaller
Companies
N/AN/A
N/AN/A
N/AN/A
N/AN/A
N/AN/A
N/AN/A
N/AN/A
N/AN/A
N/AN/A
N/AN/A
N/AN/A
N/AN/A
N/AN/A
N/AN/A
N/AN/A
N/AN/A
N/AN/A
N/AN/A
N/AN/A
N/AN/A
N/AN/A
319,330.090 18.15
N/AN/A
1,260,257.068 17.38
N/AN/A
N/AN/A
USD
Asia Pacific exJapan Equity
High Dividend
37,433,593.639 28.22
N/AN/A
9,731,424.436 28.31
N/AN/A
N/AN/A
N/AN/A
N/AN/A
N/AN/A
N/AN/A
N/AN/A
N/AN/A
N/AN/A
N/AN/A
N/AN/A
N/AN/A
N/AN/A
N/AN/A
N/AN/A
4,203.078 28.04
N/AN/A
N/AN/A
N/AN/A
N/AN/A
N/AN/A
N/AN/A
N/AN/A
USDBRIC Equity
Key Figures as at 31 March 2011
The accompanying notes form an integral part of these financial statements.
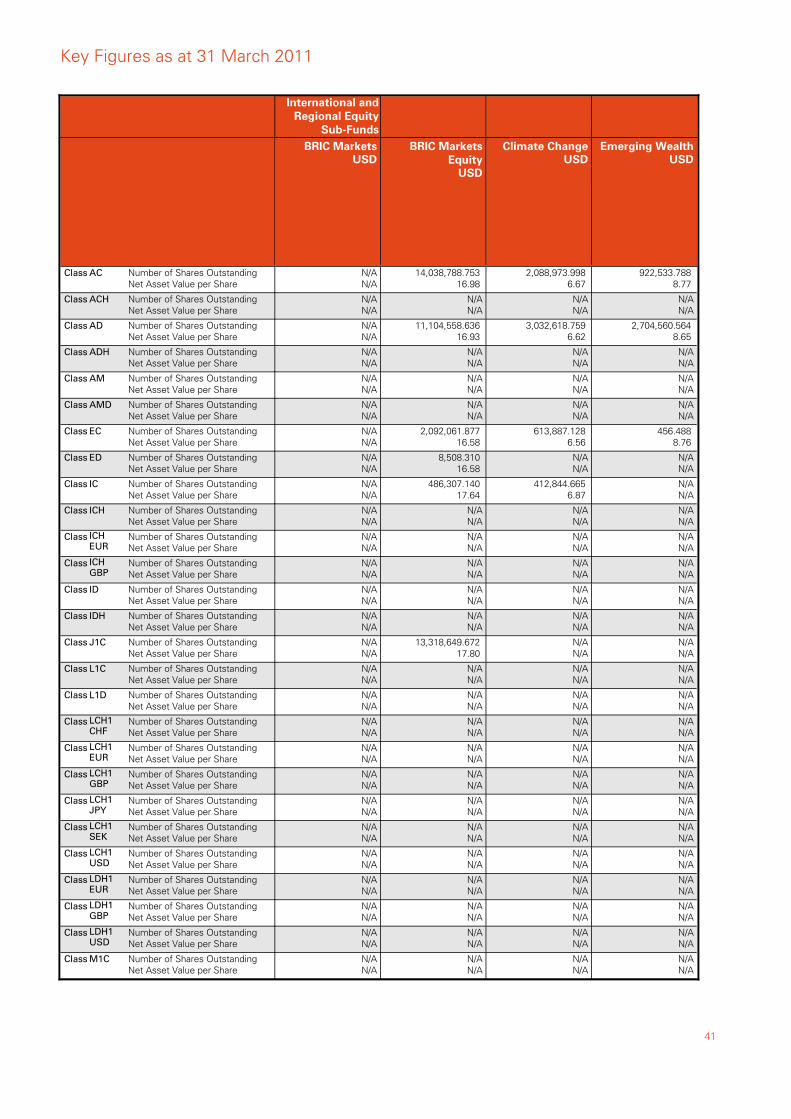
41
Class AC Number of Shares OutstandingNet Asset Value per Share
N/AN/A
Class ACH Number of Shares OutstandingNet Asset Value per Share
N/AN/A
Class AD Number of Shares OutstandingNet Asset Value per Share
N/AN/A
Class ADH Number of Shares OutstandingNet Asset Value per Share
N/AN/A
Class AM Number of Shares OutstandingNet Asset Value per Share
N/AN/A
Class AMD Number of Shares OutstandingNet Asset Value per Share
N/AN/A
Class EC Number of Shares OutstandingNet Asset Value per Share
N/AN/A
Class ED Number of Shares OutstandingNet Asset Value per Share
N/AN/A
Class IC Number of Shares OutstandingNet Asset Value per Share
N/AN/A
Class ICH Number of Shares OutstandingNet Asset Value per Share
N/AN/A
Class ICHEUR
Number of Shares OutstandingNet Asset Value per Share
N/AN/A
Class ICHGBP
Number of Shares OutstandingNet Asset Value per Share
N/AN/A
Class ID Number of Shares OutstandingNet Asset Value per Share
N/AN/A
Class IDH Number of Shares OutstandingNet Asset Value per Share
N/AN/A
Class J1C Number of Shares OutstandingNet Asset Value per Share
N/AN/A
Class L1C Number of Shares OutstandingNet Asset Value per Share
N/AN/A
Class L1D Number of Shares OutstandingNet Asset Value per Share
N/AN/A
Class LCH1CHF
Number of Shares OutstandingNet Asset Value per Share
N/AN/A
Class LCH1EUR
Number of Shares OutstandingNet Asset Value per Share
N/AN/A
Class LCH1GBP
Number of Shares OutstandingNet Asset Value per Share
N/AN/A
Class LCH1JPY
Number of Shares OutstandingNet Asset Value per Share
N/AN/A
Class LCH1SEK
Number of Shares OutstandingNet Asset Value per Share
N/AN/A
Class LCH1USD
Number of Shares OutstandingNet Asset Value per Share
N/AN/A
Class LDH1EUR
Number of Shares OutstandingNet Asset Value per Share
N/AN/A
Class LDH1GBP
Number of Shares OutstandingNet Asset Value per Share
N/AN/A
Class LDH1USD
Number of Shares OutstandingNet Asset Value per Share
N/AN/A
Class M1C Number of Shares OutstandingNet Asset Value per Share
N/AN/A
International andRegional Equity
Sub-Funds
USDBRIC Markets
14,038,788.753 16.98
N/AN/A
11,104,558.636 16.93
N/AN/A
N/AN/A
N/AN/A
2,092,061.877 16.58
8,508.310 16.58
486,307.140 17.64
N/AN/A
N/AN/A
N/AN/A
N/AN/A
N/AN/A
13,318,649.672 17.80
N/AN/A
N/AN/A
N/AN/A
N/AN/A
N/AN/A
N/AN/A
N/AN/A
N/AN/A
N/AN/A
N/AN/A
N/AN/A
N/AN/A
USD
BRIC MarketsEquity
2,088,973.998 6.67
N/AN/A
3,032,618.759 6.62
N/AN/A
N/AN/A
N/AN/A
613,887.128 6.56
N/AN/A
412,844.665 6.87
N/AN/A
N/AN/A
N/AN/A
N/AN/A
N/AN/A
N/AN/A
N/AN/A
N/AN/A
N/AN/A
N/AN/A
N/AN/A
N/AN/A
N/AN/A
N/AN/A
N/AN/A
N/AN/A
N/AN/A
N/AN/A
USDClimate Change
922,533.788 8.77
N/AN/A
2,704,560.564 8.65
N/AN/A
N/AN/A
N/AN/A
456.488 8.76
N/AN/A
N/AN/A
N/AN/A
N/AN/A
N/AN/A
N/AN/A
N/AN/A
N/AN/A
N/AN/A
N/AN/A
N/AN/A
N/AN/A
N/AN/A
N/AN/A
N/AN/A
N/AN/A
N/AN/A
N/AN/A
N/AN/A
N/AN/A
USDEmerging Wealth
Key Figures as at 31 March 2011
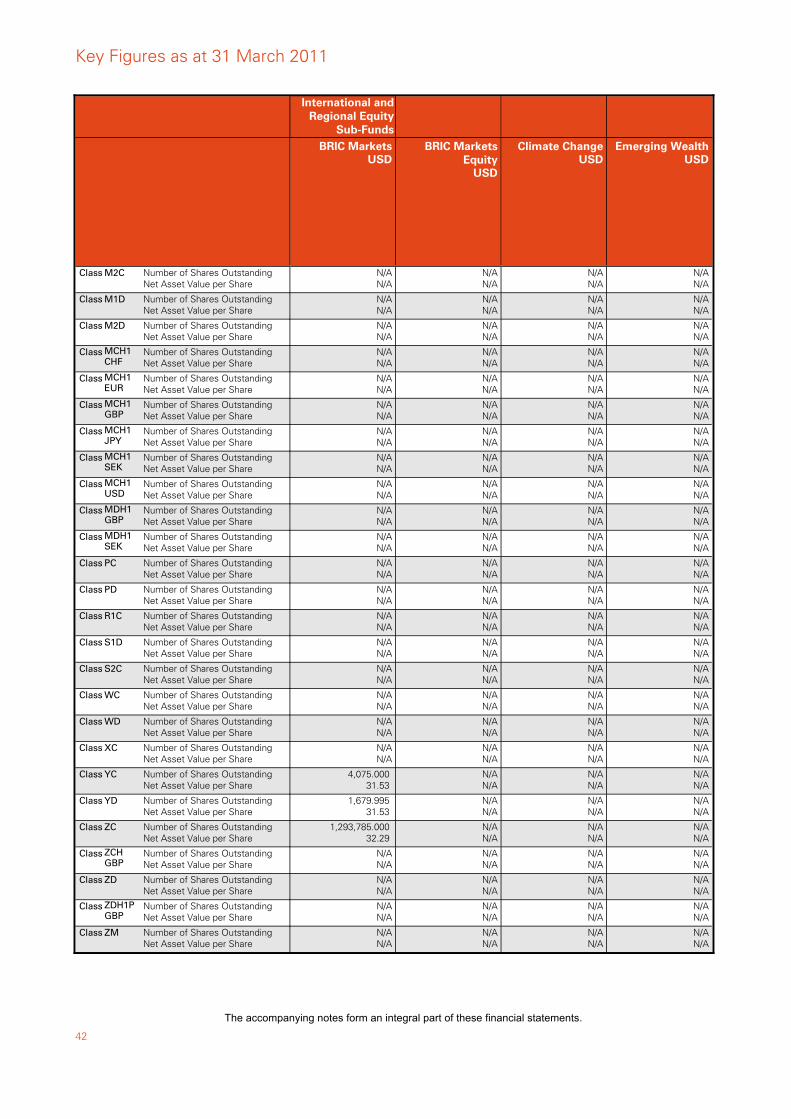
42
Class M2C Number of Shares OutstandingNet Asset Value per Share
N/AN/A
Class M1D Number of Shares OutstandingNet Asset Value per Share
N/AN/A
Class M2D Number of Shares OutstandingNet Asset Value per Share
N/AN/A
Class MCH1CHF
Number of Shares OutstandingNet Asset Value per Share
N/AN/A
Class MCH1EUR
Number of Shares OutstandingNet Asset Value per Share
N/AN/A
Class MCH1GBP
Number of Shares OutstandingNet Asset Value per Share
N/AN/A
Class MCH1JPY
Number of Shares OutstandingNet Asset Value per Share
N/AN/A
Class MCH1SEK
Number of Shares OutstandingNet Asset Value per Share
N/AN/A
Class MCH1USD
Number of Shares OutstandingNet Asset Value per Share
N/AN/A
Class MDH1GBP
Number of Shares OutstandingNet Asset Value per Share
N/AN/A
Class MDH1SEK
Number of Shares OutstandingNet Asset Value per Share
N/AN/A
Class PC Number of Shares OutstandingNet Asset Value per Share
N/AN/A
Class PD Number of Shares OutstandingNet Asset Value per Share
N/AN/A
Class R1C Number of Shares OutstandingNet Asset Value per Share
N/AN/A
Class S1D Number of Shares OutstandingNet Asset Value per Share
N/AN/A
Class S2C Number of Shares OutstandingNet Asset Value per Share
N/AN/A
Class WC Number of Shares OutstandingNet Asset Value per Share
N/AN/A
Class WD Number of Shares OutstandingNet Asset Value per Share
N/AN/A
Class XC Number of Shares OutstandingNet Asset Value per Share
N/AN/A
Class YC Number of Shares OutstandingNet Asset Value per Share
4,075.000 31.53
Class YD Number of Shares OutstandingNet Asset Value per Share
1,679.995 31.53
Class ZC Number of Shares OutstandingNet Asset Value per Share
1,293,785.000 32.29
Class ZCHGBP
Number of Shares OutstandingNet Asset Value per Share
N/AN/A
Class ZD Number of Shares OutstandingNet Asset Value per Share
N/AN/A
Class ZDH1PGBP
Number of Shares OutstandingNet Asset Value per Share
N/AN/A
Class ZM Number of Shares OutstandingNet Asset Value per Share
N/AN/A
International andRegional Equity
Sub-Funds
USDBRIC Markets
N/AN/A
N/AN/A
N/AN/A
N/AN/A
N/AN/A
N/AN/A
N/AN/A
N/AN/A
N/AN/A
N/AN/A
N/AN/A
N/AN/A
N/AN/A
N/AN/A
N/AN/A
N/AN/A
N/AN/A
N/AN/A
N/AN/A
N/AN/A
N/AN/A
N/AN/A
N/AN/A
N/AN/A
N/AN/A
N/AN/A
USD
BRIC MarketsEquity
N/AN/A
N/AN/A
N/AN/A
N/AN/A
N/AN/A
N/AN/A
N/AN/A
N/AN/A
N/AN/A
N/AN/A
N/AN/A
N/AN/A
N/AN/A
N/AN/A
N/AN/A
N/AN/A
N/AN/A
N/AN/A
N/AN/A
N/AN/A
N/AN/A
N/AN/A
N/AN/A
N/AN/A
N/AN/A
N/AN/A
USDClimate Change
N/AN/A
N/AN/A
N/AN/A
N/AN/A
N/AN/A
N/AN/A
N/AN/A
N/AN/A
N/AN/A
N/AN/A
N/AN/A
N/AN/A
N/AN/A
N/AN/A
N/AN/A
N/AN/A
N/AN/A
N/AN/A
N/AN/A
N/AN/A
N/AN/A
N/AN/A
N/AN/A
N/AN/A
N/AN/A
N/AN/A
USDEmerging Wealth
Key Figures as at 31 March 2011
The accompanying notes form an integral part of these financial statements.
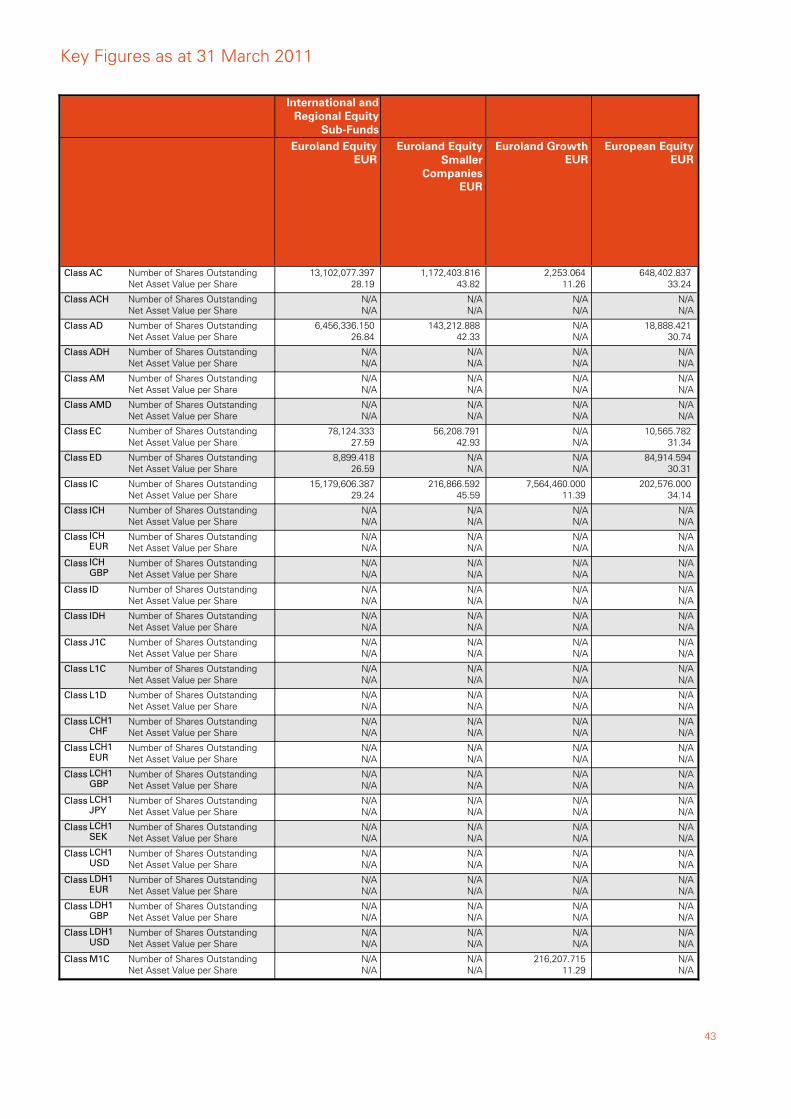
43
Class AC Number of Shares OutstandingNet Asset Value per Share
13,102,077.397 28.19
Class ACH Number of Shares OutstandingNet Asset Value per Share
N/AN/A
Class AD Number of Shares OutstandingNet Asset Value per Share
6,456,336.150 26.84
Class ADH Number of Shares OutstandingNet Asset Value per Share
N/AN/A
Class AM Number of Shares OutstandingNet Asset Value per Share
N/AN/A
Class AMD Number of Shares OutstandingNet Asset Value per Share
N/AN/A
Class EC Number of Shares OutstandingNet Asset Value per Share
78,124.333 27.59
Class ED Number of Shares OutstandingNet Asset Value per Share
8,899.418 26.59
Class IC Number of Shares OutstandingNet Asset Value per Share
15,179,606.387 29.24
Class ICH Number of Shares OutstandingNet Asset Value per Share
N/AN/A
Class ICHEUR
Number of Shares OutstandingNet Asset Value per Share
N/AN/A
Class ICHGBP
Number of Shares OutstandingNet Asset Value per Share
N/AN/A
Class ID Number of Shares OutstandingNet Asset Value per Share
N/AN/A
Class IDH Number of Shares OutstandingNet Asset Value per Share
N/AN/A
Class J1C Number of Shares OutstandingNet Asset Value per Share
N/AN/A
Class L1C Number of Shares OutstandingNet Asset Value per Share
N/AN/A
Class L1D Number of Shares OutstandingNet Asset Value per Share
N/AN/A
Class LCH1CHF
Number of Shares OutstandingNet Asset Value per Share
N/AN/A
Class LCH1EUR
Number of Shares OutstandingNet Asset Value per Share
N/AN/A
Class LCH1GBP
Number of Shares OutstandingNet Asset Value per Share
N/AN/A
Class LCH1JPY
Number of Shares OutstandingNet Asset Value per Share
N/AN/A
Class LCH1SEK
Number of Shares OutstandingNet Asset Value per Share
N/AN/A
Class LCH1USD
Number of Shares OutstandingNet Asset Value per Share
N/AN/A
Class LDH1EUR
Number of Shares OutstandingNet Asset Value per Share
N/AN/A
Class LDH1GBP
Number of Shares OutstandingNet Asset Value per Share
N/AN/A
Class LDH1USD
Number of Shares OutstandingNet Asset Value per Share
N/AN/A
Class M1C Number of Shares OutstandingNet Asset Value per Share
N/AN/A
International andRegional Equity
Sub-Funds
EUREuroland Equity
1,172,403.816 43.82
N/AN/A
143,212.888 42.33
N/AN/A
N/AN/A
N/AN/A
56,208.791 42.93
N/AN/A
216,866.592 45.59
N/AN/A
N/AN/A
N/AN/A
N/AN/A
N/AN/A
N/AN/A
N/AN/A
N/AN/A
N/AN/A
N/AN/A
N/AN/A
N/AN/A
N/AN/A
N/AN/A
N/AN/A
N/AN/A
N/AN/A
N/AN/A
EUR
Euroland EquitySmaller
Companies
2,253.064 11.26
N/AN/A
N/AN/A
N/AN/A
N/AN/A
N/AN/A
N/AN/A
N/AN/A
7,564,460.000 11.39
N/AN/A
N/AN/A
N/AN/A
N/AN/A
N/AN/A
N/AN/A
N/AN/A
N/AN/A
N/AN/A
N/AN/A
N/AN/A
N/AN/A
N/AN/A
N/AN/A
N/AN/A
N/AN/A
N/AN/A
216,207.715 11.29
EUREuroland Growth
648,402.837 33.24
N/AN/A
18,888.421 30.74
N/AN/A
N/AN/A
N/AN/A
10,565.782 31.34
84,914.594 30.31
202,576.000 34.14
N/AN/A
N/AN/A
N/AN/A
N/AN/A
N/AN/A
N/AN/A
N/AN/A
N/AN/A
N/AN/A
N/AN/A
N/AN/A
N/AN/A
N/AN/A
N/AN/A
N/AN/A
N/AN/A
N/AN/A
N/AN/A
EUREuropean Equity
Key Figures as at 31 March 2011

44
Class M2C Number of Shares OutstandingNet Asset Value per Share
N/AN/A
Class M1D Number of Shares OutstandingNet Asset Value per Share
N/AN/A
Class M2D Number of Shares OutstandingNet Asset Value per Share
N/AN/A
Class MCH1CHF
Number of Shares OutstandingNet Asset Value per Share
N/AN/A
Class MCH1EUR
Number of Shares OutstandingNet Asset Value per Share
N/AN/A
Class MCH1GBP
Number of Shares OutstandingNet Asset Value per Share
N/AN/A
Class MCH1JPY
Number of Shares OutstandingNet Asset Value per Share
N/AN/A
Class MCH1SEK
Number of Shares OutstandingNet Asset Value per Share
N/AN/A
Class MCH1USD
Number of Shares OutstandingNet Asset Value per Share
N/AN/A
Class MDH1GBP
Number of Shares OutstandingNet Asset Value per Share
N/AN/A
Class MDH1SEK
Number of Shares OutstandingNet Asset Value per Share
N/AN/A
Class PC Number of Shares OutstandingNet Asset Value per Share
N/AN/A
Class PD Number of Shares OutstandingNet Asset Value per Share
N/AN/A
Class R1C Number of Shares OutstandingNet Asset Value per Share
N/AN/A
Class S1D Number of Shares OutstandingNet Asset Value per Share
N/AN/A
Class S2C Number of Shares OutstandingNet Asset Value per Share
N/AN/A
Class WC Number of Shares OutstandingNet Asset Value per Share
N/AN/A
Class WD Number of Shares OutstandingNet Asset Value per Share
N/AN/A
Class XC Number of Shares OutstandingNet Asset Value per Share
N/AN/A
Class YC Number of Shares OutstandingNet Asset Value per Share
N/AN/A
Class YD Number of Shares OutstandingNet Asset Value per Share
N/AN/A
Class ZC Number of Shares OutstandingNet Asset Value per Share
90,702.668 32.07
Class ZCHGBP
Number of Shares OutstandingNet Asset Value per Share
N/AN/A
Class ZD Number of Shares OutstandingNet Asset Value per Share
699,671.054 29.61
Class ZDH1PGBP
Number of Shares OutstandingNet Asset Value per Share
N/AN/A
Class ZM Number of Shares OutstandingNet Asset Value per Share
N/AN/A
International andRegional Equity
Sub-Funds
EUREuroland Equity
N/AN/A
N/AN/A
N/AN/A
N/AN/A
N/AN/A
N/AN/A
N/AN/A
N/AN/A
N/AN/A
N/AN/A
N/AN/A
N/AN/A
N/AN/A
N/AN/A
N/AN/A
N/AN/A
N/AN/A
N/AN/A
N/AN/A
N/AN/A
N/AN/A
46,183.718 49.72
N/AN/A
N/AN/A
N/AN/A
N/AN/A
EUR
Euroland EquitySmaller
Companies
N/AN/A
175,124.968 10.69
N/AN/A
N/AN/A
N/AN/A
N/AN/A
N/AN/A
N/AN/A
N/AN/A
N/AN/A
N/AN/A
N/AN/A
N/AN/A
N/AN/A
N/AN/A
N/AN/A
N/AN/A
N/AN/A
N/AN/A
N/AN/A
N/AN/A
N/AN/A
N/AN/A
N/AN/A
N/AN/A
N/AN/A
EUREuroland Growth
N/AN/A
N/AN/A
N/AN/A
N/AN/A
N/AN/A
N/AN/A
N/AN/A
N/AN/A
N/AN/A
N/AN/A
N/AN/A
5,159.000 34.61
2,689,613.759 30.40
N/AN/A
N/AN/A
N/AN/A
N/AN/A
27,027.027 18.55
N/AN/A
N/AN/A
N/AN/A
N/AN/A
N/AN/A
198,239.430 31.24
N/AN/A
N/AN/A
EUREuropean Equity
Key Figures as at 31 March 2011
The accompanying notes form an integral part of these financial statements.
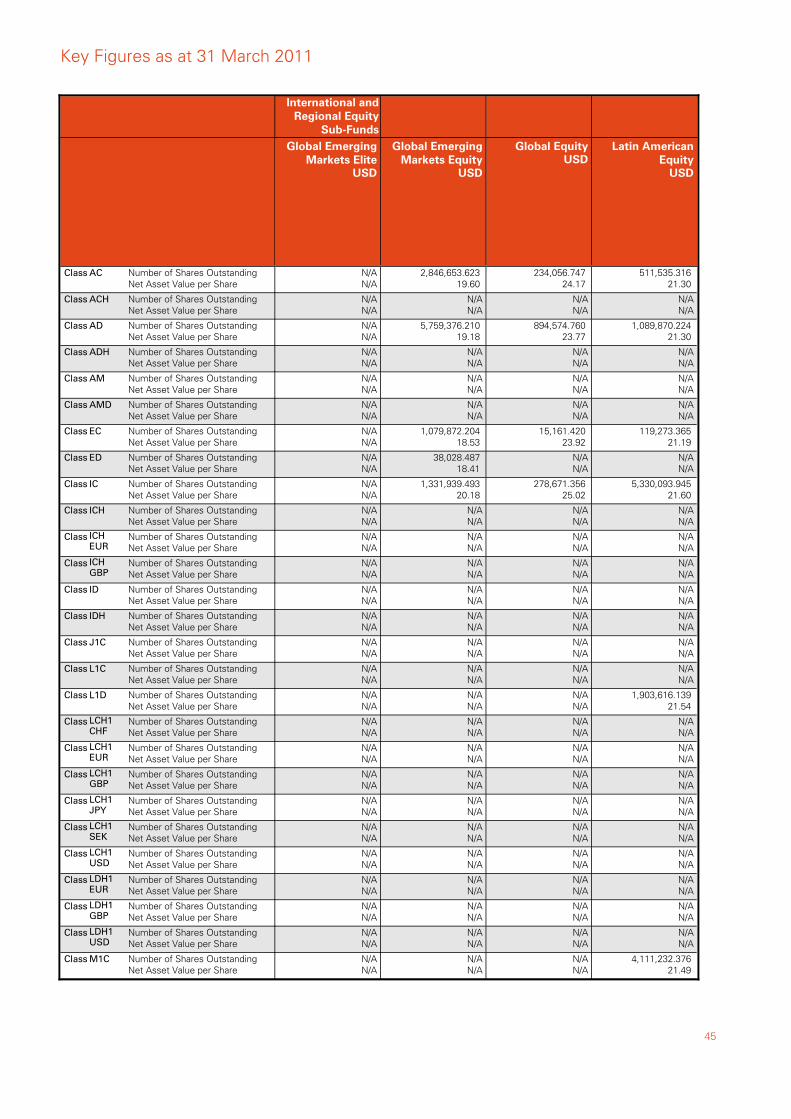
45
Class AC Number of Shares OutstandingNet Asset Value per Share
N/AN/A
Class ACH Number of Shares OutstandingNet Asset Value per Share
N/AN/A
Class AD Number of Shares OutstandingNet Asset Value per Share
N/AN/A
Class ADH Number of Shares OutstandingNet Asset Value per Share
N/AN/A
Class AM Number of Shares OutstandingNet Asset Value per Share
N/AN/A
Class AMD Number of Shares OutstandingNet Asset Value per Share
N/AN/A
Class EC Number of Shares OutstandingNet Asset Value per Share
N/AN/A
Class ED Number of Shares OutstandingNet Asset Value per Share
N/AN/A
Class IC Number of Shares OutstandingNet Asset Value per Share
N/AN/A
Class ICH Number of Shares OutstandingNet Asset Value per Share
N/AN/A
Class ICHEUR
Number of Shares OutstandingNet Asset Value per Share
N/AN/A
Class ICHGBP
Number of Shares OutstandingNet Asset Value per Share
N/AN/A
Class ID Number of Shares OutstandingNet Asset Value per Share
N/AN/A
Class IDH Number of Shares OutstandingNet Asset Value per Share
N/AN/A
Class J1C Number of Shares OutstandingNet Asset Value per Share
N/AN/A
Class L1C Number of Shares OutstandingNet Asset Value per Share
N/AN/A
Class L1D Number of Shares OutstandingNet Asset Value per Share
N/AN/A
Class LCH1CHF
Number of Shares OutstandingNet Asset Value per Share
N/AN/A
Class LCH1EUR
Number of Shares OutstandingNet Asset Value per Share
N/AN/A
Class LCH1GBP
Number of Shares OutstandingNet Asset Value per Share
N/AN/A
Class LCH1JPY
Number of Shares OutstandingNet Asset Value per Share
N/AN/A
Class LCH1SEK
Number of Shares OutstandingNet Asset Value per Share
N/AN/A
Class LCH1USD
Number of Shares OutstandingNet Asset Value per Share
N/AN/A
Class LDH1EUR
Number of Shares OutstandingNet Asset Value per Share
N/AN/A
Class LDH1GBP
Number of Shares OutstandingNet Asset Value per Share
N/AN/A
Class LDH1USD
Number of Shares OutstandingNet Asset Value per Share
N/AN/A
Class M1C Number of Shares OutstandingNet Asset Value per Share
N/AN/A
International andRegional Equity
Sub-Funds
USD
Global EmergingMarkets Elite
2,846,653.623 19.60
N/AN/A
5,759,376.210 19.18
N/AN/A
N/AN/A
N/AN/A
1,079,872.204 18.53
38,028.487 18.41
1,331,939.493 20.18
N/AN/A
N/AN/A
N/AN/A
N/AN/A
N/AN/A
N/AN/A
N/AN/A
N/AN/A
N/AN/A
N/AN/A
N/AN/A
N/AN/A
N/AN/A
N/AN/A
N/AN/A
N/AN/A
N/AN/A
N/AN/A
USD
Global EmergingMarkets Equity
234,056.747 24.17
N/AN/A
894,574.760 23.77
N/AN/A
N/AN/A
N/AN/A
15,161.420 23.92
N/AN/A
278,671.356 25.02
N/AN/A
N/AN/A
N/AN/A
N/AN/A
N/AN/A
N/AN/A
N/AN/A
N/AN/A
N/AN/A
N/AN/A
N/AN/A
N/AN/A
N/AN/A
N/AN/A
N/AN/A
N/AN/A
N/AN/A
N/AN/A
USDGlobal Equity
511,535.316 21.30
N/AN/A
1,089,870.224 21.30
N/AN/A
N/AN/A
N/AN/A
119,273.365 21.19
N/AN/A
5,330,093.945 21.60
N/AN/A
N/AN/A
N/AN/A
N/AN/A
N/AN/A
N/AN/A
N/AN/A
1,903,616.139 21.54
N/AN/A
N/AN/A
N/AN/A
N/AN/A
N/AN/A
N/AN/A
N/AN/A
N/AN/A
N/AN/A
4,111,232.376 21.49
USD
Latin AmericanEquity
Key Figures as at 31 March 2011
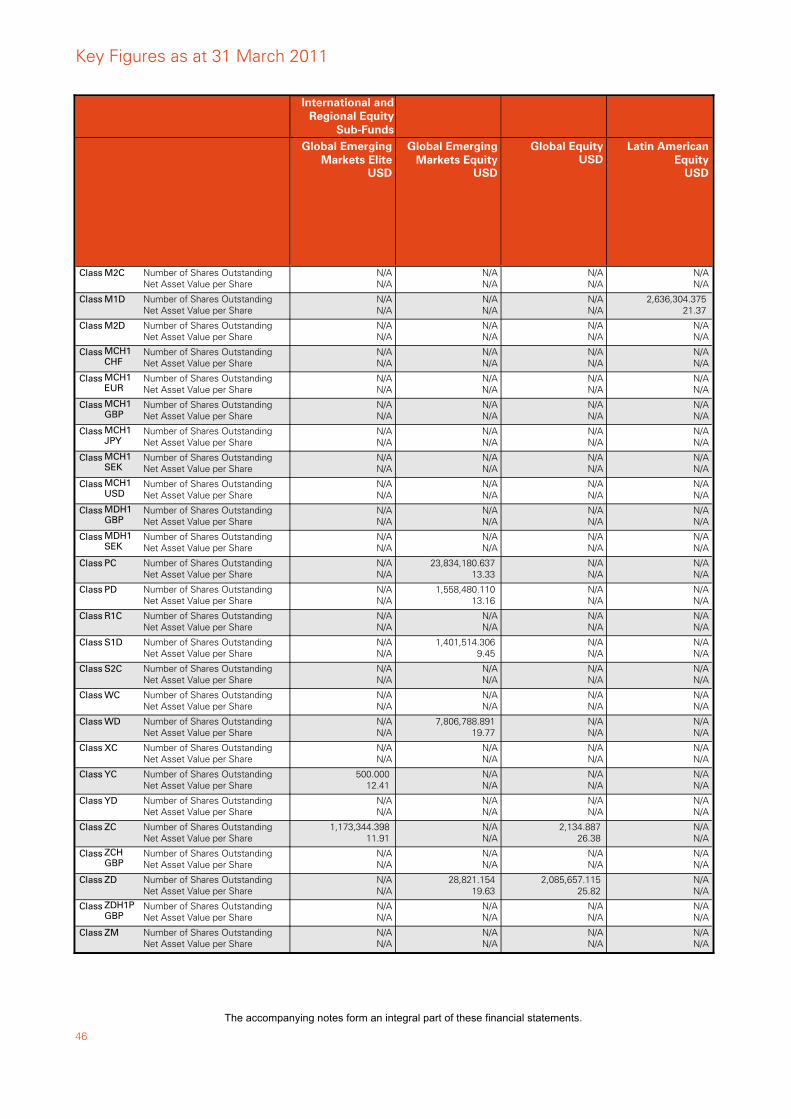
46
Class M2C Number of Shares OutstandingNet Asset Value per Share
N/AN/A
Class M1D Number of Shares OutstandingNet Asset Value per Share
N/AN/A
Class M2D Number of Shares OutstandingNet Asset Value per Share
N/AN/A
Class MCH1CHF
Number of Shares OutstandingNet Asset Value per Share
N/AN/A
Class MCH1EUR
Number of Shares OutstandingNet Asset Value per Share
N/AN/A
Class MCH1GBP
Number of Shares OutstandingNet Asset Value per Share
N/AN/A
Class MCH1JPY
Number of Shares OutstandingNet Asset Value per Share
N/AN/A
Class MCH1SEK
Number of Shares OutstandingNet Asset Value per Share
N/AN/A
Class MCH1USD
Number of Shares OutstandingNet Asset Value per Share
N/AN/A
Class MDH1GBP
Number of Shares OutstandingNet Asset Value per Share
N/AN/A
Class MDH1SEK
Number of Shares OutstandingNet Asset Value per Share
N/AN/A
Class PC Number of Shares OutstandingNet Asset Value per Share
N/AN/A
Class PD Number of Shares OutstandingNet Asset Value per Share
N/AN/A
Class R1C Number of Shares OutstandingNet Asset Value per Share
N/AN/A
Class S1D Number of Shares OutstandingNet Asset Value per Share
N/AN/A
Class S2C Number of Shares OutstandingNet Asset Value per Share
N/AN/A
Class WC Number of Shares OutstandingNet Asset Value per Share
N/AN/A
Class WD Number of Shares OutstandingNet Asset Value per Share
N/AN/A
Class XC Number of Shares OutstandingNet Asset Value per Share
N/AN/A
Class YC Number of Shares OutstandingNet Asset Value per Share
500.000 12.41
Class YD Number of Shares OutstandingNet Asset Value per Share
N/AN/A
Class ZC Number of Shares OutstandingNet Asset Value per Share
1,173,344.398 11.91
Class ZCHGBP
Number of Shares OutstandingNet Asset Value per Share
N/AN/A
Class ZD Number of Shares OutstandingNet Asset Value per Share
N/AN/A
Class ZDH1PGBP
Number of Shares OutstandingNet Asset Value per Share
N/AN/A
Class ZM Number of Shares OutstandingNet Asset Value per Share
N/AN/A
International andRegional Equity
Sub-Funds
USD
Global EmergingMarkets Elite
N/AN/A
N/AN/A
N/AN/A
N/AN/A
N/AN/A
N/AN/A
N/AN/A
N/AN/A
N/AN/A
N/AN/A
N/AN/A
23,834,180.637 13.33
1,558,480.110 13.16
N/AN/A
1,401,514.306 9.45
N/AN/A
N/AN/A
7,806,788.891 19.77
N/AN/A
N/AN/A
N/AN/A
N/AN/A
N/AN/A
28,821.154 19.63
N/AN/A
N/AN/A
USD
Global EmergingMarkets Equity
N/AN/A
N/AN/A
N/AN/A
N/AN/A
N/AN/A
N/AN/A
N/AN/A
N/AN/A
N/AN/A
N/AN/A
N/AN/A
N/AN/A
N/AN/A
N/AN/A
N/AN/A
N/AN/A
N/AN/A
N/AN/A
N/AN/A
N/AN/A
N/AN/A
2,134.887 26.38
N/AN/A
2,085,657.115 25.82
N/AN/A
N/AN/A
USDGlobal Equity
N/AN/A
2,636,304.375 21.37
N/AN/A
N/AN/A
N/AN/A
N/AN/A
N/AN/A
N/AN/A
N/AN/A
N/AN/A
N/AN/A
N/AN/A
N/AN/A
N/AN/A
N/AN/A
N/AN/A
N/AN/A
N/AN/A
N/AN/A
N/AN/A
N/AN/A
N/AN/A
N/AN/A
N/AN/A
N/AN/A
N/AN/A
USD
Latin AmericanEquity
Key Figures as at 31 March 2011
The accompanying notes form an integral part of these financial statements.
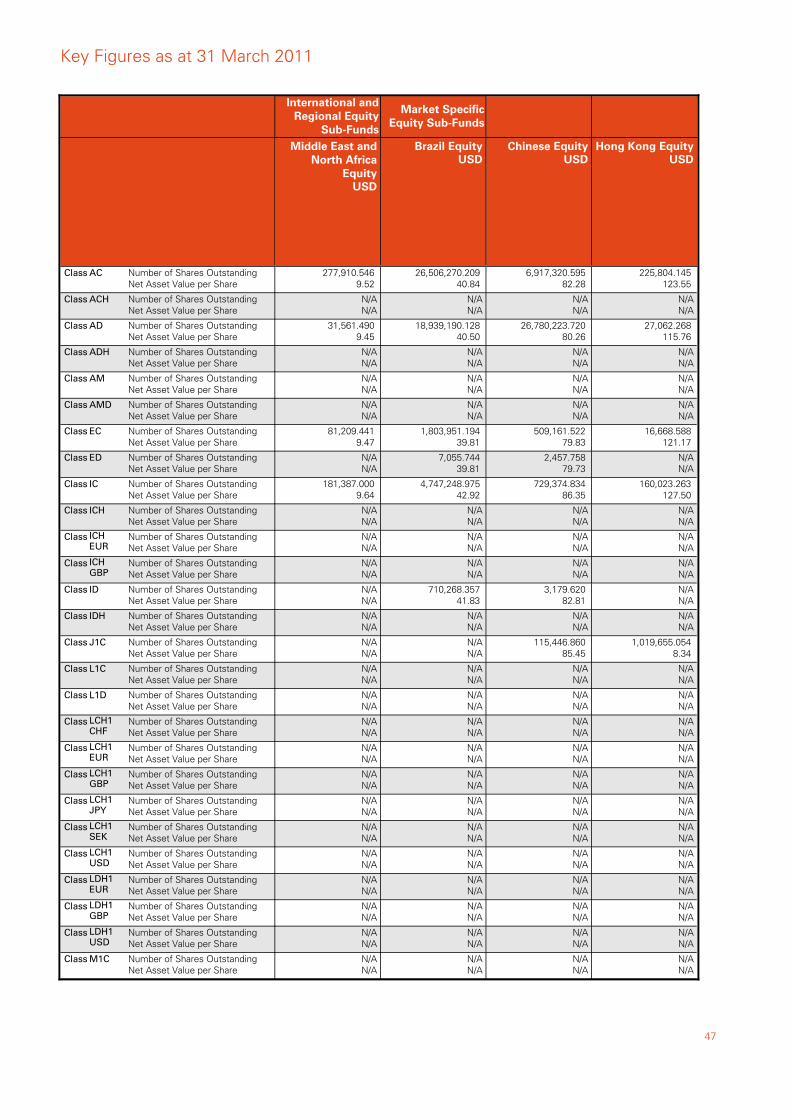
47
Class AC Number of Shares OutstandingNet Asset Value per Share
277,910.546 9.52
Class ACH Number of Shares OutstandingNet Asset Value per Share
N/AN/A
Class AD Number of Shares OutstandingNet Asset Value per Share
31,561.490 9.45
Class ADH Number of Shares OutstandingNet Asset Value per Share
N/AN/A
Class AM Number of Shares OutstandingNet Asset Value per Share
N/AN/A
Class AMD Number of Shares OutstandingNet Asset Value per Share
N/AN/A
Class EC Number of Shares OutstandingNet Asset Value per Share
81,209.441 9.47
Class ED Number of Shares OutstandingNet Asset Value per Share
N/AN/A
Class IC Number of Shares OutstandingNet Asset Value per Share
181,387.000 9.64
Class ICH Number of Shares OutstandingNet Asset Value per Share
N/AN/A
Class ICHEUR
Number of Shares OutstandingNet Asset Value per Share
N/AN/A
Class ICHGBP
Number of Shares OutstandingNet Asset Value per Share
N/AN/A
Class ID Number of Shares OutstandingNet Asset Value per Share
N/AN/A
Class IDH Number of Shares OutstandingNet Asset Value per Share
N/AN/A
Class J1C Number of Shares OutstandingNet Asset Value per Share
N/AN/A
Class L1C Number of Shares OutstandingNet Asset Value per Share
N/AN/A
Class L1D Number of Shares OutstandingNet Asset Value per Share
N/AN/A
Class LCH1CHF
Number of Shares OutstandingNet Asset Value per Share
N/AN/A
Class LCH1EUR
Number of Shares OutstandingNet Asset Value per Share
N/AN/A
Class LCH1GBP
Number of Shares OutstandingNet Asset Value per Share
N/AN/A
Class LCH1JPY
Number of Shares OutstandingNet Asset Value per Share
N/AN/A
Class LCH1SEK
Number of Shares OutstandingNet Asset Value per Share
N/AN/A
Class LCH1USD
Number of Shares OutstandingNet Asset Value per Share
N/AN/A
Class LDH1EUR
Number of Shares OutstandingNet Asset Value per Share
N/AN/A
Class LDH1GBP
Number of Shares OutstandingNet Asset Value per Share
N/AN/A
Class LDH1USD
Number of Shares OutstandingNet Asset Value per Share
N/AN/A
Class M1C Number of Shares OutstandingNet Asset Value per Share
N/AN/A
International andRegional Equity
Sub-Funds
USD
Middle East andNorth Africa
Equity
26,506,270.209 40.84
N/AN/A
18,939,190.128 40.50
N/AN/A
N/AN/A
N/AN/A
1,803,951.194 39.81
7,055.744 39.81
4,747,248.975 42.92
N/AN/A
N/AN/A
N/AN/A
710,268.357 41.83
N/AN/A
N/AN/A
N/AN/A
N/AN/A
N/AN/A
N/AN/A
N/AN/A
N/AN/A
N/AN/A
N/AN/A
N/AN/A
N/AN/A
N/AN/A
N/AN/A
Market SpecificEquity Sub-Funds
USDBrazil Equity
6,917,320.595 82.28
N/AN/A
26,780,223.720 80.26
N/AN/A
N/AN/A
N/AN/A
509,161.522 79.83
2,457.758 79.73
729,374.834 86.35
N/AN/A
N/AN/A
N/AN/A
3,179.620 82.81
N/AN/A
115,446.860 85.45
N/AN/A
N/AN/A
N/AN/A
N/AN/A
N/AN/A
N/AN/A
N/AN/A
N/AN/A
N/AN/A
N/AN/A
N/AN/A
N/AN/A
USDChinese Equity
225,804.145 123.55
N/AN/A
27,062.268 115.76
N/AN/A
N/AN/A
N/AN/A
16,668.588 121.17
N/AN/A
160,023.263 127.50
N/AN/A
N/AN/A
N/AN/A
N/AN/A
N/AN/A
1,019,655.054 8.34
N/AN/A
N/AN/A
N/AN/A
N/AN/A
N/AN/A
N/AN/A
N/AN/A
N/AN/A
N/AN/A
N/AN/A
N/AN/A
N/AN/A
USDHong Kong Equity
Key Figures as at 31 March 2011
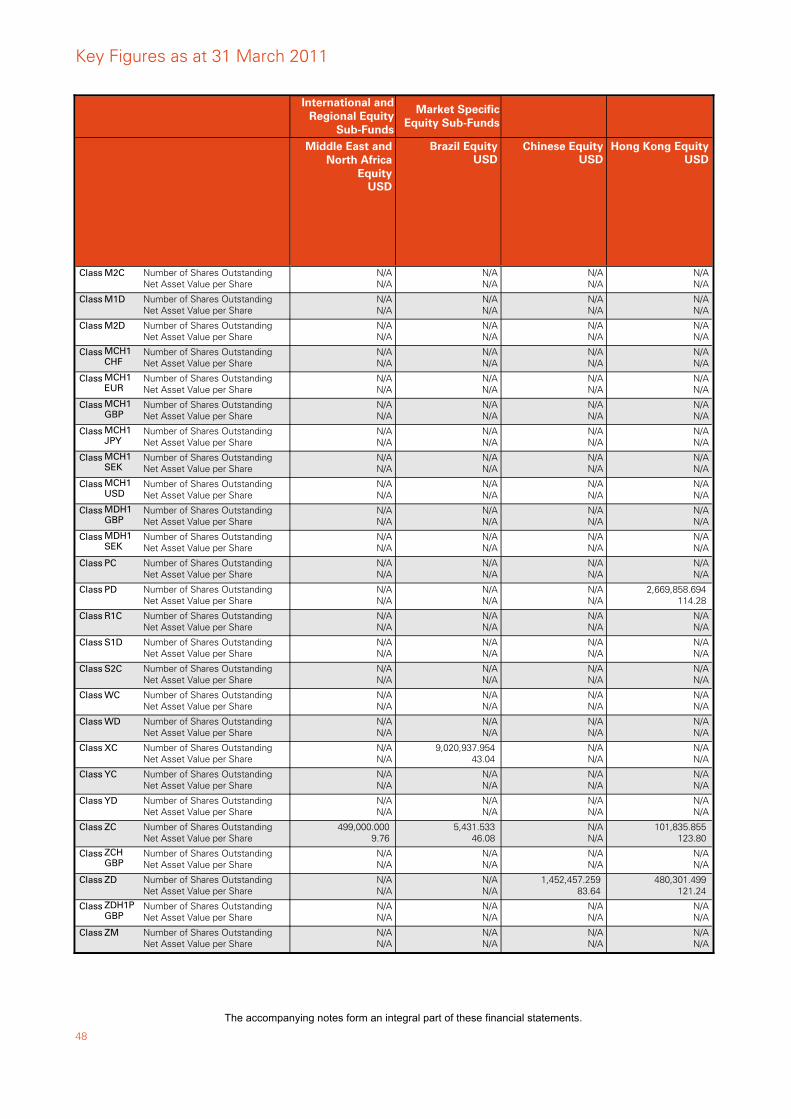
48
Class M2C Number of Shares OutstandingNet Asset Value per Share
N/AN/A
Class M1D Number of Shares OutstandingNet Asset Value per Share
N/AN/A
Class M2D Number of Shares OutstandingNet Asset Value per Share
N/AN/A
Class MCH1CHF
Number of Shares OutstandingNet Asset Value per Share
N/AN/A
Class MCH1EUR
Number of Shares OutstandingNet Asset Value per Share
N/AN/A
Class MCH1GBP
Number of Shares OutstandingNet Asset Value per Share
N/AN/A
Class MCH1JPY
Number of Shares OutstandingNet Asset Value per Share
N/AN/A
Class MCH1SEK
Number of Shares OutstandingNet Asset Value per Share
N/AN/A
Class MCH1USD
Number of Shares OutstandingNet Asset Value per Share
N/AN/A
Class MDH1GBP
Number of Shares OutstandingNet Asset Value per Share
N/AN/A
Class MDH1SEK
Number of Shares OutstandingNet Asset Value per Share
N/AN/A
Class PC Number of Shares OutstandingNet Asset Value per Share
N/AN/A
Class PD Number of Shares OutstandingNet Asset Value per Share
N/AN/A
Class R1C Number of Shares OutstandingNet Asset Value per Share
N/AN/A
Class S1D Number of Shares OutstandingNet Asset Value per Share
N/AN/A
Class S2C Number of Shares OutstandingNet Asset Value per Share
N/AN/A
Class WC Number of Shares OutstandingNet Asset Value per Share
N/AN/A
Class WD Number of Shares OutstandingNet Asset Value per Share
N/AN/A
Class XC Number of Shares OutstandingNet Asset Value per Share
N/AN/A
Class YC Number of Shares OutstandingNet Asset Value per Share
N/AN/A
Class YD Number of Shares OutstandingNet Asset Value per Share
N/AN/A
Class ZC Number of Shares OutstandingNet Asset Value per Share
499,000.000 9.76
Class ZCHGBP
Number of Shares OutstandingNet Asset Value per Share
N/AN/A
Class ZD Number of Shares OutstandingNet Asset Value per Share
N/AN/A
Class ZDH1PGBP
Number of Shares OutstandingNet Asset Value per Share
N/AN/A
Class ZM Number of Shares OutstandingNet Asset Value per Share
N/AN/A
International andRegional Equity
Sub-Funds
USD
Middle East andNorth Africa
Equity
N/AN/A
N/AN/A
N/AN/A
N/AN/A
N/AN/A
N/AN/A
N/AN/A
N/AN/A
N/AN/A
N/AN/A
N/AN/A
N/AN/A
N/AN/A
N/AN/A
N/AN/A
N/AN/A
N/AN/A
N/AN/A
9,020,937.954 43.04
N/AN/A
N/AN/A
5,431.533 46.08
N/AN/A
N/AN/A
N/AN/A
N/AN/A
Market SpecificEquity Sub-Funds
USDBrazil Equity
N/AN/A
N/AN/A
N/AN/A
N/AN/A
N/AN/A
N/AN/A
N/AN/A
N/AN/A
N/AN/A
N/AN/A
N/AN/A
N/AN/A
N/AN/A
N/AN/A
N/AN/A
N/AN/A
N/AN/A
N/AN/A
N/AN/A
N/AN/A
N/AN/A
N/AN/A
N/AN/A
1,452,457.259 83.64
N/AN/A
N/AN/A
USDChinese Equity
N/AN/A
N/AN/A
N/AN/A
N/AN/A
N/AN/A
N/AN/A
N/AN/A
N/AN/A
N/AN/A
N/AN/A
N/AN/A
N/AN/A
2,669,858.694 114.28
N/AN/A
N/AN/A
N/AN/A
N/AN/A
N/AN/A
N/AN/A
N/AN/A
N/AN/A
101,835.855 123.80
N/AN/A
480,301.499 121.24
N/AN/A
N/AN/A
USDHong Kong Equity
Key Figures as at 31 March 2011
The accompanying notes form an integral part of these financial statements.
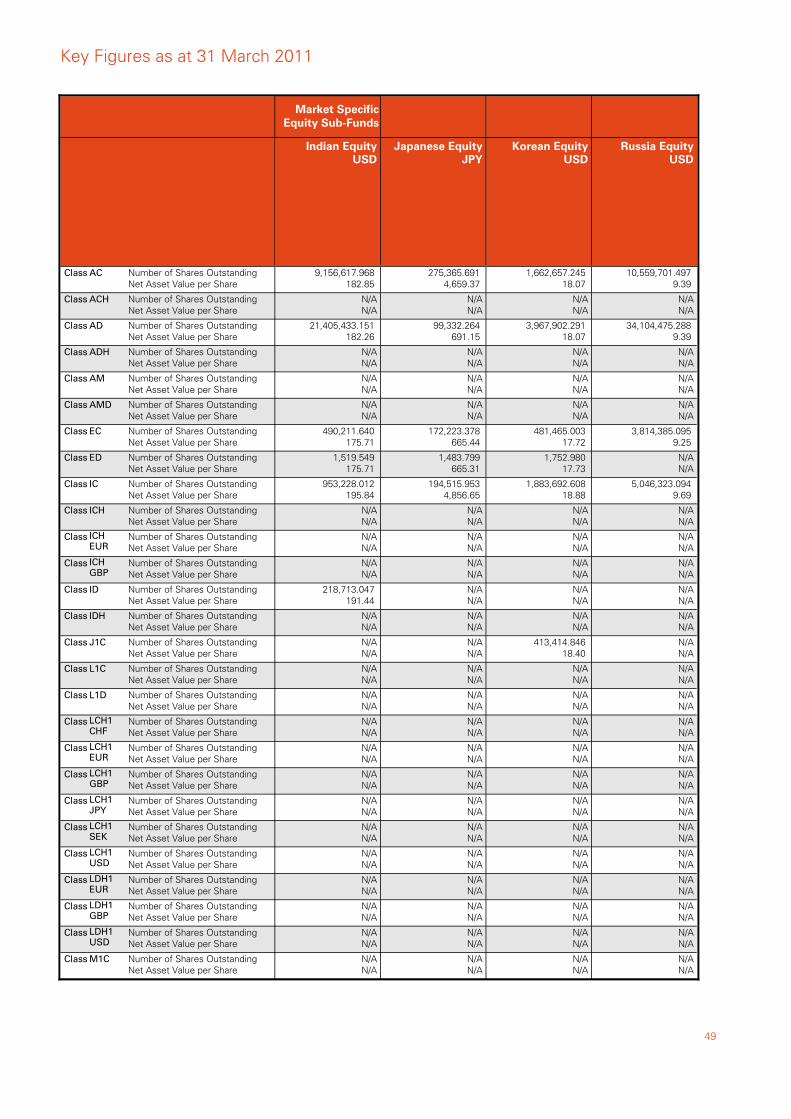
49
Class AC Number of Shares OutstandingNet Asset Value per Share
9,156,617.968 182.85
Class ACH Number of Shares OutstandingNet Asset Value per Share
N/AN/A
Class AD Number of Shares OutstandingNet Asset Value per Share
21,405,433.151 182.26
Class ADH Number of Shares OutstandingNet Asset Value per Share
N/AN/A
Class AM Number of Shares OutstandingNet Asset Value per Share
N/AN/A
Class AMD Number of Shares OutstandingNet Asset Value per Share
N/AN/A
Class EC Number of Shares OutstandingNet Asset Value per Share
490,211.640 175.71
Class ED Number of Shares OutstandingNet Asset Value per Share
1,519.549 175.71
Class IC Number of Shares OutstandingNet Asset Value per Share
953,228.012 195.84
Class ICH Number of Shares OutstandingNet Asset Value per Share
N/AN/A
Class ICHEUR
Number of Shares OutstandingNet Asset Value per Share
N/AN/A
Class ICHGBP
Number of Shares OutstandingNet Asset Value per Share
N/AN/A
Class ID Number of Shares OutstandingNet Asset Value per Share
218,713.047 191.44
Class IDH Number of Shares OutstandingNet Asset Value per Share
N/AN/A
Class J1C Number of Shares OutstandingNet Asset Value per Share
N/AN/A
Class L1C Number of Shares OutstandingNet Asset Value per Share
N/AN/A
Class L1D Number of Shares OutstandingNet Asset Value per Share
N/AN/A
Class LCH1CHF
Number of Shares OutstandingNet Asset Value per Share
N/AN/A
Class LCH1EUR
Number of Shares OutstandingNet Asset Value per Share
N/AN/A
Class LCH1GBP
Number of Shares OutstandingNet Asset Value per Share
N/AN/A
Class LCH1JPY
Number of Shares OutstandingNet Asset Value per Share
N/AN/A
Class LCH1SEK
Number of Shares OutstandingNet Asset Value per Share
N/AN/A
Class LCH1USD
Number of Shares OutstandingNet Asset Value per Share
N/AN/A
Class LDH1EUR
Number of Shares OutstandingNet Asset Value per Share
N/AN/A
Class LDH1GBP
Number of Shares OutstandingNet Asset Value per Share
N/AN/A
Class LDH1USD
Number of Shares OutstandingNet Asset Value per Share
N/AN/A
Class M1C Number of Shares OutstandingNet Asset Value per Share
N/AN/A
Market SpecificEquity Sub-Funds
USDIndian Equity
275,365.691 4,659.37
N/AN/A
99,332.264 691.15
N/AN/A
N/AN/A
N/AN/A
172,223.378 665.44
1,483.799 665.31
194,515.953 4,856.65
N/AN/A
N/AN/A
N/AN/A
N/AN/A
N/AN/A
N/AN/A
N/AN/A
N/AN/A
N/AN/A
N/AN/A
N/AN/A
N/AN/A
N/AN/A
N/AN/A
N/AN/A
N/AN/A
N/AN/A
N/AN/A
JPYJapanese Equity
1,662,657.245 18.07
N/AN/A
3,967,902.291 18.07
N/AN/A
N/AN/A
N/AN/A
481,465.003 17.72
1,752.980 17.73
1,883,692.608 18.88
N/AN/A
N/AN/A
N/AN/A
N/AN/A
N/AN/A
413,414.846 18.40
N/AN/A
N/AN/A
N/AN/A
N/AN/A
N/AN/A
N/AN/A
N/AN/A
N/AN/A
N/AN/A
N/AN/A
N/AN/A
N/AN/A
USDKorean Equity
10,559,701.497 9.39
N/AN/A
34,104,475.288 9.39
N/AN/A
N/AN/A
N/AN/A
3,814,385.095 9.25
N/AN/A
5,046,323.094 9.69
N/AN/A
N/AN/A
N/AN/A
N/AN/A
N/AN/A
N/AN/A
N/AN/A
N/AN/A
N/AN/A
N/AN/A
N/AN/A
N/AN/A
N/AN/A
N/AN/A
N/AN/A
N/AN/A
N/AN/A
N/AN/A
USDRussia Equity
Key Figures as at 31 March 2011
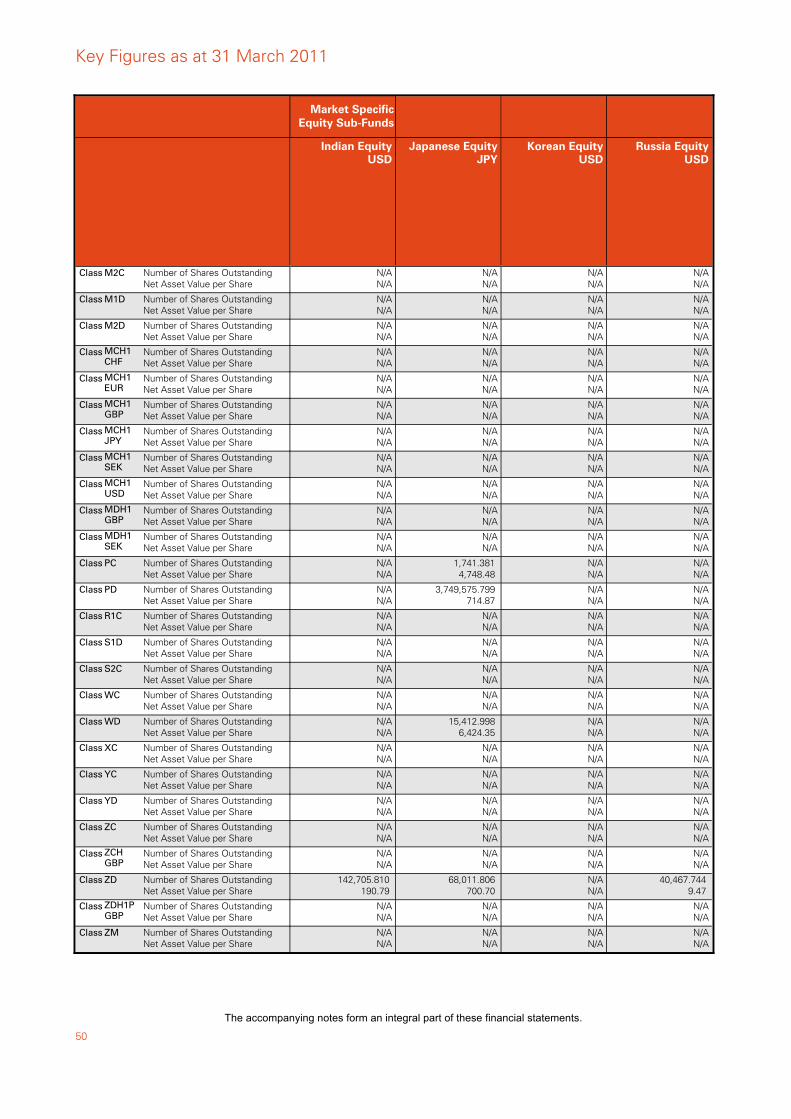
50
Class M2C Number of Shares OutstandingNet Asset Value per Share
N/AN/A
Class M1D Number of Shares OutstandingNet Asset Value per Share
N/AN/A
Class M2D Number of Shares OutstandingNet Asset Value per Share
N/AN/A
Class MCH1CHF
Number of Shares OutstandingNet Asset Value per Share
N/AN/A
Class MCH1EUR
Number of Shares OutstandingNet Asset Value per Share
N/AN/A
Class MCH1GBP
Number of Shares OutstandingNet Asset Value per Share
N/AN/A
Class MCH1JPY
Number of Shares OutstandingNet Asset Value per Share
N/AN/A
Class MCH1SEK
Number of Shares OutstandingNet Asset Value per Share
N/AN/A
Class MCH1USD
Number of Shares OutstandingNet Asset Value per Share
N/AN/A
Class MDH1GBP
Number of Shares OutstandingNet Asset Value per Share
N/AN/A
Class MDH1SEK
Number of Shares OutstandingNet Asset Value per Share
N/AN/A
Class PC Number of Shares OutstandingNet Asset Value per Share
N/AN/A
Class PD Number of Shares OutstandingNet Asset Value per Share
N/AN/A
Class R1C Number of Shares OutstandingNet Asset Value per Share
N/AN/A
Class S1D Number of Shares OutstandingNet Asset Value per Share
N/AN/A
Class S2C Number of Shares OutstandingNet Asset Value per Share
N/AN/A
Class WC Number of Shares OutstandingNet Asset Value per Share
N/AN/A
Class WD Number of Shares OutstandingNet Asset Value per Share
N/AN/A
Class XC Number of Shares OutstandingNet Asset Value per Share
N/AN/A
Class YC Number of Shares OutstandingNet Asset Value per Share
N/AN/A
Class YD Number of Shares OutstandingNet Asset Value per Share
N/AN/A
Class ZC Number of Shares OutstandingNet Asset Value per Share
N/AN/A
Class ZCHGBP
Number of Shares OutstandingNet Asset Value per Share
N/AN/A
Class ZD Number of Shares OutstandingNet Asset Value per Share
142,705.810 190.79
Class ZDH1PGBP
Number of Shares OutstandingNet Asset Value per Share
N/AN/A
Class ZM Number of Shares OutstandingNet Asset Value per Share
N/AN/A
Market SpecificEquity Sub-Funds
USDIndian Equity
N/AN/A
N/AN/A
N/AN/A
N/AN/A
N/AN/A
N/AN/A
N/AN/A
N/AN/A
N/AN/A
N/AN/A
N/AN/A
1,741.381 4,748.48
3,749,575.799 714.87
N/AN/A
N/AN/A
N/AN/A
N/AN/A
15,412.998 6,424.35
N/AN/A
N/AN/A
N/AN/A
N/AN/A
N/AN/A
68,011.806 700.70
N/AN/A
N/AN/A
JPYJapanese Equity
N/AN/A
N/AN/A
N/AN/A
N/AN/A
N/AN/A
N/AN/A
N/AN/A
N/AN/A
N/AN/A
N/AN/A
N/AN/A
N/AN/A
N/AN/A
N/AN/A
N/AN/A
N/AN/A
N/AN/A
N/AN/A
N/AN/A
N/AN/A
N/AN/A
N/AN/A
N/AN/A
N/AN/A
N/AN/A
N/AN/A
USDKorean Equity
N/AN/A
N/AN/A
N/AN/A
N/AN/A
N/AN/A
N/AN/A
N/AN/A
N/AN/A
N/AN/A
N/AN/A
N/AN/A
N/AN/A
N/AN/A
N/AN/A
N/AN/A
N/AN/A
N/AN/A
N/AN/A
N/AN/A
N/AN/A
N/AN/A
N/AN/A
N/AN/A
40,467.744 9.47
N/AN/A
N/AN/A
USDRussia Equity
Key Figures as at 31 March 2011
The accompanying notes form an integral part of these financial statements.
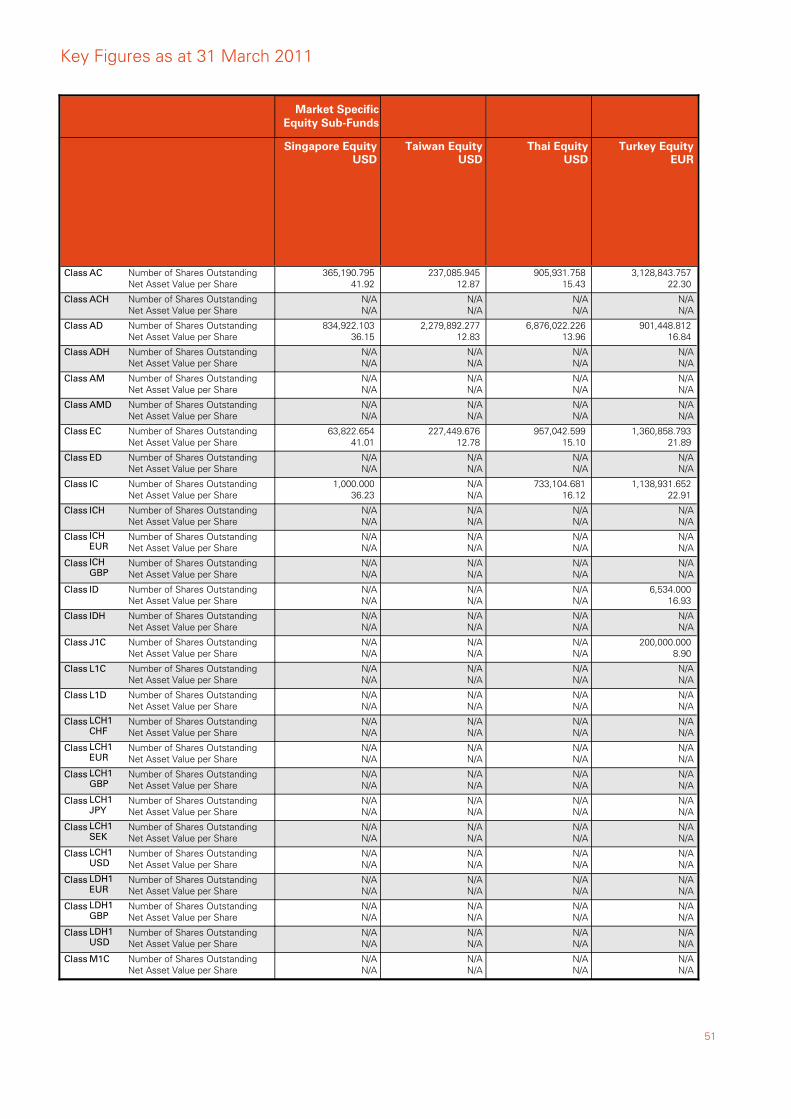
51
Class AC Number of Shares OutstandingNet Asset Value per Share
365,190.795 41.92
Class ACH Number of Shares OutstandingNet Asset Value per Share
N/AN/A
Class AD Number of Shares OutstandingNet Asset Value per Share
834,922.103 36.15
Class ADH Number of Shares OutstandingNet Asset Value per Share
N/AN/A
Class AM Number of Shares OutstandingNet Asset Value per Share
N/AN/A
Class AMD Number of Shares OutstandingNet Asset Value per Share
N/AN/A
Class EC Number of Shares OutstandingNet Asset Value per Share
63,822.654 41.01
Class ED Number of Shares OutstandingNet Asset Value per Share
N/AN/A
Class IC Number of Shares OutstandingNet Asset Value per Share
1,000.000 36.23
Class ICH Number of Shares OutstandingNet Asset Value per Share
N/AN/A
Class ICHEUR
Number of Shares OutstandingNet Asset Value per Share
N/AN/A
Class ICHGBP
Number of Shares OutstandingNet Asset Value per Share
N/AN/A
Class ID Number of Shares OutstandingNet Asset Value per Share
N/AN/A
Class IDH Number of Shares OutstandingNet Asset Value per Share
N/AN/A
Class J1C Number of Shares OutstandingNet Asset Value per Share
N/AN/A
Class L1C Number of Shares OutstandingNet Asset Value per Share
N/AN/A
Class L1D Number of Shares OutstandingNet Asset Value per Share
N/AN/A
Class LCH1CHF
Number of Shares OutstandingNet Asset Value per Share
N/AN/A
Class LCH1EUR
Number of Shares OutstandingNet Asset Value per Share
N/AN/A
Class LCH1GBP
Number of Shares OutstandingNet Asset Value per Share
N/AN/A
Class LCH1JPY
Number of Shares OutstandingNet Asset Value per Share
N/AN/A
Class LCH1SEK
Number of Shares OutstandingNet Asset Value per Share
N/AN/A
Class LCH1USD
Number of Shares OutstandingNet Asset Value per Share
N/AN/A
Class LDH1EUR
Number of Shares OutstandingNet Asset Value per Share
N/AN/A
Class LDH1GBP
Number of Shares OutstandingNet Asset Value per Share
N/AN/A
Class LDH1USD
Number of Shares OutstandingNet Asset Value per Share
N/AN/A
Class M1C Number of Shares OutstandingNet Asset Value per Share
N/AN/A
Market SpecificEquity Sub-Funds
USDSingapore Equity
237,085.945 12.87
N/AN/A
2,279,892.277 12.83
N/AN/A
N/AN/A
N/AN/A
227,449.676 12.78
N/AN/A
N/AN/A
N/AN/A
N/AN/A
N/AN/A
N/AN/A
N/AN/A
N/AN/A
N/AN/A
N/AN/A
N/AN/A
N/AN/A
N/AN/A
N/AN/A
N/AN/A
N/AN/A
N/AN/A
N/AN/A
N/AN/A
N/AN/A
USDTaiwan Equity
905,931.758 15.43
N/AN/A
6,876,022.226 13.96
N/AN/A
N/AN/A
N/AN/A
957,042.599 15.10
N/AN/A
733,104.681 16.12
N/AN/A
N/AN/A
N/AN/A
N/AN/A
N/AN/A
N/AN/A
N/AN/A
N/AN/A
N/AN/A
N/AN/A
N/AN/A
N/AN/A
N/AN/A
N/AN/A
N/AN/A
N/AN/A
N/AN/A
N/AN/A
USDThai Equity
3,128,843.757 22.30
N/AN/A
901,448.812 16.84
N/AN/A
N/AN/A
N/AN/A
1,360,858.793 21.89
N/AN/A
1,138,931.652 22.91
N/AN/A
N/AN/A
N/AN/A
6,534.000 16.93
N/AN/A
200,000.000 8.90
N/AN/A
N/AN/A
N/AN/A
N/AN/A
N/AN/A
N/AN/A
N/AN/A
N/AN/A
N/AN/A
N/AN/A
N/AN/A
N/AN/A
EURTurkey Equity
Key Figures as at 31 March 2011
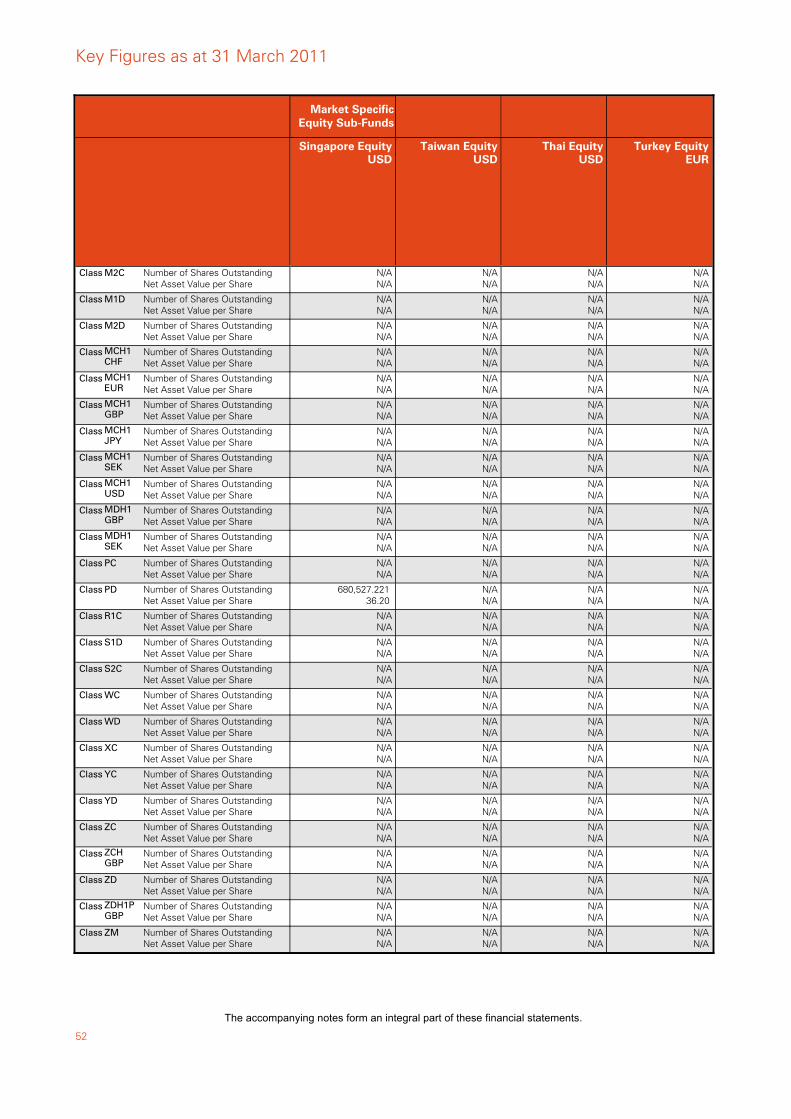
52
Class M2C Number of Shares OutstandingNet Asset Value per Share
N/AN/A
Class M1D Number of Shares OutstandingNet Asset Value per Share
N/AN/A
Class M2D Number of Shares OutstandingNet Asset Value per Share
N/AN/A
Class MCH1CHF
Number of Shares OutstandingNet Asset Value per Share
N/AN/A
Class MCH1EUR
Number of Shares OutstandingNet Asset Value per Share
N/AN/A
Class MCH1GBP
Number of Shares OutstandingNet Asset Value per Share
N/AN/A
Class MCH1JPY
Number of Shares OutstandingNet Asset Value per Share
N/AN/A
Class MCH1SEK
Number of Shares OutstandingNet Asset Value per Share
N/AN/A
Class MCH1USD
Number of Shares OutstandingNet Asset Value per Share
N/AN/A
Class MDH1GBP
Number of Shares OutstandingNet Asset Value per Share
N/AN/A
Class MDH1SEK
Number of Shares OutstandingNet Asset Value per Share
N/AN/A
Class PC Number of Shares OutstandingNet Asset Value per Share
N/AN/A
Class PD Number of Shares OutstandingNet Asset Value per Share
680,527.221 36.20
Class R1C Number of Shares OutstandingNet Asset Value per Share
N/AN/A
Class S1D Number of Shares OutstandingNet Asset Value per Share
N/AN/A
Class S2C Number of Shares OutstandingNet Asset Value per Share
N/AN/A
Class WC Number of Shares OutstandingNet Asset Value per Share
N/AN/A
Class WD Number of Shares OutstandingNet Asset Value per Share
N/AN/A
Class XC Number of Shares OutstandingNet Asset Value per Share
N/AN/A
Class YC Number of Shares OutstandingNet Asset Value per Share
N/AN/A
Class YD Number of Shares OutstandingNet Asset Value per Share
N/AN/A
Class ZC Number of Shares OutstandingNet Asset Value per Share
N/AN/A
Class ZCHGBP
Number of Shares OutstandingNet Asset Value per Share
N/AN/A
Class ZD Number of Shares OutstandingNet Asset Value per Share
N/AN/A
Class ZDH1PGBP
Number of Shares OutstandingNet Asset Value per Share
N/AN/A
Class ZM Number of Shares OutstandingNet Asset Value per Share
N/AN/A
Market SpecificEquity Sub-Funds
USDSingapore Equity
N/AN/A
N/AN/A
N/AN/A
N/AN/A
N/AN/A
N/AN/A
N/AN/A
N/AN/A
N/AN/A
N/AN/A
N/AN/A
N/AN/A
N/AN/A
N/AN/A
N/AN/A
N/AN/A
N/AN/A
N/AN/A
N/AN/A
N/AN/A
N/AN/A
N/AN/A
N/AN/A
N/AN/A
N/AN/A
N/AN/A
USDTaiwan Equity
N/AN/A
N/AN/A
N/AN/A
N/AN/A
N/AN/A
N/AN/A
N/AN/A
N/AN/A
N/AN/A
N/AN/A
N/AN/A
N/AN/A
N/AN/A
N/AN/A
N/AN/A
N/AN/A
N/AN/A
N/AN/A
N/AN/A
N/AN/A
N/AN/A
N/AN/A
N/AN/A
N/AN/A
N/AN/A
N/AN/A
USDThai Equity
N/AN/A
N/AN/A
N/AN/A
N/AN/A
N/AN/A
N/AN/A
N/AN/A
N/AN/A
N/AN/A
N/AN/A
N/AN/A
N/AN/A
N/AN/A
N/AN/A
N/AN/A
N/AN/A
N/AN/A
N/AN/A
N/AN/A
N/AN/A
N/AN/A
N/AN/A
N/AN/A
N/AN/A
N/AN/A
N/AN/A
EURTurkey Equity
Key Figures as at 31 March 2011
The accompanying notes form an integral part of these financial statements.

53
Class AC Number of Shares OutstandingNet Asset Value per Share
253,687.072 28.15
Class ACH Number of Shares OutstandingNet Asset Value per Share
N/AN/A
Class AD Number of Shares OutstandingNet Asset Value per Share
1,676,067.091 24.58
Class ADH Number of Shares OutstandingNet Asset Value per Share
N/AN/A
Class AM Number of Shares OutstandingNet Asset Value per Share
N/AN/A
Class AMD Number of Shares OutstandingNet Asset Value per Share
N/AN/A
Class EC Number of Shares OutstandingNet Asset Value per Share
3,285.861 27.86
Class ED Number of Shares OutstandingNet Asset Value per Share
N/AN/A
Class IC Number of Shares OutstandingNet Asset Value per Share
146.913 28.60
Class ICH Number of Shares OutstandingNet Asset Value per Share
N/AN/A
Class ICHEUR
Number of Shares OutstandingNet Asset Value per Share
N/AN/A
Class ICHGBP
Number of Shares OutstandingNet Asset Value per Share
N/AN/A
Class ID Number of Shares OutstandingNet Asset Value per Share
7,246.000 27.43
Class IDH Number of Shares OutstandingNet Asset Value per Share
N/AN/A
Class J1C Number of Shares OutstandingNet Asset Value per Share
N/AN/A
Class L1C Number of Shares OutstandingNet Asset Value per Share
N/AN/A
Class L1D Number of Shares OutstandingNet Asset Value per Share
N/AN/A
Class LCH1CHF
Number of Shares OutstandingNet Asset Value per Share
N/AN/A
Class LCH1EUR
Number of Shares OutstandingNet Asset Value per Share
N/AN/A
Class LCH1GBP
Number of Shares OutstandingNet Asset Value per Share
N/AN/A
Class LCH1JPY
Number of Shares OutstandingNet Asset Value per Share
N/AN/A
Class LCH1SEK
Number of Shares OutstandingNet Asset Value per Share
N/AN/A
Class LCH1USD
Number of Shares OutstandingNet Asset Value per Share
N/AN/A
Class LDH1EUR
Number of Shares OutstandingNet Asset Value per Share
N/AN/A
Class LDH1GBP
Number of Shares OutstandingNet Asset Value per Share
N/AN/A
Class LDH1USD
Number of Shares OutstandingNet Asset Value per Share
N/AN/A
Class M1C Number of Shares OutstandingNet Asset Value per Share
N/AN/A
Market SpecificEquity Sub-Funds
GBPUK Equity
831,222.383 21.53
2,008,041.707 26.22
322,979.261 24.10
24,924.843 27.15
N/AN/A
N/AN/A
183,271.591 21.09
866.292 23.42
1,683,848.888 22.04
N/AN/A
N/AN/A
N/AN/A
8,763.535 9.04
N/AN/A
N/AN/A
N/AN/A
N/AN/A
N/AN/A
N/AN/A
N/AN/A
N/AN/A
N/AN/A
N/AN/A
N/AN/A
N/AN/A
N/AN/A
N/AN/A
USDUS Equity
1,707,542.249 22.07
N/AN/A
261,493.615 15.40
N/AN/A
N/AN/A
N/AN/A
650,490.611 21.78
N/AN/A
39,869.269 22.47
N/AN/A
N/AN/A
N/AN/A
190,000.000 18.65
N/AN/A
N/AN/A
N/AN/A
N/AN/A
N/AN/A
N/AN/A
N/AN/A
N/AN/A
N/AN/A
N/AN/A
N/AN/A
N/AN/A
N/AN/A
N/AN/A
Bond Sub-Funds
USDBrazil Bond
338,495.561 20.14
N/AN/A
59,335.569 16.98
N/AN/A
N/AN/A
N/AN/A
43,415.804 19.89
N/AN/A
3,314,012.488 20.92
N/AN/A
N/AN/A
N/AN/A
N/AN/A
N/AN/A
N/AN/A
N/AN/A
N/AN/A
N/AN/A
N/AN/A
N/AN/A
N/AN/A
N/AN/A
N/AN/A
N/AN/A
N/AN/A
N/AN/A
N/AN/A
EUR
Euro Bond(Formerly Euro
Core Bond)
Key Figures as at 31 March 2011
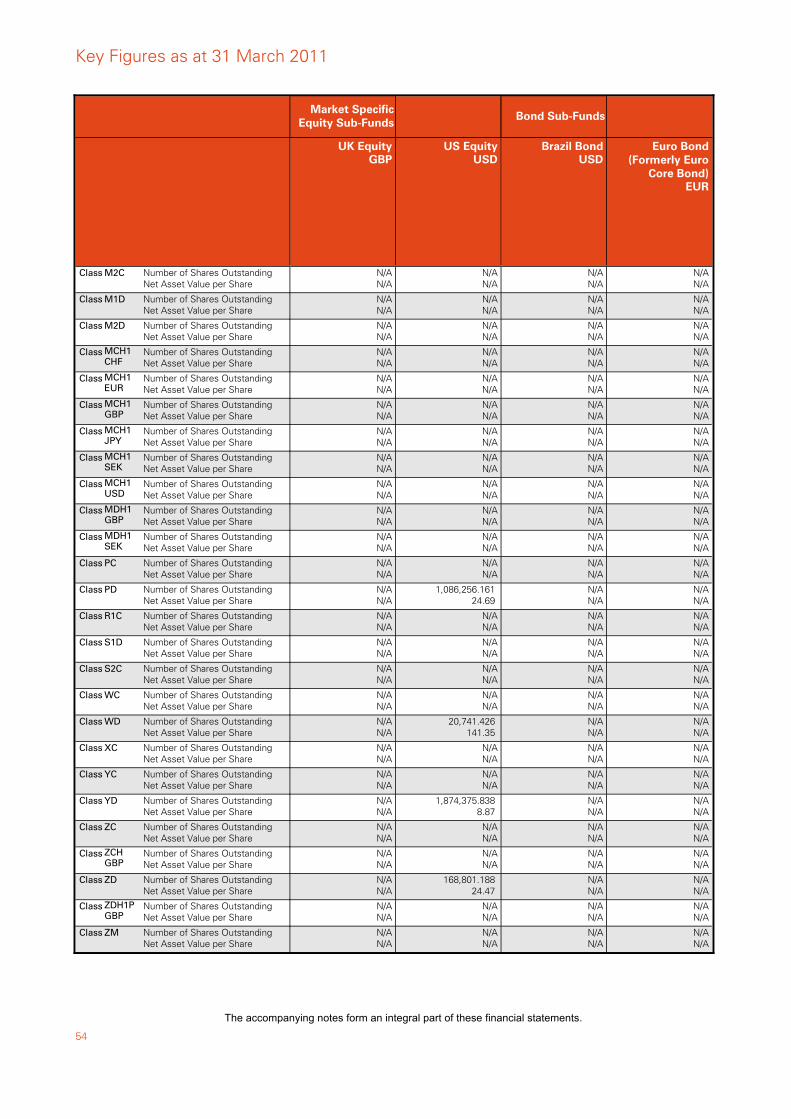
54
Class M2C Number of Shares OutstandingNet Asset Value per Share
N/AN/A
Class M1D Number of Shares OutstandingNet Asset Value per Share
N/AN/A
Class M2D Number of Shares OutstandingNet Asset Value per Share
N/AN/A
Class MCH1CHF
Number of Shares OutstandingNet Asset Value per Share
N/AN/A
Class MCH1EUR
Number of Shares OutstandingNet Asset Value per Share
N/AN/A
Class MCH1GBP
Number of Shares OutstandingNet Asset Value per Share
N/AN/A
Class MCH1JPY
Number of Shares OutstandingNet Asset Value per Share
N/AN/A
Class MCH1SEK
Number of Shares OutstandingNet Asset Value per Share
N/AN/A
Class MCH1USD
Number of Shares OutstandingNet Asset Value per Share
N/AN/A
Class MDH1GBP
Number of Shares OutstandingNet Asset Value per Share
N/AN/A
Class MDH1SEK
Number of Shares OutstandingNet Asset Value per Share
N/AN/A
Class PC Number of Shares OutstandingNet Asset Value per Share
N/AN/A
Class PD Number of Shares OutstandingNet Asset Value per Share
N/AN/A
Class R1C Number of Shares OutstandingNet Asset Value per Share
N/AN/A
Class S1D Number of Shares OutstandingNet Asset Value per Share
N/AN/A
Class S2C Number of Shares OutstandingNet Asset Value per Share
N/AN/A
Class WC Number of Shares OutstandingNet Asset Value per Share
N/AN/A
Class WD Number of Shares OutstandingNet Asset Value per Share
N/AN/A
Class XC Number of Shares OutstandingNet Asset Value per Share
N/AN/A
Class YC Number of Shares OutstandingNet Asset Value per Share
N/AN/A
Class YD Number of Shares OutstandingNet Asset Value per Share
N/AN/A
Class ZC Number of Shares OutstandingNet Asset Value per Share
N/AN/A
Class ZCHGBP
Number of Shares OutstandingNet Asset Value per Share
N/AN/A
Class ZD Number of Shares OutstandingNet Asset Value per Share
N/AN/A
Class ZDH1PGBP
Number of Shares OutstandingNet Asset Value per Share
N/AN/A
Class ZM Number of Shares OutstandingNet Asset Value per Share
N/AN/A
Market SpecificEquity Sub-Funds
GBPUK Equity
N/AN/A
N/AN/A
N/AN/A
N/AN/A
N/AN/A
N/AN/A
N/AN/A
N/AN/A
N/AN/A
N/AN/A
N/AN/A
N/AN/A
1,086,256.161 24.69
N/AN/A
N/AN/A
N/AN/A
N/AN/A
20,741.426 141.35
N/AN/A
N/AN/A
1,874,375.838 8.87
N/AN/A
N/AN/A
168,801.188 24.47
N/AN/A
N/AN/A
USDUS Equity
N/AN/A
N/AN/A
N/AN/A
N/AN/A
N/AN/A
N/AN/A
N/AN/A
N/AN/A
N/AN/A
N/AN/A
N/AN/A
N/AN/A
N/AN/A
N/AN/A
N/AN/A
N/AN/A
N/AN/A
N/AN/A
N/AN/A
N/AN/A
N/AN/A
N/AN/A
N/AN/A
N/AN/A
N/AN/A
N/AN/A
Bond Sub-Funds
USDBrazil Bond
N/AN/A
N/AN/A
N/AN/A
N/AN/A
N/AN/A
N/AN/A
N/AN/A
N/AN/A
N/AN/A
N/AN/A
N/AN/A
N/AN/A
N/AN/A
N/AN/A
N/AN/A
N/AN/A
N/AN/A
N/AN/A
N/AN/A
N/AN/A
N/AN/A
N/AN/A
N/AN/A
N/AN/A
N/AN/A
N/AN/A
EUR
Euro Bond(Formerly Euro
Core Bond)
Key Figures as at 31 March 2011
The accompanying notes form an integral part of these financial statements.
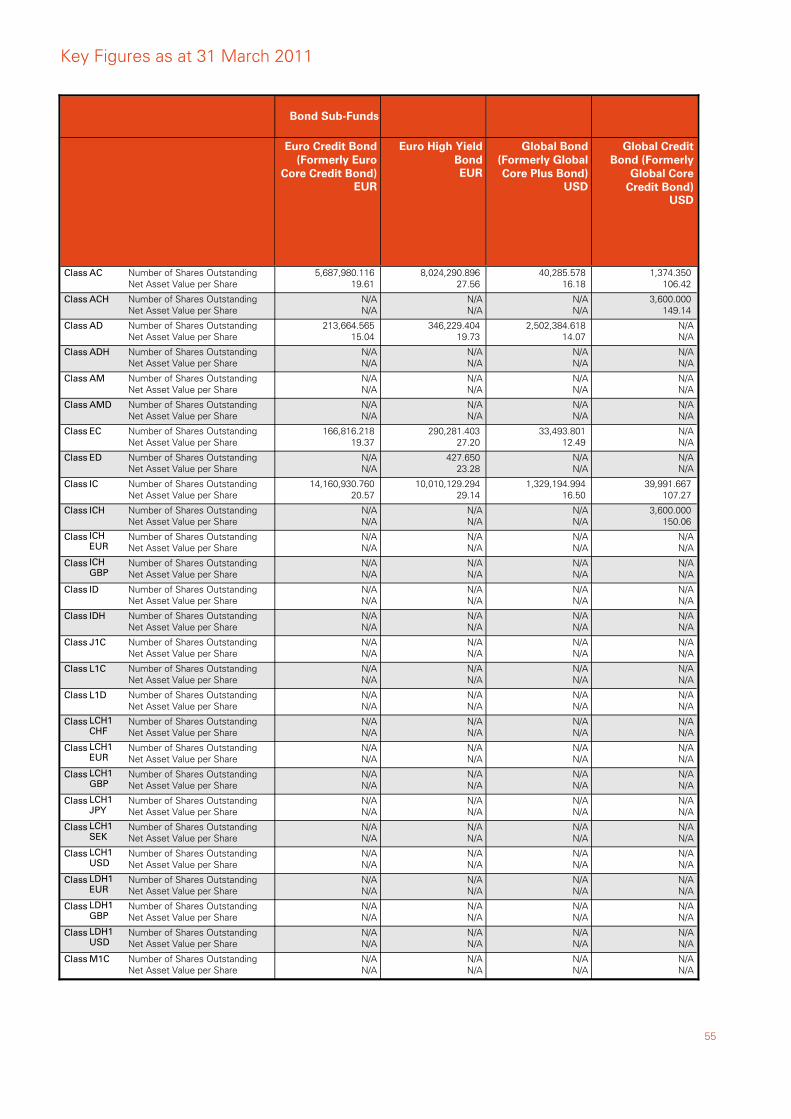
55
Class AC Number of Shares OutstandingNet Asset Value per Share
5,687,980.116 19.61
Class ACH Number of Shares OutstandingNet Asset Value per Share
N/AN/A
Class AD Number of Shares OutstandingNet Asset Value per Share
213,664.565 15.04
Class ADH Number of Shares OutstandingNet Asset Value per Share
N/AN/A
Class AM Number of Shares OutstandingNet Asset Value per Share
N/AN/A
Class AMD Number of Shares OutstandingNet Asset Value per Share
N/AN/A
Class EC Number of Shares OutstandingNet Asset Value per Share
166,816.218 19.37
Class ED Number of Shares OutstandingNet Asset Value per Share
N/AN/A
Class IC Number of Shares OutstandingNet Asset Value per Share
14,160,930.760 20.57
Class ICH Number of Shares OutstandingNet Asset Value per Share
N/AN/A
Class ICHEUR
Number of Shares OutstandingNet Asset Value per Share
N/AN/A
Class ICHGBP
Number of Shares OutstandingNet Asset Value per Share
N/AN/A
Class ID Number of Shares OutstandingNet Asset Value per Share
N/AN/A
Class IDH Number of Shares OutstandingNet Asset Value per Share
N/AN/A
Class J1C Number of Shares OutstandingNet Asset Value per Share
N/AN/A
Class L1C Number of Shares OutstandingNet Asset Value per Share
N/AN/A
Class L1D Number of Shares OutstandingNet Asset Value per Share
N/AN/A
Class LCH1CHF
Number of Shares OutstandingNet Asset Value per Share
N/AN/A
Class LCH1EUR
Number of Shares OutstandingNet Asset Value per Share
N/AN/A
Class LCH1GBP
Number of Shares OutstandingNet Asset Value per Share
N/AN/A
Class LCH1JPY
Number of Shares OutstandingNet Asset Value per Share
N/AN/A
Class LCH1SEK
Number of Shares OutstandingNet Asset Value per Share
N/AN/A
Class LCH1USD
Number of Shares OutstandingNet Asset Value per Share
N/AN/A
Class LDH1EUR
Number of Shares OutstandingNet Asset Value per Share
N/AN/A
Class LDH1GBP
Number of Shares OutstandingNet Asset Value per Share
N/AN/A
Class LDH1USD
Number of Shares OutstandingNet Asset Value per Share
N/AN/A
Class M1C Number of Shares OutstandingNet Asset Value per Share
N/AN/A
Bond Sub-Funds
EUR
Euro Credit Bond(Formerly Euro
Core Credit Bond)
8,024,290.896 27.56
N/AN/A
346,229.404 19.73
N/AN/A
N/AN/A
N/AN/A
290,281.403 27.20
427.650 23.28
10,010,129.294 29.14
N/AN/A
N/AN/A
N/AN/A
N/AN/A
N/AN/A
N/AN/A
N/AN/A
N/AN/A
N/AN/A
N/AN/A
N/AN/A
N/AN/A
N/AN/A
N/AN/A
N/AN/A
N/AN/A
N/AN/A
N/AN/A
EUR
Euro High YieldBond
40,285.578 16.18
N/AN/A
2,502,384.618 14.07
N/AN/A
N/AN/A
N/AN/A
33,493.801 12.49
N/AN/A
1,329,194.994 16.50
N/AN/A
N/AN/A
N/AN/A
N/AN/A
N/AN/A
N/AN/A
N/AN/A
N/AN/A
N/AN/A
N/AN/A
N/AN/A
N/AN/A
N/AN/A
N/AN/A
N/AN/A
N/AN/A
N/AN/A
N/AN/A
USD
Global Bond(Formerly GlobalCore Plus Bond)
1,374.350 106.42
3,600.000 149.14
N/AN/A
N/AN/A
N/AN/A
N/AN/A
N/AN/A
N/AN/A
39,991.667 107.27
3,600.000 150.06
N/AN/A
N/AN/A
N/AN/A
N/AN/A
N/AN/A
N/AN/A
N/AN/A
N/AN/A
N/AN/A
N/AN/A
N/AN/A
N/AN/A
N/AN/A
N/AN/A
N/AN/A
N/AN/A
N/AN/A
USD
Global CreditBond (Formerly
Global CoreCredit Bond)
Key Figures as at 31 March 2011
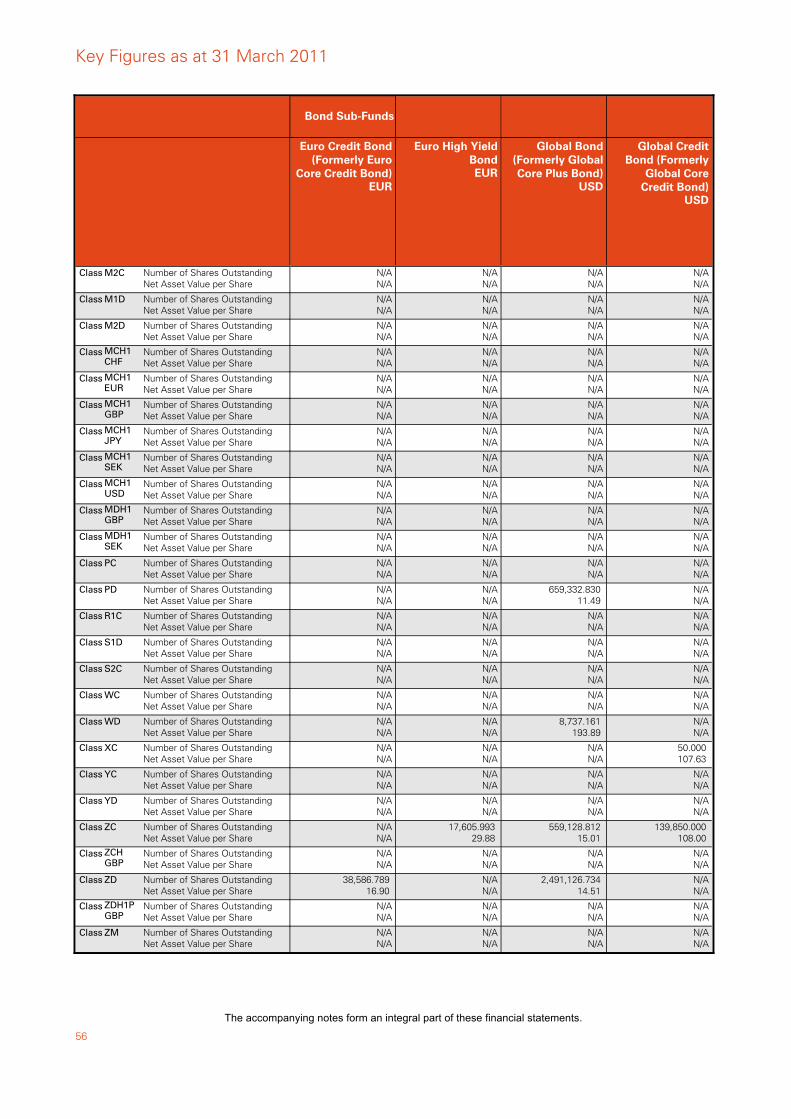
56
Class M2C Number of Shares OutstandingNet Asset Value per Share
N/AN/A
Class M1D Number of Shares OutstandingNet Asset Value per Share
N/AN/A
Class M2D Number of Shares OutstandingNet Asset Value per Share
N/AN/A
Class MCH1CHF
Number of Shares OutstandingNet Asset Value per Share
N/AN/A
Class MCH1EUR
Number of Shares OutstandingNet Asset Value per Share
N/AN/A
Class MCH1GBP
Number of Shares OutstandingNet Asset Value per Share
N/AN/A
Class MCH1JPY
Number of Shares OutstandingNet Asset Value per Share
N/AN/A
Class MCH1SEK
Number of Shares OutstandingNet Asset Value per Share
N/AN/A
Class MCH1USD
Number of Shares OutstandingNet Asset Value per Share
N/AN/A
Class MDH1GBP
Number of Shares OutstandingNet Asset Value per Share
N/AN/A
Class MDH1SEK
Number of Shares OutstandingNet Asset Value per Share
N/AN/A
Class PC Number of Shares OutstandingNet Asset Value per Share
N/AN/A
Class PD Number of Shares OutstandingNet Asset Value per Share
N/AN/A
Class R1C Number of Shares OutstandingNet Asset Value per Share
N/AN/A
Class S1D Number of Shares OutstandingNet Asset Value per Share
N/AN/A
Class S2C Number of Shares OutstandingNet Asset Value per Share
N/AN/A
Class WC Number of Shares OutstandingNet Asset Value per Share
N/AN/A
Class WD Number of Shares OutstandingNet Asset Value per Share
N/AN/A
Class XC Number of Shares OutstandingNet Asset Value per Share
N/AN/A
Class YC Number of Shares OutstandingNet Asset Value per Share
N/AN/A
Class YD Number of Shares OutstandingNet Asset Value per Share
N/AN/A
Class ZC Number of Shares OutstandingNet Asset Value per Share
N/AN/A
Class ZCHGBP
Number of Shares OutstandingNet Asset Value per Share
N/AN/A
Class ZD Number of Shares OutstandingNet Asset Value per Share
38,586.789 16.90
Class ZDH1PGBP
Number of Shares OutstandingNet Asset Value per Share
N/AN/A
Class ZM Number of Shares OutstandingNet Asset Value per Share
N/AN/A
Bond Sub-Funds
EUR
Euro Credit Bond(Formerly Euro
Core Credit Bond)
N/AN/A
N/AN/A
N/AN/A
N/AN/A
N/AN/A
N/AN/A
N/AN/A
N/AN/A
N/AN/A
N/AN/A
N/AN/A
N/AN/A
N/AN/A
N/AN/A
N/AN/A
N/AN/A
N/AN/A
N/AN/A
N/AN/A
N/AN/A
N/AN/A
17,605.993 29.88
N/AN/A
N/AN/A
N/AN/A
N/AN/A
EUR
Euro High YieldBond
N/AN/A
N/AN/A
N/AN/A
N/AN/A
N/AN/A
N/AN/A
N/AN/A
N/AN/A
N/AN/A
N/AN/A
N/AN/A
N/AN/A
659,332.830 11.49
N/AN/A
N/AN/A
N/AN/A
N/AN/A
8,737.161 193.89
N/AN/A
N/AN/A
N/AN/A
559,128.812 15.01
N/AN/A
2,491,126.734 14.51
N/AN/A
N/AN/A
USD
Global Bond(Formerly GlobalCore Plus Bond)
N/AN/A
N/AN/A
N/AN/A
N/AN/A
N/AN/A
N/AN/A
N/AN/A
N/AN/A
N/AN/A
N/AN/A
N/AN/A
N/AN/A
N/AN/A
N/AN/A
N/AN/A
N/AN/A
N/AN/A
N/AN/A
50.000 107.63
N/AN/A
N/AN/A
139,850.000 108.00
N/AN/A
N/AN/A
N/AN/A
N/AN/A
USD
Global CreditBond (Formerly
Global CoreCredit Bond)
Key Figures as at 31 March 2011
The accompanying notes form an integral part of these financial statements.
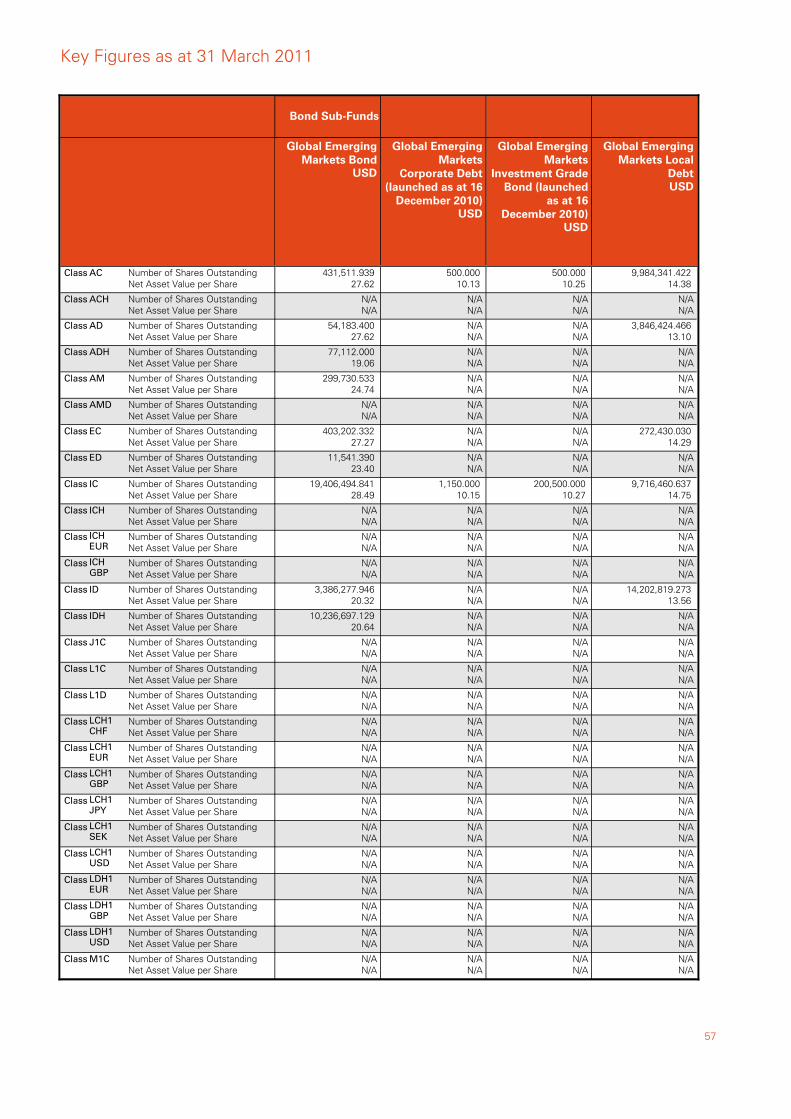
57
Class AC Number of Shares OutstandingNet Asset Value per Share
431,511.939 27.62
Class ACH Number of Shares OutstandingNet Asset Value per Share
N/AN/A
Class AD Number of Shares OutstandingNet Asset Value per Share
54,183.400 27.62
Class ADH Number of Shares OutstandingNet Asset Value per Share
77,112.000 19.06
Class AM Number of Shares OutstandingNet Asset Value per Share
299,730.533 24.74
Class AMD Number of Shares OutstandingNet Asset Value per Share
N/AN/A
Class EC Number of Shares OutstandingNet Asset Value per Share
403,202.332 27.27
Class ED Number of Shares OutstandingNet Asset Value per Share
11,541.390 23.40
Class IC Number of Shares OutstandingNet Asset Value per Share
19,406,494.841 28.49
Class ICH Number of Shares OutstandingNet Asset Value per Share
N/AN/A
Class ICHEUR
Number of Shares OutstandingNet Asset Value per Share
N/AN/A
Class ICHGBP
Number of Shares OutstandingNet Asset Value per Share
N/AN/A
Class ID Number of Shares OutstandingNet Asset Value per Share
3,386,277.946 20.32
Class IDH Number of Shares OutstandingNet Asset Value per Share
10,236,697.129 20.64
Class J1C Number of Shares OutstandingNet Asset Value per Share
N/AN/A
Class L1C Number of Shares OutstandingNet Asset Value per Share
N/AN/A
Class L1D Number of Shares OutstandingNet Asset Value per Share
N/AN/A
Class LCH1CHF
Number of Shares OutstandingNet Asset Value per Share
N/AN/A
Class LCH1EUR
Number of Shares OutstandingNet Asset Value per Share
N/AN/A
Class LCH1GBP
Number of Shares OutstandingNet Asset Value per Share
N/AN/A
Class LCH1JPY
Number of Shares OutstandingNet Asset Value per Share
N/AN/A
Class LCH1SEK
Number of Shares OutstandingNet Asset Value per Share
N/AN/A
Class LCH1USD
Number of Shares OutstandingNet Asset Value per Share
N/AN/A
Class LDH1EUR
Number of Shares OutstandingNet Asset Value per Share
N/AN/A
Class LDH1GBP
Number of Shares OutstandingNet Asset Value per Share
N/AN/A
Class LDH1USD
Number of Shares OutstandingNet Asset Value per Share
N/AN/A
Class M1C Number of Shares OutstandingNet Asset Value per Share
N/AN/A
Bond Sub-Funds
USD
Global EmergingMarkets Bond
500.000 10.13
N/AN/A
N/AN/A
N/AN/A
N/AN/A
N/AN/A
N/AN/A
N/AN/A
1,150.000 10.15
N/AN/A
N/AN/A
N/AN/A
N/AN/A
N/AN/A
N/AN/A
N/AN/A
N/AN/A
N/AN/A
N/AN/A
N/AN/A
N/AN/A
N/AN/A
N/AN/A
N/AN/A
N/AN/A
N/AN/A
N/AN/A
USD
Global EmergingMarkets
Corporate Debt(launched as at 16
December 2010)
500.000 10.25
N/AN/A
N/AN/A
N/AN/A
N/AN/A
N/AN/A
N/AN/A
N/AN/A
200,500.000 10.27
N/AN/A
N/AN/A
N/AN/A
N/AN/A
N/AN/A
N/AN/A
N/AN/A
N/AN/A
N/AN/A
N/AN/A
N/AN/A
N/AN/A
N/AN/A
N/AN/A
N/AN/A
N/AN/A
N/AN/A
N/AN/A
USD
Global EmergingMarkets
Investment GradeBond (launched
as at 16December 2010)
9,984,341.422 14.38
N/AN/A
3,846,424.466 13.10
N/AN/A
N/AN/A
N/AN/A
272,430.030 14.29
N/AN/A
9,716,460.637 14.75
N/AN/A
N/AN/A
N/AN/A
14,202,819.273 13.56
N/AN/A
N/AN/A
N/AN/A
N/AN/A
N/AN/A
N/AN/A
N/AN/A
N/AN/A
N/AN/A
N/AN/A
N/AN/A
N/AN/A
N/AN/A
N/AN/A
USD
Global EmergingMarkets Local
Debt
Key Figures as at 31 March 2011
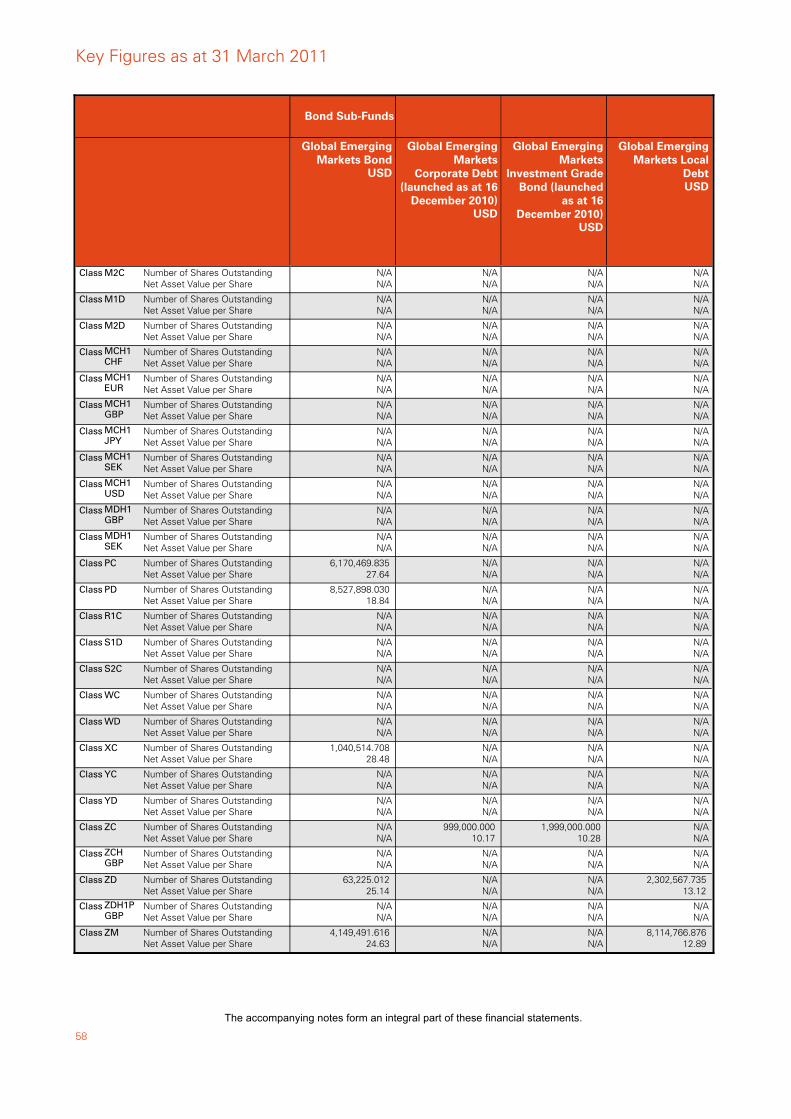
58
Class M2C Number of Shares OutstandingNet Asset Value per Share
N/AN/A
Class M1D Number of Shares OutstandingNet Asset Value per Share
N/AN/A
Class M2D Number of Shares OutstandingNet Asset Value per Share
N/AN/A
Class MCH1CHF
Number of Shares OutstandingNet Asset Value per Share
N/AN/A
Class MCH1EUR
Number of Shares OutstandingNet Asset Value per Share
N/AN/A
Class MCH1GBP
Number of Shares OutstandingNet Asset Value per Share
N/AN/A
Class MCH1JPY
Number of Shares OutstandingNet Asset Value per Share
N/AN/A
Class MCH1SEK
Number of Shares OutstandingNet Asset Value per Share
N/AN/A
Class MCH1USD
Number of Shares OutstandingNet Asset Value per Share
N/AN/A
Class MDH1GBP
Number of Shares OutstandingNet Asset Value per Share
N/AN/A
Class MDH1SEK
Number of Shares OutstandingNet Asset Value per Share
N/AN/A
Class PC Number of Shares OutstandingNet Asset Value per Share
6,170,469.835 27.64
Class PD Number of Shares OutstandingNet Asset Value per Share
8,527,898.030 18.84
Class R1C Number of Shares OutstandingNet Asset Value per Share
N/AN/A
Class S1D Number of Shares OutstandingNet Asset Value per Share
N/AN/A
Class S2C Number of Shares OutstandingNet Asset Value per Share
N/AN/A
Class WC Number of Shares OutstandingNet Asset Value per Share
N/AN/A
Class WD Number of Shares OutstandingNet Asset Value per Share
N/AN/A
Class XC Number of Shares OutstandingNet Asset Value per Share
1,040,514.708 28.48
Class YC Number of Shares OutstandingNet Asset Value per Share
N/AN/A
Class YD Number of Shares OutstandingNet Asset Value per Share
N/AN/A
Class ZC Number of Shares OutstandingNet Asset Value per Share
N/AN/A
Class ZCHGBP
Number of Shares OutstandingNet Asset Value per Share
N/AN/A
Class ZD Number of Shares OutstandingNet Asset Value per Share
63,225.012 25.14
Class ZDH1PGBP
Number of Shares OutstandingNet Asset Value per Share
N/AN/A
Class ZM Number of Shares OutstandingNet Asset Value per Share
4,149,491.616 24.63
Bond Sub-Funds
USD
Global EmergingMarkets Bond
N/AN/A
N/AN/A
N/AN/A
N/AN/A
N/AN/A
N/AN/A
N/AN/A
N/AN/A
N/AN/A
N/AN/A
N/AN/A
N/AN/A
N/AN/A
N/AN/A
N/AN/A
N/AN/A
N/AN/A
N/AN/A
N/AN/A
N/AN/A
N/AN/A
999,000.000 10.17
N/AN/A
N/AN/A
N/AN/A
N/AN/A
USD
Global EmergingMarkets
Corporate Debt(launched as at 16
December 2010)
N/AN/A
N/AN/A
N/AN/A
N/AN/A
N/AN/A
N/AN/A
N/AN/A
N/AN/A
N/AN/A
N/AN/A
N/AN/A
N/AN/A
N/AN/A
N/AN/A
N/AN/A
N/AN/A
N/AN/A
N/AN/A
N/AN/A
N/AN/A
N/AN/A
1,999,000.000 10.28
N/AN/A
N/AN/A
N/AN/A
N/AN/A
USD
Global EmergingMarkets
Investment GradeBond (launched
as at 16December 2010)
N/AN/A
N/AN/A
N/AN/A
N/AN/A
N/AN/A
N/AN/A
N/AN/A
N/AN/A
N/AN/A
N/AN/A
N/AN/A
N/AN/A
N/AN/A
N/AN/A
N/AN/A
N/AN/A
N/AN/A
N/AN/A
N/AN/A
N/AN/A
N/AN/A
N/AN/A
N/AN/A
2,302,567.735 13.12
N/AN/A
8,114,766.876 12.89
USD
Global EmergingMarkets Local
Debt
Key Figures as at 31 March 2011
The accompanying notes form an integral part of these financial statements.
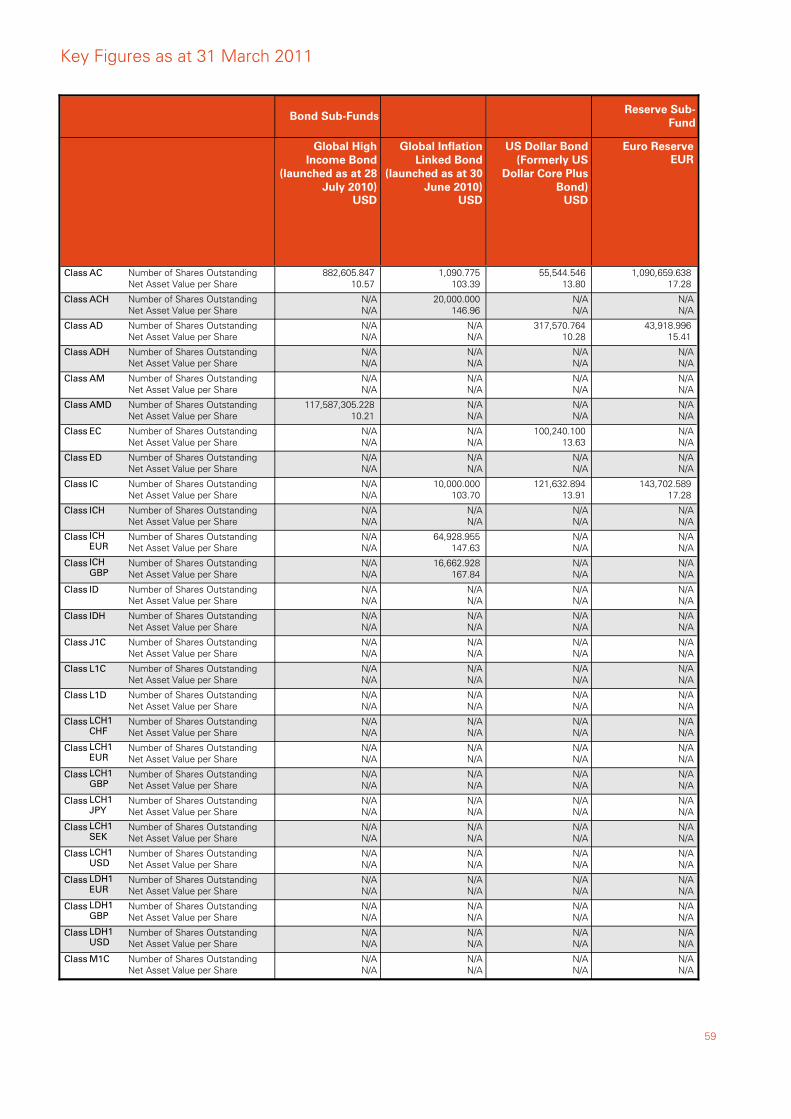
59
Class AC Number of Shares OutstandingNet Asset Value per Share
882,605.847 10.57
Class ACH Number of Shares OutstandingNet Asset Value per Share
N/AN/A
Class AD Number of Shares OutstandingNet Asset Value per Share
N/AN/A
Class ADH Number of Shares OutstandingNet Asset Value per Share
N/AN/A
Class AM Number of Shares OutstandingNet Asset Value per Share
N/AN/A
Class AMD Number of Shares OutstandingNet Asset Value per Share
117,587,305.228 10.21
Class EC Number of Shares OutstandingNet Asset Value per Share
N/AN/A
Class ED Number of Shares OutstandingNet Asset Value per Share
N/AN/A
Class IC Number of Shares OutstandingNet Asset Value per Share
N/AN/A
Class ICH Number of Shares OutstandingNet Asset Value per Share
N/AN/A
Class ICHEUR
Number of Shares OutstandingNet Asset Value per Share
N/AN/A
Class ICHGBP
Number of Shares OutstandingNet Asset Value per Share
N/AN/A
Class ID Number of Shares OutstandingNet Asset Value per Share
N/AN/A
Class IDH Number of Shares OutstandingNet Asset Value per Share
N/AN/A
Class J1C Number of Shares OutstandingNet Asset Value per Share
N/AN/A
Class L1C Number of Shares OutstandingNet Asset Value per Share
N/AN/A
Class L1D Number of Shares OutstandingNet Asset Value per Share
N/AN/A
Class LCH1CHF
Number of Shares OutstandingNet Asset Value per Share
N/AN/A
Class LCH1EUR
Number of Shares OutstandingNet Asset Value per Share
N/AN/A
Class LCH1GBP
Number of Shares OutstandingNet Asset Value per Share
N/AN/A
Class LCH1JPY
Number of Shares OutstandingNet Asset Value per Share
N/AN/A
Class LCH1SEK
Number of Shares OutstandingNet Asset Value per Share
N/AN/A
Class LCH1USD
Number of Shares OutstandingNet Asset Value per Share
N/AN/A
Class LDH1EUR
Number of Shares OutstandingNet Asset Value per Share
N/AN/A
Class LDH1GBP
Number of Shares OutstandingNet Asset Value per Share
N/AN/A
Class LDH1USD
Number of Shares OutstandingNet Asset Value per Share
N/AN/A
Class M1C Number of Shares OutstandingNet Asset Value per Share
N/AN/A
Bond Sub-Funds
USD
Global HighIncome Bond
(launched as at 28July 2010)
1,090.775 103.39
20,000.000 146.96
N/AN/A
N/AN/A
N/AN/A
N/AN/A
N/AN/A
N/AN/A
10,000.000 103.70
N/AN/A
64,928.955 147.63
16,662.928 167.84
N/AN/A
N/AN/A
N/AN/A
N/AN/A
N/AN/A
N/AN/A
N/AN/A
N/AN/A
N/AN/A
N/AN/A
N/AN/A
N/AN/A
N/AN/A
N/AN/A
N/AN/A
USD
Global InflationLinked Bond
(launched as at 30June 2010)
55,544.546 13.80
N/AN/A
317,570.764 10.28
N/AN/A
N/AN/A
N/AN/A
100,240.100 13.63
N/AN/A
121,632.894 13.91
N/AN/A
N/AN/A
N/AN/A
N/AN/A
N/AN/A
N/AN/A
N/AN/A
N/AN/A
N/AN/A
N/AN/A
N/AN/A
N/AN/A
N/AN/A
N/AN/A
N/AN/A
N/AN/A
N/AN/A
N/AN/A
USD
US Dollar Bond(Formerly US
Dollar Core PlusBond)
1,090,659.638 17.28
N/AN/A
43,918.996 15.41
N/AN/A
N/AN/A
N/AN/A
N/AN/A
N/AN/A
143,702.589 17.28
N/AN/A
N/AN/A
N/AN/A
N/AN/A
N/AN/A
N/AN/A
N/AN/A
N/AN/A
N/AN/A
N/AN/A
N/AN/A
N/AN/A
N/AN/A
N/AN/A
N/AN/A
N/AN/A
N/AN/A
N/AN/A
Reserve Sub-Fund
EUREuro Reserve
Key Figures as at 31 March 2011
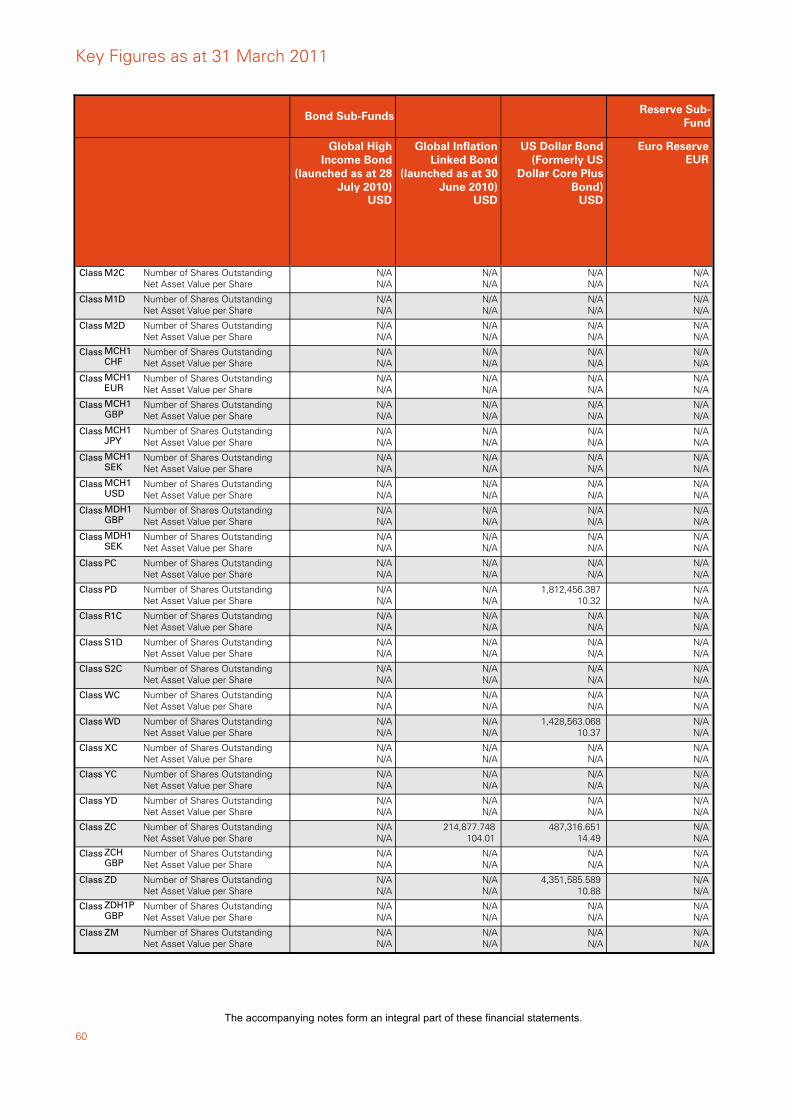
60
Class M2C Number of Shares OutstandingNet Asset Value per Share
N/AN/A
Class M1D Number of Shares OutstandingNet Asset Value per Share
N/AN/A
Class M2D Number of Shares OutstandingNet Asset Value per Share
N/AN/A
Class MCH1CHF
Number of Shares OutstandingNet Asset Value per Share
N/AN/A
Class MCH1EUR
Number of Shares OutstandingNet Asset Value per Share
N/AN/A
Class MCH1GBP
Number of Shares OutstandingNet Asset Value per Share
N/AN/A
Class MCH1JPY
Number of Shares OutstandingNet Asset Value per Share
N/AN/A
Class MCH1SEK
Number of Shares OutstandingNet Asset Value per Share
N/AN/A
Class MCH1USD
Number of Shares OutstandingNet Asset Value per Share
N/AN/A
Class MDH1GBP
Number of Shares OutstandingNet Asset Value per Share
N/AN/A
Class MDH1SEK
Number of Shares OutstandingNet Asset Value per Share
N/AN/A
Class PC Number of Shares OutstandingNet Asset Value per Share
N/AN/A
Class PD Number of Shares OutstandingNet Asset Value per Share
N/AN/A
Class R1C Number of Shares OutstandingNet Asset Value per Share
N/AN/A
Class S1D Number of Shares OutstandingNet Asset Value per Share
N/AN/A
Class S2C Number of Shares OutstandingNet Asset Value per Share
N/AN/A
Class WC Number of Shares OutstandingNet Asset Value per Share
N/AN/A
Class WD Number of Shares OutstandingNet Asset Value per Share
N/AN/A
Class XC Number of Shares OutstandingNet Asset Value per Share
N/AN/A
Class YC Number of Shares OutstandingNet Asset Value per Share
N/AN/A
Class YD Number of Shares OutstandingNet Asset Value per Share
N/AN/A
Class ZC Number of Shares OutstandingNet Asset Value per Share
N/AN/A
Class ZCHGBP
Number of Shares OutstandingNet Asset Value per Share
N/AN/A
Class ZD Number of Shares OutstandingNet Asset Value per Share
N/AN/A
Class ZDH1PGBP
Number of Shares OutstandingNet Asset Value per Share
N/AN/A
Class ZM Number of Shares OutstandingNet Asset Value per Share
N/AN/A
Bond Sub-Funds
USD
Global HighIncome Bond
(launched as at 28July 2010)
N/AN/A
N/AN/A
N/AN/A
N/AN/A
N/AN/A
N/AN/A
N/AN/A
N/AN/A
N/AN/A
N/AN/A
N/AN/A
N/AN/A
N/AN/A
N/AN/A
N/AN/A
N/AN/A
N/AN/A
N/AN/A
N/AN/A
N/AN/A
N/AN/A
214,877.748 104.01
N/AN/A
N/AN/A
N/AN/A
N/AN/A
USD
Global InflationLinked Bond
(launched as at 30June 2010)
N/AN/A
N/AN/A
N/AN/A
N/AN/A
N/AN/A
N/AN/A
N/AN/A
N/AN/A
N/AN/A
N/AN/A
N/AN/A
N/AN/A
1,812,456.387 10.32
N/AN/A
N/AN/A
N/AN/A
N/AN/A
1,428,563.068 10.37
N/AN/A
N/AN/A
N/AN/A
487,316.651 14.49
N/AN/A
4,351,585.589 10.88
N/AN/A
N/AN/A
USD
US Dollar Bond(Formerly US
Dollar Core PlusBond)
N/AN/A
N/AN/A
N/AN/A
N/AN/A
N/AN/A
N/AN/A
N/AN/A
N/AN/A
N/AN/A
N/AN/A
N/AN/A
N/AN/A
N/AN/A
N/AN/A
N/AN/A
N/AN/A
N/AN/A
N/AN/A
N/AN/A
N/AN/A
N/AN/A
N/AN/A
N/AN/A
N/AN/A
N/AN/A
N/AN/A
Reserve Sub-Fund
EUREuro Reserve
Key Figures as at 31 March 2011
The accompanying notes form an integral part of these financial statements.
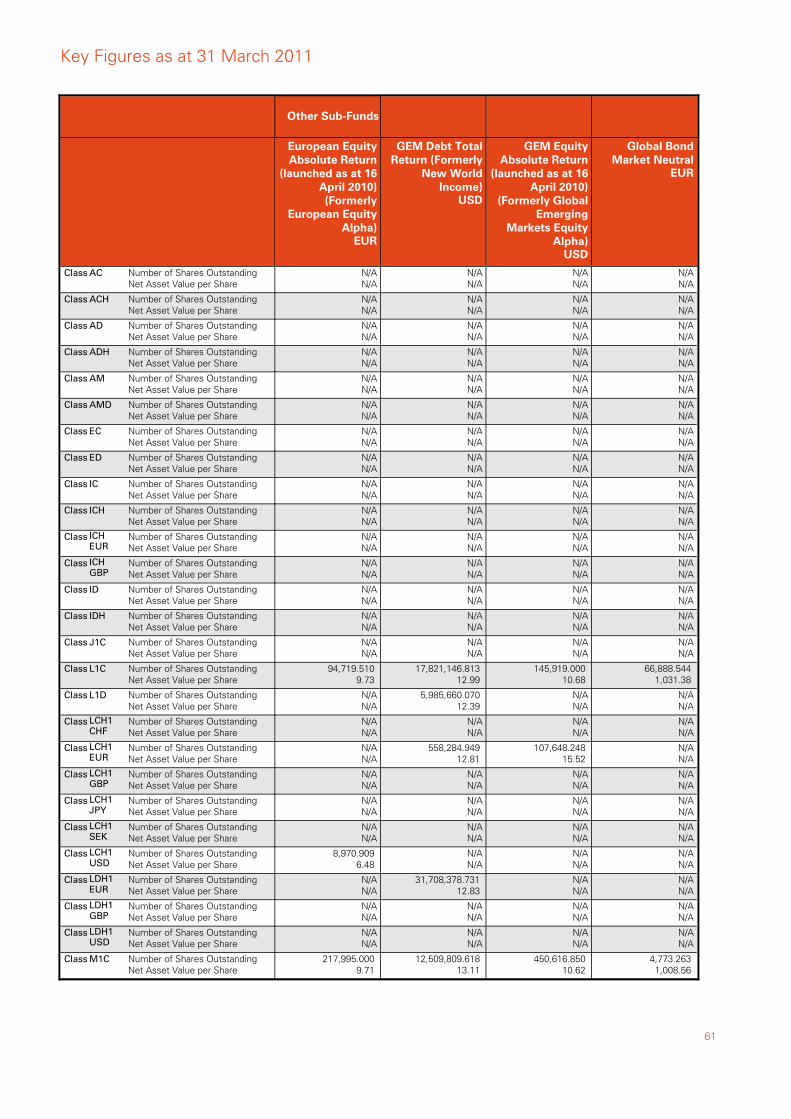
61
Class AC Number of Shares OutstandingNet Asset Value per Share
N/AN/A
Class ACH Number of Shares OutstandingNet Asset Value per Share
N/AN/A
Class AD Number of Shares OutstandingNet Asset Value per Share
N/AN/A
Class ADH Number of Shares OutstandingNet Asset Value per Share
N/AN/A
Class AM Number of Shares OutstandingNet Asset Value per Share
N/AN/A
Class AMD Number of Shares OutstandingNet Asset Value per Share
N/AN/A
Class EC Number of Shares OutstandingNet Asset Value per Share
N/AN/A
Class ED Number of Shares OutstandingNet Asset Value per Share
N/AN/A
Class IC Number of Shares OutstandingNet Asset Value per Share
N/AN/A
Class ICH Number of Shares OutstandingNet Asset Value per Share
N/AN/A
Class ICHEUR
Number of Shares OutstandingNet Asset Value per Share
N/AN/A
Class ICHGBP
Number of Shares OutstandingNet Asset Value per Share
N/AN/A
Class ID Number of Shares OutstandingNet Asset Value per Share
N/AN/A
Class IDH Number of Shares OutstandingNet Asset Value per Share
N/AN/A
Class J1C Number of Shares OutstandingNet Asset Value per Share
N/AN/A
Class L1C Number of Shares OutstandingNet Asset Value per Share
94,719.510 9.73
Class L1D Number of Shares OutstandingNet Asset Value per Share
N/AN/A
Class LCH1CHF
Number of Shares OutstandingNet Asset Value per Share
N/AN/A
Class LCH1EUR
Number of Shares OutstandingNet Asset Value per Share
N/AN/A
Class LCH1GBP
Number of Shares OutstandingNet Asset Value per Share
N/AN/A
Class LCH1JPY
Number of Shares OutstandingNet Asset Value per Share
N/AN/A
Class LCH1SEK
Number of Shares OutstandingNet Asset Value per Share
N/AN/A
Class LCH1USD
Number of Shares OutstandingNet Asset Value per Share
8,970.909 6.48
Class LDH1EUR
Number of Shares OutstandingNet Asset Value per Share
N/AN/A
Class LDH1GBP
Number of Shares OutstandingNet Asset Value per Share
N/AN/A
Class LDH1USD
Number of Shares OutstandingNet Asset Value per Share
N/AN/A
Class M1C Number of Shares OutstandingNet Asset Value per Share
217,995.000 9.71
Other Sub-Funds
EUR
European EquityAbsolute Return
(launched as at 16April 2010)(Formerly
European EquityAlpha)
N/AN/A
N/AN/A
N/AN/A
N/AN/A
N/AN/A
N/AN/A
N/AN/A
N/AN/A
N/AN/A
N/AN/A
N/AN/A
N/AN/A
N/AN/A
N/AN/A
N/AN/A
17,821,146.813 12.99
5,985,660.070 12.39
N/AN/A
558,284.949 12.81
N/AN/A
N/AN/A
N/AN/A
N/AN/A
31,708,378.731 12.83
N/AN/A
N/AN/A
12,509,809.618 13.11
USD
GEM Debt TotalReturn (Formerly
New WorldIncome)
N/AN/A
N/AN/A
N/AN/A
N/AN/A
N/AN/A
N/AN/A
N/AN/A
N/AN/A
N/AN/A
N/AN/A
N/AN/A
N/AN/A
N/AN/A
N/AN/A
N/AN/A
145,919.000 10.68
N/AN/A
N/AN/A
107,648.248 15.52
N/AN/A
N/AN/A
N/AN/A
N/AN/A
N/AN/A
N/AN/A
N/AN/A
450,616.850 10.62
USD
GEM EquityAbsolute Return
(launched as at 16April 2010)
(Formerly GlobalEmerging
Markets EquityAlpha)
N/AN/A
N/AN/A
N/AN/A
N/AN/A
N/AN/A
N/AN/A
N/AN/A
N/AN/A
N/AN/A
N/AN/A
N/AN/A
N/AN/A
N/AN/A
N/AN/A
N/AN/A
66,888.544 1,031.38
N/AN/A
N/AN/A
N/AN/A
N/AN/A
N/AN/A
N/AN/A
N/AN/A
N/AN/A
N/AN/A
N/AN/A
4,773.263 1,008.56
EUR
Global BondMarket Neutral
Key Figures as at 31 March 2011
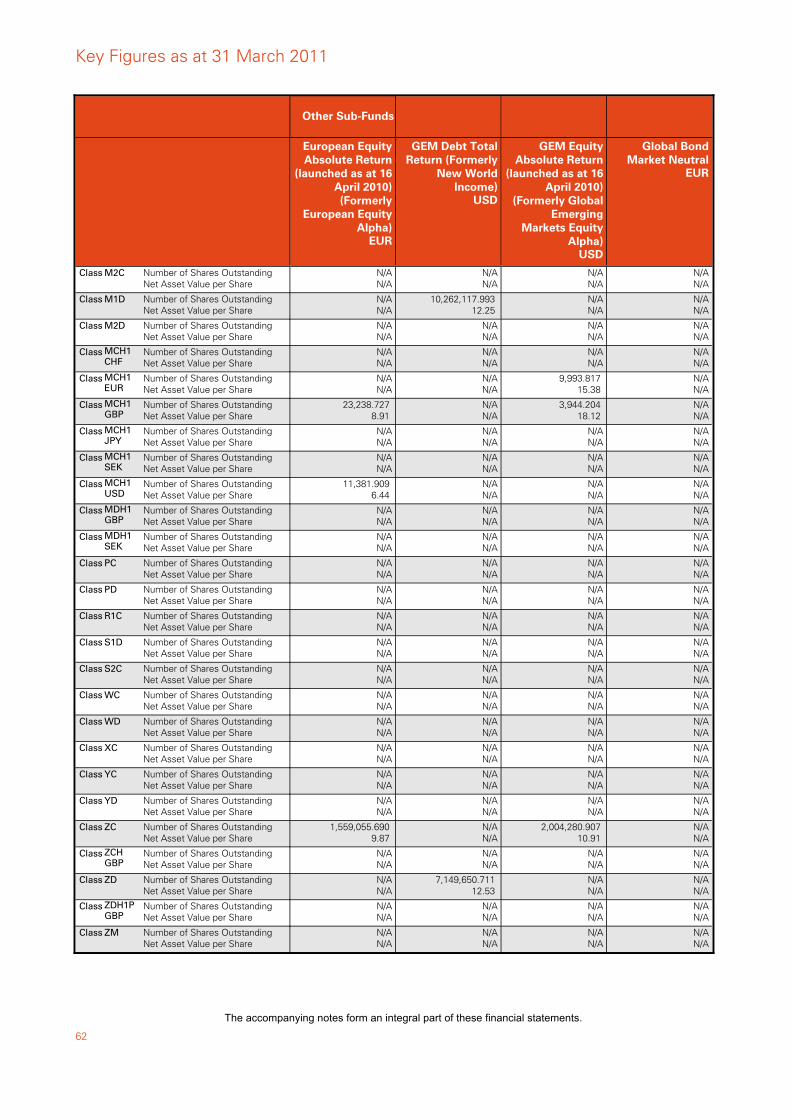
62
Class M2C Number of Shares OutstandingNet Asset Value per Share
N/AN/A
Class M1D Number of Shares OutstandingNet Asset Value per Share
N/AN/A
Class M2D Number of Shares OutstandingNet Asset Value per Share
N/AN/A
Class MCH1CHF
Number of Shares OutstandingNet Asset Value per Share
N/AN/A
Class MCH1EUR
Number of Shares OutstandingNet Asset Value per Share
N/AN/A
Class MCH1GBP
Number of Shares OutstandingNet Asset Value per Share
23,238.727 8.91
Class MCH1JPY
Number of Shares OutstandingNet Asset Value per Share
N/AN/A
Class MCH1SEK
Number of Shares OutstandingNet Asset Value per Share
N/AN/A
Class MCH1USD
Number of Shares OutstandingNet Asset Value per Share
11,381.909 6.44
Class MDH1GBP
Number of Shares OutstandingNet Asset Value per Share
N/AN/A
Class MDH1SEK
Number of Shares OutstandingNet Asset Value per Share
N/AN/A
Class PC Number of Shares OutstandingNet Asset Value per Share
N/AN/A
Class PD Number of Shares OutstandingNet Asset Value per Share
N/AN/A
Class R1C Number of Shares OutstandingNet Asset Value per Share
N/AN/A
Class S1D Number of Shares OutstandingNet Asset Value per Share
N/AN/A
Class S2C Number of Shares OutstandingNet Asset Value per Share
N/AN/A
Class WC Number of Shares OutstandingNet Asset Value per Share
N/AN/A
Class WD Number of Shares OutstandingNet Asset Value per Share
N/AN/A
Class XC Number of Shares OutstandingNet Asset Value per Share
N/AN/A
Class YC Number of Shares OutstandingNet Asset Value per Share
N/AN/A
Class YD Number of Shares OutstandingNet Asset Value per Share
N/AN/A
Class ZC Number of Shares OutstandingNet Asset Value per Share
1,559,055.690 9.87
Class ZCHGBP
Number of Shares OutstandingNet Asset Value per Share
N/AN/A
Class ZD Number of Shares OutstandingNet Asset Value per Share
N/AN/A
Class ZDH1PGBP
Number of Shares OutstandingNet Asset Value per Share
N/AN/A
Class ZM Number of Shares OutstandingNet Asset Value per Share
N/AN/A
Other Sub-Funds
EUR
European EquityAbsolute Return
(launched as at 16April 2010)(Formerly
European EquityAlpha)
N/AN/A
10,262,117.993 12.25
N/AN/A
N/AN/A
N/AN/A
N/AN/A
N/AN/A
N/AN/A
N/AN/A
N/AN/A
N/AN/A
N/AN/A
N/AN/A
N/AN/A
N/AN/A
N/AN/A
N/AN/A
N/AN/A
N/AN/A
N/AN/A
N/AN/A
N/AN/A
N/AN/A
7,149,650.711 12.53
N/AN/A
N/AN/A
USD
GEM Debt TotalReturn (Formerly
New WorldIncome)
N/AN/A
N/AN/A
N/AN/A
N/AN/A
9,993.817 15.38
3,944.204 18.12
N/AN/A
N/AN/A
N/AN/A
N/AN/A
N/AN/A
N/AN/A
N/AN/A
N/AN/A
N/AN/A
N/AN/A
N/AN/A
N/AN/A
N/AN/A
N/AN/A
N/AN/A
2,004,280.907 10.91
N/AN/A
N/AN/A
N/AN/A
N/AN/A
USD
GEM EquityAbsolute Return
(launched as at 16April 2010)
(Formerly GlobalEmerging
Markets EquityAlpha)
N/AN/A
N/AN/A
N/AN/A
N/AN/A
N/AN/A
N/AN/A
N/AN/A
N/AN/A
N/AN/A
N/AN/A
N/AN/A
N/AN/A
N/AN/A
N/AN/A
N/AN/A
N/AN/A
N/AN/A
N/AN/A
N/AN/A
N/AN/A
N/AN/A
N/AN/A
N/AN/A
N/AN/A
N/AN/A
N/AN/A
EUR
Global BondMarket Neutral
Key Figures as at 31 March 2011
The accompanying notes form an integral part of these financial statements.
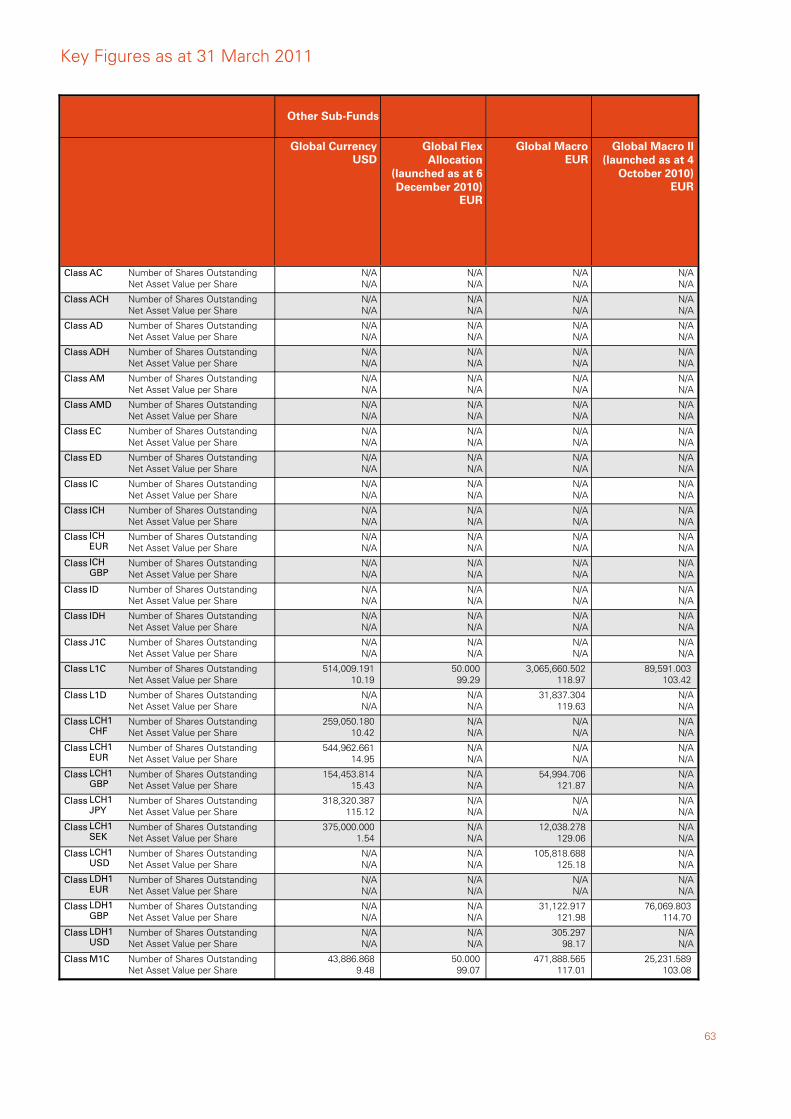
63
Class AC Number of Shares OutstandingNet Asset Value per Share
N/AN/A
Class ACH Number of Shares OutstandingNet Asset Value per Share
N/AN/A
Class AD Number of Shares OutstandingNet Asset Value per Share
N/AN/A
Class ADH Number of Shares OutstandingNet Asset Value per Share
N/AN/A
Class AM Number of Shares OutstandingNet Asset Value per Share
N/AN/A
Class AMD Number of Shares OutstandingNet Asset Value per Share
N/AN/A
Class EC Number of Shares OutstandingNet Asset Value per Share
N/AN/A
Class ED Number of Shares OutstandingNet Asset Value per Share
N/AN/A
Class IC Number of Shares OutstandingNet Asset Value per Share
N/AN/A
Class ICH Number of Shares OutstandingNet Asset Value per Share
N/AN/A
Class ICHEUR
Number of Shares OutstandingNet Asset Value per Share
N/AN/A
Class ICHGBP
Number of Shares OutstandingNet Asset Value per Share
N/AN/A
Class ID Number of Shares OutstandingNet Asset Value per Share
N/AN/A
Class IDH Number of Shares OutstandingNet Asset Value per Share
N/AN/A
Class J1C Number of Shares OutstandingNet Asset Value per Share
N/AN/A
Class L1C Number of Shares OutstandingNet Asset Value per Share
514,009.191 10.19
Class L1D Number of Shares OutstandingNet Asset Value per Share
N/AN/A
Class LCH1CHF
Number of Shares OutstandingNet Asset Value per Share
259,050.180 10.42
Class LCH1EUR
Number of Shares OutstandingNet Asset Value per Share
544,962.661 14.95
Class LCH1GBP
Number of Shares OutstandingNet Asset Value per Share
154,453.814 15.43
Class LCH1JPY
Number of Shares OutstandingNet Asset Value per Share
318,320.387 115.12
Class LCH1SEK
Number of Shares OutstandingNet Asset Value per Share
375,000.000 1.54
Class LCH1USD
Number of Shares OutstandingNet Asset Value per Share
N/AN/A
Class LDH1EUR
Number of Shares OutstandingNet Asset Value per Share
N/AN/A
Class LDH1GBP
Number of Shares OutstandingNet Asset Value per Share
N/AN/A
Class LDH1USD
Number of Shares OutstandingNet Asset Value per Share
N/AN/A
Class M1C Number of Shares OutstandingNet Asset Value per Share
43,886.868 9.48
Other Sub-Funds
USDGlobal Currency
N/AN/A
N/AN/A
N/AN/A
N/AN/A
N/AN/A
N/AN/A
N/AN/A
N/AN/A
N/AN/A
N/AN/A
N/AN/A
N/AN/A
N/AN/A
N/AN/A
N/AN/A
50.000 99.29
N/AN/A
N/AN/A
N/AN/A
N/AN/A
N/AN/A
N/AN/A
N/AN/A
N/AN/A
N/AN/A
N/AN/A
50.000 99.07
EUR
Global FlexAllocation
(launched as at 6December 2010)
N/AN/A
N/AN/A
N/AN/A
N/AN/A
N/AN/A
N/AN/A
N/AN/A
N/AN/A
N/AN/A
N/AN/A
N/AN/A
N/AN/A
N/AN/A
N/AN/A
N/AN/A
3,065,660.502 118.97
31,837.304 119.63
N/AN/A
N/AN/A
54,994.706 121.87
N/AN/A
12,038.278 129.06
105,818.688 125.18
N/AN/A
31,122.917 121.98
305.297 98.17
471,888.565 117.01
EURGlobal Macro
N/AN/A
N/AN/A
N/AN/A
N/AN/A
N/AN/A
N/AN/A
N/AN/A
N/AN/A
N/AN/A
N/AN/A
N/AN/A
N/AN/A
N/AN/A
N/AN/A
N/AN/A
89,591.003 103.42
N/AN/A
N/AN/A
N/AN/A
N/AN/A
N/AN/A
N/AN/A
N/AN/A
N/AN/A
76,069.803 114.70
N/AN/A
25,231.589 103.08
EUR
Global Macro II(launched as at 4
October 2010)
Key Figures as at 31 March 2011
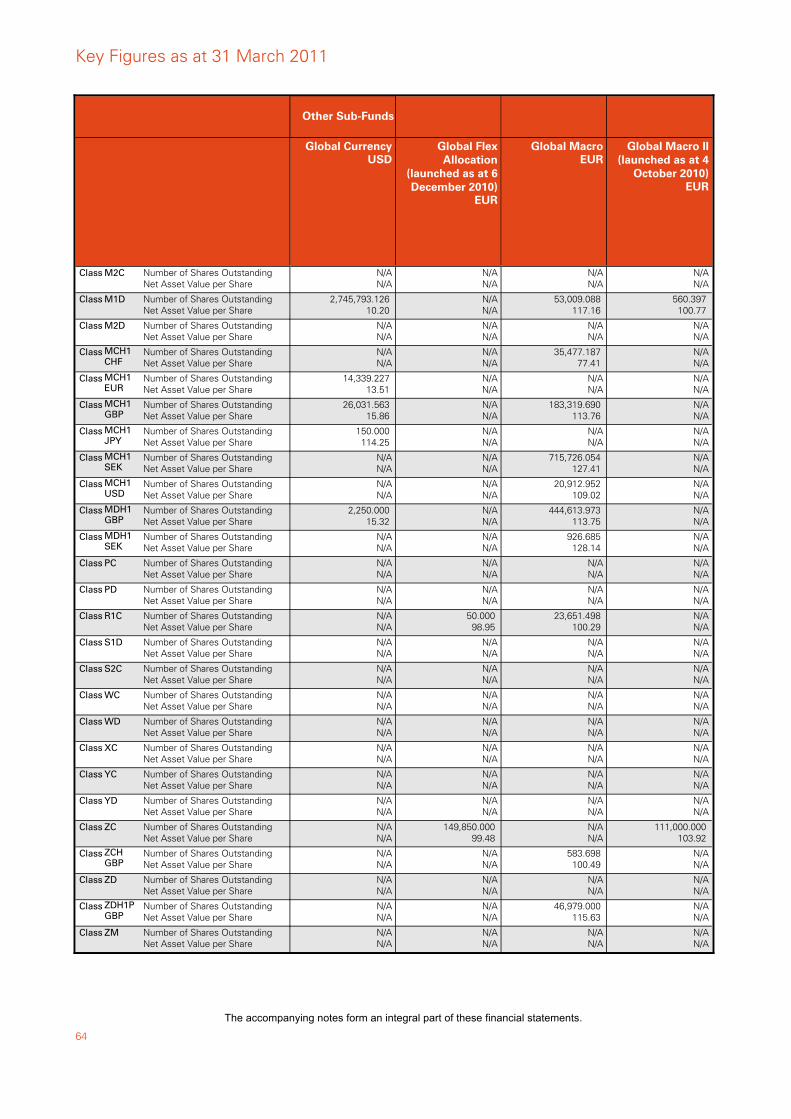
64
Class M2C Number of Shares OutstandingNet Asset Value per Share
N/AN/A
Class M1D Number of Shares OutstandingNet Asset Value per Share
2,745,793.126 10.20
Class M2D Number of Shares OutstandingNet Asset Value per Share
N/AN/A
Class MCH1CHF
Number of Shares OutstandingNet Asset Value per Share
N/AN/A
Class MCH1EUR
Number of Shares OutstandingNet Asset Value per Share
14,339.227 13.51
Class MCH1GBP
Number of Shares OutstandingNet Asset Value per Share
26,031.563 15.86
Class MCH1JPY
Number of Shares OutstandingNet Asset Value per Share
150.000 114.25
Class MCH1SEK
Number of Shares OutstandingNet Asset Value per Share
N/AN/A
Class MCH1USD
Number of Shares OutstandingNet Asset Value per Share
N/AN/A
Class MDH1GBP
Number of Shares OutstandingNet Asset Value per Share
2,250.000 15.32
Class MDH1SEK
Number of Shares OutstandingNet Asset Value per Share
N/AN/A
Class PC Number of Shares OutstandingNet Asset Value per Share
N/AN/A
Class PD Number of Shares OutstandingNet Asset Value per Share
N/AN/A
Class R1C Number of Shares OutstandingNet Asset Value per Share
N/AN/A
Class S1D Number of Shares OutstandingNet Asset Value per Share
N/AN/A
Class S2C Number of Shares OutstandingNet Asset Value per Share
N/AN/A
Class WC Number of Shares OutstandingNet Asset Value per Share
N/AN/A
Class WD Number of Shares OutstandingNet Asset Value per Share
N/AN/A
Class XC Number of Shares OutstandingNet Asset Value per Share
N/AN/A
Class YC Number of Shares OutstandingNet Asset Value per Share
N/AN/A
Class YD Number of Shares OutstandingNet Asset Value per Share
N/AN/A
Class ZC Number of Shares OutstandingNet Asset Value per Share
N/AN/A
Class ZCHGBP
Number of Shares OutstandingNet Asset Value per Share
N/AN/A
Class ZD Number of Shares OutstandingNet Asset Value per Share
N/AN/A
Class ZDH1PGBP
Number of Shares OutstandingNet Asset Value per Share
N/AN/A
Class ZM Number of Shares OutstandingNet Asset Value per Share
N/AN/A
Other Sub-Funds
USDGlobal Currency
N/AN/A
N/AN/A
N/AN/A
N/AN/A
N/AN/A
N/AN/A
N/AN/A
N/AN/A
N/AN/A
N/AN/A
N/AN/A
N/AN/A
N/AN/A
50.000 98.95
N/AN/A
N/AN/A
N/AN/A
N/AN/A
N/AN/A
N/AN/A
N/AN/A
149,850.000 99.48
N/AN/A
N/AN/A
N/AN/A
N/AN/A
EUR
Global FlexAllocation
(launched as at 6December 2010)
N/AN/A
53,009.088 117.16
N/AN/A
35,477.187 77.41
N/AN/A
183,319.690 113.76
N/AN/A
715,726.054 127.41
20,912.952 109.02
444,613.973 113.75
926.685 128.14
N/AN/A
N/AN/A
23,651.498 100.29
N/AN/A
N/AN/A
N/AN/A
N/AN/A
N/AN/A
N/AN/A
N/AN/A
N/AN/A
583.698 100.49
N/AN/A
46,979.000 115.63
N/AN/A
EURGlobal Macro
N/AN/A
560.397 100.77
N/AN/A
N/AN/A
N/AN/A
N/AN/A
N/AN/A
N/AN/A
N/AN/A
N/AN/A
N/AN/A
N/AN/A
N/AN/A
N/AN/A
N/AN/A
N/AN/A
N/AN/A
N/AN/A
N/AN/A
N/AN/A
N/AN/A
111,000.000 103.92
N/AN/A
N/AN/A
N/AN/A
N/AN/A
EUR
Global Macro II(launched as at 4
October 2010)
Key Figures as at 31 March 2011
The accompanying notes form an integral part of these financial statements.

65
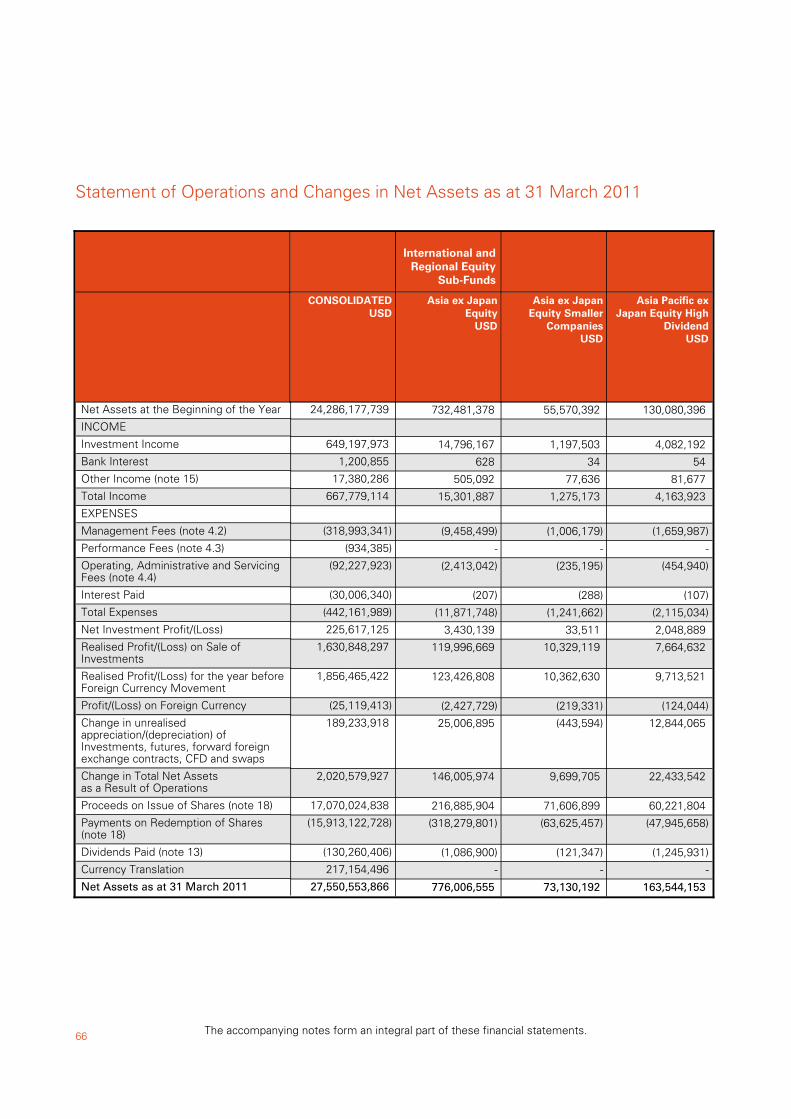
66
Statement of Operations and Changes in Net Assets as at 31 March 2011
The accompanying notes form an integral part of these financial statements.
24,286,177,739 Net Assets at the Beginning of the Year
INCOME
649,197,973 Investment Income
1,200,855 Bank Interest
17,380,286 Other Income (note 15)
667,779,114 Total Income
EXPENSES
(318,993,341)Management Fees (note 4.2)
(934,385)Performance Fees (note 4.3)
(92,227,923)Operating, Administrative and ServicingFees (note 4.4)
(30,006,340)Interest Paid
(442,161,989)Total Expenses
225,617,125 Net Investment Profit/(Loss)
1,630,848,297 Realised Profit/(Loss) on Sale ofInvestments
1,856,465,422 Realised Profit/(Loss) for the year beforeForeign Currency Movement
(25,119,413)Profit/(Loss) on Foreign Currency
189,233,918 Change in unrealisedappreciation/(depreciation) ofInvestments, futures, forward foreignexchange contracts, CFD and swaps
2,020,579,927 Change in Total Net Assets as a Result of Operations
17,070,024,838 Proceeds on Issue of Shares (note 18)
(15,913,122,728)Payments on Redemption of Shares(note 18)
(130,260,406)Dividends Paid (note 13)
217,154,496 Currency Translation
27,550,553,866 Net Assets as at 31 March 2011
CONSOLIDATEDUSD
732,481,378
14,796,167
628
505,092
15,301,887
(9,458,499)
-
(2,413,042)
(207)
(11,871,748)
3,430,139
119,996,669
123,426,808
(2,427,729)
25,006,895
146,005,974
216,885,904
(318,279,801)
(1,086,900)
-
776,006,555
International andRegional Equity
Sub-Funds
USD
Asia ex JapanEquity
55,570,392
1,197,503
34
77,636
1,275,173
(1,006,179)
-
(235,195)
(288)
(1,241,662)
33,511
10,329,119
10,362,630
(219,331)
(443,594)
9,699,705
71,606,899
(63,625,457)
(121,347)
-
73,130,192
USD
Asia ex JapanEquity Smaller
Companies
130,080,396
4,082,192
54
81,677
4,163,923
(1,659,987)
-
(454,940)
(107)
(2,115,034)
2,048,889
7,664,632
9,713,521
(124,044)
12,844,065
22,433,542
60,221,804
(47,945,658)
(1,245,931)
-
163,544,153
USD
Asia Pacific exJapan Equity High
Dividend
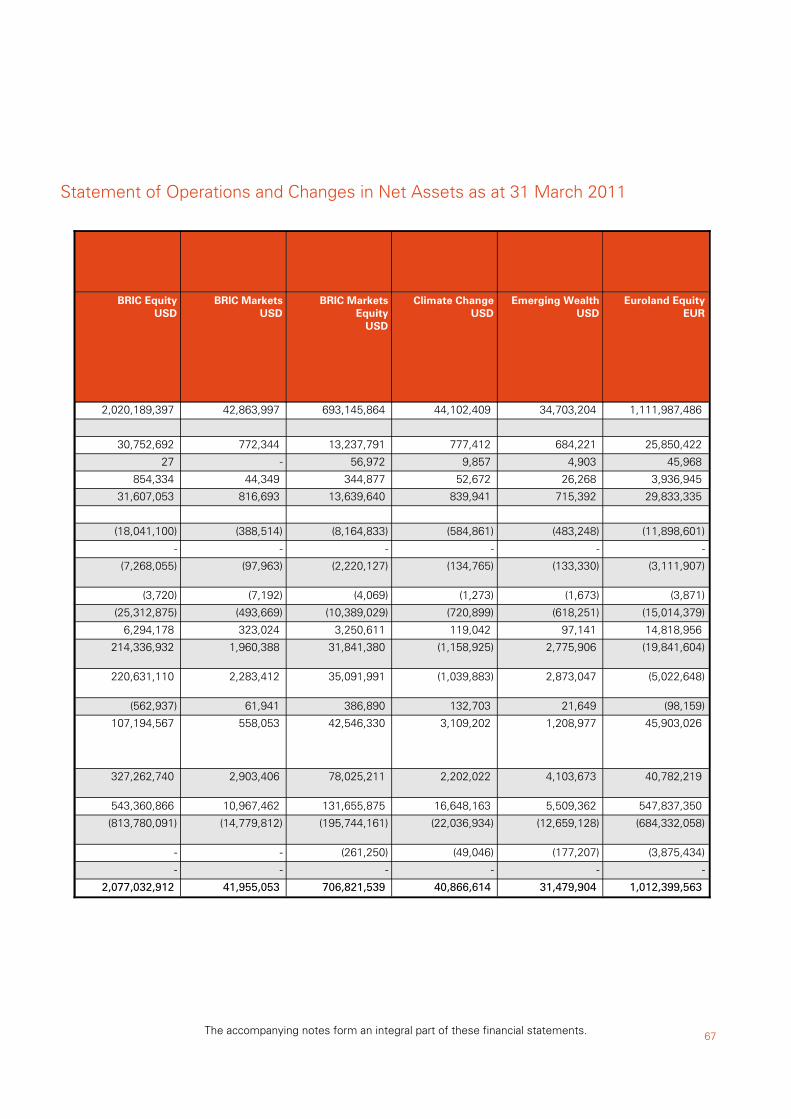
67
Statement of Operations and Changes in Net Assets as at 31 March 2011
The accompanying notes form an integral part of these financial statements.
2,020,189,397
30,752,692
27
854,334
31,607,053
(18,041,100)
-
(7,268,055)
(3,720)
(25,312,875)
6,294,178
214,336,932
220,631,110
(562,937)
107,194,567
327,262,740
543,360,866
(813,780,091)
-
-
2,077,032,912
USDBRIC Equity
42,863,997
772,344
-
44,349
816,693
(388,514)
-
(97,963)
(7,192)
(493,669)
323,024
1,960,388
2,283,412
61,941
558,053
2,903,406
10,967,462
(14,779,812)
-
-
41,955,053
USDBRIC Markets
693,145,864
13,237,791
56,972
344,877
13,639,640
(8,164,833)
-
(2,220,127)
(4,069)
(10,389,029)
3,250,611
31,841,380
35,091,991
386,890
42,546,330
78,025,211
131,655,875
(195,744,161)
(261,250)
-
706,821,539
USD
BRIC MarketsEquity
44,102,409
777,412
9,857
52,672
839,941
(584,861)
-
(134,765)
(1,273)
(720,899)
119,042
(1,158,925)
(1,039,883)
132,703
3,109,202
2,202,022
16,648,163
(22,036,934)
(49,046)
-
40,866,614
USDClimate Change
34,703,204
684,221
4,903
26,268
715,392
(483,248)
-
(133,330)
(1,673)
(618,251)
97,141
2,775,906
2,873,047
21,649
1,208,977
4,103,673
5,509,362
(12,659,128)
(177,207)
-
31,479,904
USDEmerging Wealth
1,111,987,486
25,850,422
45,968
3,936,945
29,833,335
(11,898,601)
-
(3,111,907)
(3,871)
(15,014,379)
14,818,956
(19,841,604)
(5,022,648)
(98,159)
45,903,026
40,782,219
547,837,350
(684,332,058)
(3,875,434)
-
1,012,399,563
EUREuroland Equity

68
Statement of Operations and Changes in Net Assets as at 31 March 2011
The accompanying notes form an integral part of these financial statements.
69,348,554 Net Assets at the Beginning of the Year
INCOME
1,218,581 Investment Income
4,151 Bank Interest
178,466 Other Income (note 15)
1,401,198 Total Income
EXPENSES
(915,738)Management Fees (note 4.2)
-Performance Fees (note 4.3)
(227,909)Operating, Administrative and ServicingFees (note 4.4)
-Interest Paid
(1,143,647)Total Expenses
257,551 Net Investment Profit/(Loss)
10,873,103 Realised Profit/(Loss) on Sale ofInvestments
11,130,654 Realised Profit/(Loss) for the year beforeForeign Currency Movement
(41,845)Profit/(Loss) on Foreign Currency
(155,771)Change in unrealisedappreciation/(depreciation) ofInvestments, futures, forward foreignexchange contracts, CFD and swaps
10,933,038 Change in Total Net Assets as a Result of Operations
47,825,205 Proceeds on Issue of Shares (note 18)
(56,027,302)Payments on Redemption of Shares(note 18)
(50,919)Dividends Paid (note 13)
-Currency Translation
72,028,576 Net Assets as at 31 March 2011
EUR
Euroland EquitySmaller
Companies
125,960,642
3,201,911
7,916
512,225
3,722,052
(867,159)
-
(287,755)
-
(1,154,914)
2,567,138
(6,717,177)
(4,150,039)
(33,994)
7,176,863
2,992,830
16,831,219
(55,251,749)
(40,667)
-
90,492,275
EUREuroland Growth
112,787,066
3,391,537
1,967
351,493
3,744,997
(1,128,917)
-
(381,457)
(156)
(1,510,530)
2,234,467
6,899,351
9,133,818
(168,533)
(431,879)
8,533,406
99,408,658
(98,263,622)
(1,864,743)
-
120,600,765
EUREuropean Equity
13,979,295
307,449
116
9,633
317,198
(143,187)
-
(35,811)
(133)
(179,131)
138,067
2,446,598
2,584,665
(10,580)
(576,642)
1,997,443
-
(1,999,993)
-
-
13,976,745
USD
Global EmergingMarkets Elite
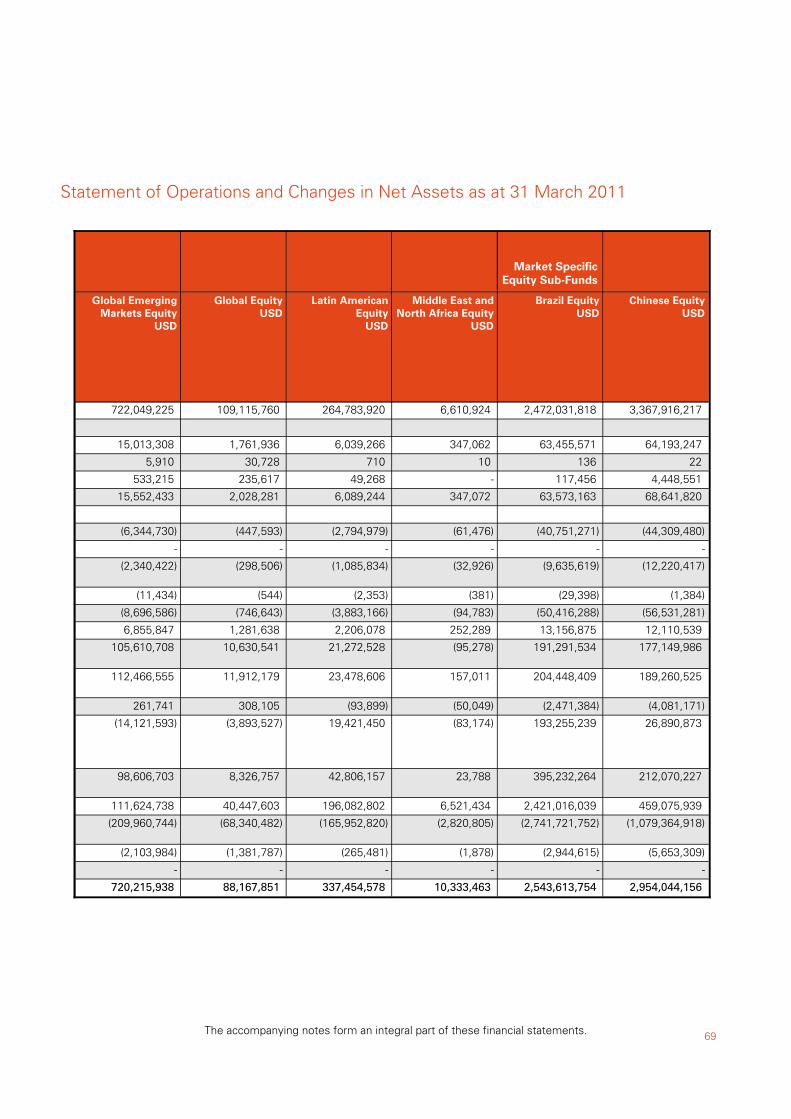
69
Statement of Operations and Changes in Net Assets as at 31 March 2011
The accompanying notes form an integral part of these financial statements.
722,049,225
15,013,308
5,910
533,215
15,552,433
(6,344,730)
-
(2,340,422)
(11,434)
(8,696,586)
6,855,847
105,610,708
112,466,555
261,741
(14,121,593)
98,606,703
111,624,738
(209,960,744)
(2,103,984)
-
720,215,938
USD
Global EmergingMarkets Equity
109,115,760
1,761,936
30,728
235,617
2,028,281
(447,593)
-
(298,506)
(544)
(746,643)
1,281,638
10,630,541
11,912,179
308,105
(3,893,527)
8,326,757
40,447,603
(68,340,482)
(1,381,787)
-
88,167,851
USDGlobal Equity
264,783,920
6,039,266
710
49,268
6,089,244
(2,794,979)
-
(1,085,834)
(2,353)
(3,883,166)
2,206,078
21,272,528
23,478,606
(93,899)
19,421,450
42,806,157
196,082,802
(165,952,820)
(265,481)
-
337,454,578
USD
Latin AmericanEquity
6,610,924
347,062
10
-
347,072
(61,476)
-
(32,926)
(381)
(94,783)
252,289
(95,278)
157,011
(50,049)
(83,174)
23,788
6,521,434
(2,820,805)
(1,878)
-
10,333,463
USD
Middle East andNorth Africa Equity
2,472,031,818
63,455,571
136
117,456
63,573,163
(40,751,271)
-
(9,635,619)
(29,398)
(50,416,288)
13,156,875
191,291,534
204,448,409
(2,471,384)
193,255,239
395,232,264
2,421,016,039
(2,741,721,752)
(2,944,615)
-
2,543,613,754
Market SpecificEquity Sub-Funds
USDBrazil Equity
3,367,916,217
64,193,247
22
4,448,551
68,641,820
(44,309,480)
-
(12,220,417)
(1,384)
(56,531,281)
12,110,539
177,149,986
189,260,525
(4,081,171)
26,890,873
212,070,227
459,075,939
(1,079,364,918)
(5,653,309)
-
2,954,044,156
USDChinese Equity
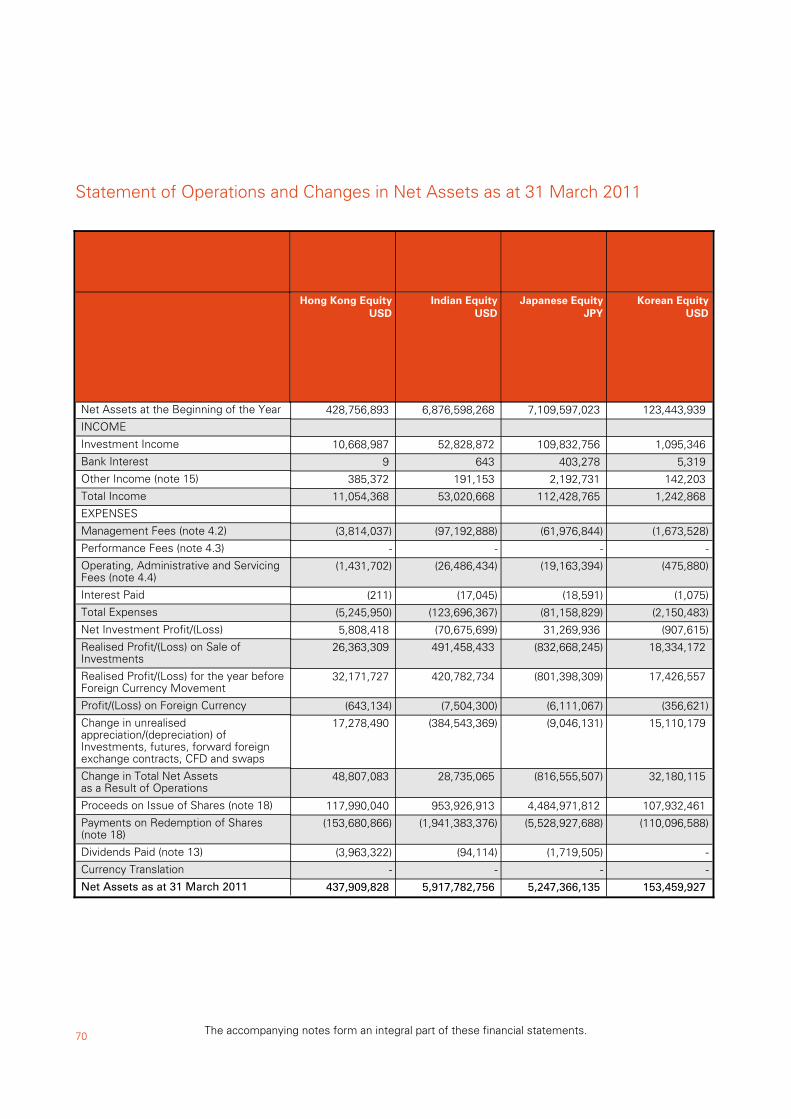
70
Statement of Operations and Changes in Net Assets as at 31 March 2011
The accompanying notes form an integral part of these financial statements.
428,756,893 Net Assets at the Beginning of the Year
INCOME
10,668,987 Investment Income
9 Bank Interest
385,372 Other Income (note 15)
11,054,368 Total Income
EXPENSES
(3,814,037)Management Fees (note 4.2)
-Performance Fees (note 4.3)
(1,431,702)Operating, Administrative and ServicingFees (note 4.4)
(211)Interest Paid
(5,245,950)Total Expenses
5,808,418 Net Investment Profit/(Loss)
26,363,309 Realised Profit/(Loss) on Sale ofInvestments
32,171,727 Realised Profit/(Loss) for the year beforeForeign Currency Movement
(643,134)Profit/(Loss) on Foreign Currency
17,278,490 Change in unrealisedappreciation/(depreciation) ofInvestments, futures, forward foreignexchange contracts, CFD and swaps
48,807,083 Change in Total Net Assets as a Result of Operations
117,990,040 Proceeds on Issue of Shares (note 18)
(153,680,866)Payments on Redemption of Shares(note 18)
(3,963,322)Dividends Paid (note 13)
-Currency Translation
437,909,828 Net Assets as at 31 March 2011
USDHong Kong Equity
6,876,598,268
52,828,872
643
191,153
53,020,668
(97,192,888)
-
(26,486,434)
(17,045)
(123,696,367)
(70,675,699)
491,458,433
420,782,734
(7,504,300)
(384,543,369)
28,735,065
953,926,913
(1,941,383,376)
(94,114)
-
5,917,782,756
USDIndian Equity
7,109,597,023
109,832,756
403,278
2,192,731
112,428,765
(61,976,844)
-
(19,163,394)
(18,591)
(81,158,829)
31,269,936
(832,668,245)
(801,398,309)
(6,111,067)
(9,046,131)
(816,555,507)
4,484,971,812
(5,528,927,688)
(1,719,505)
-
5,247,366,135
JPYJapanese Equity
123,443,939
1,095,346
5,319
142,203
1,242,868
(1,673,528)
-
(475,880)
(1,075)
(2,150,483)
(907,615)
18,334,172
17,426,557
(356,621)
15,110,179
32,180,115
107,932,461
(110,096,588)
-
-
153,459,927
USDKorean Equity
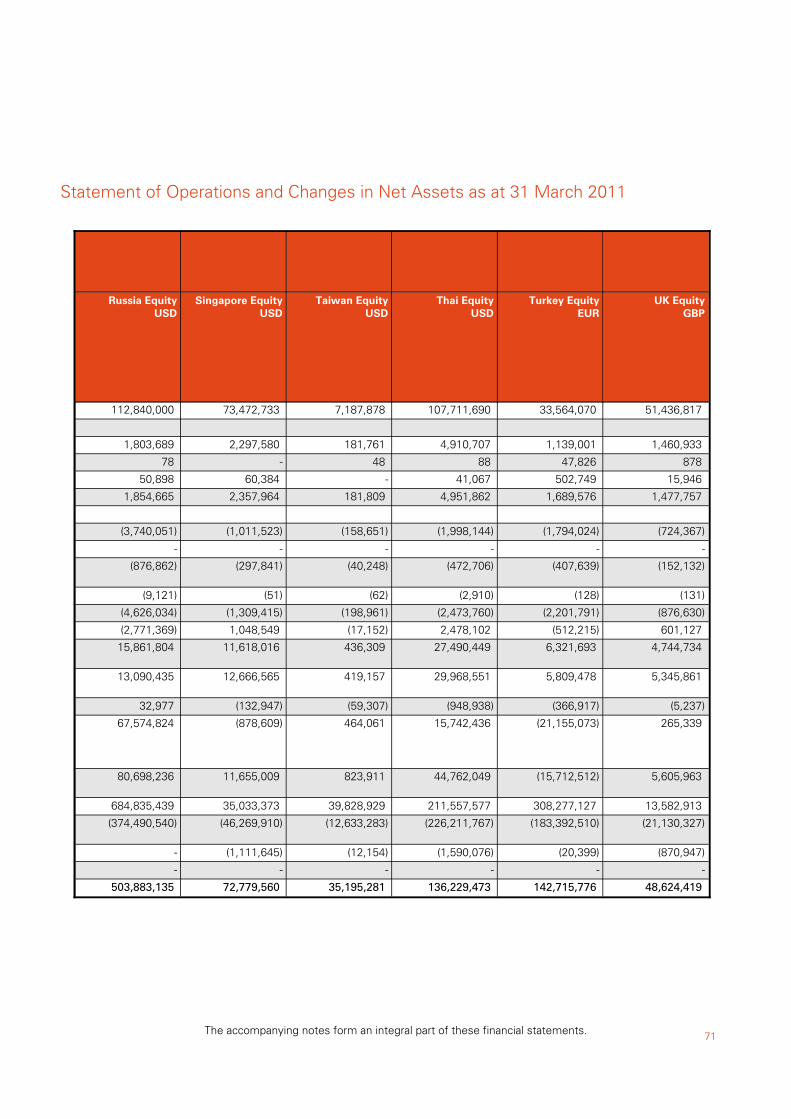
71
Statement of Operations and Changes in Net Assets as at 31 March 2011
The accompanying notes form an integral part of these financial statements.
112,840,000
1,803,689
78
50,898
1,854,665
(3,740,051)
-
(876,862)
(9,121)
(4,626,034)
(2,771,369)
15,861,804
13,090,435
32,977
67,574,824
80,698,236
684,835,439
(374,490,540)
-
-
503,883,135
USDRussia Equity
73,472,733
2,297,580
-
60,384
2,357,964
(1,011,523)
-
(297,841)
(51)
(1,309,415)
1,048,549
11,618,016
12,666,565
(132,947)
(878,609)
11,655,009
35,033,373
(46,269,910)
(1,111,645)
-
72,779,560
USDSingapore Equity
7,187,878
181,761
48
-
181,809
(158,651)
-
(40,248)
(62)
(198,961)
(17,152)
436,309
419,157
(59,307)
464,061
823,911
39,828,929
(12,633,283)
(12,154)
-
35,195,281
USDTaiwan Equity
107,711,690
4,910,707
88
41,067
4,951,862
(1,998,144)
-
(472,706)
(2,910)
(2,473,760)
2,478,102
27,490,449
29,968,551
(948,938)
15,742,436
44,762,049
211,557,577
(226,211,767)
(1,590,076)
-
136,229,473
USDThai Equity
33,564,070
1,139,001
47,826
502,749
1,689,576
(1,794,024)
-
(407,639)
(128)
(2,201,791)
(512,215)
6,321,693
5,809,478
(366,917)
(21,155,073)
(15,712,512)
308,277,127
(183,392,510)
(20,399)
-
142,715,776
EURTurkey Equity
51,436,817
1,460,933
878
15,946
1,477,757
(724,367)
-
(152,132)
(131)
(876,630)
601,127
4,744,734
5,345,861
(5,237)
265,339
5,605,963
13,582,913
(21,130,327)
(870,947)
-
48,624,419
GBPUK Equity
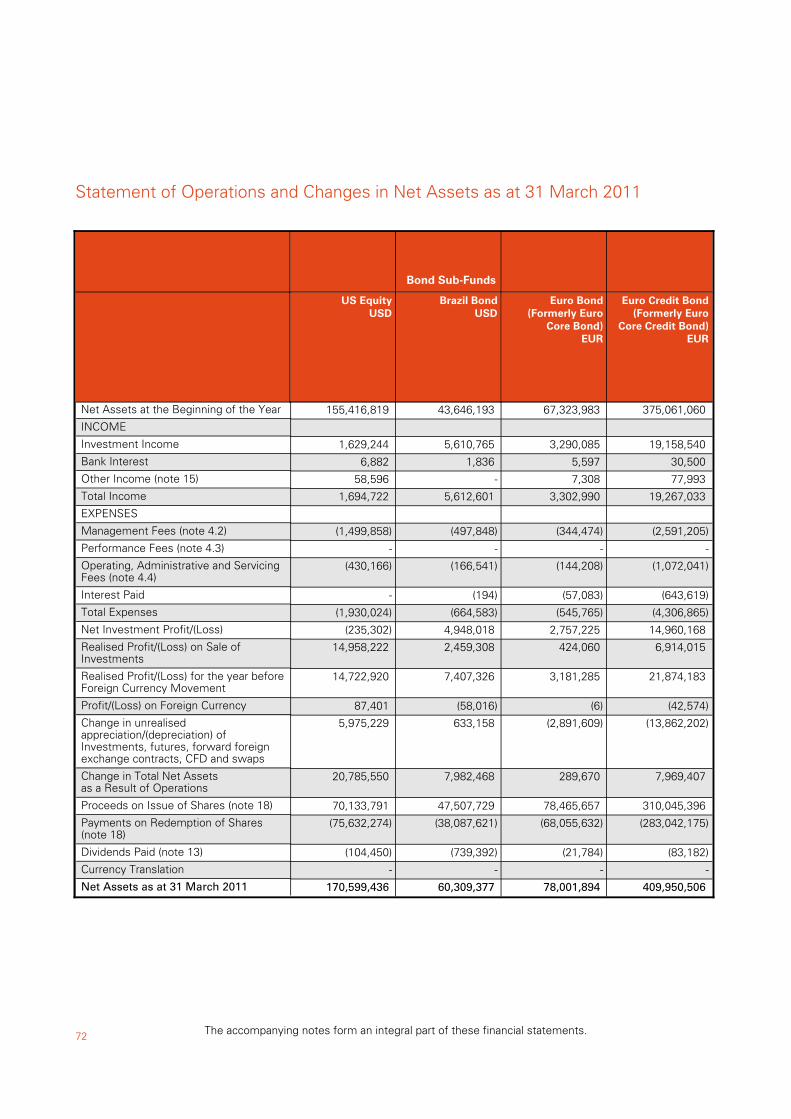
72
Statement of Operations and Changes in Net Assets as at 31 March 2011
The accompanying notes form an integral part of these financial statements.
155,416,819 Net Assets at the Beginning of the Year
INCOME
1,629,244 Investment Income
6,882 Bank Interest
58,596 Other Income (note 15)
1,694,722 Total Income
EXPENSES
(1,499,858)Management Fees (note 4.2)
-Performance Fees (note 4.3)
(430,166)Operating, Administrative and ServicingFees (note 4.4)
-Interest Paid
(1,930,024)Total Expenses
(235,302)Net Investment Profit/(Loss)
14,958,222 Realised Profit/(Loss) on Sale ofInvestments
14,722,920 Realised Profit/(Loss) for the year beforeForeign Currency Movement
87,401 Profit/(Loss) on Foreign Currency
5,975,229 Change in unrealisedappreciation/(depreciation) ofInvestments, futures, forward foreignexchange contracts, CFD and swaps
20,785,550 Change in Total Net Assets as a Result of Operations
70,133,791 Proceeds on Issue of Shares (note 18)
(75,632,274)Payments on Redemption of Shares(note 18)
(104,450)Dividends Paid (note 13)
-Currency Translation
170,599,436 Net Assets as at 31 March 2011
USDUS Equity
43,646,193
5,610,765
1,836
-
5,612,601
(497,848)
-
(166,541)
(194)
(664,583)
4,948,018
2,459,308
7,407,326
(58,016)
633,158
7,982,468
47,507,729
(38,087,621)
(739,392)
-
60,309,377
Bond Sub-Funds
USDBrazil Bond
67,323,983
3,290,085
5,597
7,308
3,302,990
(344,474)
-
(144,208)
(57,083)
(545,765)
2,757,225
424,060
3,181,285
(6)
(2,891,609)
289,670
78,465,657
(68,055,632)
(21,784)
-
78,001,894
EUR
Euro Bond(Formerly Euro
Core Bond)
375,061,060
19,158,540
30,500
77,993
19,267,033
(2,591,205)
-
(1,072,041)
(643,619)
(4,306,865)
14,960,168
6,914,015
21,874,183
(42,574)
(13,862,202)
7,969,407
310,045,396
(283,042,175)
(83,182)
-
409,950,506
EUR
Euro Credit Bond(Formerly Euro
Core Credit Bond)
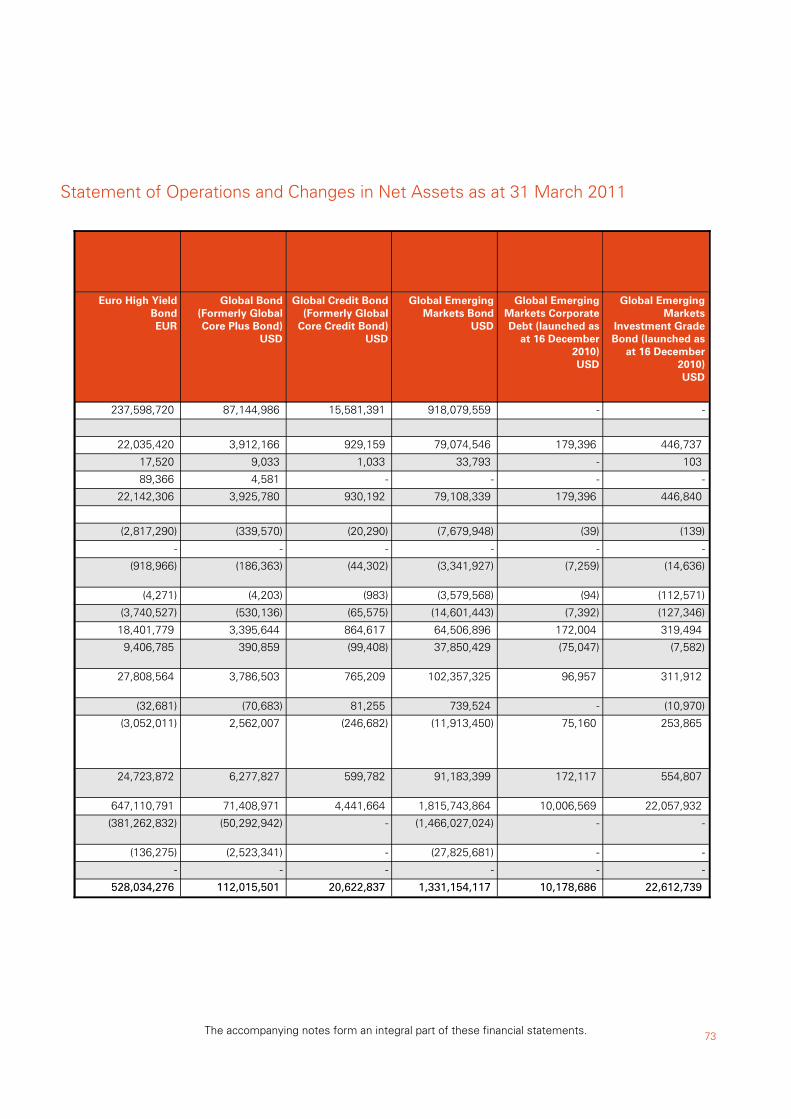
73
Statement of Operations and Changes in Net Assets as at 31 March 2011
The accompanying notes form an integral part of these financial statements.
237,598,720
22,035,420
17,520
89,366
22,142,306
(2,817,290)
-
(918,966)
(4,271)
(3,740,527)
18,401,779
9,406,785
27,808,564
(32,681)
(3,052,011)
24,723,872
647,110,791
(381,262,832)
(136,275)
-
528,034,276
EUR
Euro High YieldBond
87,144,986
3,912,166
9,033
4,581
3,925,780
(339,570)
-
(186,363)
(4,203)
(530,136)
3,395,644
390,859
3,786,503
(70,683)
2,562,007
6,277,827
71,408,971
(50,292,942)
(2,523,341)
-
112,015,501
USD
Global Bond(Formerly GlobalCore Plus Bond)
15,581,391
929,159
1,033
-
930,192
(20,290)
-
(44,302)
(983)
(65,575)
864,617
(99,408)
765,209
81,255
(246,682)
599,782
4,441,664
-
-
-
20,622,837
USD
Global Credit Bond(Formerly Global
Core Credit Bond)
918,079,559
79,074,546
33,793
-
79,108,339
(7,679,948)
-
(3,341,927)
(3,579,568)
(14,601,443)
64,506,896
37,850,429
102,357,325
739,524
(11,913,450)
91,183,399
1,815,743,864
(1,466,027,024)
(27,825,681)
-
1,331,154,117
USD
Global EmergingMarkets Bond
-
179,396
-
-
179,396
(39)
-
(7,259)
(94)
(7,392)
172,004
(75,047)
96,957
-
75,160
172,117
10,006,569
-
-
-
10,178,686
USD
Global EmergingMarkets CorporateDebt (launched as
at 16 December2010)
-
446,737
103
-
446,840
(139)
-
(14,636)
(112,571)
(127,346)
319,494
(7,582)
311,912
(10,970)
253,865
554,807
22,057,932
-
-
-
22,612,739
USD
Global EmergingMarkets
Investment GradeBond (launched as
at 16 December2010)
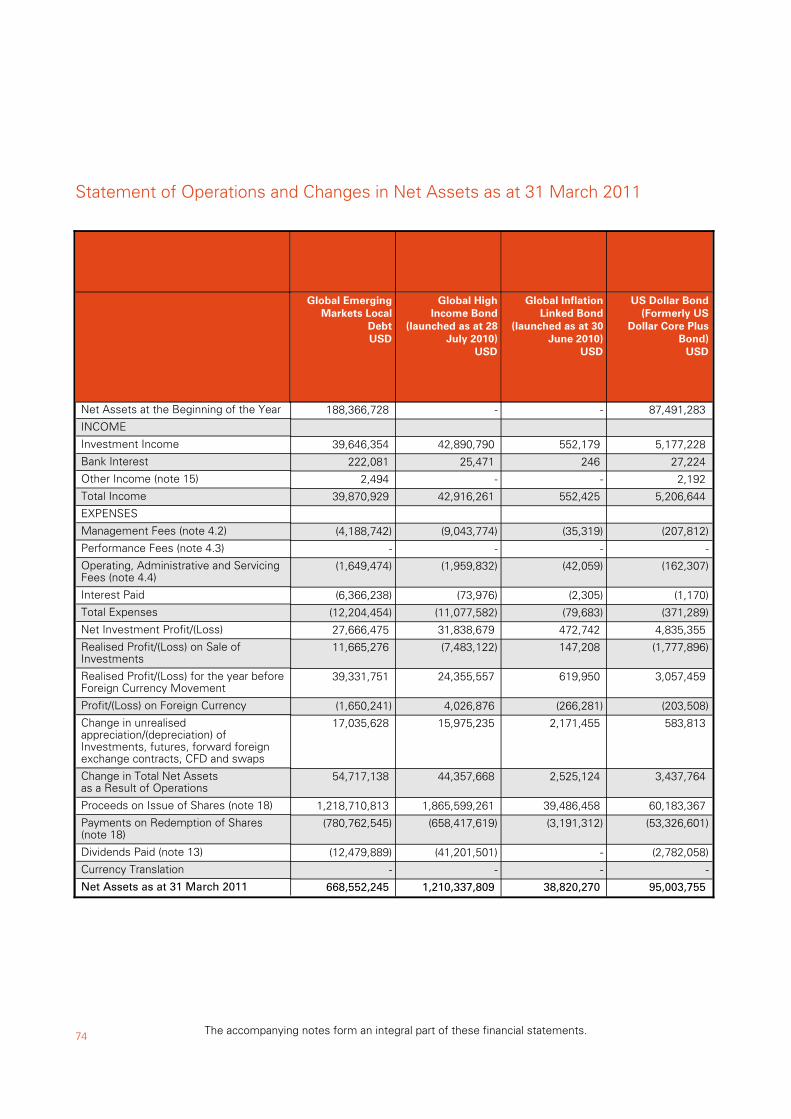
74
Statement of Operations and Changes in Net Assets as at 31 March 2011
The accompanying notes form an integral part of these financial statements.
188,366,728 Net Assets at the Beginning of the Year
INCOME
39,646,354 Investment Income
222,081 Bank Interest
2,494 Other Income (note 15)
39,870,929 Total Income
EXPENSES
(4,188,742)Management Fees (note 4.2)
-Performance Fees (note 4.3)
(1,649,474)Operating, Administrative and ServicingFees (note 4.4)
(6,366,238)Interest Paid
(12,204,454)Total Expenses
27,666,475 Net Investment Profit/(Loss)
11,665,276 Realised Profit/(Loss) on Sale ofInvestments
39,331,751 Realised Profit/(Loss) for the year beforeForeign Currency Movement
(1,650,241)Profit/(Loss) on Foreign Currency
17,035,628 Change in unrealisedappreciation/(depreciation) ofInvestments, futures, forward foreignexchange contracts, CFD and swaps
54,717,138 Change in Total Net Assets as a Result of Operations
1,218,710,813 Proceeds on Issue of Shares (note 18)
(780,762,545)Payments on Redemption of Shares(note 18)
(12,479,889)Dividends Paid (note 13)
-Currency Translation
668,552,245 Net Assets as at 31 March 2011
USD
Global EmergingMarkets Local
Debt
-
42,890,790
25,471
-
42,916,261
(9,043,774)
-
(1,959,832)
(73,976)
(11,077,582)
31,838,679
(7,483,122)
24,355,557
4,026,876
15,975,235
44,357,668
1,865,599,261
(658,417,619)
(41,201,501)
-
1,210,337,809
USD
Global HighIncome Bond
(launched as at 28July 2010)
-
552,179
246
-
552,425
(35,319)
-
(42,059)
(2,305)
(79,683)
472,742
147,208
619,950
(266,281)
2,171,455
2,525,124
39,486,458
(3,191,312)
-
-
38,820,270
USD
Global InflationLinked Bond
(launched as at 30June 2010)
87,491,283
5,177,228
27,224
2,192
5,206,644
(207,812)
-
(162,307)
(1,170)
(371,289)
4,835,355
(1,777,896)
3,057,459
(203,508)
583,813
3,437,764
60,183,367
(53,326,601)
(2,782,058)
-
95,003,755
USD
US Dollar Bond(Formerly US
Dollar Core PlusBond)
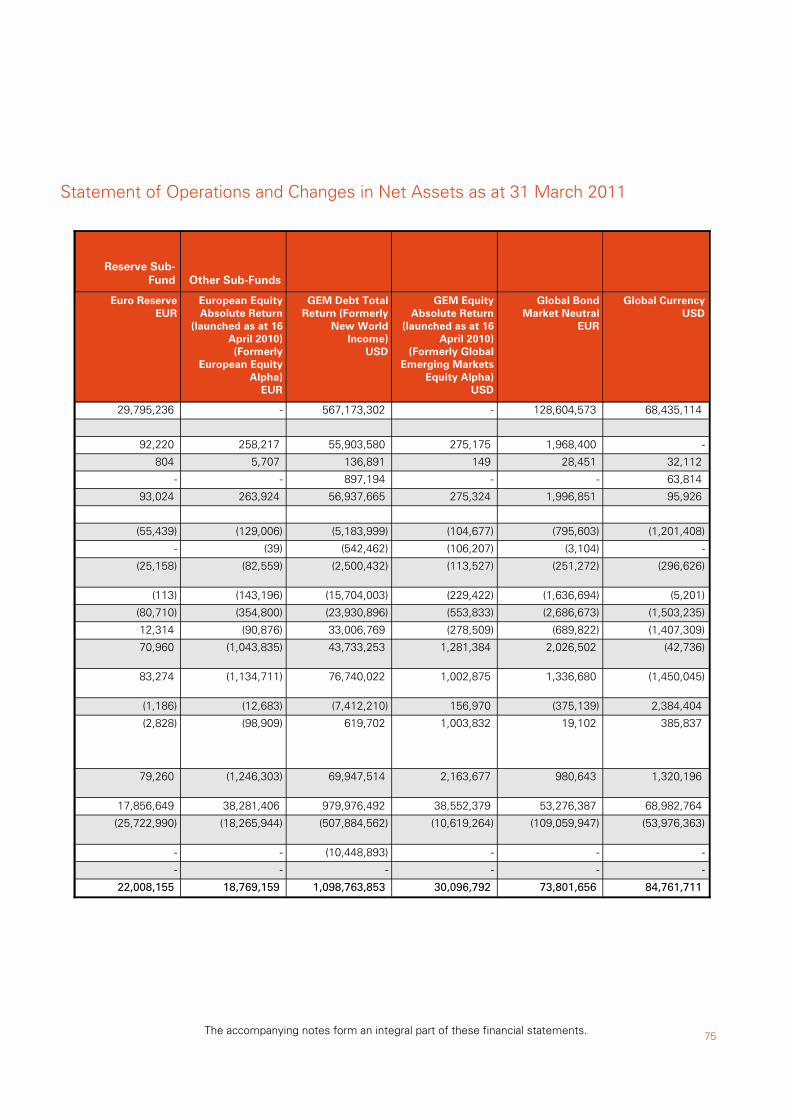
75
Statement of Operations and Changes in Net Assets as at 31 March 2011
The accompanying notes form an integral part of these financial statements.
29,795,236
92,220
804
-
93,024
(55,439)
-
(25,158)
(113)
(80,710)
12,314
70,960
83,274
(1,186)
(2,828)
79,260
17,856,649
(25,722,990)
-
-
22,008,155
Reserve Sub-Fund
EUREuro Reserve
-
258,217
5,707
-
263,924
(129,006)
(39)
(82,559)
(143,196)
(354,800)
(90,876)
(1,043,835)
(1,134,711)
(12,683)
(98,909)
(1,246,303)
38,281,406
(18,265,944)
-
-
18,769,159
Other Sub-Funds
EUR
European EquityAbsolute Return
(launched as at 16April 2010)(Formerly
European EquityAlpha)
567,173,302
55,903,580
136,891
897,194
56,937,665
(5,183,999)
(542,462)
(2,500,432)
(15,704,003)
(23,930,896)
33,006,769
43,733,253
76,740,022
(7,412,210)
619,702
69,947,514
979,976,492
(507,884,562)
(10,448,893)
-
1,098,763,853
USD
GEM Debt TotalReturn (Formerly
New WorldIncome)
-
275,175
149
-
275,324
(104,677)
(106,207)
(113,527)
(229,422)
(553,833)
(278,509)
1,281,384
1,002,875
156,970
1,003,832
2,163,677
38,552,379
(10,619,264)
-
-
30,096,792
USD
GEM EquityAbsolute Return
(launched as at 16April 2010)
(Formerly GlobalEmerging Markets
Equity Alpha)
128,604,573
1,968,400
28,451
-
1,996,851
(795,603)
(3,104)
(251,272)
(1,636,694)
(2,686,673)
(689,822)
2,026,502
1,336,680
(375,139)
19,102
980,643
53,276,387
(109,059,947)
-
-
73,801,656
EUR
Global BondMarket Neutral
68,435,114
-
32,112
63,814
95,926
(1,201,408)
-
(296,626)
(5,201)
(1,503,235)
(1,407,309)
(42,736)
(1,450,045)
2,384,404
385,837
1,320,196
68,982,764
(53,976,363)
-
-
84,761,711
USDGlobal Currency
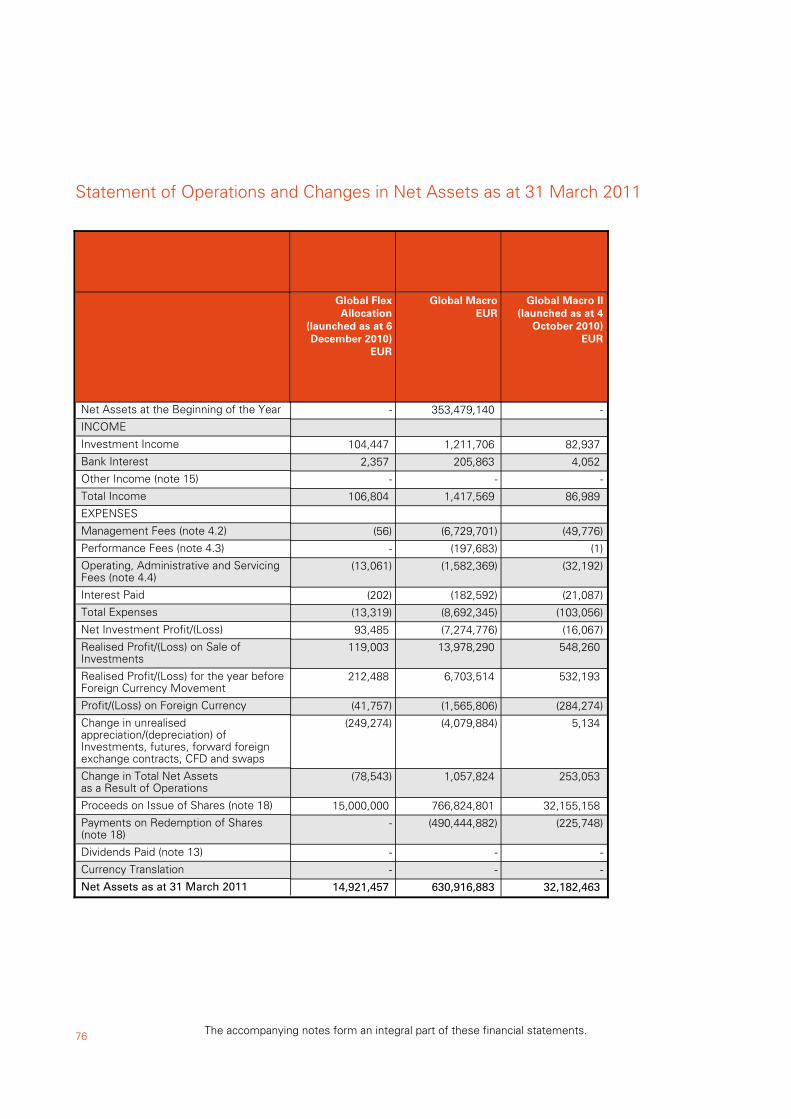
76
Statement of Operations and Changes in Net Assets as at 31 March 2011
The accompanying notes form an integral part of these financial statements.
-Net Assets at the Beginning of the Year
INCOME
104,447 Investment Income
2,357 Bank Interest
-Other Income (note 15)
106,804 Total Income
EXPENSES
(56)Management Fees (note 4.2)
-Performance Fees (note 4.3)
(13,061)Operating, Administrative and ServicingFees (note 4.4)
(202)Interest Paid
(13,319)Total Expenses
93,485 Net Investment Profit/(Loss)
119,003 Realised Profit/(Loss) on Sale ofInvestments
212,488 Realised Profit/(Loss) for the year beforeForeign Currency Movement
(41,757)Profit/(Loss) on Foreign Currency
(249,274)Change in unrealisedappreciation/(depreciation) ofInvestments, futures, forward foreignexchange contracts, CFD and swaps
(78,543)Change in Total Net Assets as a Result of Operations
15,000,000 Proceeds on Issue of Shares (note 18)
-Payments on Redemption of Shares(note 18)
-Dividends Paid (note 13)
-Currency Translation
14,921,457 Net Assets as at 31 March 2011
EUR
Global FlexAllocation
(launched as at 6December 2010)
353,479,140
1,211,706
205,863
-
1,417,569
(6,729,701)
(197,683)
(1,582,369)
(182,592)
(8,692,345)
(7,274,776)
13,978,290
6,703,514
(1,565,806)
(4,079,884)
1,057,824
766,824,801
(490,444,882)
-
-
630,916,883
EURGlobal Macro
-
82,937
4,052
-
86,989
(49,776)
(1)
(32,192)
(21,087)
(103,056)
(16,067)
548,260
532,193
(284,274)
5,134
253,053
32,155,158
(225,748)
-
-
32,182,463
EUR
Global Macro II(launched as at 4
October 2010)
Notes to the Financial Statements
77
1. Basis of presentation
HSBC Global Investment Funds (the “Company”) is incorporated under the laws of the Grand Duchy of Luxembourg as an investment company with variable capital (Société d’Investissement à Capital Variable or “SICAV”). The capital comprises various Classes of Shares each relating to a separate portfolio (a “sub-fund”) consisting of securities, cash and other sundry assets and liabilities. The accompanying financial statements present the assets and liabilities of the individual sub-funds and of the Company taken as a whole. The financial statements of each individual sub-fund are expressed in the currency designated in the Prospectus for that particular sub-fund and the financial statements of the Company are expressed in United States Dollars (USD). The financial statements have been prepared in accordance with the format prescribed by the Luxembourg authorities for Luxembourg investment companies.
The Company is an officially registered investment fund under Part I of the law of 20 December 2002 (the “2002 Law”) and has been certified as a UCITS fund under the directive 85/611/CEE of the Council of Europe.
Certain sub-funds of the Company are authorised by the Hong Kong Securities and Futures Commission under Section 104 of the “Securities and Futures Ordinance”.
In the Prospectus and in the various reports, the short names of the sub-funds are used. The complete name of each sub-fund consists of “HSBC Global Investment Funds” plus the short name of the sub-fund.
From 1 April 2010 to 31 March 2011: 1) The following sub-funds were open:
• European Equity Absolute Return on 16 April 2010. • GEM Equity Absolute Return on 16 April 2010. • Global Inflation Linked Bond on 30 June 2010. • Global High Income Bond on 28 July 2010. • Global Macro II on 4 October 2010. • Global Flex Allocation on 6 December 2010. • Global Emerging Markets Corporate Debt on 16 December 2010. • Global Emerging Markets Investment Grade Bond on 16 December 2010. 2) The following sub-funds changed their names: • Euro Core Bond changed its name to Euro Bond. • Euro Core Credit Bond changed its name to Euro Credit Bond. • Global Core Credit Bond changed its name to Global Credit Bond. • Global Core Plus Bond changed its name to Global Bond. • US Dollar Core Plus Bond changed its name to US Dollar Bond. • New World Income changed its name to GEM Debt Total Return. • European Equity Alpha changed its name to European Equity Absolute Return. • Global Emerging Markets Equity Alpha changed its name to GEM Equity Absolute Return.
3) The changes in investment advisers:
The investment adviser of the sub-fund Japanese Equity has changed from Sinopia Asset Management (Asia Pacific) Limited to Sinopia Asset Management (UK) Limited as at 20 December 2010.
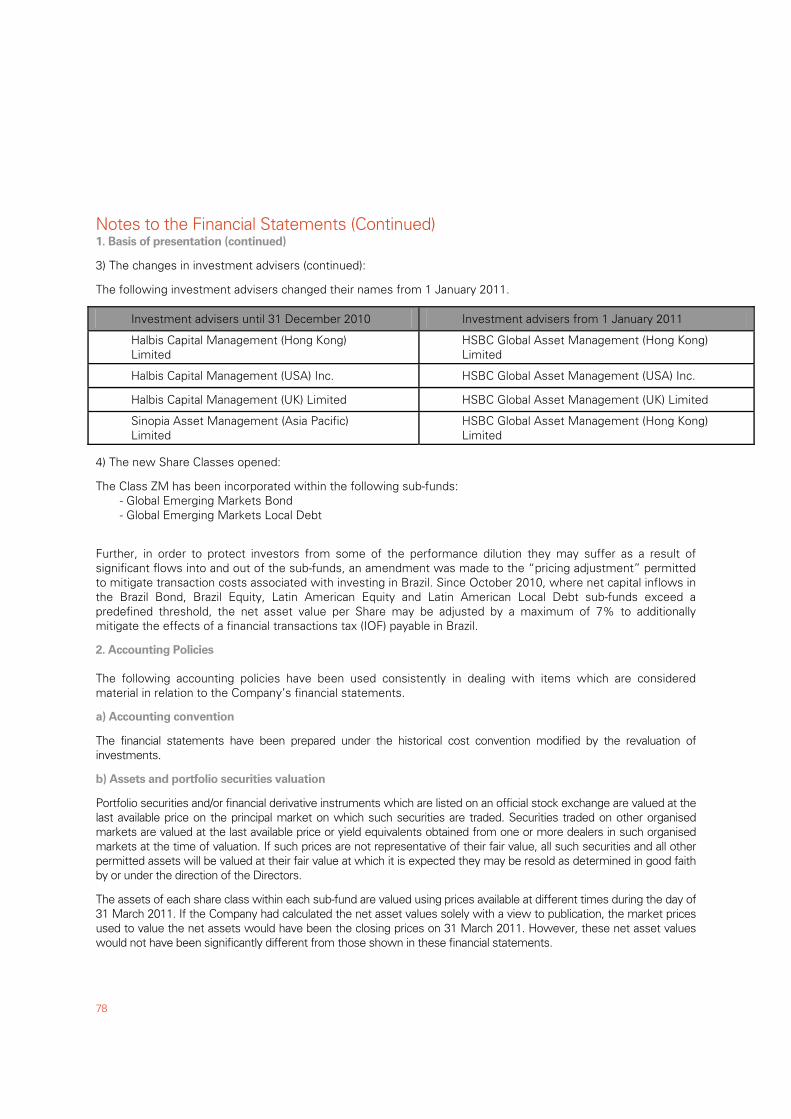
Notes to the Financial Statements (Continued)
78
1. Basis of presentation (continued)
3) The changes in investment advisers (continued):
The following investment advisers changed their names from 1 January 2011.
Investment advisers until 31 December 2010 Investment advisers from 1 January 2011
Halbis Capital Management (Hong Kong) Limited
HSBC Global Asset Management (Hong Kong) Limited
Halbis Capital Management (USA) Inc. HSBC Global Asset Management (USA) Inc.
Halbis Capital Management (UK) Limited HSBC Global Asset Management (UK) Limited
Sinopia Asset Management (Asia Pacific) Limited
HSBC Global Asset Management (Hong Kong) Limited
4) The new Share Classes opened:
The Class ZM has been incorporated within the following sub-funds: - Global Emerging Markets Bond - Global Emerging Markets Local Debt
Further, in order to protect investors from some of the performance dilution they may suffer as a result of significant flows into and out of the sub-funds, an amendment was made to the “pricing adjustment” permitted to mitigate transaction costs associated with investing in Brazil. Since October 2010, where net capital inflows in the Brazil Bond, Brazil Equity, Latin American Equity and Latin American Local Debt sub-funds exceed a predefined threshold, the net asset value per Share may be adjusted by a maximum of 7% to additionally mitigate the effects of a financial transactions tax (IOF) payable in Brazil.
2. Accounting Policies
The following accounting policies have been used consistently in dealing with items which are considered material in relation to the Company’s financial statements.
a) Accounting convention
The financial statements have been prepared under the historical cost convention modified by the revaluation of investments.
b) Assets and portfolio securities valuation
Portfolio securities and/or financial derivative instruments which are listed on an official stock exchange are valued at the last available price on the principal market on which such securities are traded. Securities traded on other organised markets are valued at the last available price or yield equivalents obtained from one or more dealers in such organised markets at the time of valuation. If such prices are not representative of their fair value, all such securities and all other permitted assets will be valued at their fair value at which it is expected they may be resold as determined in good faith by or under the direction of the Directors.
The assets of each share class within each sub-fund are valued using prices available at different times during the day of 31 March 2011. If the Company had calculated the net asset values solely with a view to publication, the market prices used to value the net assets would have been the closing prices on 31 March 2011. However, these net asset values would not have been significantly different from those shown in these financial statements.
Notes to the Financial Statements (Continued)
79
1. Basis of presentation (continued)
2. Accounting Policies (continued)
b) Assets and portfolio securities valuation (continued)
The financial derivative instruments which are not listed on any official stock exchange or traded on any other organised market are valued in accordance with market practice. Shares or units in underlying open-ended investment sub-funds are valued at their last available net asset value reduced by any applicable charges.
The Company uses the amortized cost method of valuation in valuing its portfolio of financial instruments in the form of short term debt (such as commercial paper, certificate of deposit, treasury bills,…).
c) Income and Expenses
Interest is accrued on a day-to-day basis. Dividends are accounted for on an ex-dividend basis.
d) Foreign Exchange
The cost of investments, income and expenses in currencies other than the fund relevant reporting currency have been recorded at the rate of exchange ruling at the time of the transaction. The market value of investments and other assets and liabilities in currencies other than the relevant reporting currency have been converted at the rates of exchange ruling at 31 March 2011.
e) Realised Profit/(Loss) on Sale of Investments
Realised profit/(loss) on sale of investments is the difference between the historical average cost of the investment and the sale proceeds.
f) Segregated Liability
The Company has segregated liability between its sub-funds; meaning, the assets of a sub-fund are exclusively available to satisfy the rights of shareholders in relation to that sub-fund and the rights of creditors whose claims have arisen in connection with the creation, operation and liquidation of that sub-fund.
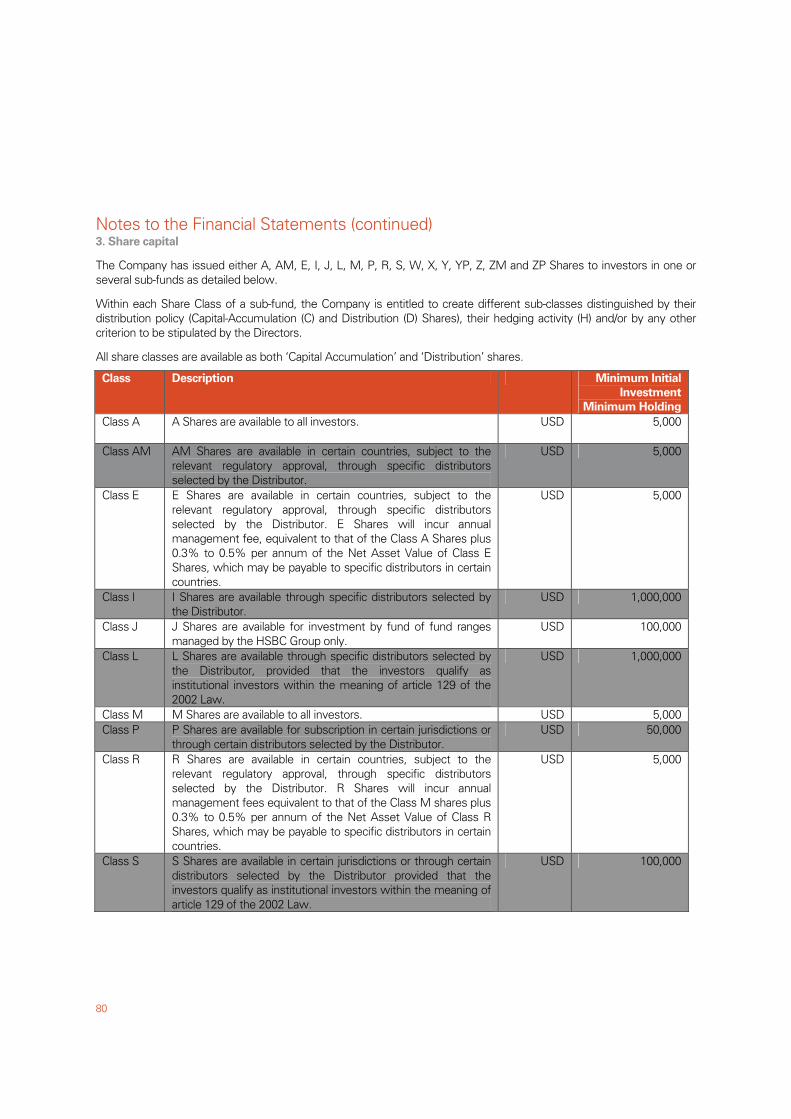
Notes to the Financial Statements (continued)
80
3. Share capital
The Company has issued either A, AM, E, I, J, L, M, P, R, S, W, X, Y, YP, Z, ZM and ZP Shares to investors in one or several sub-funds as detailed below.
Within each Share Class of a sub-fund, the Company is entitled to create different sub-classes distinguished by their distribution policy (Capital-Accumulation (C) and Distribution (D) Shares), their hedging activity (H) and/or by any other criterion to be stipulated by the Directors.
All share classes are available as both ‘Capital Accumulation’ and ‘Distribution’ shares.
Class Description Minimum Initial
Investment
Minimum Holding
Class A A Shares are available to all investors.
USD 5,000
Class AM AM Shares are available in certain countries, subject to the relevant regulatory approval, through specific distributors selected by the Distributor.
USD 5,000
Class E E Shares are available in certain countries, subject to the relevant regulatory approval, through specific distributors selected by the Distributor. E Shares will incur annual management fee, equivalent to that of the Class A Shares plus 0.3% to 0.5% per annum of the Net Asset Value of Class E Shares, which may be payable to specific distributors in certain countries.
USD 5,000
Class I I Shares are available through specific distributors selected by the Distributor.
USD 1,000,000
Class J J Shares are available for investment by fund of fund ranges managed by the HSBC Group only.
USD 100,000
Class L L Shares are available through specific distributors selected by the Distributor, provided that the investors qualify as institutional investors within the meaning of article 129 of the 2002 Law.
USD 1,000,000
Class M M Shares are available to all investors. USD 5,000 Class P P Shares are available for subscription in certain jurisdictions or
through certain distributors selected by the Distributor. USD 50,000
Class R R Shares are available in certain countries, subject to the relevant regulatory approval, through specific distributors selected by the Distributor. R Shares will incur annual management fees equivalent to that of the Class M shares plus 0.3% to 0.5% per annum of the Net Asset Value of Class R Shares, which may be payable to specific distributors in certain countries.
USD 5,000
Class S S Shares are available in certain jurisdictions or through certain distributors selected by the Distributor provided that the investors qualify as institutional investors within the meaning of article 129 of the 2002 Law.
USD 100,000
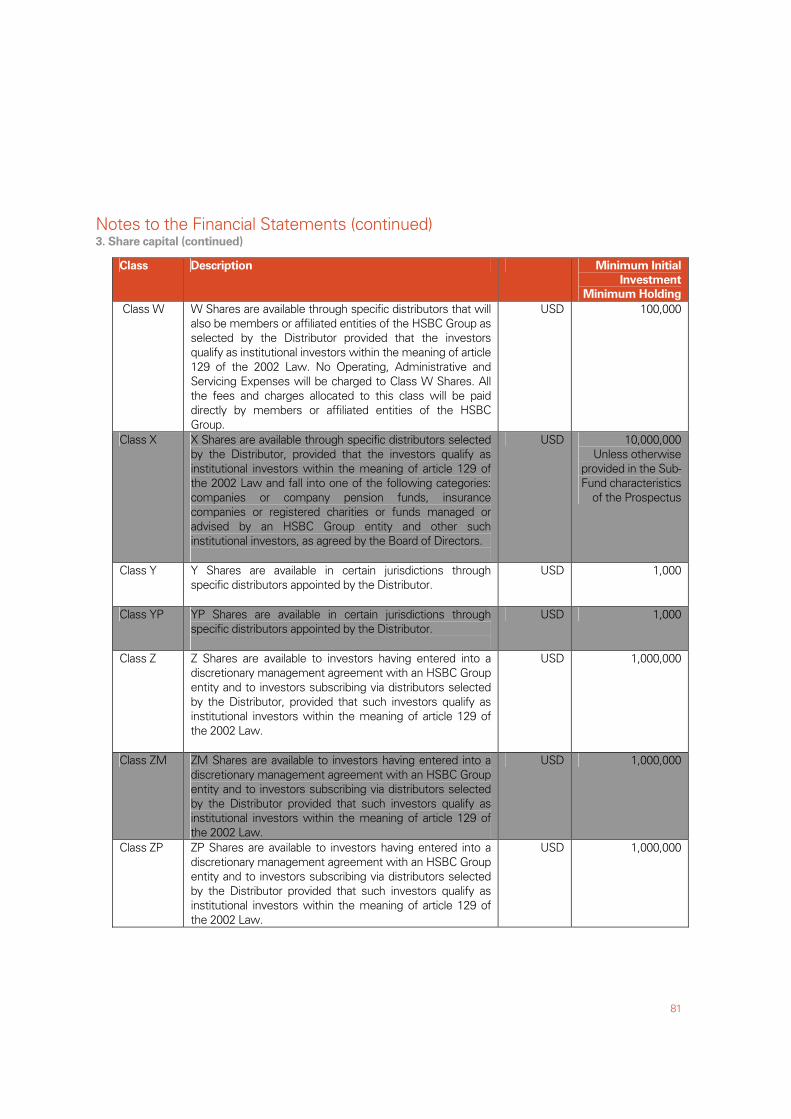
Notes to the Financial Statements (continued)
81
3. Share capital (continued)
Class Description Minimum Initial
Investment
Minimum Holding
Class W W Shares are available through specific distributors that will also be members or affiliated entities of the HSBC Group as selected by the Distributor provided that the investors qualify as institutional investors within the meaning of article 129 of the 2002 Law. No Operating, Administrative and Servicing Expenses will be charged to Class W Shares. All the fees and charges allocated to this class will be paid directly by members or affiliated entities of the HSBC Group.
USD 100,000
Class X X Shares are available through specific distributors selected by the Distributor, provided that the investors qualify as institutional investors within the meaning of article 129 of the 2002 Law and fall into one of the following categories: companies or company pension funds, insurance companies or registered charities or funds managed or advised by an HSBC Group entity and other such institutional investors, as agreed by the Board of Directors.
USD 10,000,000Unless otherwise
provided in the Sub-Fund characteristics
of the Prospectus
Class Y Y Shares are available in certain jurisdictions through specific distributors appointed by the Distributor.
USD 1,000
Class YP YP Shares are available in certain jurisdictions through specific distributors appointed by the Distributor.
USD 1,000
Class Z Z Shares are available to investors having entered into a discretionary management agreement with an HSBC Group entity and to investors subscribing via distributors selected by the Distributor, provided that such investors qualify as institutional investors within the meaning of article 129 of the 2002 Law.
USD 1,000,000
Class ZM ZM Shares are available to investors having entered into a discretionary management agreement with an HSBC Group entity and to investors subscribing via distributors selected by the Distributor provided that such investors qualify as institutional investors within the meaning of article 129 of the 2002 Law.
USD 1,000,000
Class ZP ZP Shares are available to investors having entered into a discretionary management agreement with an HSBC Group entity and to investors subscribing via distributors selected by the Distributor provided that such investors qualify as institutional investors within the meaning of article 129 of the 2002 Law.
USD 1,000,000
Notes to the Financial Statements (continued)
82
3. Share capital (continued)
The Board of Directors of the Company is authorised to issue different Classes of Shares in one or more sub-funds. Details of the characteristics of such Share Classes offered will be determined at the sole discretion of the Board of Directors. In case of the creation of any additional Classes of Shares, the Prospectus will be updated.
The subscription proceeds of all Shares in a sub-fund are invested in one common underlying portfolio of investments. All Shares of the same Class have equal rights and privileges. Each Share is, upon issue, entitled to participate equally in assets of the relevant class of the sub-fund to which it relates on liquidation and in dividends and other distributions as declared for such sub-fund. The Shares will carry no preferential or pre-emptive rights and each whole Share will be entitled to one vote at all meetings of shareholders.
The minimum initial investment amount may be waived or reduced at the discretion of the Company.
Share Class Denominations and Successive Classes:
The Share Classes issued in the different sub-funds are designated by their class name, followed by their distribution characteristics and, if applicable, their specific hedging policy and the currency into which the Base Currency is hedged. This means that for example Shares issued in Class A which are distributing income and applying a hedging policy to Euro, as defined above, would be identified as ADHEUR whereas Class I Shares accumulating income would be identified as IC.
Successive Classes J, L, M, R, YP, ZM and ZP in a given sub-fund are numbered 1, 2, 3… and will be referred to as J1, J2, J3, (…), L1, L2, L3 (…), M1, M2, M3 (…) etc.
Successive Classes S Shares will be issued in different sub-funds, and numbered 1, 2, 3 etc. and will be referred to as S1, S2, S3, etc. for the S Class launched in the first sub-fund, S Class launched in the second sub-fund and S Class launched in the third sub-fund, respectively and as disclosed in the relevant sub-fund characteristics (see Section 3.2. of the Prospectus).
Within each Share Class of a sub-fund, separate currency hedged classes may be issued (suffixed by “H” and the currency into which the Base Currency is hedged e.g. “HEUR” or “HGBP”). Any fees of the Administrator relating to the execution of the currency hedging policy will be borne by the relevant currency hedged class. These fees are in addition to the operating, administrative and servicing expenses detailed below. Any gains or losses shall also accrue to the relevant currency hedged class.
4. Charges and Expenses
1. Explanation of the Charging Structure
Investment in the Company is generally offered via charging structures, as represented by the A, AM, E, I, J, L, M, P, R, S, W, X, Y, YP, Z, ZM and ZP Classes of Shares.
The Management Company is entitled, in respect of each Class of Shares, to a management fee to cover all investment management, investment advisory and distribution services provided in relation to the relevant class (see paragraph (2) headed “Management Fee” below).
In addition, the Company pays to the Management Company a fee to cover operating, administrative and servicing expenses. To safeguard shareholders from fluctuations in a sub-fund’s operating, administrative and servicing expenses, the Company has agreed with the Management Company that the fee charged to cover such operating, administrative and servicing expenses is fixed at an annual rate. The potential excess of such expenses above such annual rate will be borne directly by the Management Company (see paragraph (4) headed “Operating, Administrative and Servicing Expenses / operating currency hedging fees” below).
Notes to the Financial Statements (continued)
83
4. Charges and Expenses (continued)
2. Management Fee The Company pays to the Management Company an annual management fee calculated as a percentage of the Net Asset Value of each sub-fund or share class (“Management Fee”). The Management Fee is accrued daily and payable monthly in arrears at the rates specified in the table on page 172. The maximum rate for Class E, I, J, L and M Shares is 3.5%. The maximum rate for Class A, AM, P, R, S, X, Y, YP, Z, ZM and ZP Shares is as stated in the Prospectus. No Management Fee is currently charged for Class W Shares. The Management Fee covers management and distribution services provided in relation to the relevant sub-fund of the Company by the Management Company, the Investment Advisers and the Share Distributors. The Management Company is responsible for discharging, out of such fee, the fees of the Investment Advisers and the Share Distributors and may pay part of such fee to recognised intermediaries or such other person as the Management Company may determine, at its discretion. The Management Company may instruct the Company to pay a portion of the Management Fee directly out of the assets of the Company to any of such service providers. In such case, the Management Fee due to Management Company is reduced accordingly. 3. Performance Fee Unless otherwise provided in the Prospectus, for sub-funds issuing Classes J Shares, L Shares, M Shares, R Shares, YP Shares and ZP Shares, the Management Company is also entitled to a Performance Fee, payable annually in arrears after the end of each twelve month period. Each Dealing Day, the Performance Fee accrual will be calculated as 20% of the difference between the change in the Net Asset Value per share of the relevant Class of the sub-fund since the previous Dealing Day (net of all other fees and expenses and excluding the effect of subscriptions and redemptions) and the simple daily equivalent of the percentage defined below for the relevant sub-funds (hereafter the "Percentage") provided that on such Dealing Day the Net Asset Value per Share of the relevant Class of the sub-fund is higher than the Low Tide Mark (as defined below). On a Dealing Day when the Net Asset Value exceeds the Low Tide Mark but immediately follows a Dealing Day when the Net Asset Value per share was below the Low Tide Mark, no accrual is made. On the first issue of the relevant Class of Shares in a sub-fund, the Low Tide Mark will equal the initial offer price of the relevant Class of Shares of the sub-fund. The Low Tide Mark will not be set at a level below the initial offer price of the relevant Class of Shares of the sub-fund. The cumulative Performance Fee accrual from the beginning of the twelve month period will be included in the calculation of the Net Asset Value per Share. In the event of any change in the Net Asset Value per Share of the relevant Class of the sub-fund being less than the simple daily equivalent of the Percentage, the daily Performance Fee accrual will be negative and will reduce the cumulative Performance Fee accrual until the accrual reaches a minimum level of zero. If the cumulative Performance Fee accrual reaches zero, the Net Asset Value per Share on the previous day will be set as the ‘Low Tide Mark’. No further daily Performance Fee accrual will be made until the Net Asset Value per Share exceeds the Low Tide Mark.
Notes to the Financial Statements (continued)
84
4. Charges and Expenses (continued)
3. Performance Fee (continued)
At the end of the twelve month period, the positive balance (if any) of the Performance Fee accrual will become payable to the Management Company and the Performance Fee accrual in the Net Asset Value per Share of the relevant Class of Shares will be reset to zero and the Net Asset Value per Share on that day will be set as the Low Tide Mark. When there is a positive Performance Fee accrual during a period of significant new subscriptions into a sub-fund with the relevant Class of Shares, followed by a period of negative performance, all shareholders will participate (in proportion with their shareholding) in the reduction in the cumulative Performance Fee accrual, regardless of their actual contribution to the cumulative Performance Fee accrual. Also, if the Net Asset Value per Share is rising but is still below the Low Tide Mark, the Management Company will not benefit from any Performance Fee accruals on any relevant Class of Shares of the sub-fund, including Shares that are newly issued and which only experience positive performance.
The detailed Performance Fee information can be found in the Prospectus dated October 2010.
If there is a positive balance of the Performance Fee, it will become payable to the Management Company and will be included in the “performance fees” balance from the statement of operations. If there was a positive balance of the Performance Fees accrued as at 31 March 2010 but no performance fees paid during the year ended 31 March 2011 or payable as at 31 March 2011, the 31 March 2010 accrual reversal is included in the “other income” balance from the statement of operations.
With effect from 1 June 2011, the Board of Directors has decided to bring into line the Performance Period starting on the first issue of each relevant Class of Shares and used for the calculation of the Performance Fee payable annually.
The positive balance (if any) of the Performance Fee accrual will therefore become payable to the Management Company each year on the last Business Day of November.
The first date on which Performance Fees will be paid simultaneously for all relevant Class of Shares is on 30 November 2011.
As a consequence: 1. Any Class of Shares that is due to pay a Performance Fee between 2 January 2011 and 31 May 2011 will continue to make any payment on its anniversary date; 2. Any Class of Share that is due to pay a Performance Fee between 1 June 2011 and 30 November 2011 will delay its payment date until 30 November 2011 (and consequently the next following performance period will be between 12 to 18 months). 3. Any Class of Share that is due to pay a Performance Fee between 1 December 2011 and 31 May 2012 will have an earlier payment date, on 30 November 2011 (and consequently the next following performance period will be between 6 to 12 months).
In relation to performance fees, the following sub-funds stopped paying performance fees compared to last year: - BRIC Equity - Euroland Growth - GEM Equity
4. Operating, Administrative and Servicing Expenses / Operating Currency Hedging Fees
The Company pays to the Management Company a fee to cover certain Operating, Administrative and Servicing Expenses. The Management Company is responsible for discharging out of this fee, the expenses described below, inter alia, payable to the Custodian, Administration, Registrar and Transfer Agent.
This fee is set, for each sub-fund and/or Class, at a fixed percentage of the Net Asset Value of the relevant sub-fund or class specified in the Company’s Prospectus (as specified in the table on page 170). Such fee is accrued daily and payable monthly in arrears.
Notes to the Financial Statements (continued)
85
4. Charges and Expenses (continued)
4. Operating, Administrative and Servicing Expenses / Operating Currency Hedging Fees (continued)
No Operating, Administrative and Servicing Expenses will be charged to Class W Shares. All the fees and charges allocated to such Class of Shares will be paid directly by a member or an affiliated entity of HSBC Group.
The maximum rate for class A, AM, E, I, J, L, M, P, R, S, X, Y, YP, Z, ZM and ZP Shares is 1.0% (but not including the fees of the Administration Agent relating to the execution of the currency hedging for the currency hedged Share Classes). However, the Board of Directors reserves the right to amend the fixed level of the Operating, Administrative and Servicing Expenses applicable to each Class of Shares. In the event of an increase of such expenses, the concerned shareholders will be given at least three months prior notice of such increase. During this three months notice, such shareholders may request the redemption of their Shares, free of charge.
Operating, Administrative and Servicing Expenses cover the ongoing custody fees and safekeeping charges payable to the Custodian and its correspondent banks, fees for fund accounting and administration services (including domiciliary services) payable to the Administrative Agent and transfer agency fees for registrar and transfer agency services payable to the Registrar and Transfer Agent.
Operating, Administrative and Servicing Expenses also cover expenses relating to the creation of new sub-funds; the costs of the Subsidiaries (see below); the Luxembourg asset-based taxe d’abonnement, at the rate referred to under Section “Taxation” of the Company’s Prospectus; attendance fees and reasonable out-of-pocket expenses incurred by the Board of Directors; legal and auditing fees and expenses; ongoing registration and listing fees, including translation expenses; the costs and expenses of preparing, printing, and distributing the Company’s Prospectus, Simplified Prospectuses, financial reports, statements and other documents made available directly or through intermediaries to its shareholders.
The Company pays to the Management Company a fee to cover the expense of the Administration Agent relating to the execution of the hedged Share Classes launched on or after 1 December 2008.
The Management Company may instruct the Company to pay a portion of the aforesaid fees directly out of the assets of the Company to any of the aforementioned service providers. In such case the fee due to the Management Company is reduced accordingly.
5. Transaction expenses and extraordinary expenses
The transaction expenses linked to security dealing are written off against the realised profit/loss from the sale of investments.
Each sub-fund bears the costs and expenses of buying and selling portfolio securities and financial instruments, brokerage fees and commissions, interest or taxes payable, and other transaction related expenses. These transaction fees are accounted for on a cash basis and are paid when incurred or invoiced from the net assets of the sub-fund to which they are attributable. Transaction fees are allocated across each sub-fund’s Share Classes.
The Company bears any extraordinary expenses including, without limitation, litigation expenses and the full amount of any tax, levy, duty or similar charge and any unforeseen charges imposed on the Company or its assets.
6. Indian Equity and Global Emerging Markets Equity
The Company's wholly owned subsidiaries in Mauritius, HSBC Global Investment Funds Mauritius Limited ("HSBC Mauritius") and HSBC GIF Mauritius No. 2 Limited ("HSBC Mauritius No. 2"), (each a Subsidiary or collectively, the "Subsidiaries") are located at Rogers House, 5 President John Kennedy Street, Port Louis, Mauritius. HSBC Mauritius manages the Indian Equity sub-fund's investments in India, whilst HSBC Mauritius No. 2 manages the Global Emerging Markets Equity sub-fund's investments in India.
Notes to the Financial Statements (continued)
86
6. Indian Equity and Global Emerging Markets Equity (continued)
HSBC Mauritius was incorporated in Mauritius on 3 October 1995. The accounts of the Indian Equity sub-fund and of HSBC Mauritius are consolidated.
HSBC Mauritius No. 2 was incorporated in Mauritius on 21 November 2007. The accounts of the Global Emerging Markets Equity sub-fund and of HSBC Mauritius No. 2 are consolidated.
The Subsidiaries have appointed Multiconsult Limited, Rogers House, 5 President John Kennedy Street, Port Louis, Mauritius, to provide administrative services to the Subsidiaries in Mauritius, including maintenance of its accounts, books and records.
Both Subsidiaries have appointed KPMG Mauritius, KPMG Centre, 30 St George Street, Port Louis, Mauritius, as auditors of the Subsidiaries in Mauritius to perform the auditor’s duties required by Mauritius law.
7. Taxation of the Company
The following summary is based on the Company’s understanding of the law and practice currently in force in the Grand Duchy of Luxembourg and in other jurisdictions and is subject to changes therein.
Belgium
The Belgian government has enacted a law which charges an annual net asset value tax on foreign investment funds registered with the Belgian Banking and Finance Commission. An annual tax of 0.08% is charged on the net outstanding amounts of sub-funds placed in Belgium through Belgian financial intermediaries, or where that figure is not substantially documented, the tax authorities may calculate the tax on the total asset of those sub-funds.
To date as the amounts are small, the Management Company has paid this tax cost on behalf of the Company out of the Operating, Administrative and Servicing Expenses it receives. However, should the cost become substantial or long term, the Management Company may require the sub-funds concerned to bear that tax charge for future periods.
India
On the basis that they are a Mauritian tax resident, the Subsidiaries will benefit from the tax advantages available to them under the India-Mauritius double taxation treaty, which became effective on 1 July 1983. The Subsidiaries will file, through their Custodian, a declaration of Mauritian residency with the registrar of each Indian company in which it invests. Capital gains resulting from the purchase and sale by the Subsidiaries of stocks on the Indian stock exchanges will be exempt from tax on the basis that the Subsidiaries are able to benefit from the provisions of the India-Mauritius double taxation treaty.
Interest on certain notified securities and bonds and on deposits in foreign currency with scheduled banks is exempt from income tax. The sale and purchase of stocks and securities is exempt from Indian Sales tax.
The above-stated tax treatment under the India-Mauritius tax treaty will be available provided that the Subsidiaries neither have a permanent establishment nor its effective management and control in India. No guarantee or warranty can be given or should be assumed that the tax benefits of the said treaty will continue to be available to the Indian Equity and in Global Emerging Markets Equity sub-funds in future periods due to, among others, changes in the regulatory environment in Mauritius, India or the European Union.
The Indian Central Board of Direct Taxes has confirmed the availability of the treaty benefits to companies holding a certificate of Mauritian tax residence. The Supreme Court of India confirmed on 7 October 2003 the validity of this position.
Dividends paid by the Indian companies are exempt from tax in the hands of the recipients if the said company pays a dividend distribution tax at the prescribed tax rate on dividends declared, distributed or paid by them on or after 1 April 2003.
Notes to the Financial Statements (continued)
87
7. Taxation of the Company (continued)
The new Indian Direct Tax Code is expected to come into force from 1 April 2012. This will broadly tax all capital gains of foreign investors at 30% unless relief is available under an appropriate double tax treaty with India. However, the new Indian Direct Tax Code gives considerable discretion to the tax authorities, which may be used to seek to deny treaty benefits to foreign investors. Such actions could result in a significant financial cost for investors. Luxembourg The Company is not liable to any Luxembourg tax on profits or income. The Company is however liable in Luxembourg to a tax of 0.05% per annum of its net asset value, such tax being payable quarterly on the basis of the value of the net assets of the Company at the end of the relevant calendar quarter. The tax rate is reduced to 0.01% per annum for the Euro Reserve sub-fund and Classes J, L, S1, W, X, Z and ZP Shares in the relevant sub-funds. No stamp duty or other tax is payable in Luxembourg on the issue of shares. The classes/sub-funds may be exempted from this 0.01% tax if they comply with the requirements of the Luxembourg law of 19 December 2003 which include: (i) the shares of the class/sub-fund must be reserved to institutional investors in the meaning of article 129 of the 2002 Law; (ii) the exclusive object of the class/sub-fund’s portfolio must be the investment in money market instruments and/or deposits with credit institutions; (iii) the remaining average maturity of the class/sub-fund’s portfolio must be less than 90 days; and (iv) the class/sub-fund must benefit from the highest possible rating of a recognized rating agency. No Luxembourg tax is payable on the realised or unrealised capital appreciation of the assets of the Company. Mauritius The Subsidiaries are registered with the Financial Services Commission in Mauritius as offshore companies. As a result they are subject to a reduced rate of Mauritian income tax on their income. In addition, no Mauritian capital gains tax will be payable in respect of the Subsidiaries investments in India and any dividends and redemption proceeds paid by the Subsidiaries to the Indian Equity or Global Emerging Markets Equity sub-funds will be exempt from Mauritian withholding tax. A certificate of Mauritian tax residence has been granted to the Subsidiaries by the Mauritius Revenue Authority. On the basis that they are Mauritian tax residents, the Subsidiaries will qualify for certain reliefs from Indian tax as set out in the Indian tax paragraph above. Thailand Where possible, Thai stocks of the Thai Equity sub-fund are held through custody arrangements in London which enables the Company to benefit from the United Kingdom-Thailand double tax treaty and therefore gains realised by the sub-fund are currently not liable to tax in Thailand. Although the Company will seek to maintain this favourable position, no guarantee or warranty can be given or should be assumed that the tax benefits of the treaty will continue to be available to the sub-fund in future periods. Should the sub-fund become subject to Thai tax on its gains this will have an adverse effect on investment returns and a possible impact on the net asset value. United Kingdom It is the intention of the Board of Directors to conduct the affairs of the Company so that it does not become resident in the United Kingdom. On the basis that the Company is not resident in the United Kingdom for tax purposes it should not be subject to United Kingdom corporation tax on its income and capital gains. The Company has received certification as a distributing fund under Schedule 27 of the Income and Corporation Taxes Act 1988.
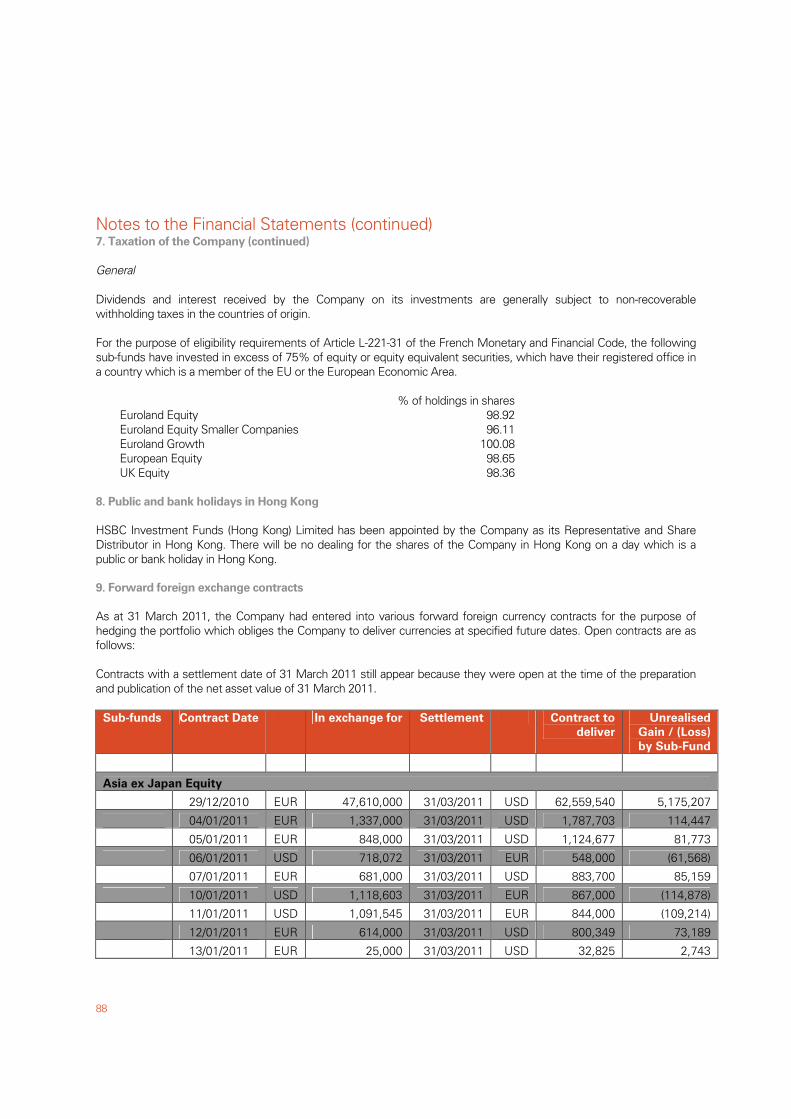
Notes to the Financial Statements (continued)
88
7. Taxation of the Company (continued)
General Dividends and interest received by the Company on its investments are generally subject to non-recoverable withholding taxes in the countries of origin. For the purpose of eligibility requirements of Article L-221-31 of the French Monetary and Financial Code, the following sub-funds have invested in excess of 75% of equity or equity equivalent securities, which have their registered office in a country which is a member of the EU or the European Economic Area. % of holdings in shares Euroland Equity 98.92 Euroland Equity Smaller Companies 96.11 Euroland Growth 100.08 European Equity 98.65 UK Equity 98.36 8. Public and bank holidays in Hong Kong
HSBC Investment Funds (Hong Kong) Limited has been appointed by the Company as its Representative and Share Distributor in Hong Kong. There will be no dealing for the shares of the Company in Hong Kong on a day which is a public or bank holiday in Hong Kong.
9. Forward foreign exchange contracts
As at 31 March 2011, the Company had entered into various forward foreign currency contracts for the purpose of hedging the portfolio which obliges the Company to deliver currencies at specified future dates. Open contracts are as follows: Contracts with a settlement date of 31 March 2011 still appear because they were open at the time of the preparation and publication of the net asset value of 31 March 2011.
Sub-funds Contract Date In exchange for Settlement Contract to
deliver
Unrealised
Gain / (Loss)
by Sub-Fund
Asia ex Japan Equity
29/12/2010 EUR 47,610,000 31/03/2011 USD 62,559,540 5,175,207
04/01/2011 EUR 1,337,000 31/03/2011 USD 1,787,703 114,447
05/01/2011 EUR 848,000 31/03/2011 USD 1,124,677 81,773
06/01/2011 USD 718,072 31/03/2011 EUR 548,000 (61,568)
07/01/2011 EUR 681,000 31/03/2011 USD 883,700 85,159
10/01/2011 USD 1,118,603 31/03/2011 EUR 867,000 (114,878)
11/01/2011 USD 1,091,545 31/03/2011 EUR 844,000 (109,214)
12/01/2011 EUR 614,000 31/03/2011 USD 800,349 73,189
13/01/2011 EUR 25,000 31/03/2011 USD 32,825 2,743
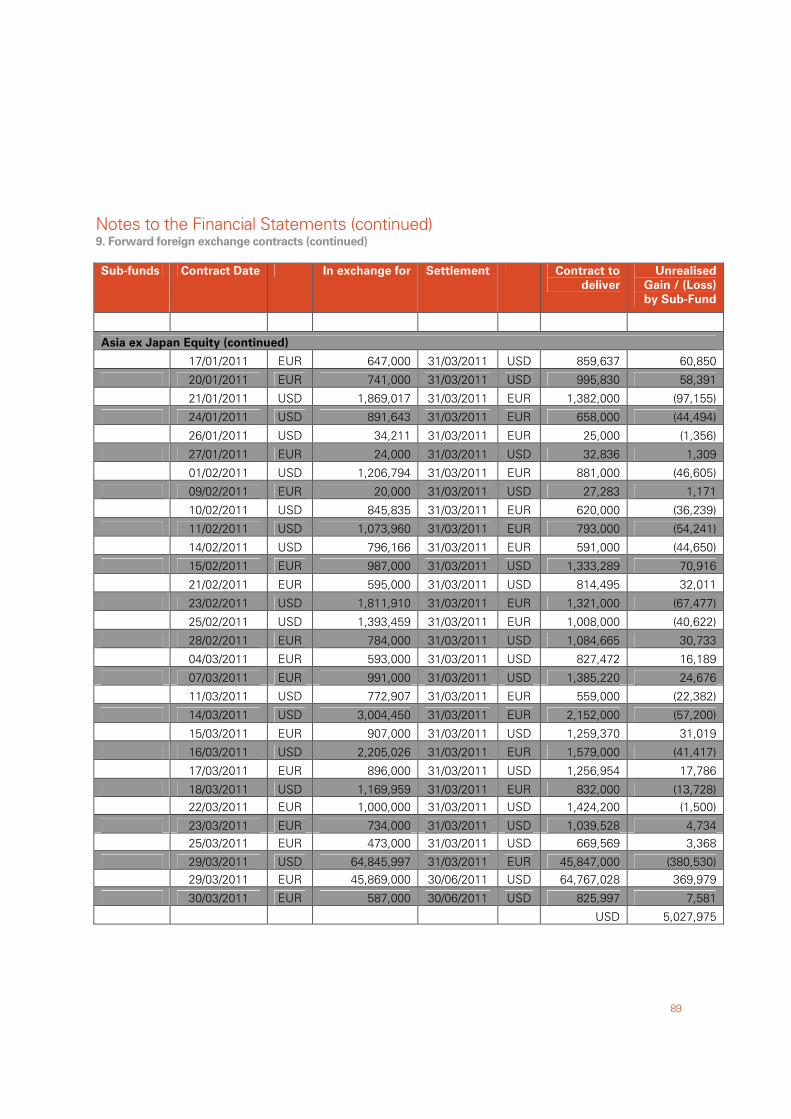
Notes to the Financial Statements (continued)
89
9. Forward foreign exchange contracts (continued)
Sub-funds Contract Date In exchange for Settlement Contract to
deliver
Unrealised
Gain / (Loss)
by Sub-Fund
Asia ex Japan Equity (continued)
17/01/2011 EUR 647,000 31/03/2011 USD 859,637 60,850
20/01/2011 EUR 741,000 31/03/2011 USD 995,830 58,391
21/01/2011 USD 1,869,017 31/03/2011 EUR 1,382,000 (97,155)
24/01/2011 USD 891,643 31/03/2011 EUR 658,000 (44,494)
26/01/2011 USD 34,211 31/03/2011 EUR 25,000 (1,356)
27/01/2011 EUR 24,000 31/03/2011 USD 32,836 1,309
01/02/2011 USD 1,206,794 31/03/2011 EUR 881,000 (46,605)
09/02/2011 EUR 20,000 31/03/2011 USD 27,283 1,171
10/02/2011 USD 845,835 31/03/2011 EUR 620,000 (36,239)
11/02/2011 USD 1,073,960 31/03/2011 EUR 793,000 (54,241)
14/02/2011 USD 796,166 31/03/2011 EUR 591,000 (44,650)
15/02/2011 EUR 987,000 31/03/2011 USD 1,333,289 70,916
21/02/2011 EUR 595,000 31/03/2011 USD 814,495 32,011
23/02/2011 USD 1,811,910 31/03/2011 EUR 1,321,000 (67,477)
25/02/2011 USD 1,393,459 31/03/2011 EUR 1,008,000 (40,622)
28/02/2011 EUR 784,000 31/03/2011 USD 1,084,665 30,733
04/03/2011 EUR 593,000 31/03/2011 USD 827,472 16,189
07/03/2011 EUR 991,000 31/03/2011 USD 1,385,220 24,676
11/03/2011 USD 772,907 31/03/2011 EUR 559,000 (22,382)
14/03/2011 USD 3,004,450 31/03/2011 EUR 2,152,000 (57,200)
15/03/2011 EUR 907,000 31/03/2011 USD 1,259,370 31,019
16/03/2011 USD 2,205,026 31/03/2011 EUR 1,579,000 (41,417)
17/03/2011 EUR 896,000 31/03/2011 USD 1,256,954 17,786
18/03/2011 USD 1,169,959 31/03/2011 EUR 832,000 (13,728) 22/03/2011 EUR 1,000,000 31/03/2011 USD 1,424,200 (1,500)
23/03/2011 EUR 734,000 31/03/2011 USD 1,039,528 4,734 25/03/2011 EUR 473,000 31/03/2011 USD 669,569 3,368
29/03/2011 USD 64,845,997 31/03/2011 EUR 45,847,000 (380,530) 29/03/2011 EUR 45,869,000 30/06/2011 USD 64,767,028 369,979
30/03/2011 EUR 587,000 30/06/2011 USD 825,997 7,581
USD 5,027,975
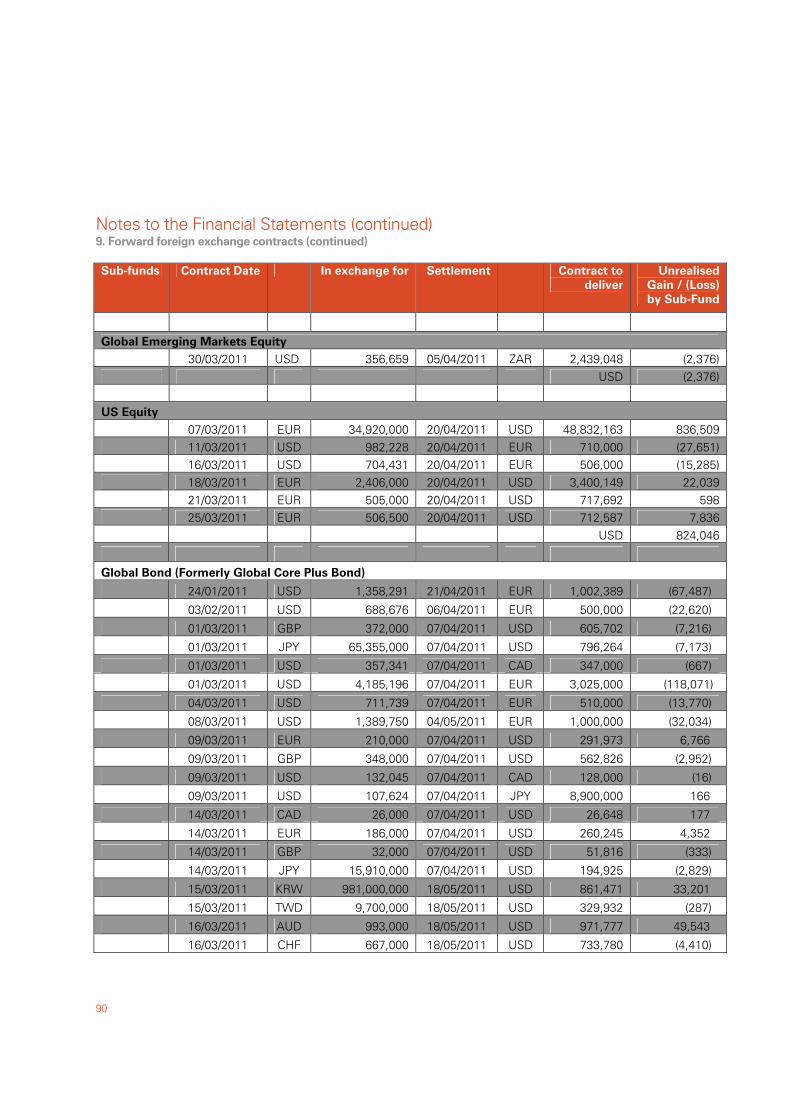
Notes to the Financial Statements (continued)
90
9. Forward foreign exchange contracts (continued)
Sub-funds Contract Date In exchange for Settlement Contract to
deliver
Unrealised
Gain / (Loss)
by Sub-Fund
Global Emerging Markets Equity 30/03/2011 USD 356,659 05/04/2011 ZAR 2,439,048 (2,376)
USD (2,376)
US Equity 07/03/2011 EUR 34,920,000 20/04/2011 USD 48,832,163 836,509 11/03/2011 USD 982,228 20/04/2011 EUR 710,000 (27,651) 16/03/2011 USD 704,431 20/04/2011 EUR 506,000 (15,285) 18/03/2011 EUR 2,406,000 20/04/2011 USD 3,400,149 22,039 21/03/2011 EUR 505,000 20/04/2011 USD 717,692 598 25/03/2011 EUR 506,500 20/04/2011 USD 712,587 7,836 USD 824,046
Global Bond (Formerly Global Core Plus Bond)
24/01/2011 USD 1,358,291 21/04/2011 EUR 1,002,389 (67,487)
03/02/2011 USD 688,676 06/04/2011 EUR 500,000 (22,620)
01/03/2011 GBP 372,000 07/04/2011 USD 605,702 (7,216)
01/03/2011 JPY 65,355,000 07/04/2011 USD 796,264 (7,173)
01/03/2011 USD 357,341 07/04/2011 CAD 347,000 (667)
01/03/2011 USD 4,185,196 07/04/2011 EUR 3,025,000 (118,071)
04/03/2011 USD 711,739 07/04/2011 EUR 510,000 (13,770)
08/03/2011 USD 1,389,750 04/05/2011 EUR 1,000,000 (32,034)
09/03/2011 EUR 210,000 07/04/2011 USD 291,973 6,766
09/03/2011 GBP 348,000 07/04/2011 USD 562,826 (2,952)
09/03/2011 USD 132,045 07/04/2011 CAD 128,000 (16)
09/03/2011 USD 107,624 07/04/2011 JPY 8,900,000 166
14/03/2011 CAD 26,000 07/04/2011 USD 26,648 177
14/03/2011 EUR 186,000 07/04/2011 USD 260,245 4,352
14/03/2011 GBP 32,000 07/04/2011 USD 51,816 (333)
14/03/2011 JPY 15,910,000 07/04/2011 USD 194,925 (2,829)
15/03/2011 KRW 981,000,000 18/05/2011 USD 861,471 33,201
15/03/2011 TWD 9,700,000 18/05/2011 USD 329,932 (287)
16/03/2011 AUD 993,000 18/05/2011 USD 971,777 49,543
16/03/2011 CHF 667,000 18/05/2011 USD 733,780 (4,410)
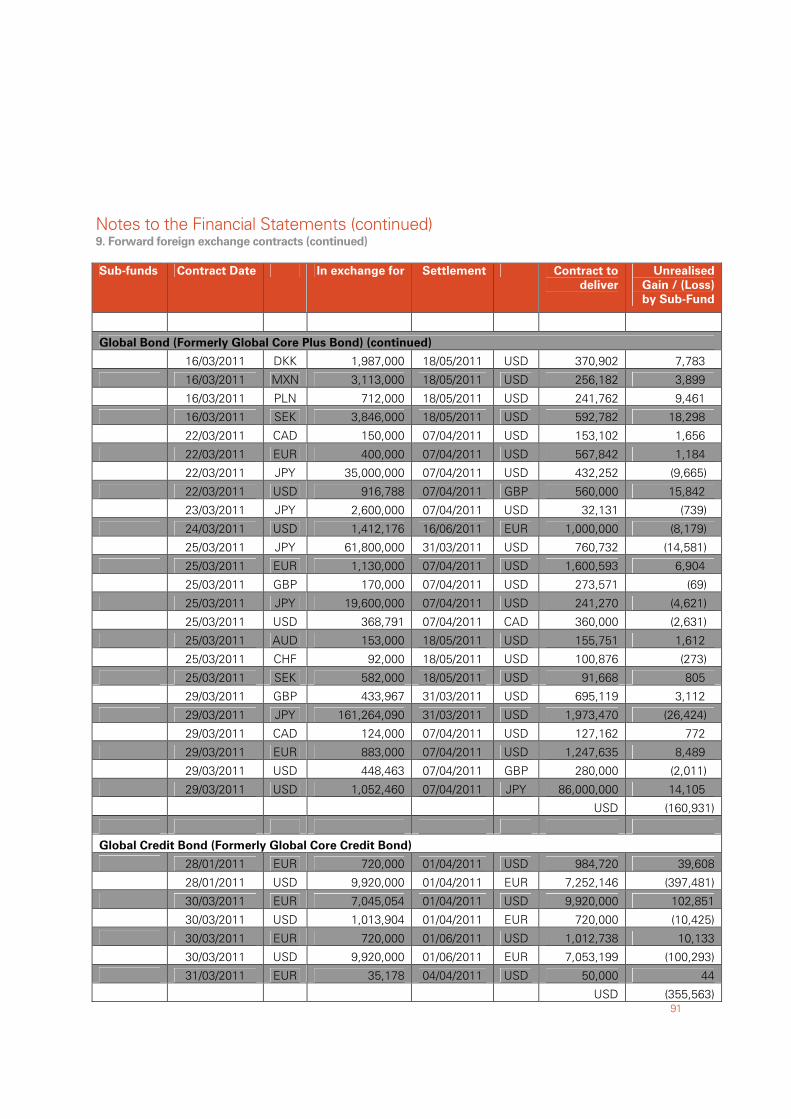
Notes to the Financial Statements (continued)
91
9. Forward foreign exchange contracts (continued)
Sub-funds Contract Date In exchange for Settlement Contract to
deliver
Unrealised
Gain / (Loss)
by Sub-Fund
Global Bond (Formerly Global Core Plus Bond) (continued)
16/03/2011 DKK 1,987,000 18/05/2011 USD 370,902 7,783
16/03/2011 MXN 3,113,000 18/05/2011 USD 256,182 3,899
16/03/2011 PLN 712,000 18/05/2011 USD 241,762 9,461
16/03/2011 SEK 3,846,000 18/05/2011 USD 592,782 18,298
22/03/2011 CAD 150,000 07/04/2011 USD 153,102 1,656
22/03/2011 EUR 400,000 07/04/2011 USD 567,842 1,184
22/03/2011 JPY 35,000,000 07/04/2011 USD 432,252 (9,665)
22/03/2011 USD 916,788 07/04/2011 GBP 560,000 15,842
23/03/2011 JPY 2,600,000 07/04/2011 USD 32,131 (739)
24/03/2011 USD 1,412,176 16/06/2011 EUR 1,000,000 (8,179)
25/03/2011 JPY 61,800,000 31/03/2011 USD 760,732 (14,581)
25/03/2011 EUR 1,130,000 07/04/2011 USD 1,600,593 6,904
25/03/2011 GBP 170,000 07/04/2011 USD 273,571 (69)
25/03/2011 JPY 19,600,000 07/04/2011 USD 241,270 (4,621)
25/03/2011 USD 368,791 07/04/2011 CAD 360,000 (2,631)
25/03/2011 AUD 153,000 18/05/2011 USD 155,751 1,612
25/03/2011 CHF 92,000 18/05/2011 USD 100,876 (273)
25/03/2011 SEK 582,000 18/05/2011 USD 91,668 805
29/03/2011 GBP 433,967 31/03/2011 USD 695,119 3,112
29/03/2011 JPY 161,264,090 31/03/2011 USD 1,973,470 (26,424)
29/03/2011 CAD 124,000 07/04/2011 USD 127,162 772
29/03/2011 EUR 883,000 07/04/2011 USD 1,247,635 8,489
29/03/2011 USD 448,463 07/04/2011 GBP 280,000 (2,011)
29/03/2011 USD 1,052,460 07/04/2011 JPY 86,000,000 14,105
USD (160,931)
Global Credit Bond (Formerly Global Core Credit Bond)
28/01/2011 EUR 720,000 01/04/2011 USD 984,720 39,608
28/01/2011 USD 9,920,000 01/04/2011 EUR 7,252,146 (397,481)
30/03/2011 EUR 7,045,054 01/04/2011 USD 9,920,000 102,851
30/03/2011 USD 1,013,904 01/04/2011 EUR 720,000 (10,425)
30/03/2011 EUR 720,000 01/06/2011 USD 1,012,738 10,133
30/03/2011 USD 9,920,000 01/06/2011 EUR 7,053,199 (100,293)
31/03/2011 EUR 35,178 04/04/2011 USD 50,000 44
USD (355,563)
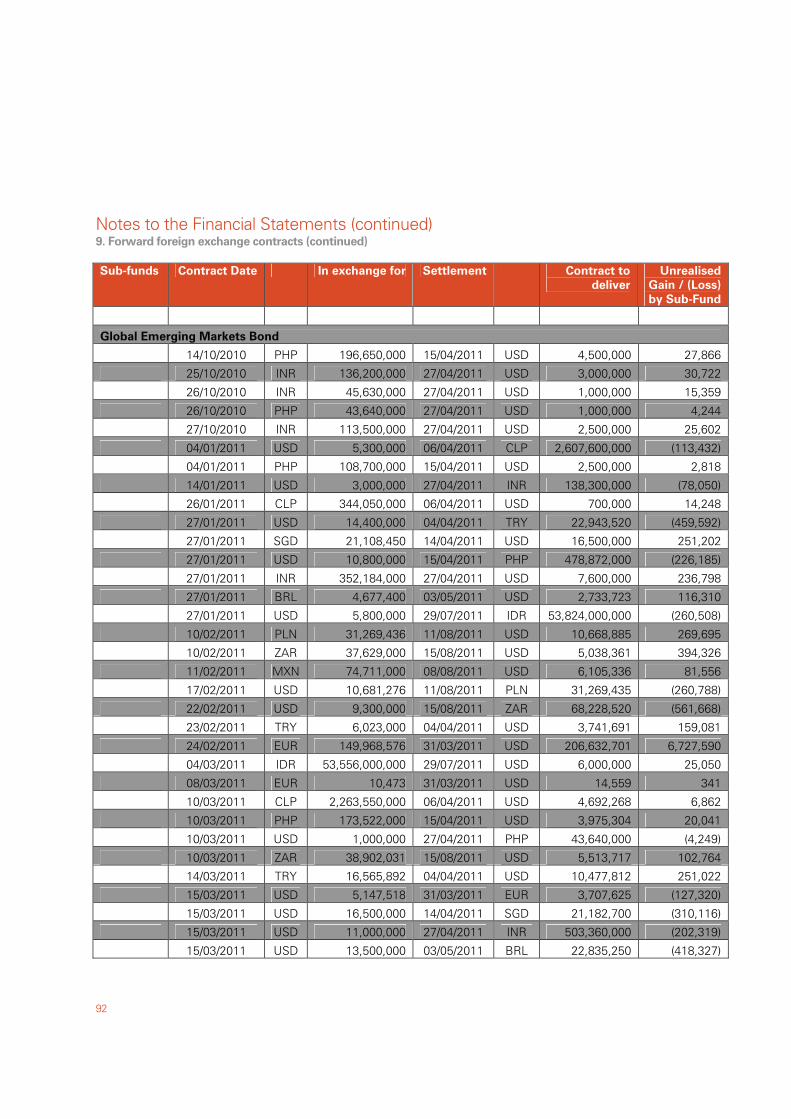
Notes to the Financial Statements (continued)
92
9. Forward foreign exchange contracts (continued)
Sub-funds Contract Date In exchange for Settlement Contract to
deliver
Unrealised
Gain / (Loss)
by Sub-Fund
Global Emerging Markets Bond
14/10/2010 PHP 196,650,000 15/04/2011 USD 4,500,000 27,866
25/10/2010 INR 136,200,000 27/04/2011 USD 3,000,000 30,722
26/10/2010 INR 45,630,000 27/04/2011 USD 1,000,000 15,359
26/10/2010 PHP 43,640,000 27/04/2011 USD 1,000,000 4,244
27/10/2010 INR 113,500,000 27/04/2011 USD 2,500,000 25,602
04/01/2011 USD 5,300,000 06/04/2011 CLP 2,607,600,000 (113,432)
04/01/2011 PHP 108,700,000 15/04/2011 USD 2,500,000 2,818
14/01/2011 USD 3,000,000 27/04/2011 INR 138,300,000 (78,050)
26/01/2011 CLP 344,050,000 06/04/2011 USD 700,000 14,248
27/01/2011 USD 14,400,000 04/04/2011 TRY 22,943,520 (459,592)
27/01/2011 SGD 21,108,450 14/04/2011 USD 16,500,000 251,202
27/01/2011 USD 10,800,000 15/04/2011 PHP 478,872,000 (226,185)
27/01/2011 INR 352,184,000 27/04/2011 USD 7,600,000 236,798
27/01/2011 BRL 4,677,400 03/05/2011 USD 2,733,723 116,310
27/01/2011 USD 5,800,000 29/07/2011 IDR 53,824,000,000 (260,508)
10/02/2011 PLN 31,269,436 11/08/2011 USD 10,668,885 269,695
10/02/2011 ZAR 37,629,000 15/08/2011 USD 5,038,361 394,326
11/02/2011 MXN 74,711,000 08/08/2011 USD 6,105,336 81,556
17/02/2011 USD 10,681,276 11/08/2011 PLN 31,269,435 (260,788)
22/02/2011 USD 9,300,000 15/08/2011 ZAR 68,228,520 (561,668)
23/02/2011 TRY 6,023,000 04/04/2011 USD 3,741,691 159,081
24/02/2011 EUR 149,968,576 31/03/2011 USD 206,632,701 6,727,590
04/03/2011 IDR 53,556,000,000 29/07/2011 USD 6,000,000 25,050
08/03/2011 EUR 10,473 31/03/2011 USD 14,559 341
10/03/2011 CLP 2,263,550,000 06/04/2011 USD 4,692,268 6,862
10/03/2011 PHP 173,522,000 15/04/2011 USD 3,975,304 20,041
10/03/2011 USD 1,000,000 27/04/2011 PHP 43,640,000 (4,249)
10/03/2011 ZAR 38,902,031 15/08/2011 USD 5,513,717 102,764
14/03/2011 TRY 16,565,892 04/04/2011 USD 10,477,812 251,022
15/03/2011 USD 5,147,518 31/03/2011 EUR 3,707,625 (127,320)
15/03/2011 USD 16,500,000 14/04/2011 SGD 21,182,700 (310,116)
15/03/2011 USD 11,000,000 27/04/2011 INR 503,360,000 (202,319)
15/03/2011 USD 13,500,000 03/05/2011 BRL 22,835,250 (418,327)
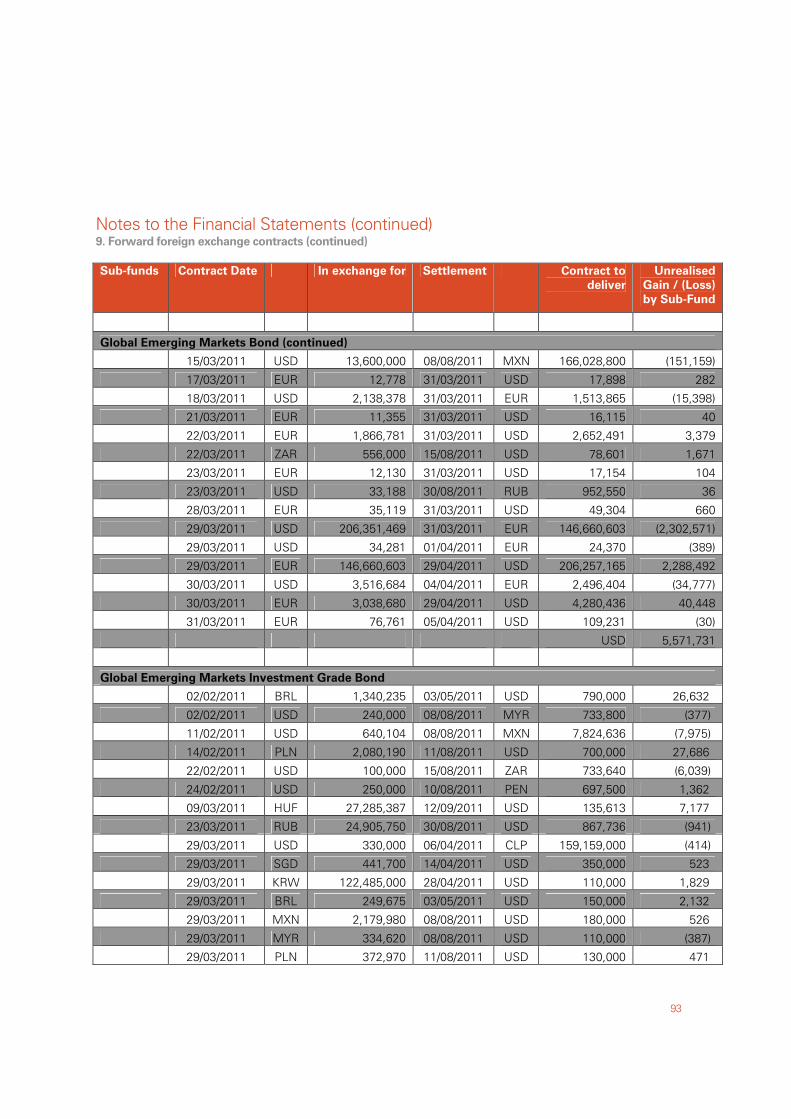
Notes to the Financial Statements (continued)
93
9. Forward foreign exchange contracts (continued)
Sub-funds Contract Date In exchange for Settlement Contract to
deliver
Unrealised
Gain / (Loss)
by Sub-Fund
Global Emerging Markets Bond (continued)
15/03/2011 USD 13,600,000 08/08/2011 MXN 166,028,800 (151,159)
17/03/2011 EUR 12,778 31/03/2011 USD 17,898 282
18/03/2011 USD 2,138,378 31/03/2011 EUR 1,513,865 (15,398)
21/03/2011 EUR 11,355 31/03/2011 USD 16,115 40
22/03/2011 EUR 1,866,781 31/03/2011 USD 2,652,491 3,379
22/03/2011 ZAR 556,000 15/08/2011 USD 78,601 1,671
23/03/2011 EUR 12,130 31/03/2011 USD 17,154 104
23/03/2011 USD 33,188 30/08/2011 RUB 952,550 36
28/03/2011 EUR 35,119 31/03/2011 USD 49,304 660
29/03/2011 USD 206,351,469 31/03/2011 EUR 146,660,603 (2,302,571)
29/03/2011 USD 34,281 01/04/2011 EUR 24,370 (389)
29/03/2011 EUR 146,660,603 29/04/2011 USD 206,257,165 2,288,492
30/03/2011 USD 3,516,684 04/04/2011 EUR 2,496,404 (34,777)
30/03/2011 EUR 3,038,680 29/04/2011 USD 4,280,436 40,448
31/03/2011 EUR 76,761 05/04/2011 USD 109,231 (30)
USD 5,571,731
Global Emerging Markets Investment Grade Bond
02/02/2011 BRL 1,340,235 03/05/2011 USD 790,000 26,632
02/02/2011 USD 240,000 08/08/2011 MYR 733,800 (377)
11/02/2011 USD 640,104 08/08/2011 MXN 7,824,636 (7,975)
14/02/2011 PLN 2,080,190 11/08/2011 USD 700,000 27,686
22/02/2011 USD 100,000 15/08/2011 ZAR 733,640 (6,039)
24/02/2011 USD 250,000 10/08/2011 PEN 697,500 1,362
09/03/2011 HUF 27,285,387 12/09/2011 USD 135,613 7,177
23/03/2011 RUB 24,905,750 30/08/2011 USD 867,736 (941)
29/03/2011 USD 330,000 06/04/2011 CLP 159,159,000 (414)
29/03/2011 SGD 441,700 14/04/2011 USD 350,000 523
29/03/2011 KRW 122,485,000 28/04/2011 USD 110,000 1,829
29/03/2011 BRL 249,675 03/05/2011 USD 150,000 2,132
29/03/2011 MXN 2,179,980 08/08/2011 USD 180,000 526
29/03/2011 MYR 334,620 08/08/2011 USD 110,000 (387)
29/03/2011 PLN 372,970 11/08/2011 USD 130,000 471
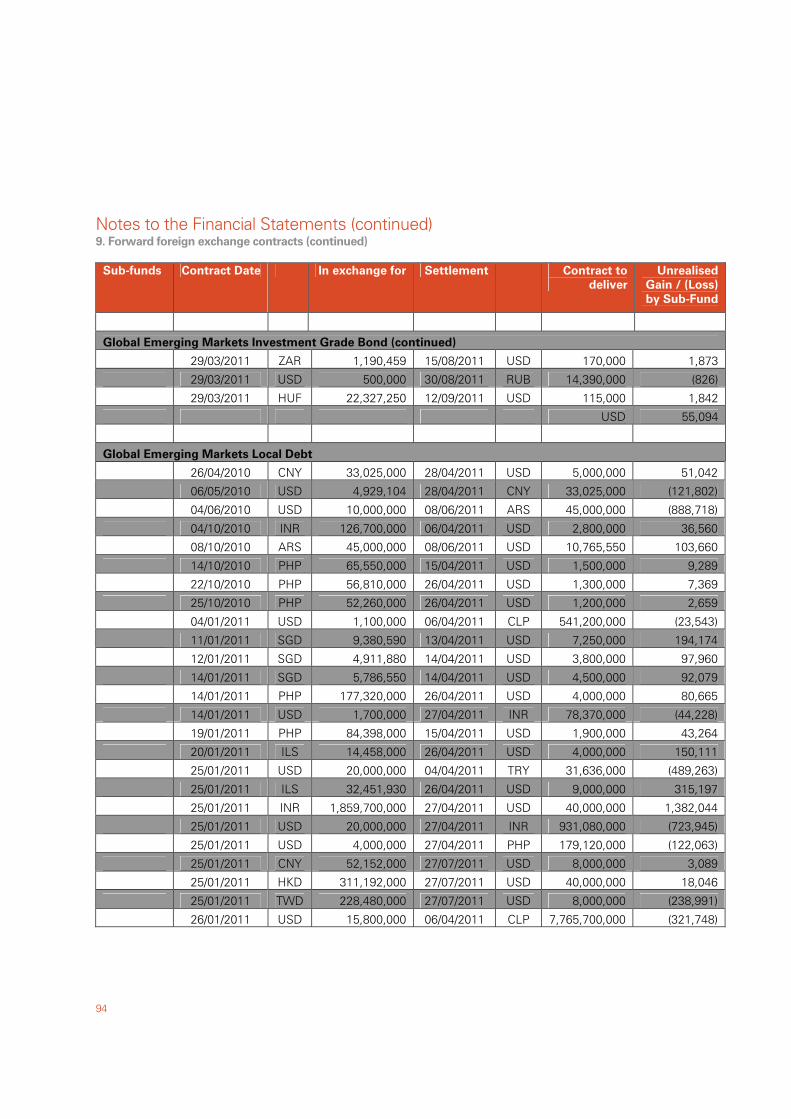
Notes to the Financial Statements (continued)
94
9. Forward foreign exchange contracts (continued)
Sub-funds Contract Date In exchange for Settlement Contract to
deliver
Unrealised
Gain / (Loss)
by Sub-Fund
Global Emerging Markets Investment Grade Bond (continued)
29/03/2011 ZAR 1,190,459 15/08/2011 USD 170,000 1,873
29/03/2011 USD 500,000 30/08/2011 RUB 14,390,000 (826)
29/03/2011 HUF 22,327,250 12/09/2011 USD 115,000 1,842
USD 55,094
Global Emerging Markets Local Debt
26/04/2010 CNY 33,025,000 28/04/2011 USD 5,000,000 51,042
06/05/2010 USD 4,929,104 28/04/2011 CNY 33,025,000 (121,802)
04/06/2010 USD 10,000,000 08/06/2011 ARS 45,000,000 (888,718)
04/10/2010 INR 126,700,000 06/04/2011 USD 2,800,000 36,560
08/10/2010 ARS 45,000,000 08/06/2011 USD 10,765,550 103,660
14/10/2010 PHP 65,550,000 15/04/2011 USD 1,500,000 9,289
22/10/2010 PHP 56,810,000 26/04/2011 USD 1,300,000 7,369
25/10/2010 PHP 52,260,000 26/04/2011 USD 1,200,000 2,659
04/01/2011 USD 1,100,000 06/04/2011 CLP 541,200,000 (23,543)
11/01/2011 SGD 9,380,590 13/04/2011 USD 7,250,000 194,174
12/01/2011 SGD 4,911,880 14/04/2011 USD 3,800,000 97,960
14/01/2011 SGD 5,786,550 14/04/2011 USD 4,500,000 92,079
14/01/2011 PHP 177,320,000 26/04/2011 USD 4,000,000 80,665
14/01/2011 USD 1,700,000 27/04/2011 INR 78,370,000 (44,228)
19/01/2011 PHP 84,398,000 15/04/2011 USD 1,900,000 43,264
20/01/2011 ILS 14,458,000 26/04/2011 USD 4,000,000 150,111
25/01/2011 USD 20,000,000 04/04/2011 TRY 31,636,000 (489,263)
25/01/2011 ILS 32,451,930 26/04/2011 USD 9,000,000 315,197
25/01/2011 INR 1,859,700,000 27/04/2011 USD 40,000,000 1,382,044
25/01/2011 USD 20,000,000 27/04/2011 INR 931,080,000 (723,945)
25/01/2011 USD 4,000,000 27/04/2011 PHP 179,120,000 (122,063)
25/01/2011 CNY 52,152,000 27/07/2011 USD 8,000,000 3,089
25/01/2011 HKD 311,192,000 27/07/2011 USD 40,000,000 18,046
25/01/2011 TWD 228,480,000 27/07/2011 USD 8,000,000 (238,991)
26/01/2011 USD 15,800,000 06/04/2011 CLP 7,765,700,000 (321,748)
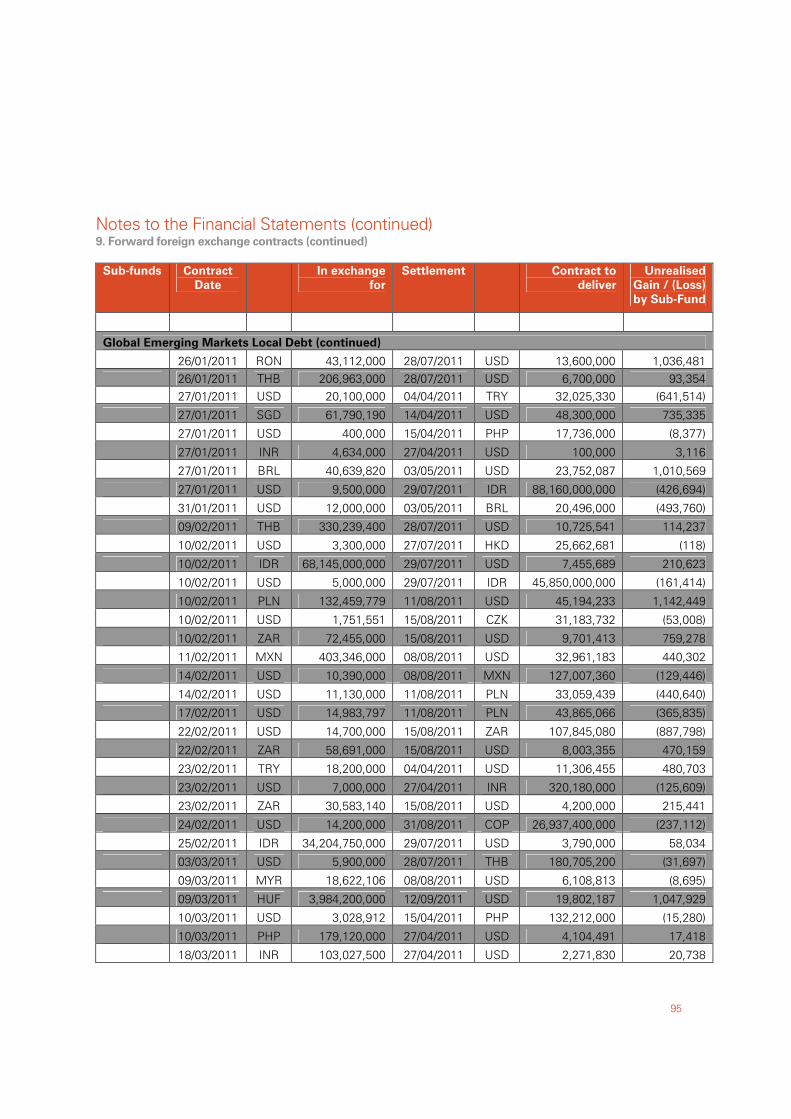
Notes to the Financial Statements (continued)
95
9. Forward foreign exchange contracts (continued)
Sub-funds Contract
Date
In exchange
for
Settlement Contract to
deliver
Unrealised
Gain / (Loss)
by Sub-Fund
Global Emerging Markets Local Debt (continued)
26/01/2011 RON 43,112,000 28/07/2011 USD 13,600,000 1,036,481 26/01/2011 THB 206,963,000 28/07/2011 USD 6,700,000 93,354 27/01/2011 USD 20,100,000 04/04/2011 TRY 32,025,330 (641,514)
27/01/2011 SGD 61,790,190 14/04/2011 USD 48,300,000 735,335
27/01/2011 USD 400,000 15/04/2011 PHP 17,736,000 (8,377)
27/01/2011 INR 4,634,000 27/04/2011 USD 100,000 3,116
27/01/2011 BRL 40,639,820 03/05/2011 USD 23,752,087 1,010,569
27/01/2011 USD 9,500,000 29/07/2011 IDR 88,160,000,000 (426,694)
31/01/2011 USD 12,000,000 03/05/2011 BRL 20,496,000 (493,760)
09/02/2011 THB 330,239,400 28/07/2011 USD 10,725,541 114,237
10/02/2011 USD 3,300,000 27/07/2011 HKD 25,662,681 (118)
10/02/2011 IDR 68,145,000,000 29/07/2011 USD 7,455,689 210,623
10/02/2011 USD 5,000,000 29/07/2011 IDR 45,850,000,000 (161,414)
10/02/2011 PLN 132,459,779 11/08/2011 USD 45,194,233 1,142,449
10/02/2011 USD 1,751,551 15/08/2011 CZK 31,183,732 (53,008)
10/02/2011 ZAR 72,455,000 15/08/2011 USD 9,701,413 759,278
11/02/2011 MXN 403,346,000 08/08/2011 USD 32,961,183 440,302
14/02/2011 USD 10,390,000 08/08/2011 MXN 127,007,360 (129,446)
14/02/2011 USD 11,130,000 11/08/2011 PLN 33,059,439 (440,640)
17/02/2011 USD 14,983,797 11/08/2011 PLN 43,865,066 (365,835)
22/02/2011 USD 14,700,000 15/08/2011 ZAR 107,845,080 (887,798)
22/02/2011 ZAR 58,691,000 15/08/2011 USD 8,003,355 470,159
23/02/2011 TRY 18,200,000 04/04/2011 USD 11,306,455 480,703
23/02/2011 USD 7,000,000 27/04/2011 INR 320,180,000 (125,609)
23/02/2011 ZAR 30,583,140 15/08/2011 USD 4,200,000 215,441
24/02/2011 USD 14,200,000 31/08/2011 COP 26,937,400,000 (237,112)
25/02/2011 IDR 34,204,750,000 29/07/2011 USD 3,790,000 58,034
03/03/2011 USD 5,900,000 28/07/2011 THB 180,705,200 (31,697)
09/03/2011 MYR 18,622,106 08/08/2011 USD 6,108,813 (8,695)
09/03/2011 HUF 3,984,200,000 12/09/2011 USD 19,802,187 1,047,929
10/03/2011 USD 3,028,912 15/04/2011 PHP 132,212,000 (15,280)
10/03/2011 PHP 179,120,000 27/04/2011 USD 4,104,491 17,418
18/03/2011 INR 103,027,500 27/04/2011 USD 2,271,830 20,738
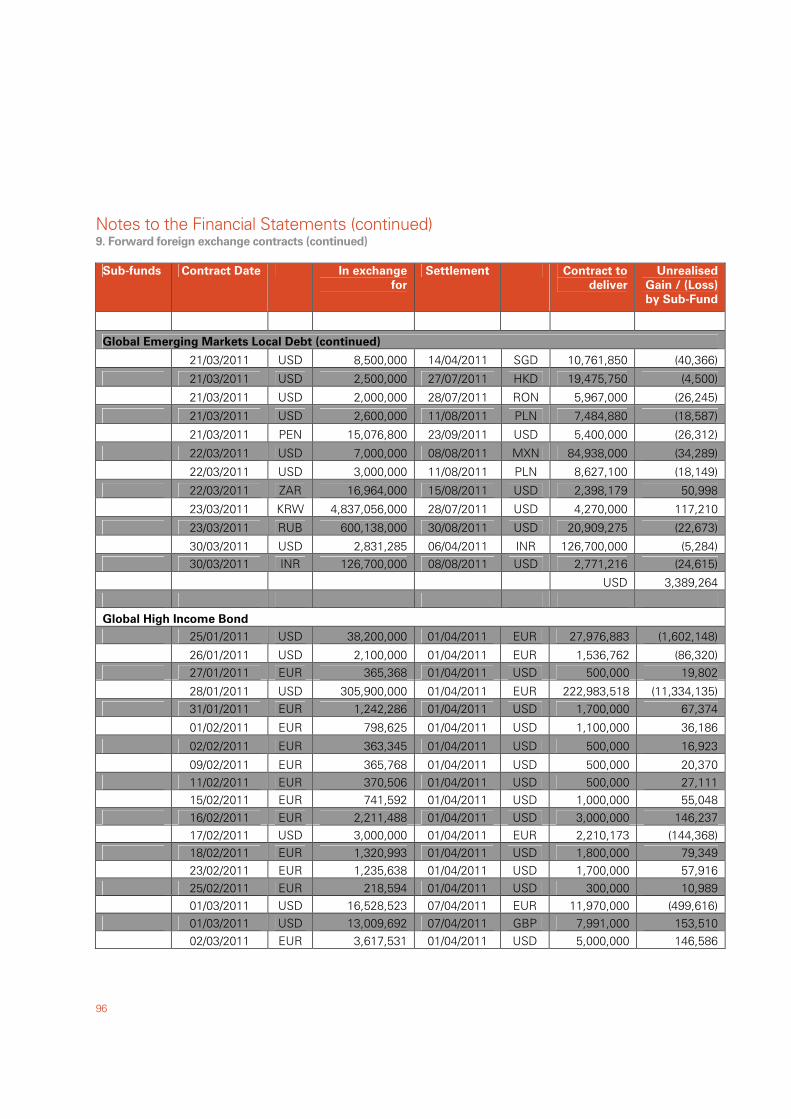
Notes to the Financial Statements (continued)
96
9. Forward foreign exchange contracts (continued)
Sub-funds Contract Date In exchange
for
Settlement Contract to
deliver
Unrealised
Gain / (Loss)
by Sub-Fund
Global Emerging Markets Local Debt (continued)
21/03/2011 USD 8,500,000 14/04/2011 SGD 10,761,850 (40,366)
21/03/2011 USD 2,500,000 27/07/2011 HKD 19,475,750 (4,500)
21/03/2011 USD 2,000,000 28/07/2011 RON 5,967,000 (26,245)
21/03/2011 USD 2,600,000 11/08/2011 PLN 7,484,880 (18,587)
21/03/2011 PEN 15,076,800 23/09/2011 USD 5,400,000 (26,312)
22/03/2011 USD 7,000,000 08/08/2011 MXN 84,938,000 (34,289)
22/03/2011 USD 3,000,000 11/08/2011 PLN 8,627,100 (18,149)
22/03/2011 ZAR 16,964,000 15/08/2011 USD 2,398,179 50,998
23/03/2011 KRW 4,837,056,000 28/07/2011 USD 4,270,000 117,210
23/03/2011 RUB 600,138,000 30/08/2011 USD 20,909,275 (22,673)
30/03/2011 USD 2,831,285 06/04/2011 INR 126,700,000 (5,284) 30/03/2011 INR 126,700,000 08/08/2011 USD 2,771,216 (24,615)
USD 3,389,264
Global High Income Bond 25/01/2011 USD 38,200,000 01/04/2011 EUR 27,976,883 (1,602,148)
26/01/2011 USD 2,100,000 01/04/2011 EUR 1,536,762 (86,320) 27/01/2011 EUR 365,368 01/04/2011 USD 500,000 19,802
28/01/2011 USD 305,900,000 01/04/2011 EUR 222,983,518 (11,334,135) 31/01/2011 EUR 1,242,286 01/04/2011 USD 1,700,000 67,374
01/02/2011 EUR 798,625 01/04/2011 USD 1,100,000 36,186
02/02/2011 EUR 363,345 01/04/2011 USD 500,000 16,923
09/02/2011 EUR 365,768 01/04/2011 USD 500,000 20,370 11/02/2011 EUR 370,506 01/04/2011 USD 500,000 27,111 15/02/2011 EUR 741,592 01/04/2011 USD 1,000,000 55,048 16/02/2011 EUR 2,211,488 01/04/2011 USD 3,000,000 146,237 17/02/2011 USD 3,000,000 01/04/2011 EUR 2,210,173 (144,368) 18/02/2011 EUR 1,320,993 01/04/2011 USD 1,800,000 79,349 23/02/2011 EUR 1,235,638 01/04/2011 USD 1,700,000 57,916 25/02/2011 EUR 218,594 01/04/2011 USD 300,000 10,989 01/03/2011 USD 16,528,523 07/04/2011 EUR 11,970,000 (499,616) 01/03/2011 USD 13,009,692 07/04/2011 GBP 7,991,000 153,510 02/03/2011 EUR 3,617,531 01/04/2011 USD 5,000,000 146,586
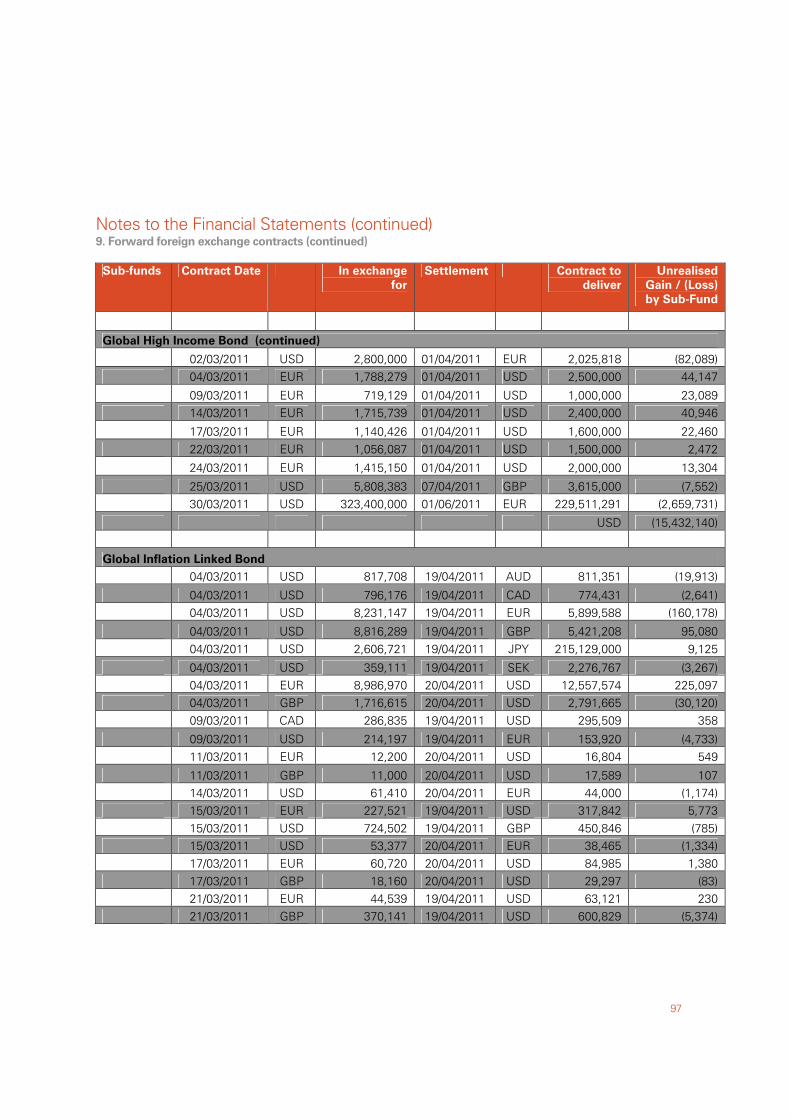
Notes to the Financial Statements (continued)
97
9. Forward foreign exchange contracts (continued)
Sub-funds Contract Date In exchange
for
Settlement Contract to
deliver
Unrealised
Gain / (Loss)
by Sub-Fund
Global High Income Bond (continued)
02/03/2011 USD 2,800,000 01/04/2011 EUR 2,025,818 (82,089) 04/03/2011 EUR 1,788,279 01/04/2011 USD 2,500,000 44,147
09/03/2011 EUR 719,129 01/04/2011 USD 1,000,000 23,089 14/03/2011 EUR 1,715,739 01/04/2011 USD 2,400,000 40,946
17/03/2011 EUR 1,140,426 01/04/2011 USD 1,600,000 22,460 22/03/2011 EUR 1,056,087 01/04/2011 USD 1,500,000 2,472
24/03/2011 EUR 1,415,150 01/04/2011 USD 2,000,000 13,304
25/03/2011 USD 5,808,383 07/04/2011 GBP 3,615,000 (7,552) 30/03/2011 USD 323,400,000 01/06/2011 EUR 229,511,291 (2,659,731)
USD (15,432,140)
Global Inflation Linked Bond
04/03/2011 USD 817,708 19/04/2011 AUD 811,351 (19,913)
04/03/2011 USD 796,176 19/04/2011 CAD 774,431 (2,641) 04/03/2011 USD 8,231,147 19/04/2011 EUR 5,899,588 (160,178)
04/03/2011 USD 8,816,289 19/04/2011 GBP 5,421,208 95,080 04/03/2011 USD 2,606,721 19/04/2011 JPY 215,129,000 9,125
04/03/2011 USD 359,111 19/04/2011 SEK 2,276,767 (3,267) 04/03/2011 EUR 8,986,970 20/04/2011 USD 12,557,574 225,097 04/03/2011 GBP 1,716,615 20/04/2011 USD 2,791,665 (30,120) 09/03/2011 CAD 286,835 19/04/2011 USD 295,509 358
09/03/2011 USD 214,197 19/04/2011 EUR 153,920 (4,733) 11/03/2011 EUR 12,200 20/04/2011 USD 16,804 549
11/03/2011 GBP 11,000 20/04/2011 USD 17,589 107 14/03/2011 USD 61,410 20/04/2011 EUR 44,000 (1,174) 15/03/2011 EUR 227,521 19/04/2011 USD 317,842 5,773 15/03/2011 USD 724,502 19/04/2011 GBP 450,846 (785) 15/03/2011 USD 53,377 20/04/2011 EUR 38,465 (1,334) 17/03/2011 EUR 60,720 20/04/2011 USD 84,985 1,380 17/03/2011 GBP 18,160 20/04/2011 USD 29,297 (83) 21/03/2011 EUR 44,539 19/04/2011 USD 63,121 230 21/03/2011 GBP 370,141 19/04/2011 USD 600,829 (5,374)
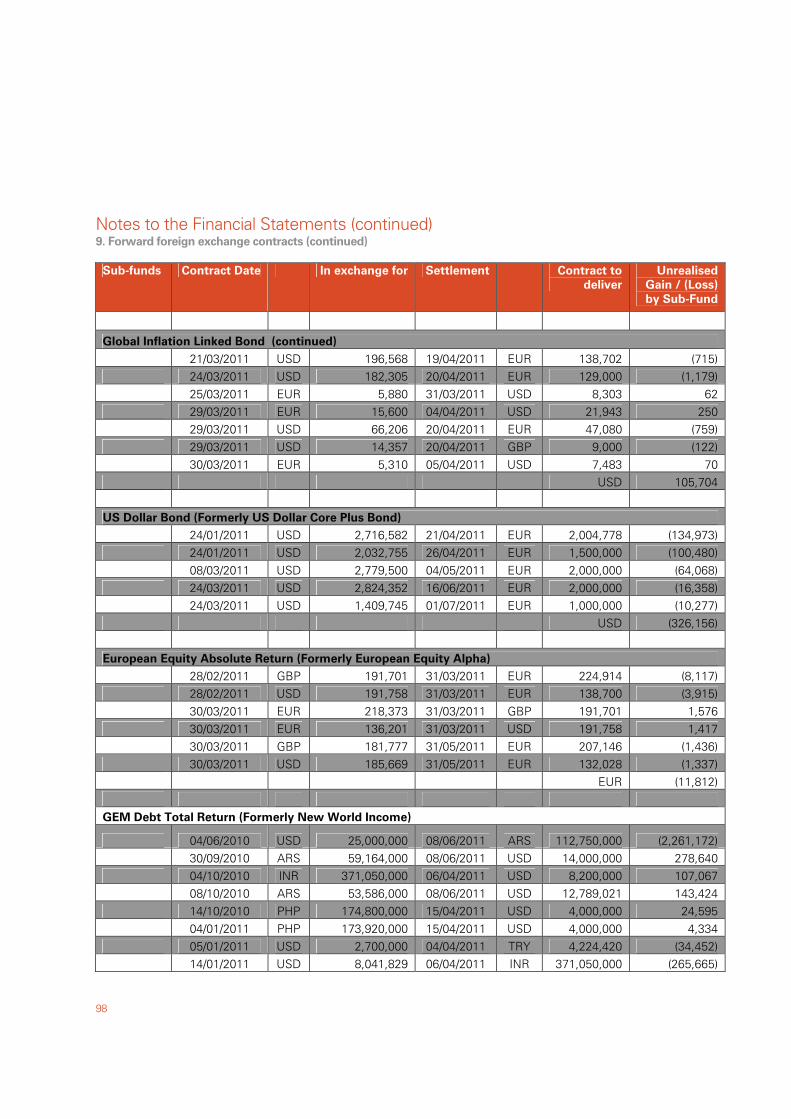
Notes to the Financial Statements (continued)
98
9. Forward foreign exchange contracts (continued)
Sub-funds Contract Date In exchange for Settlement Contract to
deliver
Unrealised
Gain / (Loss)
by Sub-Fund
Global Inflation Linked Bond (continued)
21/03/2011 USD 196,568 19/04/2011 EUR 138,702 (715) 24/03/2011 USD 182,305 20/04/2011 EUR 129,000 (1,179) 25/03/2011 EUR 5,880 31/03/2011 USD 8,303 62 29/03/2011 EUR 15,600 04/04/2011 USD 21,943 250 29/03/2011 USD 66,206 20/04/2011 EUR 47,080 (759) 29/03/2011 USD 14,357 20/04/2011 GBP 9,000 (122) 30/03/2011 EUR 5,310 05/04/2011 USD 7,483 70 USD 105,704
US Dollar Bond (Formerly US Dollar Core Plus Bond)
24/01/2011 USD 2,716,582 21/04/2011 EUR 2,004,778 (134,973) 24/01/2011 USD 2,032,755 26/04/2011 EUR 1,500,000 (100,480) 08/03/2011 USD 2,779,500 04/05/2011 EUR 2,000,000 (64,068) 24/03/2011 USD 2,824,352 16/06/2011 EUR 2,000,000 (16,358) 24/03/2011 USD 1,409,745 01/07/2011 EUR 1,000,000 (10,277) USD (326,156)
European Equity Absolute Return (Formerly European Equity Alpha)
28/02/2011 GBP 191,701 31/03/2011 EUR 224,914 (8,117) 28/02/2011 USD 191,758 31/03/2011 EUR 138,700 (3,915) 30/03/2011 EUR 218,373 31/03/2011 GBP 191,701 1,576 30/03/2011 EUR 136,201 31/03/2011 USD 191,758 1,417 30/03/2011 GBP 181,777 31/05/2011 EUR 207,146 (1,436) 30/03/2011 USD 185,669 31/05/2011 EUR 132,028 (1,337) EUR (11,812)
GEM Debt Total Return (Formerly New World Income)
04/06/2010 USD 25,000,000 08/06/2011 ARS 112,750,000 (2,261,172) 30/09/2010 ARS 59,164,000 08/06/2011 USD 14,000,000 278,640 04/10/2010 INR 371,050,000 06/04/2011 USD 8,200,000 107,067 08/10/2010 ARS 53,586,000 08/06/2011 USD 12,789,021 143,424 14/10/2010 PHP 174,800,000 15/04/2011 USD 4,000,000 24,595 04/01/2011 PHP 173,920,000 15/04/2011 USD 4,000,000 4,334 05/01/2011 USD 2,700,000 04/04/2011 TRY 4,224,420 (34,452) 14/01/2011 USD 8,041,829 06/04/2011 INR 371,050,000 (265,665)
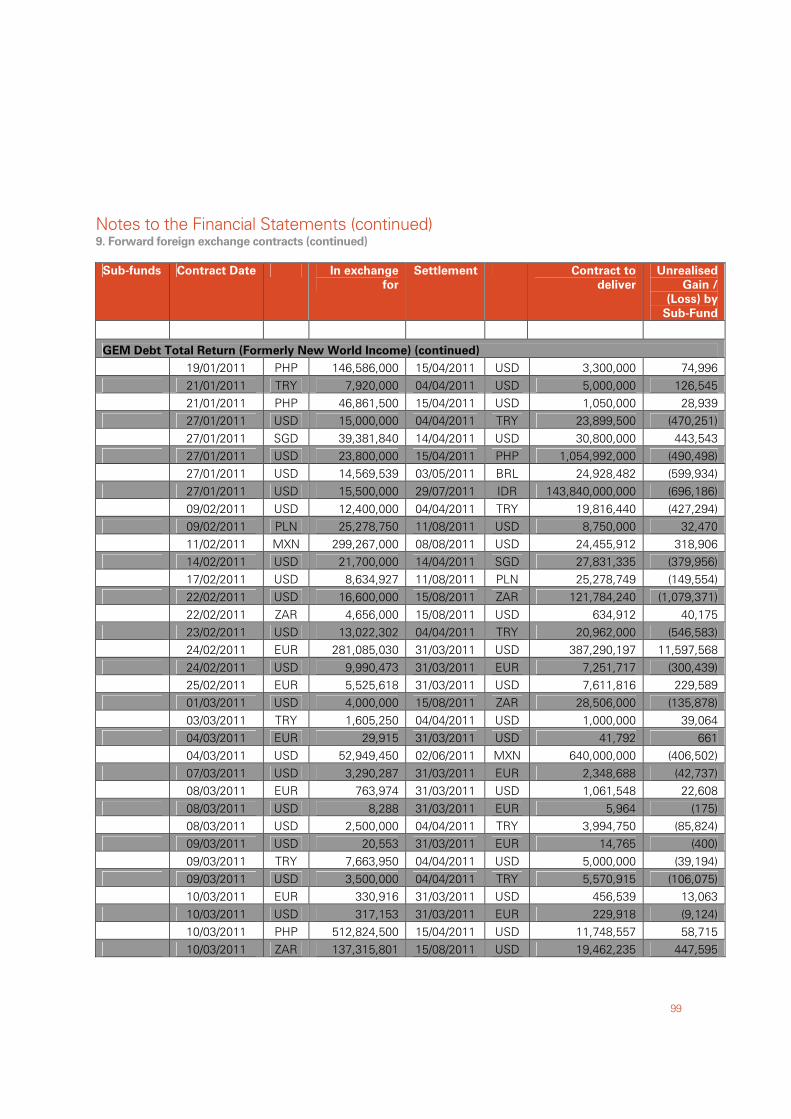
Notes to the Financial Statements (continued)
99
9. Forward foreign exchange contracts (continued)
Sub-funds Contract Date In exchange
for
Settlement Contract to
deliver
Unrealised
Gain /
(Loss) by
Sub-Fund
GEM Debt Total Return (Formerly New World Income) (continued) 19/01/2011 PHP 146,586,000 15/04/2011 USD 3,300,000 74,996 21/01/2011 TRY 7,920,000 04/04/2011 USD 5,000,000 126,545 21/01/2011 PHP 46,861,500 15/04/2011 USD 1,050,000 28,939 27/01/2011 USD 15,000,000 04/04/2011 TRY 23,899,500 (470,251) 27/01/2011 SGD 39,381,840 14/04/2011 USD 30,800,000 443,543 27/01/2011 USD 23,800,000 15/04/2011 PHP 1,054,992,000 (490,498) 27/01/2011 USD 14,569,539 03/05/2011 BRL 24,928,482 (599,934) 27/01/2011 USD 15,500,000 29/07/2011 IDR 143,840,000,000 (696,186) 09/02/2011 USD 12,400,000 04/04/2011 TRY 19,816,440 (427,294) 09/02/2011 PLN 25,278,750 11/08/2011 USD 8,750,000 32,470 11/02/2011 MXN 299,267,000 08/08/2011 USD 24,455,912 318,906 14/02/2011 USD 21,700,000 14/04/2011 SGD 27,831,335 (379,956) 17/02/2011 USD 8,634,927 11/08/2011 PLN 25,278,749 (149,554) 22/02/2011 USD 16,600,000 15/08/2011 ZAR 121,784,240 (1,079,371) 22/02/2011 ZAR 4,656,000 15/08/2011 USD 634,912 40,175 23/02/2011 USD 13,022,302 04/04/2011 TRY 20,962,000 (546,583) 24/02/2011 EUR 281,085,030 31/03/2011 USD 387,290,197 11,597,568 24/02/2011 USD 9,990,473 31/03/2011 EUR 7,251,717 (300,439) 25/02/2011 EUR 5,525,618 31/03/2011 USD 7,611,816 229,589 01/03/2011 USD 4,000,000 15/08/2011 ZAR 28,506,000 (135,878) 03/03/2011 TRY 1,605,250 04/04/2011 USD 1,000,000 39,064 04/03/2011 EUR 29,915 31/03/2011 USD 41,792 661 04/03/2011 USD 52,949,450 02/06/2011 MXN 640,000,000 (406,502) 07/03/2011 USD 3,290,287 31/03/2011 EUR 2,348,688 (42,737) 08/03/2011 EUR 763,974 31/03/2011 USD 1,061,548 22,608 08/03/2011 USD 8,288 31/03/2011 EUR 5,964 (175) 08/03/2011 USD 2,500,000 04/04/2011 TRY 3,994,750 (85,824) 09/03/2011 USD 20,553 31/03/2011 EUR 14,765 (400) 09/03/2011 TRY 7,663,950 04/04/2011 USD 5,000,000 (39,194) 09/03/2011 USD 3,500,000 04/04/2011 TRY 5,570,915 (106,075) 10/03/2011 EUR 330,916 31/03/2011 USD 456,539 13,063 10/03/2011 USD 317,153 31/03/2011 EUR 229,918 (9,124) 10/03/2011 PHP 512,824,500 15/04/2011 USD 11,748,557 58,715 10/03/2011 ZAR 137,315,801 15/08/2011 USD 19,462,235 447,595
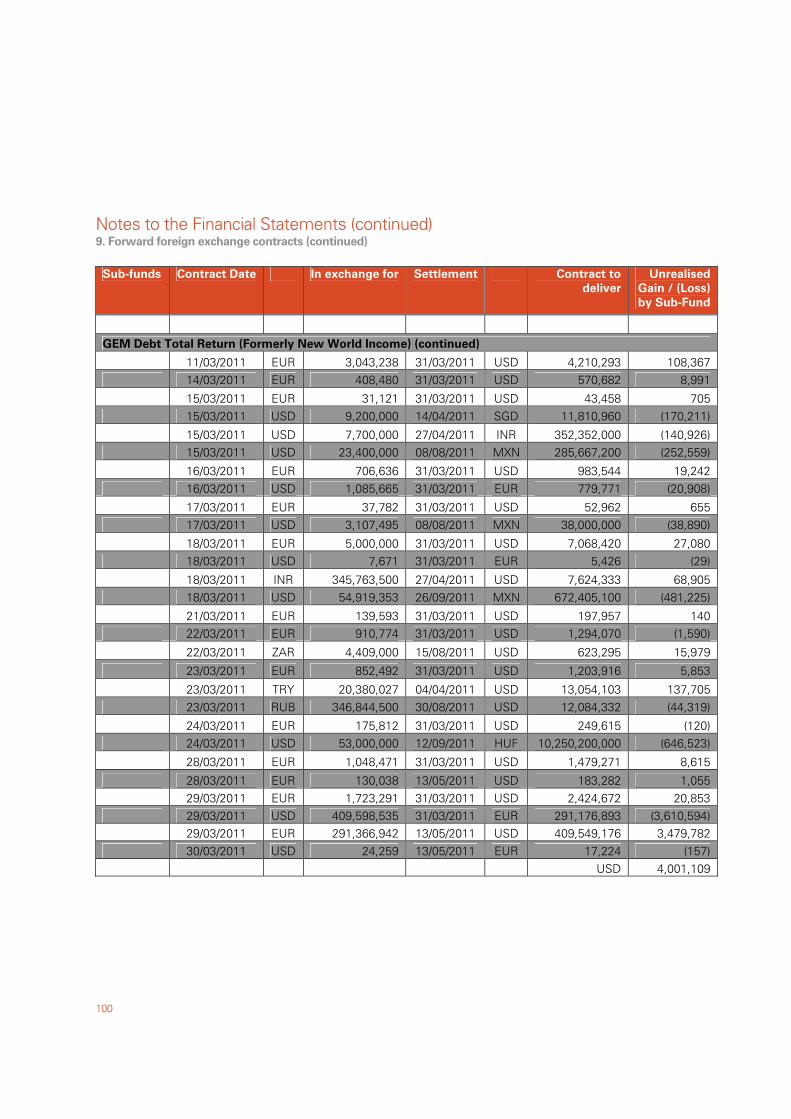
Notes to the Financial Statements (continued)
100
9. Forward foreign exchange contracts (continued)
Sub-funds Contract Date In exchange for Settlement Contract to
deliver
Unrealised
Gain / (Loss)
by Sub-Fund
GEM Debt Total Return (Formerly New World Income) (continued)
11/03/2011 EUR 3,043,238 31/03/2011 USD 4,210,293 108,367 14/03/2011 EUR 408,480 31/03/2011 USD 570,682 8,991
15/03/2011 EUR 31,121 31/03/2011 USD 43,458 705 15/03/2011 USD 9,200,000 14/04/2011 SGD 11,810,960 (170,211)
15/03/2011 USD 7,700,000 27/04/2011 INR 352,352,000 (140,926) 15/03/2011 USD 23,400,000 08/08/2011 MXN 285,667,200 (252,559)
16/03/2011 EUR 706,636 31/03/2011 USD 983,544 19,242 16/03/2011 USD 1,085,665 31/03/2011 EUR 779,771 (20,908)
17/03/2011 EUR 37,782 31/03/2011 USD 52,962 655 17/03/2011 USD 3,107,495 08/08/2011 MXN 38,000,000 (38,890)
18/03/2011 EUR 5,000,000 31/03/2011 USD 7,068,420 27,080 18/03/2011 USD 7,671 31/03/2011 EUR 5,426 (29)
18/03/2011 INR 345,763,500 27/04/2011 USD 7,624,333 68,905 18/03/2011 USD 54,919,353 26/09/2011 MXN 672,405,100 (481,225)
21/03/2011 EUR 139,593 31/03/2011 USD 197,957 140 22/03/2011 EUR 910,774 31/03/2011 USD 1,294,070 (1,590)
22/03/2011 ZAR 4,409,000 15/08/2011 USD 623,295 15,979
23/03/2011 EUR 852,492 31/03/2011 USD 1,203,916 5,853
23/03/2011 TRY 20,380,027 04/04/2011 USD 13,054,103 137,705 23/03/2011 RUB 346,844,500 30/08/2011 USD 12,084,332 (44,319)
24/03/2011 EUR 175,812 31/03/2011 USD 249,615 (120) 24/03/2011 USD 53,000,000 12/09/2011 HUF 10,250,200,000 (646,523)
28/03/2011 EUR 1,048,471 31/03/2011 USD 1,479,271 8,615
28/03/2011 EUR 130,038 13/05/2011 USD 183,282 1,055 29/03/2011 EUR 1,723,291 31/03/2011 USD 2,424,672 20,853 29/03/2011 USD 409,598,535 31/03/2011 EUR 291,176,893 (3,610,594) 29/03/2011 EUR 291,366,942 13/05/2011 USD 409,549,176 3,479,782 30/03/2011 USD 24,259 13/05/2011 EUR 17,224 (157) USD 4,001,109
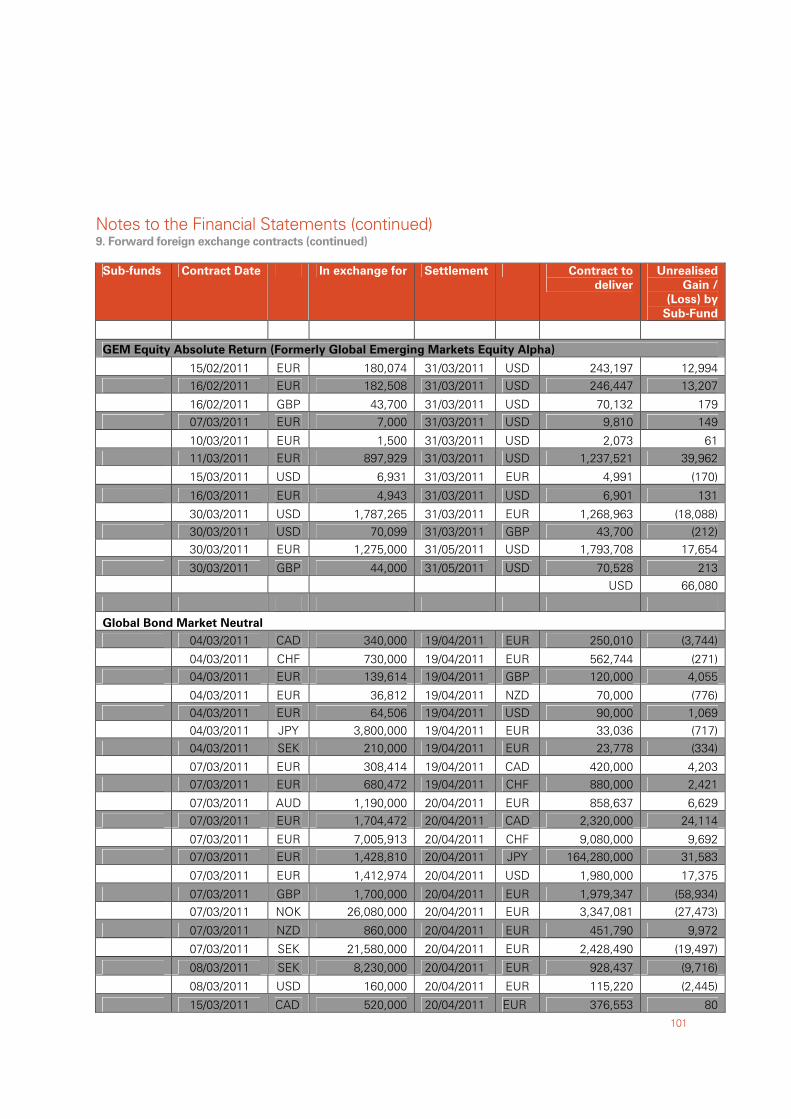
Notes to the Financial Statements (continued)
101
9. Forward foreign exchange contracts (continued)
Sub-funds Contract Date In exchange for Settlement Contract to
deliver
Unrealised
Gain /
(Loss) by
Sub-Fund
GEM Equity Absolute Return (Formerly Global Emerging Markets Equity Alpha)
15/02/2011 EUR 180,074 31/03/2011 USD 243,197 12,994 16/02/2011 EUR 182,508 31/03/2011 USD 246,447 13,207
16/02/2011 GBP 43,700 31/03/2011 USD 70,132 179 07/03/2011 EUR 7,000 31/03/2011 USD 9,810 149
10/03/2011 EUR 1,500 31/03/2011 USD 2,073 61 11/03/2011 EUR 897,929 31/03/2011 USD 1,237,521 39,962
15/03/2011 USD 6,931 31/03/2011 EUR 4,991 (170)
16/03/2011 EUR 4,943 31/03/2011 USD 6,901 131
30/03/2011 USD 1,787,265 31/03/2011 EUR 1,268,963 (18,088) 30/03/2011 USD 70,099 31/03/2011 GBP 43,700 (212) 30/03/2011 EUR 1,275,000 31/05/2011 USD 1,793,708 17,654
30/03/2011 GBP 44,000 31/05/2011 USD 70,528 213 USD 66,080
Global Bond Market Neutral 04/03/2011 CAD 340,000 19/04/2011 EUR 250,010 (3,744)
04/03/2011 CHF 730,000 19/04/2011 EUR 562,744 (271) 04/03/2011 EUR 139,614 19/04/2011 GBP 120,000 4,055
04/03/2011 EUR 36,812 19/04/2011 NZD 70,000 (776) 04/03/2011 EUR 64,506 19/04/2011 USD 90,000 1,069 04/03/2011 JPY 3,800,000 19/04/2011 EUR 33,036 (717) 04/03/2011 SEK 210,000 19/04/2011 EUR 23,778 (334)
07/03/2011 EUR 308,414 19/04/2011 CAD 420,000 4,203 07/03/2011 EUR 680,472 19/04/2011 CHF 880,000 2,421
07/03/2011 AUD 1,190,000 20/04/2011 EUR 858,637 6,629 07/03/2011 EUR 1,704,472 20/04/2011 CAD 2,320,000 24,114
07/03/2011 EUR 7,005,913 20/04/2011 CHF 9,080,000 9,692 07/03/2011 EUR 1,428,810 20/04/2011 JPY 164,280,000 31,583
07/03/2011 EUR 1,412,974 20/04/2011 USD 1,980,000 17,375
07/03/2011 GBP 1,700,000 20/04/2011 EUR 1,979,347 (58,934) 07/03/2011 NOK 26,080,000 20/04/2011 EUR 3,347,081 (27,473)
07/03/2011 NZD 860,000 20/04/2011 EUR 451,790 9,972
07/03/2011 SEK 21,580,000 20/04/2011 EUR 2,428,490 (19,497)
08/03/2011 SEK 8,230,000 20/04/2011 EUR 928,437 (9,716)
08/03/2011 USD 160,000 20/04/2011 EUR 115,220 (2,445)
15/03/2011 CAD 520,000 20/04/2011 EUR 376,553 80
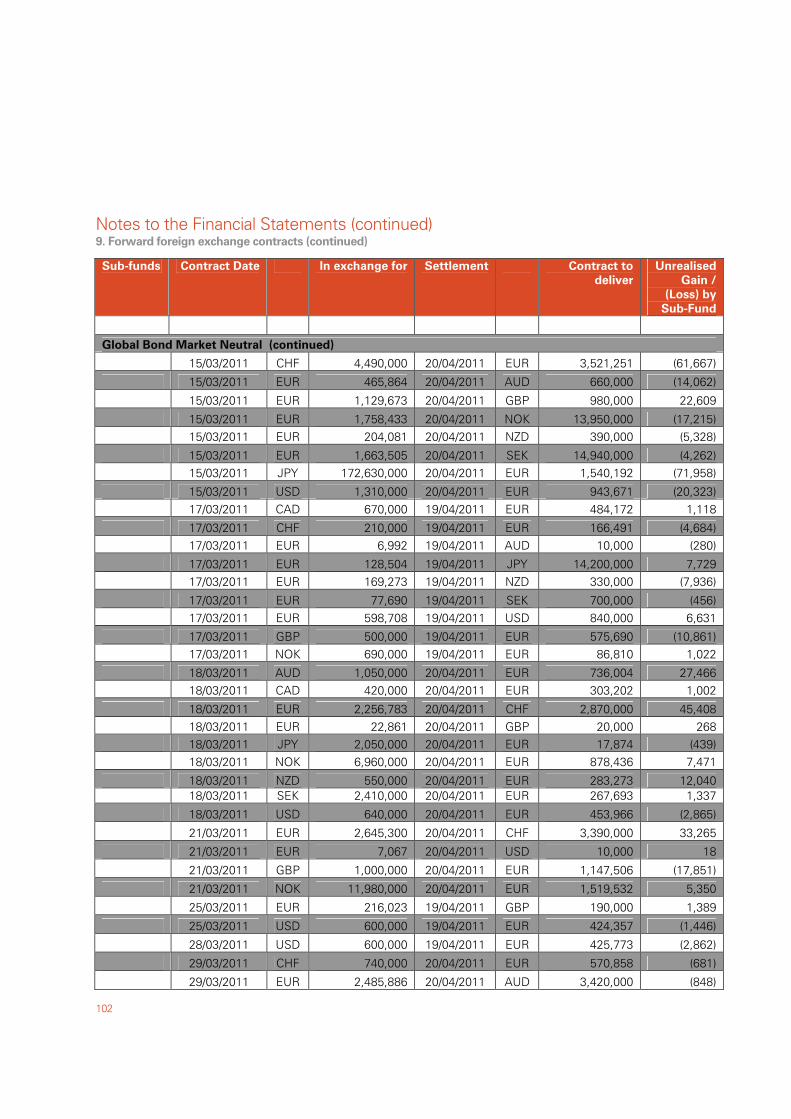
Notes to the Financial Statements (continued)
102
9. Forward foreign exchange contracts (continued)
Sub-funds Contract Date In exchange for Settlement Contract to
deliver
Unrealised
Gain /
(Loss) by
Sub-Fund
Global Bond Market Neutral (continued)
15/03/2011 CHF 4,490,000 20/04/2011 EUR 3,521,251 (61,667)
15/03/2011 EUR 465,864 20/04/2011 AUD 660,000 (14,062)
15/03/2011 EUR 1,129,673 20/04/2011 GBP 980,000 22,609
15/03/2011 EUR 1,758,433 20/04/2011 NOK 13,950,000 (17,215) 15/03/2011 EUR 204,081 20/04/2011 NZD 390,000 (5,328)
15/03/2011 EUR 1,663,505 20/04/2011 SEK 14,940,000 (4,262) 15/03/2011 JPY 172,630,000 20/04/2011 EUR 1,540,192 (71,958)
15/03/2011 USD 1,310,000 20/04/2011 EUR 943,671 (20,323) 17/03/2011 CAD 670,000 19/04/2011 EUR 484,172 1,118
17/03/2011 CHF 210,000 19/04/2011 EUR 166,491 (4,684) 17/03/2011 EUR 6,992 19/04/2011 AUD 10,000 (280)
17/03/2011 EUR 128,504 19/04/2011 JPY 14,200,000 7,729 17/03/2011 EUR 169,273 19/04/2011 NZD 330,000 (7,936)
17/03/2011 EUR 77,690 19/04/2011 SEK 700,000 (456) 17/03/2011 EUR 598,708 19/04/2011 USD 840,000 6,631
17/03/2011 GBP 500,000 19/04/2011 EUR 575,690 (10,861) 17/03/2011 NOK 690,000 19/04/2011 EUR 86,810 1,022
18/03/2011 AUD 1,050,000 20/04/2011 EUR 736,004 27,466 18/03/2011 CAD 420,000 20/04/2011 EUR 303,202 1,002
18/03/2011 EUR 2,256,783 20/04/2011 CHF 2,870,000 45,408 18/03/2011 EUR 22,861 20/04/2011 GBP 20,000 268 18/03/2011 JPY 2,050,000 20/04/2011 EUR 17,874 (439) 18/03/2011 NOK 6,960,000 20/04/2011 EUR 878,436 7,471
18/03/2011 NZD 550,000 20/04/2011 EUR 283,273 12,040 18/03/2011 SEK 2,410,000 20/04/2011 EUR 267,693 1,337
18/03/2011 USD 640,000 20/04/2011 EUR 453,966 (2,865)
21/03/2011 EUR 2,645,300 20/04/2011 CHF 3,390,000 33,265
21/03/2011 EUR 7,067 20/04/2011 USD 10,000 18
21/03/2011 GBP 1,000,000 20/04/2011 EUR 1,147,506 (17,851)
21/03/2011 NOK 11,980,000 20/04/2011 EUR 1,519,532 5,350
25/03/2011 EUR 216,023 19/04/2011 GBP 190,000 1,389
25/03/2011 USD 600,000 19/04/2011 EUR 424,357 (1,446)
28/03/2011 USD 600,000 19/04/2011 EUR 425,773 (2,862)
29/03/2011 CHF 740,000 20/04/2011 EUR 570,858 (681)
29/03/2011 EUR 2,485,886 20/04/2011 AUD 3,420,000 (848)
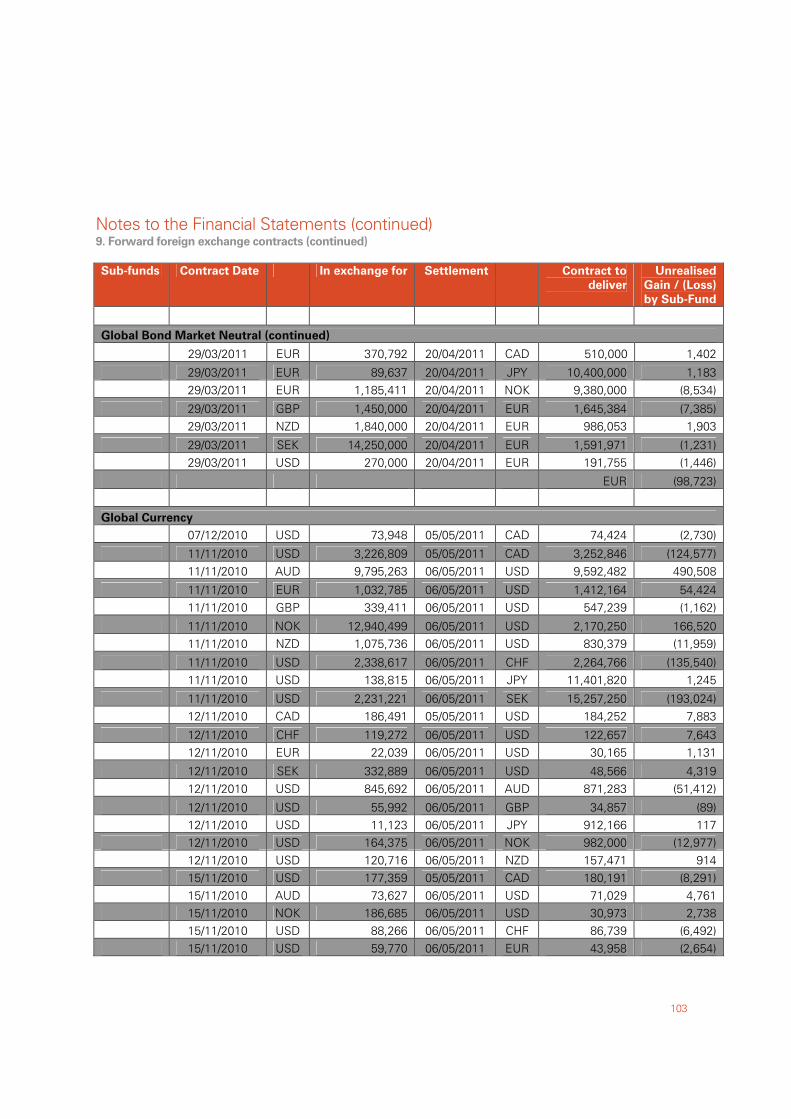
Notes to the Financial Statements (continued)
103
9. Forward foreign exchange contracts (continued)
Sub-funds Contract Date In exchange for Settlement Contract to
deliver
Unrealised
Gain / (Loss)
by Sub-Fund
Global Bond Market Neutral (continued)
29/03/2011 EUR 370,792 20/04/2011 CAD 510,000 1,402
29/03/2011 EUR 89,637 20/04/2011 JPY 10,400,000 1,183 29/03/2011 EUR 1,185,411 20/04/2011 NOK 9,380,000 (8,534)
29/03/2011 GBP 1,450,000 20/04/2011 EUR 1,645,384 (7,385) 29/03/2011 NZD 1,840,000 20/04/2011 EUR 986,053 1,903
29/03/2011 SEK 14,250,000 20/04/2011 EUR 1,591,971 (1,231) 29/03/2011 USD 270,000 20/04/2011 EUR 191,755 (1,446)
EUR (98,723)
Global Currency 07/12/2010 USD 73,948 05/05/2011 CAD 74,424 (2,730)
11/11/2010 USD 3,226,809 05/05/2011 CAD 3,252,846 (124,577) 11/11/2010 AUD 9,795,263 06/05/2011 USD 9,592,482 490,508
11/11/2010 EUR 1,032,785 06/05/2011 USD 1,412,164 54,424 11/11/2010 GBP 339,411 06/05/2011 USD 547,239 (1,162)
11/11/2010 NOK 12,940,499 06/05/2011 USD 2,170,250 166,520 11/11/2010 NZD 1,075,736 06/05/2011 USD 830,379 (11,959)
11/11/2010 USD 2,338,617 06/05/2011 CHF 2,264,766 (135,540) 11/11/2010 USD 138,815 06/05/2011 JPY 11,401,820 1,245
11/11/2010 USD 2,231,221 06/05/2011 SEK 15,257,250 (193,024) 12/11/2010 CAD 186,491 05/05/2011 USD 184,252 7,883
12/11/2010 CHF 119,272 06/05/2011 USD 122,657 7,643 12/11/2010 EUR 22,039 06/05/2011 USD 30,165 1,131
12/11/2010 SEK 332,889 06/05/2011 USD 48,566 4,319 12/11/2010 USD 845,692 06/05/2011 AUD 871,283 (51,412)
12/11/2010 USD 55,992 06/05/2011 GBP 34,857 (89) 12/11/2010 USD 11,123 06/05/2011 JPY 912,166 117 12/11/2010 USD 164,375 06/05/2011 NOK 982,000 (12,977) 12/11/2010 USD 120,716 06/05/2011 NZD 157,471 914 15/11/2010 USD 177,359 05/05/2011 CAD 180,191 (8,291) 15/11/2010 AUD 73,627 06/05/2011 USD 71,029 4,761 15/11/2010 NOK 186,685 06/05/2011 USD 30,973 2,738 15/11/2010 USD 88,266 06/05/2011 CHF 86,739 (6,492) 15/11/2010 USD 59,770 06/05/2011 EUR 43,958 (2,654)
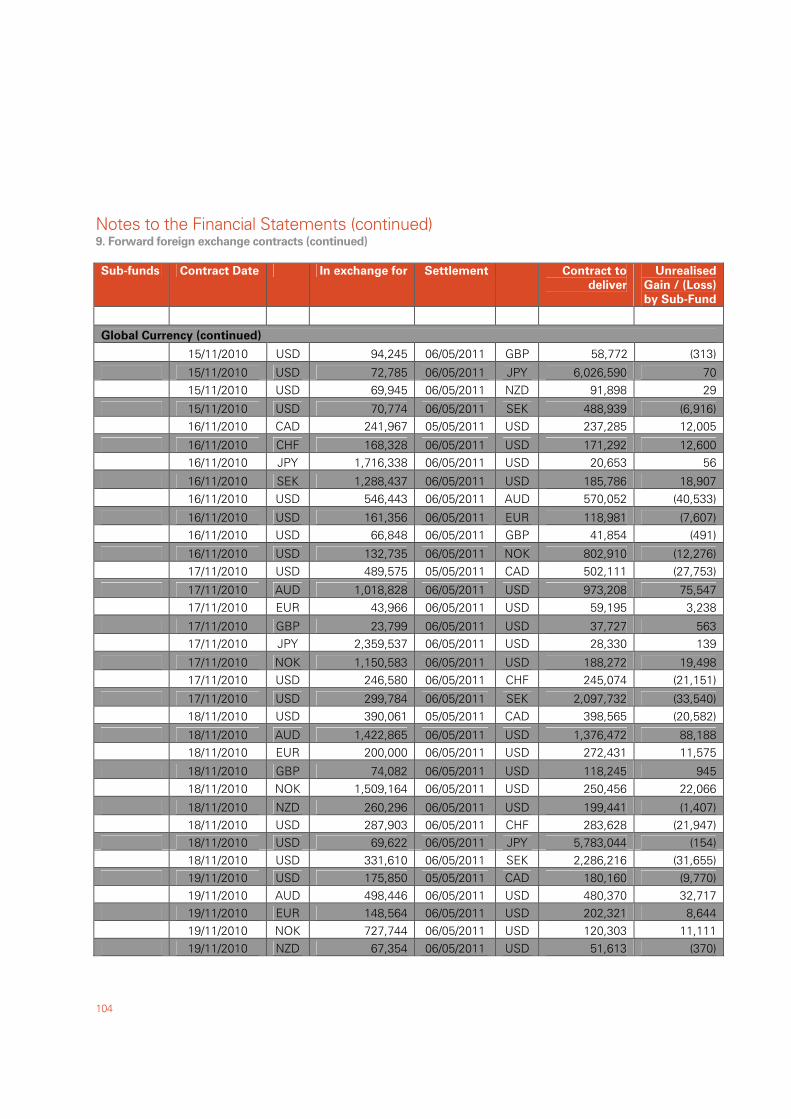
Notes to the Financial Statements (continued)
104
9. Forward foreign exchange contracts (continued)
Sub-funds Contract Date In exchange for Settlement Contract to
deliver
Unrealised
Gain / (Loss)
by Sub-Fund
Global Currency (continued)
15/11/2010 USD 94,245 06/05/2011 GBP 58,772 (313)
15/11/2010 USD 72,785 06/05/2011 JPY 6,026,590 70 15/11/2010 USD 69,945 06/05/2011 NZD 91,898 29
15/11/2010 USD 70,774 06/05/2011 SEK 488,939 (6,916) 16/11/2010 CAD 241,967 05/05/2011 USD 237,285 12,005
16/11/2010 CHF 168,328 06/05/2011 USD 171,292 12,600 16/11/2010 JPY 1,716,338 06/05/2011 USD 20,653 56
16/11/2010 SEK 1,288,437 06/05/2011 USD 185,786 18,907 16/11/2010 USD 546,443 06/05/2011 AUD 570,052 (40,533)
16/11/2010 USD 161,356 06/05/2011 EUR 118,981 (7,607) 16/11/2010 USD 66,848 06/05/2011 GBP 41,854 (491)
16/11/2010 USD 132,735 06/05/2011 NOK 802,910 (12,276) 17/11/2010 USD 489,575 05/05/2011 CAD 502,111 (27,753)
17/11/2010 AUD 1,018,828 06/05/2011 USD 973,208 75,547 17/11/2010 EUR 43,966 06/05/2011 USD 59,195 3,238
17/11/2010 GBP 23,799 06/05/2011 USD 37,727 563 17/11/2010 JPY 2,359,537 06/05/2011 USD 28,330 139
17/11/2010 NOK 1,150,583 06/05/2011 USD 188,272 19,498 17/11/2010 USD 246,580 06/05/2011 CHF 245,074 (21,151)
17/11/2010 USD 299,784 06/05/2011 SEK 2,097,732 (33,540) 18/11/2010 USD 390,061 05/05/2011 CAD 398,565 (20,582)
18/11/2010 AUD 1,422,865 06/05/2011 USD 1,376,472 88,188 18/11/2010 EUR 200,000 06/05/2011 USD 272,431 11,575
18/11/2010 GBP 74,082 06/05/2011 USD 118,245 945 18/11/2010 NOK 1,509,164 06/05/2011 USD 250,456 22,066
18/11/2010 NZD 260,296 06/05/2011 USD 199,441 (1,407) 18/11/2010 USD 287,903 06/05/2011 CHF 283,628 (21,947) 18/11/2010 USD 69,622 06/05/2011 JPY 5,783,044 (154) 18/11/2010 USD 331,610 06/05/2011 SEK 2,286,216 (31,655) 19/11/2010 USD 175,850 05/05/2011 CAD 180,160 (9,770) 19/11/2010 AUD 498,446 06/05/2011 USD 480,370 32,717 19/11/2010 EUR 148,564 06/05/2011 USD 202,321 8,644 19/11/2010 NOK 727,744 06/05/2011 USD 120,303 11,111 19/11/2010 NZD 67,354 06/05/2011 USD 51,613 (370)

Notes to the Financial Statements (continued)
105
9. Forward foreign exchange contracts (continued)
Sub-funds Contract Date In exchange for Settlement Contract to
deliver
Unrealised
Gain / (Loss)
by Sub-Fund
Global Currency (continued)
19/11/2010 USD 216,738 06/05/2011 CHF 216,254 (19,509)
19/11/2010 USD 30,571 06/05/2011 GBP 19,184 (294) 19/11/2010 USD 24,045 06/05/2011 JPY 2,003,937 (134)
19/11/2010 USD 208,154 06/05/2011 SEK 1,438,857 (20,472) 22/11/2010 USD 458,191 05/05/2011 CAD 468,658 (24,669)
22/11/2010 AUD 592,809 06/05/2011 USD 572,653 37,569 22/11/2010 GBP 81,240 06/05/2011 USD 129,399 1,308
22/11/2010 JPY 4,149,778 06/05/2011 USD 49,795 275 22/11/2010 NOK 1,027,732 06/05/2011 USD 169,395 16,191
22/11/2010 NZD 212,694 06/05/2011 USD 161,800 17 22/11/2010 SEK 1,870,579 06/05/2011 USD 269,386 27,791
22/11/2010 USD 148,894 06/05/2011 CHF 147,712 (12,474) 22/11/2010 USD 505,961 06/05/2011 EUR 372,484 (22,995)
23/11/2010 CAD 403,582 05/05/2011 USD 392,439 23,358 23/11/2010 CHF 406,192 06/05/2011 USD 408,896 34,854
23/11/2010 JPY 2,692,628 06/05/2011 USD 32,522 (34) 23/11/2010 SEK 1,884,719 06/05/2011 USD 268,227 31,196
23/11/2010 USD 1,012,488 06/05/2011 AUD 1,062,365 (81,443) 23/11/2010 USD 465,894 06/05/2011 EUR 348,802 (29,438)
23/11/2010 USD 155,201 06/05/2011 GBP 98,256 (2,884) 23/11/2010 USD 169,375 06/05/2011 NOK 1,044,003 (19,186)
23/11/2010 USD 121,790 06/05/2011 NZD 161,904 (1,390) 24/11/2010 CAD 186,536 05/05/2011 USD 183,873 8,309
24/11/2010 AUD 243,486 06/05/2011 USD 234,485 16,153 24/11/2010 EUR 140,052 06/05/2011 USD 187,026 11,852
24/11/2010 NOK 912,199 06/05/2011 USD 148,934 15,789 24/11/2010 USD 151,890 06/05/2011 CHF 150,681 (12,721) 24/11/2010 USD 74,397 06/05/2011 GBP 47,215 (1,568) 24/11/2010 USD 296,324 06/05/2011 JPY 24,678,225 (1,433) 24/11/2010 USD 9,997 06/05/2011 NZD 13,276 (103) 24/11/2010 USD 119,583 06/05/2011 SEK 832,977 (12,774) 25/11/2010 CAD 192,006 05/05/2011 USD 189,609 8,208 25/11/2010 SEK 1,085,666 06/05/2011 USD 155,578 16,901 25/11/2010 USD 81,068 06/05/2011 CHF 80,819 (7,222)
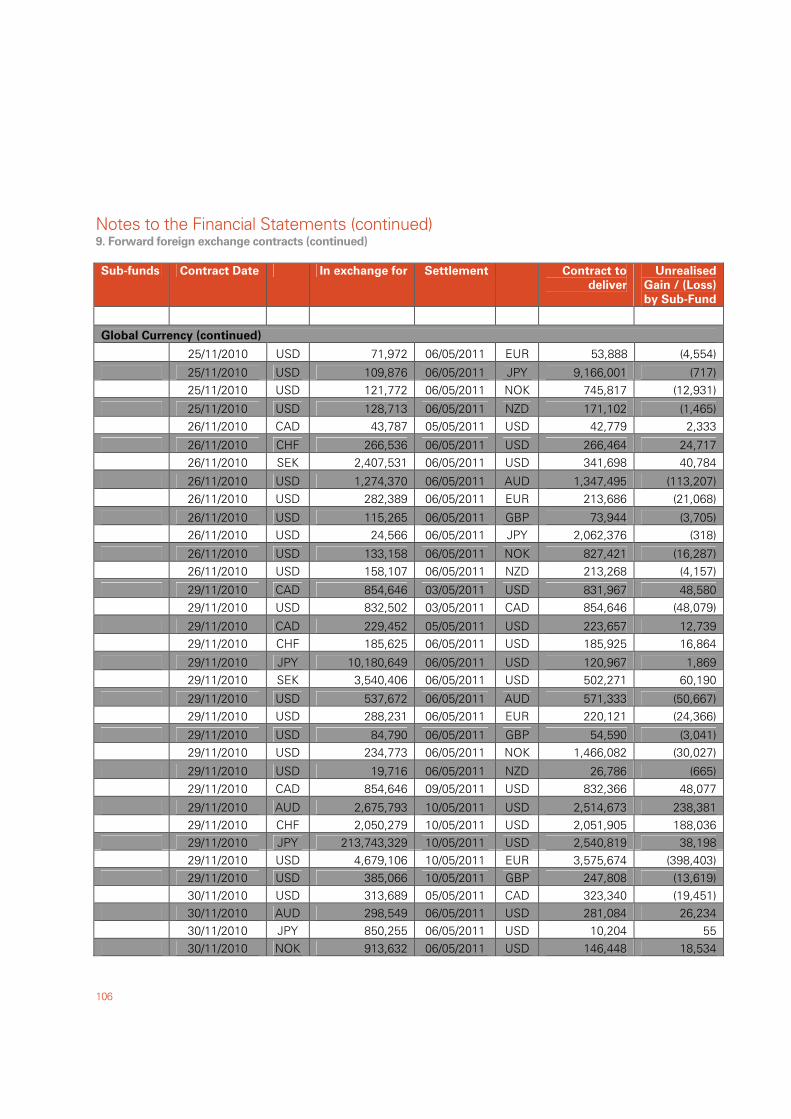
Notes to the Financial Statements (continued)
106
9. Forward foreign exchange contracts (continued)
Sub-funds Contract Date In exchange for Settlement Contract to
deliver
Unrealised
Gain / (Loss)
by Sub-Fund
Global Currency (continued)
25/11/2010 USD 71,972 06/05/2011 EUR 53,888 (4,554)
25/11/2010 USD 109,876 06/05/2011 JPY 9,166,001 (717) 25/11/2010 USD 121,772 06/05/2011 NOK 745,817 (12,931)
25/11/2010 USD 128,713 06/05/2011 NZD 171,102 (1,465) 26/11/2010 CAD 43,787 05/05/2011 USD 42,779 2,333
26/11/2010 CHF 266,536 06/05/2011 USD 266,464 24,717 26/11/2010 SEK 2,407,531 06/05/2011 USD 341,698 40,784
26/11/2010 USD 1,274,370 06/05/2011 AUD 1,347,495 (113,207) 26/11/2010 USD 282,389 06/05/2011 EUR 213,686 (21,068)
26/11/2010 USD 115,265 06/05/2011 GBP 73,944 (3,705) 26/11/2010 USD 24,566 06/05/2011 JPY 2,062,376 (318)
26/11/2010 USD 133,158 06/05/2011 NOK 827,421 (16,287) 26/11/2010 USD 158,107 06/05/2011 NZD 213,268 (4,157)
29/11/2010 CAD 854,646 03/05/2011 USD 831,967 48,580 29/11/2010 USD 832,502 03/05/2011 CAD 854,646 (48,079)
29/11/2010 CAD 229,452 05/05/2011 USD 223,657 12,739 29/11/2010 CHF 185,625 06/05/2011 USD 185,925 16,864
29/11/2010 JPY 10,180,649 06/05/2011 USD 120,967 1,869 29/11/2010 SEK 3,540,406 06/05/2011 USD 502,271 60,190
29/11/2010 USD 537,672 06/05/2011 AUD 571,333 (50,667) 29/11/2010 USD 288,231 06/05/2011 EUR 220,121 (24,366)
29/11/2010 USD 84,790 06/05/2011 GBP 54,590 (3,041) 29/11/2010 USD 234,773 06/05/2011 NOK 1,466,082 (30,027)
29/11/2010 USD 19,716 06/05/2011 NZD 26,786 (665) 29/11/2010 CAD 854,646 09/05/2011 USD 832,366 48,077
29/11/2010 AUD 2,675,793 10/05/2011 USD 2,514,673 238,381 29/11/2010 CHF 2,050,279 10/05/2011 USD 2,051,905 188,036 29/11/2010 JPY 213,743,329 10/05/2011 USD 2,540,819 38,198 29/11/2010 USD 4,679,106 10/05/2011 EUR 3,575,674 (398,403) 29/11/2010 USD 385,066 10/05/2011 GBP 247,808 (13,619) 30/11/2010 USD 313,689 05/05/2011 CAD 323,340 (19,451) 30/11/2010 AUD 298,549 06/05/2011 USD 281,084 26,234 30/11/2010 JPY 850,255 06/05/2011 USD 10,204 55 30/11/2010 NOK 913,632 06/05/2011 USD 146,448 18,534

Notes to the Financial Statements (continued)
107
9. Forward foreign exchange contracts (continued)
Sub-funds Contract Date In exchange for Settlement Contract to
deliver
Unrealised
Gain / (Loss)
by Sub-Fund
Global Currency (continued)
30/11/2010 NZD 19,777 06/05/2011 USD 14,535 512
30/11/2010 SEK 829,425 06/05/2011 USD 117,567 14,203 30/11/2010 USD 133,025 06/05/2011 CHF 132,476 (11,698)
30/11/2010 USD 356,231 06/05/2011 EUR 273,673 (32,418) 30/11/2010 CAD 28,355 09/05/2011 USD 27,519 1,692
30/11/2010 AUD 143,220 10/05/2011 USD 134,889 12,466 30/11/2010 GBP 47,583 10/05/2011 USD 73,998 2,554
30/11/2010 JPY 51,889,802 10/05/2011 USD 623,089 3,011 30/11/2010 USD 222,584 10/05/2011 EUR 170,846 (20,020)
01/12/2010 CAD 99,483 05/05/2011 USD 97,201 5,293 01/12/2010 AUD 167,036 06/05/2011 USD 157,755 14,187
01/12/2010 CHF 52,990 06/05/2011 USD 52,948 4,942 01/12/2010 EUR 33,204 06/05/2011 USD 43,361 3,789
01/12/2010 GBP 19,406 06/05/2011 USD 30,161 1,061 01/12/2010 NZD 75,537 06/05/2011 USD 55,698 1,771
01/12/2010 USD 129,955 06/05/2011 JPY 10,916,972 (1,764) 01/12/2010 USD 112,408 06/05/2011 NOK 700,563 (14,125)
01/12/2010 USD 23,973 06/05/2011 SEK 168,992 (2,879) 01/12/2010 CAD 228,326 09/05/2011 USD 223,020 12,197
01/12/2010 EUR 345,966 10/05/2011 USD 451,519 39,726 01/12/2010 USD 203,210 10/05/2011 AUD 215,152 (18,244)
01/12/2010 USD 273,999 10/05/2011 CHF 274,335 (25,708) 01/12/2010 USD 292,244 10/05/2011 GBP 187,869 (10,008)
01/12/2010 USD 312,684 10/05/2011 JPY 26,270,943 (4,299) 02/12/2010 CAD 237,666 05/05/2011 USD 235,795 9,063
02/12/2010 AUD 184,433 06/05/2011 USD 176,672 13,179 02/12/2010 CHF 22,005 06/05/2011 USD 22,270 1,770 02/12/2010 EUR 50,194 06/05/2011 USD 66,376 4,901 02/12/2010 GBP 66,560 06/05/2011 USD 103,692 3,396 02/12/2010 JPY 1,550,931 06/05/2011 USD 18,605 108 02/12/2010 NOK 326,992 06/05/2011 USD 53,472 5,575 02/12/2010 NZD 424,484 06/05/2011 USD 316,550 6,397 02/12/2010 SEK 1,485,747 06/05/2011 USD 214,169 21,871 02/12/2010 CAD 826,007 09/05/2011 USD 819,597 31,341
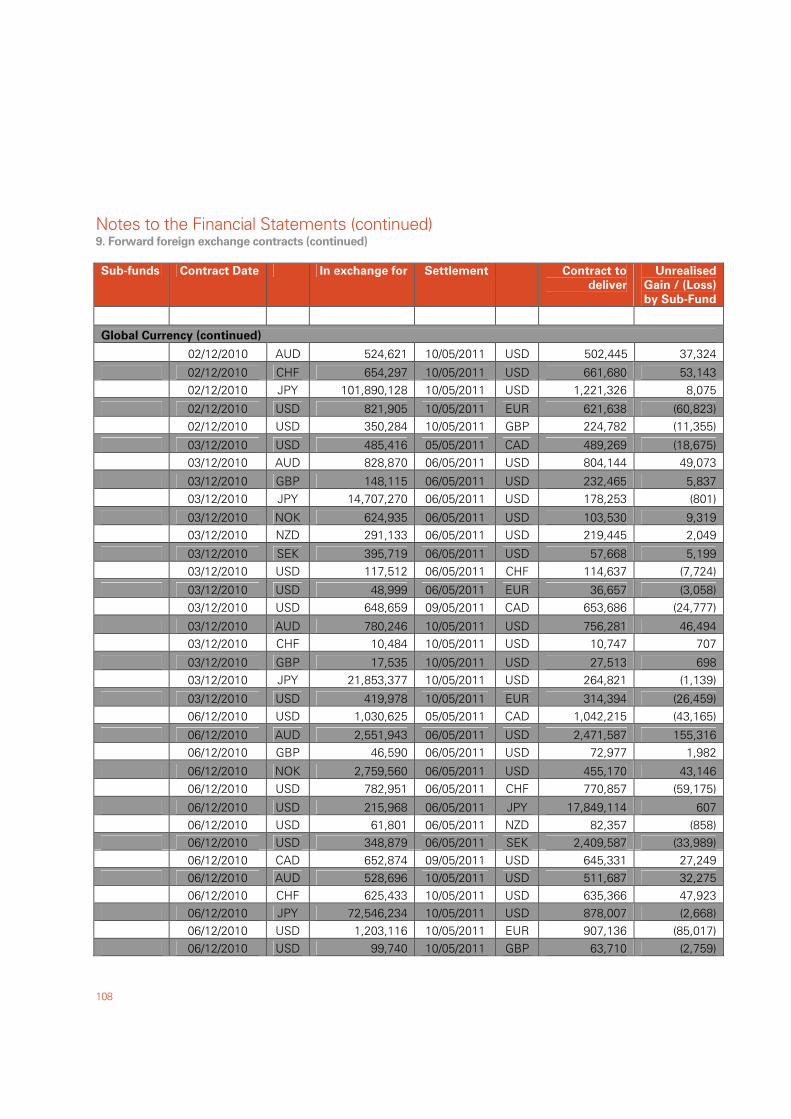
Notes to the Financial Statements (continued)
108
9. Forward foreign exchange contracts (continued)
Sub-funds Contract Date In exchange for Settlement Contract to
deliver
Unrealised
Gain / (Loss)
by Sub-Fund
Global Currency (continued)
02/12/2010 AUD 524,621 10/05/2011 USD 502,445 37,324
02/12/2010 CHF 654,297 10/05/2011 USD 661,680 53,143 02/12/2010 JPY 101,890,128 10/05/2011 USD 1,221,326 8,075
02/12/2010 USD 821,905 10/05/2011 EUR 621,638 (60,823) 02/12/2010 USD 350,284 10/05/2011 GBP 224,782 (11,355)
03/12/2010 USD 485,416 05/05/2011 CAD 489,269 (18,675) 03/12/2010 AUD 828,870 06/05/2011 USD 804,144 49,073
03/12/2010 GBP 148,115 06/05/2011 USD 232,465 5,837 03/12/2010 JPY 14,707,270 06/05/2011 USD 178,253 (801)
03/12/2010 NOK 624,935 06/05/2011 USD 103,530 9,319 03/12/2010 NZD 291,133 06/05/2011 USD 219,445 2,049
03/12/2010 SEK 395,719 06/05/2011 USD 57,668 5,199 03/12/2010 USD 117,512 06/05/2011 CHF 114,637 (7,724)
03/12/2010 USD 48,999 06/05/2011 EUR 36,657 (3,058) 03/12/2010 USD 648,659 09/05/2011 CAD 653,686 (24,777)
03/12/2010 AUD 780,246 10/05/2011 USD 756,281 46,494 03/12/2010 CHF 10,484 10/05/2011 USD 10,747 707
03/12/2010 GBP 17,535 10/05/2011 USD 27,513 698 03/12/2010 JPY 21,853,377 10/05/2011 USD 264,821 (1,139)
03/12/2010 USD 419,978 10/05/2011 EUR 314,394 (26,459) 06/12/2010 USD 1,030,625 05/05/2011 CAD 1,042,215 (43,165)
06/12/2010 AUD 2,551,943 06/05/2011 USD 2,471,587 155,316 06/12/2010 GBP 46,590 06/05/2011 USD 72,977 1,982
06/12/2010 NOK 2,759,560 06/05/2011 USD 455,170 43,146 06/12/2010 USD 782,951 06/05/2011 CHF 770,857 (59,175)
06/12/2010 USD 215,968 06/05/2011 JPY 17,849,114 607 06/12/2010 USD 61,801 06/05/2011 NZD 82,357 (858) 06/12/2010 USD 348,879 06/05/2011 SEK 2,409,587 (33,989) 06/12/2010 CAD 652,874 09/05/2011 USD 645,331 27,249 06/12/2010 AUD 528,696 10/05/2011 USD 511,687 32,275 06/12/2010 CHF 625,433 10/05/2011 USD 635,366 47,923 06/12/2010 JPY 72,546,234 10/05/2011 USD 878,007 (2,668) 06/12/2010 USD 1,203,116 10/05/2011 EUR 907,136 (85,017) 06/12/2010 USD 99,740 10/05/2011 GBP 63,710 (2,759)
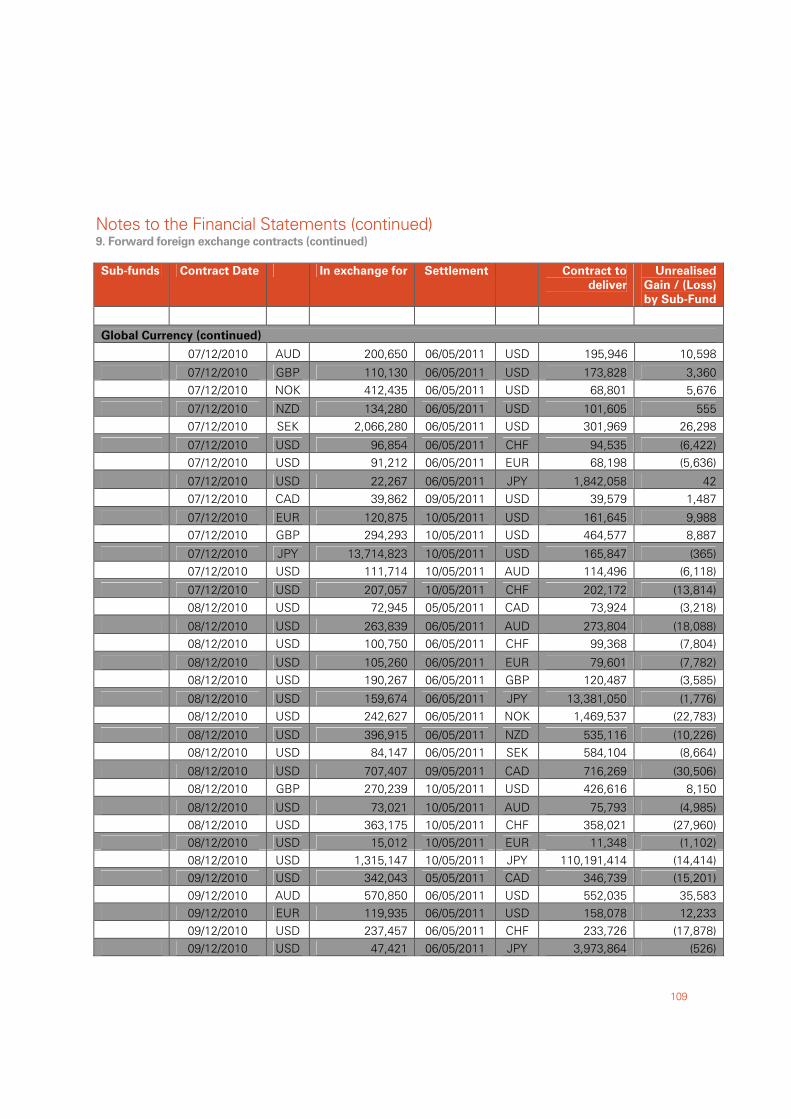
Notes to the Financial Statements (continued)
109
9. Forward foreign exchange contracts (continued)
Sub-funds Contract Date In exchange for Settlement Contract to
deliver
Unrealised
Gain / (Loss)
by Sub-Fund
Global Currency (continued)
07/12/2010 AUD 200,650 06/05/2011 USD 195,946 10,598
07/12/2010 GBP 110,130 06/05/2011 USD 173,828 3,360 07/12/2010 NOK 412,435 06/05/2011 USD 68,801 5,676
07/12/2010 NZD 134,280 06/05/2011 USD 101,605 555 07/12/2010 SEK 2,066,280 06/05/2011 USD 301,969 26,298
07/12/2010 USD 96,854 06/05/2011 CHF 94,535 (6,422) 07/12/2010 USD 91,212 06/05/2011 EUR 68,198 (5,636)
07/12/2010 USD 22,267 06/05/2011 JPY 1,842,058 42 07/12/2010 CAD 39,862 09/05/2011 USD 39,579 1,487
07/12/2010 EUR 120,875 10/05/2011 USD 161,645 9,988 07/12/2010 GBP 294,293 10/05/2011 USD 464,577 8,887
07/12/2010 JPY 13,714,823 10/05/2011 USD 165,847 (365) 07/12/2010 USD 111,714 10/05/2011 AUD 114,496 (6,118)
07/12/2010 USD 207,057 10/05/2011 CHF 202,172 (13,814) 08/12/2010 USD 72,945 05/05/2011 CAD 73,924 (3,218)
08/12/2010 USD 263,839 06/05/2011 AUD 273,804 (18,088) 08/12/2010 USD 100,750 06/05/2011 CHF 99,368 (7,804)
08/12/2010 USD 105,260 06/05/2011 EUR 79,601 (7,782) 08/12/2010 USD 190,267 06/05/2011 GBP 120,487 (3,585)
08/12/2010 USD 159,674 06/05/2011 JPY 13,381,050 (1,776) 08/12/2010 USD 242,627 06/05/2011 NOK 1,469,537 (22,783)
08/12/2010 USD 396,915 06/05/2011 NZD 535,116 (10,226) 08/12/2010 USD 84,147 06/05/2011 SEK 584,104 (8,664)
08/12/2010 USD 707,407 09/05/2011 CAD 716,269 (30,506) 08/12/2010 GBP 270,239 10/05/2011 USD 426,616 8,150
08/12/2010 USD 73,021 10/05/2011 AUD 75,793 (4,985) 08/12/2010 USD 363,175 10/05/2011 CHF 358,021 (27,960) 08/12/2010 USD 15,012 10/05/2011 EUR 11,348 (1,102) 08/12/2010 USD 1,315,147 10/05/2011 JPY 110,191,414 (14,414) 09/12/2010 USD 342,043 05/05/2011 CAD 346,739 (15,201) 09/12/2010 AUD 570,850 06/05/2011 USD 552,035 35,583 09/12/2010 EUR 119,935 06/05/2011 USD 158,078 12,233 09/12/2010 USD 237,457 06/05/2011 CHF 233,726 (17,878) 09/12/2010 USD 47,421 06/05/2011 JPY 3,973,864 (526)

Notes to the Financial Statements (continued)
110
9. Forward foreign exchange contracts (continued)
Sub-funds Contract Date In exchange for Settlement Contract to
deliver
Unrealised
Gain / (Loss)
by Sub-Fund
Global Currency (continued)
09/12/2010 USD 113,677 06/05/2011 NOK 692,175 (11,336)
09/12/2010 USD 283,533 06/05/2011 NZD 384,193 (8,782) 09/12/2010 USD 19,168 06/05/2011 SEK 133,253 (2,006)
09/12/2010 USD 76,837 09/05/2011 CAD 77,924 (3,441) 09/12/2010 AUD 214,838 10/05/2011 USD 207,544 13,497
09/12/2010 CHF 144,103 10/05/2011 USD 146,439 10,995 09/12/2010 JPY 26,626,132 10/05/2011 USD 317,740 3,530
09/12/2010 USD 294,831 10/05/2011 EUR 223,759 (22,909) 09/12/2010 USD 19,969 10/05/2011 GBP 12,697 (458)
10/12/2010 AUD 259,229 06/05/2011 USD 251,114 15,730 10/12/2010 CHF 52,224 06/05/2011 USD 53,222 3,831
10/12/2010 EUR 101,235 06/05/2011 USD 133,618 10,139 10/12/2010 GBP 63,336 06/05/2011 USD 99,861 2,040
10/12/2010 NOK 1,441,001 06/05/2011 USD 238,061 22,152 10/12/2010 USD 33,311 06/05/2011 JPY 2,788,583 (335)
10/12/2010 USD 124,757 06/05/2011 NZD 168,492 (3,440) 10/12/2010 USD 214,608 06/05/2011 SEK 1,487,735 (21,786)
10/12/2010 USD 110,796 09/05/2011 CAD 112,217 (4,812) 10/12/2010 AUD 184,552 10/05/2011 USD 178,682 11,199
10/12/2010 GBP 169,981 10/05/2011 USD 268,012 5,457 10/12/2010 JPY 12,675,095 10/05/2011 USD 151,428 1,509
10/12/2010 USD 91,206 10/05/2011 CHF 89,534 (6,610) 10/12/2010 USD 273,104 10/05/2011 EUR 206,901 (20,697)
13/12/2010 CAD 342,657 05/05/2011 USD 340,012 13,016 13/12/2010 CHF 63,331 06/05/2011 USD 65,582 3,605
13/12/2010 GBP 28,011 06/05/2011 USD 44,396 671 13/12/2010 NZD 399,820 06/05/2011 USD 298,551 5,632 13/12/2010 SEK 2,908,008 06/05/2011 USD 423,091 38,901 13/12/2010 USD 171,754 06/05/2011 AUD 175,848 (9,301) 13/12/2010 USD 20,590 06/05/2011 EUR 15,387 (1,261) 13/12/2010 USD 191,392 06/05/2011 NOK 1,142,011 (14,858) 13/12/2010 CHF 275,720 10/05/2011 USD 285,448 15,777 13/12/2010 EUR 181,526 10/05/2011 USD 242,696 15,056 13/12/2010 JPY 4,672,589 10/05/2011 USD 56,003 376
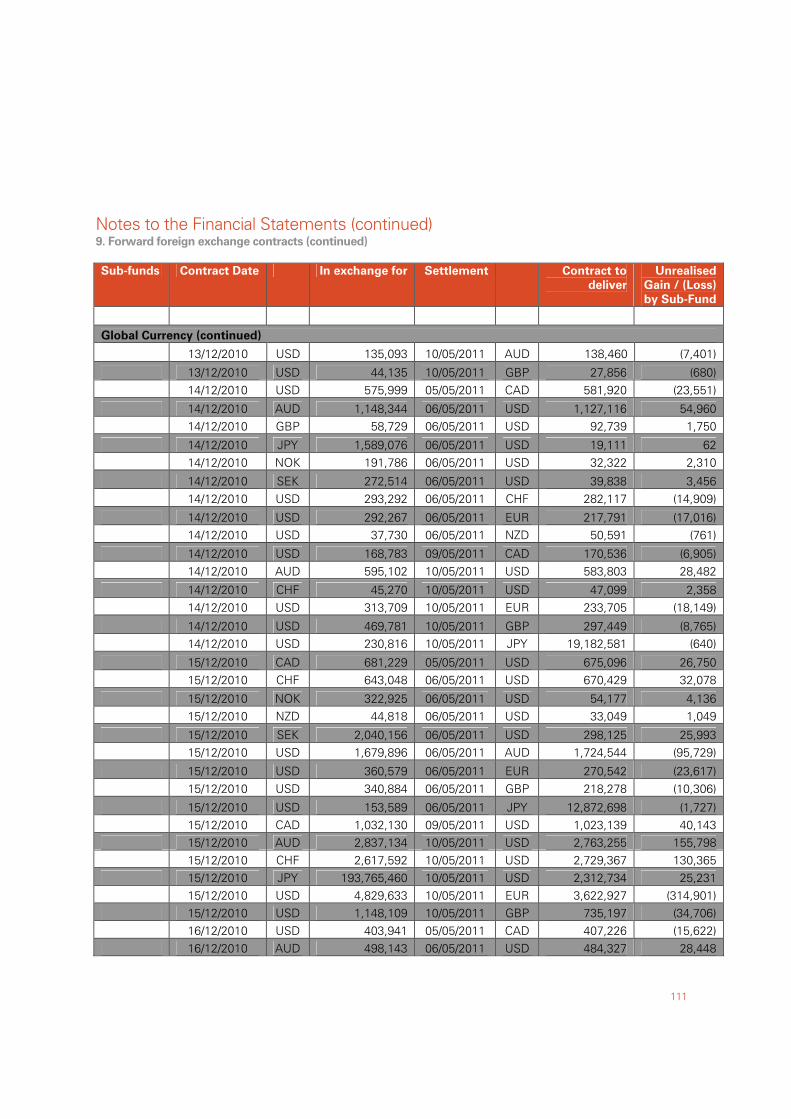
Notes to the Financial Statements (continued)
111
9. Forward foreign exchange contracts (continued)
Sub-funds Contract Date In exchange for Settlement Contract to
deliver
Unrealised
Gain / (Loss)
by Sub-Fund
Global Currency (continued)
13/12/2010 USD 135,093 10/05/2011 AUD 138,460 (7,401)
13/12/2010 USD 44,135 10/05/2011 GBP 27,856 (680) 14/12/2010 USD 575,999 05/05/2011 CAD 581,920 (23,551)
14/12/2010 AUD 1,148,344 06/05/2011 USD 1,127,116 54,960 14/12/2010 GBP 58,729 06/05/2011 USD 92,739 1,750
14/12/2010 JPY 1,589,076 06/05/2011 USD 19,111 62 14/12/2010 NOK 191,786 06/05/2011 USD 32,322 2,310
14/12/2010 SEK 272,514 06/05/2011 USD 39,838 3,456 14/12/2010 USD 293,292 06/05/2011 CHF 282,117 (14,909)
14/12/2010 USD 292,267 06/05/2011 EUR 217,791 (17,016) 14/12/2010 USD 37,730 06/05/2011 NZD 50,591 (761)
14/12/2010 USD 168,783 09/05/2011 CAD 170,536 (6,905) 14/12/2010 AUD 595,102 10/05/2011 USD 583,803 28,482
14/12/2010 CHF 45,270 10/05/2011 USD 47,099 2,358 14/12/2010 USD 313,709 10/05/2011 EUR 233,705 (18,149)
14/12/2010 USD 469,781 10/05/2011 GBP 297,449 (8,765) 14/12/2010 USD 230,816 10/05/2011 JPY 19,182,581 (640)
15/12/2010 CAD 681,229 05/05/2011 USD 675,096 26,750 15/12/2010 CHF 643,048 06/05/2011 USD 670,429 32,078
15/12/2010 NOK 322,925 06/05/2011 USD 54,177 4,136 15/12/2010 NZD 44,818 06/05/2011 USD 33,049 1,049
15/12/2010 SEK 2,040,156 06/05/2011 USD 298,125 25,993 15/12/2010 USD 1,679,896 06/05/2011 AUD 1,724,544 (95,729)
15/12/2010 USD 360,579 06/05/2011 EUR 270,542 (23,617) 15/12/2010 USD 340,884 06/05/2011 GBP 218,278 (10,306)
15/12/2010 USD 153,589 06/05/2011 JPY 12,872,698 (1,727) 15/12/2010 CAD 1,032,130 09/05/2011 USD 1,023,139 40,143 15/12/2010 AUD 2,837,134 10/05/2011 USD 2,763,255 155,798 15/12/2010 CHF 2,617,592 10/05/2011 USD 2,729,367 130,365 15/12/2010 JPY 193,765,460 10/05/2011 USD 2,312,734 25,231 15/12/2010 USD 4,829,633 10/05/2011 EUR 3,622,927 (314,901) 15/12/2010 USD 1,148,109 10/05/2011 GBP 735,197 (34,706) 16/12/2010 USD 403,941 05/05/2011 CAD 407,226 (15,622) 16/12/2010 AUD 498,143 06/05/2011 USD 484,327 28,448
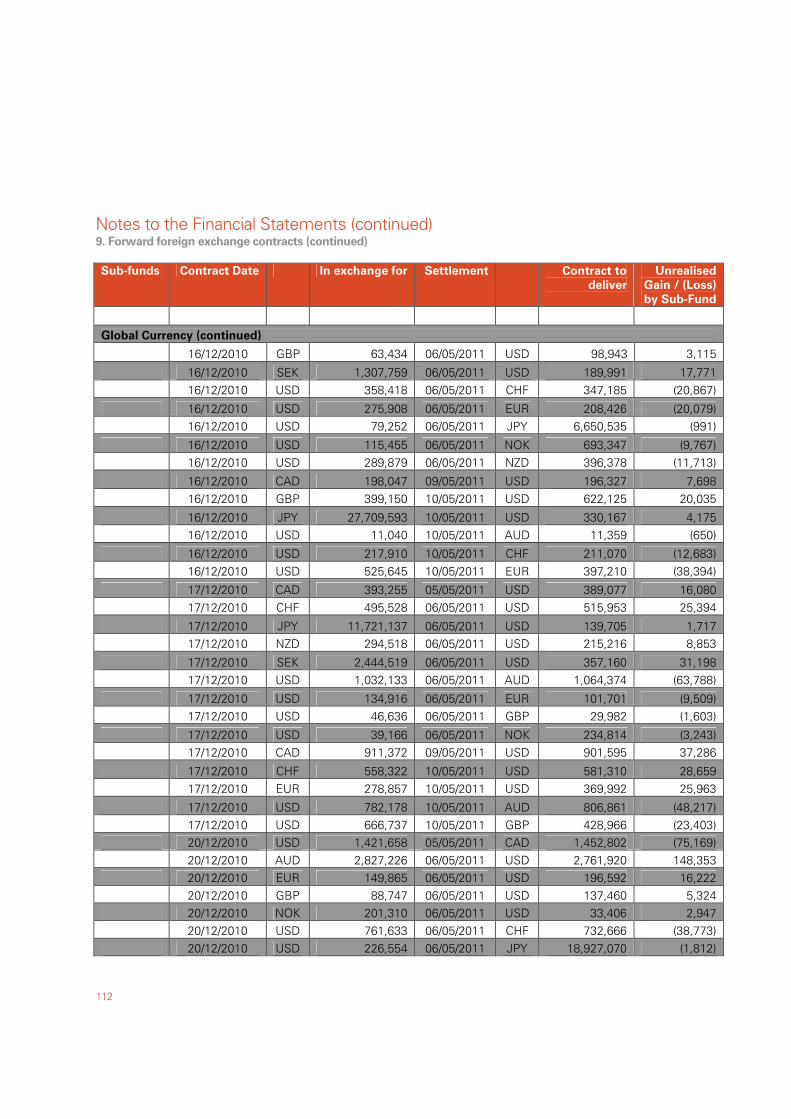
Notes to the Financial Statements (continued)
112
9. Forward foreign exchange contracts (continued)
Sub-funds Contract Date In exchange for Settlement Contract to
deliver
Unrealised
Gain / (Loss)
by Sub-Fund
Global Currency (continued)
16/12/2010 GBP 63,434 06/05/2011 USD 98,943 3,115
16/12/2010 SEK 1,307,759 06/05/2011 USD 189,991 17,771 16/12/2010 USD 358,418 06/05/2011 CHF 347,185 (20,867)
16/12/2010 USD 275,908 06/05/2011 EUR 208,426 (20,079) 16/12/2010 USD 79,252 06/05/2011 JPY 6,650,535 (991)
16/12/2010 USD 115,455 06/05/2011 NOK 693,347 (9,767) 16/12/2010 USD 289,879 06/05/2011 NZD 396,378 (11,713)
16/12/2010 CAD 198,047 09/05/2011 USD 196,327 7,698 16/12/2010 GBP 399,150 10/05/2011 USD 622,125 20,035
16/12/2010 JPY 27,709,593 10/05/2011 USD 330,167 4,175 16/12/2010 USD 11,040 10/05/2011 AUD 11,359 (650)
16/12/2010 USD 217,910 10/05/2011 CHF 211,070 (12,683) 16/12/2010 USD 525,645 10/05/2011 EUR 397,210 (38,394)
17/12/2010 CAD 393,255 05/05/2011 USD 389,077 16,080 17/12/2010 CHF 495,528 06/05/2011 USD 515,953 25,394
17/12/2010 JPY 11,721,137 06/05/2011 USD 139,705 1,717 17/12/2010 NZD 294,518 06/05/2011 USD 215,216 8,853
17/12/2010 SEK 2,444,519 06/05/2011 USD 357,160 31,198 17/12/2010 USD 1,032,133 06/05/2011 AUD 1,064,374 (63,788)
17/12/2010 USD 134,916 06/05/2011 EUR 101,701 (9,509) 17/12/2010 USD 46,636 06/05/2011 GBP 29,982 (1,603)
17/12/2010 USD 39,166 06/05/2011 NOK 234,814 (3,243) 17/12/2010 CAD 911,372 09/05/2011 USD 901,595 37,286
17/12/2010 CHF 558,322 10/05/2011 USD 581,310 28,659 17/12/2010 EUR 278,857 10/05/2011 USD 369,992 25,963
17/12/2010 USD 782,178 10/05/2011 AUD 806,861 (48,217) 17/12/2010 USD 666,737 10/05/2011 GBP 428,966 (23,403) 20/12/2010 USD 1,421,658 05/05/2011 CAD 1,452,802 (75,169) 20/12/2010 AUD 2,827,226 06/05/2011 USD 2,761,920 148,353 20/12/2010 EUR 149,865 06/05/2011 USD 196,592 16,222 20/12/2010 GBP 88,747 06/05/2011 USD 137,460 5,324 20/12/2010 NOK 201,310 06/05/2011 USD 33,406 2,947 20/12/2010 USD 761,633 06/05/2011 CHF 732,666 (38,773) 20/12/2010 USD 226,554 06/05/2011 JPY 18,927,070 (1,812)
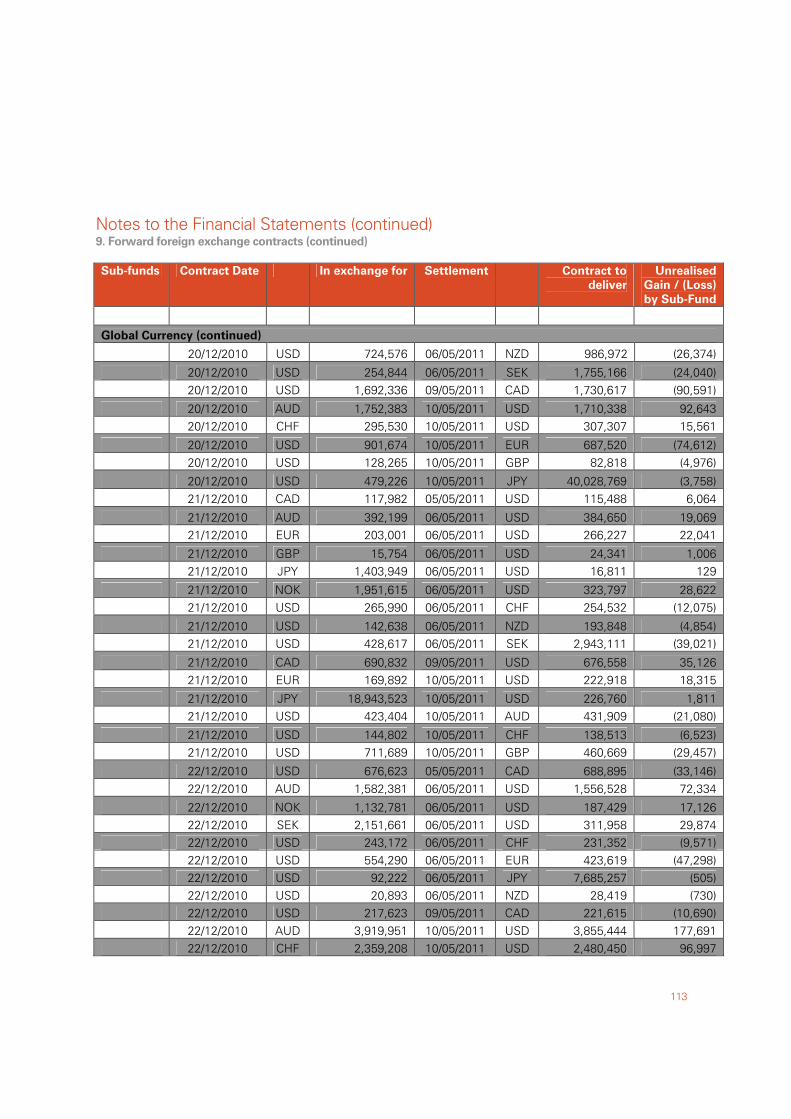
Notes to the Financial Statements (continued)
113
9. Forward foreign exchange contracts (continued)
Sub-funds Contract Date In exchange for Settlement Contract to
deliver
Unrealised
Gain / (Loss)
by Sub-Fund
Global Currency (continued)
20/12/2010 USD 724,576 06/05/2011 NZD 986,972 (26,374)
20/12/2010 USD 254,844 06/05/2011 SEK 1,755,166 (24,040) 20/12/2010 USD 1,692,336 09/05/2011 CAD 1,730,617 (90,591)
20/12/2010 AUD 1,752,383 10/05/2011 USD 1,710,338 92,643 20/12/2010 CHF 295,530 10/05/2011 USD 307,307 15,561
20/12/2010 USD 901,674 10/05/2011 EUR 687,520 (74,612) 20/12/2010 USD 128,265 10/05/2011 GBP 82,818 (4,976)
20/12/2010 USD 479,226 10/05/2011 JPY 40,028,769 (3,758) 21/12/2010 CAD 117,982 05/05/2011 USD 115,488 6,064
21/12/2010 AUD 392,199 06/05/2011 USD 384,650 19,069 21/12/2010 EUR 203,001 06/05/2011 USD 266,227 22,041
21/12/2010 GBP 15,754 06/05/2011 USD 24,341 1,006 21/12/2010 JPY 1,403,949 06/05/2011 USD 16,811 129
21/12/2010 NOK 1,951,615 06/05/2011 USD 323,797 28,622 21/12/2010 USD 265,990 06/05/2011 CHF 254,532 (12,075)
21/12/2010 USD 142,638 06/05/2011 NZD 193,848 (4,854) 21/12/2010 USD 428,617 06/05/2011 SEK 2,943,111 (39,021)
21/12/2010 CAD 690,832 09/05/2011 USD 676,558 35,126 21/12/2010 EUR 169,892 10/05/2011 USD 222,918 18,315
21/12/2010 JPY 18,943,523 10/05/2011 USD 226,760 1,811 21/12/2010 USD 423,404 10/05/2011 AUD 431,909 (21,080)
21/12/2010 USD 144,802 10/05/2011 CHF 138,513 (6,523) 21/12/2010 USD 711,689 10/05/2011 GBP 460,669 (29,457)
22/12/2010 USD 676,623 05/05/2011 CAD 688,895 (33,146) 22/12/2010 AUD 1,582,381 06/05/2011 USD 1,556,528 72,334
22/12/2010 NOK 1,132,781 06/05/2011 USD 187,429 17,126 22/12/2010 SEK 2,151,661 06/05/2011 USD 311,958 29,874 22/12/2010 USD 243,172 06/05/2011 CHF 231,352 (9,571) 22/12/2010 USD 554,290 06/05/2011 EUR 423,619 (47,298) 22/12/2010 USD 92,222 06/05/2011 JPY 7,685,257 (505) 22/12/2010 USD 20,893 06/05/2011 NZD 28,419 (730) 22/12/2010 USD 217,623 09/05/2011 CAD 221,615 (10,690) 22/12/2010 AUD 3,919,951 10/05/2011 USD 3,855,444 177,691 22/12/2010 CHF 2,359,208 10/05/2011 USD 2,480,450 96,997
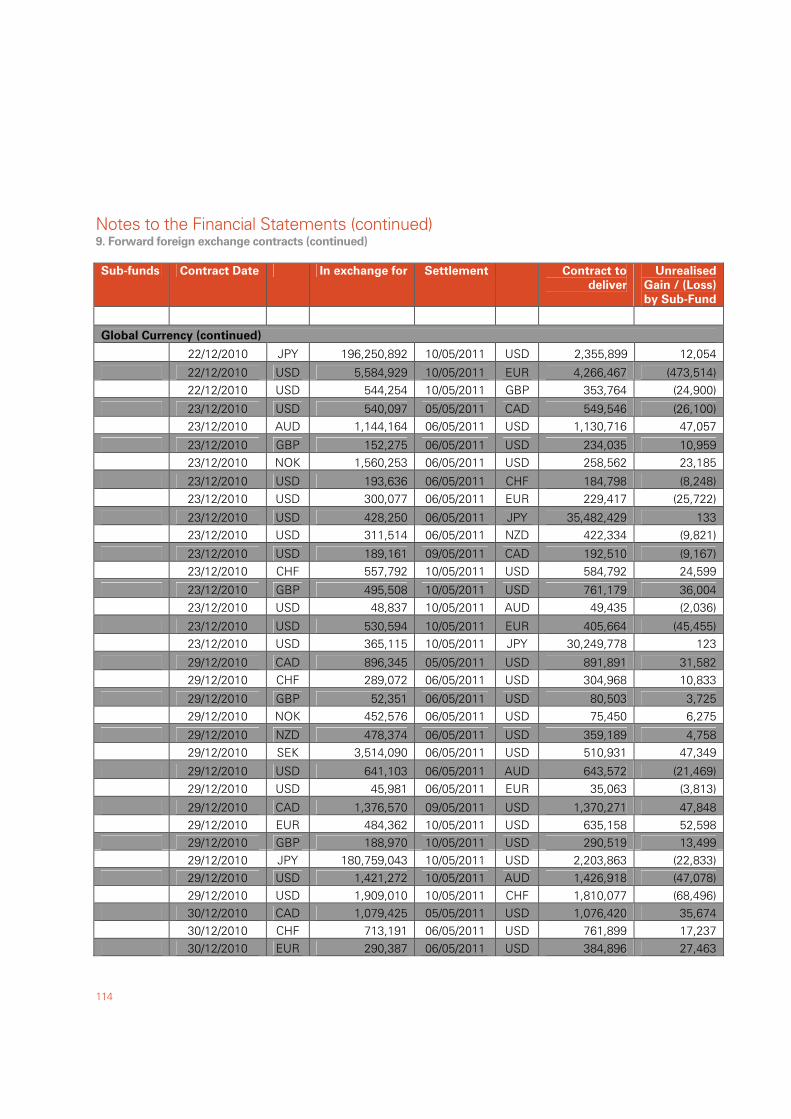
Notes to the Financial Statements (continued)
114
9. Forward foreign exchange contracts (continued)
Sub-funds Contract Date In exchange for Settlement Contract to
deliver
Unrealised
Gain / (Loss)
by Sub-Fund
Global Currency (continued)
22/12/2010 JPY 196,250,892 10/05/2011 USD 2,355,899 12,054
22/12/2010 USD 5,584,929 10/05/2011 EUR 4,266,467 (473,514) 22/12/2010 USD 544,254 10/05/2011 GBP 353,764 (24,900)
23/12/2010 USD 540,097 05/05/2011 CAD 549,546 (26,100) 23/12/2010 AUD 1,144,164 06/05/2011 USD 1,130,716 47,057
23/12/2010 GBP 152,275 06/05/2011 USD 234,035 10,959 23/12/2010 NOK 1,560,253 06/05/2011 USD 258,562 23,185
23/12/2010 USD 193,636 06/05/2011 CHF 184,798 (8,248) 23/12/2010 USD 300,077 06/05/2011 EUR 229,417 (25,722)
23/12/2010 USD 428,250 06/05/2011 JPY 35,482,429 133 23/12/2010 USD 311,514 06/05/2011 NZD 422,334 (9,821)
23/12/2010 USD 189,161 09/05/2011 CAD 192,510 (9,167) 23/12/2010 CHF 557,792 10/05/2011 USD 584,792 24,599
23/12/2010 GBP 495,508 10/05/2011 USD 761,179 36,004 23/12/2010 USD 48,837 10/05/2011 AUD 49,435 (2,036)
23/12/2010 USD 530,594 10/05/2011 EUR 405,664 (45,455) 23/12/2010 USD 365,115 10/05/2011 JPY 30,249,778 123
29/12/2010 CAD 896,345 05/05/2011 USD 891,891 31,582 29/12/2010 CHF 289,072 06/05/2011 USD 304,968 10,833
29/12/2010 GBP 52,351 06/05/2011 USD 80,503 3,725 29/12/2010 NOK 452,576 06/05/2011 USD 75,450 6,275
29/12/2010 NZD 478,374 06/05/2011 USD 359,189 4,758 29/12/2010 SEK 3,514,090 06/05/2011 USD 510,931 47,349
29/12/2010 USD 641,103 06/05/2011 AUD 643,572 (21,469) 29/12/2010 USD 45,981 06/05/2011 EUR 35,063 (3,813)
29/12/2010 CAD 1,376,570 09/05/2011 USD 1,370,271 47,848 29/12/2010 EUR 484,362 10/05/2011 USD 635,158 52,598 29/12/2010 GBP 188,970 10/05/2011 USD 290,519 13,499 29/12/2010 JPY 180,759,043 10/05/2011 USD 2,203,863 (22,833) 29/12/2010 USD 1,421,272 10/05/2011 AUD 1,426,918 (47,078) 29/12/2010 USD 1,909,010 10/05/2011 CHF 1,810,077 (68,496) 30/12/2010 CAD 1,079,425 05/05/2011 USD 1,076,420 35,674 30/12/2010 CHF 713,191 06/05/2011 USD 761,899 17,237 30/12/2010 EUR 290,387 06/05/2011 USD 384,896 27,463
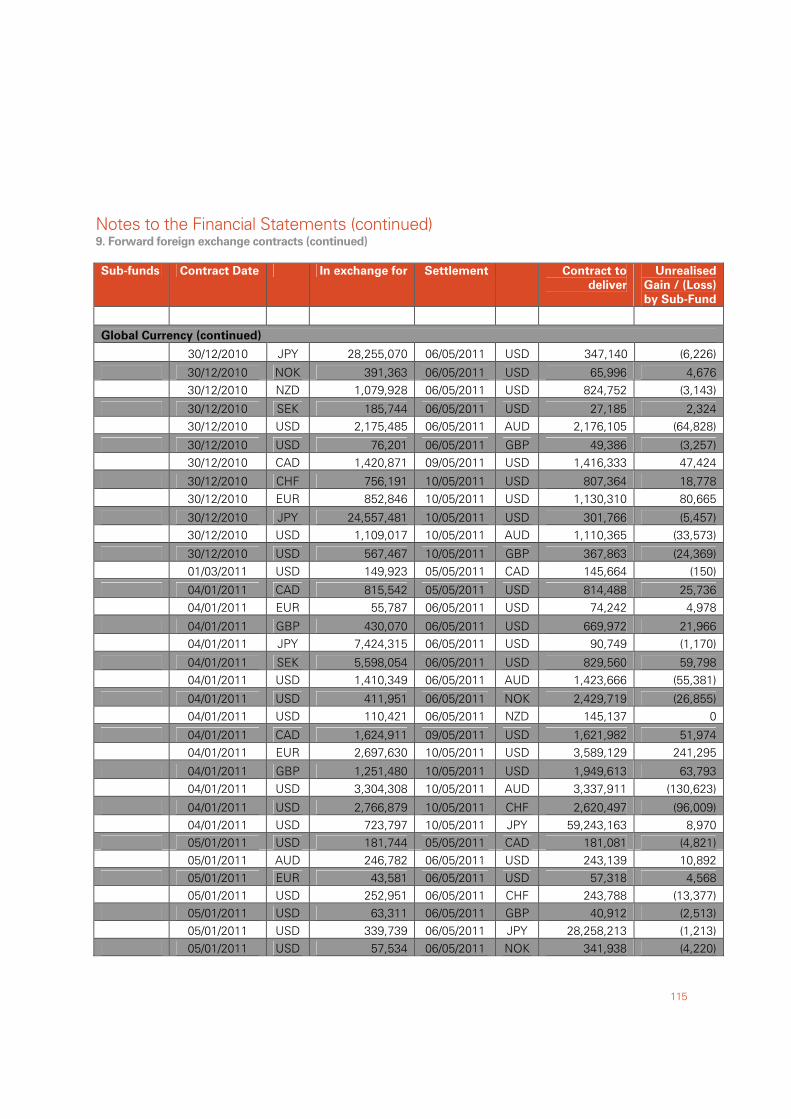
Notes to the Financial Statements (continued)
115
9. Forward foreign exchange contracts (continued)
Sub-funds Contract Date In exchange for Settlement Contract to
deliver
Unrealised
Gain / (Loss)
by Sub-Fund
Global Currency (continued)
30/12/2010 JPY 28,255,070 06/05/2011 USD 347,140 (6,226)
30/12/2010 NOK 391,363 06/05/2011 USD 65,996 4,676 30/12/2010 NZD 1,079,928 06/05/2011 USD 824,752 (3,143)
30/12/2010 SEK 185,744 06/05/2011 USD 27,185 2,324 30/12/2010 USD 2,175,485 06/05/2011 AUD 2,176,105 (64,828)
30/12/2010 USD 76,201 06/05/2011 GBP 49,386 (3,257) 30/12/2010 CAD 1,420,871 09/05/2011 USD 1,416,333 47,424
30/12/2010 CHF 756,191 10/05/2011 USD 807,364 18,778 30/12/2010 EUR 852,846 10/05/2011 USD 1,130,310 80,665
30/12/2010 JPY 24,557,481 10/05/2011 USD 301,766 (5,457) 30/12/2010 USD 1,109,017 10/05/2011 AUD 1,110,365 (33,573)
30/12/2010 USD 567,467 10/05/2011 GBP 367,863 (24,369) 01/03/2011 USD 149,923 05/05/2011 CAD 145,664 (150)
04/01/2011 CAD 815,542 05/05/2011 USD 814,488 25,736 04/01/2011 EUR 55,787 06/05/2011 USD 74,242 4,978
04/01/2011 GBP 430,070 06/05/2011 USD 669,972 21,966 04/01/2011 JPY 7,424,315 06/05/2011 USD 90,749 (1,170)
04/01/2011 SEK 5,598,054 06/05/2011 USD 829,560 59,798 04/01/2011 USD 1,410,349 06/05/2011 AUD 1,423,666 (55,381)
04/01/2011 USD 411,951 06/05/2011 NOK 2,429,719 (26,855) 04/01/2011 USD 110,421 06/05/2011 NZD 145,137 0
04/01/2011 CAD 1,624,911 09/05/2011 USD 1,621,982 51,974 04/01/2011 EUR 2,697,630 10/05/2011 USD 3,589,129 241,295
04/01/2011 GBP 1,251,480 10/05/2011 USD 1,949,613 63,793 04/01/2011 USD 3,304,308 10/05/2011 AUD 3,337,911 (130,623)
04/01/2011 USD 2,766,879 10/05/2011 CHF 2,620,497 (96,009) 04/01/2011 USD 723,797 10/05/2011 JPY 59,243,163 8,970 05/01/2011 USD 181,744 05/05/2011 CAD 181,081 (4,821) 05/01/2011 AUD 246,782 06/05/2011 USD 243,139 10,892 05/01/2011 EUR 43,581 06/05/2011 USD 57,318 4,568 05/01/2011 USD 252,951 06/05/2011 CHF 243,788 (13,377) 05/01/2011 USD 63,311 06/05/2011 GBP 40,912 (2,513) 05/01/2011 USD 339,739 06/05/2011 JPY 28,258,213 (1,213) 05/01/2011 USD 57,534 06/05/2011 NOK 341,938 (4,220)

Notes to the Financial Statements (continued)
116
9. Forward foreign exchange contracts (continued)
Sub-funds Contract Date In exchange for Settlement Contract to
deliver
Unrealised
Gain / (Loss)
by Sub-Fund
Global Currency (continued)
05/01/2011 USD 280,288 06/05/2011 NZD 371,347 (2,238)
05/01/2011 USD 213,106 06/05/2011 SEK 1,449,267 (17,168) 05/01/2011 CAD 302,950 09/05/2011 USD 303,951 8,143
05/01/2011 GBP 208,377 10/05/2011 USD 322,329 12,912 05/01/2011 USD 574,043 10/05/2011 AUD 582,857 (25,770)
05/01/2011 USD 172,858 10/05/2011 CHF 166,589 (9,139) 05/01/2011 USD 59,672 10/05/2011 EUR 45,377 (4,763)
05/01/2011 USD 849,953 10/05/2011 JPY 70,700,778 (3,119) 06/01/2011 USD 106,119 05/05/2011 CAD 106,083 (3,177)
06/01/2011 CHF 169,747 06/05/2011 USD 176,184 9,258 06/01/2011 GBP 11,694 06/05/2011 USD 18,103 711
06/01/2011 JPY 17,125,796 06/05/2011 USD 206,216 417 06/01/2011 SEK 581,393 06/05/2011 USD 84,660 7,705
06/01/2011 USD 314,369 06/05/2011 AUD 320,442 (15,555) 06/01/2011 USD 156,362 06/05/2011 EUR 119,790 (13,754)
06/01/2011 USD 129,082 06/05/2011 NOK 772,030 (10,349) 06/01/2011 USD 40,334 06/05/2011 NZD 53,756 (565)
06/01/2011 USD 2,160,660 09/05/2011 CAD 2,159,741 (64,322) 06/01/2011 AUD 4,393,894 10/05/2011 USD 4,307,282 213,482
06/01/2011 EUR 1,442,046 10/05/2011 USD 1,882,174 165,419 06/01/2011 GBP 4,151,526 10/05/2011 USD 6,426,483 252,575
06/01/2011 USD 3,224,570 10/05/2011 CHF 3,107,450 (170,303) 06/01/2011 USD 5,381,723 10/05/2011 JPY 447,096,861 (12,923)
07/01/2011 CAD 566,046 05/05/2011 USD 569,508 13,669 07/01/2011 CHF 546,024 06/05/2011 USD 567,264 29,248
07/01/2011 GBP 54,283 06/05/2011 USD 84,436 2,899 07/01/2011 JPY 10,985,927 06/05/2011 USD 132,579 (27) 07/01/2011 NZD 123,702 06/05/2011 USD 93,409 703 07/01/2011 SEK 260,039 06/05/2011 USD 37,546 3,766 07/01/2011 USD 1,439,110 06/05/2011 AUD 1,462,332 (66,471) 07/01/2011 USD 309,408 06/05/2011 EUR 238,480 (29,264) 07/01/2011 USD 93,037 06/05/2011 NOK 557,219 (7,599) 07/01/2011 USD 42,238 09/05/2011 CAD 41,996 (1,027) 07/01/2011 AUD 1,011,034 10/05/2011 USD 994,019 46,207
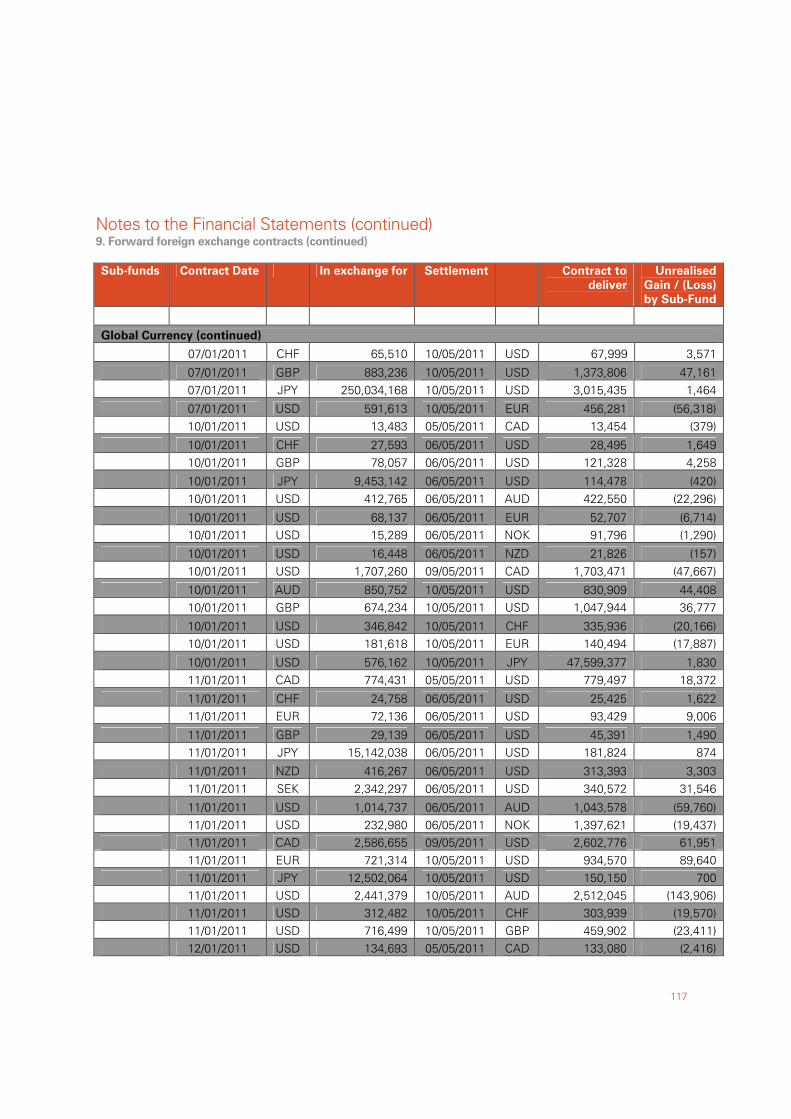
Notes to the Financial Statements (continued)
117
9. Forward foreign exchange contracts (continued)
Sub-funds Contract Date In exchange for Settlement Contract to
deliver
Unrealised
Gain / (Loss)
by Sub-Fund
Global Currency (continued)
07/01/2011 CHF 65,510 10/05/2011 USD 67,999 3,571
07/01/2011 GBP 883,236 10/05/2011 USD 1,373,806 47,161 07/01/2011 JPY 250,034,168 10/05/2011 USD 3,015,435 1,464
07/01/2011 USD 591,613 10/05/2011 EUR 456,281 (56,318) 10/01/2011 USD 13,483 05/05/2011 CAD 13,454 (379)
10/01/2011 CHF 27,593 06/05/2011 USD 28,495 1,649 10/01/2011 GBP 78,057 06/05/2011 USD 121,328 4,258
10/01/2011 JPY 9,453,142 06/05/2011 USD 114,478 (420) 10/01/2011 USD 412,765 06/05/2011 AUD 422,550 (22,296)
10/01/2011 USD 68,137 06/05/2011 EUR 52,707 (6,714) 10/01/2011 USD 15,289 06/05/2011 NOK 91,796 (1,290)
10/01/2011 USD 16,448 06/05/2011 NZD 21,826 (157) 10/01/2011 USD 1,707,260 09/05/2011 CAD 1,703,471 (47,667)
10/01/2011 AUD 850,752 10/05/2011 USD 830,909 44,408 10/01/2011 GBP 674,234 10/05/2011 USD 1,047,944 36,777
10/01/2011 USD 346,842 10/05/2011 CHF 335,936 (20,166) 10/01/2011 USD 181,618 10/05/2011 EUR 140,494 (17,887)
10/01/2011 USD 576,162 10/05/2011 JPY 47,599,377 1,830 11/01/2011 CAD 774,431 05/05/2011 USD 779,497 18,372
11/01/2011 CHF 24,758 06/05/2011 USD 25,425 1,622 11/01/2011 EUR 72,136 06/05/2011 USD 93,429 9,006
11/01/2011 GBP 29,139 06/05/2011 USD 45,391 1,490 11/01/2011 JPY 15,142,038 06/05/2011 USD 181,824 874
11/01/2011 NZD 416,267 06/05/2011 USD 313,393 3,303 11/01/2011 SEK 2,342,297 06/05/2011 USD 340,572 31,546
11/01/2011 USD 1,014,737 06/05/2011 AUD 1,043,578 (59,760) 11/01/2011 USD 232,980 06/05/2011 NOK 1,397,621 (19,437) 11/01/2011 CAD 2,586,655 09/05/2011 USD 2,602,776 61,951 11/01/2011 EUR 721,314 10/05/2011 USD 934,570 89,640 11/01/2011 JPY 12,502,064 10/05/2011 USD 150,150 700 11/01/2011 USD 2,441,379 10/05/2011 AUD 2,512,045 (143,906) 11/01/2011 USD 312,482 10/05/2011 CHF 303,939 (19,570) 11/01/2011 USD 716,499 10/05/2011 GBP 459,902 (23,411) 12/01/2011 USD 134,693 05/05/2011 CAD 133,080 (2,416)

Notes to the Financial Statements (continued)
118
9. Forward foreign exchange contracts (continued)
Sub-funds Contract Date In exchange for Settlement Contract to
deliver
Unrealised
Gain / (Loss)
by Sub-Fund
Global Currency (continued)
12/01/2011 AUD 405,092 06/05/2011 USD 396,585 20,406
12/01/2011 CHF 29,881 06/05/2011 USD 30,789 1,854 12/01/2011 GBP 88,015 06/05/2011 USD 137,974 3,633
12/01/2011 NOK 333,964 06/05/2011 USD 56,146 4,161 12/01/2011 NZD 298,746 06/05/2011 USD 224,635 2,651
12/01/2011 USD 58,110 06/05/2011 EUR 44,533 (5,132) 12/01/2011 USD 37,782 06/05/2011 JPY 3,143,281 (143)
12/01/2011 USD 872,962 09/05/2011 CAD 862,774 (15,867) 12/01/2011 AUD 2,118,958 10/05/2011 USD 2,072,985 107,156
12/01/2011 EUR 256,715 10/05/2011 USD 334,932 29,584 12/01/2011 GBP 261,527 10/05/2011 USD 410,085 10,665
12/01/2011 USD 679,492 10/05/2011 JPY 56,581,595 (3,218) 13/01/2011 CAD 150,091 05/05/2011 USD 151,384 3,249
13/01/2011 AUD 160,752 06/05/2011 USD 158,282 7,192 13/01/2011 CHF 60,746 06/05/2011 USD 63,075 3,288
13/01/2011 EUR 225,826 06/05/2011 USD 300,837 19,843 13/01/2011 NOK 2,264,017 06/05/2011 USD 384,447 24,385
13/01/2011 NZD 176,620 06/05/2011 USD 134,585 (212) 13/01/2011 USD 48,548 06/05/2011 GBP 30,654 (771)
13/01/2011 USD 247,939 06/05/2011 SEK 1,666,083 (16,780) 13/01/2011 USD 1,489,265 09/05/2011 CAD 1,475,889 (31,196)
13/01/2011 AUD 286,954 10/05/2011 USD 282,599 12,641 13/01/2011 EUR 3,363,836 10/05/2011 USD 4,483,718 292,667
13/01/2011 USD 485,936 10/05/2011 CHF 467,758 (25,088) 13/01/2011 USD 2,867,761 10/05/2011 GBP 1,810,052 (44,307)
13/01/2011 USD 1,254,385 10/05/2011 JPY 103,736,989 2,699 14/01/2011 CAD 465,200 05/05/2011 USD 468,072 11,208 14/01/2011 CHF 347,606 06/05/2011 USD 361,029 18,718 14/01/2011 EUR 596,996 06/05/2011 USD 796,843 50,911 14/01/2011 GBP 20,220 06/05/2011 USD 32,076 456 14/01/2011 NZD 167,658 06/05/2011 USD 127,426 128 14/01/2011 USD 1,158,227 06/05/2011 AUD 1,187,418 (64,356) 14/01/2011 USD 38,373 06/05/2011 JPY 3,175,346 60 14/01/2011 USD 94,716 06/05/2011 NOK 558,286 (6,110)
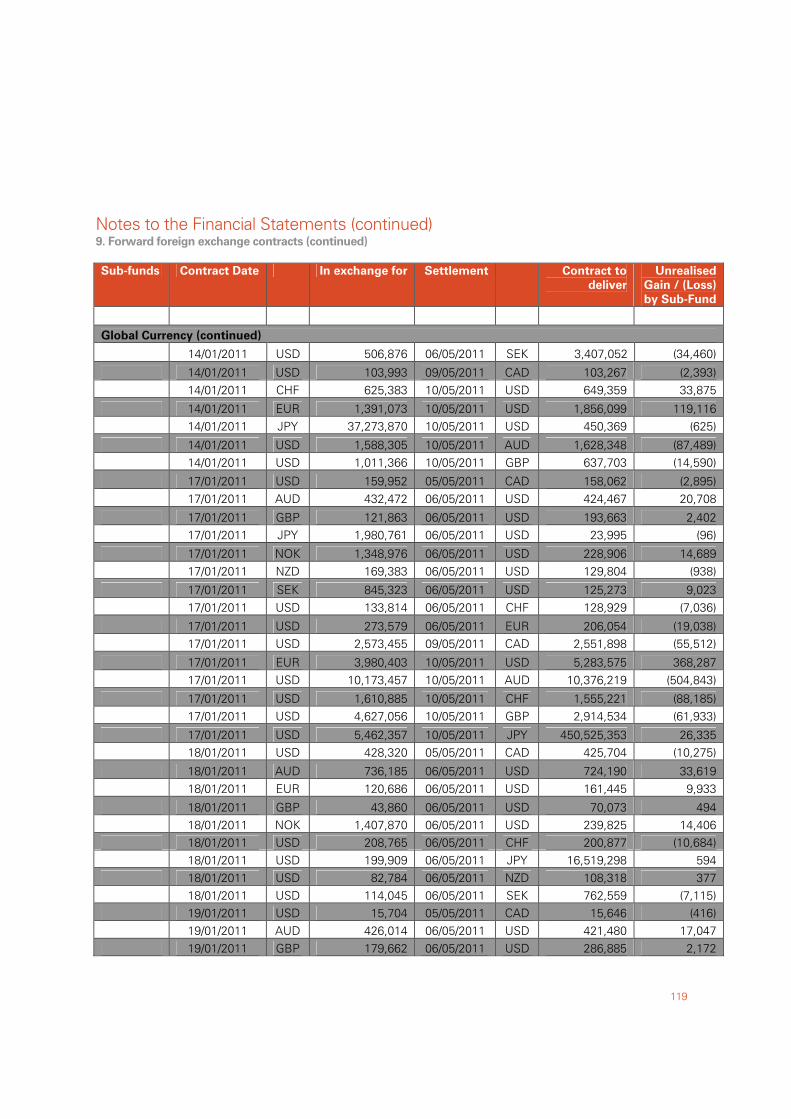
Notes to the Financial Statements (continued)
119
9. Forward foreign exchange contracts (continued)
Sub-funds Contract Date In exchange for Settlement Contract to
deliver
Unrealised
Gain / (Loss)
by Sub-Fund
Global Currency (continued)
14/01/2011 USD 506,876 06/05/2011 SEK 3,407,052 (34,460)
14/01/2011 USD 103,993 09/05/2011 CAD 103,267 (2,393) 14/01/2011 CHF 625,383 10/05/2011 USD 649,359 33,875
14/01/2011 EUR 1,391,073 10/05/2011 USD 1,856,099 119,116 14/01/2011 JPY 37,273,870 10/05/2011 USD 450,369 (625)
14/01/2011 USD 1,588,305 10/05/2011 AUD 1,628,348 (87,489) 14/01/2011 USD 1,011,366 10/05/2011 GBP 637,703 (14,590)
17/01/2011 USD 159,952 05/05/2011 CAD 158,062 (2,895) 17/01/2011 AUD 432,472 06/05/2011 USD 424,467 20,708
17/01/2011 GBP 121,863 06/05/2011 USD 193,663 2,402 17/01/2011 JPY 1,980,761 06/05/2011 USD 23,995 (96)
17/01/2011 NOK 1,348,976 06/05/2011 USD 228,906 14,689 17/01/2011 NZD 169,383 06/05/2011 USD 129,804 (938)
17/01/2011 SEK 845,323 06/05/2011 USD 125,273 9,023 17/01/2011 USD 133,814 06/05/2011 CHF 128,929 (7,036)
17/01/2011 USD 273,579 06/05/2011 EUR 206,054 (19,038) 17/01/2011 USD 2,573,455 09/05/2011 CAD 2,551,898 (55,512)
17/01/2011 EUR 3,980,403 10/05/2011 USD 5,283,575 368,287 17/01/2011 USD 10,173,457 10/05/2011 AUD 10,376,219 (504,843)
17/01/2011 USD 1,610,885 10/05/2011 CHF 1,555,221 (88,185) 17/01/2011 USD 4,627,056 10/05/2011 GBP 2,914,534 (61,933)
17/01/2011 USD 5,462,357 10/05/2011 JPY 450,525,353 26,335 18/01/2011 USD 428,320 05/05/2011 CAD 425,704 (10,275)
18/01/2011 AUD 736,185 06/05/2011 USD 724,190 33,619 18/01/2011 EUR 120,686 06/05/2011 USD 161,445 9,933
18/01/2011 GBP 43,860 06/05/2011 USD 70,073 494 18/01/2011 NOK 1,407,870 06/05/2011 USD 239,825 14,406 18/01/2011 USD 208,765 06/05/2011 CHF 200,877 (10,684) 18/01/2011 USD 199,909 06/05/2011 JPY 16,519,298 594 18/01/2011 USD 82,784 06/05/2011 NZD 108,318 377 18/01/2011 USD 114,045 06/05/2011 SEK 762,559 (7,115) 19/01/2011 USD 15,704 05/05/2011 CAD 15,646 (416) 19/01/2011 AUD 426,014 06/05/2011 USD 421,480 17,047 19/01/2011 GBP 179,662 06/05/2011 USD 286,885 2,172

Notes to the Financial Statements (continued)
120
9. Forward foreign exchange contracts (continued)
Sub-funds Contract Date In exchange for Settlement Contract to
deliver
Unrealised
Gain / (Loss)
by Sub-Fund
Global Currency (continued)
19/01/2011 NZD 87,734 06/05/2011 USD 67,081 (333)
19/01/2011 SEK 672,068 06/05/2011 USD 101,346 5,425 19/01/2011 USD 49,027 06/05/2011 CHF 46,998 (2,316)
19/01/2011 USD 190,985 06/05/2011 EUR 141,668 (10,196) 19/01/2011 USD 47,133 06/05/2011 JPY 3,863,331 519
19/01/2011 USD 18,560 06/05/2011 NOK 108,271 (993) 20/01/2011 CAD 224,057 05/05/2011 USD 223,179 7,659
20/01/2011 CHF 404,601 06/05/2011 USD 419,442 22,570 20/01/2011 EUR 108,848 06/05/2011 USD 145,924 8,644
20/01/2011 JPY 9,843,444 06/05/2011 USD 118,702 65 20/01/2011 USD 1,312,775 06/05/2011 AUD 1,351,320 (78,587)
20/01/2011 USD 211,903 06/05/2011 GBP 133,706 (3,217) 20/01/2011 USD 462,041 06/05/2011 NOK 2,731,603 (31,287)
20/01/2011 USD 629,322 06/05/2011 NZD 841,123 (10,629) 20/01/2011 USD 102,252 06/05/2011 SEK 685,165 (6,611)
21/01/2011 CAD 303,595 05/05/2011 USD 304,975 7,809 21/01/2011 EUR 344,122 06/05/2011 USD 466,796 21,868
21/01/2011 NOK 1,369,823 06/05/2011 USD 234,714 12,646 21/01/2011 USD 41,404 06/05/2011 AUD 42,343 (2,193)
21/01/2011 USD 30,876 06/05/2011 CHF 29,605 (1,466) 21/01/2011 USD 274,700 06/05/2011 GBP 171,963 (1,971)
21/01/2011 USD 120,318 06/05/2011 JPY 9,938,502 404 21/01/2011 USD 7,851 06/05/2011 NZD 10,449 (99)
21/01/2011 USD 57,462 06/05/2011 SEK 380,774 (3,037) 24/01/2011 USD 148,300 05/05/2011 CAD 147,735 (3,909)
24/01/2011 AUD 579,666 06/05/2011 USD 571,963 24,730 24/01/2011 GBP 119,365 06/05/2011 USD 190,707 1,338 24/01/2011 NOK 73,153 06/05/2011 USD 12,611 598 24/01/2011 NZD 95,901 06/05/2011 USD 72,727 235 24/01/2011 SEK 1,826,058 06/05/2011 USD 277,143 12,961 24/01/2011 USD 83,991 06/05/2011 CHF 79,693 (3,070) 24/01/2011 USD 122,779 06/05/2011 EUR 89,914 (4,906) 24/01/2011 USD 24,011 06/05/2011 JPY 1,977,193 155 25/01/2011 CAD 289,562 05/05/2011 USD 289,526 8,799

Notes to the Financial Statements (continued)
121
9. Forward foreign exchange contracts (continued)
Sub-funds Contract Date In exchange for Settlement Contract to
deliver
Unrealised
Gain / (Loss)
by Sub-Fund
Global Currency (continued)
25/01/2011 CHF 223,689 06/05/2011 USD 237,215 7,157
25/01/2011 EUR 79,420 06/05/2011 USD 108,293 4,486 25/01/2011 JPY 15,778,902 06/05/2011 USD 191,428 (1,046)
25/01/2011 NOK 669,102 06/05/2011 USD 115,231 5,594 25/01/2011 NZD 298,468 06/05/2011 USD 226,568 507
25/01/2011 USD 965,838 06/05/2011 AUD 985,304 (48,623) 25/01/2011 USD 782,535 06/05/2011 GBP 495,398 (14,515)
25/01/2011 USD 56,971 06/05/2011 SEK 374,423 (2,517) 26/01/2011 CAD 134,025 05/05/2011 USD 134,295 3,786
26/01/2011 AUD 185,586 06/05/2011 USD 182,478 8,559 26/01/2011 CHF 214,027 06/05/2011 USD 227,179 6,638
26/01/2011 EUR 39,302 06/05/2011 USD 53,715 2,095 26/01/2011 GBP 128,613 06/05/2011 USD 204,060 2,864
26/01/2011 NZD 176,510 06/05/2011 USD 134,193 95 26/01/2011 USD 318,895 06/05/2011 JPY 26,220,383 2,530
26/01/2011 USD 35,229 06/05/2011 NOK 203,836 (1,582) 27/01/2011 CAD 301,099 05/05/2011 USD 301,941 8,271
27/01/2011 CHF 203,292 06/05/2011 USD 214,743 7,347 27/01/2011 GBP 16,715 06/05/2011 USD 26,581 312
27/01/2011 NZD 474,210 06/05/2011 USD 363,514 (2,735) 27/01/2011 SEK 2,904,220 06/05/2011 USD 449,689 11,701
27/01/2011 USD 569,313 06/05/2011 AUD 580,486 (28,350) 27/01/2011 USD 37,709 06/05/2011 EUR 27,524 (1,377)
27/01/2011 USD 31,571 06/05/2011 JPY 2,617,329 (9) 27/01/2011 USD 394,928 06/05/2011 NOK 2,295,423 (19,613)
28/01/2011 USD 234,863 05/05/2011 CAD 235,092 (7,349) 28/01/2011 EUR 31,139 06/05/2011 USD 42,398 1,820 28/01/2011 USD 11,586 06/05/2011 CHF 10,918 (341) 28/01/2011 USD 34,486 06/05/2011 GBP 21,786 (565) 28/01/2011 USD 18,071 06/05/2011 JPY 1,484,528 160 28/01/2011 USD 42,259 06/05/2011 NOK 246,667 (2,288) 28/01/2011 USD 67,412 06/05/2011 NZD 87,764 642 28/01/2011 USD 12,272 06/05/2011 SEK 80,099 (454) 31/01/2011 CAD 36,262 05/05/2011 USD 36,262 1,097

Notes to the Financial Statements (continued)
122
9. Forward foreign exchange contracts (continued)
Sub-funds Contract Date In exchange for Settlement Contract to
deliver
Unrealised
Gain / (Loss)
by Sub-Fund
Global Currency (continued)
31/01/2011 AUD 344,600 06/05/2011 USD 338,953 15,770
31/01/2011 EUR 165,619 06/05/2011 USD 226,747 8,437 31/01/2011 GBP 34,778 06/05/2011 USD 55,321 633
31/01/2011 NZD 150,783 06/05/2011 USD 115,479 (763) 31/01/2011 SEK 476,704 06/05/2011 USD 73,575 2,158
31/01/2011 USD 66,545 06/05/2011 CHF 62,577 (1,818) 31/01/2011 USD 91,486 06/05/2011 JPY 7,497,920 1,019
31/01/2011 USD 182,028 06/05/2011 NOK 1,057,352 (8,924) 01/02/2011 USD 311,529 05/05/2011 CAD 309,663 (7,512)
01/02/2011 AUD 1,547,248 06/05/2011 USD 1,547,771 44,926 01/02/2011 EUR 266,995 06/05/2011 USD 367,757 11,385
01/02/2011 NOK 2,184,567 06/05/2011 USD 380,097 14,387 01/02/2011 NZD 485,839 06/05/2011 USD 375,839 (6,212)
01/02/2011 USD 246,116 06/05/2011 CHF 231,432 (6,714) 01/02/2011 USD 111,058 06/05/2011 GBP 68,846 292
01/02/2011 USD 636,101 06/05/2011 JPY 51,816,049 10,908 01/02/2011 USD 57,574 06/05/2011 SEK 369,091 (1,065)
02/02/2011 CAD 789,345 05/05/2011 USD 797,033 16,202 02/02/2011 CHF 345,787 06/05/2011 USD 367,696 10,064
02/02/2011 EUR 126,672 06/05/2011 USD 174,610 5,269 02/02/2011 GBP 68,153 06/05/2011 USD 110,039 (388)
02/02/2011 JPY 3,893,175 06/05/2011 USD 47,713 (739) 02/02/2011 NZD 49,235 06/05/2011 USD 38,069 (611)
02/02/2011 USD 982,212 06/05/2011 AUD 987,739 (34,695) 02/02/2011 USD 166,677 06/05/2011 NOK 961,275 (6,921)
02/02/2011 USD 117,601 06/05/2011 SEK 761,134 (3,325) 03/02/2011 USD 746,912 05/05/2011 CAD 741,290 (16,825) 03/02/2011 AUD 1,055,234 06/05/2011 USD 1,055,404 30,827 03/02/2011 SEK 824,194 06/05/2011 USD 126,566 4,373 03/02/2011 USD 281,837 06/05/2011 CHF 266,729 (9,553) 03/02/2011 USD 420,848 06/05/2011 EUR 308,979 (17,926) 03/02/2011 USD 150,179 06/05/2011 GBP 93,210 214 03/02/2011 USD 303,856 06/05/2011 JPY 24,790,078 4,748 03/02/2011 USD 16,122 06/05/2011 NOK 92,968 (667)

Notes to the Financial Statements (continued)
123
9. Forward foreign exchange contracts (continued)
Sub-funds Contract Date In exchange for Settlement Contract to
deliver
Unrealised
Gain / (Loss)
by Sub-Fund
Global Currency (continued)
03/02/2011 USD 112,070 06/05/2011 NZD 146,156 877
04/02/2011 CAD 135,980 05/05/2011 USD 137,648 2,448 04/02/2011 AUD 650,377 06/05/2011 USD 654,351 15,130
04/02/2011 EUR 514,497 06/05/2011 USD 700,648 29,954 04/02/2011 GBP 68,379 06/05/2011 USD 110,072 (57)
04/02/2011 NOK 300,232 06/05/2011 USD 52,089 2,127 04/02/2011 NZD 136,264 06/05/2011 USD 104,514 (845)
04/02/2011 USD 90,379 06/05/2011 CHF 85,616 (3,154) 04/02/2011 USD 332,846 06/05/2011 JPY 27,157,808 5,170
04/02/2011 USD 326,194 06/05/2011 SEK 2,116,914 (10,136) 07/02/2011 USD 826,989 05/05/2011 CAD 817,557 (15,323)
07/02/2011 AUD 1,464,122 06/05/2011 USD 1,471,084 36,045 07/02/2011 GBP 157,572 06/05/2011 USD 253,583 (66)
07/02/2011 NOK 707,733 06/05/2011 USD 121,745 6,056 07/02/2011 USD 358,036 06/05/2011 CHF 342,682 (16,330)
07/02/2011 USD 351,084 06/05/2011 EUR 259,504 (17,433) 07/02/2011 USD 394,238 06/05/2011 JPY 32,465,606 2,521
07/02/2011 USD 312,387 06/05/2011 NZD 408,547 1,568 07/02/2011 USD 68,422 06/05/2011 SEK 445,250 (2,319)
08/02/2011 CAD 428,108 05/05/2011 USD 430,374 10,690 08/02/2011 CHF 372,917 06/05/2011 USD 389,630 17,769
08/02/2011 EUR 150,548 06/05/2011 USD 205,403 8,380 08/02/2011 JPY 27,690,747 06/05/2011 USD 338,461 (4,356)
08/02/2011 USD 1,973,427 06/05/2011 AUD 1,962,152 (46,568) 08/02/2011 USD 467,979 06/05/2011 GBP 291,076 (332)
08/02/2011 USD 484,154 06/05/2011 NOK 2,800,094 (21,523) 08/02/2011 USD 40,060 06/05/2011 NZD 51,969 523 08/02/2011 USD 70,190 06/05/2011 SEK 451,958 (1,615) 09/02/2011 USD 118,857 05/05/2011 CAD 118,445 (3,175) 09/02/2011 AUD 72,504 06/05/2011 USD 72,444 2,190 09/02/2011 CHF 97,653 06/05/2011 USD 101,275 5,408 09/02/2011 SEK 395,395 06/05/2011 USD 61,047 1,769 09/02/2011 USD 190,606 06/05/2011 EUR 139,988 (8,187) 09/02/2011 USD 81,283 06/05/2011 GBP 50,682 (259)
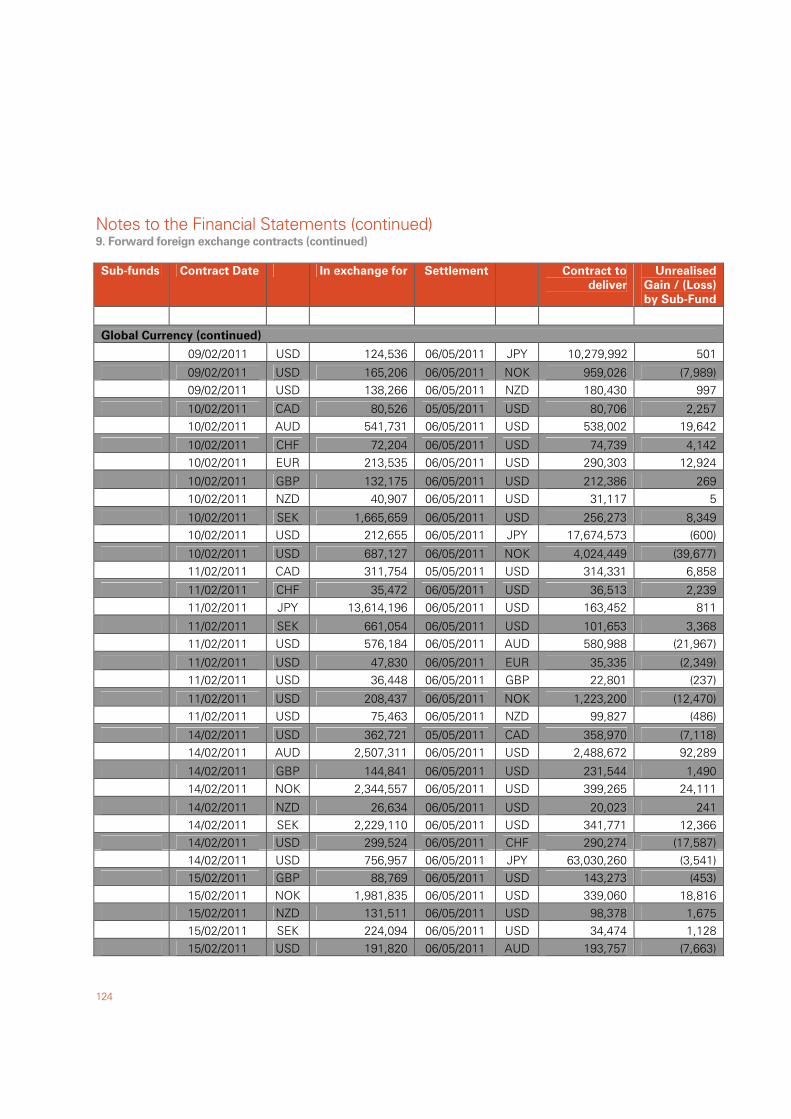
Notes to the Financial Statements (continued)
124
9. Forward foreign exchange contracts (continued)
Sub-funds Contract Date In exchange for Settlement Contract to
deliver
Unrealised
Gain / (Loss)
by Sub-Fund
Global Currency (continued)
09/02/2011 USD 124,536 06/05/2011 JPY 10,279,992 501
09/02/2011 USD 165,206 06/05/2011 NOK 959,026 (7,989) 09/02/2011 USD 138,266 06/05/2011 NZD 180,430 997
10/02/2011 CAD 80,526 05/05/2011 USD 80,706 2,257 10/02/2011 AUD 541,731 06/05/2011 USD 538,002 19,642
10/02/2011 CHF 72,204 06/05/2011 USD 74,739 4,142 10/02/2011 EUR 213,535 06/05/2011 USD 290,303 12,924
10/02/2011 GBP 132,175 06/05/2011 USD 212,386 269 10/02/2011 NZD 40,907 06/05/2011 USD 31,117 5
10/02/2011 SEK 1,665,659 06/05/2011 USD 256,273 8,349 10/02/2011 USD 212,655 06/05/2011 JPY 17,674,573 (600)
10/02/2011 USD 687,127 06/05/2011 NOK 4,024,449 (39,677) 11/02/2011 CAD 311,754 05/05/2011 USD 314,331 6,858
11/02/2011 CHF 35,472 06/05/2011 USD 36,513 2,239 11/02/2011 JPY 13,614,196 06/05/2011 USD 163,452 811
11/02/2011 SEK 661,054 06/05/2011 USD 101,653 3,368 11/02/2011 USD 576,184 06/05/2011 AUD 580,988 (21,967)
11/02/2011 USD 47,830 06/05/2011 EUR 35,335 (2,349) 11/02/2011 USD 36,448 06/05/2011 GBP 22,801 (237)
11/02/2011 USD 208,437 06/05/2011 NOK 1,223,200 (12,470) 11/02/2011 USD 75,463 06/05/2011 NZD 99,827 (486)
14/02/2011 USD 362,721 05/05/2011 CAD 358,970 (7,118) 14/02/2011 AUD 2,507,311 06/05/2011 USD 2,488,672 92,289
14/02/2011 GBP 144,841 06/05/2011 USD 231,544 1,490 14/02/2011 NOK 2,344,557 06/05/2011 USD 399,265 24,111
14/02/2011 NZD 26,634 06/05/2011 USD 20,023 241 14/02/2011 SEK 2,229,110 06/05/2011 USD 341,771 12,366 14/02/2011 USD 299,524 06/05/2011 CHF 290,274 (17,587) 14/02/2011 USD 756,957 06/05/2011 JPY 63,030,260 (3,541) 15/02/2011 GBP 88,769 06/05/2011 USD 143,273 (453) 15/02/2011 NOK 1,981,835 06/05/2011 USD 339,060 18,816 15/02/2011 NZD 131,511 06/05/2011 USD 98,378 1,675 15/02/2011 SEK 224,094 06/05/2011 USD 34,474 1,128 15/02/2011 USD 191,820 06/05/2011 AUD 193,757 (7,663)

Notes to the Financial Statements (continued)
125
9. Forward foreign exchange contracts (continued)
Sub-funds Contract Date In exchange for Settlement Contract to
deliver
Unrealised
Gain / (Loss)
by Sub-Fund
Global Currency (continued)
15/02/2011 USD 232,500 06/05/2011 EUR 172,231 (12,082)
15/02/2011 USD 80,938 06/05/2011 JPY 6,776,828 (829) 16/02/2011 CAD 91,095 05/05/2011 USD 92,188 1,665
16/02/2011 CHF 230,846 06/05/2011 USD 238,678 13,513 16/02/2011 GBP 40,745 06/05/2011 USD 65,320 235
16/02/2011 NOK 528,448 06/05/2011 USD 90,995 4,431 16/02/2011 NZD 73,735 06/05/2011 USD 55,119 978
16/02/2011 USD 109,745 06/05/2011 AUD 110,894 (4,426) 16/02/2011 USD 110,878 06/05/2011 EUR 82,128 (5,751)
16/02/2011 USD 54,744 06/05/2011 JPY 4,587,667 (608) 16/02/2011 USD 41,061 06/05/2011 SEK 265,908 (1,185)
17/02/2011 AUD 228,866 06/05/2011 USD 227,453 8,136 17/02/2011 JPY 1,267,009 06/05/2011 USD 15,158 130
17/02/2011 NOK 1,933,423 06/05/2011 USD 334,422 14,711 17/02/2011 NZD 235,393 06/05/2011 USD 176,535 2,552
17/02/2011 SEK 75,390 06/05/2011 USD 11,637 340 17/02/2011 USD 89,861 06/05/2011 CHF 85,974 (4,062)
17/02/2011 USD 78,548 06/05/2011 EUR 58,014 (3,837) 17/02/2011 USD 81,734 06/05/2011 GBP 50,729 116
18/02/2011 USD 200,653 05/05/2011 CAD 197,796 (3,132) 18/02/2011 AUD 796,301 06/05/2011 USD 797,064 22,628
18/02/2011 EUR 51,304 06/05/2011 USD 69,472 3,381 18/02/2011 GBP 206,331 06/05/2011 USD 334,222 (2,257)
18/02/2011 NOK 615,638 06/05/2011 USD 107,185 3,986 18/02/2011 NZD 43,907 06/05/2011 USD 33,199 205
18/02/2011 SEK 1,790,298 06/05/2011 USD 276,989 7,434 18/02/2011 USD 133,184 06/05/2011 CHF 126,824 (5,366) 18/02/2011 USD 173,885 06/05/2011 JPY 14,495,808 (1,016) 21/02/2011 CAD 136,876 05/05/2011 USD 138,915 2,104 21/02/2011 CHF 92,453 06/05/2011 USD 97,572 3,430 21/02/2011 EUR 260,999 06/05/2011 USD 356,507 14,120 21/02/2011 JPY 4,786,581 06/05/2011 USD 57,603 150 21/02/2011 NOK 202,258 06/05/2011 USD 35,434 1,090 21/02/2011 NZD 223,379 06/05/2011 USD 169,649 298

Notes to the Financial Statements (continued)
126
9. Forward foreign exchange contracts (continued)
Sub-funds Contract Date In exchange for Settlement Contract to
deliver
Unrealised
Gain / (Loss)
by Sub-Fund
Global Currency (continued)
21/02/2011 USD 144,855 06/05/2011 AUD 144,544 (3,952)
21/02/2011 USD 36,207 06/05/2011 GBP 22,353 243 21/02/2011 USD 12,634 06/05/2011 SEK 81,223 (270)
22/02/2011 USD 544,587 05/05/2011 CAD 538,840 (10,569) 22/02/2011 AUD 1,148,053 06/05/2011 USD 1,141,145 40,631
22/02/2011 EUR 38,728 06/05/2011 USD 52,909 2,086 22/02/2011 NOK 2,127,450 06/05/2011 USD 373,673 10,498
22/02/2011 USD 15,536 06/05/2011 CHF 14,610 (424) 22/02/2011 USD 102,311 06/05/2011 JPY 8,497,381 (215)
22/02/2011 USD 1,159,114 06/05/2011 NZD 1,556,202 (24,904) 22/02/2011 USD 647,592 06/05/2011 SEK 4,174,538 (15,640)
23/02/2011 CAD 634,000 05/05/2011 USD 637,958 15,230 23/02/2011 CHF 451,159 06/05/2011 USD 483,474 9,402
23/02/2011 JPY 51,995,609 06/05/2011 USD 630,119 (2,761) 23/02/2011 SEK 252,892 06/05/2011 USD 39,428 749
23/02/2011 USD 2,604,812 06/05/2011 AUD 2,623,367 (96,039) 23/02/2011 USD 160,895 06/05/2011 EUR 117,051 (5,325)
23/02/2011 USD 326,531 06/05/2011 GBP 201,306 2,652 23/02/2011 USD 412,592 06/05/2011 NOK 2,330,897 (8,333)
23/02/2011 USD 170,475 06/05/2011 NZD 229,704 (4,294) 24/02/2011 CAD 730,427 05/05/2011 USD 742,493 10,041
24/02/2011 CHF 295,853 06/05/2011 USD 319,769 3,440 24/02/2011 EUR 37,751 06/05/2011 USD 51,957 1,651
24/02/2011 JPY 59,326,821 06/05/2011 USD 726,535 (10,721) 24/02/2011 USD 1,322,427 06/05/2011 AUD 1,324,071 (40,718)
24/02/2011 USD 200,539 06/05/2011 GBP 123,905 1,189 24/02/2011 USD 210,939 06/05/2011 NOK 1,185,184 (3,085) 24/02/2011 USD 357,011 06/05/2011 NZD 479,665 (7,937) 24/02/2011 USD 98,558 06/05/2011 SEK 630,952 (1,684) 25/02/2011 USD 394,655 05/05/2011 CAD 387,790 (4,875) 25/02/2011 AUD 335,801 06/05/2011 USD 337,130 8,534 25/02/2011 NOK 2,234,430 06/05/2011 USD 395,578 7,910 25/02/2011 NZD 492,963 06/05/2011 USD 367,771 7,275 25/02/2011 USD 138,608 06/05/2011 CHF 128,596 (1,878)
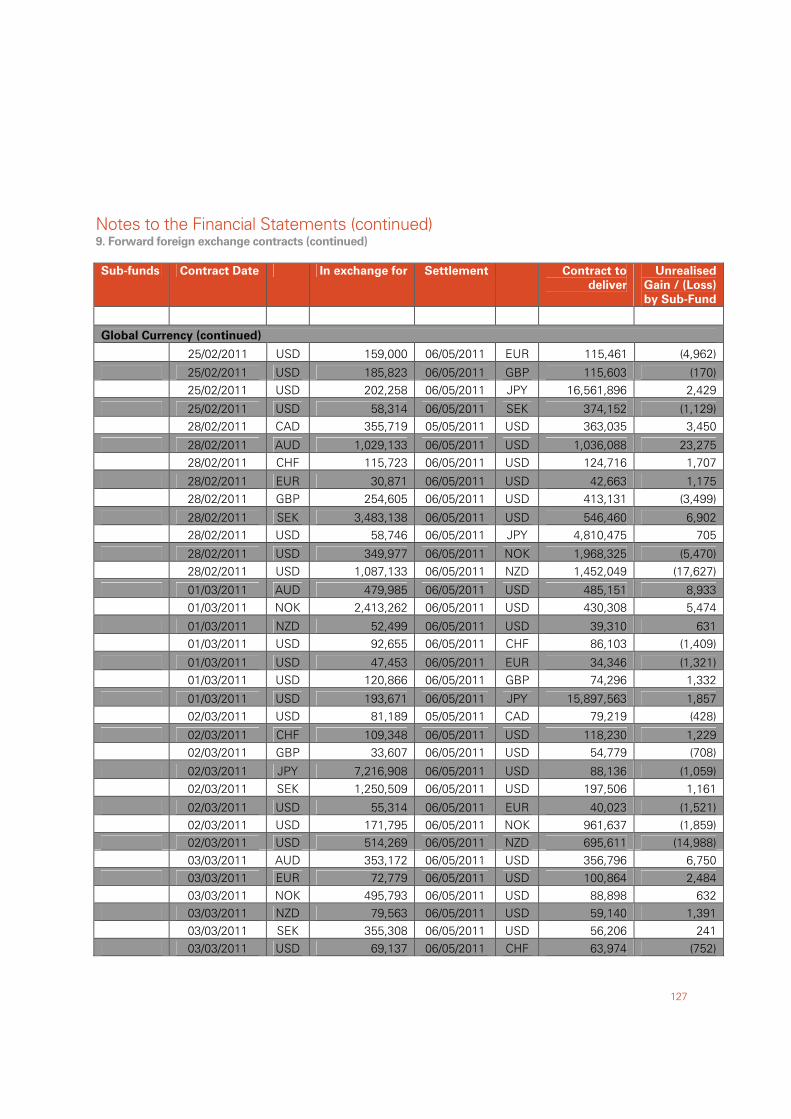
Notes to the Financial Statements (continued)
127
9. Forward foreign exchange contracts (continued)
Sub-funds Contract Date In exchange for Settlement Contract to
deliver
Unrealised
Gain / (Loss)
by Sub-Fund
Global Currency (continued)
25/02/2011 USD 159,000 06/05/2011 EUR 115,461 (4,962)
25/02/2011 USD 185,823 06/05/2011 GBP 115,603 (170) 25/02/2011 USD 202,258 06/05/2011 JPY 16,561,896 2,429
25/02/2011 USD 58,314 06/05/2011 SEK 374,152 (1,129) 28/02/2011 CAD 355,719 05/05/2011 USD 363,035 3,450
28/02/2011 AUD 1,029,133 06/05/2011 USD 1,036,088 23,275 28/02/2011 CHF 115,723 06/05/2011 USD 124,716 1,707
28/02/2011 EUR 30,871 06/05/2011 USD 42,663 1,175 28/02/2011 GBP 254,605 06/05/2011 USD 413,131 (3,499)
28/02/2011 SEK 3,483,138 06/05/2011 USD 546,460 6,902 28/02/2011 USD 58,746 06/05/2011 JPY 4,810,475 705
28/02/2011 USD 349,977 06/05/2011 NOK 1,968,325 (5,470) 28/02/2011 USD 1,087,133 06/05/2011 NZD 1,452,049 (17,627)
01/03/2011 AUD 479,985 06/05/2011 USD 485,151 8,933 01/03/2011 NOK 2,413,262 06/05/2011 USD 430,308 5,474
01/03/2011 NZD 52,499 06/05/2011 USD 39,310 631 01/03/2011 USD 92,655 06/05/2011 CHF 86,103 (1,409)
01/03/2011 USD 47,453 06/05/2011 EUR 34,346 (1,321) 01/03/2011 USD 120,866 06/05/2011 GBP 74,296 1,332
01/03/2011 USD 193,671 06/05/2011 JPY 15,897,563 1,857 02/03/2011 USD 81,189 05/05/2011 CAD 79,219 (428)
02/03/2011 CHF 109,348 06/05/2011 USD 118,230 1,229 02/03/2011 GBP 33,607 06/05/2011 USD 54,779 (708)
02/03/2011 JPY 7,216,908 06/05/2011 USD 88,136 (1,059) 02/03/2011 SEK 1,250,509 06/05/2011 USD 197,506 1,161
02/03/2011 USD 55,314 06/05/2011 EUR 40,023 (1,521) 02/03/2011 USD 171,795 06/05/2011 NOK 961,637 (1,859) 02/03/2011 USD 514,269 06/05/2011 NZD 695,611 (14,988) 03/03/2011 AUD 353,172 06/05/2011 USD 356,796 6,750 03/03/2011 EUR 72,779 06/05/2011 USD 100,864 2,484 03/03/2011 NOK 495,793 06/05/2011 USD 88,898 632 03/03/2011 NZD 79,563 06/05/2011 USD 59,140 1,391 03/03/2011 SEK 355,308 06/05/2011 USD 56,206 241 03/03/2011 USD 69,137 06/05/2011 CHF 63,974 (752)
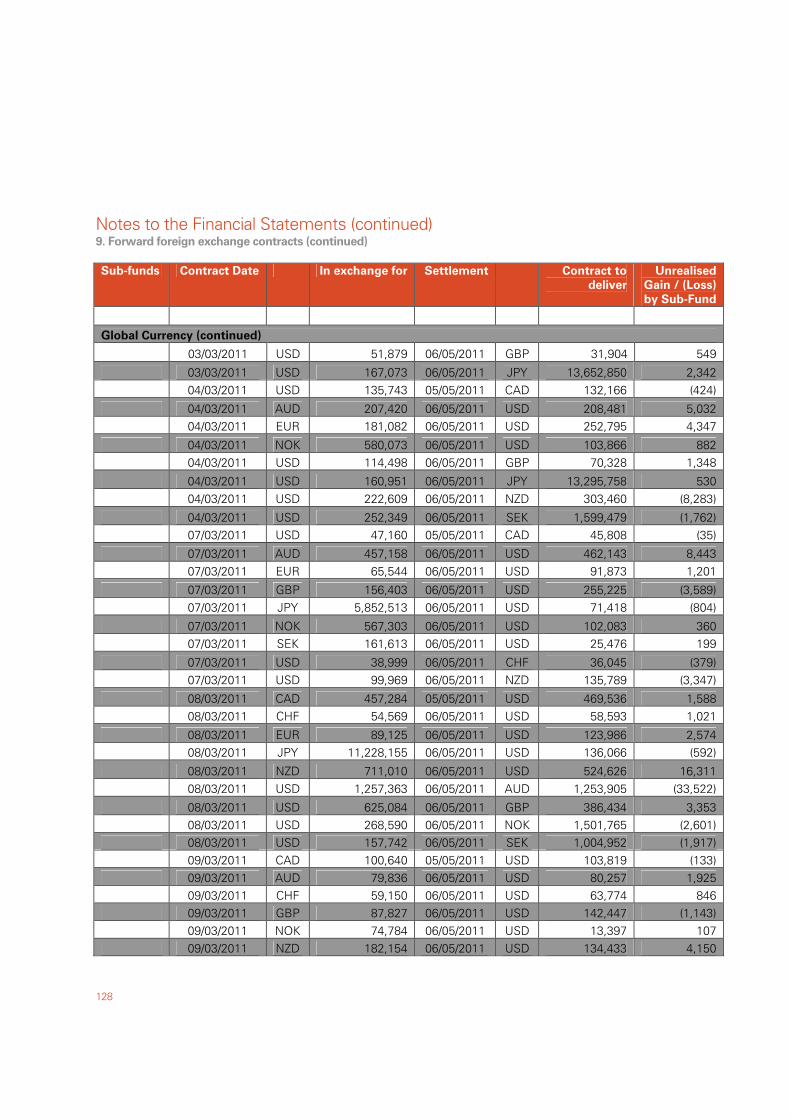
Notes to the Financial Statements (continued)
128
9. Forward foreign exchange contracts (continued)
Sub-funds Contract Date In exchange for Settlement Contract to
deliver
Unrealised
Gain / (Loss)
by Sub-Fund
Global Currency (continued)
03/03/2011 USD 51,879 06/05/2011 GBP 31,904 549
03/03/2011 USD 167,073 06/05/2011 JPY 13,652,850 2,342 04/03/2011 USD 135,743 05/05/2011 CAD 132,166 (424)
04/03/2011 AUD 207,420 06/05/2011 USD 208,481 5,032 04/03/2011 EUR 181,082 06/05/2011 USD 252,795 4,347
04/03/2011 NOK 580,073 06/05/2011 USD 103,866 882 04/03/2011 USD 114,498 06/05/2011 GBP 70,328 1,348
04/03/2011 USD 160,951 06/05/2011 JPY 13,295,758 530 04/03/2011 USD 222,609 06/05/2011 NZD 303,460 (8,283)
04/03/2011 USD 252,349 06/05/2011 SEK 1,599,479 (1,762) 07/03/2011 USD 47,160 05/05/2011 CAD 45,808 (35)
07/03/2011 AUD 457,158 06/05/2011 USD 462,143 8,443 07/03/2011 EUR 65,544 06/05/2011 USD 91,873 1,201
07/03/2011 GBP 156,403 06/05/2011 USD 255,225 (3,589) 07/03/2011 JPY 5,852,513 06/05/2011 USD 71,418 (804)
07/03/2011 NOK 567,303 06/05/2011 USD 102,083 360 07/03/2011 SEK 161,613 06/05/2011 USD 25,476 199
07/03/2011 USD 38,999 06/05/2011 CHF 36,045 (379) 07/03/2011 USD 99,969 06/05/2011 NZD 135,789 (3,347)
08/03/2011 CAD 457,284 05/05/2011 USD 469,536 1,588 08/03/2011 CHF 54,569 06/05/2011 USD 58,593 1,021
08/03/2011 EUR 89,125 06/05/2011 USD 123,986 2,574 08/03/2011 JPY 11,228,155 06/05/2011 USD 136,066 (592)
08/03/2011 NZD 711,010 06/05/2011 USD 524,626 16,311 08/03/2011 USD 1,257,363 06/05/2011 AUD 1,253,905 (33,522)
08/03/2011 USD 625,084 06/05/2011 GBP 386,434 3,353 08/03/2011 USD 268,590 06/05/2011 NOK 1,501,765 (2,601) 08/03/2011 USD 157,742 06/05/2011 SEK 1,004,952 (1,917) 09/03/2011 CAD 100,640 05/05/2011 USD 103,819 (133) 09/03/2011 AUD 79,836 06/05/2011 USD 80,257 1,925 09/03/2011 CHF 59,150 06/05/2011 USD 63,774 846 09/03/2011 GBP 87,827 06/05/2011 USD 142,447 (1,143) 09/03/2011 NOK 74,784 06/05/2011 USD 13,397 107 09/03/2011 NZD 182,154 06/05/2011 USD 134,433 4,150
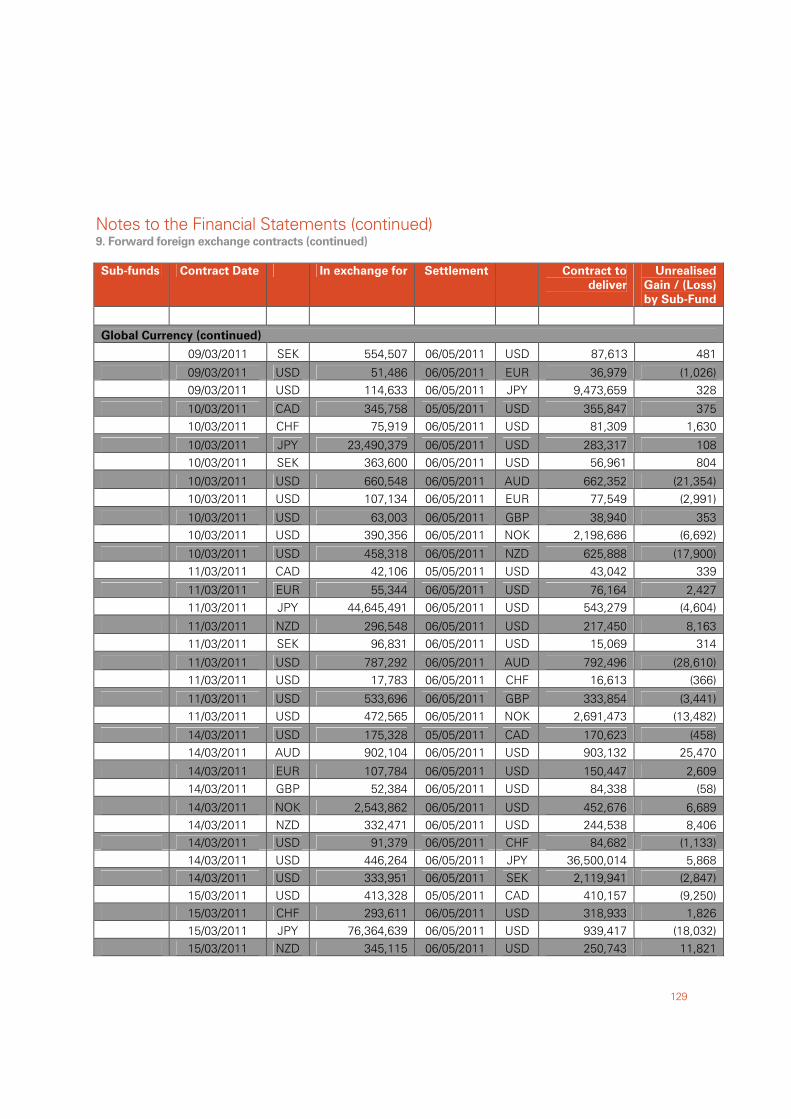
Notes to the Financial Statements (continued)
129
9. Forward foreign exchange contracts (continued)
Sub-funds Contract Date In exchange for Settlement Contract to
deliver
Unrealised
Gain / (Loss)
by Sub-Fund
Global Currency (continued)
09/03/2011 SEK 554,507 06/05/2011 USD 87,613 481
09/03/2011 USD 51,486 06/05/2011 EUR 36,979 (1,026) 09/03/2011 USD 114,633 06/05/2011 JPY 9,473,659 328
10/03/2011 CAD 345,758 05/05/2011 USD 355,847 375 10/03/2011 CHF 75,919 06/05/2011 USD 81,309 1,630
10/03/2011 JPY 23,490,379 06/05/2011 USD 283,317 108 10/03/2011 SEK 363,600 06/05/2011 USD 56,961 804
10/03/2011 USD 660,548 06/05/2011 AUD 662,352 (21,354) 10/03/2011 USD 107,134 06/05/2011 EUR 77,549 (2,991)
10/03/2011 USD 63,003 06/05/2011 GBP 38,940 353 10/03/2011 USD 390,356 06/05/2011 NOK 2,198,686 (6,692)
10/03/2011 USD 458,318 06/05/2011 NZD 625,888 (17,900) 11/03/2011 CAD 42,106 05/05/2011 USD 43,042 339
11/03/2011 EUR 55,344 06/05/2011 USD 76,164 2,427 11/03/2011 JPY 44,645,491 06/05/2011 USD 543,279 (4,604)
11/03/2011 NZD 296,548 06/05/2011 USD 217,450 8,163 11/03/2011 SEK 96,831 06/05/2011 USD 15,069 314
11/03/2011 USD 787,292 06/05/2011 AUD 792,496 (28,610) 11/03/2011 USD 17,783 06/05/2011 CHF 16,613 (366)
11/03/2011 USD 533,696 06/05/2011 GBP 333,854 (3,441) 11/03/2011 USD 472,565 06/05/2011 NOK 2,691,473 (13,482)
14/03/2011 USD 175,328 05/05/2011 CAD 170,623 (458) 14/03/2011 AUD 902,104 06/05/2011 USD 903,132 25,470
14/03/2011 EUR 107,784 06/05/2011 USD 150,447 2,609 14/03/2011 GBP 52,384 06/05/2011 USD 84,338 (58)
14/03/2011 NOK 2,543,862 06/05/2011 USD 452,676 6,689 14/03/2011 NZD 332,471 06/05/2011 USD 244,538 8,406 14/03/2011 USD 91,379 06/05/2011 CHF 84,682 (1,133) 14/03/2011 USD 446,264 06/05/2011 JPY 36,500,014 5,868 14/03/2011 USD 333,951 06/05/2011 SEK 2,119,941 (2,847) 15/03/2011 USD 413,328 05/05/2011 CAD 410,157 (9,250) 15/03/2011 CHF 293,611 06/05/2011 USD 318,933 1,826 15/03/2011 JPY 76,364,639 06/05/2011 USD 939,417 (18,032) 15/03/2011 NZD 345,115 06/05/2011 USD 250,743 11,821

Notes to the Financial Statements (continued)
130
9. Forward foreign exchange contracts (continued)
Sub-funds Contract Date In exchange for Settlement Contract to
deliver
Unrealised
Gain / (Loss)
by Sub-Fund
Global Currency (continued)
15/03/2011 USD 2,687,227 06/05/2011 AUD 2,736,726 (130,465)
15/03/2011 USD 318,456 06/05/2011 EUR 229,610 (7,603) 15/03/2011 USD 298,726 06/05/2011 GBP 186,714 (1,678)
15/03/2011 USD 131,823 06/05/2011 NOK 751,983 (3,976) 15/03/2011 USD 424,685 06/05/2011 SEK 2,744,752 (11,391)
16/03/2011 CAD 571,469 05/05/2011 USD 581,368 7,397 16/03/2011 CHF 38,554 06/05/2011 USD 42,085 34
16/03/2011 EUR 184,233 06/05/2011 USD 256,655 4,962 16/03/2011 GBP 115,126 06/05/2011 USD 184,953 273
16/03/2011 JPY 20,643,706 06/05/2011 USD 256,023 (6,944) 16/03/2011 NZD 284,712 06/05/2011 USD 208,275 8,334
16/03/2011 USD 307,410 06/05/2011 AUD 311,728 (13,535) 16/03/2011 USD 235,569 06/05/2011 NOK 1,338,846 (6,209)
16/03/2011 USD 55,433 06/05/2011 SEK 357,645 (1,388) 17/03/2011 CAD 236,188 05/05/2011 USD 239,045 4,291
17/03/2011 CHF 197,351 06/05/2011 USD 219,002 (3,402) 17/03/2011 GBP 14,533 06/05/2011 USD 23,438 (56)
17/03/2011 JPY 68,187,879 06/05/2011 USD 869,002 (46,274) 17/03/2011 NOK 1,836,878 06/05/2011 USD 325,705 5,995
17/03/2011 SEK 327,178 06/05/2011 USD 50,840 1,139 17/03/2011 USD 880,131 06/05/2011 AUD 900,563 (47,094)
17/03/2011 USD 410,063 06/05/2011 EUR 292,621 (5,472) 17/03/2011 USD 276,415 06/05/2011 NZD 384,737 (16,331)
18/03/2011 USD 163,456 05/05/2011 CAD 160,682 (2,091) 18/03/2011 AUD 644,688 06/05/2011 USD 635,510 28,115
18/03/2011 GBP 91,201 06/05/2011 USD 147,293 (560) 18/03/2011 JPY 30,940,410 06/05/2011 USD 380,319 (7,005) 18/03/2011 NOK 1,941,972 06/05/2011 USD 346,431 4,246 18/03/2011 SEK 561,785 06/05/2011 USD 88,545 705 18/03/2011 USD 350,556 06/05/2011 CHF 315,531 5,849 18/03/2011 USD 92,250 06/05/2011 NZD 127,263 (4,582) 21/03/2011 USD 213,613 05/05/2011 CAD 208,771 (1,477) 21/03/2011 AUD 940,866 06/05/2011 USD 940,527 27,977 21/03/2011 EUR 437,470 06/05/2011 USD 619,454 1,768

Notes to the Financial Statements (continued)
131
9. Forward foreign exchange contracts (continued)
Sub-funds Contract Date In exchange for Settlement Contract to
deliver
Unrealised
Gain / (Loss)
by Sub-Fund
Global Currency (continued)
21/03/2011 NOK 2,924,111 06/05/2011 USD 523,867 4,163
21/03/2011 USD 18,196 06/05/2011 CHF 16,455 220 21/03/2011 USD 185,999 06/05/2011 GBP 114,409 1,928
21/03/2011 USD 203,406 06/05/2011 JPY 16,518,165 4,104 21/03/2011 USD 134,475 06/05/2011 NZD 183,577 (5,203)
21/03/2011 USD 660,204 06/05/2011 SEK 4,154,672 156 22/03/2011 CAD 100,811 05/05/2011 USD 103,247 614
22/03/2011 AUD 298,849 06/05/2011 USD 300,720 6,908 22/03/2011 CHF 49,776 06/05/2011 USD 55,140 (761)
22/03/2011 EUR 12,618 06/05/2011 USD 17,946 (28) 22/03/2011 GBP 151,143 06/05/2011 USD 247,453 (4,280)
22/03/2011 NOK 284,610 06/05/2011 USD 51,087 307 22/03/2011 SEK 1,024,138 06/05/2011 USD 163,024 (320)
22/03/2011 USD 33,606 06/05/2011 JPY 2,720,719 779 22/03/2011 USD 66,840 06/05/2011 NZD 90,099 (1,711)
23/03/2011 USD 405,718 05/05/2011 CAD 398,494 (4,840) 23/03/2011 AUD 293,172 06/05/2011 USD 294,489 7,295
23/03/2011 JPY 1,742,797 06/05/2011 USD 21,527 (499) 23/03/2011 NOK 463,323 06/05/2011 USD 82,773 893
23/03/2011 USD 158,974 06/05/2011 CHF 143,206 2,526 23/03/2011 USD 173,424 06/05/2011 EUR 122,650 (744)
23/03/2011 USD 144,429 06/05/2011 NZD 196,038 (4,728) 23/03/2011 USD 33,996 06/05/2011 SEK 215,202 (193)
23/03/2011 USD 12,450,327 12/05/2011 CAD 12,241,323 (159,871) 23/03/2011 AUD 8,398,886 13/05/2011 USD 8,435,942 202,321
23/03/2011 CHF 6,621,422 13/05/2011 USD 7,318,289 (84,134) 23/03/2011 EUR 6,346,426 13/05/2011 USD 8,981,576 29,340 23/03/2011 GBP 1,752,911 13/05/2011 USD 2,852,560 (32,539) 23/03/2011 JPY 3,029,893,074 13/05/2011 USD 37,455,381 (895,994) 23/03/2011 SEK 116,524,310 13/05/2011 USD 18,354,741 150,368 23/03/2011 USD 2,989,116 13/05/2011 EUR 2,117,514 (17,432) 23/03/2011 USD 364,125 13/05/2011 GBP 224,173 3,486 23/03/2011 USD 4,774,041 13/05/2011 JPY 386,155,450 114,574 23/03/2011 USD 3,915,409 13/05/2011 NOK 21,948,648 (46,605)
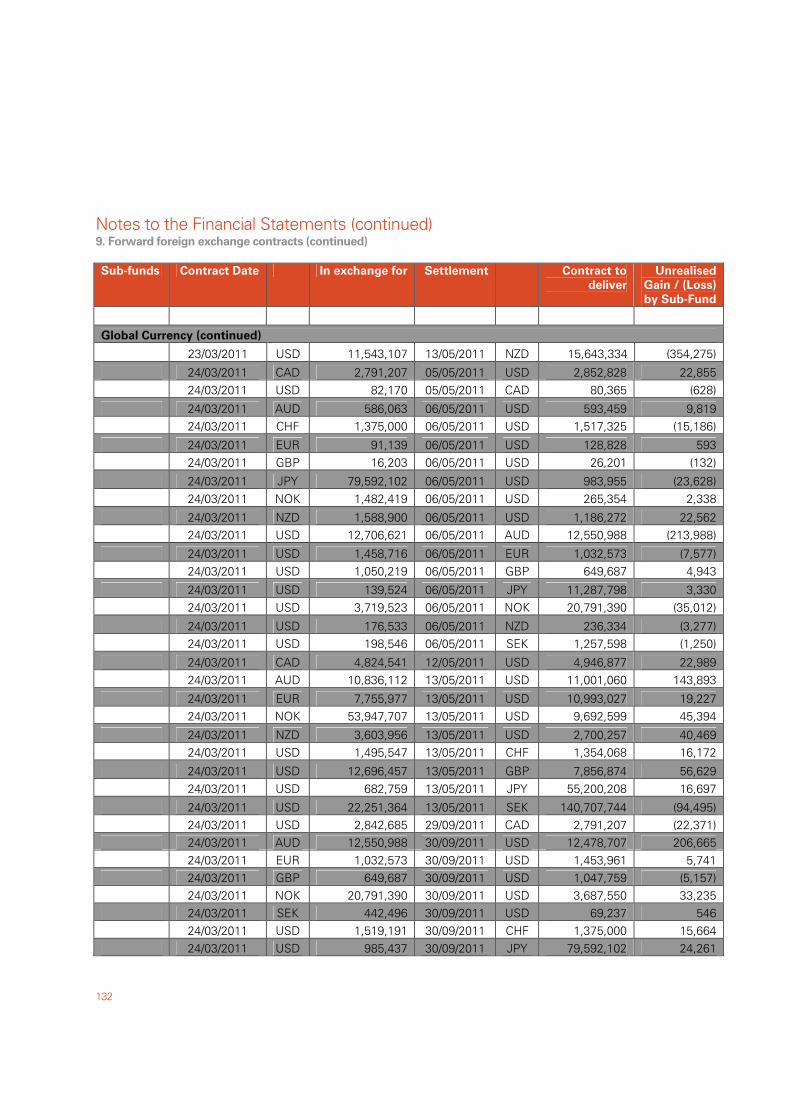
Notes to the Financial Statements (continued)
132
9. Forward foreign exchange contracts (continued)
Sub-funds Contract Date In exchange for Settlement Contract to
deliver
Unrealised
Gain / (Loss)
by Sub-Fund
Global Currency (continued)
23/03/2011 USD 11,543,107 13/05/2011 NZD 15,643,334 (354,275)
24/03/2011 CAD 2,791,207 05/05/2011 USD 2,852,828 22,855 24/03/2011 USD 82,170 05/05/2011 CAD 80,365 (628)
24/03/2011 AUD 586,063 06/05/2011 USD 593,459 9,819 24/03/2011 CHF 1,375,000 06/05/2011 USD 1,517,325 (15,186)
24/03/2011 EUR 91,139 06/05/2011 USD 128,828 593 24/03/2011 GBP 16,203 06/05/2011 USD 26,201 (132)
24/03/2011 JPY 79,592,102 06/05/2011 USD 983,955 (23,628) 24/03/2011 NOK 1,482,419 06/05/2011 USD 265,354 2,338
24/03/2011 NZD 1,588,900 06/05/2011 USD 1,186,272 22,562 24/03/2011 USD 12,706,621 06/05/2011 AUD 12,550,988 (213,988)
24/03/2011 USD 1,458,716 06/05/2011 EUR 1,032,573 (7,577) 24/03/2011 USD 1,050,219 06/05/2011 GBP 649,687 4,943
24/03/2011 USD 139,524 06/05/2011 JPY 11,287,798 3,330 24/03/2011 USD 3,719,523 06/05/2011 NOK 20,791,390 (35,012)
24/03/2011 USD 176,533 06/05/2011 NZD 236,334 (3,277) 24/03/2011 USD 198,546 06/05/2011 SEK 1,257,598 (1,250)
24/03/2011 CAD 4,824,541 12/05/2011 USD 4,946,877 22,989 24/03/2011 AUD 10,836,112 13/05/2011 USD 11,001,060 143,893
24/03/2011 EUR 7,755,977 13/05/2011 USD 10,993,027 19,227 24/03/2011 NOK 53,947,707 13/05/2011 USD 9,692,599 45,394
24/03/2011 NZD 3,603,956 13/05/2011 USD 2,700,257 40,469 24/03/2011 USD 1,495,547 13/05/2011 CHF 1,354,068 16,172
24/03/2011 USD 12,696,457 13/05/2011 GBP 7,856,874 56,629 24/03/2011 USD 682,759 13/05/2011 JPY 55,200,208 16,697
24/03/2011 USD 22,251,364 13/05/2011 SEK 140,707,744 (94,495) 24/03/2011 USD 2,842,685 29/09/2011 CAD 2,791,207 (22,371) 24/03/2011 AUD 12,550,988 30/09/2011 USD 12,478,707 206,665 24/03/2011 EUR 1,032,573 30/09/2011 USD 1,453,961 5,741 24/03/2011 GBP 649,687 30/09/2011 USD 1,047,759 (5,157) 24/03/2011 NOK 20,791,390 30/09/2011 USD 3,687,550 33,235 24/03/2011 SEK 442,496 30/09/2011 USD 69,237 546 24/03/2011 USD 1,519,191 30/09/2011 CHF 1,375,000 15,664 24/03/2011 USD 985,437 30/09/2011 JPY 79,592,102 24,261
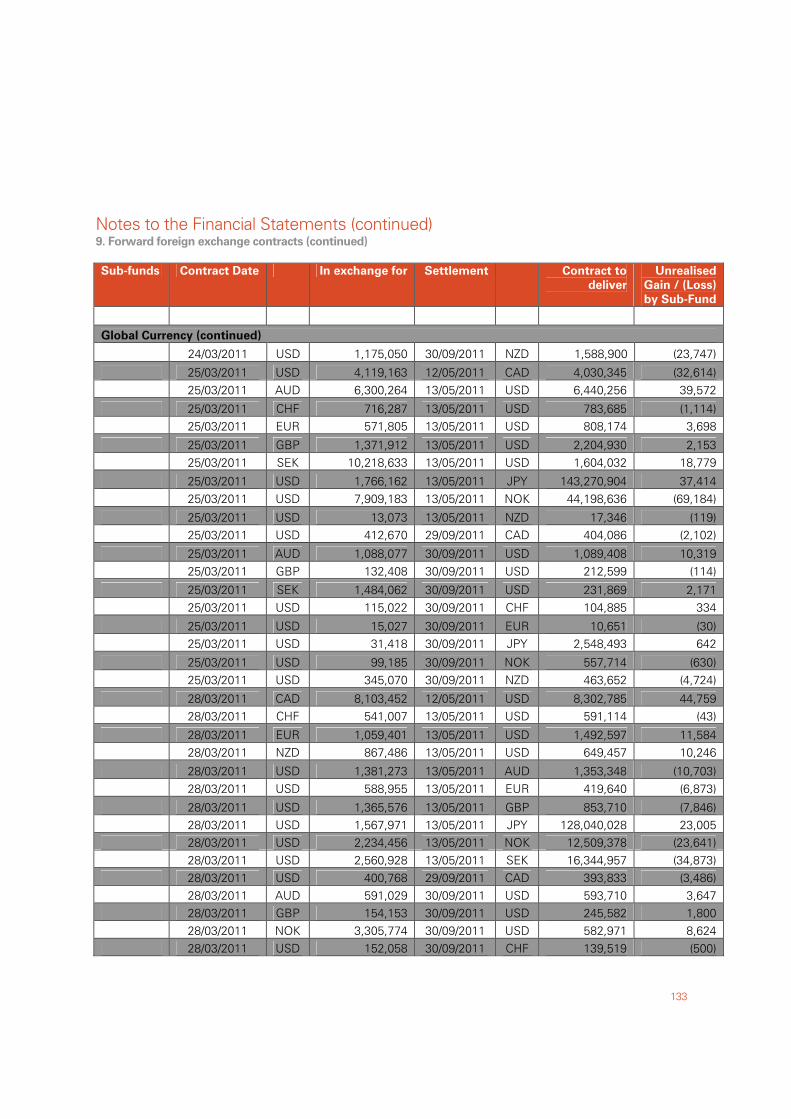
Notes to the Financial Statements (continued)
133
9. Forward foreign exchange contracts (continued)
Sub-funds Contract Date In exchange for Settlement Contract to
deliver
Unrealised
Gain / (Loss)
by Sub-Fund
Global Currency (continued)
24/03/2011 USD 1,175,050 30/09/2011 NZD 1,588,900 (23,747)
25/03/2011 USD 4,119,163 12/05/2011 CAD 4,030,345 (32,614) 25/03/2011 AUD 6,300,264 13/05/2011 USD 6,440,256 39,572
25/03/2011 CHF 716,287 13/05/2011 USD 783,685 (1,114) 25/03/2011 EUR 571,805 13/05/2011 USD 808,174 3,698
25/03/2011 GBP 1,371,912 13/05/2011 USD 2,204,930 2,153 25/03/2011 SEK 10,218,633 13/05/2011 USD 1,604,032 18,779
25/03/2011 USD 1,766,162 13/05/2011 JPY 143,270,904 37,414 25/03/2011 USD 7,909,183 13/05/2011 NOK 44,198,636 (69,184)
25/03/2011 USD 13,073 13/05/2011 NZD 17,346 (119) 25/03/2011 USD 412,670 29/09/2011 CAD 404,086 (2,102)
25/03/2011 AUD 1,088,077 30/09/2011 USD 1,089,408 10,319 25/03/2011 GBP 132,408 30/09/2011 USD 212,599 (114)
25/03/2011 SEK 1,484,062 30/09/2011 USD 231,869 2,171 25/03/2011 USD 115,022 30/09/2011 CHF 104,885 334
25/03/2011 USD 15,027 30/09/2011 EUR 10,651 (30) 25/03/2011 USD 31,418 30/09/2011 JPY 2,548,493 642
25/03/2011 USD 99,185 30/09/2011 NOK 557,714 (630) 25/03/2011 USD 345,070 30/09/2011 NZD 463,652 (4,724)
28/03/2011 CAD 8,103,452 12/05/2011 USD 8,302,785 44,759 28/03/2011 CHF 541,007 13/05/2011 USD 591,114 (43)
28/03/2011 EUR 1,059,401 13/05/2011 USD 1,492,597 11,584 28/03/2011 NZD 867,486 13/05/2011 USD 649,457 10,246
28/03/2011 USD 1,381,273 13/05/2011 AUD 1,353,348 (10,703) 28/03/2011 USD 588,955 13/05/2011 EUR 419,640 (6,873)
28/03/2011 USD 1,365,576 13/05/2011 GBP 853,710 (7,846) 28/03/2011 USD 1,567,971 13/05/2011 JPY 128,040,028 23,005 28/03/2011 USD 2,234,456 13/05/2011 NOK 12,509,378 (23,641) 28/03/2011 USD 2,560,928 13/05/2011 SEK 16,344,957 (34,873) 28/03/2011 USD 400,768 29/09/2011 CAD 393,833 (3,486) 28/03/2011 AUD 591,029 30/09/2011 USD 593,710 3,647 28/03/2011 GBP 154,153 30/09/2011 USD 245,582 1,800 28/03/2011 NOK 3,305,774 30/09/2011 USD 582,971 8,624 28/03/2011 USD 152,058 30/09/2011 CHF 139,519 (500)
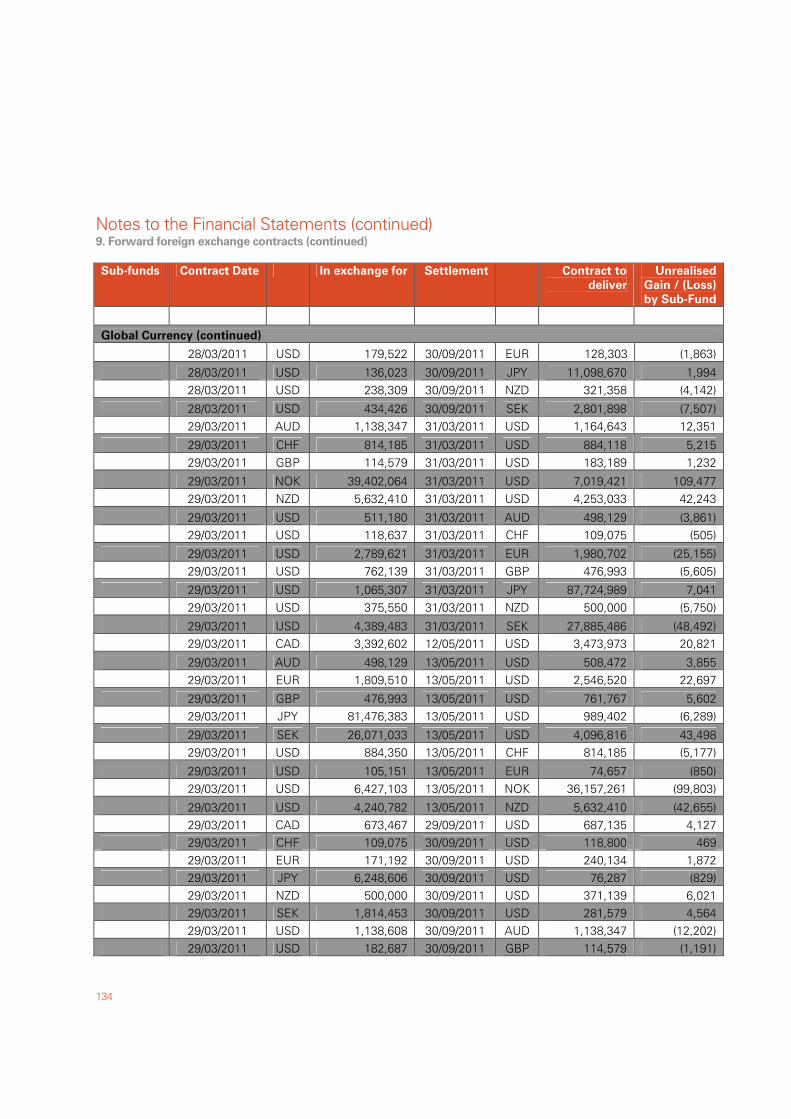
Notes to the Financial Statements (continued)
134
9. Forward foreign exchange contracts (continued)
Sub-funds Contract Date In exchange for Settlement Contract to
deliver
Unrealised
Gain / (Loss)
by Sub-Fund
Global Currency (continued)
28/03/2011 USD 179,522 30/09/2011 EUR 128,303 (1,863)
28/03/2011 USD 136,023 30/09/2011 JPY 11,098,670 1,994 28/03/2011 USD 238,309 30/09/2011 NZD 321,358 (4,142)
28/03/2011 USD 434,426 30/09/2011 SEK 2,801,898 (7,507) 29/03/2011 AUD 1,138,347 31/03/2011 USD 1,164,643 12,351
29/03/2011 CHF 814,185 31/03/2011 USD 884,118 5,215 29/03/2011 GBP 114,579 31/03/2011 USD 183,189 1,232
29/03/2011 NOK 39,402,064 31/03/2011 USD 7,019,421 109,477 29/03/2011 NZD 5,632,410 31/03/2011 USD 4,253,033 42,243
29/03/2011 USD 511,180 31/03/2011 AUD 498,129 (3,861) 29/03/2011 USD 118,637 31/03/2011 CHF 109,075 (505)
29/03/2011 USD 2,789,621 31/03/2011 EUR 1,980,702 (25,155) 29/03/2011 USD 762,139 31/03/2011 GBP 476,993 (5,605)
29/03/2011 USD 1,065,307 31/03/2011 JPY 87,724,989 7,041 29/03/2011 USD 375,550 31/03/2011 NZD 500,000 (5,750)
29/03/2011 USD 4,389,483 31/03/2011 SEK 27,885,486 (48,492) 29/03/2011 CAD 3,392,602 12/05/2011 USD 3,473,973 20,821
29/03/2011 AUD 498,129 13/05/2011 USD 508,472 3,855 29/03/2011 EUR 1,809,510 13/05/2011 USD 2,546,520 22,697
29/03/2011 GBP 476,993 13/05/2011 USD 761,767 5,602 29/03/2011 JPY 81,476,383 13/05/2011 USD 989,402 (6,289)
29/03/2011 SEK 26,071,033 13/05/2011 USD 4,096,816 43,498 29/03/2011 USD 884,350 13/05/2011 CHF 814,185 (5,177)
29/03/2011 USD 105,151 13/05/2011 EUR 74,657 (850) 29/03/2011 USD 6,427,103 13/05/2011 NOK 36,157,261 (99,803)
29/03/2011 USD 4,240,782 13/05/2011 NZD 5,632,410 (42,655) 29/03/2011 CAD 673,467 29/09/2011 USD 687,135 4,127 29/03/2011 CHF 109,075 30/09/2011 USD 118,800 469 29/03/2011 EUR 171,192 30/09/2011 USD 240,134 1,872 29/03/2011 JPY 6,248,606 30/09/2011 USD 76,287 (829) 29/03/2011 NZD 500,000 30/09/2011 USD 371,139 6,021 29/03/2011 SEK 1,814,453 30/09/2011 USD 281,579 4,564 29/03/2011 USD 1,138,608 30/09/2011 AUD 1,138,347 (12,202) 29/03/2011 USD 182,687 30/09/2011 GBP 114,579 (1,191)
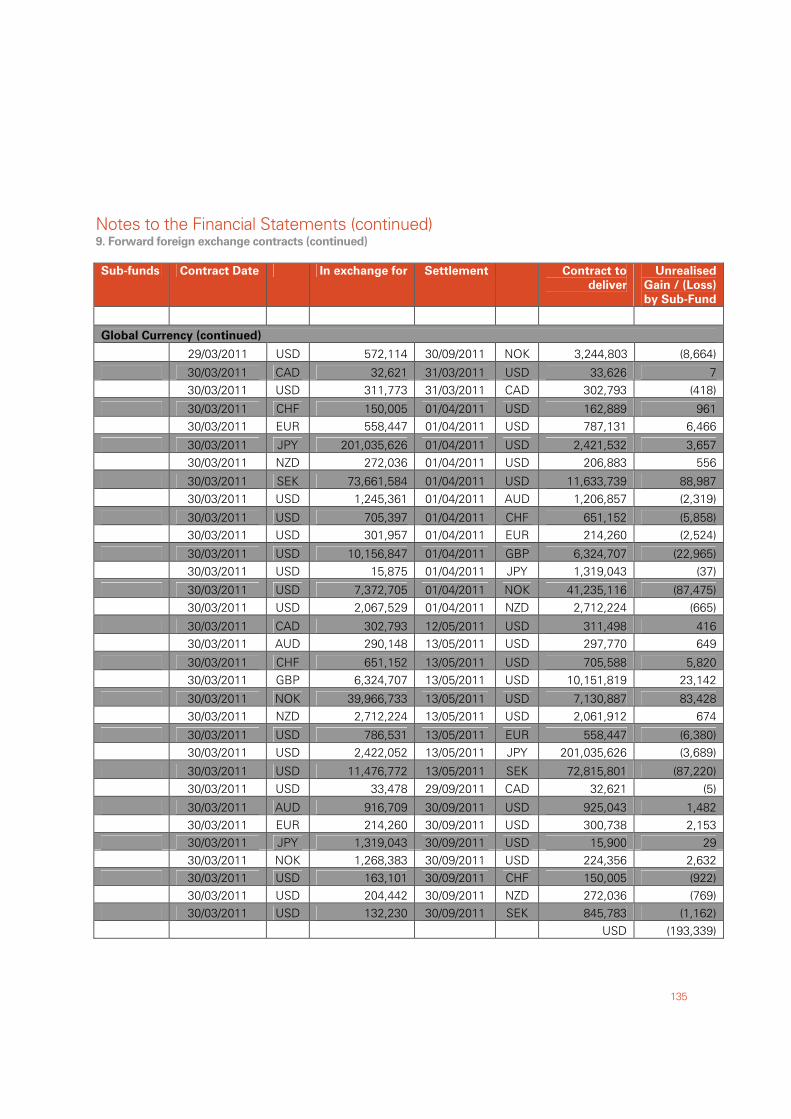
Notes to the Financial Statements (continued)
135
9. Forward foreign exchange contracts (continued)
Sub-funds Contract Date In exchange for Settlement Contract to
deliver
Unrealised
Gain / (Loss)
by Sub-Fund
Global Currency (continued)
29/03/2011 USD 572,114 30/09/2011 NOK 3,244,803 (8,664)
30/03/2011 CAD 32,621 31/03/2011 USD 33,626 7 30/03/2011 USD 311,773 31/03/2011 CAD 302,793 (418)
30/03/2011 CHF 150,005 01/04/2011 USD 162,889 961 30/03/2011 EUR 558,447 01/04/2011 USD 787,131 6,466
30/03/2011 JPY 201,035,626 01/04/2011 USD 2,421,532 3,657 30/03/2011 NZD 272,036 01/04/2011 USD 206,883 556
30/03/2011 SEK 73,661,584 01/04/2011 USD 11,633,739 88,987 30/03/2011 USD 1,245,361 01/04/2011 AUD 1,206,857 (2,319)
30/03/2011 USD 705,397 01/04/2011 CHF 651,152 (5,858) 30/03/2011 USD 301,957 01/04/2011 EUR 214,260 (2,524)
30/03/2011 USD 10,156,847 01/04/2011 GBP 6,324,707 (22,965) 30/03/2011 USD 15,875 01/04/2011 JPY 1,319,043 (37)
30/03/2011 USD 7,372,705 01/04/2011 NOK 41,235,116 (87,475) 30/03/2011 USD 2,067,529 01/04/2011 NZD 2,712,224 (665)
30/03/2011 CAD 302,793 12/05/2011 USD 311,498 416 30/03/2011 AUD 290,148 13/05/2011 USD 297,770 649
30/03/2011 CHF 651,152 13/05/2011 USD 705,588 5,820 30/03/2011 GBP 6,324,707 13/05/2011 USD 10,151,819 23,142
30/03/2011 NOK 39,966,733 13/05/2011 USD 7,130,887 83,428 30/03/2011 NZD 2,712,224 13/05/2011 USD 2,061,912 674
30/03/2011 USD 786,531 13/05/2011 EUR 558,447 (6,380) 30/03/2011 USD 2,422,052 13/05/2011 JPY 201,035,626 (3,689)
30/03/2011 USD 11,476,772 13/05/2011 SEK 72,815,801 (87,220) 30/03/2011 USD 33,478 29/09/2011 CAD 32,621 (5)
30/03/2011 AUD 916,709 30/09/2011 USD 925,043 1,482 30/03/2011 EUR 214,260 30/09/2011 USD 300,738 2,153 30/03/2011 JPY 1,319,043 30/09/2011 USD 15,900 29 30/03/2011 NOK 1,268,383 30/09/2011 USD 224,356 2,632 30/03/2011 USD 163,101 30/09/2011 CHF 150,005 (922) 30/03/2011 USD 204,442 30/09/2011 NZD 272,036 (769) 30/03/2011 USD 132,230 30/09/2011 SEK 845,783 (1,162) USD (193,339)
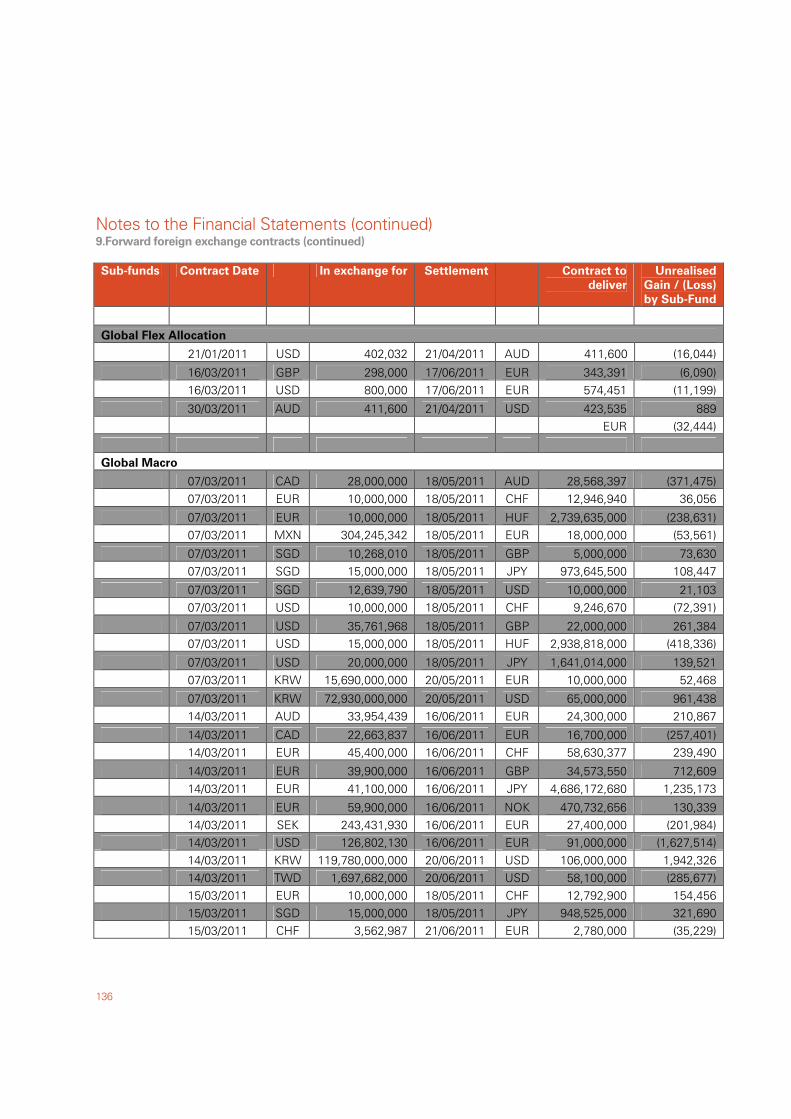
Notes to the Financial Statements (continued)
136
9.Forward foreign exchange contracts (continued)
Sub-funds Contract Date In exchange for Settlement Contract to
deliver
Unrealised
Gain / (Loss)
by Sub-Fund
Global Flex Allocation
21/01/2011 USD 402,032 21/04/2011 AUD 411,600 (16,044)
16/03/2011 GBP 298,000 17/06/2011 EUR 343,391 (6,090) 16/03/2011 USD 800,000 17/06/2011 EUR 574,451 (11,199)
30/03/2011 AUD 411,600 21/04/2011 USD 423,535 889 EUR (32,444)
Global Macro
07/03/2011 CAD 28,000,000 18/05/2011 AUD 28,568,397 (371,475) 07/03/2011 EUR 10,000,000 18/05/2011 CHF 12,946,940 36,056
07/03/2011 EUR 10,000,000 18/05/2011 HUF 2,739,635,000 (238,631) 07/03/2011 MXN 304,245,342 18/05/2011 EUR 18,000,000 (53,561)
07/03/2011 SGD 10,268,010 18/05/2011 GBP 5,000,000 73,630 07/03/2011 SGD 15,000,000 18/05/2011 JPY 973,645,500 108,447
07/03/2011 SGD 12,639,790 18/05/2011 USD 10,000,000 21,103 07/03/2011 USD 10,000,000 18/05/2011 CHF 9,246,670 (72,391)
07/03/2011 USD 35,761,968 18/05/2011 GBP 22,000,000 261,384 07/03/2011 USD 15,000,000 18/05/2011 HUF 2,938,818,000 (418,336)
07/03/2011 USD 20,000,000 18/05/2011 JPY 1,641,014,000 139,521 07/03/2011 KRW 15,690,000,000 20/05/2011 EUR 10,000,000 52,468
07/03/2011 KRW 72,930,000,000 20/05/2011 USD 65,000,000 961,438 14/03/2011 AUD 33,954,439 16/06/2011 EUR 24,300,000 210,867
14/03/2011 CAD 22,663,837 16/06/2011 EUR 16,700,000 (257,401) 14/03/2011 EUR 45,400,000 16/06/2011 CHF 58,630,377 239,490
14/03/2011 EUR 39,900,000 16/06/2011 GBP 34,573,550 712,609 14/03/2011 EUR 41,100,000 16/06/2011 JPY 4,686,172,680 1,235,173
14/03/2011 EUR 59,900,000 16/06/2011 NOK 470,732,656 130,339 14/03/2011 SEK 243,431,930 16/06/2011 EUR 27,400,000 (201,984) 14/03/2011 USD 126,802,130 16/06/2011 EUR 91,000,000 (1,627,514) 14/03/2011 KRW 119,780,000,000 20/06/2011 USD 106,000,000 1,942,326 14/03/2011 TWD 1,697,682,000 20/06/2011 USD 58,100,000 (285,677) 15/03/2011 EUR 10,000,000 18/05/2011 CHF 12,792,900 154,456 15/03/2011 SGD 15,000,000 18/05/2011 JPY 948,525,000 321,690 15/03/2011 CHF 3,562,987 21/06/2011 EUR 2,780,000 (35,229)
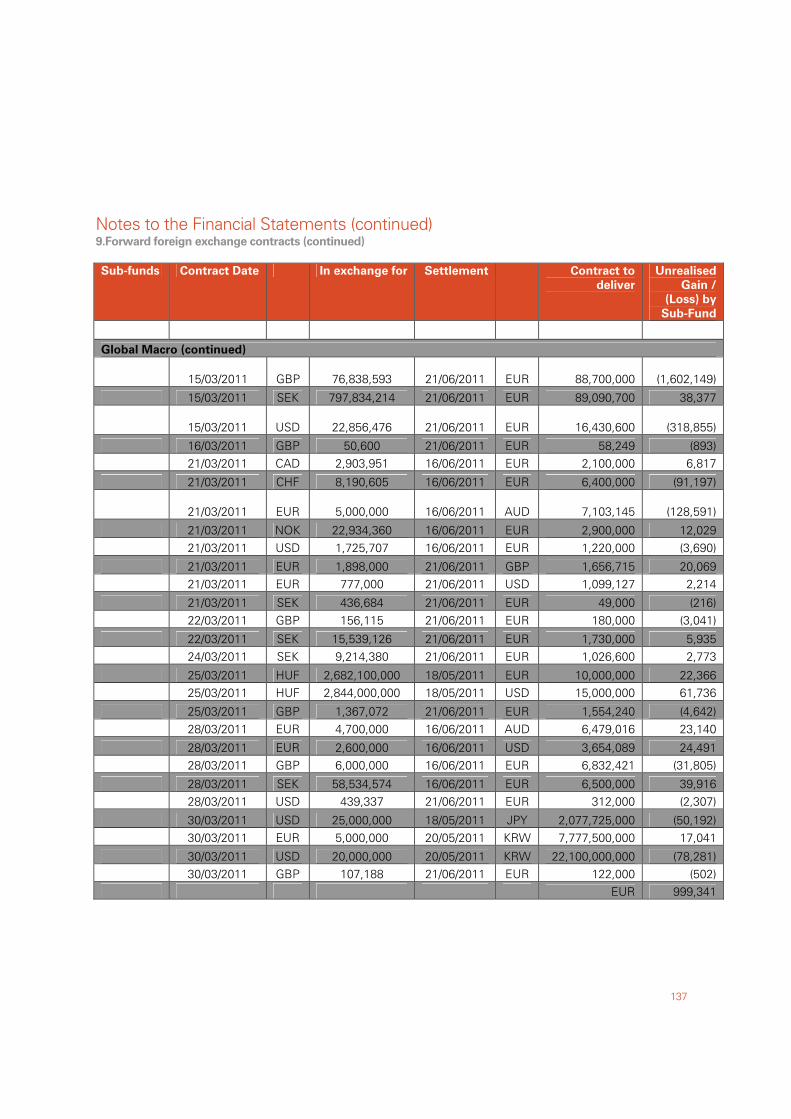
Notes to the Financial Statements (continued)
137
9.Forward foreign exchange contracts (continued)
Sub-funds Contract Date In exchange for Settlement Contract to
deliver
Unrealised
Gain /
(Loss) by
Sub-Fund
Global Macro (continued)
15/03/2011 GBP 76,838,593 21/06/2011 EUR 88,700,000
(1,602,149)
15/03/2011 SEK 797,834,214 21/06/2011 EUR 89,090,700 38,377
15/03/2011 USD 22,856,476 21/06/2011 EUR 16,430,600
(318,855)
16/03/2011 GBP 50,600 21/06/2011 EUR 58,249 (893) 21/03/2011 CAD 2,903,951 16/06/2011 EUR 2,100,000 6,817
21/03/2011 CHF 8,190,605 16/06/2011 EUR 6,400,000 (91,197)
21/03/2011 EUR 5,000,000 16/06/2011 AUD 7,103,145
(128,591)
21/03/2011 NOK 22,934,360 16/06/2011 EUR 2,900,000 12,029 21/03/2011 USD 1,725,707 16/06/2011 EUR 1,220,000 (3,690)
21/03/2011 EUR 1,898,000 21/06/2011 GBP 1,656,715 20,069 21/03/2011 EUR 777,000 21/06/2011 USD 1,099,127 2,214
21/03/2011 SEK 436,684 21/06/2011 EUR 49,000 (216) 22/03/2011 GBP 156,115 21/06/2011 EUR 180,000 (3,041)
22/03/2011 SEK 15,539,126 21/06/2011 EUR 1,730,000 5,935 24/03/2011 SEK 9,214,380 21/06/2011 EUR 1,026,600 2,773
25/03/2011 HUF 2,682,100,000 18/05/2011 EUR 10,000,000 22,366 25/03/2011 HUF 2,844,000,000 18/05/2011 USD 15,000,000 61,736
25/03/2011 GBP 1,367,072 21/06/2011 EUR 1,554,240 (4,642) 28/03/2011 EUR 4,700,000 16/06/2011 AUD 6,479,016 23,140
28/03/2011 EUR 2,600,000 16/06/2011 USD 3,654,089 24,491 28/03/2011 GBP 6,000,000 16/06/2011 EUR 6,832,421 (31,805)
28/03/2011 SEK 58,534,574 16/06/2011 EUR 6,500,000 39,916 28/03/2011 USD 439,337 21/06/2011 EUR 312,000 (2,307)
30/03/2011 USD 25,000,000 18/05/2011 JPY 2,077,725,000 (50,192) 30/03/2011 EUR 5,000,000 20/05/2011 KRW 7,777,500,000 17,041
30/03/2011 USD 20,000,000 20/05/2011 KRW 22,100,000,000 (78,281) 30/03/2011 GBP 107,188 21/06/2011 EUR 122,000 (502)
EUR 999,341
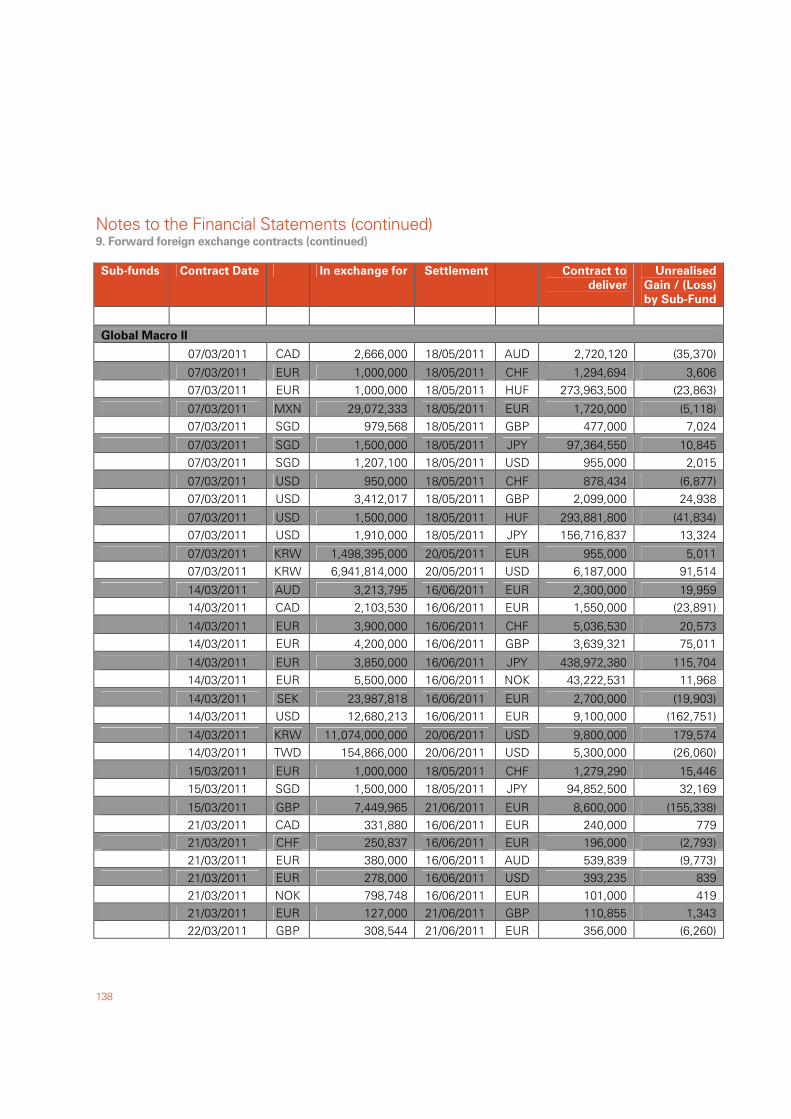
Notes to the Financial Statements (continued)
138
9. Forward foreign exchange contracts (continued)
Sub-funds Contract Date In exchange for Settlement Contract to
deliver
Unrealised
Gain / (Loss)
by Sub-Fund
Global Macro II
07/03/2011 CAD 2,666,000 18/05/2011 AUD 2,720,120 (35,370)
07/03/2011 EUR 1,000,000 18/05/2011 CHF 1,294,694 3,606 07/03/2011 EUR 1,000,000 18/05/2011 HUF 273,963,500 (23,863)
07/03/2011 MXN 29,072,333 18/05/2011 EUR 1,720,000 (5,118) 07/03/2011 SGD 979,568 18/05/2011 GBP 477,000 7,024
07/03/2011 SGD 1,500,000 18/05/2011 JPY 97,364,550 10,845 07/03/2011 SGD 1,207,100 18/05/2011 USD 955,000 2,015
07/03/2011 USD 950,000 18/05/2011 CHF 878,434 (6,877) 07/03/2011 USD 3,412,017 18/05/2011 GBP 2,099,000 24,938
07/03/2011 USD 1,500,000 18/05/2011 HUF 293,881,800 (41,834) 07/03/2011 USD 1,910,000 18/05/2011 JPY 156,716,837 13,324
07/03/2011 KRW 1,498,395,000 20/05/2011 EUR 955,000 5,011 07/03/2011 KRW 6,941,814,000 20/05/2011 USD 6,187,000 91,514
14/03/2011 AUD 3,213,795 16/06/2011 EUR 2,300,000 19,959 14/03/2011 CAD 2,103,530 16/06/2011 EUR 1,550,000 (23,891)
14/03/2011 EUR 3,900,000 16/06/2011 CHF 5,036,530 20,573 14/03/2011 EUR 4,200,000 16/06/2011 GBP 3,639,321 75,011
14/03/2011 EUR 3,850,000 16/06/2011 JPY 438,972,380 115,704 14/03/2011 EUR 5,500,000 16/06/2011 NOK 43,222,531 11,968
14/03/2011 SEK 23,987,818 16/06/2011 EUR 2,700,000 (19,903) 14/03/2011 USD 12,680,213 16/06/2011 EUR 9,100,000 (162,751)
14/03/2011 KRW 11,074,000,000 20/06/2011 USD 9,800,000 179,574 14/03/2011 TWD 154,866,000 20/06/2011 USD 5,300,000 (26,060)
15/03/2011 EUR 1,000,000 18/05/2011 CHF 1,279,290 15,446 15/03/2011 SGD 1,500,000 18/05/2011 JPY 94,852,500 32,169
15/03/2011 GBP 7,449,965 21/06/2011 EUR 8,600,000 (155,338) 21/03/2011 CAD 331,880 16/06/2011 EUR 240,000 779 21/03/2011 CHF 250,837 16/06/2011 EUR 196,000 (2,793) 21/03/2011 EUR 380,000 16/06/2011 AUD 539,839 (9,773) 21/03/2011 EUR 278,000 16/06/2011 USD 393,235 839 21/03/2011 NOK 798,748 16/06/2011 EUR 101,000 419 21/03/2011 EUR 127,000 21/06/2011 GBP 110,855 1,343 22/03/2011 GBP 308,544 21/06/2011 EUR 356,000 (6,260)
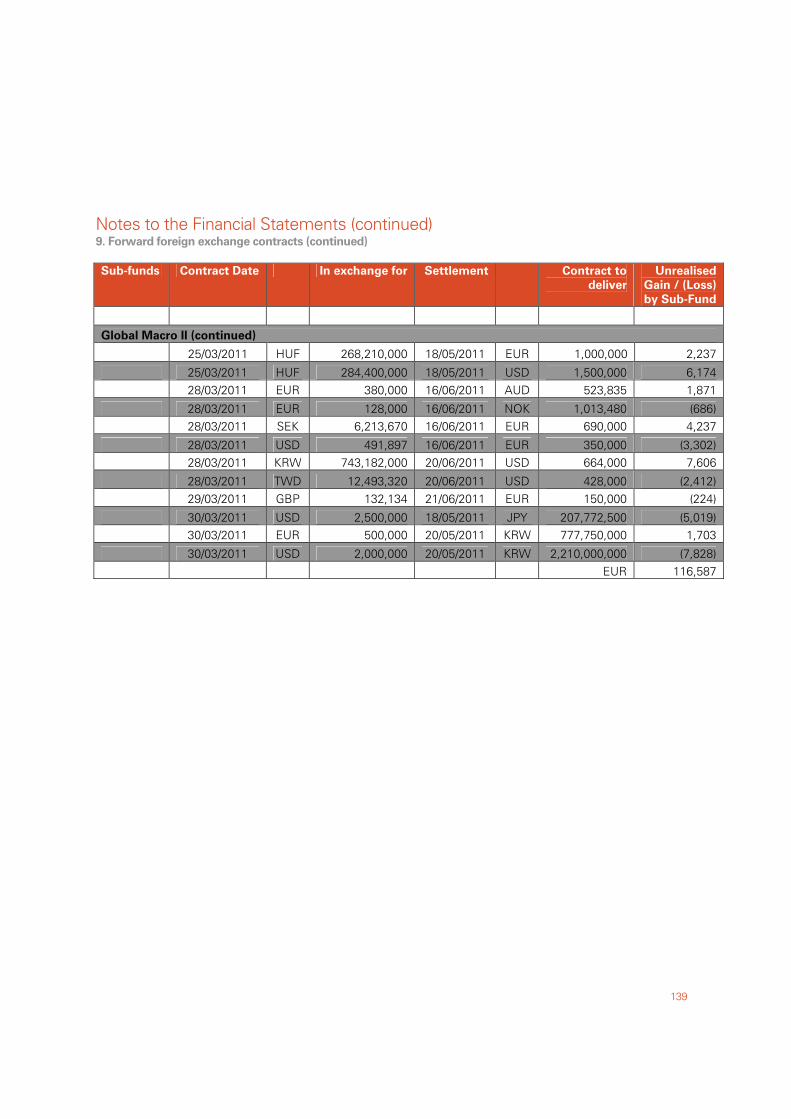
Notes to the Financial Statements (continued)
139
9. Forward foreign exchange contracts (continued)
Sub-funds Contract Date In exchange for Settlement Contract to
deliver
Unrealised
Gain / (Loss)
by Sub-Fund
Global Macro II (continued)
25/03/2011 HUF 268,210,000 18/05/2011 EUR 1,000,000 2,237
25/03/2011 HUF 284,400,000 18/05/2011 USD 1,500,000 6,174 28/03/2011 EUR 380,000 16/06/2011 AUD 523,835 1,871
28/03/2011 EUR 128,000 16/06/2011 NOK 1,013,480 (686) 28/03/2011 SEK 6,213,670 16/06/2011 EUR 690,000 4,237
28/03/2011 USD 491,897 16/06/2011 EUR 350,000 (3,302) 28/03/2011 KRW 743,182,000 20/06/2011 USD 664,000 7,606
28/03/2011 TWD 12,493,320 20/06/2011 USD 428,000 (2,412) 29/03/2011 GBP 132,134 21/06/2011 EUR 150,000 (224)
30/03/2011 USD 2,500,000 18/05/2011 JPY 207,772,500 (5,019) 30/03/2011 EUR 500,000 20/05/2011 KRW 777,750,000 1,703
30/03/2011 USD 2,000,000 20/05/2011 KRW 2,210,000,000 (7,828) EUR 116,587
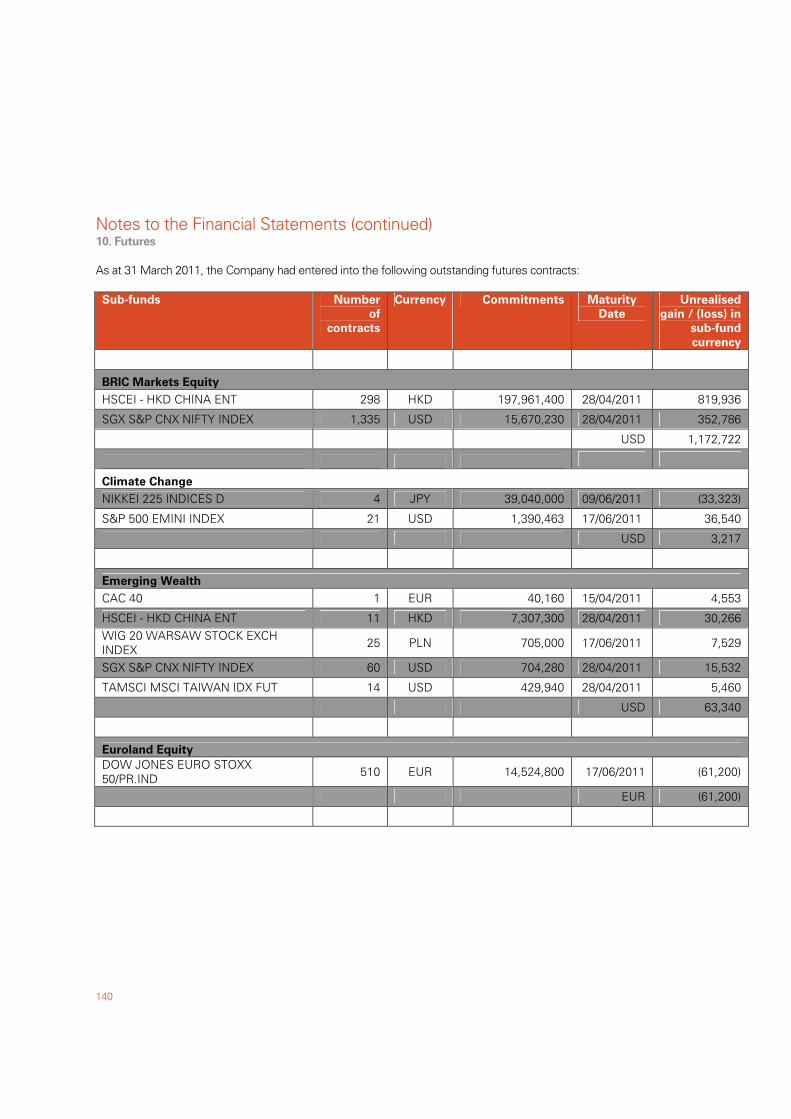
Notes to the Financial Statements (continued)
140
10. Futures
As at 31 March 2011, the Company had entered into the following outstanding futures contracts: Sub-funds Number
of
contracts
Currency Commitments Maturity
Date
Unrealised
gain / (loss) in
sub-fund
currency
BRIC Markets Equity
HSCEI - HKD CHINA ENT 298 HKD 197,961,400 28/04/2011 819,936
SGX S&P CNX NIFTY INDEX 1,335 USD 15,670,230 28/04/2011 352,786
USD 1,172,722
Climate Change
NIKKEI 225 INDICES D 4 JPY 39,040,000 09/06/2011 (33,323)
S&P 500 EMINI INDEX 21 USD 1,390,463 17/06/2011 36,540
USD 3,217
Emerging Wealth
CAC 40 1 EUR 40,160 15/04/2011 4,553
HSCEI - HKD CHINA ENT 11 HKD 7,307,300 28/04/2011 30,266 WIG 20 WARSAW STOCK EXCH INDEX 25 PLN 705,000 17/06/2011 7,529
SGX S&P CNX NIFTY INDEX 60 USD 704,280 28/04/2011 15,532
TAMSCI MSCI TAIWAN IDX FUT 14 USD 429,940 28/04/2011 5,460
USD 63,340
Euroland Equity DOW JONES EURO STOXX 50/PR.IND 510 EUR 14,524,800 17/06/2011 (61,200)
EUR (61,200)
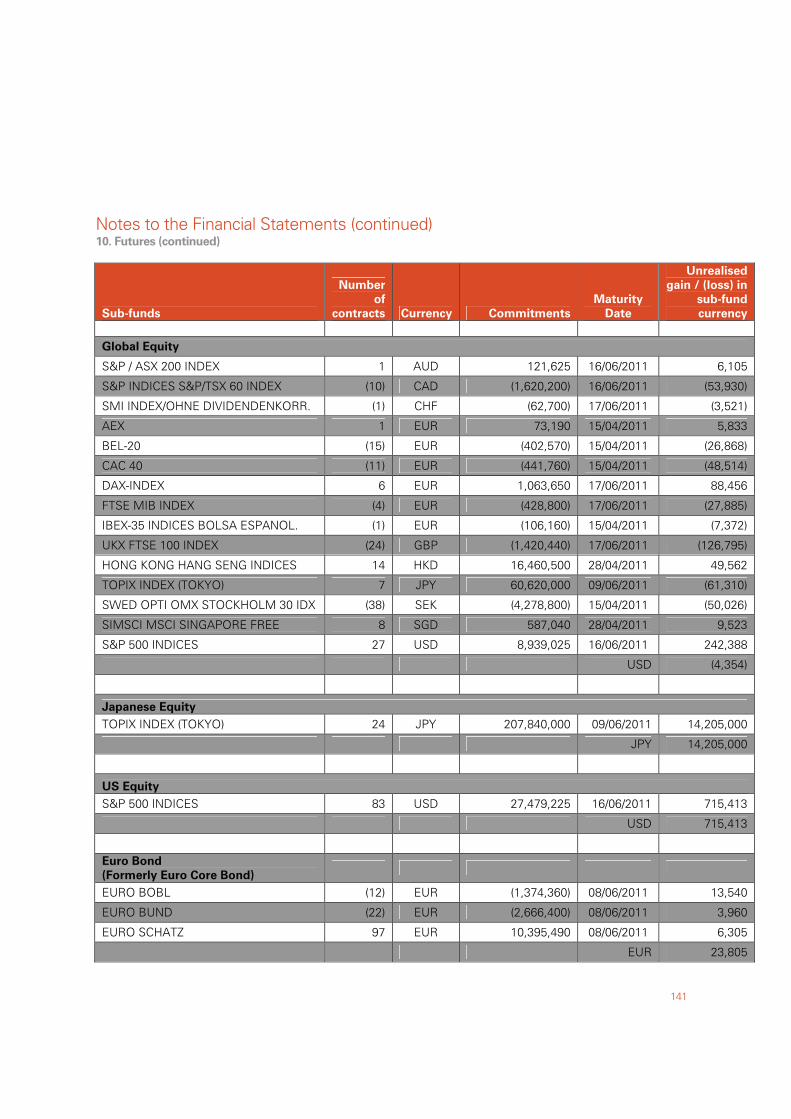
Notes to the Financial Statements (continued)
141
10. Futures (continued)
Sub-funds
Number
of
contracts Currency Commitments
Maturity
Date
Unrealised
gain / (loss) in
sub-fund
currency
Global Equity
S&P / ASX 200 INDEX 1 AUD 121,625 16/06/2011 6,105
S&P INDICES S&P/TSX 60 INDEX (10) CAD (1,620,200) 16/06/2011 (53,930)
SMI INDEX/OHNE DIVIDENDENKORR. (1) CHF (62,700) 17/06/2011 (3,521)
AEX 1 EUR 73,190 15/04/2011 5,833
BEL-20 (15) EUR (402,570) 15/04/2011 (26,868)
CAC 40 (11) EUR (441,760) 15/04/2011 (48,514)
DAX-INDEX 6 EUR 1,063,650 17/06/2011 88,456
FTSE MIB INDEX (4) EUR (428,800) 17/06/2011 (27,885)
IBEX-35 INDICES BOLSA ESPANOL. (1) EUR (106,160) 15/04/2011 (7,372)
UKX FTSE 100 INDEX (24) GBP (1,420,440) 17/06/2011 (126,795)
HONG KONG HANG SENG INDICES 14 HKD 16,460,500 28/04/2011 49,562
TOPIX INDEX (TOKYO) 7 JPY 60,620,000 09/06/2011 (61,310)
SWED OPTI OMX STOCKHOLM 30 IDX (38) SEK (4,278,800) 15/04/2011 (50,026)
SIMSCI MSCI SINGAPORE FREE 8 SGD 587,040 28/04/2011 9,523
S&P 500 INDICES 27 USD 8,939,025 16/06/2011 242,388
USD (4,354)
Japanese Equity TOPIX INDEX (TOKYO) 24 JPY 207,840,000 09/06/2011 14,205,000
JPY 14,205,000
US Equity S&P 500 INDICES 83 USD 27,479,225 16/06/2011 715,413
USD 715,413
Euro Bond
(Formerly Euro Core Bond)
EURO BOBL (12) EUR (1,374,360) 08/06/2011 13,540
EURO BUND (22) EUR (2,666,400) 08/06/2011 3,960
EURO SCHATZ 97 EUR 10,395,490 08/06/2011 6,305
EUR 23,805
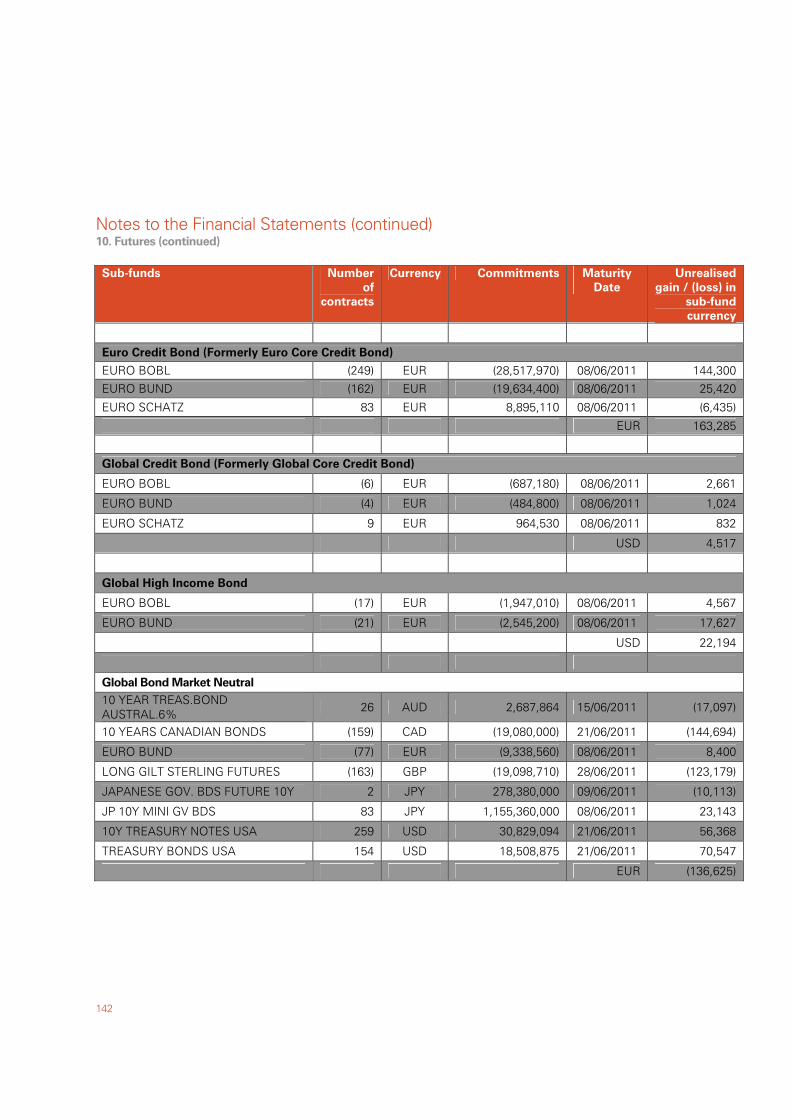
Notes to the Financial Statements (continued)
142
10. Futures (continued)
Sub-funds Number
of
contracts
Currency Commitments Maturity
Date
Unrealised
gain / (loss) in
sub-fund
currency
Euro Credit Bond (Formerly Euro Core Credit Bond)
EURO BOBL (249) EUR (28,517,970) 08/06/2011 144,300
EURO BUND (162) EUR (19,634,400) 08/06/2011 25,420
EURO SCHATZ 83 EUR 8,895,110 08/06/2011 (6,435)
EUR 163,285
Global Credit Bond (Formerly Global Core Credit Bond)
EURO BOBL (6) EUR (687,180) 08/06/2011 2,661
EURO BUND (4) EUR (484,800) 08/06/2011 1,024
EURO SCHATZ 9 EUR 964,530 08/06/2011 832
USD 4,517
Global High Income Bond
EURO BOBL (17) EUR (1,947,010) 08/06/2011 4,567
EURO BUND (21) EUR (2,545,200) 08/06/2011 17,627
USD 22,194
Global Bond Market Neutral
10 YEAR TREAS.BOND AUSTRAL.6% 26 AUD 2,687,864 15/06/2011 (17,097)
10 YEARS CANADIAN BONDS (159) CAD (19,080,000) 21/06/2011 (144,694)
EURO BUND (77) EUR (9,338,560) 08/06/2011 8,400
LONG GILT STERLING FUTURES (163) GBP (19,098,710) 28/06/2011 (123,179)
JAPANESE GOV. BDS FUTURE 10Y 2 JPY 278,380,000 09/06/2011 (10,113)
JP 10Y MINI GV BDS 83 JPY 1,155,360,000 08/06/2011 23,143
10Y TREASURY NOTES USA 259 USD 30,829,094 21/06/2011 56,368
TREASURY BONDS USA 154 USD 18,508,875 21/06/2011 70,547
EUR (136,625)
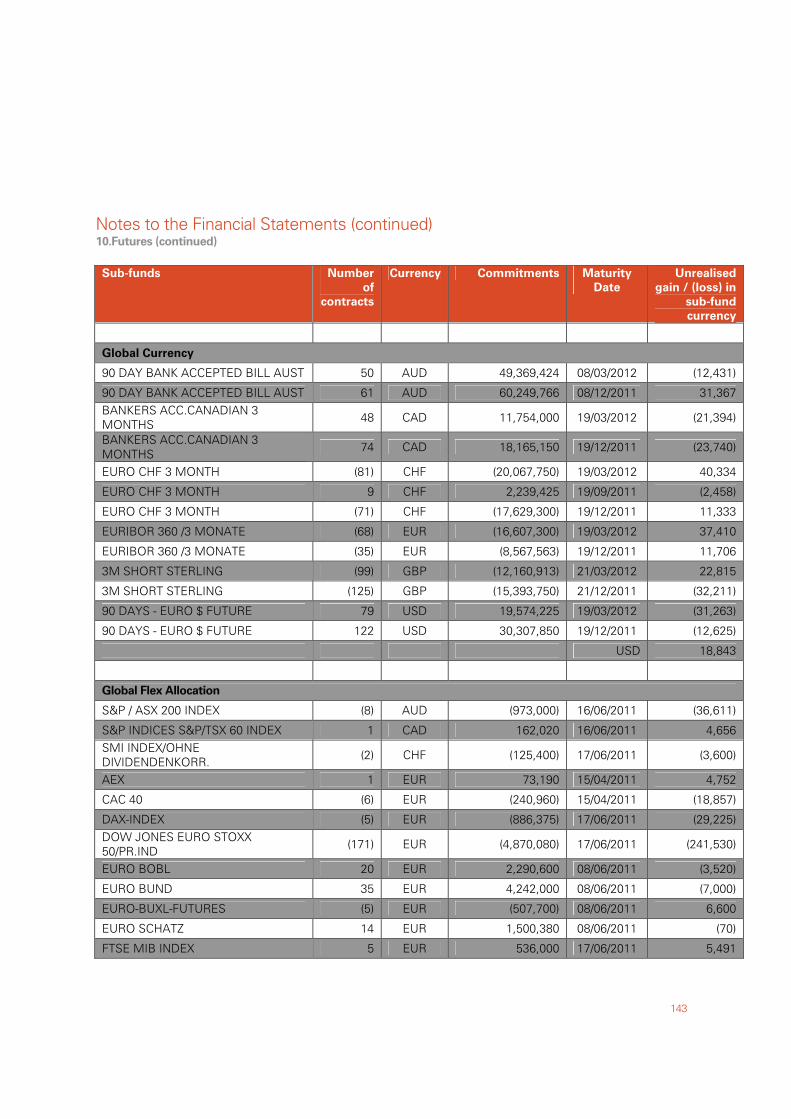
Notes to the Financial Statements (continued)
143
10.Futures (continued)
Sub-funds Number
of
contracts
Currency Commitments Maturity
Date
Unrealised
gain / (loss) in
sub-fund
currency
Global Currency
90 DAY BANK ACCEPTED BILL AUST 50 AUD 49,369,424 08/03/2012 (12,431)
90 DAY BANK ACCEPTED BILL AUST 61 AUD 60,249,766 08/12/2011 31,367 BANKERS ACC.CANADIAN 3 MONTHS 48 CAD 11,754,000 19/03/2012 (21,394)
BANKERS ACC.CANADIAN 3 MONTHS
74 CAD 18,165,150 19/12/2011 (23,740)
EURO CHF 3 MONTH (81) CHF (20,067,750) 19/03/2012 40,334
EURO CHF 3 MONTH 9 CHF 2,239,425 19/09/2011 (2,458)
EURO CHF 3 MONTH (71) CHF (17,629,300) 19/12/2011 11,333
EURIBOR 360 /3 MONATE (68) EUR (16,607,300) 19/03/2012 37,410
EURIBOR 360 /3 MONATE (35) EUR (8,567,563) 19/12/2011 11,706
3M SHORT STERLING (99) GBP (12,160,913) 21/03/2012 22,815
3M SHORT STERLING (125) GBP (15,393,750) 21/12/2011 (32,211)
90 DAYS - EURO $ FUTURE 79 USD 19,574,225 19/03/2012 (31,263)
90 DAYS - EURO $ FUTURE 122 USD 30,307,850 19/12/2011 (12,625)
USD 18,843
Global Flex Allocation
S&P / ASX 200 INDEX (8) AUD (973,000) 16/06/2011 (36,611)
S&P INDICES S&P/TSX 60 INDEX 1 CAD 162,020 16/06/2011 4,656 SMI INDEX/OHNE DIVIDENDENKORR. (2) CHF (125,400) 17/06/2011 (3,600)
AEX 1 EUR 73,190 15/04/2011 4,752
CAC 40 (6) EUR (240,960) 15/04/2011 (18,857)
DAX-INDEX (5) EUR (886,375) 17/06/2011 (29,225) DOW JONES EURO STOXX 50/PR.IND (171) EUR (4,870,080) 17/06/2011 (241,530)
EURO BOBL 20 EUR 2,290,600 08/06/2011 (3,520)
EURO BUND 35 EUR 4,242,000 08/06/2011 (7,000)
EURO-BUXL-FUTURES (5) EUR (507,700) 08/06/2011 6,600
EURO SCHATZ 14 EUR 1,500,380 08/06/2011 (70)
FTSE MIB INDEX 5 EUR 536,000 17/06/2011 5,491
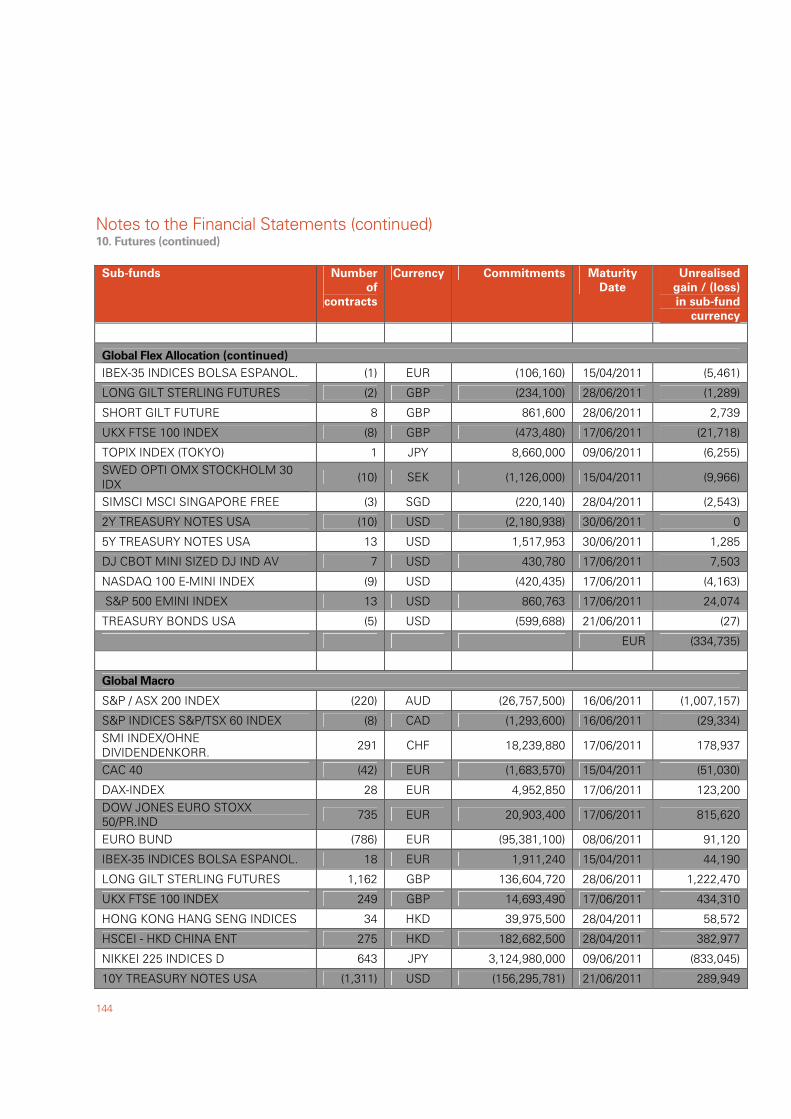
Notes to the Financial Statements (continued)
144
10. Futures (continued)
Sub-funds Number
of
contracts
Currency Commitments Maturity
Date
Unrealised
gain / (loss)
in sub-fund
currency
Global Flex Allocation (continued)
IBEX-35 INDICES BOLSA ESPANOL. (1) EUR (106,160) 15/04/2011 (5,461)
LONG GILT STERLING FUTURES (2) GBP (234,100) 28/06/2011 (1,289)
SHORT GILT FUTURE 8 GBP 861,600 28/06/2011 2,739
UKX FTSE 100 INDEX (8) GBP (473,480) 17/06/2011 (21,718)
TOPIX INDEX (TOKYO) 1 JPY 8,660,000 09/06/2011 (6,255) SWED OPTI OMX STOCKHOLM 30 IDX (10) SEK (1,126,000) 15/04/2011 (9,966)
SIMSCI MSCI SINGAPORE FREE (3) SGD (220,140) 28/04/2011 (2,543)
2Y TREASURY NOTES USA (10) USD (2,180,938) 30/06/2011 0
5Y TREASURY NOTES USA 13 USD 1,517,953 30/06/2011 1,285
DJ CBOT MINI SIZED DJ IND AV 7 USD 430,780 17/06/2011 7,503
NASDAQ 100 E-MINI INDEX (9) USD (420,435) 17/06/2011 (4,163)
S&P 500 EMINI INDEX 13 USD 860,763 17/06/2011 24,074
TREASURY BONDS USA (5) USD (599,688) 21/06/2011 (27)
EUR (334,735)
Global Macro
S&P / ASX 200 INDEX (220) AUD (26,757,500) 16/06/2011 (1,007,157)
S&P INDICES S&P/TSX 60 INDEX (8) CAD (1,293,600) 16/06/2011 (29,334) SMI INDEX/OHNE DIVIDENDENKORR. 291 CHF 18,239,880 17/06/2011 178,937
CAC 40 (42) EUR (1,683,570) 15/04/2011 (51,030)
DAX-INDEX 28 EUR 4,952,850 17/06/2011 123,200 DOW JONES EURO STOXX 50/PR.IND 735 EUR 20,903,400 17/06/2011 815,620
EURO BUND (786) EUR (95,381,100) 08/06/2011 91,120
IBEX-35 INDICES BOLSA ESPANOL. 18 EUR 1,911,240 15/04/2011 44,190
LONG GILT STERLING FUTURES 1,162 GBP 136,604,720 28/06/2011 1,222,470
UKX FTSE 100 INDEX 249 GBP 14,693,490 17/06/2011 434,310
HONG KONG HANG SENG INDICES 34 HKD 39,975,500 28/04/2011 58,572
HSCEI - HKD CHINA ENT 275 HKD 182,682,500 28/04/2011 382,977
NIKKEI 225 INDICES D 643 JPY 3,124,980,000 09/06/2011 (833,045)
10Y TREASURY NOTES USA (1,311) USD (156,295,781) 21/06/2011 289,949
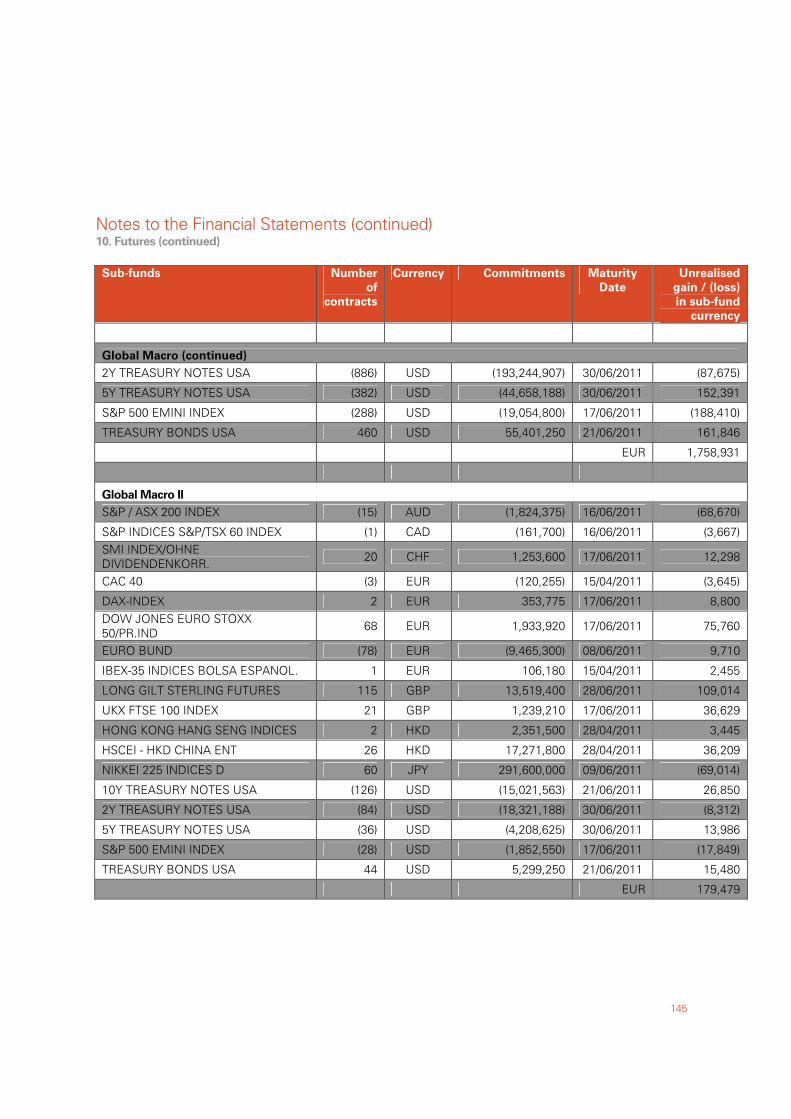
Notes to the Financial Statements (continued)
145
10. Futures (continued)
Sub-funds Number
of
contracts
Currency Commitments Maturity
Date
Unrealised
gain / (loss)
in sub-fund
currency
Global Macro (continued)
2Y TREASURY NOTES USA (886) USD (193,244,907) 30/06/2011 (87,675)
5Y TREASURY NOTES USA (382) USD (44,658,188) 30/06/2011 152,391
S&P 500 EMINI INDEX (288) USD (19,054,800) 17/06/2011 (188,410)
TREASURY BONDS USA 460 USD 55,401,250 21/06/2011 161,846
EUR 1,758,931
Global Macro II
S&P / ASX 200 INDEX (15) AUD (1,824,375) 16/06/2011 (68,670)
S&P INDICES S&P/TSX 60 INDEX (1) CAD (161,700) 16/06/2011 (3,667) SMI INDEX/OHNE DIVIDENDENKORR. 20 CHF 1,253,600 17/06/2011 12,298
CAC 40 (3) EUR (120,255) 15/04/2011 (3,645)
DAX-INDEX 2 EUR 353,775 17/06/2011 8,800 DOW JONES EURO STOXX 50/PR.IND
68 EUR 1,933,920 17/06/2011 75,760
EURO BUND (78) EUR (9,465,300) 08/06/2011 9,710
IBEX-35 INDICES BOLSA ESPANOL. 1 EUR 106,180 15/04/2011 2,455
LONG GILT STERLING FUTURES 115 GBP 13,519,400 28/06/2011 109,014
UKX FTSE 100 INDEX 21 GBP 1,239,210 17/06/2011 36,629
HONG KONG HANG SENG INDICES 2 HKD 2,351,500 28/04/2011 3,445
HSCEI - HKD CHINA ENT 26 HKD 17,271,800 28/04/2011 36,209
NIKKEI 225 INDICES D 60 JPY 291,600,000 09/06/2011 (69,014)
10Y TREASURY NOTES USA (126) USD (15,021,563) 21/06/2011 26,850
2Y TREASURY NOTES USA (84) USD (18,321,188) 30/06/2011 (8,312)
5Y TREASURY NOTES USA (36) USD (4,208,625) 30/06/2011 13,986
S&P 500 EMINI INDEX (28) USD (1,852,550) 17/06/2011 (17,849)
TREASURY BONDS USA 44 USD 5,299,250 21/06/2011 15,480
EUR 179,479
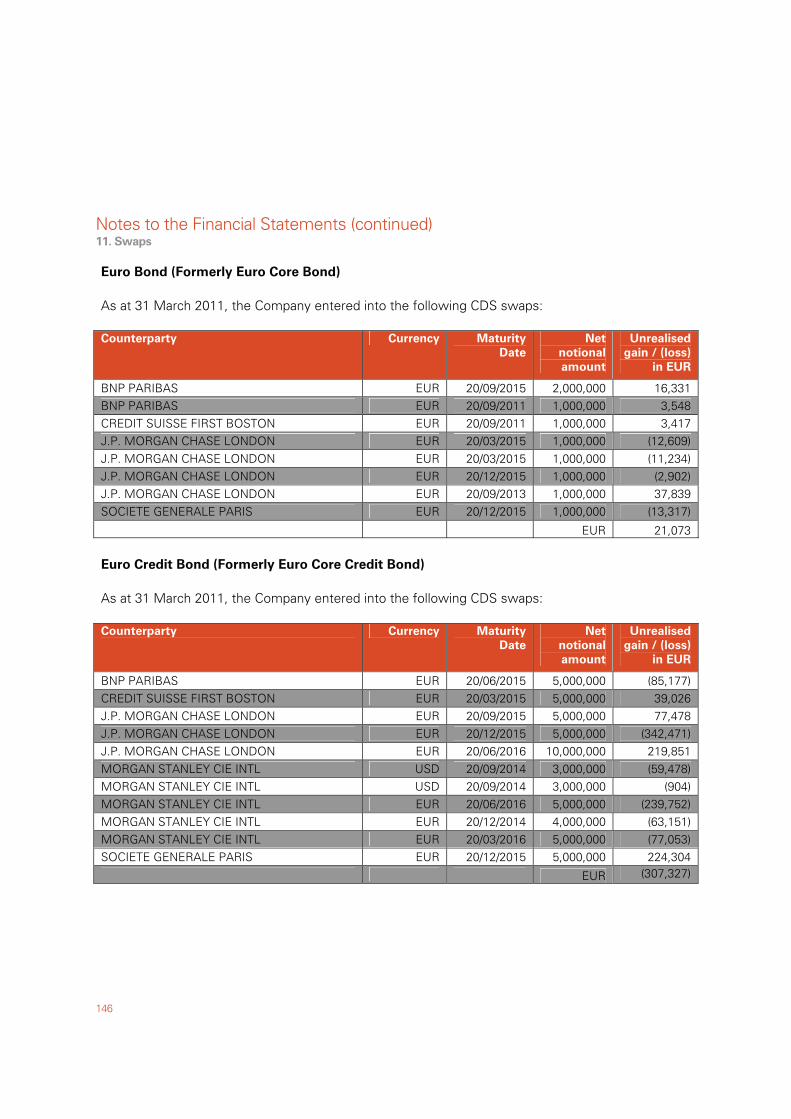
Notes to the Financial Statements (continued)
146
11. Swaps
Euro Bond (Formerly Euro Core Bond) As at 31 March 2011, the Company entered into the following CDS swaps: Counterparty Currency Maturity
Date
Net
notional
amount
Unrealised
gain / (loss)
in EUR
BNP PARIBAS EUR 20/09/2015 2,000,000 16,331 BNP PARIBAS EUR 20/09/2011 1,000,000 3,548 CREDIT SUISSE FIRST BOSTON EUR 20/09/2011 1,000,000 3,417 J.P. MORGAN CHASE LONDON EUR 20/03/2015 1,000,000 (12,609) J.P. MORGAN CHASE LONDON EUR 20/03/2015 1,000,000 (11,234) J.P. MORGAN CHASE LONDON EUR 20/12/2015 1,000,000 (2,902) J.P. MORGAN CHASE LONDON EUR 20/09/2013 1,000,000 37,839 SOCIETE GENERALE PARIS EUR 20/12/2015 1,000,000 (13,317)
EUR 21,073 Euro Credit Bond (Formerly Euro Core Credit Bond) As at 31 March 2011, the Company entered into the following CDS swaps: Counterparty Currency Maturity
Date
Net
notional
amount
Unrealised
gain / (loss)
in EUR
BNP PARIBAS EUR 20/06/2015 5,000,000 (85,177) CREDIT SUISSE FIRST BOSTON EUR 20/03/2015 5,000,000 39,026 J.P. MORGAN CHASE LONDON EUR 20/09/2015 5,000,000 77,478 J.P. MORGAN CHASE LONDON EUR 20/12/2015 5,000,000 (342,471) J.P. MORGAN CHASE LONDON EUR 20/06/2016 10,000,000 219,851 MORGAN STANLEY CIE INTL USD 20/09/2014 3,000,000 (59,478) MORGAN STANLEY CIE INTL USD 20/09/2014 3,000,000 (904) MORGAN STANLEY CIE INTL EUR 20/06/2016 5,000,000 (239,752) MORGAN STANLEY CIE INTL EUR 20/12/2014 4,000,000 (63,151) MORGAN STANLEY CIE INTL EUR 20/03/2016 5,000,000 (77,053) SOCIETE GENERALE PARIS EUR 20/12/2015 5,000,000 224,304 EUR (307,327)
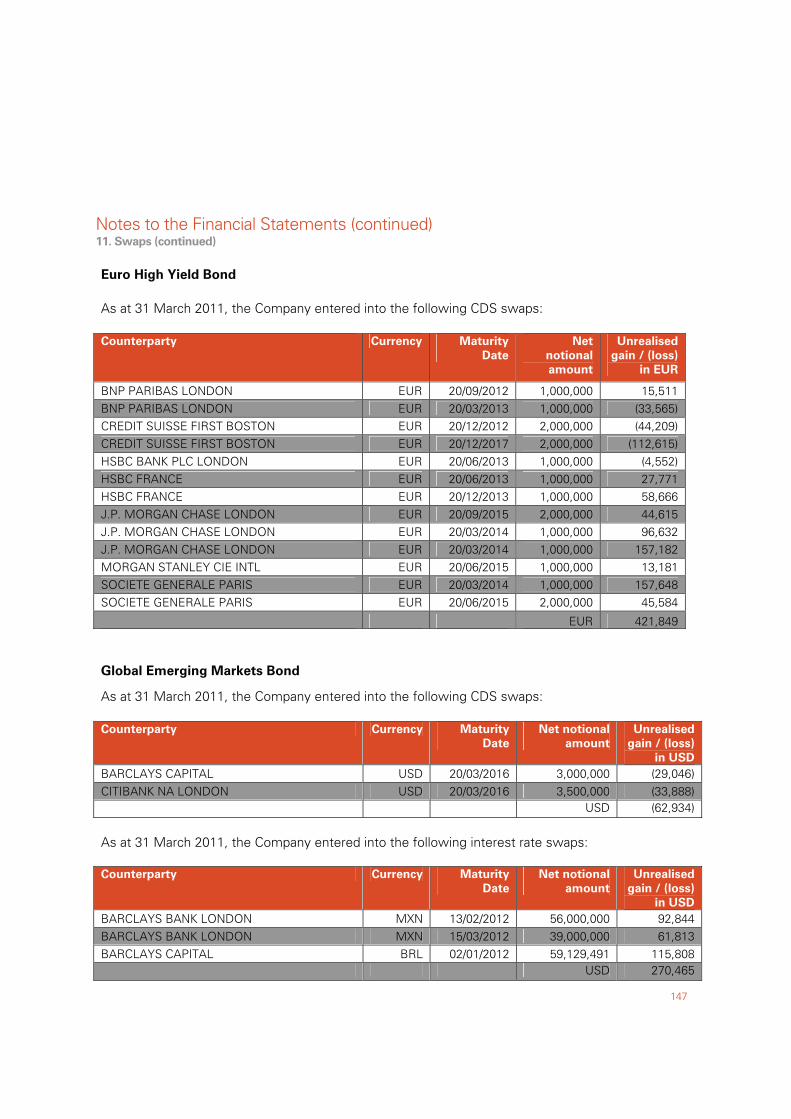
Notes to the Financial Statements (continued)
147
11. Swaps (continued)
Euro High Yield Bond As at 31 March 2011, the Company entered into the following CDS swaps: Counterparty Currency Maturity
Date
Net
notional
amount
Unrealised
gain / (loss)
in EUR
BNP PARIBAS LONDON EUR 20/09/2012 1,000,000 15,511 BNP PARIBAS LONDON EUR 20/03/2013 1,000,000 (33,565) CREDIT SUISSE FIRST BOSTON EUR 20/12/2012 2,000,000 (44,209) CREDIT SUISSE FIRST BOSTON EUR 20/12/2017 2,000,000 (112,615) HSBC BANK PLC LONDON EUR 20/06/2013 1,000,000 (4,552) HSBC FRANCE EUR 20/06/2013 1,000,000 27,771 HSBC FRANCE EUR 20/12/2013 1,000,000 58,666 J.P. MORGAN CHASE LONDON EUR 20/09/2015 2,000,000 44,615 J.P. MORGAN CHASE LONDON EUR 20/03/2014 1,000,000 96,632 J.P. MORGAN CHASE LONDON EUR 20/03/2014 1,000,000 157,182 MORGAN STANLEY CIE INTL EUR 20/06/2015 1,000,000 13,181 SOCIETE GENERALE PARIS EUR 20/03/2014 1,000,000 157,648 SOCIETE GENERALE PARIS EUR 20/06/2015 2,000,000 45,584
EUR 421,849 Global Emerging Markets Bond
As at 31 March 2011, the Company entered into the following CDS swaps: Counterparty Currency Maturity
Date
Net notional
amount
Unrealised
gain / (loss)
in USD
BARCLAYS CAPITAL USD 20/03/2016 3,000,000 (29,046) CITIBANK NA LONDON USD 20/03/2016 3,500,000 (33,888) USD (62,934)
As at 31 March 2011, the Company entered into the following interest rate swaps: Counterparty Currency Maturity
Date
Net notional
amount
Unrealised
gain / (loss)
in USD
BARCLAYS BANK LONDON MXN 13/02/2012 56,000,000 92,844 BARCLAYS BANK LONDON MXN 15/03/2012 39,000,000 61,813 BARCLAYS CAPITAL BRL 02/01/2012 59,129,491 115,808 USD 270,465
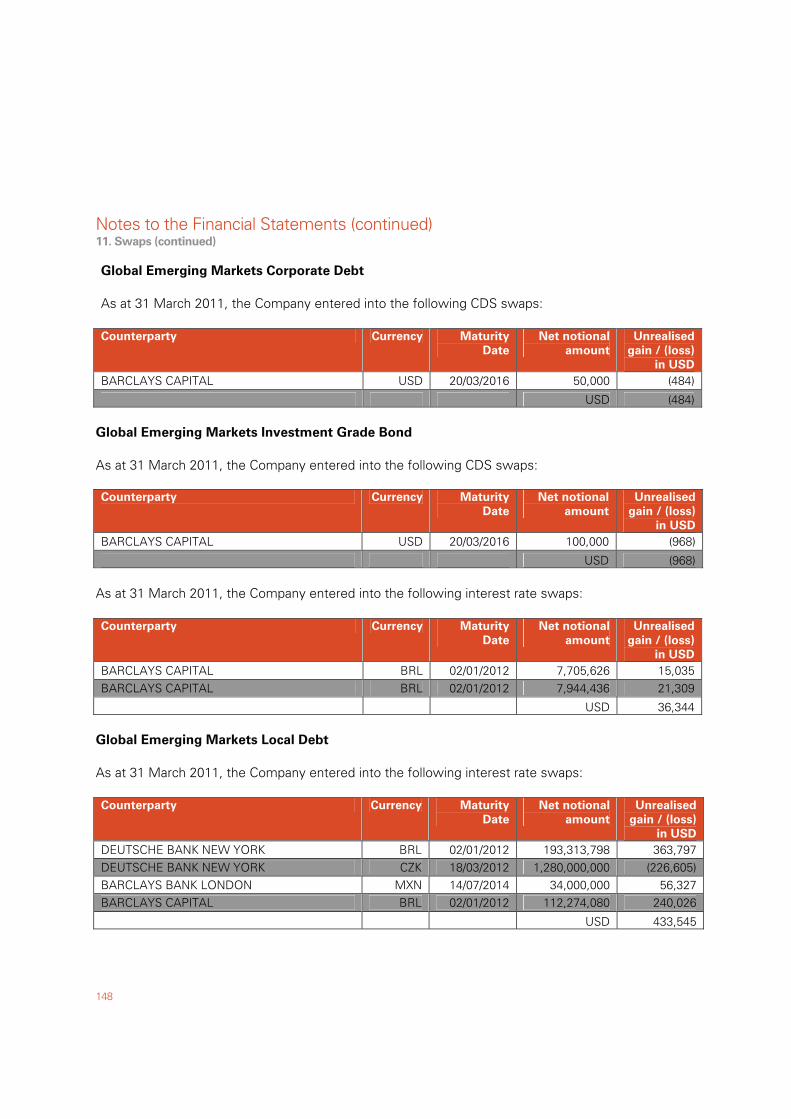
Notes to the Financial Statements (continued)
148
11. Swaps (continued)
Global Emerging Markets Corporate Debt
As at 31 March 2011, the Company entered into the following CDS swaps: Counterparty Currency Maturity
Date
Net notional
amount
Unrealised
gain / (loss)
in USD
BARCLAYS CAPITAL USD 20/03/2016 50,000 (484)
USD (484) Global Emerging Markets Investment Grade Bond
As at 31 March 2011, the Company entered into the following CDS swaps: Counterparty Currency Maturity
Date
Net notional
amount
Unrealised
gain / (loss)
in USD
BARCLAYS CAPITAL USD 20/03/2016 100,000 (968)
USD (968) As at 31 March 2011, the Company entered into the following interest rate swaps: Counterparty Currency Maturity
Date
Net notional
amount
Unrealised
gain / (loss)
in USD
BARCLAYS CAPITAL BRL 02/01/2012 7,705,626 15,035 BARCLAYS CAPITAL BRL 02/01/2012 7,944,436 21,309
USD 36,344 Global Emerging Markets Local Debt
As at 31 March 2011, the Company entered into the following interest rate swaps: Counterparty Currency Maturity
Date
Net notional
amount
Unrealised
gain / (loss)
in USD
DEUTSCHE BANK NEW YORK BRL 02/01/2012 193,313,798 363,797 DEUTSCHE BANK NEW YORK CZK 18/03/2012 1,280,000,000 (226,605) BARCLAYS BANK LONDON MXN 14/07/2014 34,000,000 56,327 BARCLAYS CAPITAL BRL 02/01/2012 112,274,080 240,026
USD 433,545
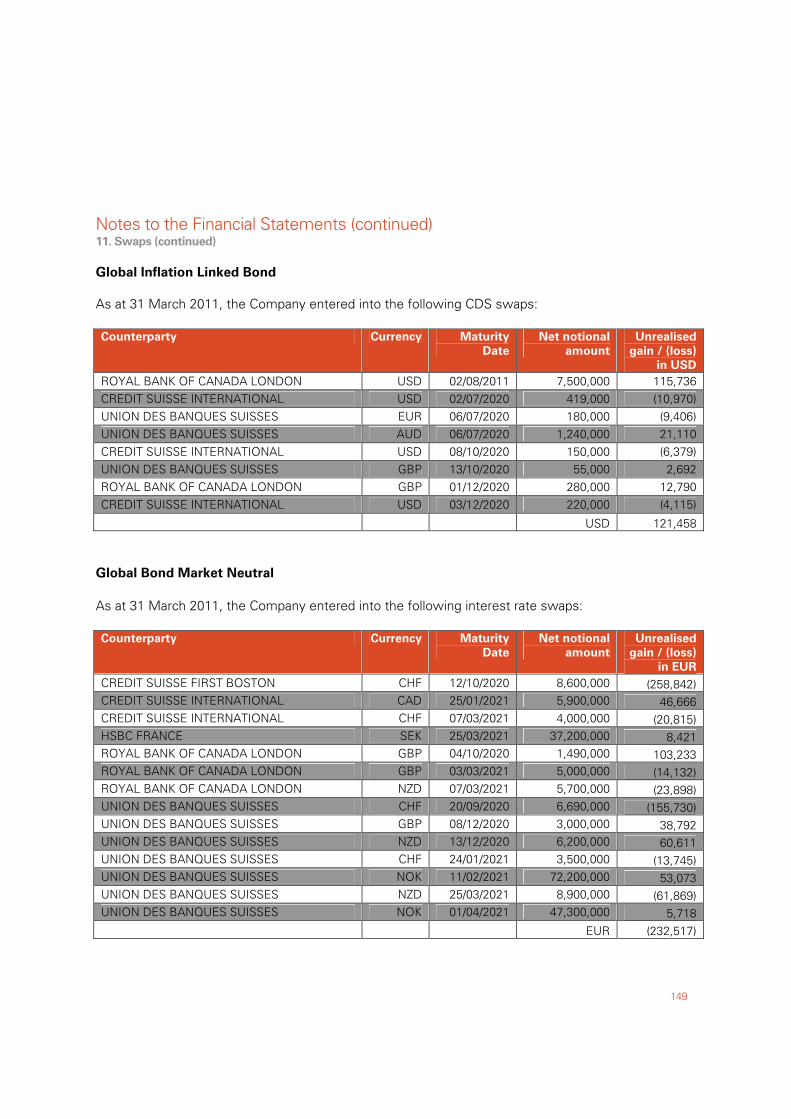
Notes to the Financial Statements (continued)
149
11. Swaps (continued)
Global Inflation Linked Bond
As at 31 March 2011, the Company entered into the following CDS swaps: Counterparty Currency Maturity
Date
Net notional
amount
Unrealised
gain / (loss)
in USD
ROYAL BANK OF CANADA LONDON USD 02/08/2011 7,500,000 115,736 CREDIT SUISSE INTERNATIONAL USD 02/07/2020 419,000 (10,970) UNION DES BANQUES SUISSES EUR 06/07/2020 180,000 (9,406) UNION DES BANQUES SUISSES AUD 06/07/2020 1,240,000 21,110 CREDIT SUISSE INTERNATIONAL USD 08/10/2020 150,000 (6,379) UNION DES BANQUES SUISSES GBP 13/10/2020 55,000 2,692 ROYAL BANK OF CANADA LONDON GBP 01/12/2020 280,000 12,790 CREDIT SUISSE INTERNATIONAL USD 03/12/2020 220,000 (4,115)
USD 121,458 Global Bond Market Neutral
As at 31 March 2011, the Company entered into the following interest rate swaps: Counterparty Currency Maturity
Date
Net notional
amount
Unrealised
gain / (loss)
in EUR
CREDIT SUISSE FIRST BOSTON CHF 12/10/2020 8,600,000 (258,842) CREDIT SUISSE INTERNATIONAL CAD 25/01/2021 5,900,000 46,666 CREDIT SUISSE INTERNATIONAL CHF 07/03/2021 4,000,000 (20,815) HSBC FRANCE SEK 25/03/2021 37,200,000 8,421 ROYAL BANK OF CANADA LONDON GBP 04/10/2020 1,490,000 103,233 ROYAL BANK OF CANADA LONDON GBP 03/03/2021 5,000,000 (14,132) ROYAL BANK OF CANADA LONDON NZD 07/03/2021 5,700,000 (23,898) UNION DES BANQUES SUISSES CHF 20/09/2020 6,690,000 (155,730) UNION DES BANQUES SUISSES GBP 08/12/2020 3,000,000 38,792 UNION DES BANQUES SUISSES NZD 13/12/2020 6,200,000 60,611 UNION DES BANQUES SUISSES CHF 24/01/2021 3,500,000 (13,745) UNION DES BANQUES SUISSES NOK 11/02/2021 72,200,000 53,073 UNION DES BANQUES SUISSES NZD 25/03/2021 8,900,000 (61,869) UNION DES BANQUES SUISSES NOK 01/04/2021 47,300,000 5,718 EUR (232,517)
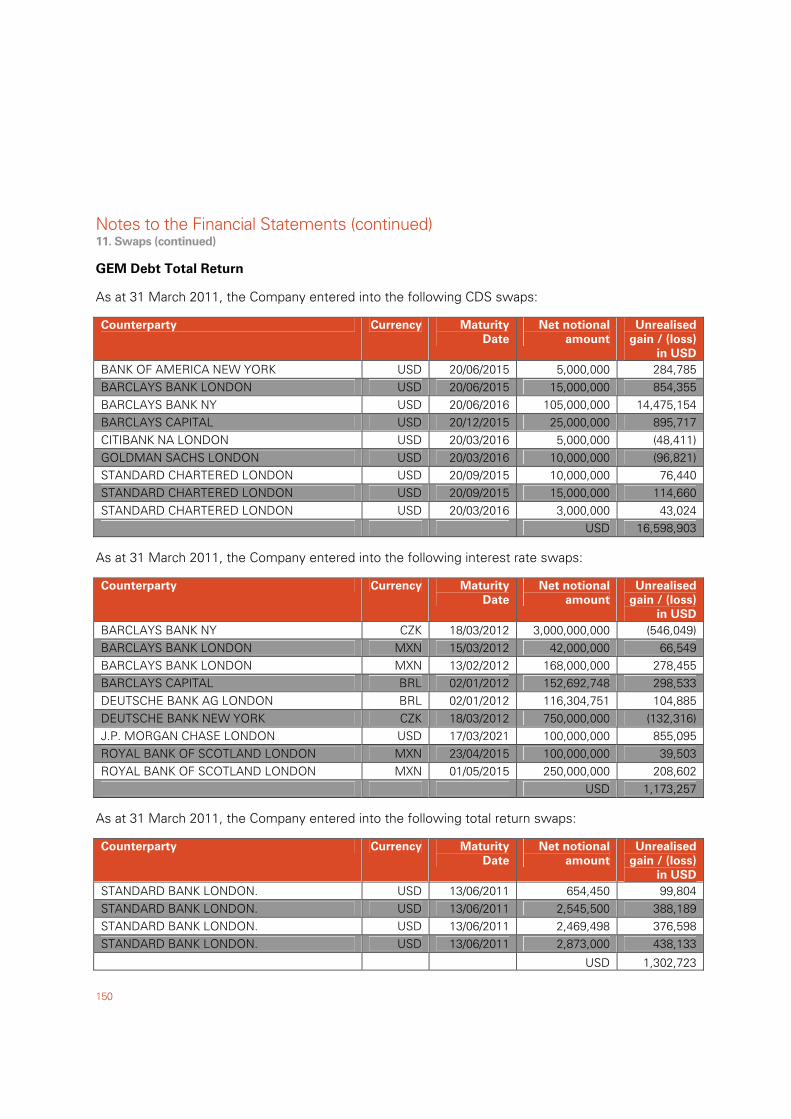
Notes to the Financial Statements (continued)
150
11. Swaps (continued) GEM Debt Total Return As at 31 March 2011, the Company entered into the following CDS swaps: Counterparty Currency Maturity
Date
Net notional
amount
Unrealised
gain / (loss)
in USD
BANK OF AMERICA NEW YORK USD 20/06/2015 5,000,000 284,785 BARCLAYS BANK LONDON USD 20/06/2015 15,000,000 854,355 BARCLAYS BANK NY USD 20/06/2016 105,000,000 14,475,154 BARCLAYS CAPITAL USD 20/12/2015 25,000,000 895,717 CITIBANK NA LONDON USD 20/03/2016 5,000,000 (48,411) GOLDMAN SACHS LONDON USD 20/03/2016 10,000,000 (96,821) STANDARD CHARTERED LONDON USD 20/09/2015 10,000,000 76,440 STANDARD CHARTERED LONDON USD 20/09/2015 15,000,000 114,660 STANDARD CHARTERED LONDON USD 20/03/2016 3,000,000 43,024 USD 16,598,903
As at 31 March 2011, the Company entered into the following interest rate swaps: Counterparty Currency Maturity
Date
Net notional
amount
Unrealised
gain / (loss)
in USD
BARCLAYS BANK NY CZK 18/03/2012 3,000,000,000 (546,049) BARCLAYS BANK LONDON MXN 15/03/2012 42,000,000 66,549 BARCLAYS BANK LONDON MXN 13/02/2012 168,000,000 278,455 BARCLAYS CAPITAL BRL 02/01/2012 152,692,748 298,533 DEUTSCHE BANK AG LONDON BRL 02/01/2012 116,304,751 104,885 DEUTSCHE BANK NEW YORK CZK 18/03/2012 750,000,000 (132,316) J.P. MORGAN CHASE LONDON USD 17/03/2021 100,000,000 855,095 ROYAL BANK OF SCOTLAND LONDON MXN 23/04/2015 100,000,000 39,503 ROYAL BANK OF SCOTLAND LONDON MXN 01/05/2015 250,000,000 208,602 USD 1,173,257
As at 31 March 2011, the Company entered into the following total return swaps: Counterparty Currency Maturity
Date
Net notional
amount
Unrealised
gain / (loss)
in USD
STANDARD BANK LONDON. USD 13/06/2011 654,450 99,804 STANDARD BANK LONDON. USD 13/06/2011 2,545,500 388,189 STANDARD BANK LONDON. USD 13/06/2011 2,469,498 376,598 STANDARD BANK LONDON. USD 13/06/2011 2,873,000 438,133
USD 1,302,723
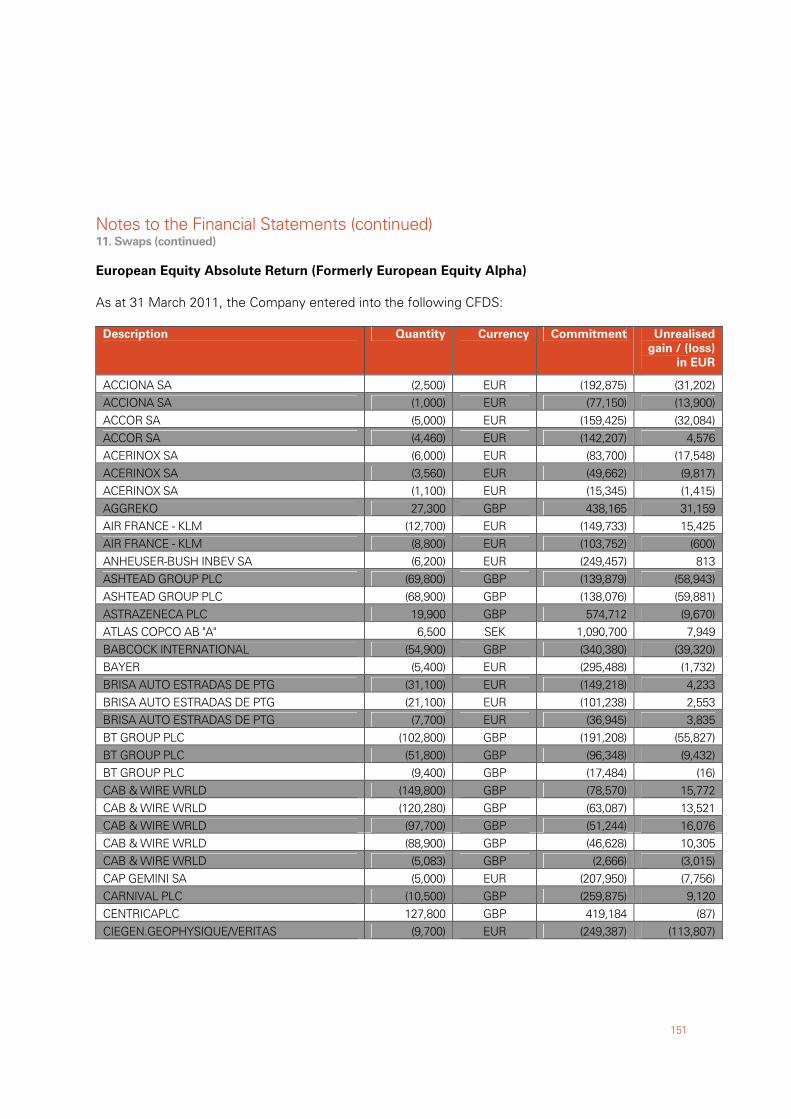
Notes to the Financial Statements (continued)
151
11. Swaps (continued)
European Equity Absolute Return (Formerly European Equity Alpha)
As at 31 March 2011, the Company entered into the following CFDS:
Description Quantity Currency Commitment Unrealised
gain / (loss)
in EUR
ACCIONA SA (2,500) EUR (192,875) (31,202) ACCIONA SA (1,000) EUR (77,150) (13,900) ACCOR SA (5,000) EUR (159,425) (32,084) ACCOR SA (4,460) EUR (142,207) 4,576 ACERINOX SA (6,000) EUR (83,700) (17,548) ACERINOX SA (3,560) EUR (49,662) (9,817) ACERINOX SA (1,100) EUR (15,345) (1,415) AGGREKO 27,300 GBP 438,165 31,159 AIR FRANCE - KLM (12,700) EUR (149,733) 15,425 AIR FRANCE - KLM (8,800) EUR (103,752) (600) ANHEUSER-BUSH INBEV SA (6,200) EUR (249,457) 813 ASHTEAD GROUP PLC (69,800) GBP (139,879) (58,943) ASHTEAD GROUP PLC (68,900) GBP (138,076) (59,881) ASTRAZENECA PLC 19,900 GBP 574,712 (9,670) ATLAS COPCO AB "A" 6,500 SEK 1,090,700 7,949 BABCOCK INTERNATIONAL (54,900) GBP (340,380) (39,320) BAYER (5,400) EUR (295,488) (1,732) BRISA AUTO ESTRADAS DE PTG (31,100) EUR (149,218) 4,233 BRISA AUTO ESTRADAS DE PTG (21,100) EUR (101,238) 2,553 BRISA AUTO ESTRADAS DE PTG (7,700) EUR (36,945) 3,835 BT GROUP PLC (102,800) GBP (191,208) (55,827) BT GROUP PLC (51,800) GBP (96,348) (9,432) BT GROUP PLC (9,400) GBP (17,484) (16) CAB & WIRE WRLD (149,800) GBP (78,570) 15,772 CAB & WIRE WRLD (120,280) GBP (63,087) 13,521 CAB & WIRE WRLD (97,700) GBP (51,244) 16,076 CAB & WIRE WRLD (88,900) GBP (46,628) 10,305 CAB & WIRE WRLD (5,083) GBP (2,666) (3,015) CAP GEMINI SA (5,000) EUR (207,950) (7,756) CARNIVAL PLC (10,500) GBP (259,875) 9,120 CENTRICAPLC 127,800 GBP 419,184 (87) CIEGEN.GEOPHYSIQUE/VERITAS (9,700) EUR (249,387) (113,807)
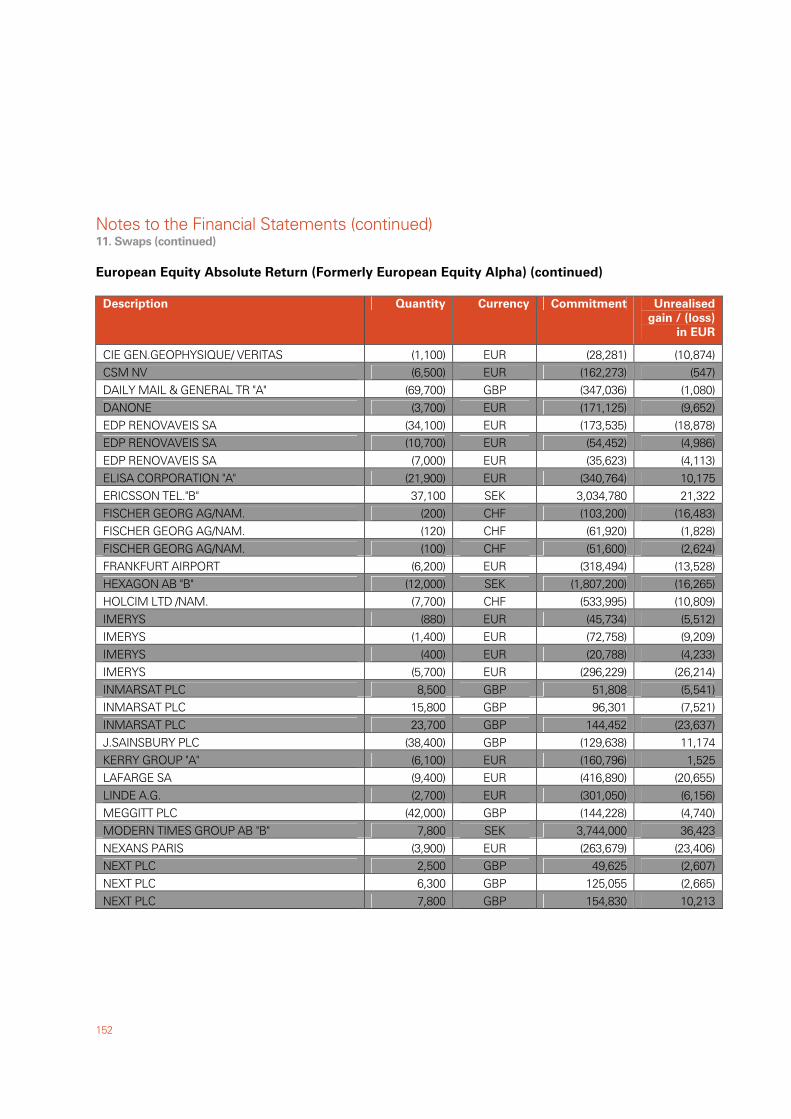
Notes to the Financial Statements (continued)
152
11. Swaps (continued)
European Equity Absolute Return (Formerly European Equity Alpha) (continued)
Description Quantity Currency Commitment Unrealised
gain / (loss)
in EUR
CIE GEN.GEOPHYSIQUE/ VERITAS (1,100) EUR (28,281) (10,874) CSM NV (6,500) EUR (162,273) (547) DAILY MAIL & GENERAL TR "A" (69,700) GBP (347,036) (1,080) DANONE (3,700) EUR (171,125) (9,652) EDP RENOVAVEIS SA (34,100) EUR (173,535) (18,878) EDP RENOVAVEIS SA (10,700) EUR (54,452) (4,986) EDP RENOVAVEIS SA (7,000) EUR (35,623) (4,113) ELISA CORPORATION "A" (21,900) EUR (340,764) 10,175 ERICSSON TEL."B" 37,100 SEK 3,034,780 21,322 FISCHER GEORG AG/NAM. (200) CHF (103,200) (16,483) FISCHER GEORG AG/NAM. (120) CHF (61,920) (1,828) FISCHER GEORG AG/NAM. (100) CHF (51,600) (2,624) FRANKFURT AIRPORT (6,200) EUR (318,494) (13,528) HEXAGON AB "B" (12,000) SEK (1,807,200) (16,265) HOLCIM LTD /NAM. (7,700) CHF (533,995) (10,809) IMERYS (880) EUR (45,734) (5,512) IMERYS (1,400) EUR (72,758) (9,209) IMERYS (400) EUR (20,788) (4,233) IMERYS (5,700) EUR (296,229) (26,214) INMARSAT PLC 8,500 GBP 51,808 (5,541) INMARSAT PLC 15,800 GBP 96,301 (7,521) INMARSAT PLC 23,700 GBP 144,452 (23,637) J.SAINSBURY PLC (38,400) GBP (129,638) 11,174 KERRY GROUP "A" (6,100) EUR (160,796) 1,525 LAFARGE SA (9,400) EUR (416,890) (20,655) LINDE A.G. (2,700) EUR (301,050) (6,156) MEGGITT PLC (42,000) GBP (144,228) (4,740) MODERN TIMES GROUP AB "B" 7,800 SEK 3,744,000 36,423 NEXANS PARIS (3,900) EUR (263,679) (23,406) NEXT PLC 2,500 GBP 49,625 (2,607) NEXT PLC 6,300 GBP 125,055 (2,665) NEXT PLC 7,800 GBP 154,830 10,213
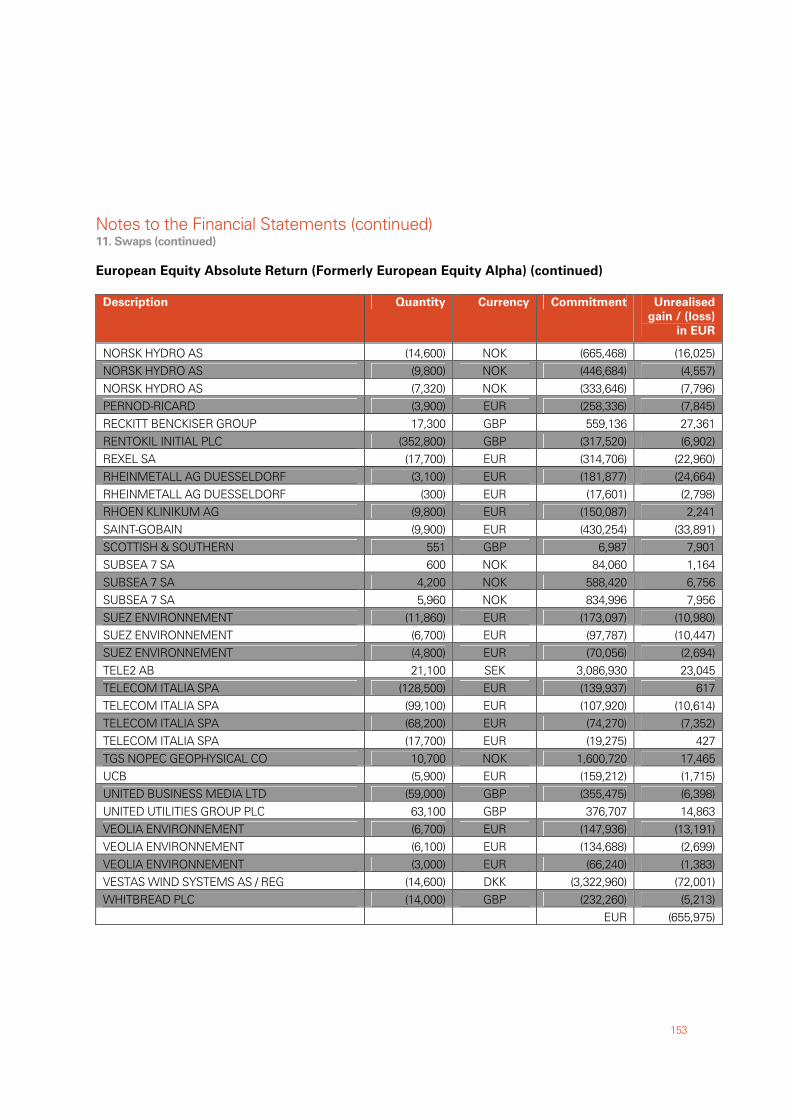
Notes to the Financial Statements (continued)
153
11. Swaps (continued)
European Equity Absolute Return (Formerly European Equity Alpha) (continued)
Description Quantity Currency Commitment Unrealised
gain / (loss)
in EUR
NORSK HYDRO AS (14,600) NOK (665,468) (16,025) NORSK HYDRO AS (9,800) NOK (446,684) (4,557) NORSK HYDRO AS (7,320) NOK (333,646) (7,796) PERNOD-RICARD (3,900) EUR (258,336) (7,845) RECKITT BENCKISER GROUP 17,300 GBP 559,136 27,361 RENTOKIL INITIAL PLC (352,800) GBP (317,520) (6,902) REXEL SA (17,700) EUR (314,706) (22,960) RHEINMETALL AG DUESSELDORF (3,100) EUR (181,877) (24,664) RHEINMETALL AG DUESSELDORF (300) EUR (17,601) (2,798) RHOEN KLINIKUM AG (9,800) EUR (150,087) 2,241 SAINT-GOBAIN (9,900) EUR (430,254) (33,891) SCOTTISH & SOUTHERN 551 GBP 6,987 7,901 SUBSEA 7 SA 600 NOK 84,060 1,164 SUBSEA 7 SA 4,200 NOK 588,420 6,756 SUBSEA 7 SA 5,960 NOK 834,996 7,956 SUEZ ENVIRONNEMENT (11,860) EUR (173,097) (10,980) SUEZ ENVIRONNEMENT (6,700) EUR (97,787) (10,447) SUEZ ENVIRONNEMENT (4,800) EUR (70,056) (2,694) TELE2 AB 21,100 SEK 3,086,930 23,045 TELECOM ITALIA SPA (128,500) EUR (139,937) 617 TELECOM ITALIA SPA (99,100) EUR (107,920) (10,614) TELECOM ITALIA SPA (68,200) EUR (74,270) (7,352) TELECOM ITALIA SPA (17,700) EUR (19,275) 427 TGS NOPEC GEOPHYSICAL CO 10,700 NOK 1,600,720 17,465 UCB (5,900) EUR (159,212) (1,715) UNITED BUSINESS MEDIA LTD (59,000) GBP (355,475) (6,398) UNITED UTILITIES GROUP PLC 63,100 GBP 376,707 14,863 VEOLIA ENVIRONNEMENT (6,700) EUR (147,936) (13,191) VEOLIA ENVIRONNEMENT (6,100) EUR (134,688) (2,699) VEOLIA ENVIRONNEMENT (3,000) EUR (66,240) (1,383) VESTAS WIND SYSTEMS AS / REG (14,600) DKK (3,322,960) (72,001) WHITBREAD PLC (14,000) GBP (232,260) (5,213) EUR (655,975)
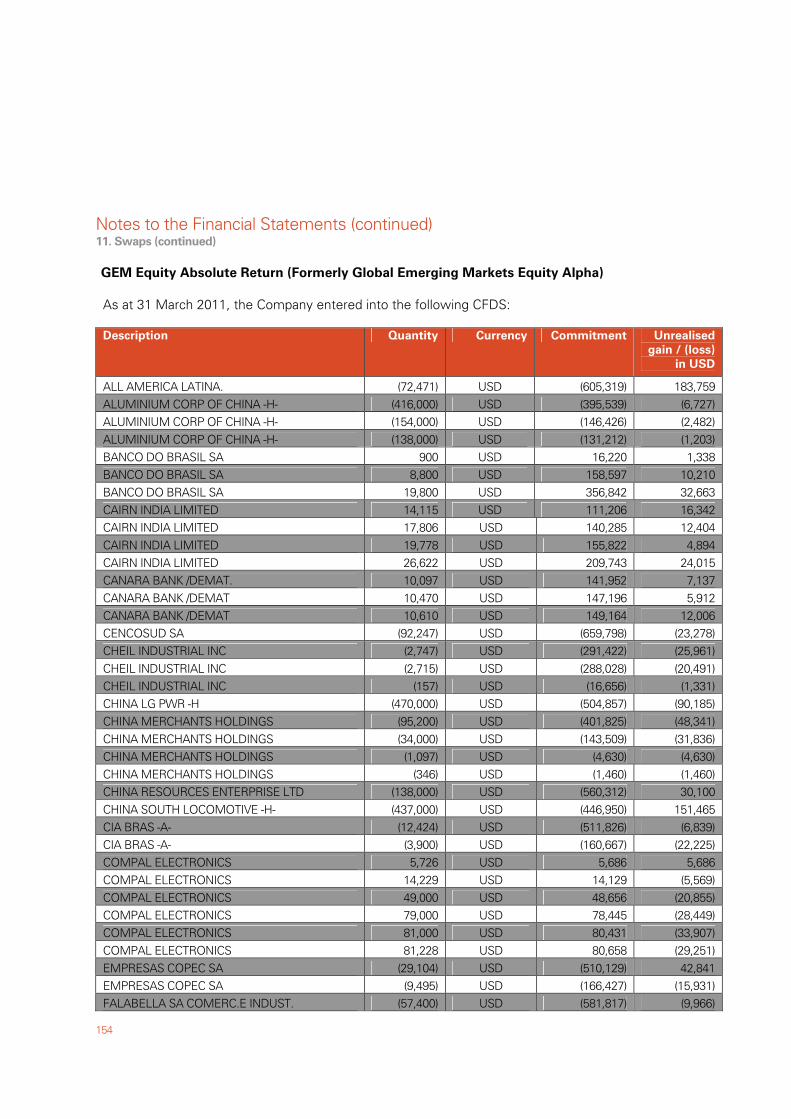
Notes to the Financial Statements (continued)
154
11. Swaps (continued)
GEM Equity Absolute Return (Formerly Global Emerging Markets Equity Alpha)
As at 31 March 2011, the Company entered into the following CFDS: Description Quantity Currency Commitment Unrealised
gain / (loss)
in USD
ALL AMERICA LATINA. (72,471) USD (605,319) 183,759 ALUMINIUM CORP OF CHINA -H- (416,000) USD (395,539) (6,727) ALUMINIUM CORP OF CHINA -H- (154,000) USD (146,426) (2,482) ALUMINIUM CORP OF CHINA -H- (138,000) USD (131,212) (1,203) BANCO DO BRASIL SA 900 USD 16,220 1,338 BANCO DO BRASIL SA 8,800 USD 158,597 10,210 BANCO DO BRASIL SA 19,800 USD 356,842 32,663 CAIRN INDIA LIMITED 14,115 USD 111,206 16,342 CAIRN INDIA LIMITED 17,806 USD 140,285 12,404 CAIRN INDIA LIMITED 19,778 USD 155,822 4,894 CAIRN INDIA LIMITED 26,622 USD 209,743 24,015 CANARA BANK /DEMAT. 10,097 USD 141,952 7,137 CANARA BANK /DEMAT 10,470 USD 147,196 5,912 CANARA BANK /DEMAT 10,610 USD 149,164 12,006 CENCOSUD SA (92,247) USD (659,798) (23,278) CHEIL INDUSTRIAL INC (2,747) USD (291,422) (25,961) CHEIL INDUSTRIAL INC (2,715) USD (288,028) (20,491) CHEIL INDUSTRIAL INC (157) USD (16,656) (1,331) CHINA LG PWR -H (470,000) USD (504,857) (90,185) CHINA MERCHANTS HOLDINGS (95,200) USD (401,825) (48,341) CHINA MERCHANTS HOLDINGS (34,000) USD (143,509) (31,836) CHINA MERCHANTS HOLDINGS (1,097) USD (4,630) (4,630) CHINA MERCHANTS HOLDINGS (346) USD (1,460) (1,460) CHINA RESOURCES ENTERPRISE LTD (138,000) USD (560,312) 30,100 CHINA SOUTH LOCOMOTIVE -H- (437,000) USD (446,950) 151,465 CIA BRAS -A- (12,424) USD (511,826) (6,839) CIA BRAS -A- (3,900) USD (160,667) (22,225) COMPAL ELECTRONICS 5,726 USD 5,686 5,686 COMPAL ELECTRONICS 14,229 USD 14,129 (5,569) COMPAL ELECTRONICS 49,000 USD 48,656 (20,855) COMPAL ELECTRONICS 79,000 USD 78,445 (28,449) COMPAL ELECTRONICS 81,000 USD 80,431 (33,907) COMPAL ELECTRONICS 81,228 USD 80,658 (29,251) EMPRESAS COPEC SA (29,104) USD (510,129) 42,841 EMPRESAS COPEC SA (9,495) USD (166,427) (15,931) FALABELLA SA COMERC.E INDUST. (57,400) USD (581,817) (9,966)
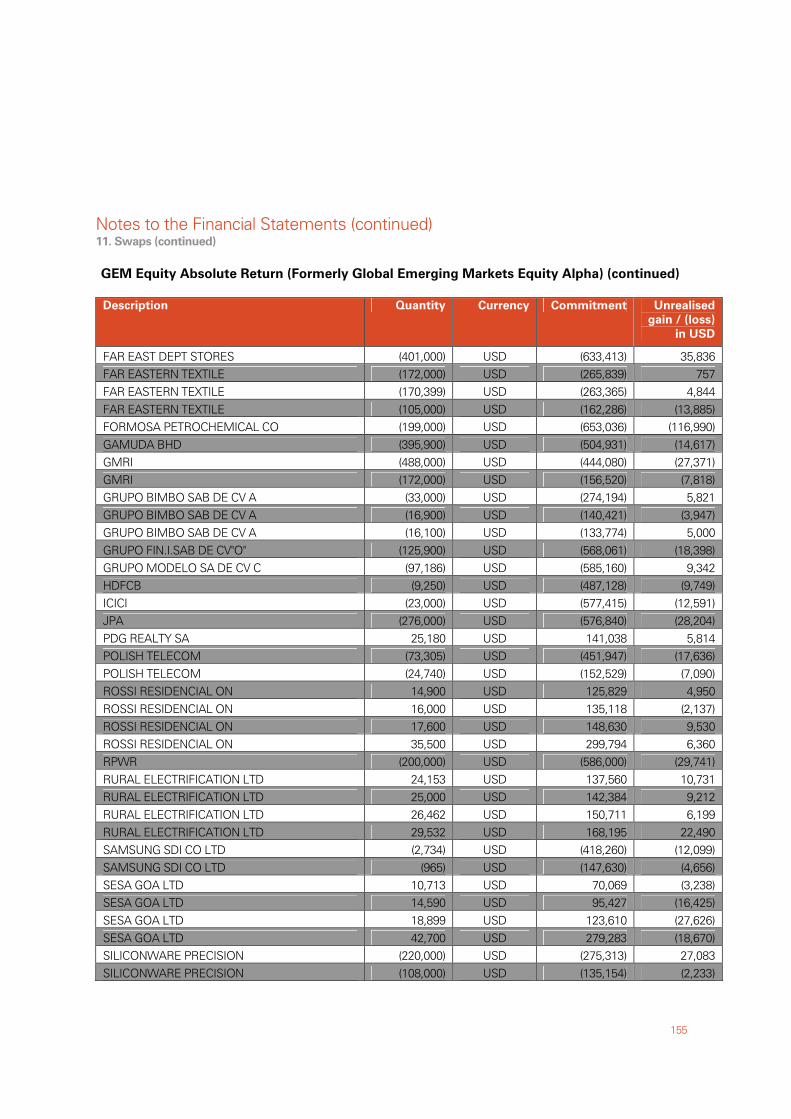
Notes to the Financial Statements (continued)
155
11. Swaps (continued)
GEM Equity Absolute Return (Formerly Global Emerging Markets Equity Alpha) (continued)
Description Quantity Currency Commitment Unrealised
gain / (loss)
in USD
FAR EAST DEPT STORES (401,000) USD (633,413) 35,836 FAR EASTERN TEXTILE (172,000) USD (265,839) 757 FAR EASTERN TEXTILE (170,399) USD (263,365) 4,844 FAR EASTERN TEXTILE (105,000) USD (162,286) (13,885) FORMOSA PETROCHEMICAL CO (199,000) USD (653,036) (116,990) GAMUDA BHD (395,900) USD (504,931) (14,617) GMRI (488,000) USD (444,080) (27,371) GMRI (172,000) USD (156,520) (7,818) GRUPO BIMBO SAB DE CV A (33,000) USD (274,194) 5,821 GRUPO BIMBO SAB DE CV A (16,900) USD (140,421) (3,947) GRUPO BIMBO SAB DE CV A (16,100) USD (133,774) 5,000 GRUPO FIN.I.SAB DE CV"O" (125,900) USD (568,061) (18,398) GRUPO MODELO SA DE CV C (97,186) USD (585,160) 9,342 HDFCB (9,250) USD (487,128) (9,749) ICICI (23,000) USD (577,415) (12,591) JPA (276,000) USD (576,840) (28,204) PDG REALTY SA 25,180 USD 141,038 5,814 POLISH TELECOM (73,305) USD (451,947) (17,636) POLISH TELECOM (24,740) USD (152,529) (7,090) ROSSI RESIDENCIAL ON 14,900 USD 125,829 4,950 ROSSI RESIDENCIAL ON 16,000 USD 135,118 (2,137) ROSSI RESIDENCIAL ON 17,600 USD 148,630 9,530 ROSSI RESIDENCIAL ON 35,500 USD 299,794 6,360 RPWR (200,000) USD (586,000) (29,741) RURAL ELECTRIFICATION LTD 24,153 USD 137,560 10,731 RURAL ELECTRIFICATION LTD 25,000 USD 142,384 9,212 RURAL ELECTRIFICATION LTD 26,462 USD 150,711 6,199 RURAL ELECTRIFICATION LTD 29,532 USD 168,195 22,490 SAMSUNG SDI CO LTD (2,734) USD (418,260) (12,099) SAMSUNG SDI CO LTD (965) USD (147,630) (4,656) SESA GOA LTD 10,713 USD 70,069 (3,238) SESA GOA LTD 14,590 USD 95,427 (16,425) SESA GOA LTD 18,899 USD 123,610 (27,626) SESA GOA LTD 42,700 USD 279,283 (18,670) SILICONWARE PRECISION (220,000) USD (275,313) 27,083 SILICONWARE PRECISION (108,000) USD (135,154) (2,233)
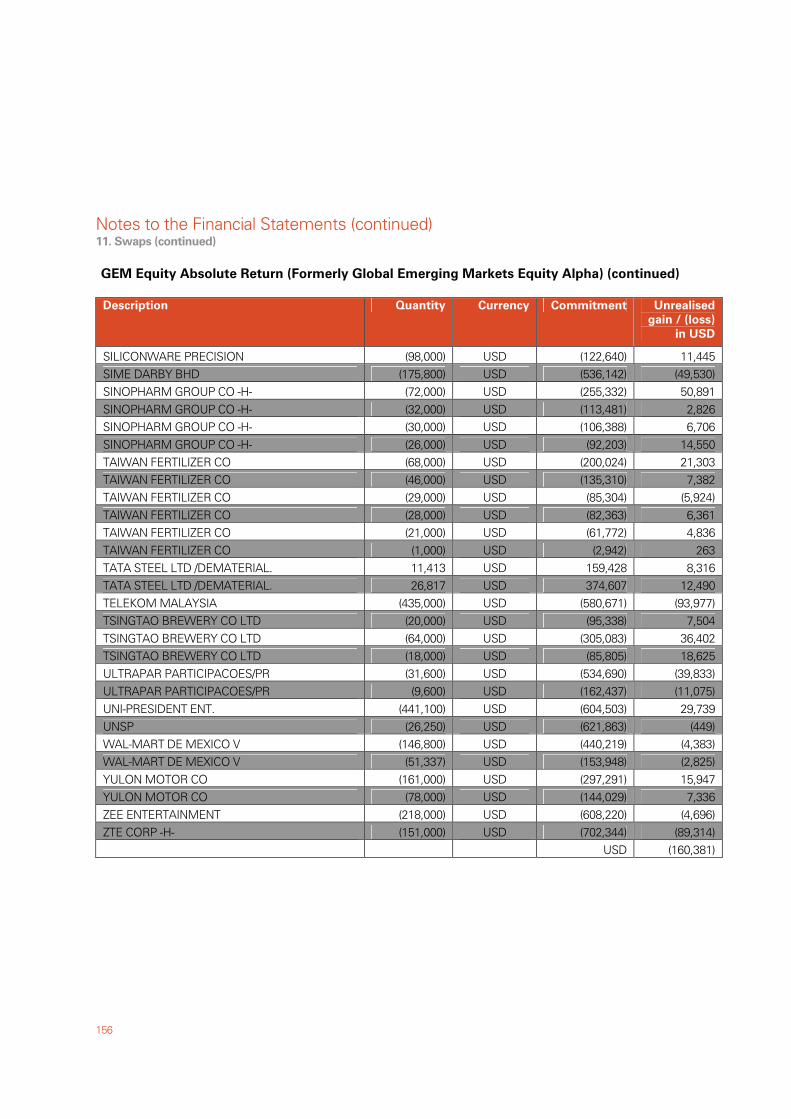
Notes to the Financial Statements (continued)
156
11. Swaps (continued)
GEM Equity Absolute Return (Formerly Global Emerging Markets Equity Alpha) (continued)
Description Quantity Currency Commitment Unrealised
gain / (loss)
in USD
SILICONWARE PRECISION (98,000) USD (122,640) 11,445 SIME DARBY BHD (175,800) USD (536,142) (49,530) SINOPHARM GROUP CO -H- (72,000) USD (255,332) 50,891 SINOPHARM GROUP CO -H- (32,000) USD (113,481) 2,826 SINOPHARM GROUP CO -H- (30,000) USD (106,388) 6,706 SINOPHARM GROUP CO -H- (26,000) USD (92,203) 14,550 TAIWAN FERTILIZER CO (68,000) USD (200,024) 21,303 TAIWAN FERTILIZER CO (46,000) USD (135,310) 7,382 TAIWAN FERTILIZER CO (29,000) USD (85,304) (5,924) TAIWAN FERTILIZER CO (28,000) USD (82,363) 6,361 TAIWAN FERTILIZER CO (21,000) USD (61,772) 4,836 TAIWAN FERTILIZER CO (1,000) USD (2,942) 263 TATA STEEL LTD /DEMATERIAL. 11,413 USD 159,428 8,316 TATA STEEL LTD /DEMATERIAL. 26,817 USD 374,607 12,490 TELEKOM MALAYSIA (435,000) USD (580,671) (93,977) TSINGTAO BREWERY CO LTD (20,000) USD (95,338) 7,504 TSINGTAO BREWERY CO LTD (64,000) USD (305,083) 36,402 TSINGTAO BREWERY CO LTD (18,000) USD (85,805) 18,625 ULTRAPAR PARTICIPACOES/PR (31,600) USD (534,690) (39,833) ULTRAPAR PARTICIPACOES/PR (9,600) USD (162,437) (11,075) UNI-PRESIDENT ENT. (441,100) USD (604,503) 29,739 UNSP (26,250) USD (621,863) (449) WAL-MART DE MEXICO V (146,800) USD (440,219) (4,383) WAL-MART DE MEXICO V (51,337) USD (153,948) (2,825) YULON MOTOR CO (161,000) USD (297,291) 15,947 YULON MOTOR CO (78,000) USD (144,029) 7,336 ZEE ENTERTAINMENT (218,000) USD (608,220) (4,696) ZTE CORP -H- (151,000) USD (702,344) (89,314) USD (160,381)
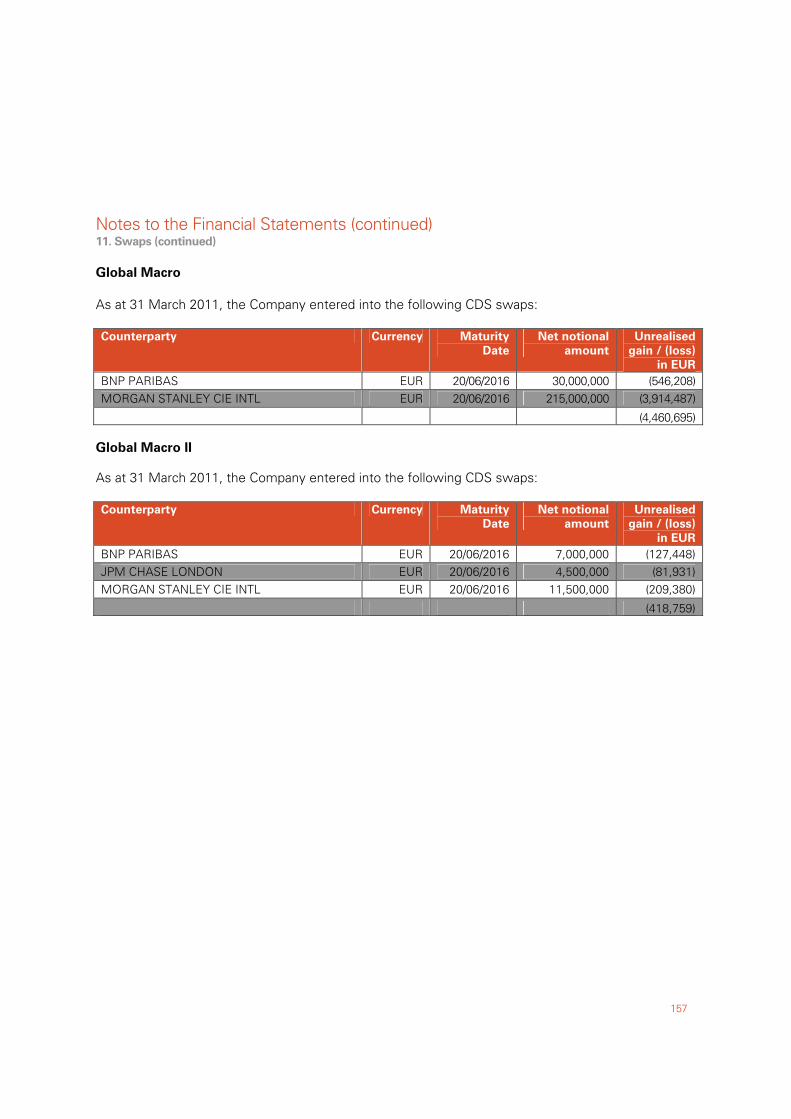
Notes to the Financial Statements (continued)
157
11. Swaps (continued)
Global Macro
As at 31 March 2011, the Company entered into the following CDS swaps: Counterparty Currency Maturity
Date
Net notional
amount
Unrealised
gain / (loss)
in EUR
BNP PARIBAS EUR 20/06/2016 30,000,000 (546,208) MORGAN STANLEY CIE INTL EUR 20/06/2016 215,000,000 (3,914,487)
(4,460,695)
Global Macro II
As at 31 March 2011, the Company entered into the following CDS swaps: Counterparty Currency Maturity
Date
Net notional
amount
Unrealised
gain / (loss)
in EUR
BNP PARIBAS EUR 20/06/2016 7,000,000 (127,448) JPM CHASE LONDON EUR 20/06/2016 4,500,000 (81,931) MORGAN STANLEY CIE INTL EUR 20/06/2016 11,500,000 (209,380)
(418,759)
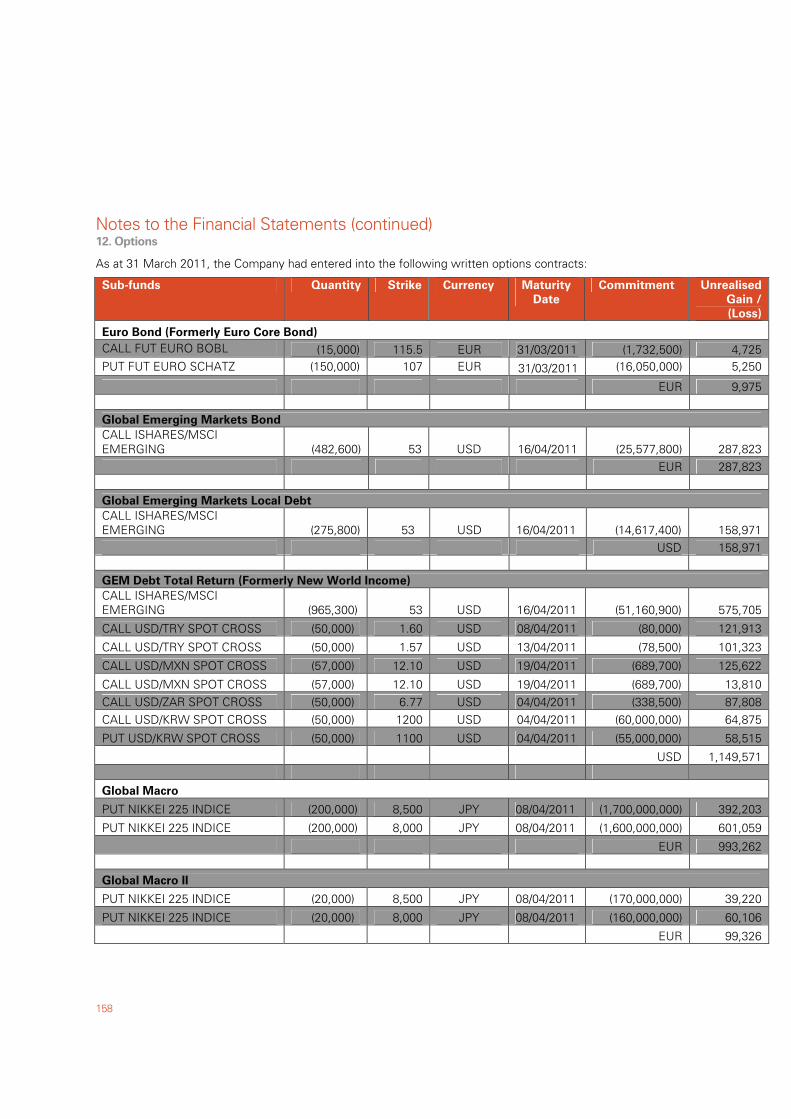
Notes to the Financial Statements (continued)
158
12. Options
As at 31 March 2011, the Company had entered into the following written options contracts:
Sub-funds Quantity Strike Currency Maturity
Date
Commitment Unrealised
Gain /
(Loss)
Euro Bond (Formerly Euro Core Bond)
CALL FUT EURO BOBL (15,000) 115.5 EUR 31/03/2011 (1,732,500) 4,725 PUT FUT EURO SCHATZ (150,000) 107 EUR 31/03/2011 (16,050,000) 5,250
EUR 9,975 Global Emerging Markets Bond
CALL ISHARES/MSCI EMERGING (482,600) 53 USD 16/04/2011 (25,577,800) 287,823 EUR 287,823
Global Emerging Markets Local Debt CALL ISHARES/MSCI EMERGING (275,800) 53 USD 16/04/2011 (14,617,400) 158,971 USD 158,971 GEM Debt Total Return (Formerly New World Income)
CALL ISHARES/MSCI EMERGING (965,300) 53 USD 16/04/2011 (51,160,900) 575,705
CALL USD/TRY SPOT CROSS (50,000) 1.60 USD 08/04/2011 (80,000) 121,913
CALL USD/TRY SPOT CROSS (50,000) 1.57 USD 13/04/2011 (78,500) 101,323
CALL USD/MXN SPOT CROSS (57,000) 12.10 USD 19/04/2011 (689,700) 125,622
CALL USD/MXN SPOT CROSS (57,000) 12.10 USD 19/04/2011 (689,700) 13,810 CALL USD/ZAR SPOT CROSS (50,000) 6.77 USD 04/04/2011 (338,500) 87,808 CALL USD/KRW SPOT CROSS (50,000) 1200 USD 04/04/2011 (60,000,000) 64,875
PUT USD/KRW SPOT CROSS (50,000) 1100 USD 04/04/2011 (55,000,000) 58,515
USD 1,149,571
Global Macro
PUT NIKKEI 225 INDICE (200,000) 8,500 JPY 08/04/2011 (1,700,000,000) 392,203
PUT NIKKEI 225 INDICE (200,000) 8,000 JPY 08/04/2011 (1,600,000,000) 601,059 EUR 993,262
Global Macro II
PUT NIKKEI 225 INDICE (20,000) 8,500 JPY 08/04/2011 (170,000,000) 39,220
PUT NIKKEI 225 INDICE (20,000) 8,000 JPY 08/04/2011 (160,000,000) 60,106
EUR 99,326
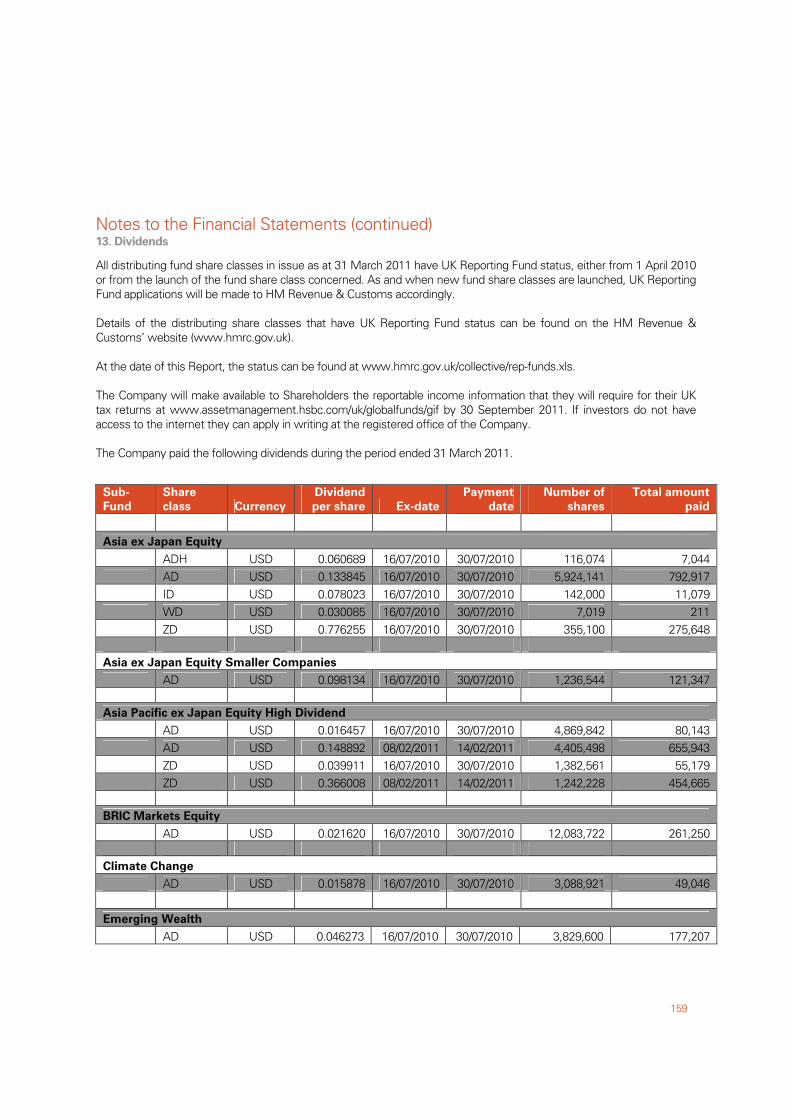
Notes to the Financial Statements (continued)
159
13. Dividends
All distributing fund share classes in issue as at 31 March 2011 have UK Reporting Fund status, either from 1 April 2010 or from the launch of the fund share class concerned. As and when new fund share classes are launched, UK Reporting Fund applications will be made to HM Revenue & Customs accordingly. Details of the distributing share classes that have UK Reporting Fund status can be found on the HM Revenue & Customs’ website (www.hmrc.gov.uk). At the date of this Report, the status can be found at www.hmrc.gov.uk/collective/rep-funds.xls. The Company will make available to Shareholders the reportable income information that they will require for their UK tax returns at www.assetmanagement.hsbc.com/uk/globalfunds/gif by 30 September 2011. If investors do not have access to the internet they can apply in writing at the registered office of the Company. The Company paid the following dividends during the period ended 31 March 2011.
Sub-
Fund
Share
class Currency
Dividend
per share Ex-date
Payment
date
Number of
shares
Total amount
paid
Asia ex Japan Equity ADH USD 0.060689 16/07/2010 30/07/2010 116,074 7,044 AD USD 0.133845 16/07/2010 30/07/2010 5,924,141 792,917 ID USD 0.078023 16/07/2010 30/07/2010 142,000 11,079 WD USD 0.030085 16/07/2010 30/07/2010 7,019 211 ZD USD 0.776255 16/07/2010 30/07/2010 355,100 275,648 Asia ex Japan Equity Smaller Companies
AD USD 0.098134 16/07/2010 30/07/2010 1,236,544 121,347 Asia Pacific ex Japan Equity High Dividend
AD USD 0.016457 16/07/2010 30/07/2010 4,869,842 80,143 AD USD 0.148892 08/02/2011 14/02/2011 4,405,498 655,943 ZD USD 0.039911 16/07/2010 30/07/2010 1,382,561 55,179 ZD USD 0.366008 08/02/2011 14/02/2011 1,242,228 454,665 BRIC Markets Equity
AD USD 0.021620 16/07/2010 30/07/2010 12,083,722 261,250
Climate Change
AD USD 0.015878 16/07/2010 30/07/2010 3,088,921 49,046 Emerging Wealth
AD USD 0.046273 16/07/2010 30/07/2010 3,829,600 177,207
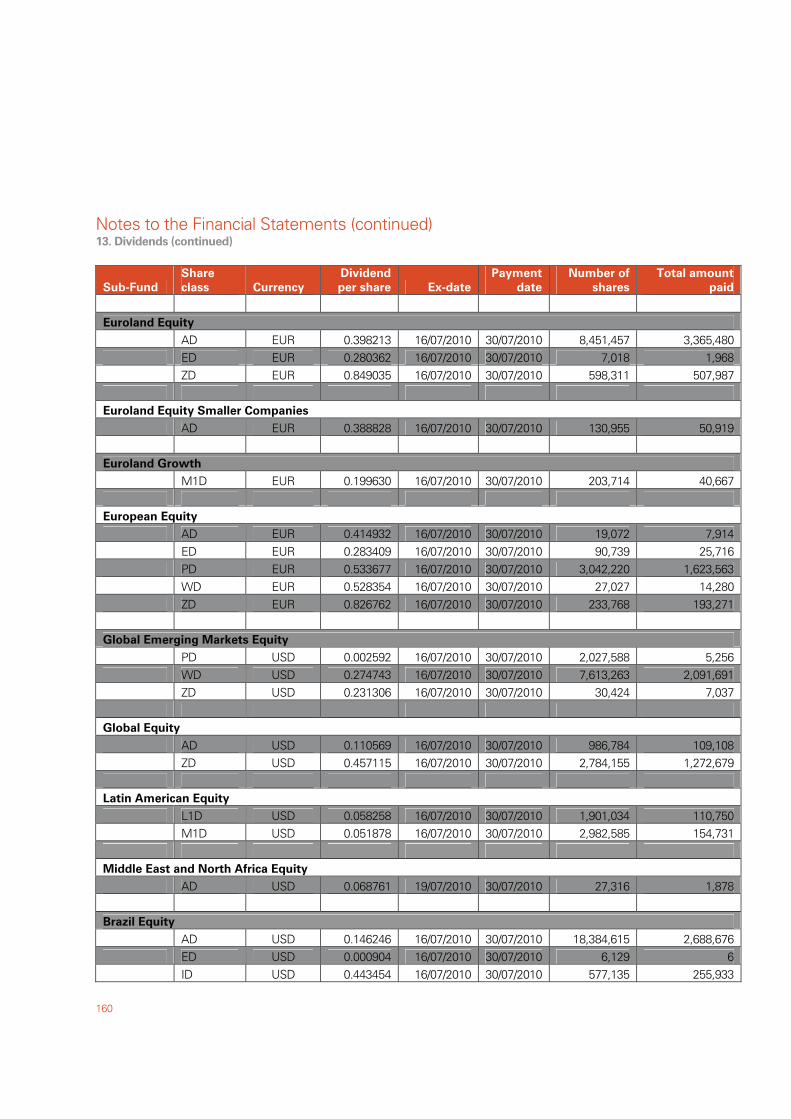
Notes to the Financial Statements (continued)
160
13. Dividends (continued)
Sub-Fund
Share
class Currency
Dividend
per share Ex-date
Payment
date
Number of
shares
Total amount
paid
Euroland Equity AD EUR 0.398213 16/07/2010 30/07/2010 8,451,457 3,365,480 ED EUR 0.280362 16/07/2010 30/07/2010 7,018 1,968 ZD EUR 0.849035 16/07/2010 30/07/2010 598,311 507,987 Euroland Equity Smaller Companies AD EUR 0.388828 16/07/2010 30/07/2010 130,955 50,919 Euroland Growth M1D EUR 0.199630 16/07/2010 30/07/2010 203,714 40,667 European Equity
AD EUR 0.414932 16/07/2010 30/07/2010 19,072 7,914 ED EUR 0.283409 16/07/2010 30/07/2010 90,739 25,716 PD EUR 0.533677 16/07/2010 30/07/2010 3,042,220 1,623,563 WD EUR 0.528354 16/07/2010 30/07/2010 27,027 14,280 ZD EUR 0.826762 16/07/2010 30/07/2010 233,768 193,271 Global Emerging Markets Equity PD USD 0.002592 16/07/2010 30/07/2010 2,027,588 5,256 WD USD 0.274743 16/07/2010 30/07/2010 7,613,263 2,091,691 ZD USD 0.231306 16/07/2010 30/07/2010 30,424 7,037 Global Equity AD USD 0.110569 16/07/2010 30/07/2010 986,784 109,108 ZD USD 0.457115 16/07/2010 30/07/2010 2,784,155 1,272,679 Latin American Equity L1D USD 0.058258 16/07/2010 30/07/2010 1,901,034 110,750 M1D USD 0.051878 16/07/2010 30/07/2010 2,982,585 154,731 Middle East and North Africa Equity AD USD 0.068761 19/07/2010 30/07/2010 27,316 1,878 Brazil Equity AD USD 0.146246 16/07/2010 30/07/2010 18,384,615 2,688,676 ED USD 0.000904 16/07/2010 30/07/2010 6,129 6 ID USD 0.443454 16/07/2010 30/07/2010 577,135 255,933
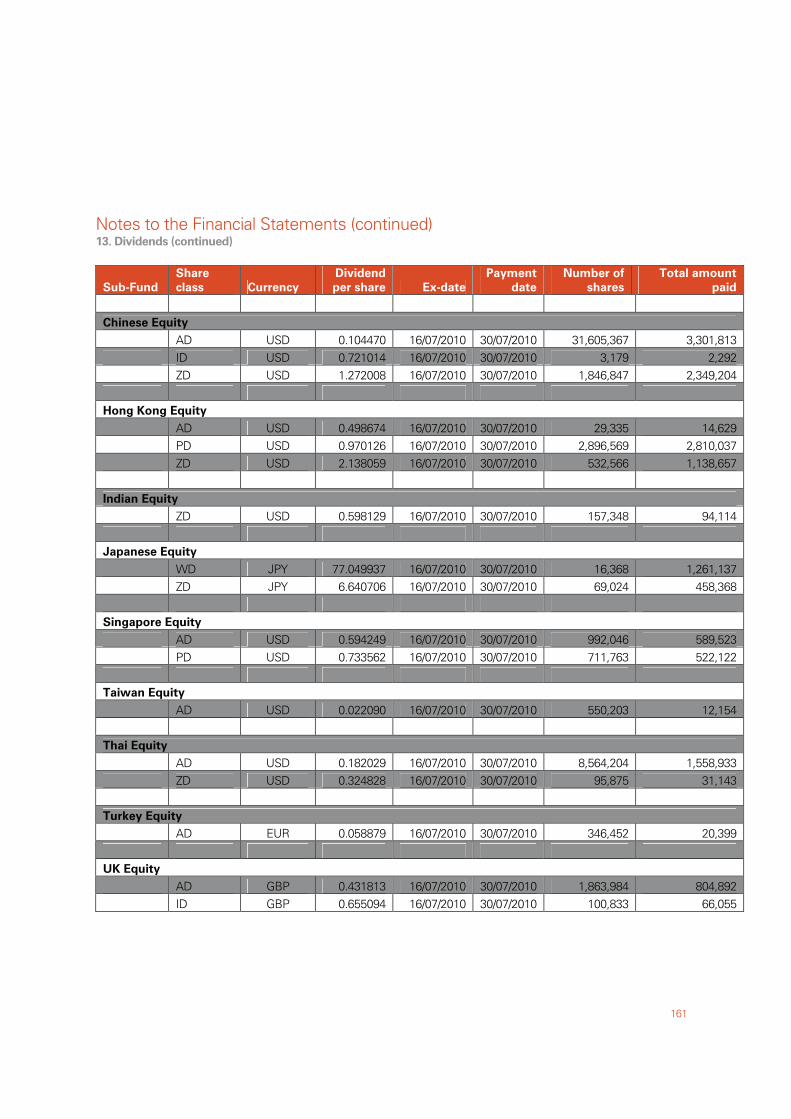
Notes to the Financial Statements (continued)
161
13. Dividends (continued)
Sub-Fund
Share
class Currency
Dividend
per share Ex-date
Payment
date
Number of
shares
Total amount
paid
Chinese Equity AD USD 0.104470 16/07/2010 30/07/2010 31,605,367 3,301,813 ID USD 0.721014 16/07/2010 30/07/2010 3,179 2,292 ZD USD 1.272008 16/07/2010 30/07/2010 1,846,847 2,349,204 Hong Kong Equity
AD USD 0.498674 16/07/2010 30/07/2010 29,335 14,629 PD USD 0.970126 16/07/2010 30/07/2010 2,896,569 2,810,037 ZD USD 2.138059 16/07/2010 30/07/2010 532,566 1,138,657 Indian Equity
ZD USD 0.598129 16/07/2010 30/07/2010 157,348 94,114 Japanese Equity
WD JPY 77.049937 16/07/2010 30/07/2010 16,368 1,261,137 ZD JPY 6.640706 16/07/2010 30/07/2010 69,024 458,368 Singapore Equity AD USD 0.594249 16/07/2010 30/07/2010 992,046 589,523 PD USD 0.733562 16/07/2010 30/07/2010 711,763 522,122 Taiwan Equity AD USD 0.022090 16/07/2010 30/07/2010 550,203 12,154 Thai Equity AD USD 0.182029 16/07/2010 30/07/2010 8,564,204 1,558,933 ZD USD 0.324828 16/07/2010 30/07/2010 95,875 31,143 Turkey Equity AD EUR 0.058879 16/07/2010 30/07/2010 346,452 20,399 UK Equity AD GBP 0.431813 16/07/2010 30/07/2010 1,863,984 804,892 ID GBP 0.655094 16/07/2010 30/07/2010 100,833 66,055
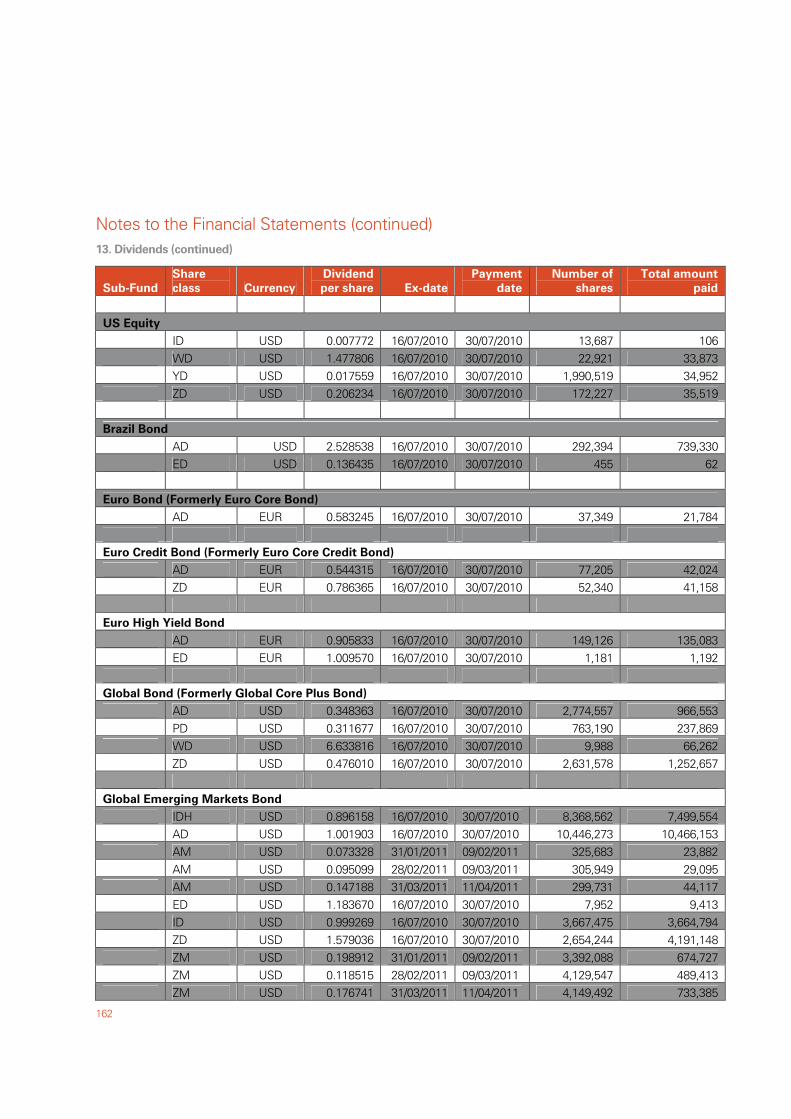
Notes to the Financial Statements (continued)
162
13. Dividends (continued)
Sub-Fund
Share
class Currency
Dividend
per share Ex-date
Payment
date
Number of
shares
Total amount
paid
US Equity ID USD 0.007772 16/07/2010 30/07/2010 13,687 106 WD USD 1.477806 16/07/2010 30/07/2010 22,921 33,873 YD USD 0.017559 16/07/2010 30/07/2010 1,990,519 34,952 ZD USD 0.206234 16/07/2010 30/07/2010 172,227 35,519 Brazil Bond AD USD 2.528538 16/07/2010 30/07/2010 292,394 739,330 ED USD 0.136435 16/07/2010 30/07/2010 455 62 Euro Bond (Formerly Euro Core Bond)
AD EUR 0.583245 16/07/2010 30/07/2010 37,349 21,784 Euro Credit Bond (Formerly Euro Core Credit Bond) AD EUR 0.544315 16/07/2010 30/07/2010 77,205 42,024 ZD EUR 0.786365 16/07/2010 30/07/2010 52,340 41,158 Euro High Yield Bond
AD EUR 0.905833 16/07/2010 30/07/2010 149,126 135,083 ED EUR 1.009570 16/07/2010 30/07/2010 1,181 1,192 Global Bond (Formerly Global Core Plus Bond) AD USD 0.348363 16/07/2010 30/07/2010 2,774,557 966,553 PD USD 0.311677 16/07/2010 30/07/2010 763,190 237,869 WD USD 6.633816 16/07/2010 30/07/2010 9,988 66,262 ZD USD 0.476010 16/07/2010 30/07/2010 2,631,578 1,252,657 Global Emerging Markets Bond
IDH USD 0.896158 16/07/2010 30/07/2010 8,368,562 7,499,554 AD USD 1.001903 16/07/2010 30/07/2010 10,446,273 10,466,153 AM USD 0.073328 31/01/2011 09/02/2011 325,683 23,882 AM USD 0.095099 28/02/2011 09/03/2011 305,949 29,095 AM USD 0.147188 31/03/2011 11/04/2011 299,731 44,117 ED USD 1.183670 16/07/2010 30/07/2010 7,952 9,413 ID USD 0.999269 16/07/2010 30/07/2010 3,667,475 3,664,794 ZD USD 1.579036 16/07/2010 30/07/2010 2,654,244 4,191,148 ZM USD 0.198912 31/01/2011 09/02/2011 3,392,088 674,727 ZM USD 0.118515 28/02/2011 09/03/2011 4,129,547 489,413 ZM USD 0.176741 31/03/2011 11/04/2011 4,149,492 733,385
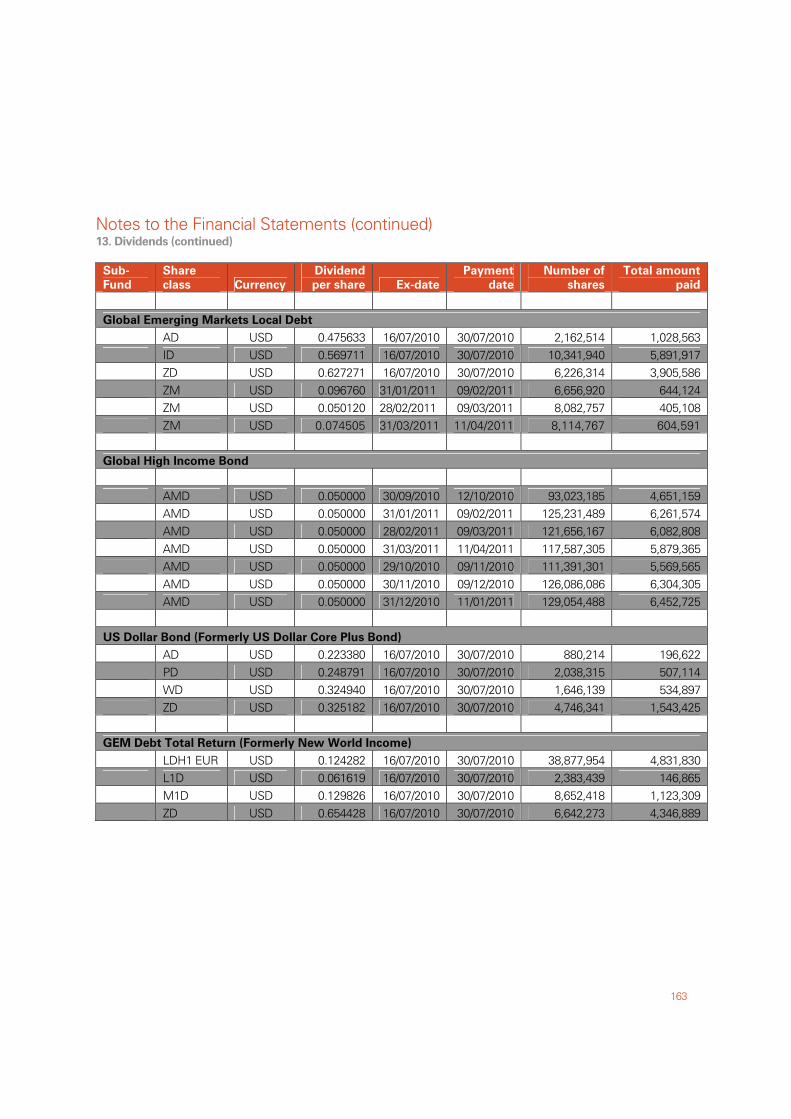
Notes to the Financial Statements (continued)
163
13. Dividends (continued)
Sub-
Fund
Share
class Currency
Dividend
per share Ex-date
Payment
date
Number of
shares
Total amount
paid
Global Emerging Markets Local Debt AD USD 0.475633 16/07/2010 30/07/2010 2,162,514 1,028,563 ID USD 0.569711 16/07/2010 30/07/2010 10,341,940 5,891,917 ZD USD 0.627271 16/07/2010 30/07/2010 6,226,314 3,905,586 ZM USD 0.096760 31/01/2011 09/02/2011 6,656,920 644,124 ZM USD 0.050120 28/02/2011 09/03/2011 8,082,757 405,108 ZM USD 0.074505 31/03/2011 11/04/2011 8,114,767 604,591 Global High Income Bond AMD USD 0.050000 30/09/2010 12/10/2010 93,023,185 4,651,159 AMD USD 0.050000 31/01/2011 09/02/2011 125,231,489 6,261,574 AMD USD 0.050000 28/02/2011 09/03/2011 121,656,167 6,082,808 AMD USD 0.050000 31/03/2011 11/04/2011 117,587,305 5,879,365 AMD USD 0.050000 29/10/2010 09/11/2010 111,391,301 5,569,565 AMD USD 0.050000 30/11/2010 09/12/2010 126,086,086 6,304,305 AMD USD 0.050000 31/12/2010 11/01/2011 129,054,488 6,452,725 US Dollar Bond (Formerly US Dollar Core Plus Bond) AD USD 0.223380 16/07/2010 30/07/2010 880,214 196,622 PD USD 0.248791 16/07/2010 30/07/2010 2,038,315 507,114 WD USD 0.324940 16/07/2010 30/07/2010 1,646,139 534,897 ZD USD 0.325182 16/07/2010 30/07/2010 4,746,341 1,543,425 GEM Debt Total Return (Formerly New World Income) LDH1 EUR USD 0.124282 16/07/2010 30/07/2010 38,877,954 4,831,830 L1D USD 0.061619 16/07/2010 30/07/2010 2,383,439 146,865 M1D USD 0.129826 16/07/2010 30/07/2010 8,652,418 1,123,309 ZD USD 0.654428 16/07/2010 30/07/2010 6,642,273 4,346,889
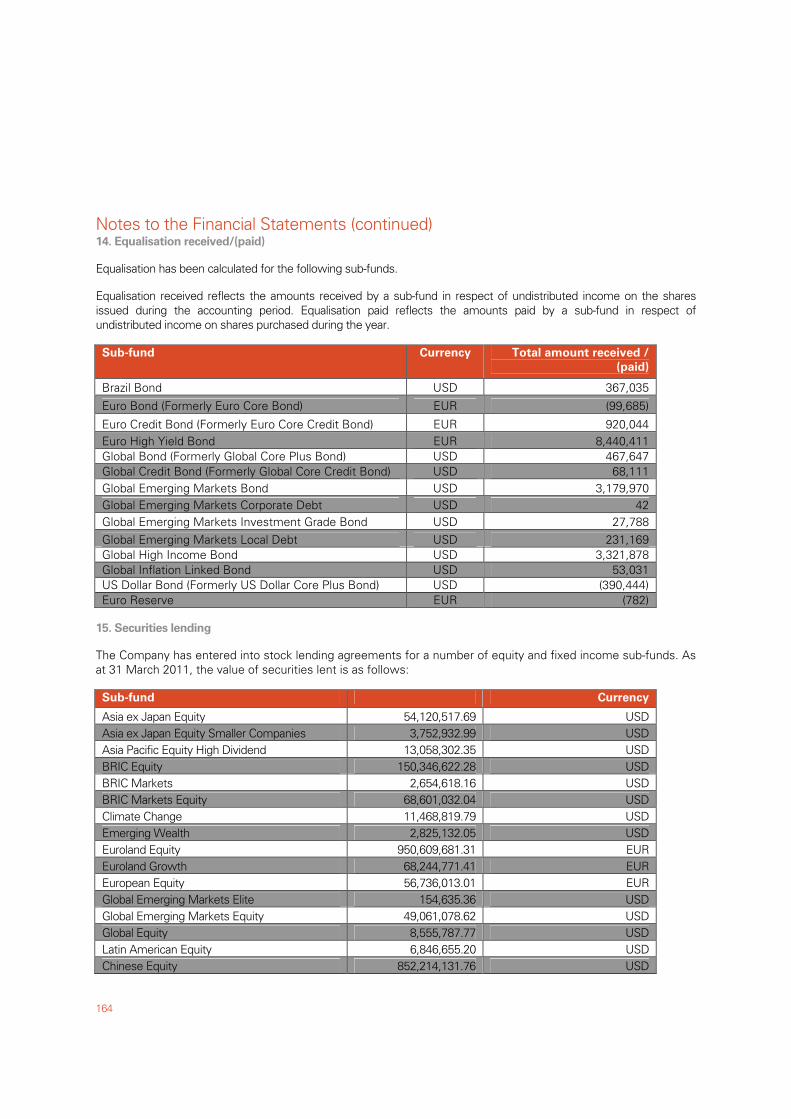
Notes to the Financial Statements (continued)
164
14. Equalisation received/(paid) Equalisation has been calculated for the following sub-funds. Equalisation received reflects the amounts received by a sub-fund in respect of undistributed income on the shares issued during the accounting period. Equalisation paid reflects the amounts paid by a sub-fund in respect of undistributed income on shares purchased during the year. Sub-fund Currency Total amount received /
(paid)
Brazil Bond USD 367,035
Euro Bond (Formerly Euro Core Bond) EUR (99,685)
Euro Credit Bond (Formerly Euro Core Credit Bond) EUR 920,044 Euro High Yield Bond EUR 8,440,411 Global Bond (Formerly Global Core Plus Bond) USD 467,647 Global Credit Bond (Formerly Global Core Credit Bond) USD 68,111 Global Emerging Markets Bond USD 3,179,970 Global Emerging Markets Corporate Debt USD 42 Global Emerging Markets Investment Grade Bond USD 27,788 Global Emerging Markets Local Debt USD 231,169 Global High Income Bond USD 3,321,878 Global Inflation Linked Bond USD 53,031 US Dollar Bond (Formerly US Dollar Core Plus Bond) USD (390,444) Euro Reserve EUR (782)
15. Securities lending The Company has entered into stock lending agreements for a number of equity and fixed income sub-funds. As at 31 March 2011, the value of securities lent is as follows: Sub-fund Currency
Asia ex Japan Equity 54,120,517.69 USD Asia ex Japan Equity Smaller Companies 3,752,932.99 USD Asia Pacific Equity High Dividend 13,058,302.35 USD BRIC Equity 150,346,622.28 USD BRIC Markets 2,654,618.16 USD BRIC Markets Equity 68,601,032.04 USD Climate Change 11,468,819.79 USD Emerging Wealth 2,825,132.05 USD Euroland Equity 950,609,681.31 EUR Euroland Growth 68,244,771.41 EUR European Equity 56,736,013.01 EUR Global Emerging Markets Elite 154,635.36 USD Global Emerging Markets Equity 49,061,078.62 USD Global Equity 8,555,787.77 USD Latin American Equity 6,846,655.20 USD Chinese Equity 852,214,131.76 USD
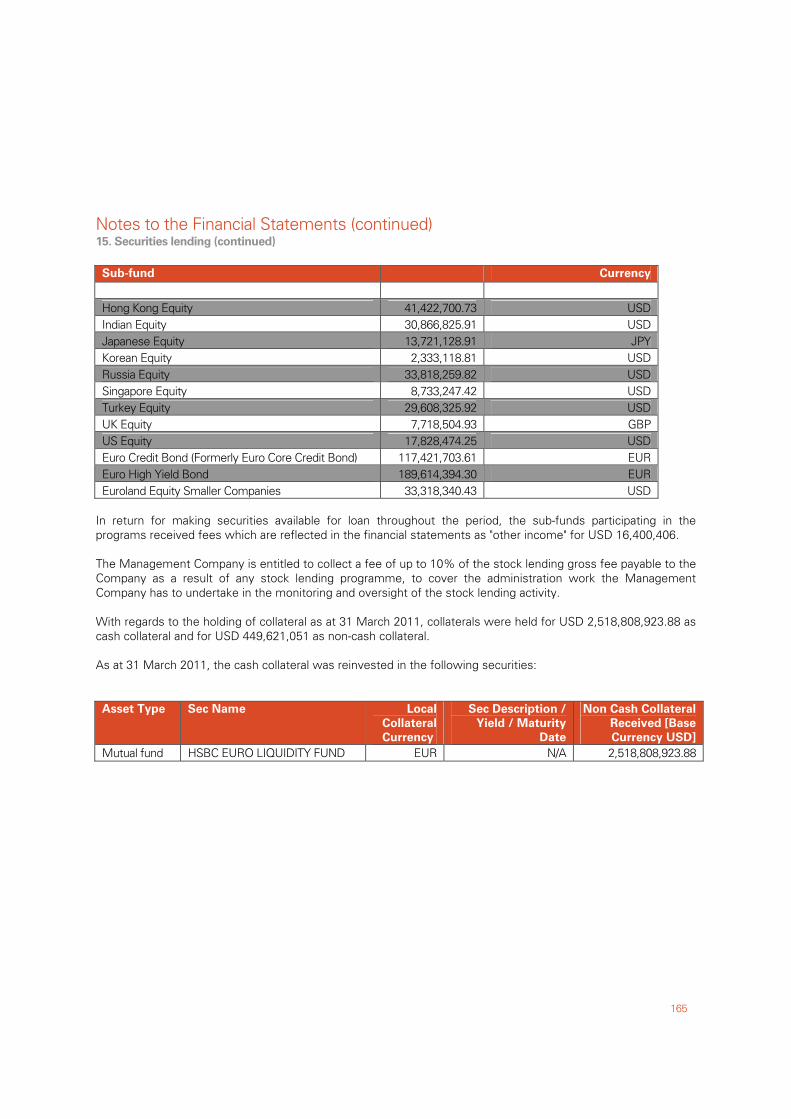
Notes to the Financial Statements (continued)
165
15. Securities lending (continued) Sub-fund Currency
Hong Kong Equity 41,422,700.73 USD Indian Equity 30,866,825.91 USD Japanese Equity 13,721,128.91 JPY Korean Equity 2,333,118.81 USD Russia Equity 33,818,259.82 USD Singapore Equity 8,733,247.42 USD Turkey Equity 29,608,325.92 USD UK Equity 7,718,504.93 GBP US Equity 17,828,474.25 USD Euro Credit Bond (Formerly Euro Core Credit Bond) 117,421,703.61 EUR Euro High Yield Bond 189,614,394.30 EUR Euroland Equity Smaller Companies 33,318,340.43 USD
In return for making securities available for loan throughout the period, the sub-funds participating in the programs received fees which are reflected in the financial statements as "other income" for USD 16,400,406. The Management Company is entitled to collect a fee of up to 10% of the stock lending gross fee payable to the Company as a result of any stock lending programme, to cover the administration work the Management Company has to undertake in the monitoring and oversight of the stock lending activity. With regards to the holding of collateral as at 31 March 2011, collaterals were held for USD 2,518,808,923.88 as cash collateral and for USD 449,621,051 as non-cash collateral. As at 31 March 2011, the cash collateral was reinvested in the following securities: Asset Type Sec Name Local
Collateral
Currency
Sec Description /
Yield / Maturity
Date
Non Cash Collateral
Received [Base
Currency USD]
Mutual fund HSBC EURO LIQUIDITY FUND EUR N/A 2,518,808,923.88
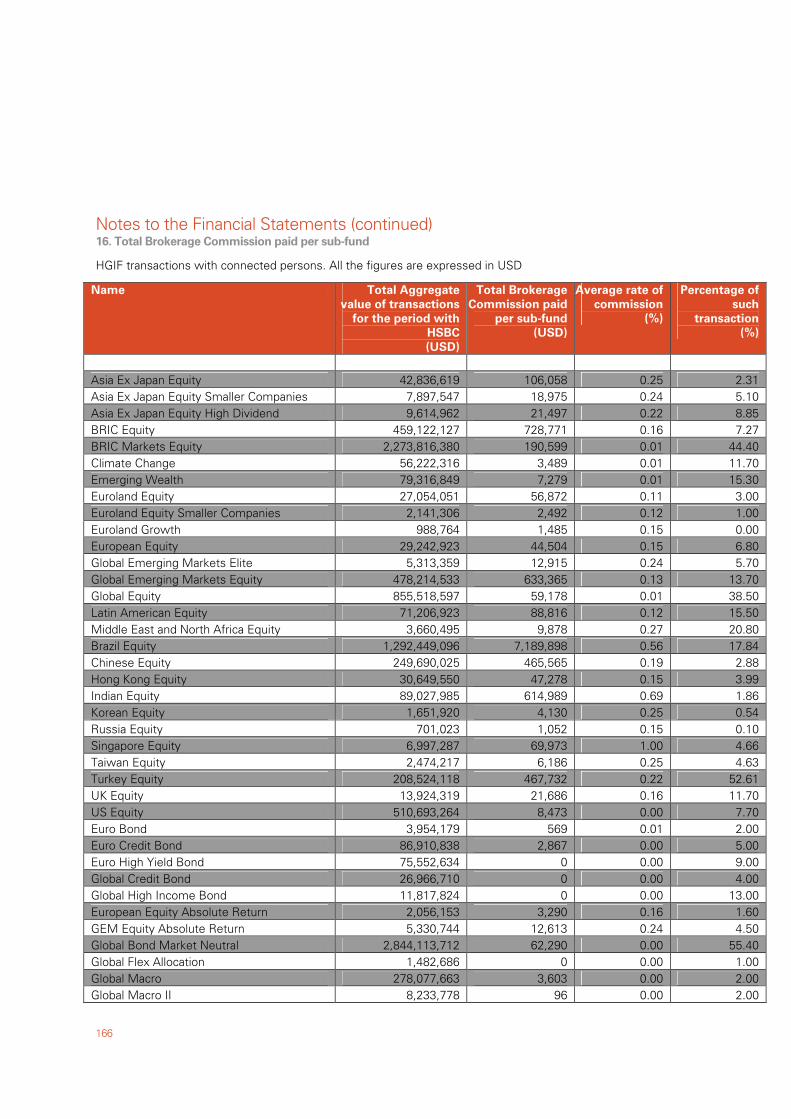
Notes to the Financial Statements (continued)
166
16. Total Brokerage Commission paid per sub-fund
HGIF transactions with connected persons. All the figures are expressed in USD
Name Total Aggregate
value of transactions
for the period with
HSBC
(USD)
Total Brokerage
Commission paid
per sub-fund
(USD)
Average rate of
commission
(%)
Percentage of
such
transaction
(%)
Asia Ex Japan Equity 42,836,619 106,058 0.25 2.31 Asia Ex Japan Equity Smaller Companies 7,897,547 18,975 0.24 5.10 Asia Ex Japan Equity High Dividend 9,614,962 21,497 0.22 8.85 BRIC Equity 459,122,127 728,771 0.16 7.27 BRIC Markets Equity 2,273,816,380 190,599 0.01 44.40 Climate Change 56,222,316 3,489 0.01 11.70 Emerging Wealth 79,316,849 7,279 0.01 15.30 Euroland Equity 27,054,051 56,872 0.11 3.00 Euroland Equity Smaller Companies 2,141,306 2,492 0.12 1.00 Euroland Growth 988,764 1,485 0.15 0.00 European Equity 29,242,923 44,504 0.15 6.80 Global Emerging Markets Elite 5,313,359 12,915 0.24 5.70 Global Emerging Markets Equity 478,214,533 633,365 0.13 13.70 Global Equity 855,518,597 59,178 0.01 38.50 Latin American Equity 71,206,923 88,816 0.12 15.50 Middle East and North Africa Equity 3,660,495 9,878 0.27 20.80 Brazil Equity 1,292,449,096 7,189,898 0.56 17.84 Chinese Equity 249,690,025 465,565 0.19 2.88 Hong Kong Equity 30,649,550 47,278 0.15 3.99 Indian Equity 89,027,985 614,989 0.69 1.86 Korean Equity 1,651,920 4,130 0.25 0.54 Russia Equity 701,023 1,052 0.15 0.10 Singapore Equity 6,997,287 69,973 1.00 4.66 Taiwan Equity 2,474,217 6,186 0.25 4.63 Turkey Equity 208,524,118 467,732 0.22 52.61 UK Equity 13,924,319 21,686 0.16 11.70 US Equity 510,693,264 8,473 0.00 7.70 Euro Bond 3,954,179 569 0.01 2.00 Euro Credit Bond 86,910,838 2,867 0.00 5.00 Euro High Yield Bond 75,552,634 0 0.00 9.00 Global Credit Bond 26,966,710 0 0.00 4.00 Global High Income Bond 11,817,824 0 0.00 13.00 European Equity Absolute Return 2,056,153 3,290 0.16 1.60 GEM Equity Absolute Return 5,330,744 12,613 0.24 4.50 Global Bond Market Neutral 2,844,113,712 62,290 0.00 55.40 Global Flex Allocation 1,482,686 0 0.00 1.00 Global Macro 278,077,663 3,603 0.00 2.00 Global Macro II 8,233,778 96 0.00 2.00
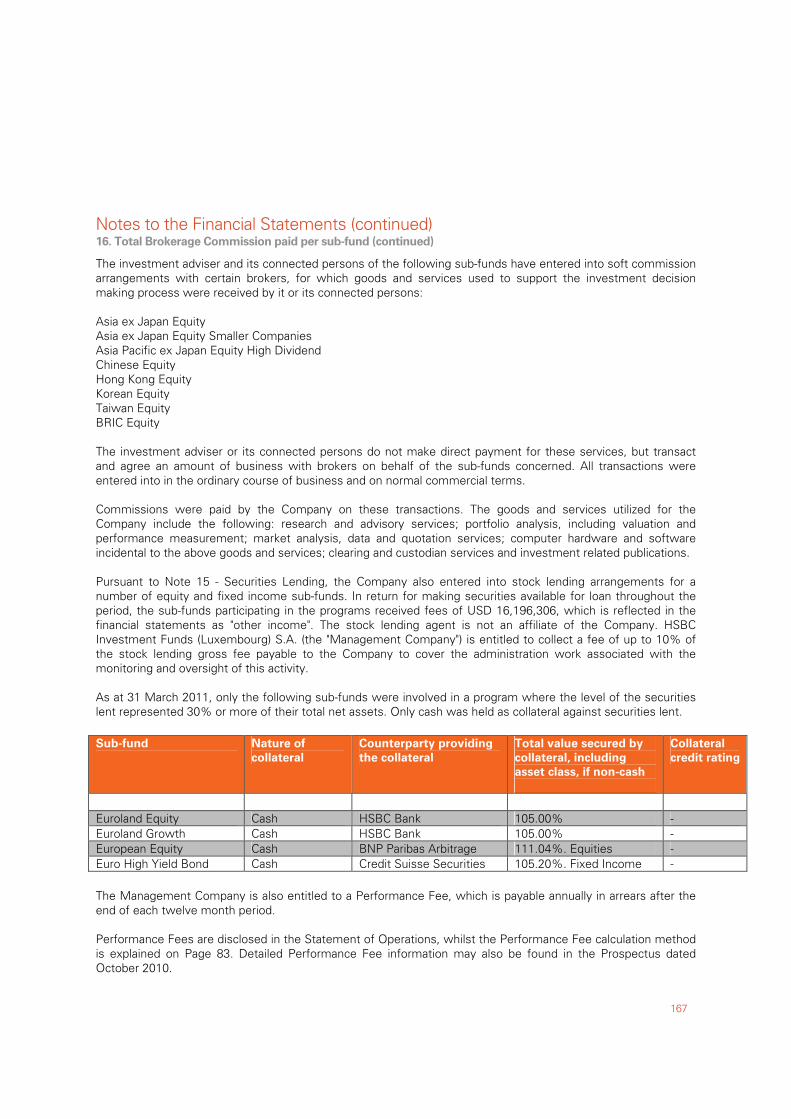
Notes to the Financial Statements (continued)
167
16. Total Brokerage Commission paid per sub-fund (continued)
The investment adviser and its connected persons of the following sub-funds have entered into soft commission arrangements with certain brokers, for which goods and services used to support the investment decision making process were received by it or its connected persons: Asia ex Japan Equity Asia ex Japan Equity Smaller Companies Asia Pacific ex Japan Equity High Dividend Chinese Equity Hong Kong Equity Korean Equity Taiwan Equity BRIC Equity The investment adviser or its connected persons do not make direct payment for these services, but transact and agree an amount of business with brokers on behalf of the sub-funds concerned. All transactions were entered into in the ordinary course of business and on normal commercial terms. Commissions were paid by the Company on these transactions. The goods and services utilized for the Company include the following: research and advisory services; portfolio analysis, including valuation and performance measurement; market analysis, data and quotation services; computer hardware and software incidental to the above goods and services; clearing and custodian services and investment related publications. Pursuant to Note 15 - Securities Lending, the Company also entered into stock lending arrangements for a number of equity and fixed income sub-funds. In return for making securities available for loan throughout the period, the sub-funds participating in the programs received fees of USD 16,196,306, which is reflected in the financial statements as "other income". The stock lending agent is not an affiliate of the Company. HSBC Investment Funds (Luxembourg) S.A. (the "Management Company") is entitled to collect a fee of up to 10% of the stock lending gross fee payable to the Company to cover the administration work associated with the monitoring and oversight of this activity. As at 31 March 2011, only the following sub-funds were involved in a program where the level of the securities lent represented 30% or more of their total net assets. Only cash was held as collateral against securities lent. Sub-fund
Nature of
collateral
Counterparty providing
the collateral
Total value secured by
collateral, including
asset class, if non-cash
Collateral
credit rating
Euroland Equity Cash HSBC Bank 105.00% - Euroland Growth Cash HSBC Bank 105.00% - European Equity Cash BNP Paribas Arbitrage 111.04%. Equities - Euro High Yield Bond Cash Credit Suisse Securities 105.20%. Fixed Income - The Management Company is also entitled to a Performance Fee, which is payable annually in arrears after the end of each twelve month period. Performance Fees are disclosed in the Statement of Operations, whilst the Performance Fee calculation method is explained on Page 83. Detailed Performance Fee information may also be found in the Prospectus dated October 2010.
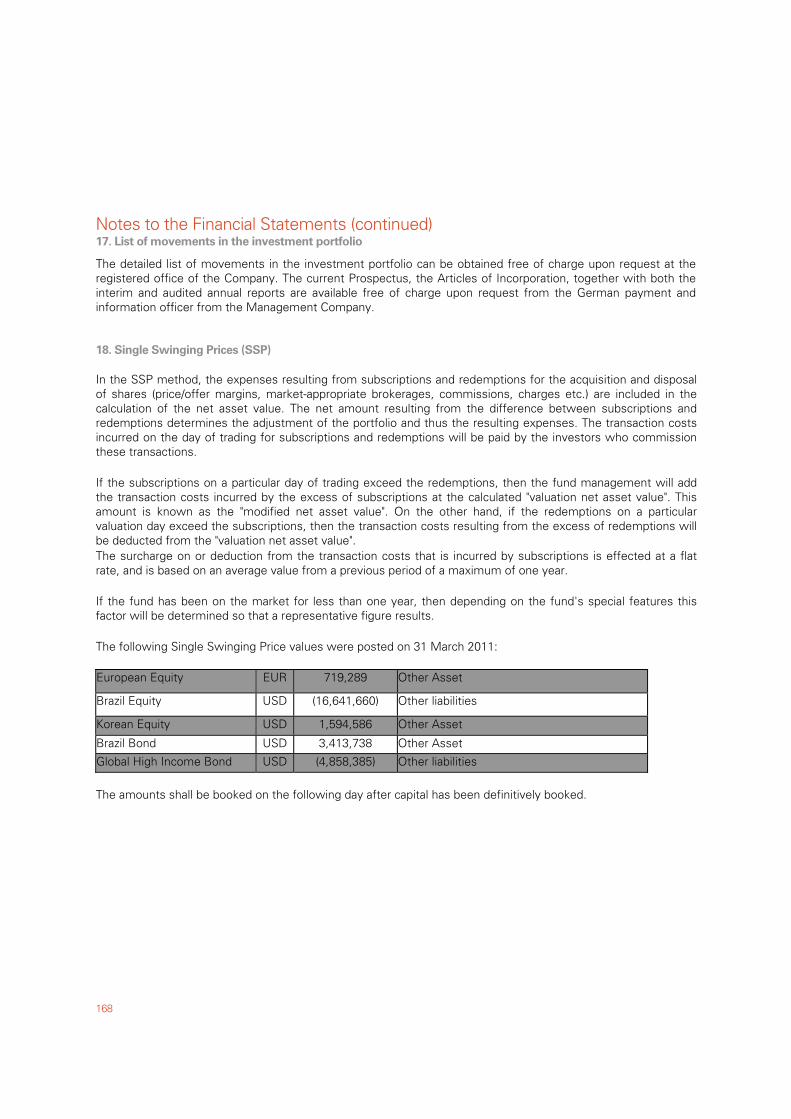
Notes to the Financial Statements (continued)
168
17. List of movements in the investment portfolio
The detailed list of movements in the investment portfolio can be obtained free of charge upon request at the registered office of the Company. The current Prospectus, the Articles of Incorporation, together with both the interim and audited annual reports are available free of charge upon request from the German payment and information officer from the Management Company.
18. Single Swinging Prices (SSP)
In the SSP method, the expenses resulting from subscriptions and redemptions for the acquisition and disposal of shares (price/offer margins, market-appropriate brokerages, commissions, charges etc.) are included in the calculation of the net asset value. The net amount resulting from the difference between subscriptions and redemptions determines the adjustment of the portfolio and thus the resulting expenses. The transaction costs incurred on the day of trading for subscriptions and redemptions will be paid by the investors who commission these transactions. If the subscriptions on a particular day of trading exceed the redemptions, then the fund management will add the transaction costs incurred by the excess of subscriptions at the calculated "valuation net asset value". This amount is known as the "modified net asset value". On the other hand, if the redemptions on a particular valuation day exceed the subscriptions, then the transaction costs resulting from the excess of redemptions will be deducted from the "valuation net asset value". The surcharge on or deduction from the transaction costs that is incurred by subscriptions is effected at a flat rate, and is based on an average value from a previous period of a maximum of one year. If the fund has been on the market for less than one year, then depending on the fund's special features this factor will be determined so that a representative figure results. The following Single Swinging Price values were posted on 31 March 2011: European Equity EUR 719,289 Other Asset
Brazil Equity USD (16,641,660) Other liabilities
Korean Equity USD 1,594,586 Other Asset
Brazil Bond USD 3,413,738 Other Asset
Global High Income Bond USD (4,858,385) Other liabilities
The amounts shall be booked on the following day after capital has been definitively booked.
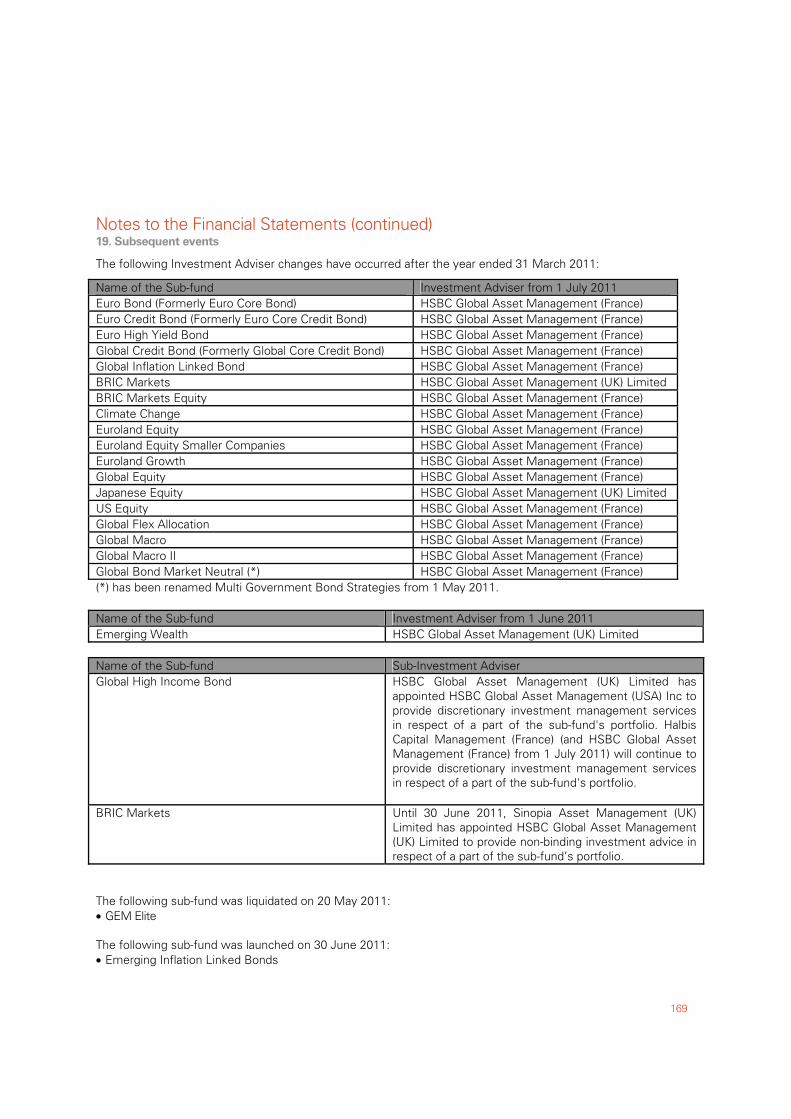
Notes to the Financial Statements (continued)
169
19. Subsequent events
The following Investment Adviser changes have occurred after the year ended 31 March 2011:
Name of the Sub-fund Investment Adviser from 1 July 2011 Euro Bond (Formerly Euro Core Bond) HSBC Global Asset Management (France) Euro Credit Bond (Formerly Euro Core Credit Bond) HSBC Global Asset Management (France) Euro High Yield Bond HSBC Global Asset Management (France) Global Credit Bond (Formerly Global Core Credit Bond) HSBC Global Asset Management (France) Global Inflation Linked Bond HSBC Global Asset Management (France) BRIC Markets HSBC Global Asset Management (UK) Limited BRIC Markets Equity HSBC Global Asset Management (France) Climate Change HSBC Global Asset Management (France) Euroland Equity HSBC Global Asset Management (France) Euroland Equity Smaller Companies HSBC Global Asset Management (France) Euroland Growth HSBC Global Asset Management (France) Global Equity HSBC Global Asset Management (France) Japanese Equity HSBC Global Asset Management (UK) Limited US Equity HSBC Global Asset Management (France) Global Flex Allocation HSBC Global Asset Management (France) Global Macro HSBC Global Asset Management (France) Global Macro II HSBC Global Asset Management (France) Global Bond Market Neutral (*) HSBC Global Asset Management (France) (*) has been renamed Multi Government Bond Strategies from 1 May 2011. Name of the Sub-fund Investment Adviser from 1 June 2011 Emerging Wealth HSBC Global Asset Management (UK) Limited Name of the Sub-fund Sub-Investment Adviser Global High Income Bond HSBC Global Asset Management (UK) Limited has
appointed HSBC Global Asset Management (USA) Inc to provide discretionary investment management services in respect of a part of the sub-fund's portfolio. Halbis Capital Management (France) (and HSBC Global Asset Management (France) from 1 July 2011) will continue to provide discretionary investment management services in respect of a part of the sub-fund's portfolio.
BRIC Markets Until 30 June 2011, Sinopia Asset Management (UK) Limited has appointed HSBC Global Asset Management (UK) Limited to provide non-binding investment advice in respect of a part of the sub-fund’s portfolio.
The following sub-fund was liquidated on 20 May 2011: • GEM Elite The following sub-fund was launched on 30 June 2011: • Emerging Inflation Linked Bonds
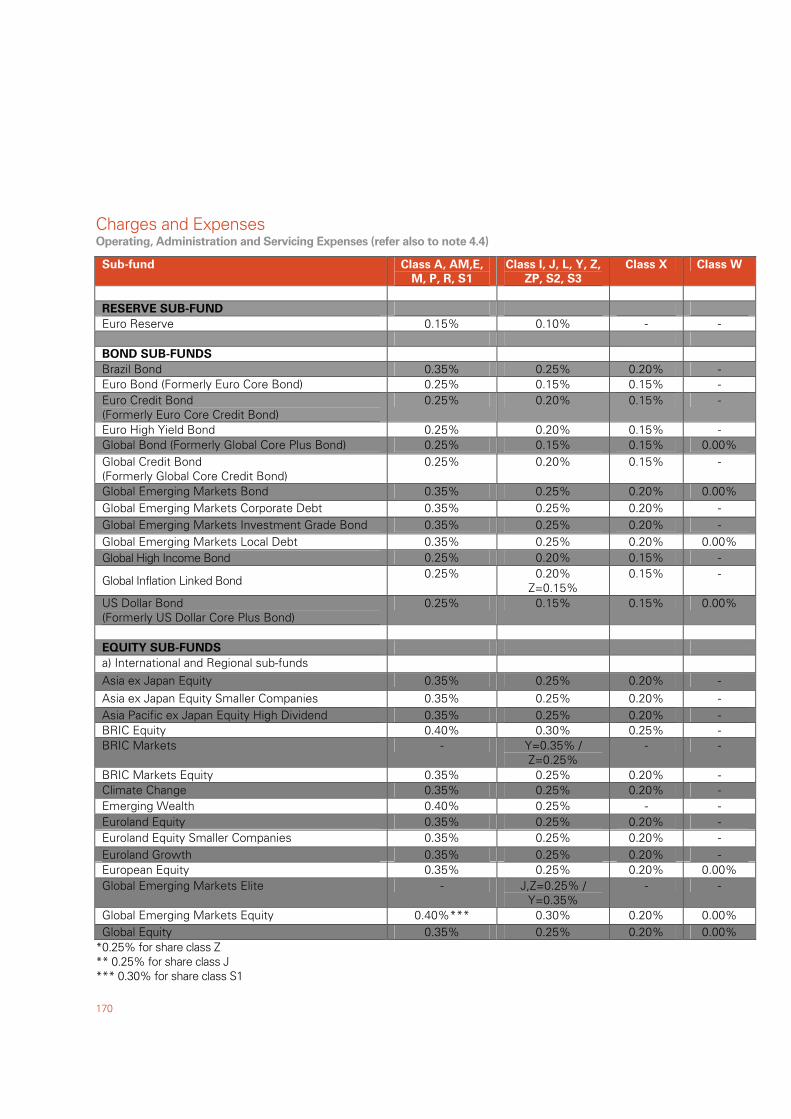
Charges and Expenses
170
Operating, Administration and Servicing Expenses (refer also to note 4.4)
Sub-fund Class A, AM,E,
M, P, R, S1
Class I, J, L, Y, Z,
ZP, S2, S3
Class X Class W
RESERVE SUB-FUND Euro Reserve 0.15% 0.10% - - BOND SUB-FUNDS Brazil Bond 0.35% 0.25% 0.20% - Euro Bond (Formerly Euro Core Bond) 0.25% 0.15% 0.15% - Euro Credit Bond (Formerly Euro Core Credit Bond)
0.25% 0.20% 0.15% -
Euro High Yield Bond 0.25% 0.20% 0.15% - Global Bond (Formerly Global Core Plus Bond) 0.25% 0.15% 0.15% 0.00% Global Credit Bond (Formerly Global Core Credit Bond)
0.25% 0.20% 0.15% -
Global Emerging Markets Bond 0.35% 0.25% 0.20% 0.00% Global Emerging Markets Corporate Debt 0.35% 0.25% 0.20% - Global Emerging Markets Investment Grade Bond 0.35% 0.25% 0.20% - Global Emerging Markets Local Debt 0.35% 0.25% 0.20% 0.00% Global High Income Bond 0.25% 0.20% 0.15% -
Global Inflation Linked Bond 0.25% 0.20% Z=0.15%
0.15% -
US Dollar Bond (Formerly US Dollar Core Plus Bond)
0.25% 0.15% 0.15% 0.00%
EQUITY SUB-FUNDS a) International and Regional sub-funds Asia ex Japan Equity 0.35% 0.25% 0.20% - Asia ex Japan Equity Smaller Companies 0.35% 0.25% 0.20% - Asia Pacific ex Japan Equity High Dividend 0.35% 0.25% 0.20% - BRIC Equity 0.40% 0.30% 0.25% - BRIC Markets - Y=0.35% /
Z=0.25% - -
BRIC Markets Equity 0.35% 0.25% 0.20% - Climate Change 0.35% 0.25% 0.20% - Emerging Wealth 0.40% 0.25% - - Euroland Equity 0.35% 0.25% 0.20% - Euroland Equity Smaller Companies 0.35% 0.25% 0.20% - Euroland Growth 0.35% 0.25% 0.20% - European Equity 0.35% 0.25% 0.20% 0.00% Global Emerging Markets Elite - J,Z=0.25% /
Y=0.35% - -
Global Emerging Markets Equity 0.40%*** 0.30% 0.20% 0.00% Global Equity 0.35% 0.25% 0.20% 0.00%
*0.25% for share class Z ** 0.25% for share class J *** 0.30% for share class S1
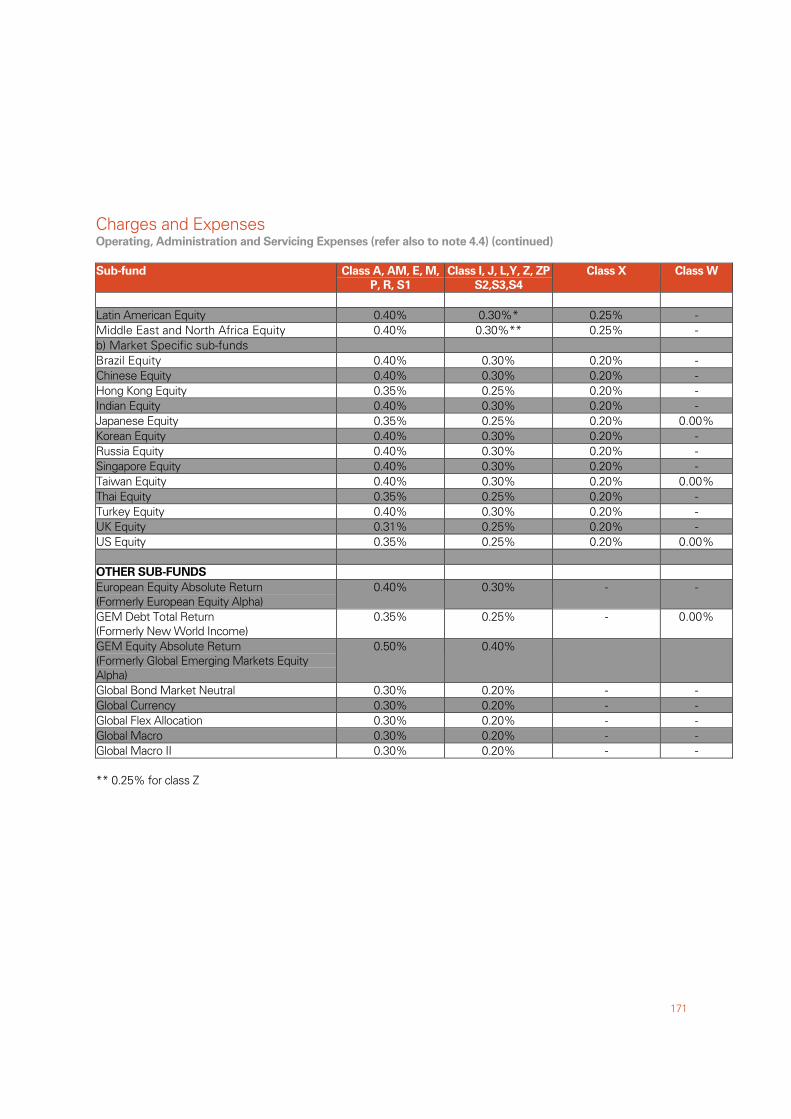
Charges and Expenses
171
Operating, Administration and Servicing Expenses (refer also to note 4.4) (continued)
Sub-fund Class A, AM, E, M,
P, R, S1
Class I, J, L,Y, Z, ZP
S2,S3,S4
Class X Class W
Latin American Equity 0.40% 0.30%* 0.25% - Middle East and North Africa Equity 0.40% 0.30%** 0.25% - b) Market Specific sub-funds Brazil Equity 0.40% 0.30% 0.20% - Chinese Equity 0.40% 0.30% 0.20% - Hong Kong Equity 0.35% 0.25% 0.20% - Indian Equity 0.40% 0.30% 0.20% - Japanese Equity 0.35% 0.25% 0.20% 0.00% Korean Equity 0.40% 0.30% 0.20% - Russia Equity 0.40% 0.30% 0.20% - Singapore Equity 0.40% 0.30% 0.20% - Taiwan Equity 0.40% 0.30% 0.20% 0.00% Thai Equity 0.35% 0.25% 0.20% - Turkey Equity 0.40% 0.30% 0.20% - UK Equity 0.31% 0.25% 0.20% - US Equity 0.35% 0.25% 0.20% 0.00% OTHER SUB-FUNDS European Equity Absolute Return (Formerly European Equity Alpha)
0.40% 0.30% - -
GEM Debt Total Return
(Formerly New World Income) 0.35% 0.25% - 0.00%
GEM Equity Absolute Return (Formerly Global Emerging Markets Equity Alpha)
0.50% 0.40%
Global Bond Market Neutral 0.30% 0.20% - - Global Currency 0.30% 0.20% - - Global Flex Allocation 0.30% 0.20% - - Global Macro 0.30% 0.20% - - Global Macro II 0.30% 0.20% - - ** 0.25% for class Z
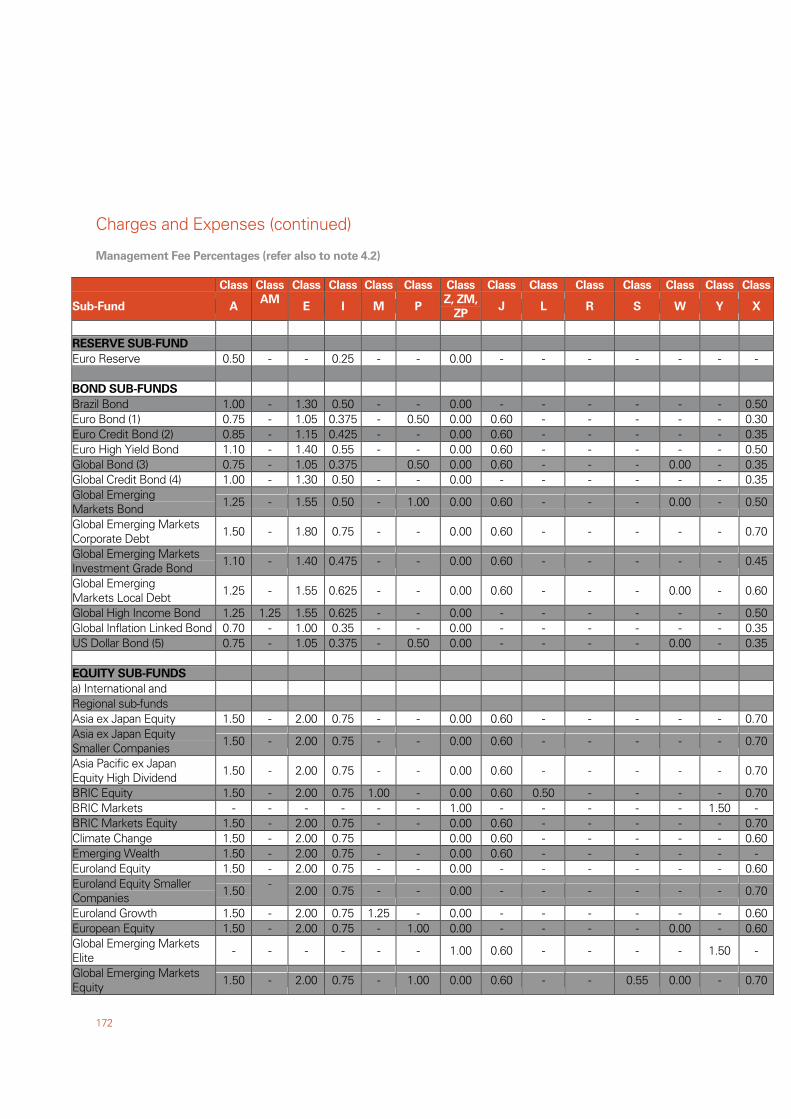
Charges and Expenses (continued)
172
Management Fee Percentages (refer also to note 4.2)
Class Class Class Class Class Class Class Class Class Class Class Class Class Class
Sub-Fund A AM
E I M P Z, ZM,
ZP J L R S W Y X
RESERVE SUB-FUND Euro Reserve 0.50 - - 0.25 - - 0.00 - - - - - - - BOND SUB-FUNDS Brazil Bond 1.00 - 1.30 0.50 - - 0.00 - - - - - - 0.50Euro Bond (1) 0.75 - 1.05 0.375 - 0.50 0.00 0.60 - - - - - 0.30Euro Credit Bond (2) 0.85 - 1.15 0.425 - - 0.00 0.60 - - - - - 0.35Euro High Yield Bond 1.10 - 1.40 0.55 - - 0.00 0.60 - - - - - 0.50Global Bond (3) 0.75 - 1.05 0.375 0.50 0.00 0.60 - - - 0.00 - 0.35Global Credit Bond (4) 1.00 - 1.30 0.50 - - 0.00 - - - - - - 0.35Global Emerging Markets Bond 1.25 - 1.55 0.50 - 1.00 0.00 0.60 - - - 0.00 - 0.50
Global Emerging Markets Corporate Debt 1.50 - 1.80 0.75 - - 0.00 0.60 - - - - - 0.70
Global Emerging Markets Investment Grade Bond 1.10 - 1.40 0.475 - - 0.00 0.60 - - - - - 0.45
Global Emerging Markets Local Debt 1.25 - 1.55 0.625 - - 0.00 0.60 - - - 0.00 - 0.60
Global High Income Bond 1.25 1.25 1.55 0.625 - - 0.00 - - - - - - 0.50Global Inflation Linked Bond 0.70 - 1.00 0.35 - - 0.00 - - - - - - 0.35US Dollar Bond (5) 0.75 - 1.05 0.375 - 0.50 0.00 - - - - 0.00 - 0.35 EQUITY SUB-FUNDS a) International and Regional sub-funds Asia ex Japan Equity 1.50 - 2.00 0.75 - - 0.00 0.60 - - - - - 0.70Asia ex Japan Equity Smaller Companies 1.50 - 2.00 0.75 - - 0.00 0.60 - - - - - 0.70
Asia Pacific ex Japan Equity High Dividend 1.50 - 2.00 0.75 - - 0.00 0.60 - - - - - 0.70
BRIC Equity 1.50 - 2.00 0.75 1.00 - 0.00 0.60 0.50 - - - - 0.70BRIC Markets - - - - - - 1.00 - - - - - 1.50 - BRIC Markets Equity 1.50 - 2.00 0.75 - - 0.00 0.60 - - - - - 0.70Climate Change 1.50 - 2.00 0.75 0.00 0.60 - - - - - 0.60Emerging Wealth 1.50 - 2.00 0.75 - - 0.00 0.60 - - - - - - Euroland Equity 1.50 - 2.00 0.75 - - 0.00 - - - - - - 0.60Euroland Equity Smaller Companies 1.50 - 2.00 0.75 - - 0.00 - - - - - - 0.70
Euroland Growth 1.50 - 2.00 0.75 1.25 - 0.00 - - - - - - 0.60European Equity 1.50 - 2.00 0.75 - 1.00 0.00 - - - - 0.00 - 0.60Global Emerging Markets Elite - - - - - - 1.00 0.60 - - - - 1.50 -
Global Emerging Markets Equity 1.50 - 2.00 0.75 - 1.00 0.00 0.60 - - 0.55 0.00 - 0.70
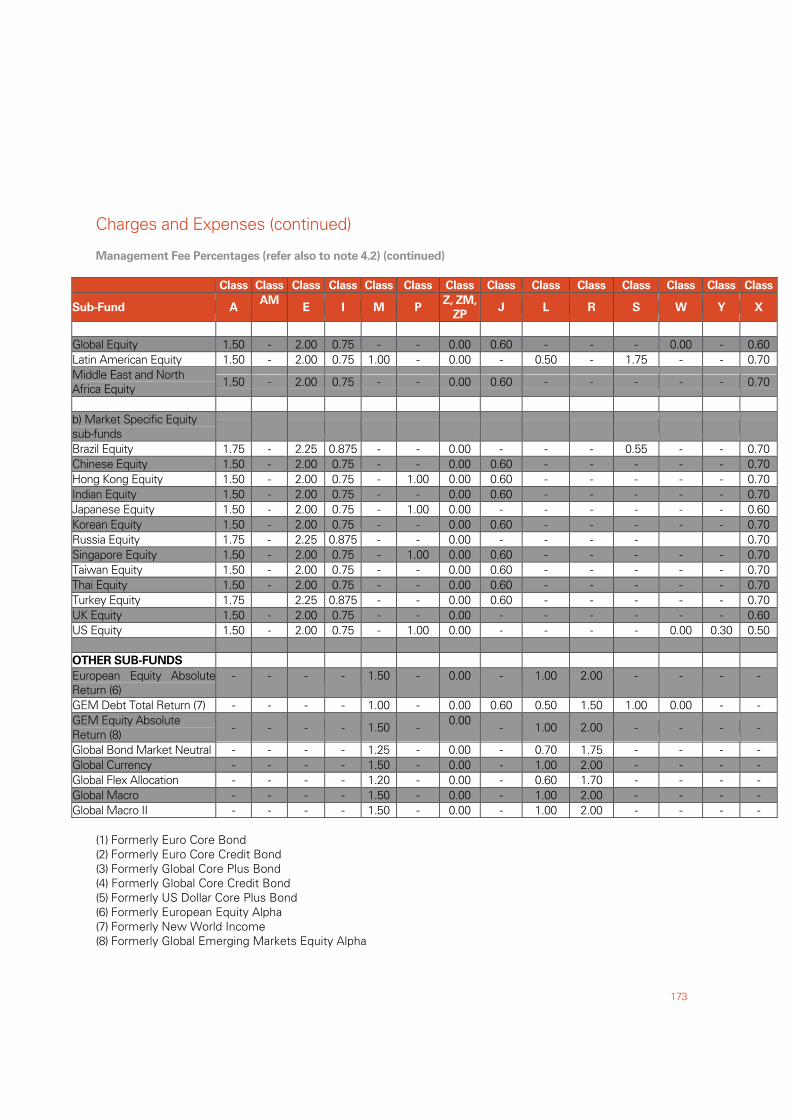
Charges and Expenses (continued)
173
Management Fee Percentages (refer also to note 4.2) (continued)
Class Class Class Class Class Class Class Class Class Class Class Class Class Class
Sub-Fund A AM
E I M P Z, ZM,
ZP J L R S W Y X
Global Equity 1.50 - 2.00 0.75 - - 0.00 0.60 - - - 0.00 - 0.60 Latin American Equity 1.50 - 2.00 0.75 1.00 - 0.00 - 0.50 - 1.75 - - 0.70 Middle East and North Africa Equity 1.50 - 2.00 0.75 - - 0.00 0.60 - - - - - 0.70
b) Market Specific Equity sub-funds
Brazil Equity 1.75 - 2.25 0.875 - - 0.00 - - - 0.55 - - 0.70 Chinese Equity 1.50 - 2.00 0.75 - - 0.00 0.60 - - - - - 0.70 Hong Kong Equity 1.50 - 2.00 0.75 - 1.00 0.00 0.60 - - - - - 0.70 Indian Equity 1.50 - 2.00 0.75 - - 0.00 0.60 - - - - - 0.70 Japanese Equity 1.50 - 2.00 0.75 - 1.00 0.00 - - - - - - 0.60 Korean Equity 1.50 - 2.00 0.75 - - 0.00 0.60 - - - - - 0.70 Russia Equity 1.75 - 2.25 0.875 - - 0.00 - - - - 0.70 Singapore Equity 1.50 - 2.00 0.75 - 1.00 0.00 0.60 - - - - - 0.70 Taiwan Equity 1.50 - 2.00 0.75 - - 0.00 0.60 - - - - - 0.70 Thai Equity 1.50 - 2.00 0.75 - - 0.00 0.60 - - - - - 0.70 Turkey Equity 1.75 2.25 0.875 - - 0.00 0.60 - - - - - 0.70 UK Equity 1.50 - 2.00 0.75 - - 0.00 - - - - - - 0.60 US Equity 1.50 - 2.00 0.75 - 1.00 0.00 - - - - 0.00 0.30 0.50 OTHER SUB-FUNDS European Equity Absolute Return (6)
- - - - 1.50 - 0.00 - 1.00 2.00 - - - -
GEM Debt Total Return (7) - - - - 1.00 - 0.00 0.60 0.50 1.50 1.00 0.00 - - GEM Equity Absolute Return (8) - - - - 1.50 - 0.00 - 1.00 2.00 - - - -
Global Bond Market Neutral - - - - 1.25 - 0.00 - 0.70 1.75 - - - - Global Currency - - - - 1.50 - 0.00 - 1.00 2.00 - - - - Global Flex Allocation - - - - 1.20 - 0.00 - 0.60 1.70 - - - - Global Macro - - - - 1.50 - 0.00 - 1.00 2.00 - - - - Global Macro II - - - - 1.50 - 0.00 - 1.00 2.00 - - - -
(1) Formerly Euro Core Bond (2) Formerly Euro Core Credit Bond (3) Formerly Global Core Plus Bond (4) Formerly Global Core Credit Bond (5) Formerly US Dollar Core Plus Bond (6) Formerly European Equity Alpha (7) Formerly New World Income (8) Formerly Global Emerging Markets Equity Alpha
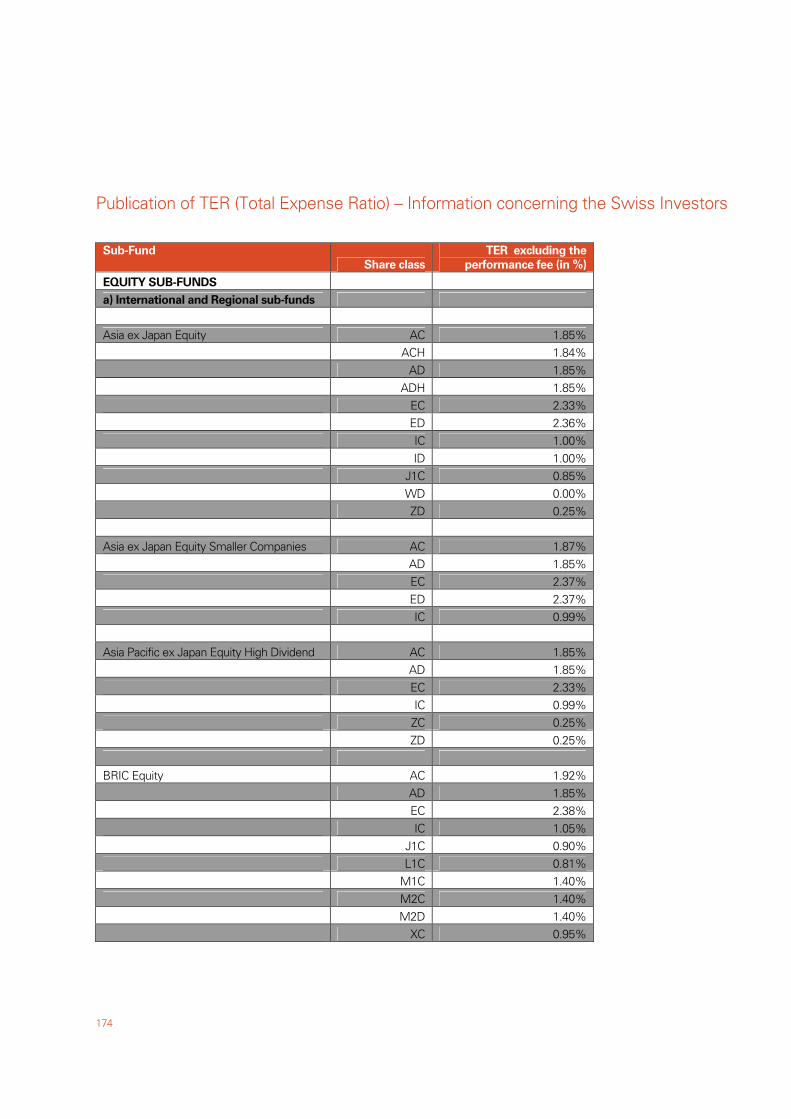
Publication of TER (Total Expense Ratio) – Information concerning the Swiss Investors
174
Sub-Fund
Share class
TER excluding the
performance fee (in %)
EQUITY SUB-FUNDS
a) International and Regional sub-funds
Asia ex Japan Equity AC 1.85% ACH 1.84% AD 1.85% ADH 1.85% EC 2.33% ED 2.36% IC 1.00% ID 1.00% J1C 0.85% WD 0.00% ZD 0.25% Asia ex Japan Equity Smaller Companies AC 1.87% AD 1.85% EC 2.37% ED 2.37% IC 0.99% Asia Pacific ex Japan Equity High Dividend AC 1.85% AD 1.85% EC 2.33% IC 0.99% ZC 0.25% ZD 0.25% BRIC Equity AC 1.92% AD 1.85% EC 2.38% IC 1.05% J1C 0.90% L1C 0.81% M1C 1.40% M2C 1.40% M2D 1.40% XC 0.95%
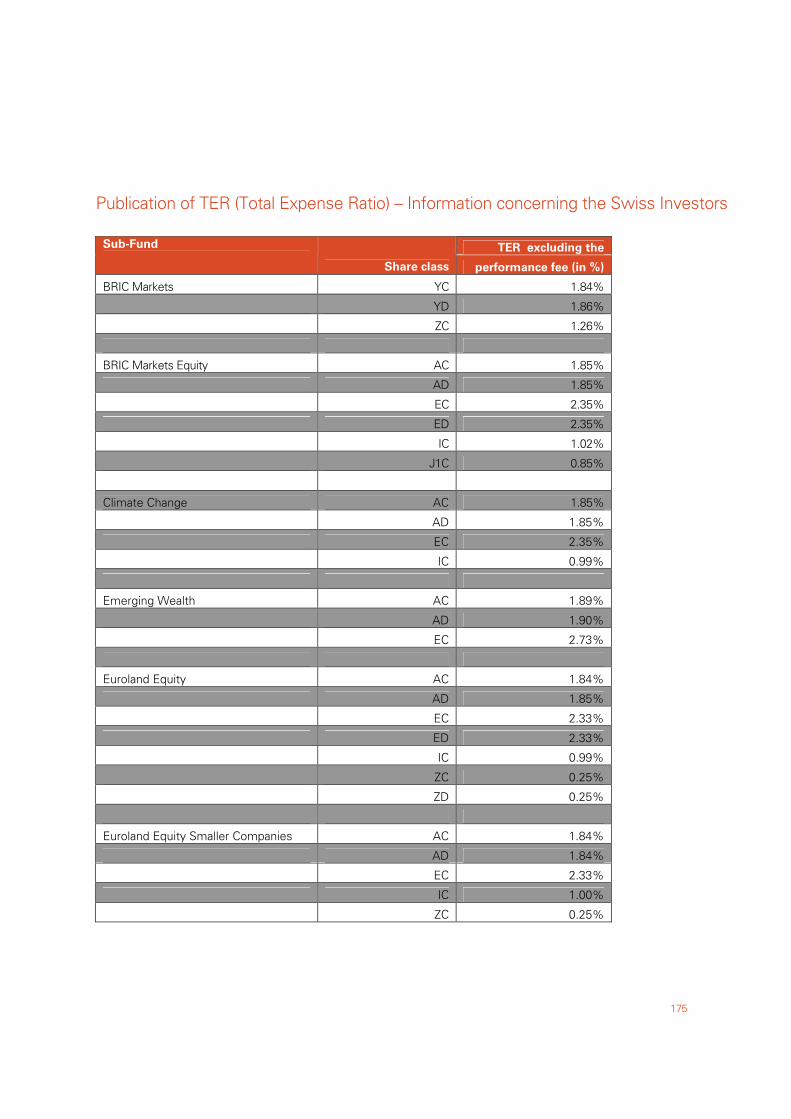
Publication of TER (Total Expense Ratio) – Information concerning the Swiss Investors
175
TER excluding the Sub-Fund
Share class performance fee (in %)
BRIC Markets YC 1.84%
YD 1.86%
ZC 1.26%
BRIC Markets Equity AC 1.85%
AD 1.85%
EC 2.35%
ED 2.35%
IC 1.02%
J1C 0.85%
Climate Change AC 1.85%
AD 1.85%
EC 2.35%
IC 0.99%
Emerging Wealth AC 1.89%
AD 1.90%
EC 2.73%
Euroland Equity AC 1.84%
AD 1.85%
EC 2.33%
ED 2.33%
IC 0.99%
ZC 0.25%
ZD 0.25%
Euroland Equity Smaller Companies AC 1.84%
AD 1.84%
EC 2.33%
IC 1.00%
ZC 0.25%
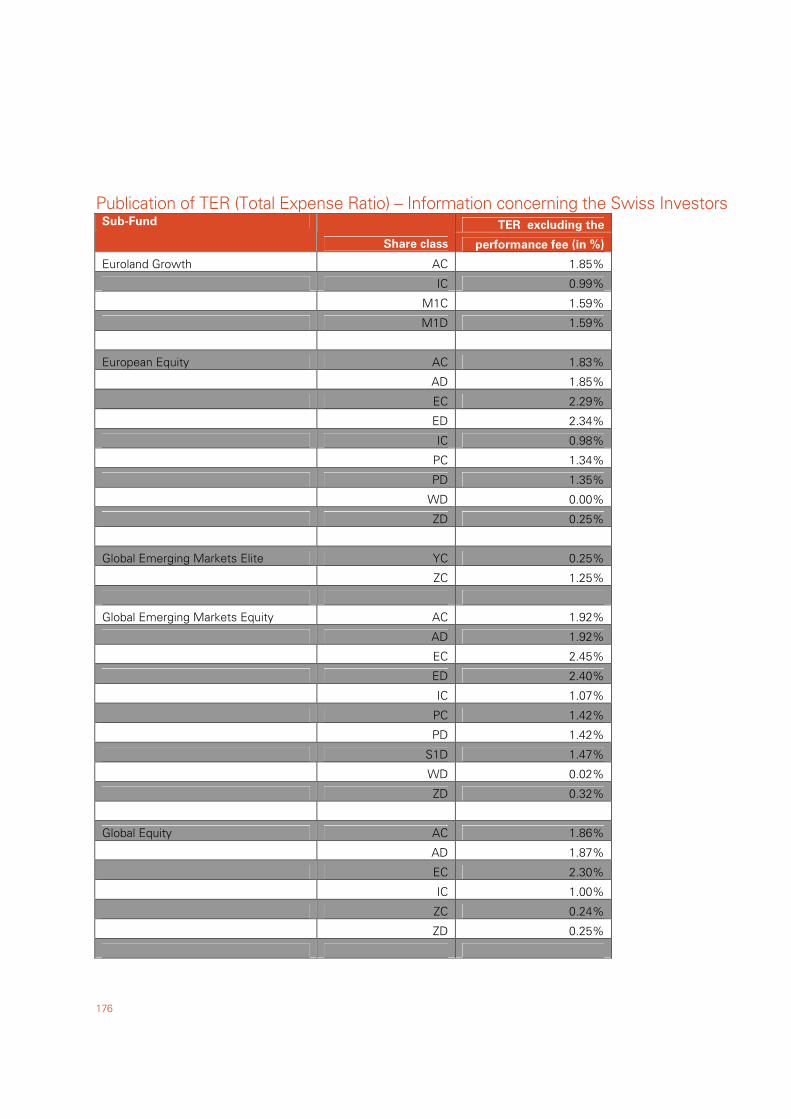
Publication of TER (Total Expense Ratio) – Information concerning the Swiss Investors
176
TER excluding the Sub-Fund
Share class performance fee (in %)
Euroland Growth AC 1.85%
IC 0.99%
M1C 1.59%
M1D 1.59%
European Equity AC 1.83%
AD 1.85%
EC 2.29%
ED 2.34%
IC 0.98%
PC 1.34%
PD 1.35%
WD 0.00%
ZD 0.25%
Global Emerging Markets Elite YC 0.25%
ZC 1.25%
Global Emerging Markets Equity AC 1.92%
AD 1.92%
EC 2.45%
ED 2.40%
IC 1.07%
PC 1.42%
PD 1.42%
S1D 1.47%
WD 0.02%
ZD 0.32%
Global Equity AC 1.86%
AD 1.87%
EC 2.30%
IC 1.00%
ZC 0.24%
ZD 0.25%
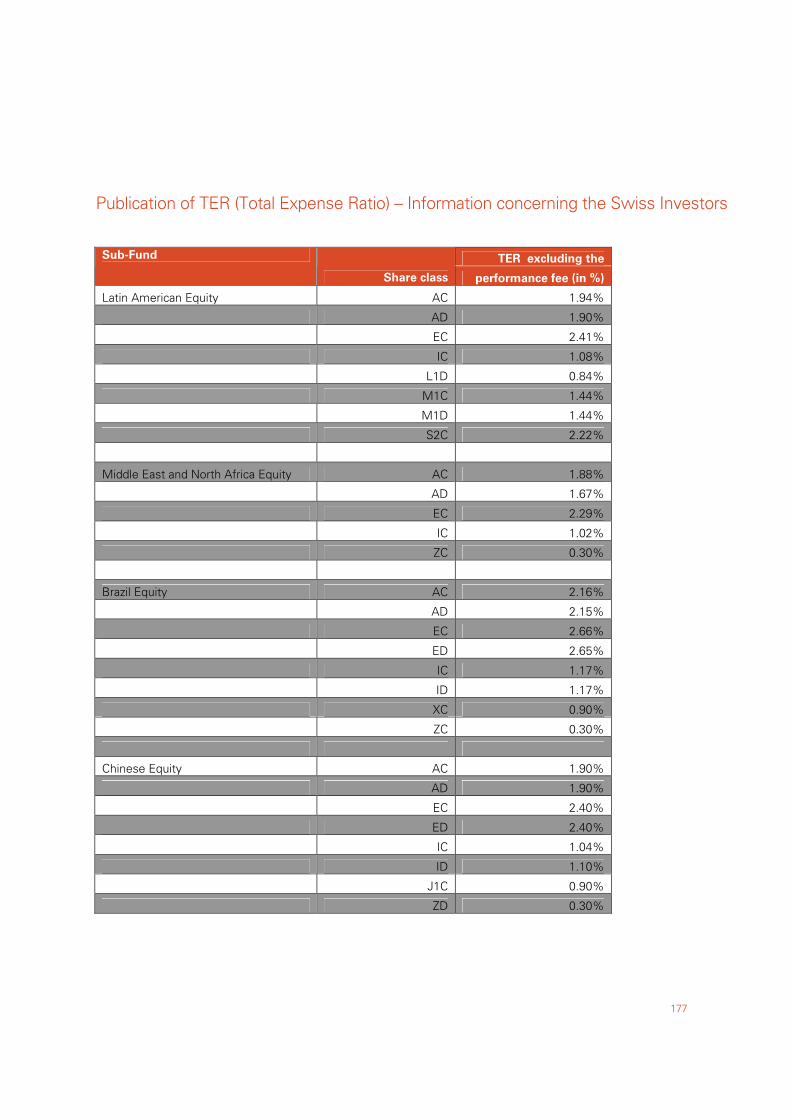
Publication of TER (Total Expense Ratio) – Information concerning the Swiss Investors
177
TER excluding the Sub-Fund
Share class performance fee (in %)
Latin American Equity AC 1.94%
AD 1.90%
EC 2.41%
IC 1.08%
L1D 0.84%
M1C 1.44%
M1D 1.44%
S2C 2.22%
Middle East and North Africa Equity AC 1.88%
AD 1.67%
EC 2.29%
IC 1.02%
ZC 0.30%
Brazil Equity AC 2.16%
AD 2.15%
EC 2.66%
ED 2.65%
IC 1.17%
ID 1.17%
XC 0.90%
ZC 0.30%
Chinese Equity AC 1.90%
AD 1.90%
EC 2.40%
ED 2.40%
IC 1.04%
ID 1.10%
J1C 0.90%
ZD 0.30%
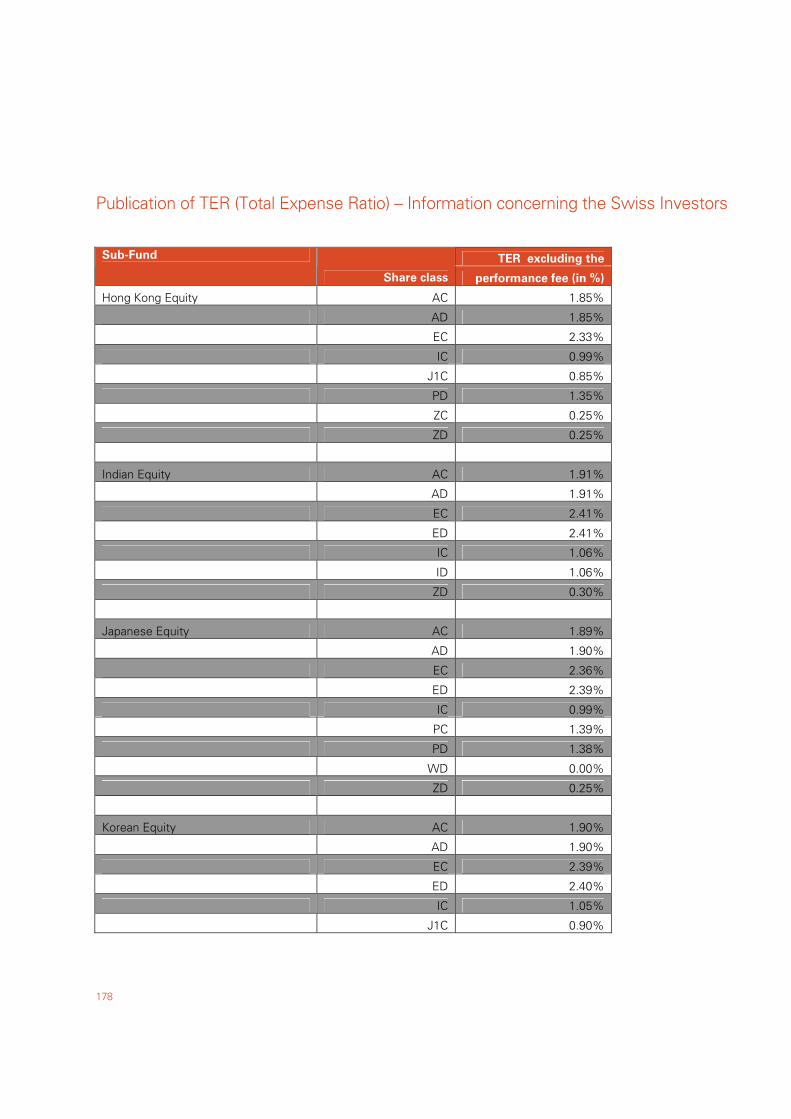
Publication of TER (Total Expense Ratio) – Information concerning the Swiss Investors
178
TER excluding the Sub-Fund
Share class performance fee (in %)
Hong Kong Equity AC 1.85%
AD 1.85%
EC 2.33%
IC 0.99%
J1C 0.85%
PD 1.35%
ZC 0.25%
ZD 0.25%
Indian Equity AC 1.91%
AD 1.91%
EC 2.41%
ED 2.41%
IC 1.06%
ID 1.06%
ZD 0.30%
Japanese Equity AC 1.89%
AD 1.90%
EC 2.36%
ED 2.39%
IC 0.99%
PC 1.39%
PD 1.38%
WD 0.00%
ZD 0.25%
Korean Equity AC 1.90%
AD 1.90%
EC 2.39%
ED 2.40%
IC 1.05%
J1C 0.90%
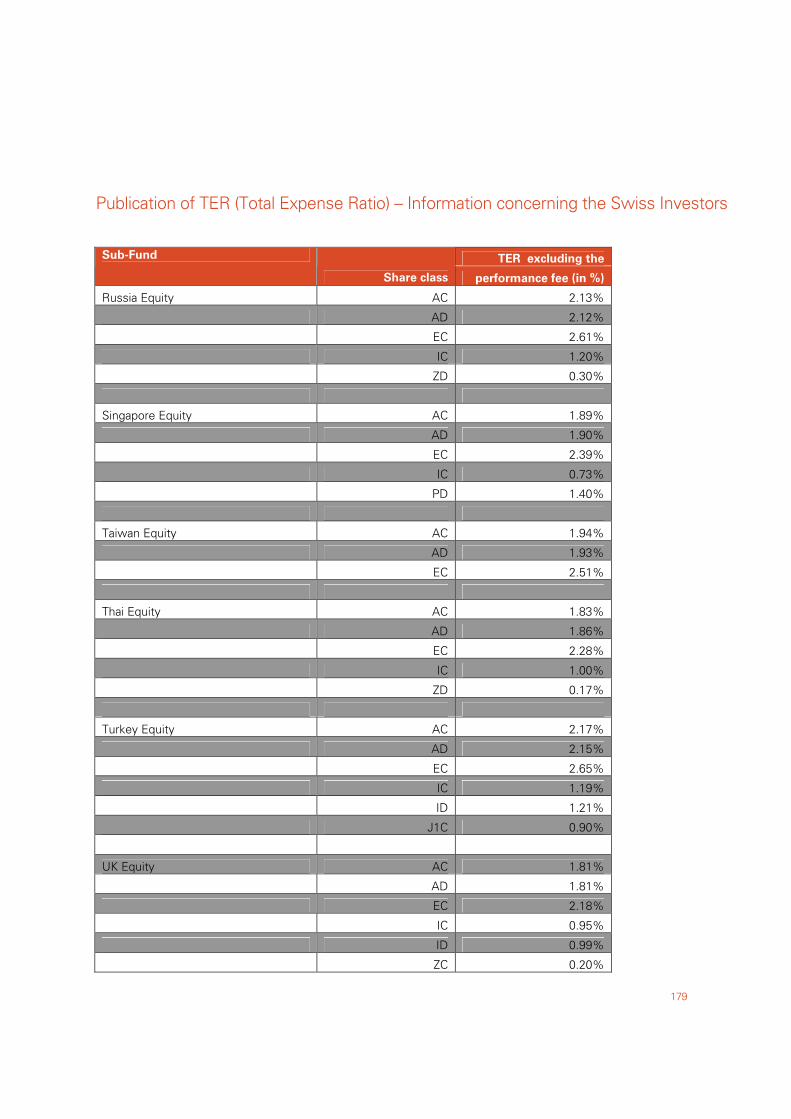
Publication of TER (Total Expense Ratio) – Information concerning the Swiss Investors
179
TER excluding the Sub-Fund
Share class performance fee (in %)
Russia Equity AC 2.13%
AD 2.12%
EC 2.61%
IC 1.20%
ZD 0.30%
Singapore Equity AC 1.89%
AD 1.90%
EC 2.39%
IC 0.73%
PD 1.40%
Taiwan Equity AC 1.94%
AD 1.93%
EC 2.51%
Thai Equity AC 1.83%
AD 1.86%
EC 2.28%
IC 1.00%
ZD 0.17%
Turkey Equity AC 2.17%
AD 2.15%
EC 2.65%
IC 1.19%
ID 1.21%
J1C 0.90%
UK Equity AC 1.81%
AD 1.81%
EC 2.18%
IC 0.95%
ID 0.99%
ZC 0.20%
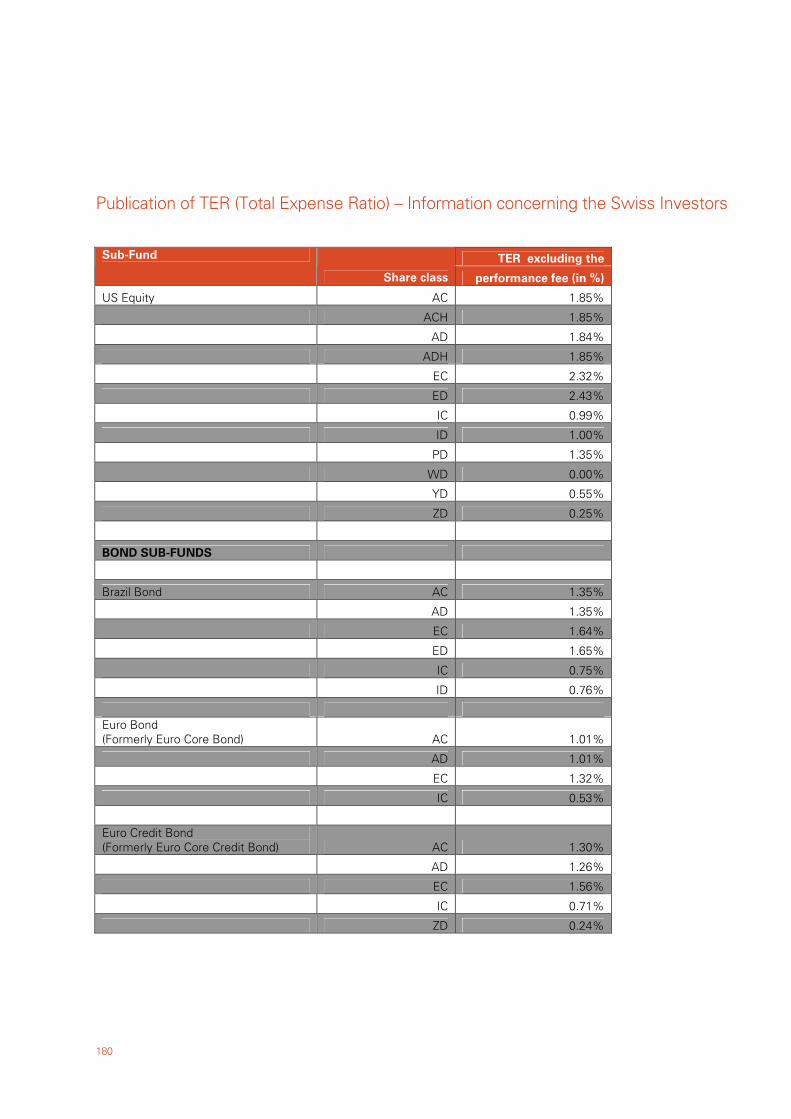
Publication of TER (Total Expense Ratio) – Information concerning the Swiss Investors
180
TER excluding the Sub-Fund
Share class performance fee (in %)
US Equity AC 1.85%
ACH 1.85%
AD 1.84%
ADH 1.85%
EC 2.32%
ED 2.43%
IC 0.99%
ID 1.00%
PD 1.35%
WD 0.00%
YD 0.55%
ZD 0.25%
BOND SUB-FUNDS
Brazil Bond AC 1.35%
AD 1.35%
EC 1.64%
ED 1.65%
IC 0.75%
ID 0.76%
Euro Bond (Formerly Euro Core Bond) AC 1.01%
AD 1.01%
EC 1.32%
IC 0.53%
Euro Credit Bond (Formerly Euro Core Credit Bond) AC 1.30%
AD 1.26%
EC 1.56%
IC 0.71%
ZD 0.24%
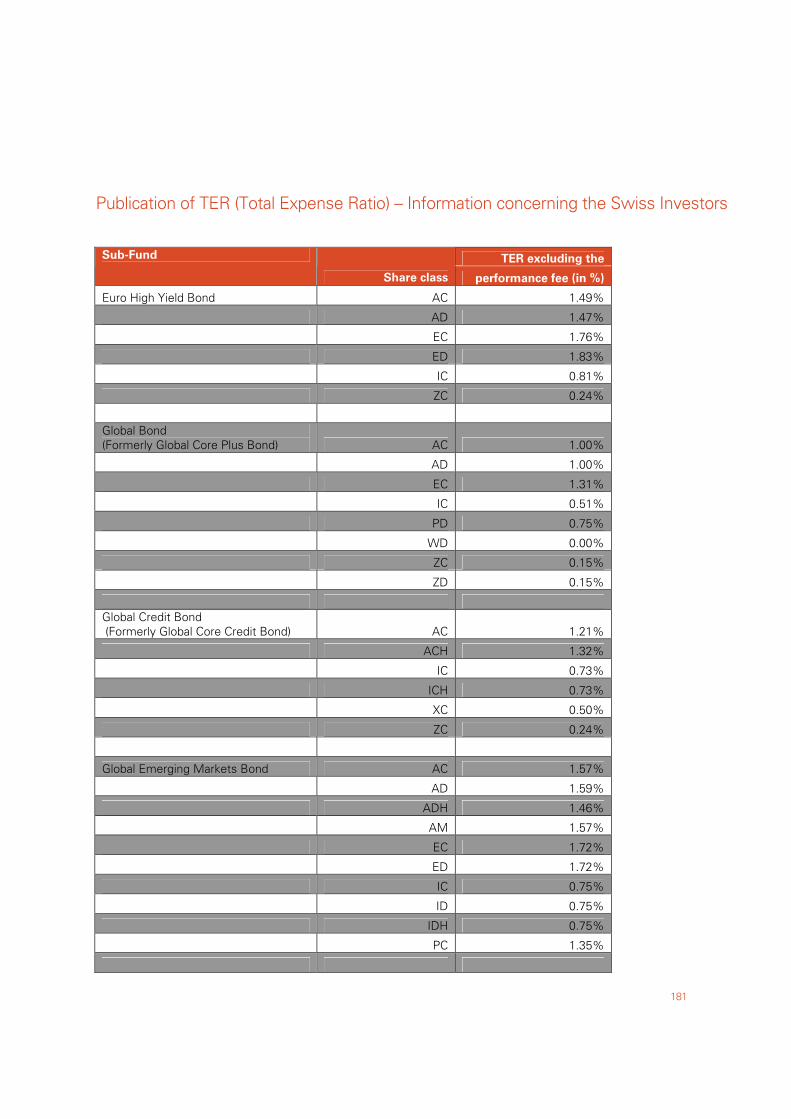
Publication of TER (Total Expense Ratio) – Information concerning the Swiss Investors
181
TER excluding the Sub-Fund
Share class performance fee (in %)
Euro High Yield Bond AC 1.49%
AD 1.47%
EC 1.76%
ED 1.83%
IC 0.81%
ZC 0.24%
Global Bond (Formerly Global Core Plus Bond) AC 1.00%
AD 1.00%
EC 1.31%
IC 0.51%
PD 0.75%
WD 0.00%
ZC 0.15%
ZD 0.15%
Global Credit Bond (Formerly Global Core Credit Bond) AC 1.21%
ACH 1.32%
IC 0.73%
ICH 0.73%
XC 0.50%
ZC 0.24%
Global Emerging Markets Bond AC 1.57%
AD 1.59%
ADH 1.46%
AM 1.57%
EC 1.72%
ED 1.72%
IC 0.75%
ID 0.75%
IDH 0.75%
PC 1.35%
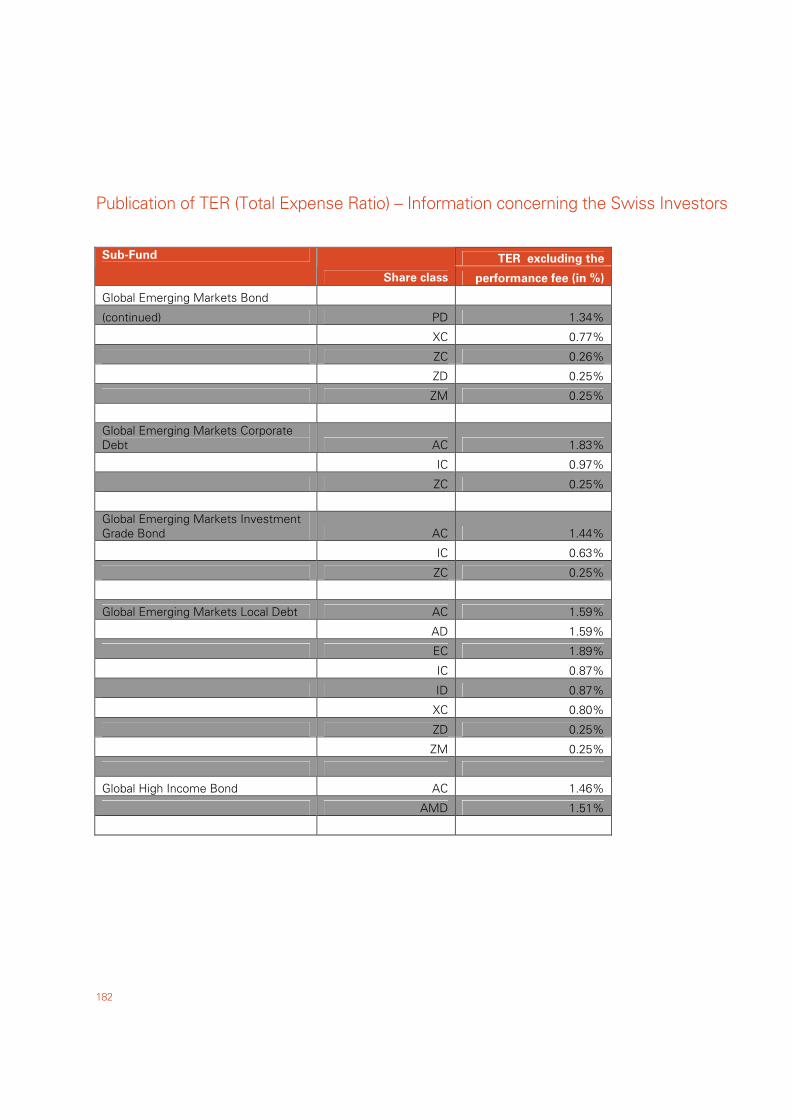
Publication of TER (Total Expense Ratio) – Information concerning the Swiss Investors
182
TER excluding the Sub-Fund
Share class performance fee (in %)
Global Emerging Markets Bond
(continued) PD 1.34%
XC 0.77%
ZC 0.26%
ZD 0.25%
ZM 0.25%
Global Emerging Markets Corporate Debt AC 1.83%
IC 0.97%
ZC 0.25%
Global Emerging Markets Investment Grade Bond AC 1.44%
IC 0.63%
ZC 0.25%
Global Emerging Markets Local Debt AC 1.59%
AD 1.59%
EC 1.89%
IC 0.87%
ID 0.87%
XC 0.80%
ZD 0.25%
ZM 0.25%
Global High Income Bond AC 1.46%
AMD 1.51%
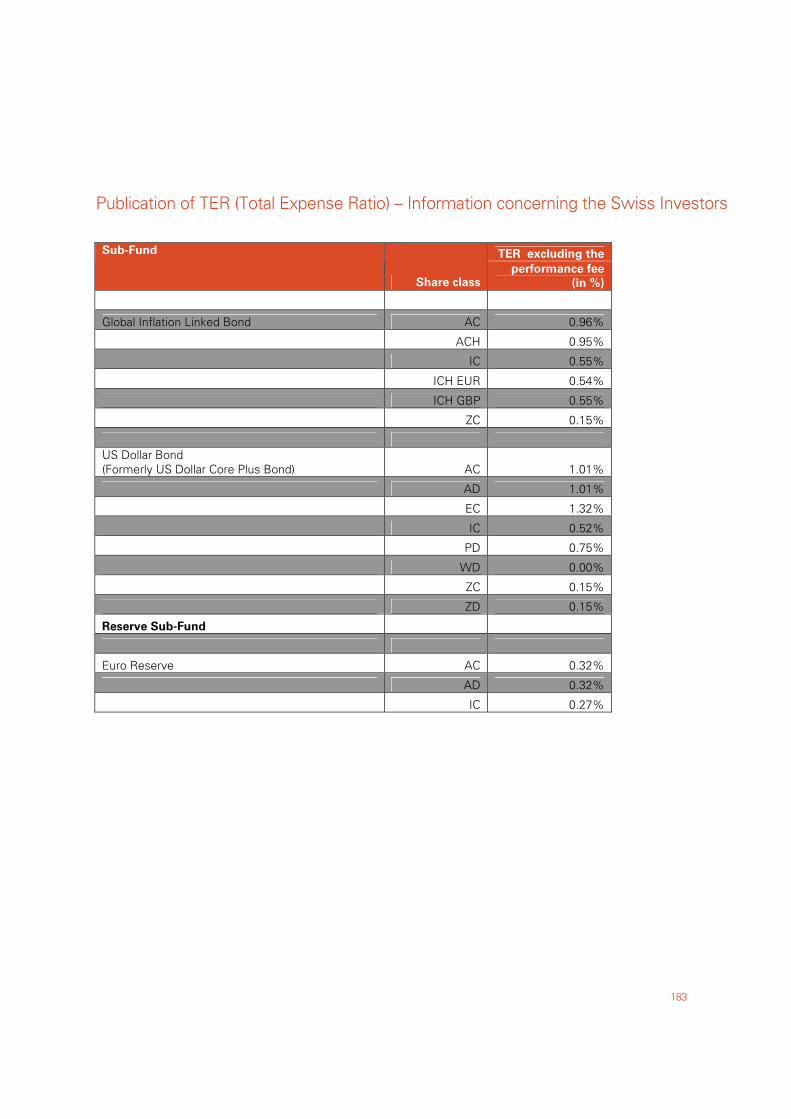
Publication of TER (Total Expense Ratio) – Information concerning the Swiss Investors
183
TER excluding the Sub-Fund
Share class performance fee
(in %)
Global Inflation Linked Bond AC 0.96%
ACH 0.95%
IC 0.55%
ICH EUR 0.54%
ICH GBP 0.55%
ZC 0.15%
US Dollar Bond (Formerly US Dollar Core Plus Bond) AC 1.01%
AD 1.01%
EC 1.32%
IC 0.52%
PD 0.75%
WD 0.00%
ZC 0.15%
ZD 0.15%
Reserve Sub-Fund
Euro Reserve AC 0.32%
AD 0.32%
IC 0.27%
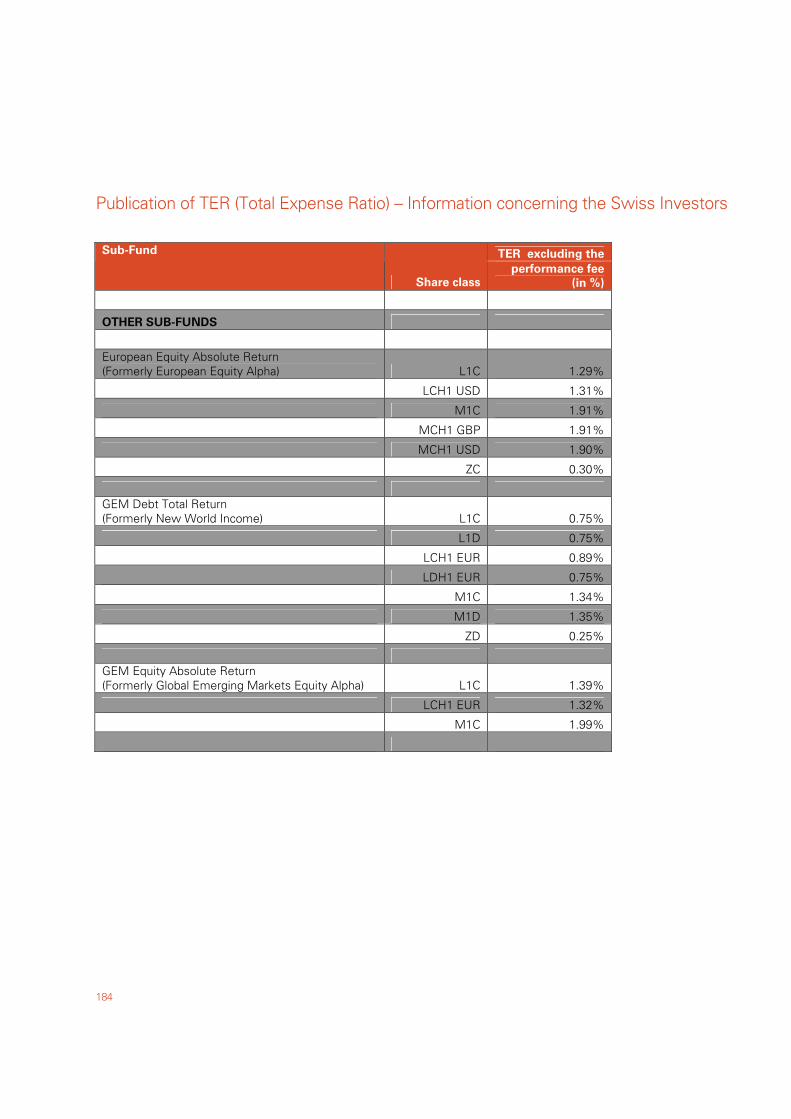
Publication of TER (Total Expense Ratio) – Information concerning the Swiss Investors
184
TER excluding the Sub-Fund
Share class performance fee
(in %)
OTHER SUB-FUNDS
European Equity Absolute Return (Formerly European Equity Alpha) L1C 1.29%
LCH1 USD 1.31%
M1C 1.91%
MCH1 GBP 1.91%
MCH1 USD 1.90%
ZC 0.30%
GEM Debt Total Return (Formerly New World Income) L1C 0.75%
L1D 0.75%
LCH1 EUR 0.89%
LDH1 EUR 0.75%
M1C 1.34%
M1D 1.35%
ZD 0.25%
GEM Equity Absolute Return (Formerly Global Emerging Markets Equity Alpha) L1C 1.39%
LCH1 EUR 1.32%
M1C 1.99%
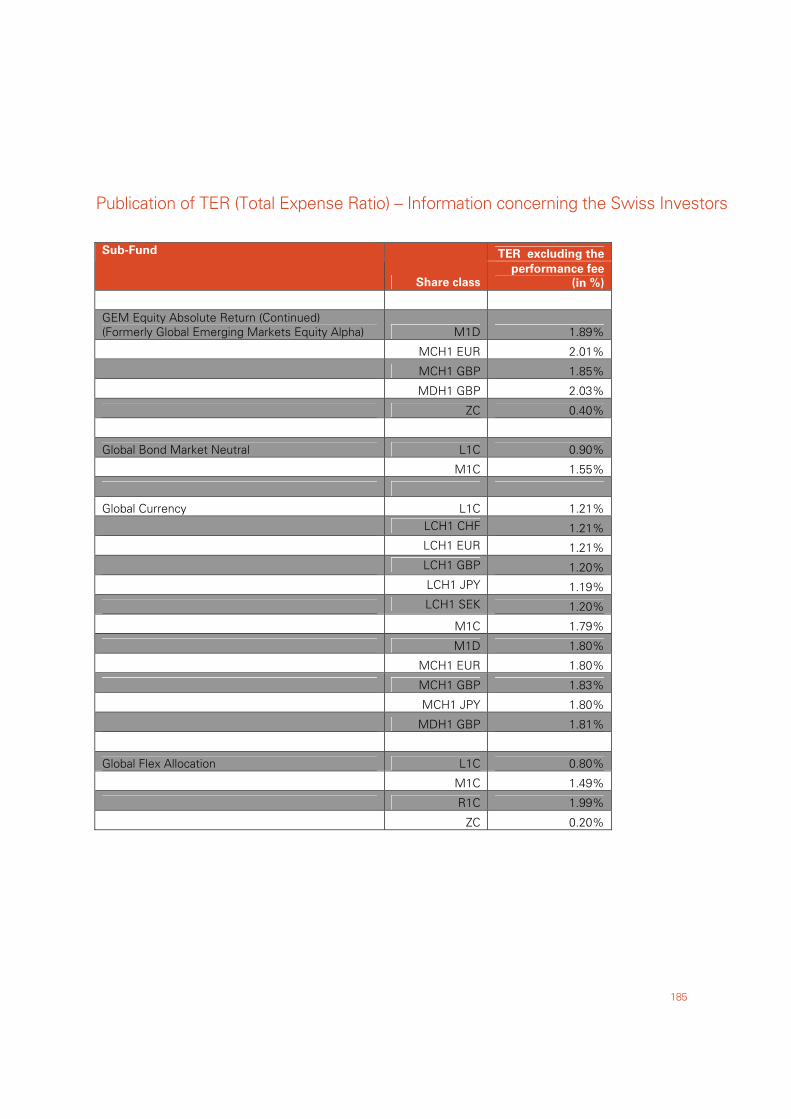
Publication of TER (Total Expense Ratio) – Information concerning the Swiss Investors
185
TER excluding the Sub-Fund
Share class performance fee
(in %)
GEM Equity Absolute Return (Continued) (Formerly Global Emerging Markets Equity Alpha) M1D 1.89%
MCH1 EUR 2.01%
MCH1 GBP 1.85%
MDH1 GBP 2.03%
ZC 0.40%
Global Bond Market Neutral L1C 0.90%
M1C 1.55%
Global Currency L1C 1.21%
LCH1 CHF 1.21%
LCH1 EUR 1.21%
LCH1 GBP 1.20%
LCH1 JPY 1.19%
LCH1 SEK 1.20%
M1C 1.79%
M1D 1.80%
MCH1 EUR 1.80%
MCH1 GBP 1.83%
MCH1 JPY 1.80%
MDH1 GBP 1.81%
Global Flex Allocation L1C 0.80%
M1C 1.49%
R1C 1.99%
ZC 0.20%
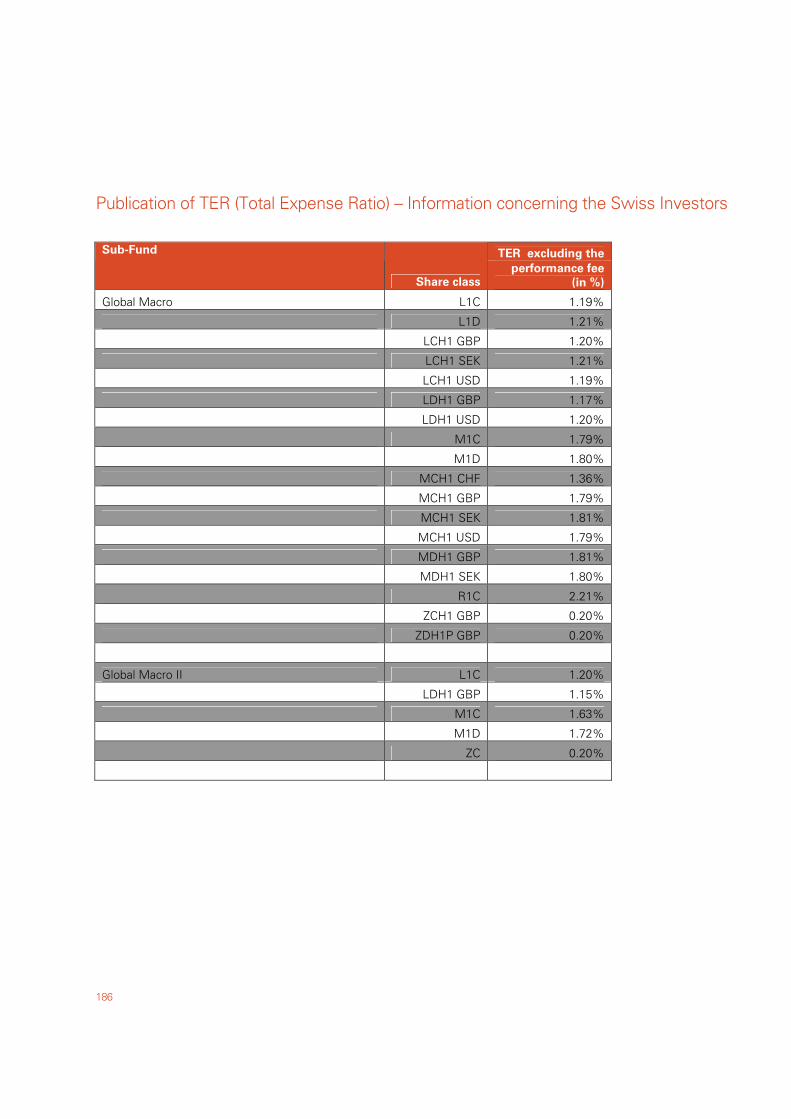
Publication of TER (Total Expense Ratio) – Information concerning the Swiss Investors
186
TER excluding the Sub-Fund
Share class performance fee
(in %)
Global Macro L1C 1.19%
L1D 1.21%
LCH1 GBP 1.20%
LCH1 SEK 1.21% LCH1 USD 1.19% LDH1 GBP 1.17%
LDH1 USD 1.20%
M1C 1.79%
M1D 1.80%
MCH1 CHF 1.36%
MCH1 GBP 1.79%
MCH1 SEK 1.81%
MCH1 USD 1.79%
MDH1 GBP 1.81%
MDH1 SEK 1.80%
R1C 2.21%
ZCH1 GBP 0.20%
ZDH1P GBP 0.20%
Global Macro II L1C 1.20%
LDH1 GBP 1.15%
M1C 1.63%
M1D 1.72%
ZC 0.20%
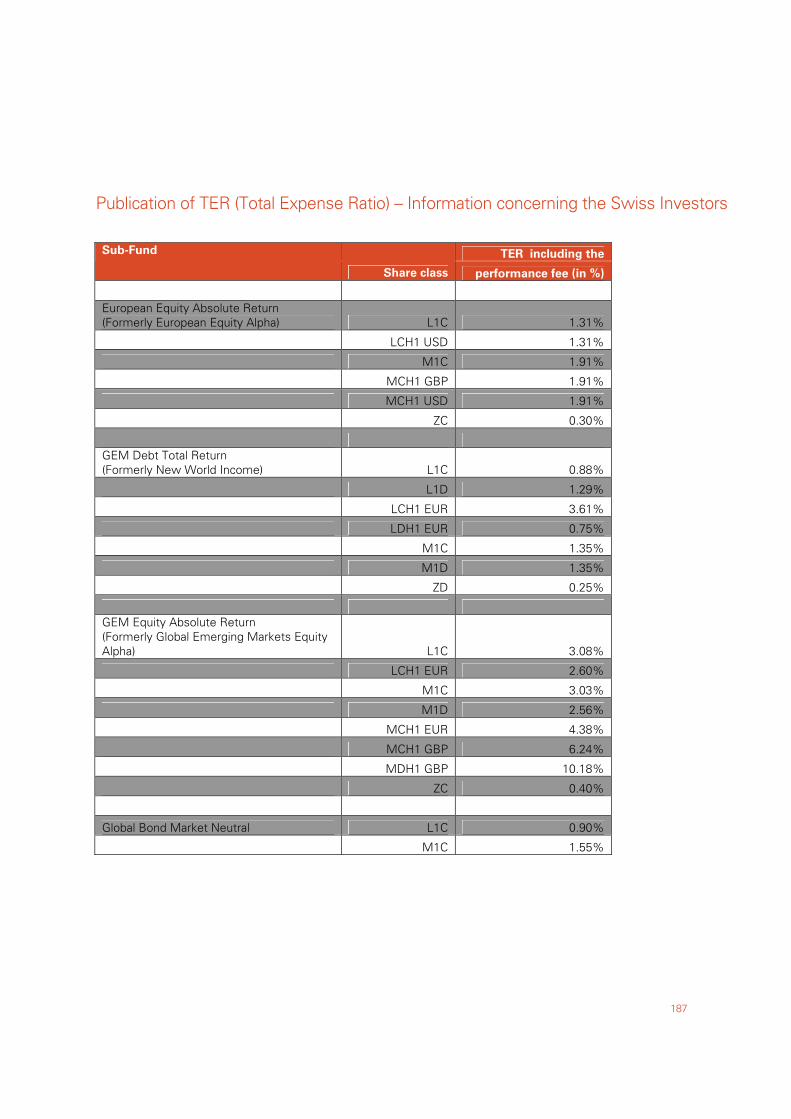
Publication of TER (Total Expense Ratio) – Information concerning the Swiss Investors
187
TER including the Sub-Fund
Share class performance fee (in %)
European Equity Absolute Return (Formerly European Equity Alpha) L1C 1.31%
LCH1 USD 1.31%
M1C 1.91%
MCH1 GBP 1.91%
MCH1 USD 1.91%
ZC 0.30%
GEM Debt Total Return (Formerly New World Income) L1C 0.88%
L1D 1.29%
LCH1 EUR 3.61%
LDH1 EUR 0.75%
M1C 1.35%
M1D 1.35%
ZD 0.25%
GEM Equity Absolute Return (Formerly Global Emerging Markets Equity Alpha) L1C 3.08%
LCH1 EUR 2.60%
M1C 3.03%
M1D 2.56%
MCH1 EUR 4.38%
MCH1 GBP 6.24%
MDH1 GBP 10.18%
ZC 0.40%
Global Bond Market Neutral L1C 0.90%
M1C 1.55%
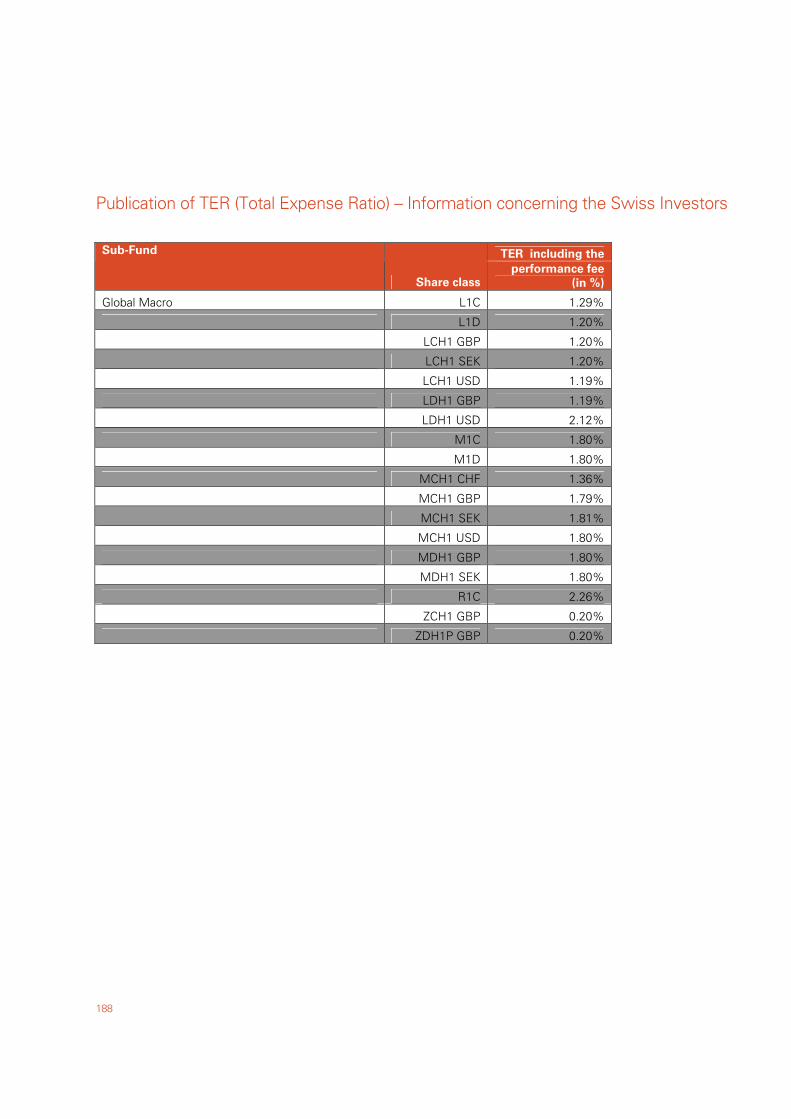
Publication of TER (Total Expense Ratio) – Information concerning the Swiss Investors
188
TER including the Sub-Fund
Share class performance fee
(in %)
Global Macro L1C 1.29%
L1D 1.20%
LCH1 GBP 1.20%
LCH1 SEK 1.20% LCH1 USD 1.19% LDH1 GBP 1.19%
LDH1 USD 2.12%
M1C 1.80%
M1D 1.80%
MCH1 CHF 1.36%
MCH1 GBP 1.79%
MCH1 SEK 1.81%
MCH1 USD 1.80%
MDH1 GBP 1.80%
MDH1 SEK 1.80%
R1C 2.26%
ZCH1 GBP 0.20%
ZDH1P GBP 0.20%
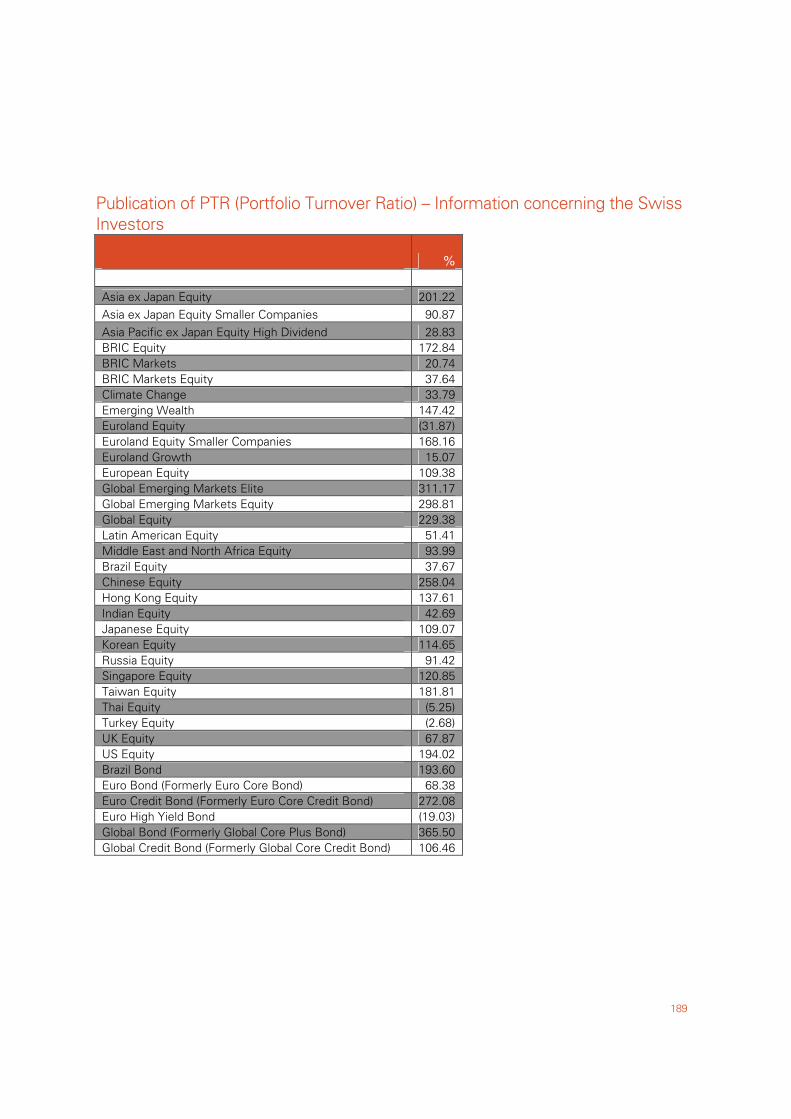
Publication of PTR (Portfolio Turnover Ratio) – Information concerning the Swiss Investors
189
% Asia ex Japan Equity 201.22 Asia ex Japan Equity Smaller Companies 90.87 Asia Pacific ex Japan Equity High Dividend 28.83 BRIC Equity 172.84 BRIC Markets 20.74 BRIC Markets Equity 37.64 Climate Change 33.79 Emerging Wealth 147.42 Euroland Equity (31.87) Euroland Equity Smaller Companies 168.16 Euroland Growth 15.07 European Equity 109.38 Global Emerging Markets Elite 311.17 Global Emerging Markets Equity 298.81 Global Equity 229.38 Latin American Equity 51.41 Middle East and North Africa Equity 93.99 Brazil Equity 37.67 Chinese Equity 258.04 Hong Kong Equity 137.61 Indian Equity 42.69 Japanese Equity 109.07 Korean Equity 114.65 Russia Equity 91.42 Singapore Equity 120.85 Taiwan Equity 181.81 Thai Equity (5.25) Turkey Equity (2.68) UK Equity 67.87 US Equity 194.02 Brazil Bond 193.60 Euro Bond (Formerly Euro Core Bond) 68.38 Euro Credit Bond (Formerly Euro Core Credit Bond) 272.08 Euro High Yield Bond (19.03) Global Bond (Formerly Global Core Plus Bond) 365.50 Global Credit Bond (Formerly Global Core Credit Bond) 106.46
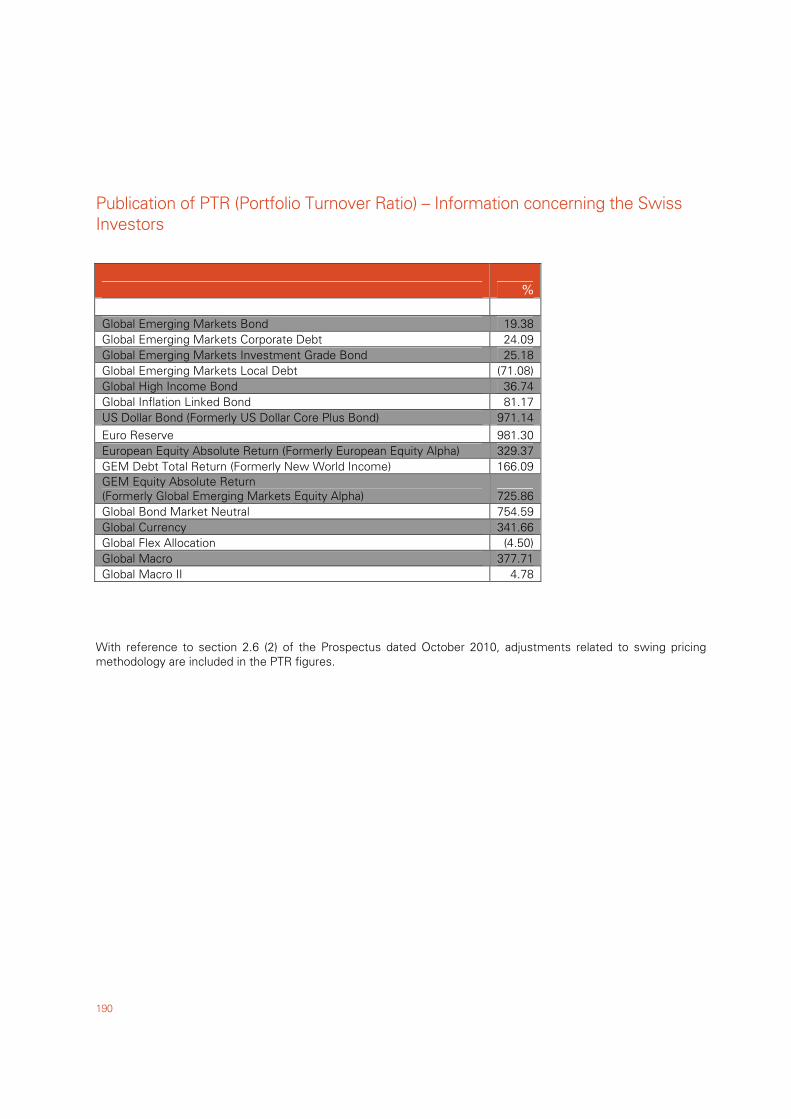
Publication of PTR (Portfolio Turnover Ratio) – Information concerning the Swiss Investors
190
% Global Emerging Markets Bond 19.38 Global Emerging Markets Corporate Debt 24.09 Global Emerging Markets Investment Grade Bond 25.18 Global Emerging Markets Local Debt (71.08) Global High Income Bond 36.74 Global Inflation Linked Bond 81.17 US Dollar Bond (Formerly US Dollar Core Plus Bond) 971.14 Euro Reserve 981.30 European Equity Absolute Return (Formerly European Equity Alpha) 329.37 GEM Debt Total Return (Formerly New World Income) 166.09 GEM Equity Absolute Return (Formerly Global Emerging Markets Equity Alpha) 725.86 Global Bond Market Neutral 754.59 Global Currency 341.66 Global Flex Allocation (4.50) Global Macro 377.71 Global Macro II 4.78
With reference to section 2.6 (2) of the Prospectus dated October 2010, adjustments related to swing pricing methodology are included in the PTR figures.
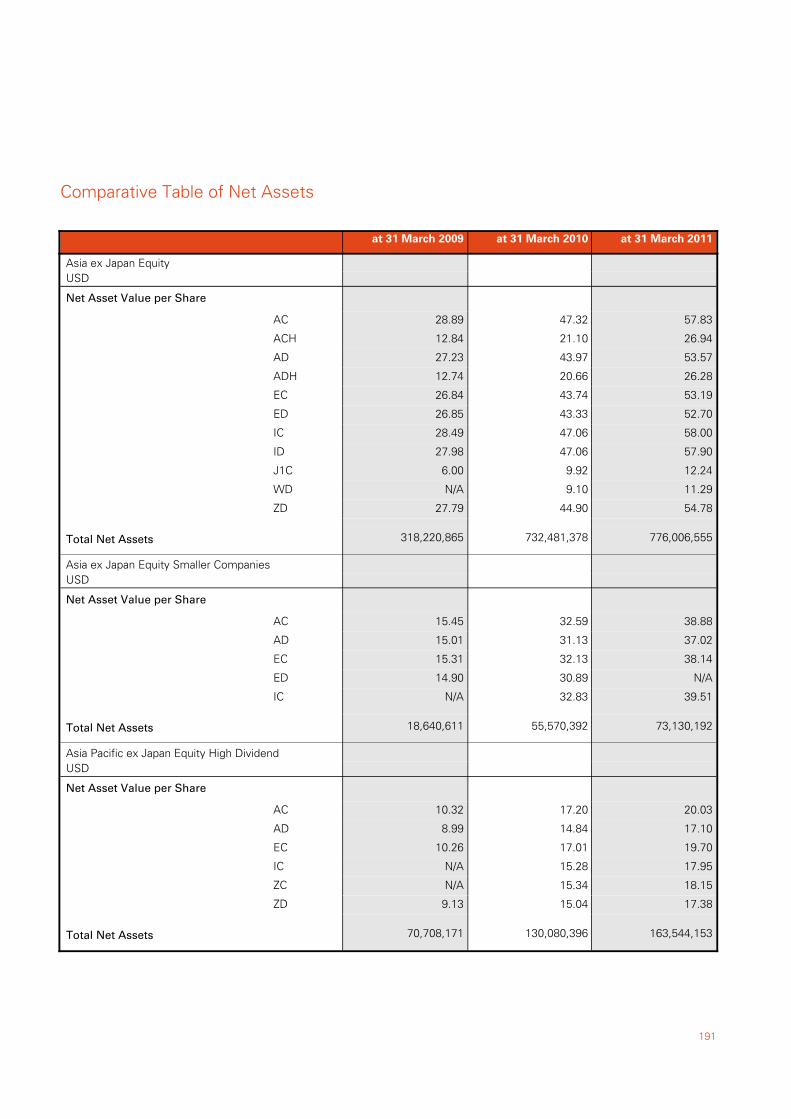
191
Asia ex Japan EquityUSD
AC 57.8347.3228.89
ACH 26.9421.1012.84
AD 53.5743.9727.23
ADH 26.2820.6612.74
EC 53.1943.7426.84
ED 52.7043.3326.85
IC 58.0047.0628.49
ID 57.9047.0627.98
J1C 12.249.926.00
WD 11.299.10N/A
ZD 54.7844.9027.79
Total Net Assets 318,220,865 732,481,378 776,006,555
Net Asset Value per Share
Asia ex Japan Equity Smaller CompaniesUSD
AC 38.8832.5915.45
AD 37.0231.1315.01
EC 38.1432.1315.31
ED N/A30.8914.90
IC 39.5132.83N/A
Total Net Assets 18,640,611 55,570,392 73,130,192
Net Asset Value per Share
Asia Pacific ex Japan Equity High DividendUSD
AC 20.0317.2010.32
AD 17.1014.848.99
EC 19.7017.0110.26
IC 17.9515.28N/A
ZC 18.1515.34N/A
ZD 17.3815.049.13
Total Net Assets 70,708,171 130,080,396 163,544,153
Net Asset Value per Share
Comparative Table of Net Assets
at 31 March 2010at 31 March 2009 at 31 March 2011
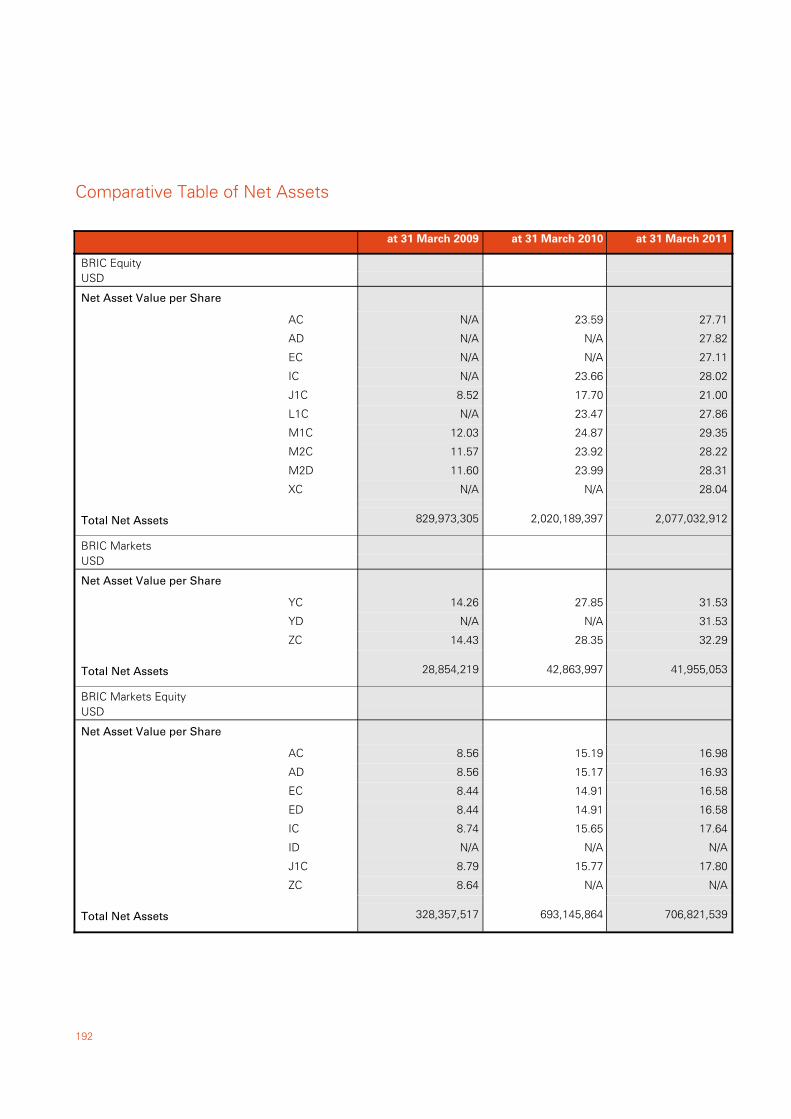
192
BRIC EquityUSD
AC 27.7123.59N/A
AD 27.82N/AN/A
EC 27.11N/AN/A
IC 28.0223.66N/A
J1C 21.0017.708.52
L1C 27.8623.47N/A
M1C 29.3524.8712.03
M2C 28.2223.9211.57
M2D 28.3123.9911.60
XC 28.04N/AN/A
Total Net Assets 829,973,305 2,020,189,397 2,077,032,912
Net Asset Value per Share
BRIC MarketsUSD
YC 31.5327.8514.26
YD 31.53N/AN/A
ZC 32.2928.3514.43
Total Net Assets 28,854,219 42,863,997 41,955,053
Net Asset Value per Share
BRIC Markets EquityUSD
AC 16.9815.198.56
AD 16.9315.178.56
EC 16.5814.918.44
ED 16.5814.918.44
IC 17.6415.658.74
ID N/AN/AN/A
J1C 17.8015.778.79
ZC N/AN/A8.64
Total Net Assets 328,357,517 693,145,864 706,821,539
Net Asset Value per Share
Comparative Table of Net Assets
at 31 March 2010at 31 March 2009 at 31 March 2011
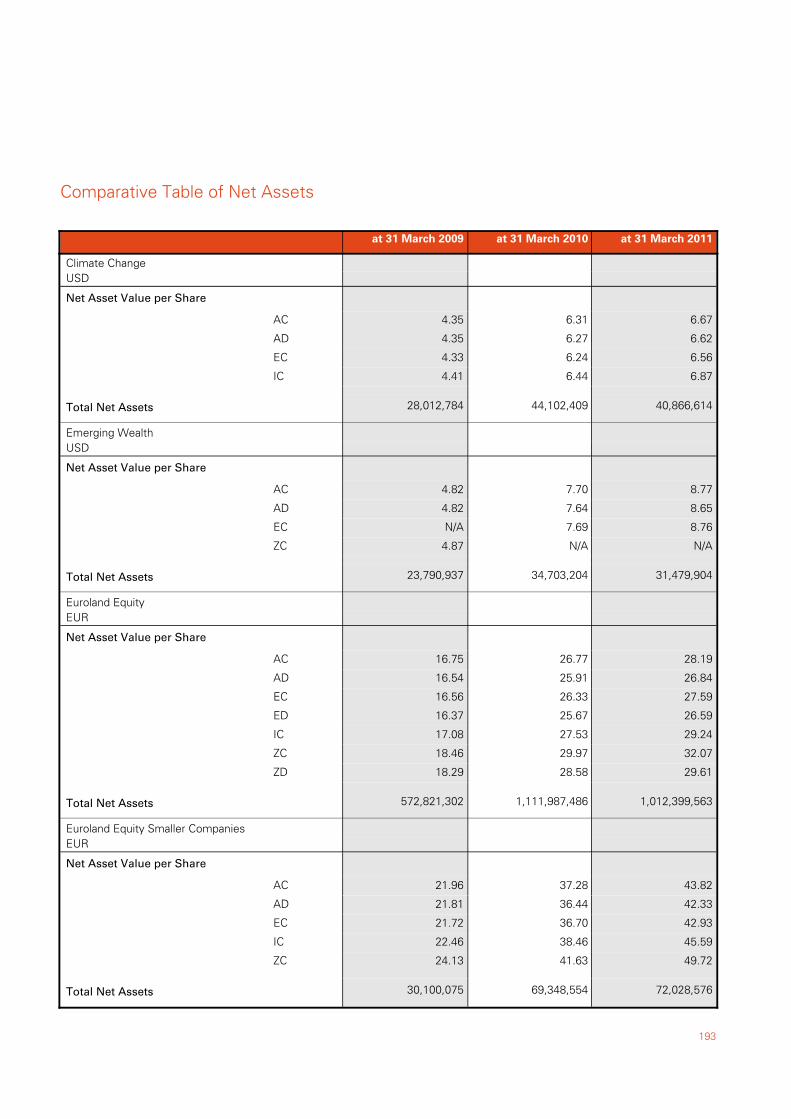
193
Climate ChangeUSD
AC 6.676.314.35
AD 6.626.274.35
EC 6.566.244.33
IC 6.876.444.41
Total Net Assets 28,012,784 44,102,409 40,866,614
Net Asset Value per Share
Emerging WealthUSD
AC 8.777.704.82
AD 8.657.644.82
EC 8.767.69N/A
ZC N/AN/A4.87
Total Net Assets 23,790,937 34,703,204 31,479,904
Net Asset Value per Share
Euroland EquityEUR
AC 28.1926.7716.75
AD 26.8425.9116.54
EC 27.5926.3316.56
ED 26.5925.6716.37
IC 29.2427.5317.08
ZC 32.0729.9718.46
ZD 29.6128.5818.29
Total Net Assets 572,821,302 1,111,987,486 1,012,399,563
Net Asset Value per Share
Euroland Equity Smaller CompaniesEUR
AC 43.8237.2821.96
AD 42.3336.4421.81
EC 42.9336.7021.72
IC 45.5938.4622.46
ZC 49.7241.6324.13
Total Net Assets 30,100,075 69,348,554 72,028,576
Net Asset Value per Share
Comparative Table of Net Assets
at 31 March 2010at 31 March 2009 at 31 March 2011
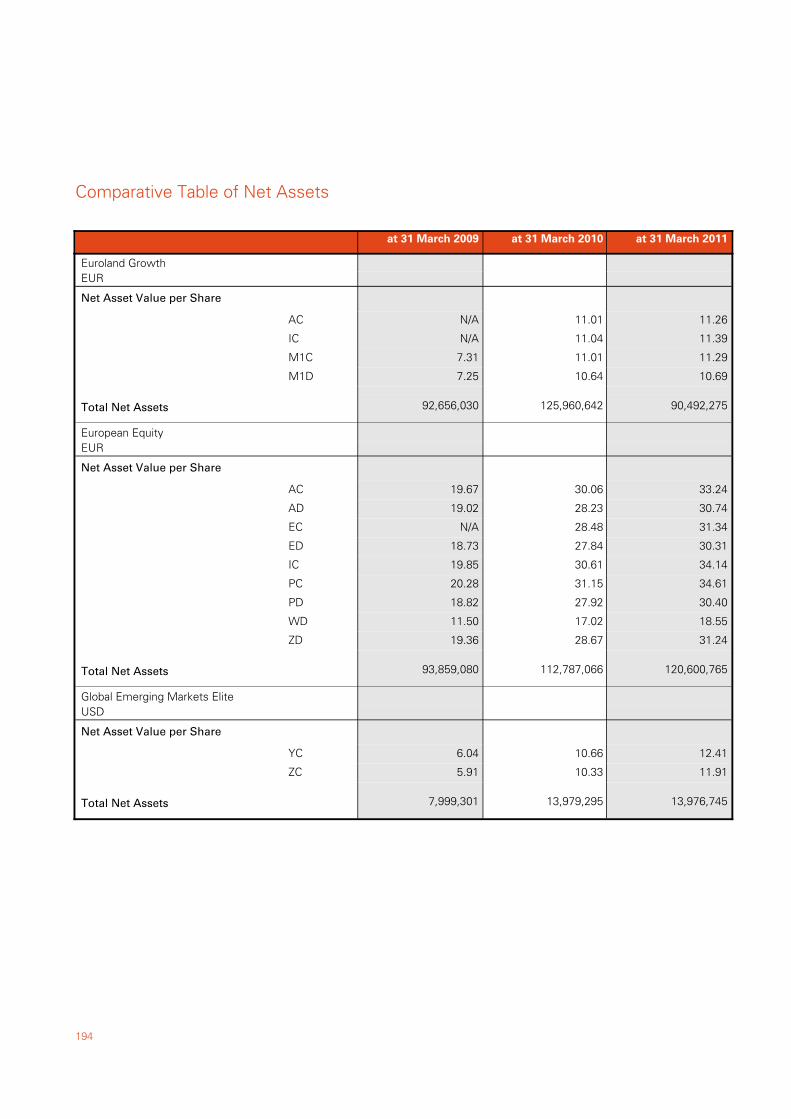
194
Euroland GrowthEUR
AC 11.2611.01N/A
IC 11.3911.04N/A
M1C 11.2911.017.31
M1D 10.6910.647.25
Total Net Assets 92,656,030 125,960,642 90,492,275
Net Asset Value per Share
European EquityEUR
AC 33.2430.0619.67
AD 30.7428.2319.02
EC 31.3428.48N/A
ED 30.3127.8418.73
IC 34.1430.6119.85
PC 34.6131.1520.28
PD 30.4027.9218.82
WD 18.5517.0211.50
ZD 31.2428.6719.36
Total Net Assets 93,859,080 112,787,066 120,600,765
Net Asset Value per Share
Global Emerging Markets EliteUSD
YC 12.4110.666.04
ZC 11.9110.335.91
Total Net Assets 7,999,301 13,979,295 13,976,745
Net Asset Value per Share
Comparative Table of Net Assets
at 31 March 2010at 31 March 2009 at 31 March 2011
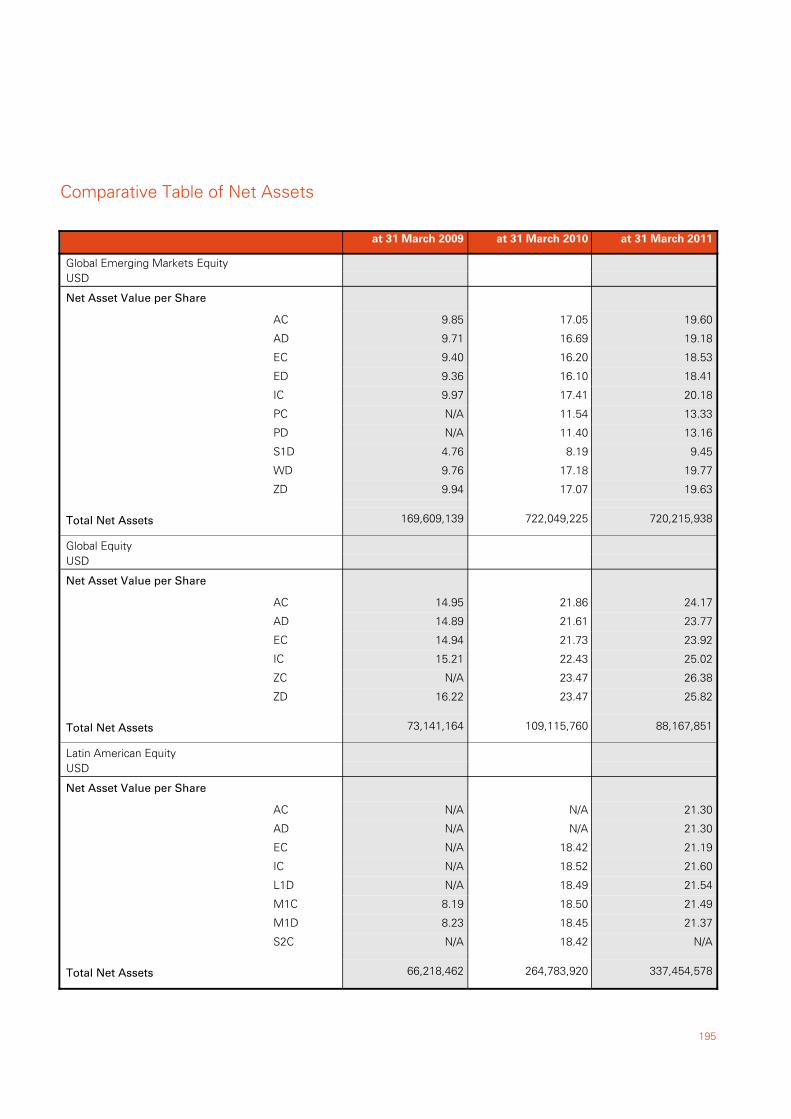
195
Global Emerging Markets EquityUSD
AC 19.6017.059.85
AD 19.1816.699.71
EC 18.5316.209.40
ED 18.4116.109.36
IC 20.1817.419.97
PC 13.3311.54N/A
PD 13.1611.40N/A
S1D 9.458.194.76
WD 19.7717.189.76
ZD 19.6317.079.94
Total Net Assets 169,609,139 722,049,225 720,215,938
Net Asset Value per Share
Global EquityUSD
AC 24.1721.8614.95
AD 23.7721.6114.89
EC 23.9221.7314.94
IC 25.0222.4315.21
ZC 26.3823.47N/A
ZD 25.8223.4716.22
Total Net Assets 73,141,164 109,115,760 88,167,851
Net Asset Value per Share
Latin American EquityUSD
AC 21.30N/AN/A
AD 21.30N/AN/A
EC 21.1918.42N/A
IC 21.6018.52N/A
L1D 21.5418.49N/A
M1C 21.4918.508.19
M1D 21.3718.458.23
S2C N/A18.42N/A
Total Net Assets 66,218,462 264,783,920 337,454,578
Net Asset Value per Share
Comparative Table of Net Assets
at 31 March 2010at 31 March 2009 at 31 March 2011
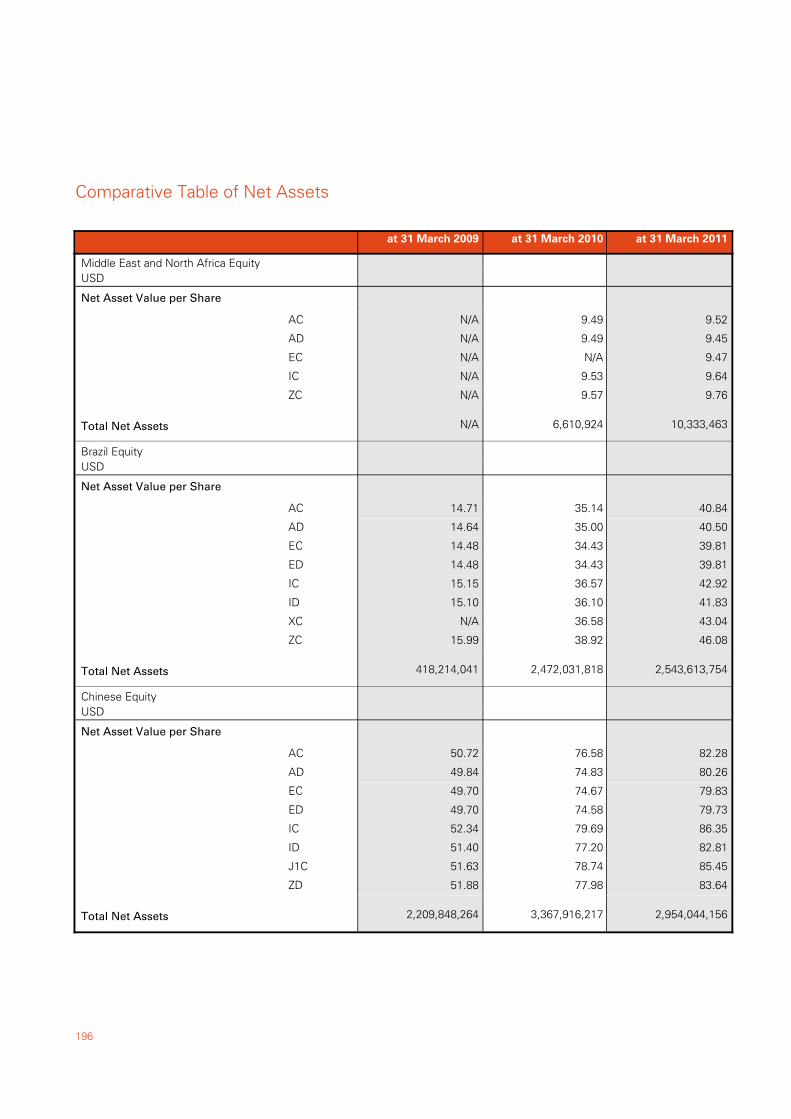
196
Middle East and North Africa EquityUSD
AC 9.529.49N/A
AD 9.459.49N/A
EC 9.47N/AN/A
IC 9.649.53N/A
ZC 9.769.57N/A
Total Net Assets N/A 6,610,924 10,333,463
Net Asset Value per Share
Brazil EquityUSD
AC 40.8435.1414.71
AD 40.5035.0014.64
EC 39.8134.4314.48
ED 39.8134.4314.48
IC 42.9236.5715.15
ID 41.8336.1015.10
XC 43.0436.58N/A
ZC 46.0838.9215.99
Total Net Assets 418,214,041 2,472,031,818 2,543,613,754
Net Asset Value per Share
Chinese EquityUSD
AC 82.2876.5850.72
AD 80.2674.8349.84
EC 79.8374.6749.70
ED 79.7374.5849.70
IC 86.3579.6952.34
ID 82.8177.2051.40
J1C 85.4578.7451.63
ZD 83.6477.9851.88
Total Net Assets 2,209,848,264 3,367,916,217 2,954,044,156
Net Asset Value per Share
Comparative Table of Net Assets
at 31 March 2010at 31 March 2009 at 31 March 2011
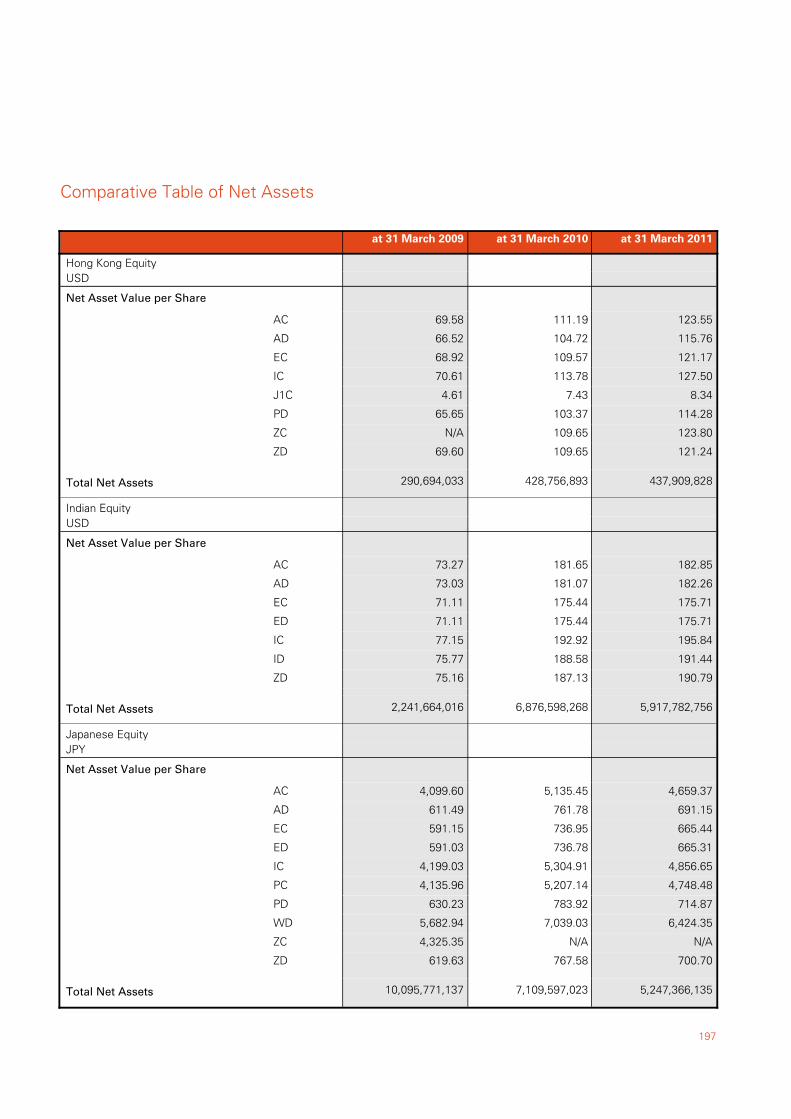
197
Hong Kong EquityUSD
AC 123.55111.1969.58
AD 115.76104.7266.52
EC 121.17109.5768.92
IC 127.50113.7870.61
J1C 8.347.434.61
PD 114.28103.3765.65
ZC 123.80109.65N/A
ZD 121.24109.6569.60
Total Net Assets 290,694,033 428,756,893 437,909,828
Net Asset Value per Share
Indian EquityUSD
AC 182.85181.6573.27
AD 182.26181.0773.03
EC 175.71175.4471.11
ED 175.71175.4471.11
IC 195.84192.9277.15
ID 191.44188.5875.77
ZD 190.79187.1375.16
Total Net Assets 2,241,664,016 6,876,598,268 5,917,782,756
Net Asset Value per Share
Japanese EquityJPY
AC 4,659.375,135.454,099.60
AD 691.15761.78611.49
EC 665.44736.95591.15
ED 665.31736.78591.03
IC 4,856.655,304.914,199.03
PC 4,748.485,207.144,135.96
PD 714.87783.92630.23
WD 6,424.357,039.035,682.94
ZC N/AN/A4,325.35
ZD 700.70767.58619.63
Total Net Assets 10,095,771,137 7,109,597,023 5,247,366,135
Net Asset Value per Share
Comparative Table of Net Assets
at 31 March 2010at 31 March 2009 at 31 March 2011
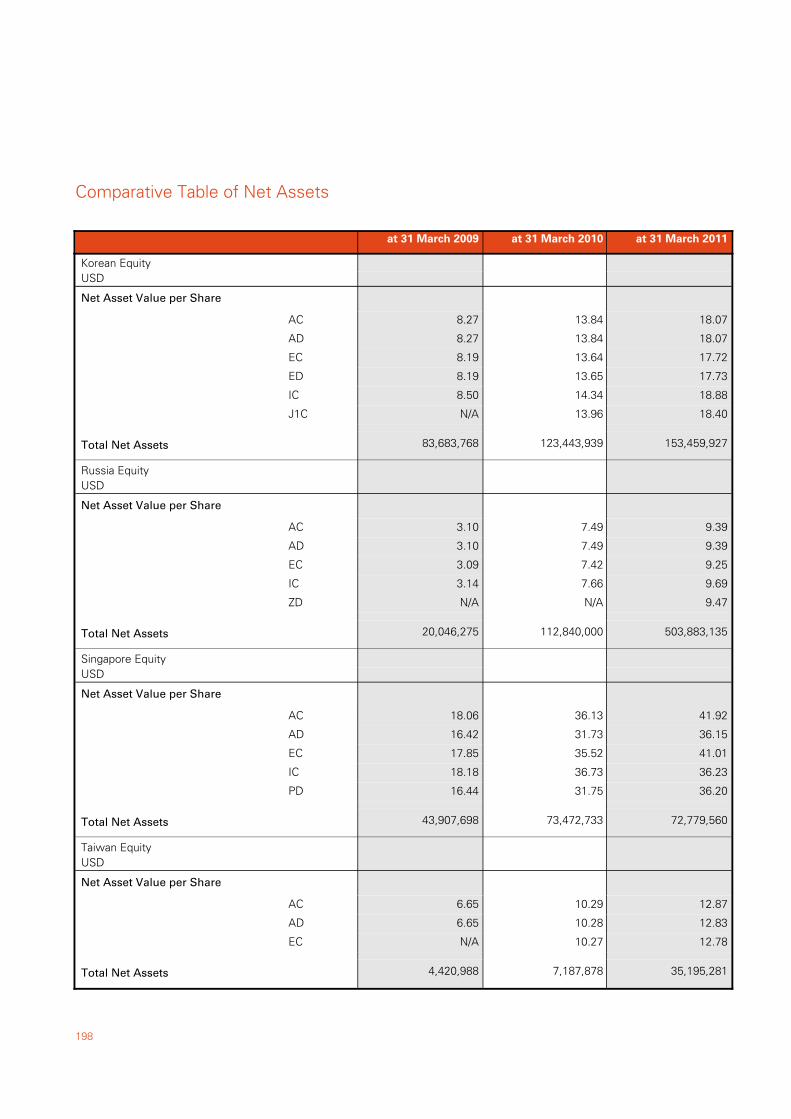
198
Korean EquityUSD
AC 18.0713.848.27
AD 18.0713.848.27
EC 17.7213.648.19
ED 17.7313.658.19
IC 18.8814.348.50
J1C 18.4013.96N/A
Total Net Assets 83,683,768 123,443,939 153,459,927
Net Asset Value per Share
Russia EquityUSD
AC 9.397.493.10
AD 9.397.493.10
EC 9.257.423.09
IC 9.697.663.14
ZD 9.47N/AN/A
Total Net Assets 20,046,275 112,840,000 503,883,135
Net Asset Value per Share
Singapore EquityUSD
AC 41.9236.1318.06
AD 36.1531.7316.42
EC 41.0135.5217.85
IC 36.2336.7318.18
PD 36.2031.7516.44
Total Net Assets 43,907,698 73,472,733 72,779,560
Net Asset Value per Share
Taiwan EquityUSD
AC 12.8710.296.65
AD 12.8310.286.65
EC 12.7810.27N/A
Total Net Assets 4,420,988 7,187,878 35,195,281
Net Asset Value per Share
Comparative Table of Net Assets
at 31 March 2010at 31 March 2009 at 31 March 2011
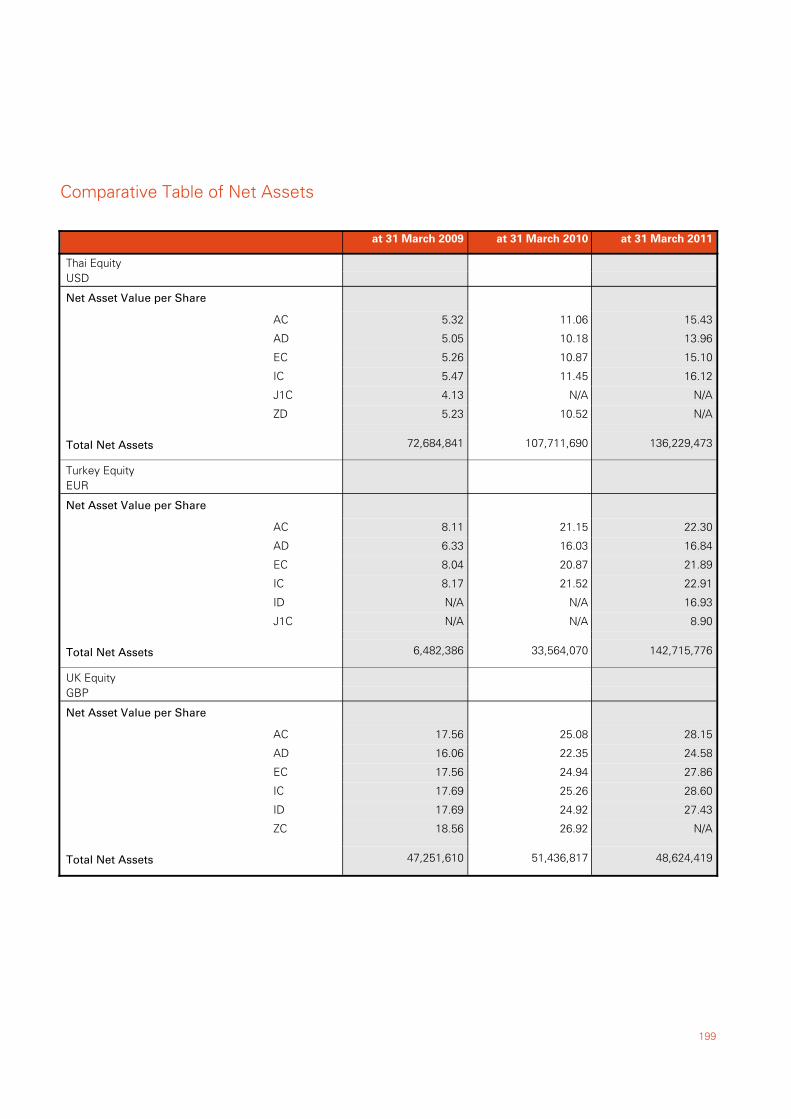
199
Thai EquityUSD
AC 15.4311.065.32
AD 13.9610.185.05
EC 15.1010.875.26
IC 16.1211.455.47
J1C N/AN/A4.13
ZD N/A10.525.23
Total Net Assets 72,684,841 107,711,690 136,229,473
Net Asset Value per Share
Turkey EquityEUR
AC 22.3021.158.11
AD 16.8416.036.33
EC 21.8920.878.04
IC 22.9121.528.17
ID 16.93N/AN/A
J1C 8.90N/AN/A
Total Net Assets 6,482,386 33,564,070 142,715,776
Net Asset Value per Share
UK EquityGBP
AC 28.1525.0817.56
AD 24.5822.3516.06
EC 27.8624.9417.56
IC 28.6025.2617.69
ID 27.4324.9217.69
ZC N/A26.9218.56
Total Net Assets 47,251,610 51,436,817 48,624,419
Net Asset Value per Share
Comparative Table of Net Assets
at 31 March 2010at 31 March 2009 at 31 March 2011
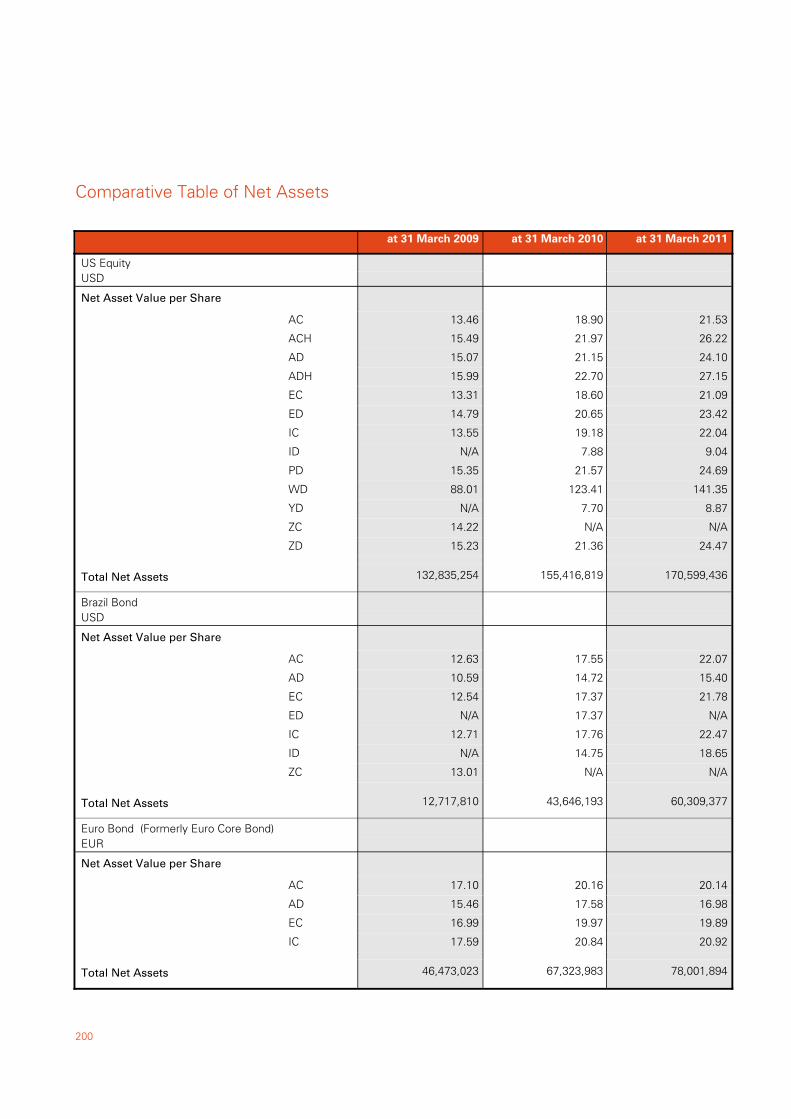
200
US EquityUSD
AC 21.5318.9013.46
ACH 26.2221.9715.49
AD 24.1021.1515.07
ADH 27.1522.7015.99
EC 21.0918.6013.31
ED 23.4220.6514.79
IC 22.0419.1813.55
ID 9.047.88N/A
PD 24.6921.5715.35
WD 141.35123.4188.01
YD 8.877.70N/A
ZC N/AN/A14.22
ZD 24.4721.3615.23
Total Net Assets 132,835,254 155,416,819 170,599,436
Net Asset Value per Share
Brazil BondUSD
AC 22.0717.5512.63
AD 15.4014.7210.59
EC 21.7817.3712.54
ED N/A17.37N/A
IC 22.4717.7612.71
ID 18.6514.75N/A
ZC N/AN/A13.01
Total Net Assets 12,717,810 43,646,193 60,309,377
Net Asset Value per Share
Euro Bond (Formerly Euro Core Bond)EUR
AC 20.1420.1617.10
AD 16.9817.5815.46
EC 19.8919.9716.99
IC 20.9220.8417.59
Total Net Assets 46,473,023 67,323,983 78,001,894
Net Asset Value per Share
Comparative Table of Net Assets
at 31 March 2010at 31 March 2009 at 31 March 2011
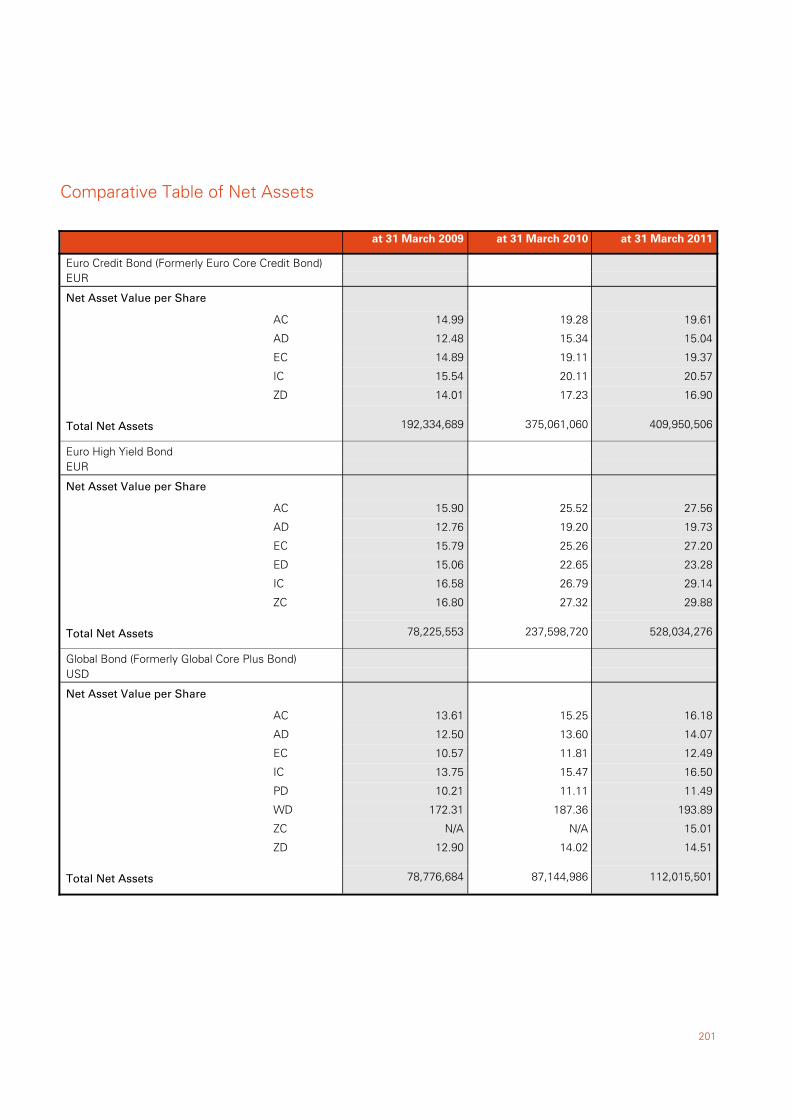
201
Euro Credit Bond (Formerly Euro Core Credit Bond)EUR
AC 19.6119.2814.99
AD 15.0415.3412.48
EC 19.3719.1114.89
IC 20.5720.1115.54
ZD 16.9017.2314.01
Total Net Assets 192,334,689 375,061,060 409,950,506
Net Asset Value per Share
Euro High Yield BondEUR
AC 27.5625.5215.90
AD 19.7319.2012.76
EC 27.2025.2615.79
ED 23.2822.6515.06
IC 29.1426.7916.58
ZC 29.8827.3216.80
Total Net Assets 78,225,553 237,598,720 528,034,276
Net Asset Value per Share
Global Bond (Formerly Global Core Plus Bond)USD
AC 16.1815.2513.61
AD 14.0713.6012.50
EC 12.4911.8110.57
IC 16.5015.4713.75
PD 11.4911.1110.21
WD 193.89187.36172.31
ZC 15.01N/AN/A
ZD 14.5114.0212.90
Total Net Assets 78,776,684 87,144,986 112,015,501
Net Asset Value per Share
Comparative Table of Net Assets
at 31 March 2010at 31 March 2009 at 31 March 2011
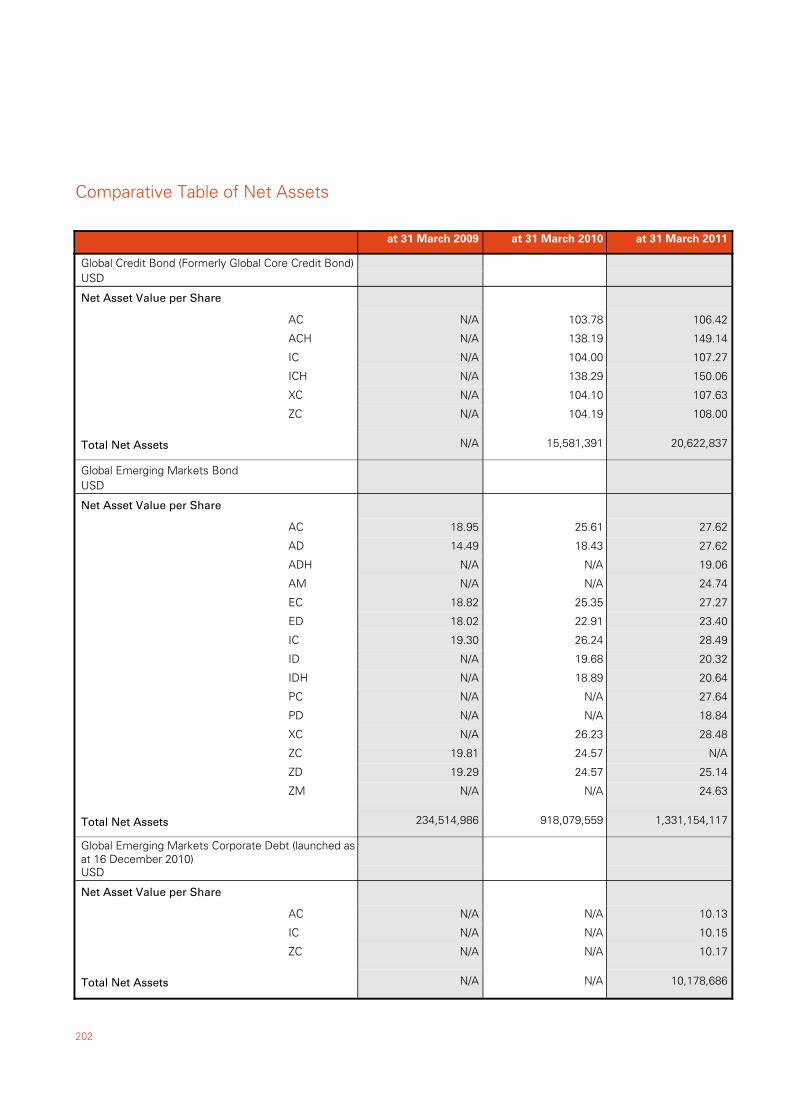
202
Global Credit Bond (Formerly Global Core Credit Bond)USD
AC 106.42103.78N/A
ACH 149.14138.19N/A
IC 107.27104.00N/A
ICH 150.06138.29N/A
XC 107.63104.10N/A
ZC 108.00104.19N/A
Total Net Assets N/A 15,581,391 20,622,837
Net Asset Value per Share
Global Emerging Markets BondUSD
AC 27.6225.6118.95
AD 27.6218.4314.49
ADH 19.06N/AN/A
AM 24.74N/AN/A
EC 27.2725.3518.82
ED 23.4022.9118.02
IC 28.4926.2419.30
ID 20.3219.68N/A
IDH 20.6418.89N/A
PC 27.64N/AN/A
PD 18.84N/AN/A
XC 28.4826.23N/A
ZC N/A24.5719.81
ZD 25.1424.5719.29
ZM 24.63N/AN/A
Total Net Assets 234,514,986 918,079,559 1,331,154,117
Net Asset Value per Share
Global Emerging Markets Corporate Debt (launched asat 16 December 2010)USD
AC 10.13N/AN/A
IC 10.15N/AN/A
ZC 10.17N/AN/A
Total Net Assets N/A N/A 10,178,686
Net Asset Value per Share
Comparative Table of Net Assets
at 31 March 2010at 31 March 2009 at 31 March 2011
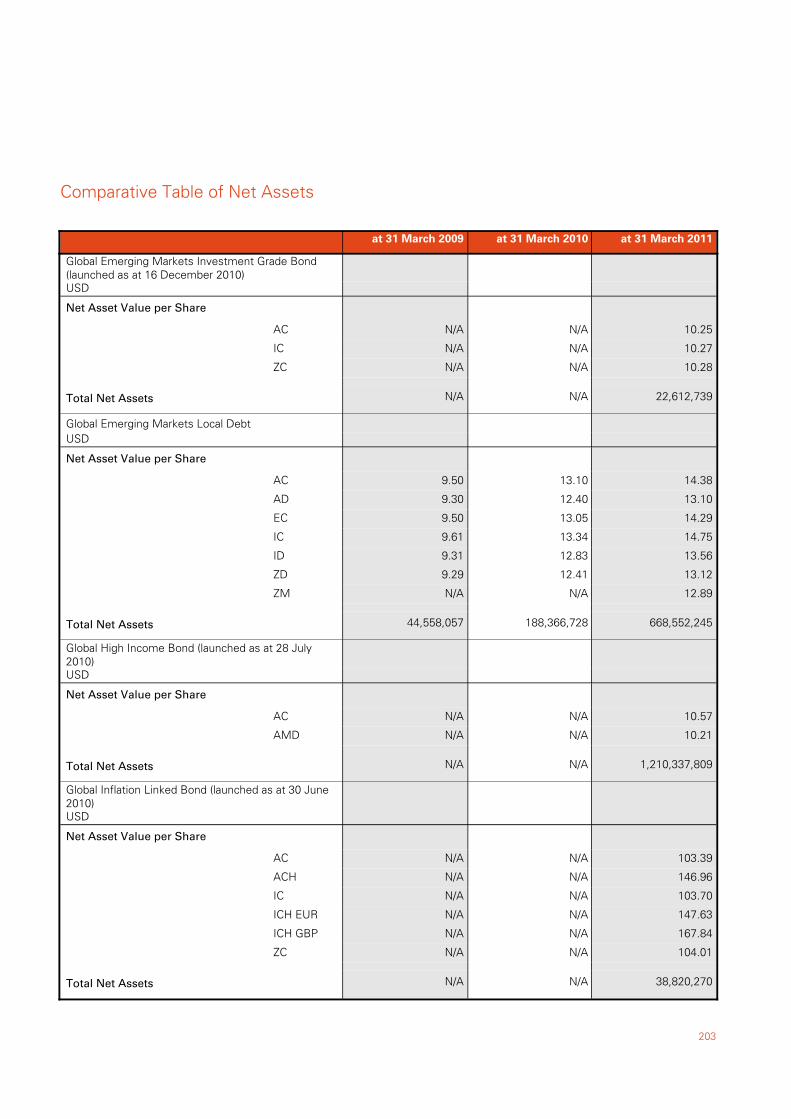
203
Global Emerging Markets Investment Grade Bond(launched as at 16 December 2010)USD
AC 10.25N/AN/A
IC 10.27N/AN/A
ZC 10.28N/AN/A
Total Net Assets N/A N/A 22,612,739
Net Asset Value per Share
Global Emerging Markets Local DebtUSD
AC 14.3813.109.50
AD 13.1012.409.30
EC 14.2913.059.50
IC 14.7513.349.61
ID 13.5612.839.31
ZD 13.1212.419.29
ZM 12.89N/AN/A
Total Net Assets 44,558,057 188,366,728 668,552,245
Net Asset Value per Share
Global High Income Bond (launched as at 28 July2010)USD
AC 10.57N/AN/A
AMD 10.21N/AN/A
Total Net Assets N/A N/A 1,210,337,809
Net Asset Value per Share
Global Inflation Linked Bond (launched as at 30 June2010)USD
AC 103.39N/AN/A
ACH 146.96N/AN/A
IC 103.70N/AN/A
ICH EUR 147.63N/AN/A
ICH GBP 167.84N/AN/A
ZC 104.01N/AN/A
Total Net Assets N/A N/A 38,820,270
Net Asset Value per Share
Comparative Table of Net Assets
at 31 March 2010at 31 March 2009 at 31 March 2011
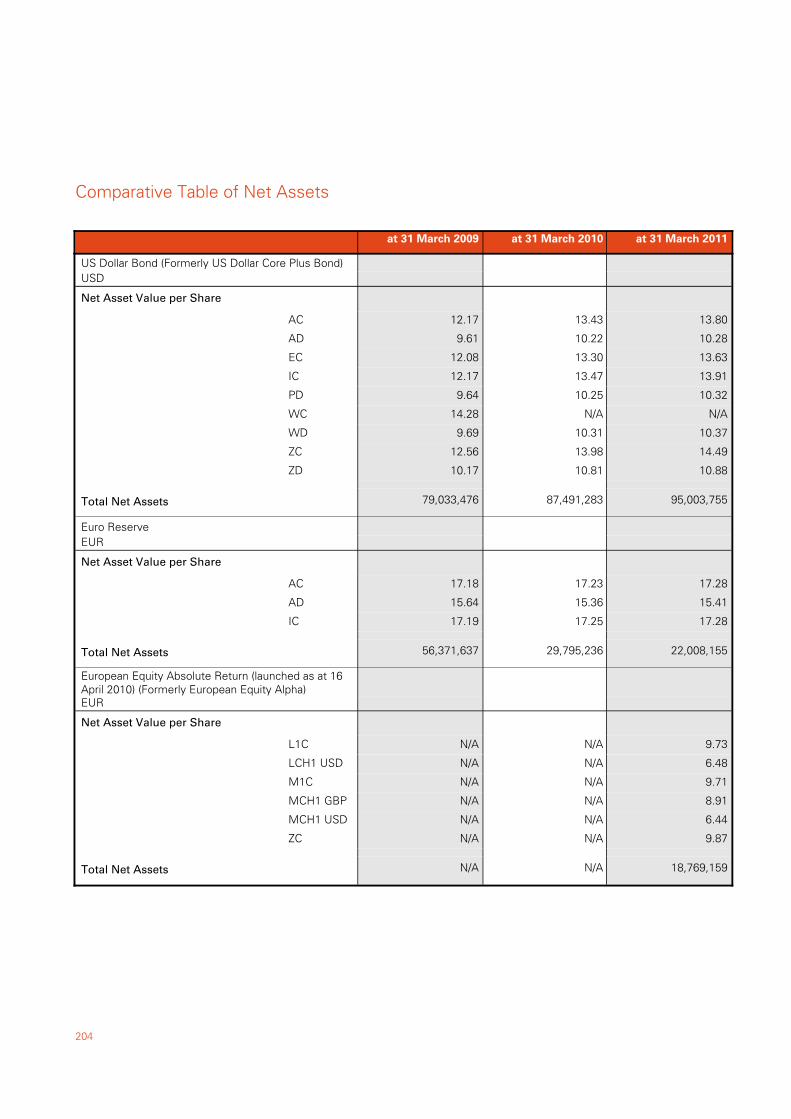
204
US Dollar Bond (Formerly US Dollar Core Plus Bond)USD
AC 13.8013.4312.17
AD 10.2810.229.61
EC 13.6313.3012.08
IC 13.9113.4712.17
PD 10.3210.259.64
WC N/AN/A14.28
WD 10.3710.319.69
ZC 14.4913.9812.56
ZD 10.8810.8110.17
Total Net Assets 79,033,476 87,491,283 95,003,755
Net Asset Value per Share
Euro ReserveEUR
AC 17.2817.2317.18
AD 15.4115.3615.64
IC 17.2817.2517.19
Total Net Assets 56,371,637 29,795,236 22,008,155
Net Asset Value per Share
European Equity Absolute Return (launched as at 16April 2010) (Formerly European Equity Alpha)EUR
L1C 9.73N/AN/A
LCH1 USD 6.48N/AN/A
M1C 9.71N/AN/A
MCH1 GBP 8.91N/AN/A
MCH1 USD 6.44N/AN/A
ZC 9.87N/AN/A
Total Net Assets N/A N/A 18,769,159
Net Asset Value per Share
Comparative Table of Net Assets
at 31 March 2010at 31 March 2009 at 31 March 2011
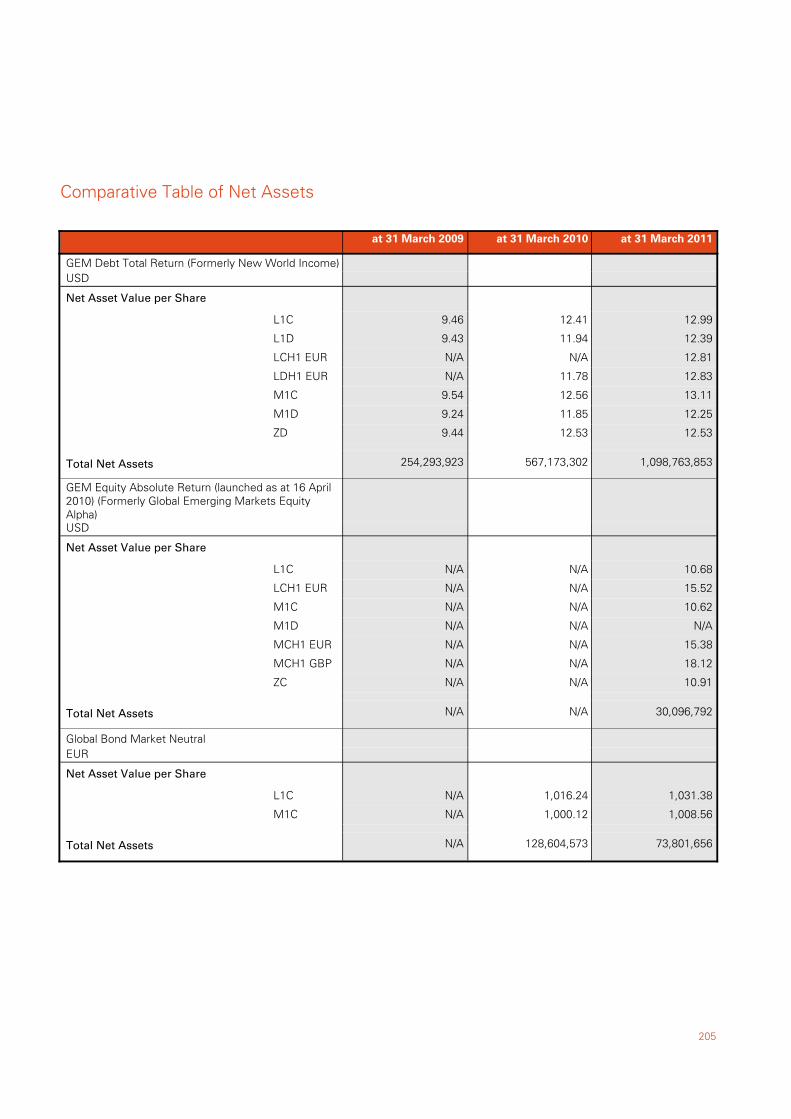
205
GEM Debt Total Return (Formerly New World Income)USD
L1C 12.9912.419.46
L1D 12.3911.949.43
LCH1 EUR 12.81N/AN/A
LDH1 EUR 12.8311.78N/A
M1C 13.1112.569.54
M1D 12.2511.859.24
ZD 12.5312.539.44
Total Net Assets 254,293,923 567,173,302 1,098,763,853
Net Asset Value per Share
GEM Equity Absolute Return (launched as at 16 April2010) (Formerly Global Emerging Markets EquityAlpha)USD
L1C 10.68N/AN/A
LCH1 EUR 15.52N/AN/A
M1C 10.62N/AN/A
M1D N/AN/AN/A
MCH1 EUR 15.38N/AN/A
MCH1 GBP 18.12N/AN/A
ZC 10.91N/AN/A
Total Net Assets N/A N/A 30,096,792
Net Asset Value per Share
Global Bond Market NeutralEUR
L1C 1,031.381,016.24N/A
M1C 1,008.561,000.12N/A
Total Net Assets N/A 128,604,573 73,801,656
Net Asset Value per Share
Comparative Table of Net Assets
at 31 March 2010at 31 March 2009 at 31 March 2011
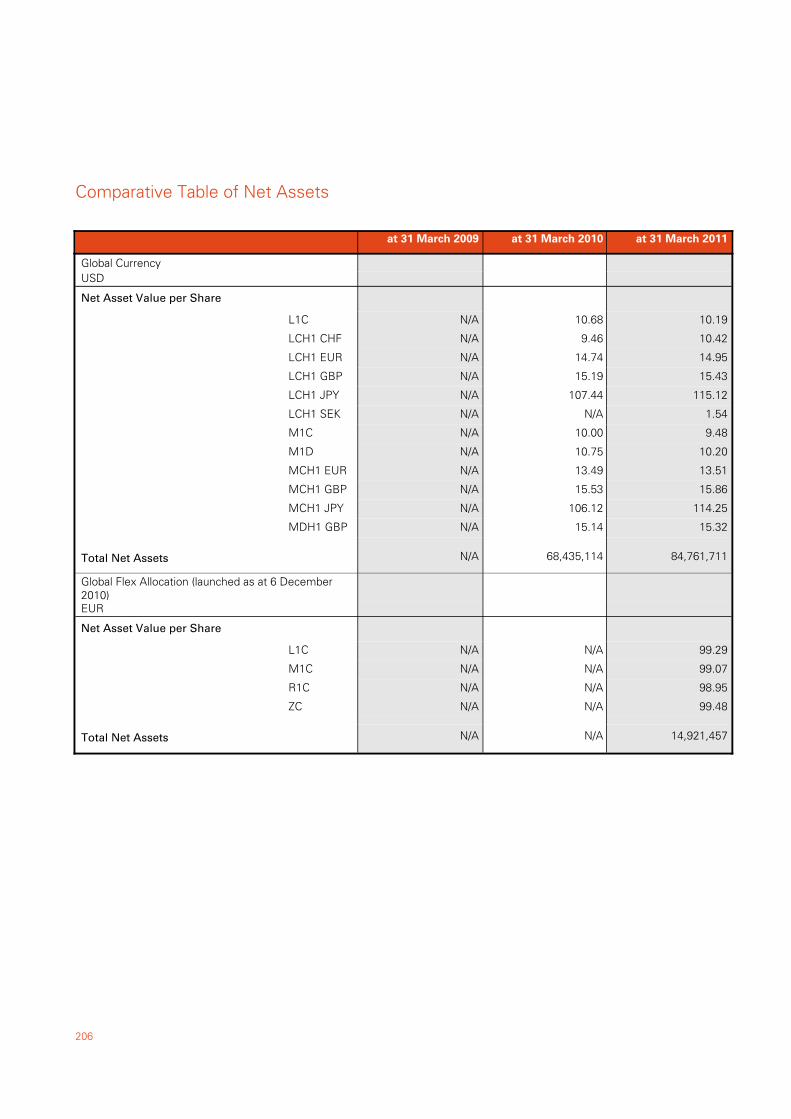
206
Global CurrencyUSD
L1C 10.1910.68N/A
LCH1 CHF 10.429.46N/A
LCH1 EUR 14.9514.74N/A
LCH1 GBP 15.4315.19N/A
LCH1 JPY 115.12107.44N/A
LCH1 SEK 1.54N/AN/A
M1C 9.4810.00N/A
M1D 10.2010.75N/A
MCH1 EUR 13.5113.49N/A
MCH1 GBP 15.8615.53N/A
MCH1 JPY 114.25106.12N/A
MDH1 GBP 15.3215.14N/A
Total Net Assets N/A 68,435,114 84,761,711
Net Asset Value per Share
Global Flex Allocation (launched as at 6 December2010)EUR
L1C 99.29N/AN/A
M1C 99.07N/AN/A
R1C 98.95N/AN/A
ZC 99.48N/AN/A
Total Net Assets N/A N/A 14,921,457
Net Asset Value per Share
Comparative Table of Net Assets
at 31 March 2010at 31 March 2009 at 31 March 2011
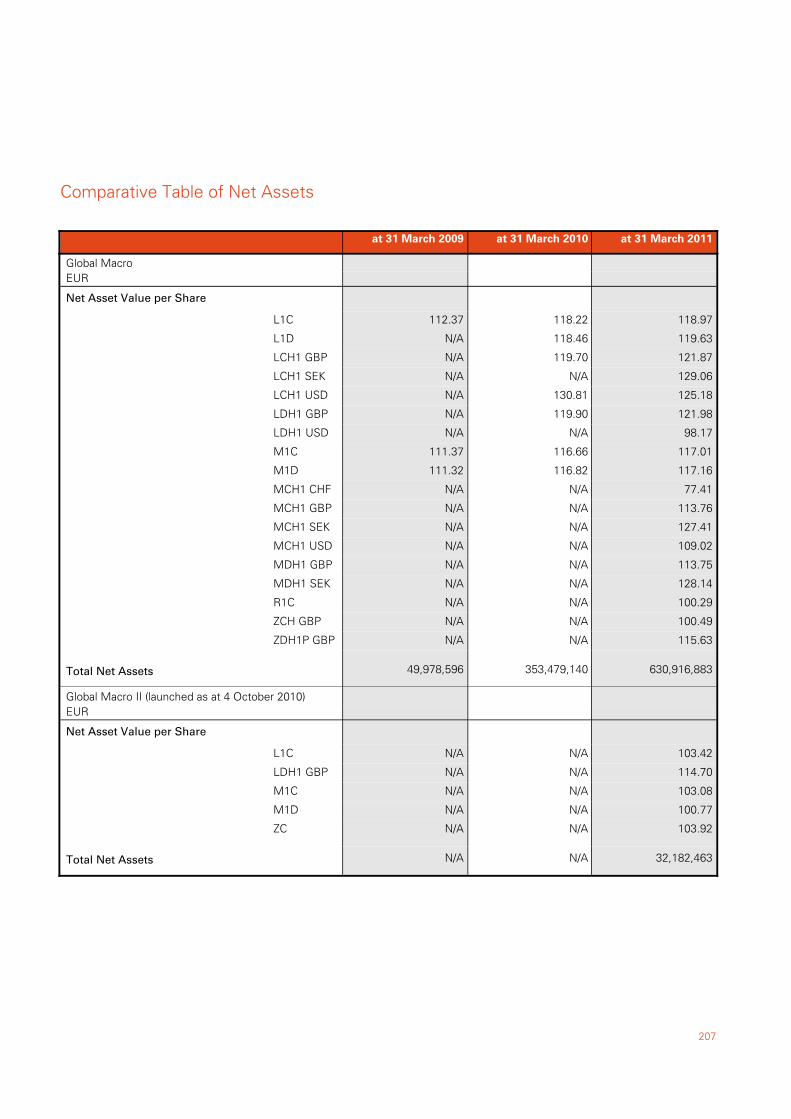
207
Global MacroEUR
L1C 118.97118.22112.37
L1D 119.63118.46N/A
LCH1 GBP 121.87119.70N/A
LCH1 SEK 129.06N/AN/A
LCH1 USD 125.18130.81N/A
LDH1 GBP 121.98119.90N/A
LDH1 USD 98.17N/AN/A
M1C 117.01116.66111.37
M1D 117.16116.82111.32
MCH1 CHF 77.41N/AN/A
MCH1 GBP 113.76N/AN/A
MCH1 SEK 127.41N/AN/A
MCH1 USD 109.02N/AN/A
MDH1 GBP 113.75N/AN/A
MDH1 SEK 128.14N/AN/A
R1C 100.29N/AN/A
ZCH GBP 100.49N/AN/A
ZDH1P GBP 115.63N/AN/A
Total Net Assets 49,978,596 353,479,140 630,916,883
Net Asset Value per Share
Global Macro II (launched as at 4 October 2010)EUR
L1C 103.42N/AN/A
LDH1 GBP 114.70N/AN/A
M1C 103.08N/AN/A
M1D 100.77N/AN/A
ZC 103.92N/AN/A
Total Net Assets N/A N/A 32,182,463
Net Asset Value per Share
Comparative Table of Net Assets
at 31 March 2010at 31 March 2009 at 31 March 2011
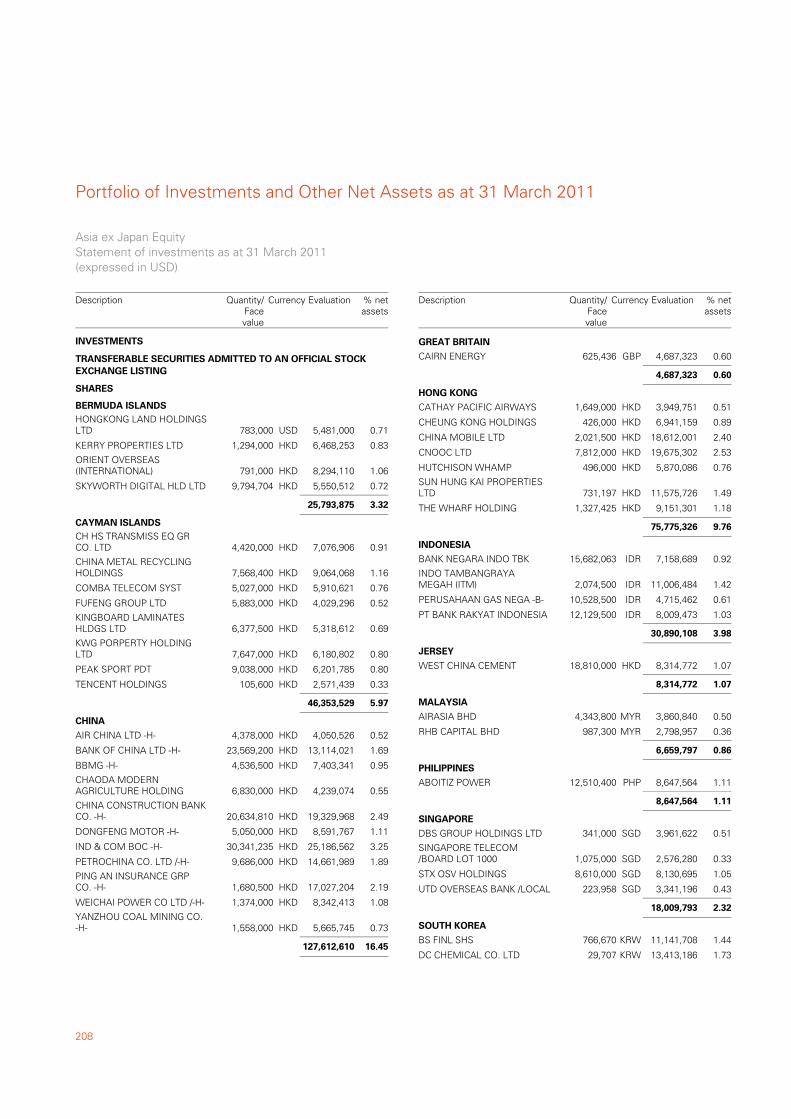
Portfolio of Investments and Other Net Assets as at 31 March 2011
208
HONGKONG LAND HOLDINGSLTD 783,000 5,481,000 0.71USD
TRANSFERABLE SECURITIES ADMITTED TO AN OFFICIAL STOCKEXCHANGE LISTING
SHARES
BERMUDA ISLANDS
KERRY PROPERTIES LTD 1,294,000 6,468,253 0.83HKD
ORIENT OVERSEAS(INTERNATIONAL) 791,000 8,294,110 1.06HKD
SKYWORTH DIGITAL HLD LTD 9,794,704 5,550,512 0.72HKD
25,793,875 3.32
CH HS TRANSMISS EQ GRCO. LTD 4,420,000 7,076,906 0.91HKD
CAYMAN ISLANDS
CHINA METAL RECYCLINGHOLDINGS 7,568,400 9,064,068 1.16HKD
COMBA TELECOM SYST 5,027,000 5,910,621 0.76HKD
FUFENG GROUP LTD 5,883,000 4,029,296 0.52HKD
KINGBOARD LAMINATESHLDGS LTD 6,377,500 5,318,612 0.69HKD
KWG PORPERTY HOLDINGLTD 7,647,000 6,180,802 0.80HKD
PEAK SPORT PDT 9,038,000 6,201,785 0.80HKD
TENCENT HOLDINGS 105,600 2,571,439 0.33HKD
46,353,529 5.97
AIR CHINA LTD -H- 4,378,000 4,050,526 0.52HKD
CHINA
BANK OF CHINA LTD -H- 23,569,200 13,114,021 1.69HKD
BBMG -H- 4,536,500 7,403,341 0.95HKD
CHAODA MODERNAGRICULTURE HOLDING 6,830,000 4,239,074 0.55HKD
CHINA CONSTRUCTION BANKCO. -H- 20,634,810 19,329,968 2.49HKD
DONGFENG MOTOR -H- 5,050,000 8,591,767 1.11HKD
IND & COM BOC -H- 30,341,235 25,186,562 3.25HKD
PETROCHINA CO. LTD /-H- 9,686,000 14,661,989 1.89HKD
PING AN INSURANCE GRPCO. -H- 1,680,500 17,027,204 2.19HKD
WEICHAI POWER CO LTD /-H- 1,374,000 8,342,413 1.08HKD
YANZHOU COAL MINING CO.-H- 1,558,000 5,665,745 0.73HKD
127,612,610 16.45
INVESTMENTS
Asia ex Japan EquityStatement of investments as at 31 March 2011(expressed in USD)
Description Currency Evaluation % netassets
Quantity/Facevalue
CAIRN ENERGY 625,436 4,687,323 0.60GBP
GREAT BRITAIN
4,687,323 0.60
CATHAY PACIFIC AIRWAYS 1,649,000 3,949,751 0.51HKD
HONG KONG
CHEUNG KONG HOLDINGS 426,000 6,941,159 0.89HKD
CHINA MOBILE LTD 2,021,500 18,612,001 2.40HKD
CNOOC LTD 7,812,000 19,675,302 2.53HKD
HUTCHISON WHAMP 496,000 5,870,086 0.76HKD
SUN HUNG KAI PROPERTIESLTD 731,197 11,575,726 1.49HKD
THE WHARF HOLDING 1,327,425 9,151,301 1.18HKD
75,775,326 9.76
BANK NEGARA INDO TBK 15,682,063 7,158,689 0.92IDR
INDONESIA
INDO TAMBANGRAYAMEGAH (ITM) 2,074,500 11,006,484 1.42IDR
PERUSAHAAN GAS NEGA -B- 10,528,500 4,715,462 0.61IDR
PT BANK RAKYAT INDONESIA 12,129,500 8,009,473 1.03IDR
30,890,108 3.98
WEST CHINA CEMENT 18,810,000 8,314,772 1.07HKD
JERSEY
8,314,772 1.07
AIRASIA BHD 4,343,800 3,860,840 0.50MYR
MALAYSIA
RHB CAPITAL BHD 987,300 2,798,957 0.36MYR
6,659,797 0.86
ABOITIZ POWER 12,510,400 8,647,564 1.11PHP
PHILIPPINES
8,647,564 1.11
DBS GROUP HOLDINGS LTD 341,000 3,961,622 0.51SGD
SINGAPORE
SINGAPORE TELECOM/BOARD LOT 1000 1,075,000 2,576,280 0.33SGD
STX OSV HOLDINGS 8,610,000 8,130,695 1.05SGD
UTD OVERSEAS BANK /LOCAL 223,958 3,341,196 0.43SGD
18,009,793 2.32
BS FINL SHS 766,670 11,141,708 1.44KRW
SOUTH KOREA
DC CHEMICAL CO. LTD 29,707 13,413,186 1.73KRW
Description Currency Evaluation % netassets
Quantity/Facevalue
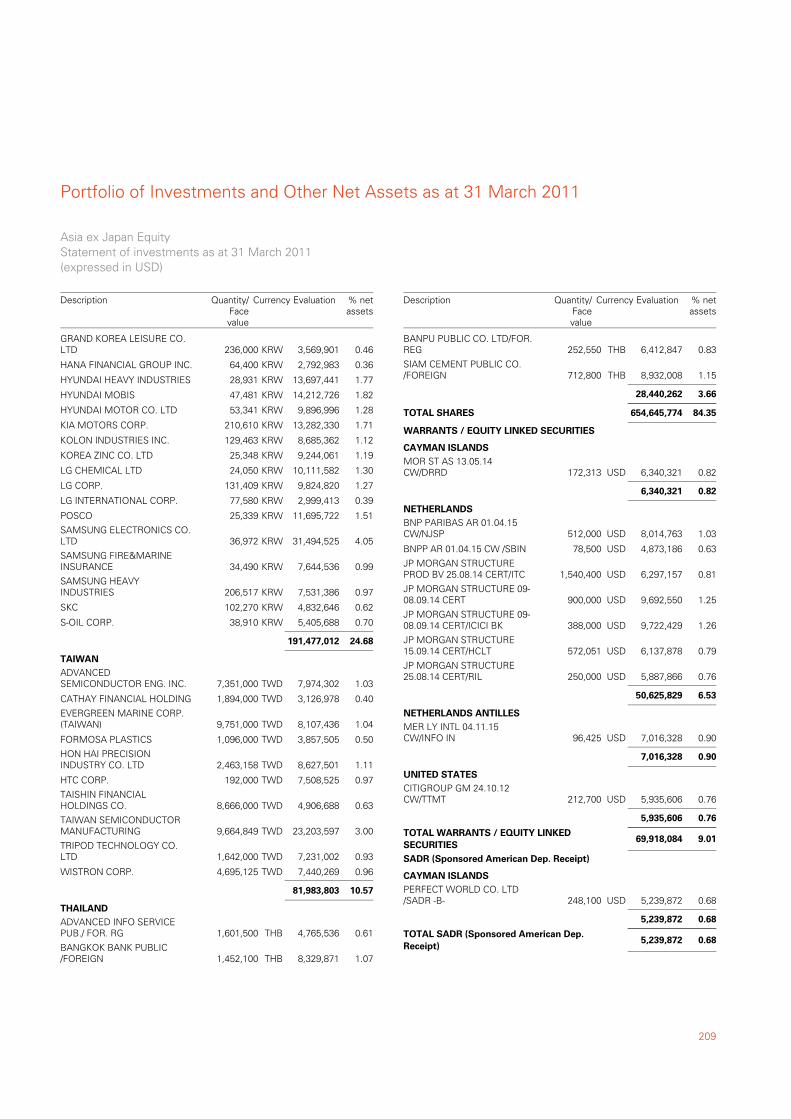
209
Portfolio of Investments and Other Net Assets as at 31 March 2011
GRAND KOREA LEISURE CO.LTD 236,000 3,569,901 0.46KRW
HANA FINANCIAL GROUP INC. 64,400 2,792,983 0.36KRW
HYUNDAI HEAVY INDUSTRIES 28,931 13,697,441 1.77KRW
HYUNDAI MOBIS 47,481 14,212,726 1.82KRW
HYUNDAI MOTOR CO. LTD 53,341 9,896,996 1.28KRW
KIA MOTORS CORP. 210,610 13,282,330 1.71KRW
KOLON INDUSTRIES INC. 129,463 8,685,362 1.12KRW
KOREA ZINC CO. LTD 25,348 9,244,061 1.19KRW
LG CHEMICAL LTD 24,050 10,111,582 1.30KRW
LG CORP. 131,409 9,824,820 1.27KRW
LG INTERNATIONAL CORP. 77,580 2,999,413 0.39KRW
POSCO 25,339 11,695,722 1.51KRW
SAMSUNG ELECTRONICS CO.LTD 36,972 31,494,525 4.05KRW
SAMSUNG FIRE&MARINEINSURANCE 34,490 7,644,536 0.99KRW
SAMSUNG HEAVYINDUSTRIES 206,517 7,531,386 0.97KRW
SKC 102,270 4,832,646 0.62KRW
S-OIL CORP. 38,910 5,405,688 0.70KRW
191,477,012 24.68
ADVANCEDSEMICONDUCTOR ENG. INC. 7,351,000 7,974,302 1.03TWD
TAIWAN
CATHAY FINANCIAL HOLDING 1,894,000 3,126,978 0.40TWD
EVERGREEN MARINE CORP.(TAIWAN) 9,751,000 8,107,436 1.04TWD
FORMOSA PLASTICS 1,096,000 3,857,505 0.50TWD
HON HAI PRECISIONINDUSTRY CO. LTD 2,463,158 8,627,501 1.11TWD
HTC CORP. 192,000 7,508,525 0.97TWD
TAISHIN FINANCIALHOLDINGS CO. 8,666,000 4,906,688 0.63TWD
TAIWAN SEMICONDUCTORMANUFACTURING 9,664,849 23,203,597 3.00TWD
TRIPOD TECHNOLOGY CO.LTD 1,642,000 7,231,002 0.93TWD
WISTRON CORP. 4,695,125 7,440,269 0.96TWD
81,983,803 10.57
ADVANCED INFO SERVICEPUB./ FOR. RG 1,601,500 4,765,536 0.61THB
THAILAND
BANGKOK BANK PUBLIC/FOREIGN 1,452,100 8,329,871 1.07THB
Asia ex Japan EquityStatement of investments as at 31 March 2011(expressed in USD)
Description Currency Evaluation % netassets
Quantity/Facevalue
BANPU PUBLIC CO. LTD/FOR.REG 252,550 6,412,847 0.83THB
SIAM CEMENT PUBLIC CO./FOREIGN 712,800 8,932,008 1.15THB
28,440,262 3.66
84.35654,645,774TOTAL SHARES
MOR ST AS 13.05.14CW/DRRD 172,313 6,340,321 0.82USD
WARRANTS / EQUITY LINKED SECURITIES
CAYMAN ISLANDS
6,340,321 0.82
BNP PARIBAS AR 01.04.15CW/NJSP 512,000 8,014,763 1.03USD
NETHERLANDS
BNPP AR 01.04.15 CW /SBIN 78,500 4,873,186 0.63USD
JP MORGAN STRUCTUREPROD BV 25.08.14 CERT/ITC 1,540,400 6,297,157 0.81USD
JP MORGAN STRUCTURE 09-08.09.14 CERT 900,000 9,692,550 1.25USD
JP MORGAN STRUCTURE 09-08.09.14 CERT/ICICI BK 388,000 9,722,429 1.26USD
JP MORGAN STRUCTURE15.09.14 CERT/HCLT 572,051 6,137,878 0.79USD
JP MORGAN STRUCTURE25.08.14 CERT/RIL 250,000 5,887,866 0.76USD
50,625,829 6.53
MER LY INTL 04.11.15CW/INFO IN 96,425 7,016,328 0.90USD
NETHERLANDS ANTILLES
7,016,328 0.90
CITIGROUP GM 24.10.12CW/TTMT 212,700 5,935,606 0.76USD
UNITED STATES
5,935,606 0.76
9.0169,918,084TOTAL WARRANTS / EQUITY LINKEDSECURITIES
PERFECT WORLD CO. LTD/SADR -B- 248,100 5,239,872 0.68USD
SADR (Sponsored American Dep. Receipt)
CAYMAN ISLANDS
5,239,872 0.68
0.685,239,872TOTAL SADR (Sponsored American Dep.Receipt)
Description Currency Evaluation % netassets
Quantity/Facevalue
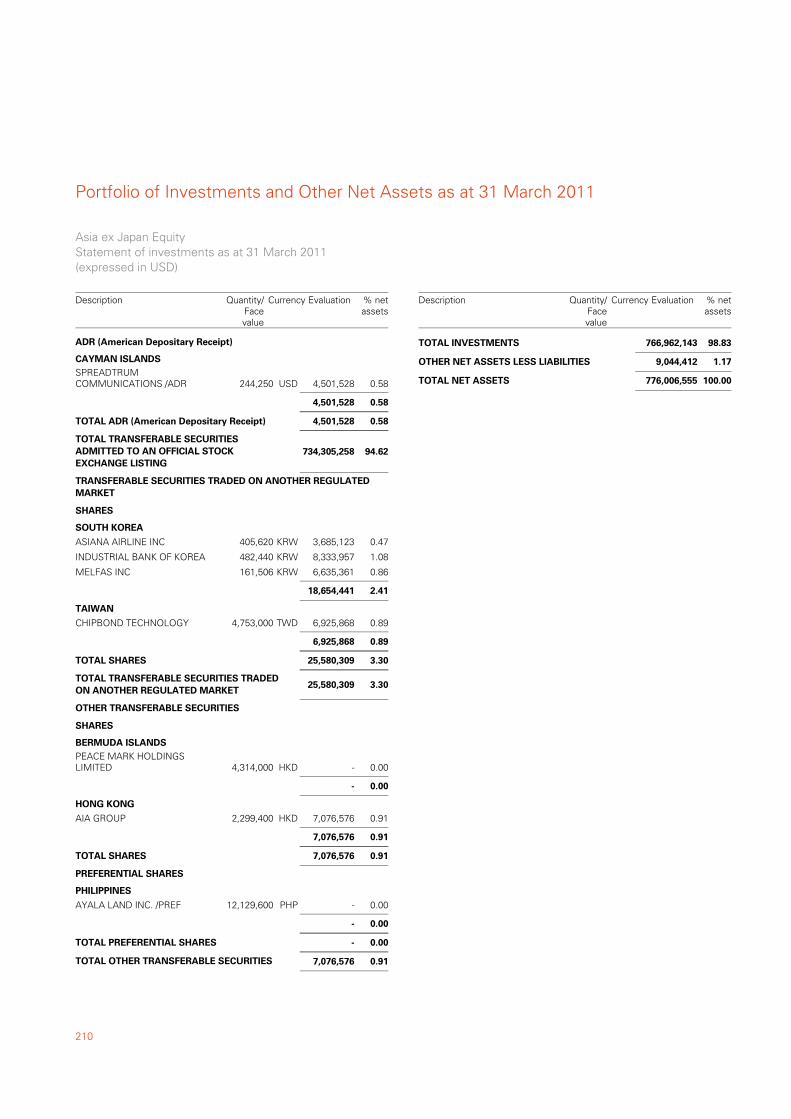
Portfolio of Investments and Other Net Assets as at 31 March 2011
210
SPREADTRUMCOMMUNICATIONS /ADR 244,250 4,501,528 0.58USD
ADR (American Depositary Receipt)
CAYMAN ISLANDS
4,501,528 0.58
0.584,501,528TOTAL ADR (American Depositary Receipt)
94.62TOTAL TRANSFERABLE SECURITIESADMITTED TO AN OFFICIAL STOCKEXCHANGE LISTING
734,305,258
ASIANA AIRLINE INC 405,620 3,685,123 0.47KRW
TRANSFERABLE SECURITIES TRADED ON ANOTHER REGULATEDMARKET
SHARES
SOUTH KOREA
INDUSTRIAL BANK OF KOREA 482,440 8,333,957 1.08KRW
MELFAS INC 161,506 6,635,361 0.86KRW
18,654,441 2.41
CHIPBOND TECHNOLOGY 4,753,000 6,925,868 0.89TWD
TAIWAN
6,925,868 0.89
3.3025,580,309TOTAL SHARES
3.30TOTAL TRANSFERABLE SECURITIES TRADEDON ANOTHER REGULATED MARKET
25,580,309
PEACE MARK HOLDINGSLIMITED 4,314,000 - 0.00HKD
OTHER TRANSFERABLE SECURITIES
SHARES
BERMUDA ISLANDS
- 0.00
AIA GROUP 2,299,400 7,076,576 0.91HKD
HONG KONG
7,076,576 0.91
0.917,076,576TOTAL SHARES
AYALA LAND INC. /PREF 12,129,600 - 0.00PHP
PREFERENTIAL SHARES
PHILIPPINES
- 0.00
0.00-TOTAL PREFERENTIAL SHARES
0.91TOTAL OTHER TRANSFERABLE SECURITIES 7,076,576
Asia ex Japan EquityStatement of investments as at 31 March 2011(expressed in USD)
Description Currency Evaluation % netassets
Quantity/Facevalue
98.83TOTAL INVESTMENTS 766,962,143
1.17OTHER NET ASSETS LESS LIABILITIES 9,044,412
100.00TOTAL NET ASSETS 776,006,555
Description Currency Evaluation % netassets
Quantity/Facevalue
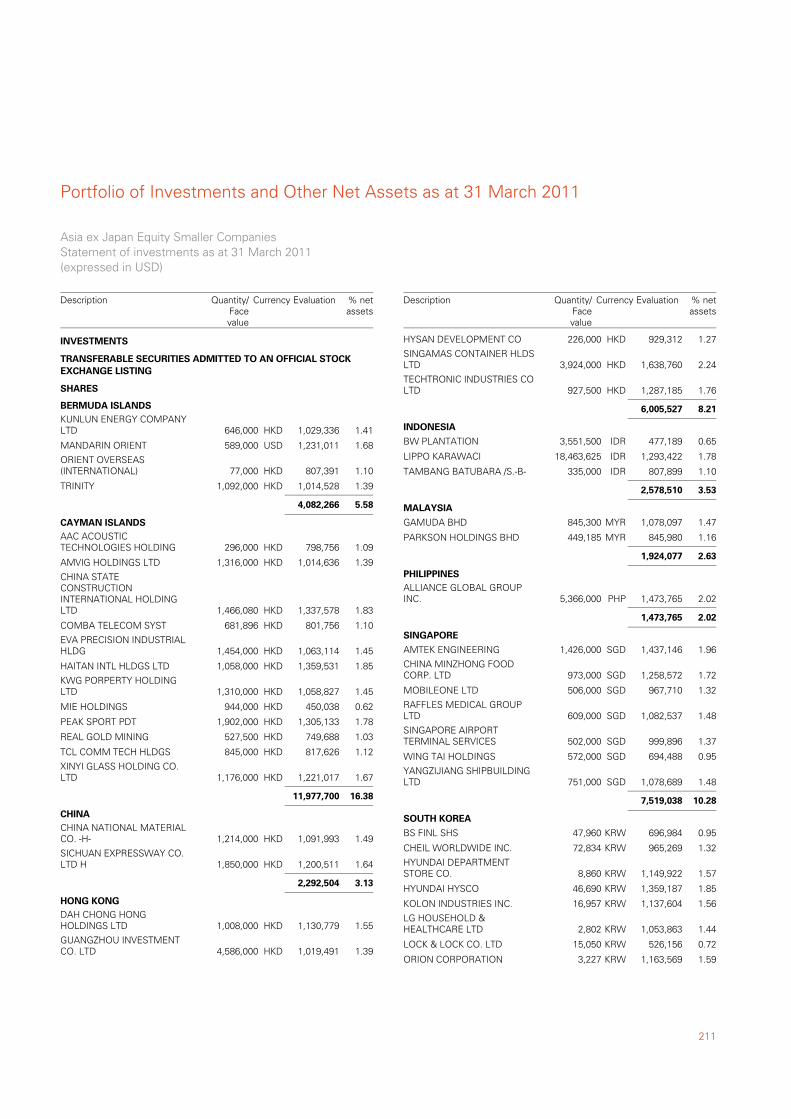
211
Portfolio of Investments and Other Net Assets as at 31 March 2011
KUNLUN ENERGY COMPANYLTD 646,000 1,029,336 1.41HKD
TRANSFERABLE SECURITIES ADMITTED TO AN OFFICIAL STOCKEXCHANGE LISTING
SHARES
BERMUDA ISLANDS
MANDARIN ORIENT 589,000 1,231,011 1.68USD
ORIENT OVERSEAS(INTERNATIONAL) 77,000 807,391 1.10HKD
TRINITY 1,092,000 1,014,528 1.39HKD
4,082,266 5.58
AAC ACOUSTICTECHNOLOGIES HOLDING 296,000 798,756 1.09HKD
CAYMAN ISLANDS
AMVIG HOLDINGS LTD 1,316,000 1,014,636 1.39HKD
CHINA STATECONSTRUCTIONINTERNATIONAL HOLDINGLTD 1,466,080 1,337,578 1.83HKD
COMBA TELECOM SYST 681,896 801,756 1.10HKD
EVA PRECISION INDUSTRIALHLDG 1,454,000 1,063,114 1.45HKD
HAITAN INTL HLDGS LTD 1,058,000 1,359,531 1.85HKD
KWG PORPERTY HOLDINGLTD 1,310,000 1,058,827 1.45HKD
MIE HOLDINGS 944,000 450,038 0.62HKD
PEAK SPORT PDT 1,902,000 1,305,133 1.78HKD
REAL GOLD MINING 527,500 749,688 1.03HKD
TCL COMM TECH HLDGS 845,000 817,626 1.12HKD
XINYI GLASS HOLDING CO.LTD 1,176,000 1,221,017 1.67HKD
11,977,700 16.38
CHINA NATIONAL MATERIALCO. -H- 1,214,000 1,091,993 1.49HKD
CHINA
SICHUAN EXPRESSWAY CO.LTD H 1,850,000 1,200,511 1.64HKD
2,292,504 3.13
DAH CHONG HONGHOLDINGS LTD 1,008,000 1,130,779 1.55HKD
HONG KONG
GUANGZHOU INVESTMENTCO. LTD 4,586,000 1,019,491 1.39HKD
INVESTMENTS
Asia ex Japan Equity Smaller CompaniesStatement of investments as at 31 March 2011(expressed in USD)
Description Currency Evaluation % netassets
Quantity/Facevalue
HYSAN DEVELOPMENT CO 226,000 929,312 1.27HKD
SINGAMAS CONTAINER HLDSLTD 3,924,000 1,638,760 2.24HKD
TECHTRONIC INDUSTRIES COLTD 927,500 1,287,185 1.76HKD
6,005,527 8.21
BW PLANTATION 3,551,500 477,189 0.65IDR
INDONESIA
LIPPO KARAWACI 18,463,625 1,293,422 1.78IDR
TAMBANG BATUBARA /S.-B- 335,000 807,899 1.10IDR
2,578,510 3.53
GAMUDA BHD 845,300 1,078,097 1.47MYR
MALAYSIA
PARKSON HOLDINGS BHD 449,185 845,980 1.16MYR
1,924,077 2.63
ALLIANCE GLOBAL GROUPINC. 5,366,000 1,473,765 2.02PHP
PHILIPPINES
1,473,765 2.02
AMTEK ENGINEERING 1,426,000 1,437,146 1.96SGD
SINGAPORE
CHINA MINZHONG FOODCORP. LTD 973,000 1,258,572 1.72SGD
MOBILEONE LTD 506,000 967,710 1.32SGD
RAFFLES MEDICAL GROUPLTD 609,000 1,082,537 1.48SGD
SINGAPORE AIRPORTTERMINAL SERVICES 502,000 999,896 1.37SGD
WING TAI HOLDINGS 572,000 694,488 0.95SGD
YANGZIJIANG SHIPBUILDINGLTD 751,000 1,078,689 1.48SGD
7,519,038 10.28
BS FINL SHS 47,960 696,984 0.95KRW
SOUTH KOREA
CHEIL WORLDWIDE INC. 72,834 965,269 1.32KRW
HYUNDAI DEPARTMENTSTORE CO. 8,860 1,149,922 1.57KRW
HYUNDAI HYSCO 46,690 1,359,187 1.85KRW
KOLON INDUSTRIES INC. 16,957 1,137,604 1.56KRW
LG HOUSEHOLD &HEALTHCARE LTD 2,802 1,053,863 1.44KRW
LOCK & LOCK CO. LTD 15,050 526,156 0.72KRW
ORION CORPORATION 3,227 1,163,569 1.59KRW
Description Currency Evaluation % netassets
Quantity/Facevalue
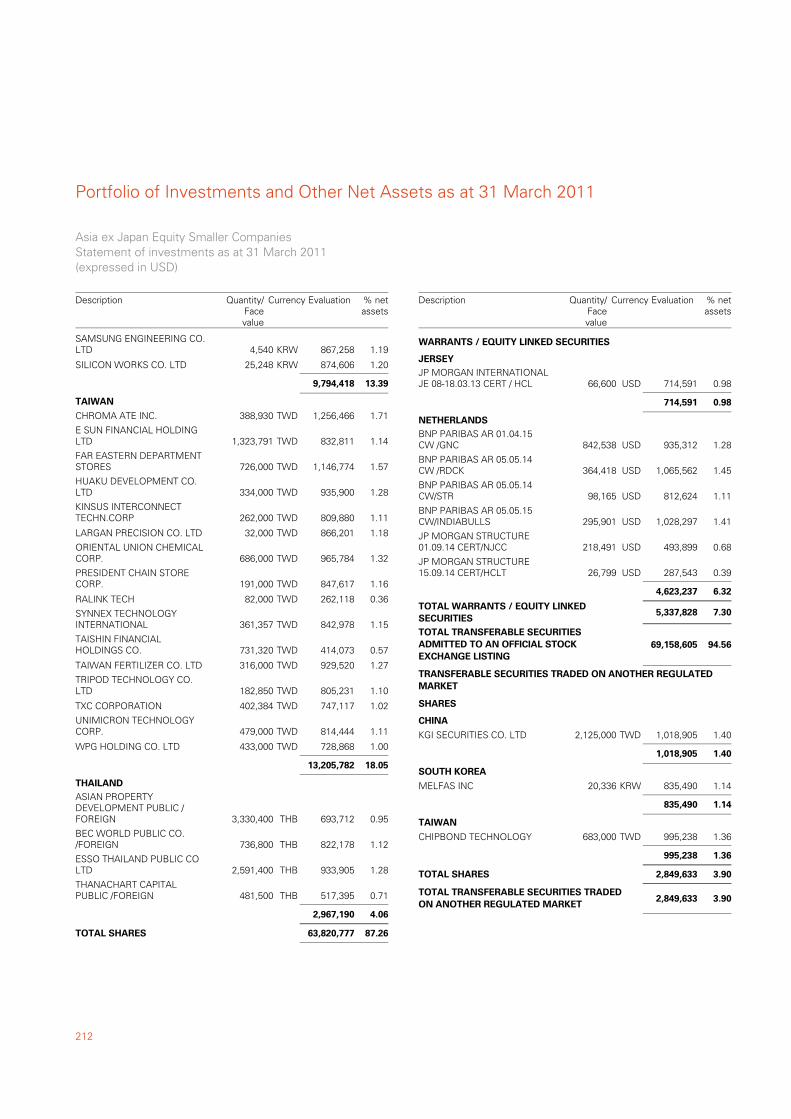
Portfolio of Investments and Other Net Assets as at 31 March 2011
212
SAMSUNG ENGINEERING CO.LTD 4,540 867,258 1.19KRW
SILICON WORKS CO. LTD 25,248 874,606 1.20KRW
9,794,418 13.39
CHROMA ATE INC. 388,930 1,256,466 1.71TWD
TAIWAN
E SUN FINANCIAL HOLDINGLTD 1,323,791 832,811 1.14TWD
FAR EASTERN DEPARTMENTSTORES 726,000 1,146,774 1.57TWD
HUAKU DEVELOPMENT CO.LTD 334,000 935,900 1.28TWD
KINSUS INTERCONNECTTECHN.CORP 262,000 809,880 1.11TWD
LARGAN PRECISION CO. LTD 32,000 866,201 1.18TWD
ORIENTAL UNION CHEMICALCORP. 686,000 965,784 1.32TWD
PRESIDENT CHAIN STORECORP. 191,000 847,617 1.16TWD
RALINK TECH 82,000 262,118 0.36TWD
SYNNEX TECHNOLOGYINTERNATIONAL 361,357 842,978 1.15TWD
TAISHIN FINANCIALHOLDINGS CO. 731,320 414,073 0.57TWD
TAIWAN FERTILIZER CO. LTD 316,000 929,520 1.27TWD
TRIPOD TECHNOLOGY CO.LTD 182,850 805,231 1.10TWD
TXC CORPORATION 402,384 747,117 1.02TWD
UNIMICRON TECHNOLOGYCORP. 479,000 814,444 1.11TWD
WPG HOLDING CO. LTD 433,000 728,868 1.00TWD
13,205,782 18.05
ASIAN PROPERTYDEVELOPMENT PUBLIC /FOREIGN 3,330,400 693,712 0.95THB
THAILAND
BEC WORLD PUBLIC CO./FOREIGN 736,800 822,178 1.12THB
ESSO THAILAND PUBLIC COLTD 2,591,400 933,905 1.28THB
THANACHART CAPITALPUBLIC /FOREIGN 481,500 517,395 0.71THB
2,967,190 4.06
87.2663,820,777TOTAL SHARES
Asia ex Japan Equity Smaller CompaniesStatement of investments as at 31 March 2011(expressed in USD)
Description Currency Evaluation % netassets
Quantity/Facevalue
JP MORGAN INTERNATIONALJE 08-18.03.13 CERT / HCL 66,600 714,591 0.98USD
WARRANTS / EQUITY LINKED SECURITIES
JERSEY
714,591 0.98
BNP PARIBAS AR 01.04.15CW /GNC 842,538 935,312 1.28USD
NETHERLANDS
BNP PARIBAS AR 05.05.14CW /RDCK 364,418 1,065,562 1.45USD
BNP PARIBAS AR 05.05.14CW/STR 98,165 812,624 1.11USD
BNP PARIBAS AR 05.05.15CW/INDIABULLS 295,901 1,028,297 1.41USD
JP MORGAN STRUCTURE01.09.14 CERT/NJCC 218,491 493,899 0.68USD
JP MORGAN STRUCTURE15.09.14 CERT/HCLT 26,799 287,543 0.39USD
4,623,237 6.32
7.305,337,828TOTAL WARRANTS / EQUITY LINKEDSECURITIES
94.56TOTAL TRANSFERABLE SECURITIESADMITTED TO AN OFFICIAL STOCKEXCHANGE LISTING
69,158,605
KGI SECURITIES CO. LTD 2,125,000 1,018,905 1.40TWD
TRANSFERABLE SECURITIES TRADED ON ANOTHER REGULATEDMARKET
SHARES
CHINA
1,018,905 1.40
MELFAS INC 20,336 835,490 1.14KRW
SOUTH KOREA
835,490 1.14
CHIPBOND TECHNOLOGY 683,000 995,238 1.36TWD
TAIWAN
995,238 1.36
3.902,849,633TOTAL SHARES
3.90TOTAL TRANSFERABLE SECURITIES TRADEDON ANOTHER REGULATED MARKET
2,849,633
Description Currency Evaluation % netassets
Quantity/Facevalue
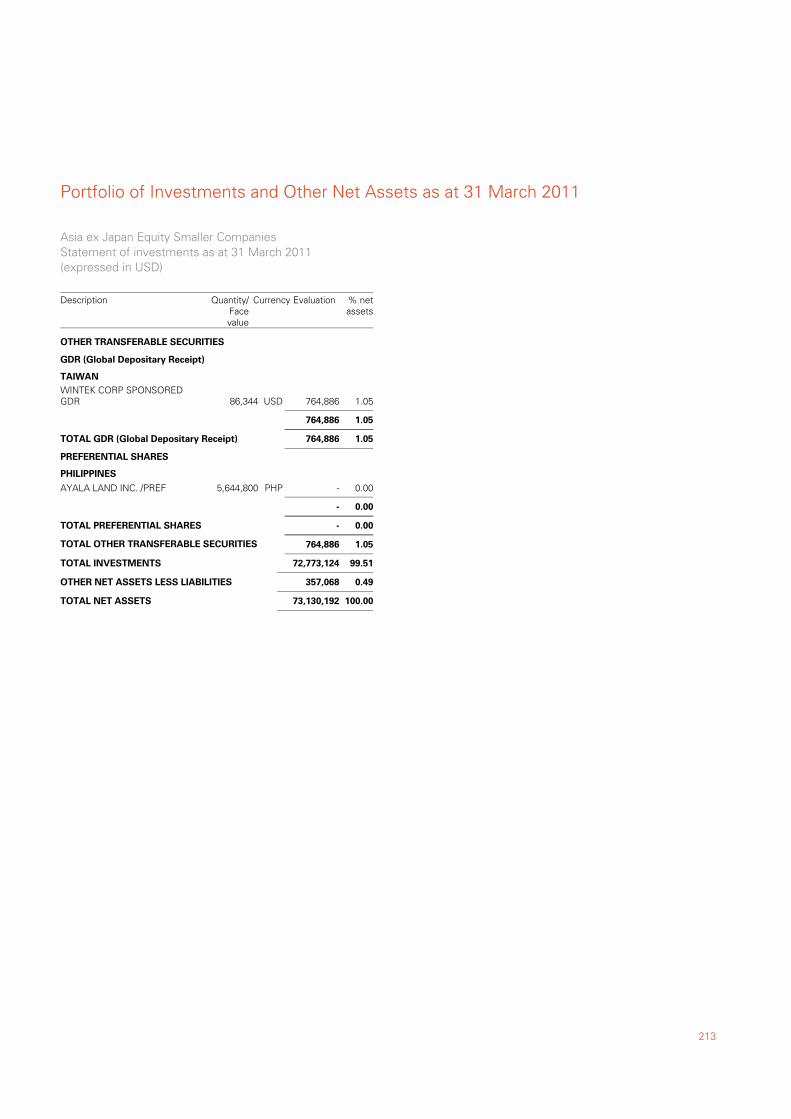
213
Portfolio of Investments and Other Net Assets as at 31 March 2011
WINTEK CORP SPONSOREDGDR 86,344 764,886 1.05USD
OTHER TRANSFERABLE SECURITIES
GDR (Global Depositary Receipt)
TAIWAN
764,886 1.05
1.05764,886TOTAL GDR (Global Depositary Receipt)
AYALA LAND INC. /PREF 5,644,800 - 0.00PHP
PREFERENTIAL SHARES
PHILIPPINES
- 0.00
0.00-TOTAL PREFERENTIAL SHARES
1.05TOTAL OTHER TRANSFERABLE SECURITIES 764,886
99.51TOTAL INVESTMENTS 72,773,124
0.49OTHER NET ASSETS LESS LIABILITIES 357,068
100.00TOTAL NET ASSETS 73,130,192
Asia ex Japan Equity Smaller CompaniesStatement of investments as at 31 March 2011(expressed in USD)
Description Currency Evaluation % netassets
Quantity/Facevalue
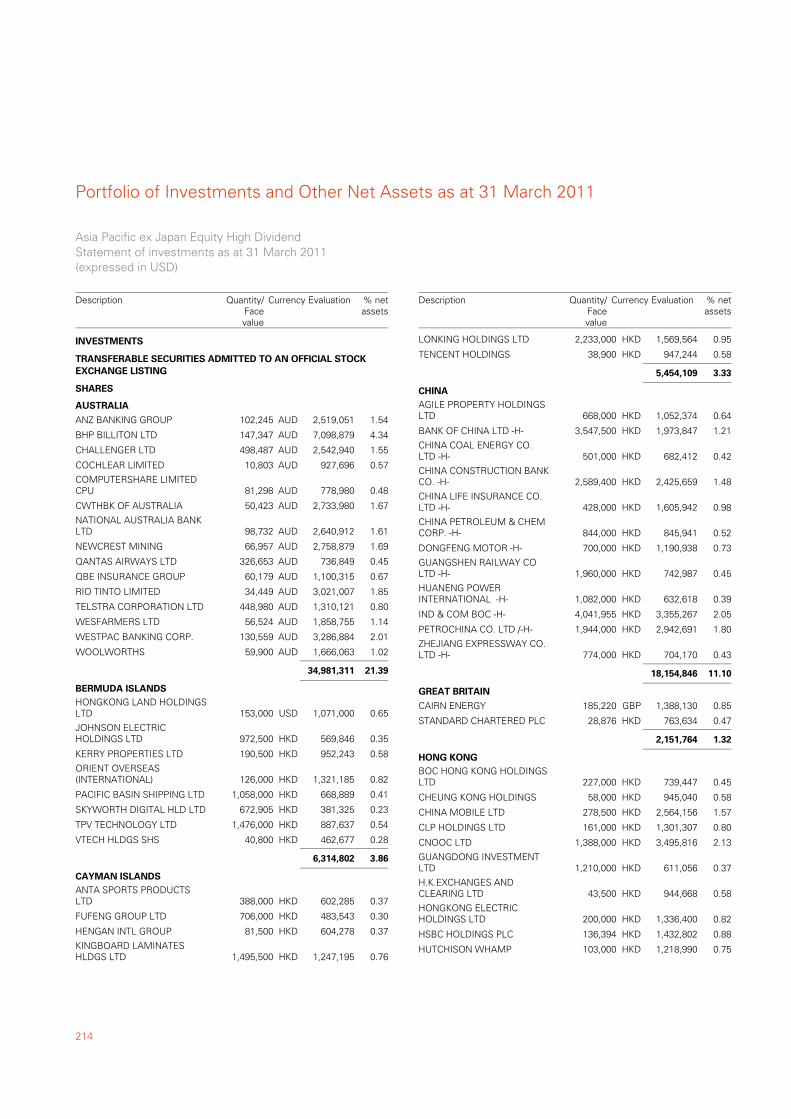
Portfolio of Investments and Other Net Assets as at 31 March 2011
214
ANZ BANKING GROUP 102,245 2,519,051 1.54AUD
TRANSFERABLE SECURITIES ADMITTED TO AN OFFICIAL STOCKEXCHANGE LISTING
SHARES
AUSTRALIA
BHP BILLITON LTD 147,347 7,098,879 4.34AUD
CHALLENGER LTD 498,487 2,542,940 1.55AUD
COCHLEAR LIMITED 10,803 927,696 0.57AUD
COMPUTERSHARE LIMITEDCPU 81,298 778,980 0.48AUD
CWTHBK OF AUSTRALIA 50,423 2,733,980 1.67AUD
NATIONAL AUSTRALIA BANKLTD 98,732 2,640,912 1.61AUD
NEWCREST MINING 66,957 2,758,879 1.69AUD
QANTAS AIRWAYS LTD 326,653 736,849 0.45AUD
QBE INSURANCE GROUP 60,179 1,100,315 0.67AUD
RIO TINTO LIMITED 34,449 3,021,007 1.85AUD
TELSTRA CORPORATION LTD 448,980 1,310,121 0.80AUD
WESFARMERS LTD 56,524 1,858,755 1.14AUD
WESTPAC BANKING CORP. 130,559 3,286,884 2.01AUD
WOOLWORTHS 59,900 1,666,063 1.02AUD
34,981,311 21.39
HONGKONG LAND HOLDINGSLTD 153,000 1,071,000 0.65USD
BERMUDA ISLANDS
JOHNSON ELECTRICHOLDINGS LTD 972,500 569,846 0.35HKD
KERRY PROPERTIES LTD 190,500 952,243 0.58HKD
ORIENT OVERSEAS(INTERNATIONAL) 126,000 1,321,185 0.82HKD
PACIFIC BASIN SHIPPING LTD 1,058,000 668,889 0.41HKD
SKYWORTH DIGITAL HLD LTD 672,905 381,325 0.23HKD
TPV TECHNOLOGY LTD 1,476,000 887,637 0.54HKD
VTECH HLDGS SHS 40,800 462,677 0.28HKD
6,314,802 3.86
ANTA SPORTS PRODUCTSLTD 388,000 602,285 0.37HKD
CAYMAN ISLANDS
FUFENG GROUP LTD 706,000 483,543 0.30HKD
HENGAN INTL GROUP 81,500 604,278 0.37HKD
KINGBOARD LAMINATESHLDGS LTD 1,495,500 1,247,195 0.76HKD
INVESTMENTS
Asia Pacific ex Japan Equity High DividendStatement of investments as at 31 March 2011(expressed in USD)
Description Currency Evaluation % netassets
Quantity/Facevalue
LONKING HOLDINGS LTD 2,233,000 1,569,564 0.95HKD
TENCENT HOLDINGS 38,900 947,244 0.58HKD
5,454,109 3.33
AGILE PROPERTY HOLDINGSLTD 668,000 1,052,374 0.64HKD
CHINA
BANK OF CHINA LTD -H- 3,547,500 1,973,847 1.21HKD
CHINA COAL ENERGY CO.LTD -H- 501,000 682,412 0.42HKD
CHINA CONSTRUCTION BANKCO. -H- 2,589,400 2,425,659 1.48HKD
CHINA LIFE INSURANCE CO.LTD -H- 428,000 1,605,942 0.98HKD
CHINA PETROLEUM & CHEMCORP. -H- 844,000 845,941 0.52HKD
DONGFENG MOTOR -H- 700,000 1,190,938 0.73HKD
GUANGSHEN RAILWAY COLTD -H- 1,960,000 742,987 0.45HKD
HUANENG POWERINTERNATIONAL -H- 1,082,000 632,618 0.39HKD
IND & COM BOC -H- 4,041,955 3,355,267 2.05HKD
PETROCHINA CO. LTD /-H- 1,944,000 2,942,691 1.80HKD
ZHEJIANG EXPRESSWAY CO.LTD -H- 774,000 704,170 0.43HKD
18,154,846 11.10
CAIRN ENERGY 185,220 1,388,130 0.85GBP
GREAT BRITAIN
STANDARD CHARTERED PLC 28,876 763,634 0.47HKD
2,151,764 1.32
BOC HONG KONG HOLDINGSLTD 227,000 739,447 0.45HKD
HONG KONG
CHEUNG KONG HOLDINGS 58,000 945,040 0.58HKD
CHINA MOBILE LTD 278,500 2,564,156 1.57HKD
CLP HOLDINGS LTD 161,000 1,301,307 0.80HKD
CNOOC LTD 1,388,000 3,495,816 2.13HKD
GUANGDONG INVESTMENTLTD 1,210,000 611,056 0.37HKD
H.K.EXCHANGES ANDCLEARING LTD 43,500 944,668 0.58HKD
HONGKONG ELECTRICHOLDINGS LTD 200,000 1,336,400 0.82HKD
HSBC HOLDINGS PLC 136,394 1,432,802 0.88HKD
HUTCHISON WHAMP 103,000 1,218,990 0.75HKD
Description Currency Evaluation % netassets
Quantity/Facevalue
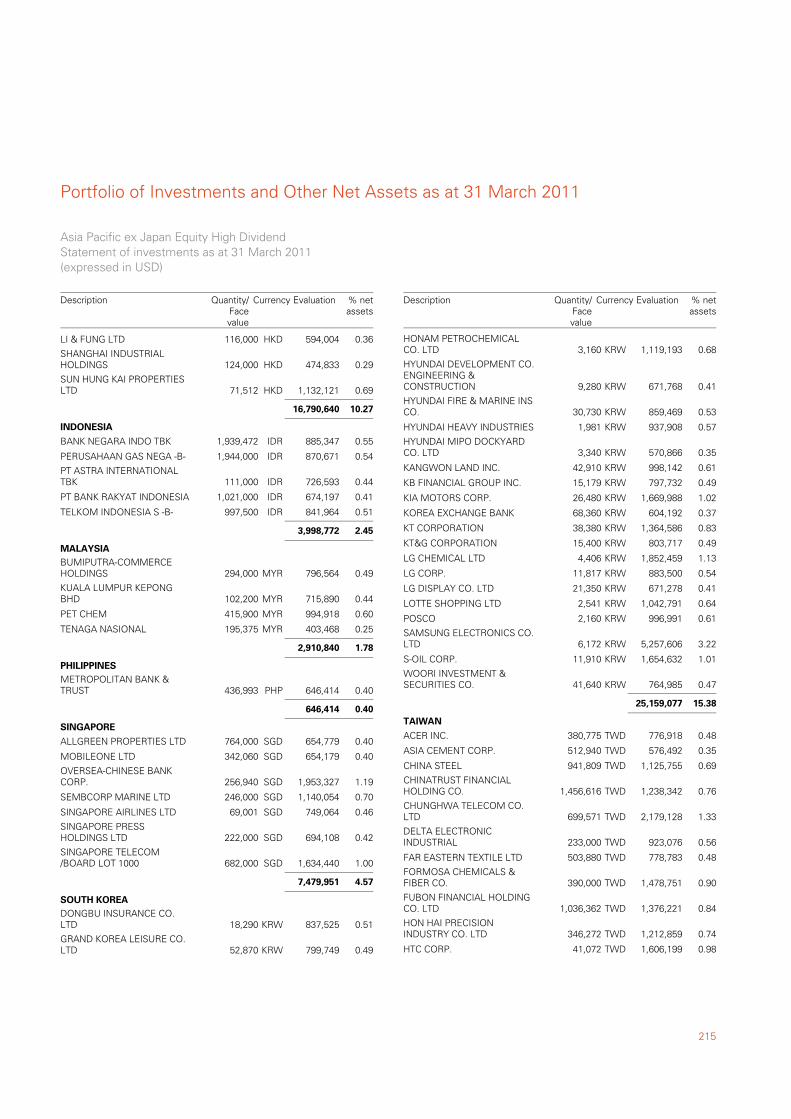
215
Portfolio of Investments and Other Net Assets as at 31 March 2011
LI & FUNG LTD 116,000 594,004 0.36HKD
SHANGHAI INDUSTRIALHOLDINGS 124,000 474,833 0.29HKD
SUN HUNG KAI PROPERTIESLTD 71,512 1,132,121 0.69HKD
16,790,640 10.27
BANK NEGARA INDO TBK 1,939,472 885,347 0.55IDR
INDONESIA
PERUSAHAAN GAS NEGA -B- 1,944,000 870,671 0.54IDR
PT ASTRA INTERNATIONALTBK 111,000 726,593 0.44IDR
PT BANK RAKYAT INDONESIA 1,021,000 674,197 0.41IDR
TELKOM INDONESIA S -B- 997,500 841,964 0.51IDR
3,998,772 2.45
BUMIPUTRA-COMMERCEHOLDINGS 294,000 796,564 0.49MYR
MALAYSIA
KUALA LUMPUR KEPONGBHD 102,200 715,890 0.44MYR
PET CHEM 415,900 994,918 0.60MYR
TENAGA NASIONAL 195,375 403,468 0.25MYR
2,910,840 1.78
METROPOLITAN BANK &TRUST 436,993 646,414 0.40PHP
PHILIPPINES
646,414 0.40
ALLGREEN PROPERTIES LTD 764,000 654,779 0.40SGD
SINGAPORE
MOBILEONE LTD 342,060 654,179 0.40SGD
OVERSEA-CHINESE BANKCORP. 256,940 1,953,327 1.19SGD
SEMBCORP MARINE LTD 246,000 1,140,054 0.70SGD
SINGAPORE AIRLINES LTD 69,001 749,064 0.46SGD
SINGAPORE PRESSHOLDINGS LTD 222,000 694,108 0.42SGD
SINGAPORE TELECOM/BOARD LOT 1000 682,000 1,634,440 1.00SGD
7,479,951 4.57
DONGBU INSURANCE CO.LTD 18,290 837,525 0.51KRW
SOUTH KOREA
GRAND KOREA LEISURE CO.LTD 52,870 799,749 0.49KRW
Asia Pacific ex Japan Equity High DividendStatement of investments as at 31 March 2011(expressed in USD)
Description Currency Evaluation % netassets
Quantity/Facevalue
HONAM PETROCHEMICALCO. LTD 3,160 1,119,193 0.68KRW
HYUNDAI DEVELOPMENT CO.ENGINEERING &CONSTRUCTION 9,280 671,768 0.41KRW
HYUNDAI FIRE & MARINE INSCO. 30,730 859,469 0.53KRW
HYUNDAI HEAVY INDUSTRIES 1,981 937,908 0.57KRW
HYUNDAI MIPO DOCKYARDCO. LTD 3,340 570,866 0.35KRW
KANGWON LAND INC. 42,910 998,142 0.61KRW
KB FINANCIAL GROUP INC. 15,179 797,732 0.49KRW
KIA MOTORS CORP. 26,480 1,669,988 1.02KRW
KOREA EXCHANGE BANK 68,360 604,192 0.37KRW
KT CORPORATION 38,380 1,364,586 0.83KRW
KT&G CORPORATION 15,400 803,717 0.49KRW
LG CHEMICAL LTD 4,406 1,852,459 1.13KRW
LG CORP. 11,817 883,500 0.54KRW
LG DISPLAY CO. LTD 21,350 671,278 0.41KRW
LOTTE SHOPPING LTD 2,541 1,042,791 0.64KRW
POSCO 2,160 996,991 0.61KRW
SAMSUNG ELECTRONICS CO.LTD 6,172 5,257,606 3.22KRW
S-OIL CORP. 11,910 1,654,632 1.01KRW
WOORI INVESTMENT &SECURITIES CO. 41,640 764,985 0.47KRW
25,159,077 15.38
ACER INC. 380,775 776,918 0.48TWD
TAIWAN
ASIA CEMENT CORP. 512,940 576,492 0.35TWD
CHINA STEEL 941,809 1,125,755 0.69TWD
CHINATRUST FINANCIALHOLDING CO. 1,456,616 1,238,342 0.76TWD
CHUNGHWA TELECOM CO.LTD 699,571 2,179,128 1.33TWD
DELTA ELECTRONICINDUSTRIAL 233,000 923,076 0.56TWD
FAR EASTERN TEXTILE LTD 503,880 778,783 0.48TWD
FORMOSA CHEMICALS &FIBER CO. 390,000 1,478,751 0.90TWD
FUBON FINANCIAL HOLDINGCO. LTD 1,036,362 1,376,221 0.84TWD
HON HAI PRECISIONINDUSTRY CO. LTD 346,272 1,212,859 0.74TWD
HTC CORP. 41,072 1,606,199 0.98TWD
Description Currency Evaluation % netassets
Quantity/Facevalue
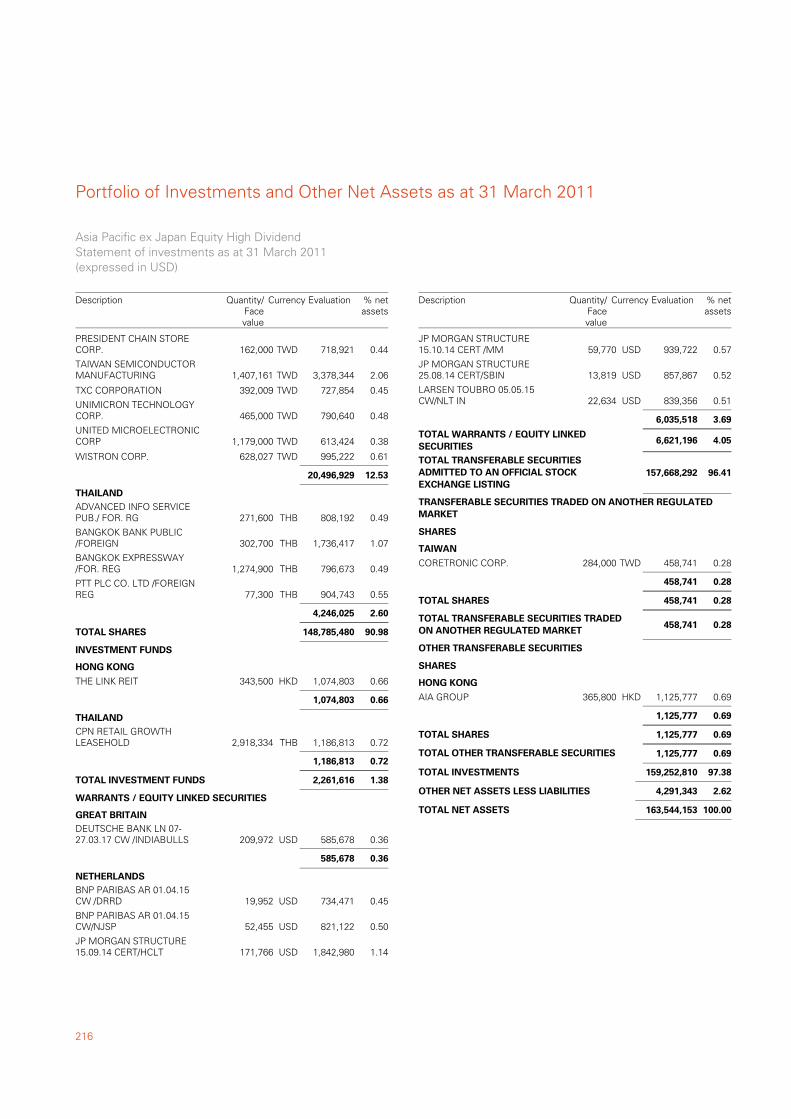
Portfolio of Investments and Other Net Assets as at 31 March 2011
216
PRESIDENT CHAIN STORECORP. 162,000 718,921 0.44TWD
TAIWAN SEMICONDUCTORMANUFACTURING 1,407,161 3,378,344 2.06TWD
TXC CORPORATION 392,009 727,854 0.45TWD
UNIMICRON TECHNOLOGYCORP. 465,000 790,640 0.48TWD
UNITED MICROELECTRONICCORP 1,179,000 613,424 0.38TWD
WISTRON CORP. 628,027 995,222 0.61TWD
20,496,929 12.53
ADVANCED INFO SERVICEPUB./ FOR. RG 271,600 808,192 0.49THB
THAILAND
BANGKOK BANK PUBLIC/FOREIGN 302,700 1,736,417 1.07THB
BANGKOK EXPRESSWAY/FOR. REG 1,274,900 796,673 0.49THB
PTT PLC CO. LTD /FOREIGNREG 77,300 904,743 0.55THB
4,246,025 2.60
90.98148,785,480TOTAL SHARES
THE LINK REIT 343,500 1,074,803 0.66HKD
INVESTMENT FUNDS
HONG KONG
1,074,803 0.66
CPN RETAIL GROWTHLEASEHOLD 2,918,334 1,186,813 0.72THB
THAILAND
1,186,813 0.72
1.382,261,616TOTAL INVESTMENT FUNDS
DEUTSCHE BANK LN 07-27.03.17 CW /INDIABULLS 209,972 585,678 0.36USD
WARRANTS / EQUITY LINKED SECURITIES
GREAT BRITAIN
585,678 0.36
BNP PARIBAS AR 01.04.15CW /DRRD 19,952 734,471 0.45USD
NETHERLANDS
BNP PARIBAS AR 01.04.15CW/NJSP 52,455 821,122 0.50USD
JP MORGAN STRUCTURE15.09.14 CERT/HCLT 171,766 1,842,980 1.14USD
Asia Pacific ex Japan Equity High DividendStatement of investments as at 31 March 2011(expressed in USD)
Description Currency Evaluation % netassets
Quantity/Facevalue
JP MORGAN STRUCTURE15.10.14 CERT /MM 59,770 939,722 0.57USD
JP MORGAN STRUCTURE25.08.14 CERT/SBIN 13,819 857,867 0.52USD
LARSEN TOUBRO 05.05.15CW/NLT IN 22,634 839,356 0.51USD
6,035,518 3.69
4.056,621,196TOTAL WARRANTS / EQUITY LINKEDSECURITIES
96.41TOTAL TRANSFERABLE SECURITIESADMITTED TO AN OFFICIAL STOCKEXCHANGE LISTING
157,668,292
CORETRONIC CORP. 284,000 458,741 0.28TWD
TRANSFERABLE SECURITIES TRADED ON ANOTHER REGULATEDMARKET
SHARES
TAIWAN
458,741 0.28
0.28458,741TOTAL SHARES
0.28TOTAL TRANSFERABLE SECURITIES TRADEDON ANOTHER REGULATED MARKET
458,741
AIA GROUP 365,800 1,125,777 0.69HKD
OTHER TRANSFERABLE SECURITIES
SHARES
HONG KONG
1,125,777 0.69
0.691,125,777TOTAL SHARES
0.69TOTAL OTHER TRANSFERABLE SECURITIES 1,125,777
97.38TOTAL INVESTMENTS 159,252,810
2.62OTHER NET ASSETS LESS LIABILITIES 4,291,343
100.00TOTAL NET ASSETS 163,544,153
Description Currency Evaluation % netassets
Quantity/Facevalue
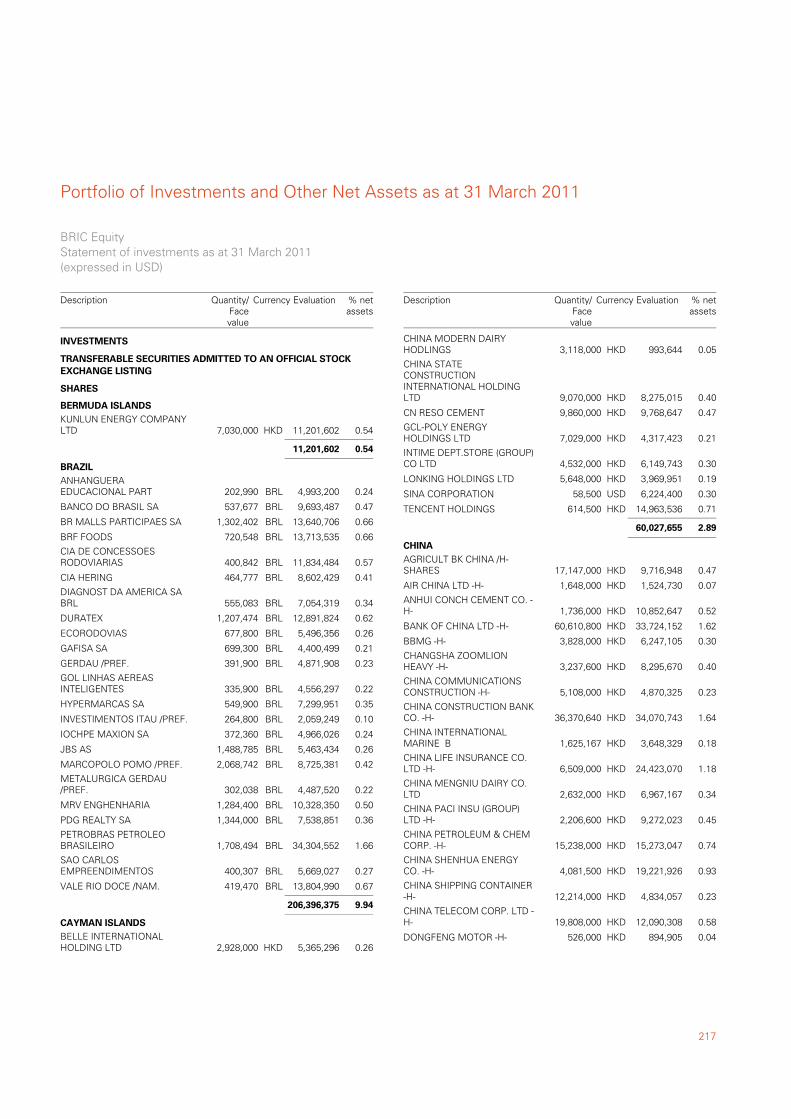
217
Portfolio of Investments and Other Net Assets as at 31 March 2011
KUNLUN ENERGY COMPANYLTD 7,030,000 11,201,602 0.54HKD
TRANSFERABLE SECURITIES ADMITTED TO AN OFFICIAL STOCKEXCHANGE LISTING
SHARES
BERMUDA ISLANDS
11,201,602 0.54
ANHANGUERAEDUCACIONAL PART 202,990 4,993,200 0.24BRL
BRAZIL
BANCO DO BRASIL SA 537,677 9,693,487 0.47BRL
BR MALLS PARTICIPAES SA 1,302,402 13,640,706 0.66BRL
BRF FOODS 720,548 13,713,535 0.66BRL
CIA DE CONCESSOESRODOVIARIAS 400,842 11,834,484 0.57BRL
CIA HERING 464,777 8,602,429 0.41BRL
DIAGNOST DA AMERICA SABRL 555,083 7,054,319 0.34BRL
DURATEX 1,207,474 12,891,824 0.62BRL
ECORODOVIAS 677,800 5,496,356 0.26BRL
GAFISA SA 699,300 4,400,499 0.21BRL
GERDAU /PREF. 391,900 4,871,908 0.23BRL
GOL LINHAS AEREASINTELIGENTES 335,900 4,556,297 0.22BRL
HYPERMARCAS SA 549,900 7,299,951 0.35BRL
INVESTIMENTOS ITAU /PREF. 264,800 2,059,249 0.10BRL
IOCHPE MAXION SA 372,360 4,966,026 0.24BRL
JBS AS 1,488,785 5,463,434 0.26BRL
MARCOPOLO POMO /PREF. 2,068,742 8,725,381 0.42BRL
METALURGICA GERDAU/PREF. 302,038 4,487,520 0.22BRL
MRV ENGHENHARIA 1,284,400 10,328,350 0.50BRL
PDG REALTY SA 1,344,000 7,538,851 0.36BRL
PETROBRAS PETROLEOBRASILEIRO 1,708,494 34,304,552 1.66BRL
SAO CARLOSEMPREENDIMENTOS 400,307 5,669,027 0.27BRL
VALE RIO DOCE /NAM. 419,470 13,804,990 0.67BRL
206,396,375 9.94
BELLE INTERNATIONALHOLDING LTD 2,928,000 5,365,296 0.26HKD
CAYMAN ISLANDS
INVESTMENTS
BRIC EquityStatement of investments as at 31 March 2011(expressed in USD)
Description Currency Evaluation % netassets
Quantity/Facevalue
CHINA MODERN DAIRYHODLINGS 3,118,000 993,644 0.05HKD
CHINA STATECONSTRUCTIONINTERNATIONAL HOLDINGLTD 9,070,000 8,275,015 0.40HKD
CN RESO CEMENT 9,860,000 9,768,647 0.47HKD
GCL-POLY ENERGYHOLDINGS LTD 7,029,000 4,317,423 0.21HKD
INTIME DEPT.STORE (GROUP)CO LTD 4,532,000 6,149,743 0.30HKD
LONKING HOLDINGS LTD 5,648,000 3,969,951 0.19HKD
SINA CORPORATION 58,500 6,224,400 0.30USD
TENCENT HOLDINGS 614,500 14,963,536 0.71HKD
60,027,655 2.89
AGRICULT BK CHINA /H-SHARES 17,147,000 9,716,948 0.47HKD
CHINA
AIR CHINA LTD -H- 1,648,000 1,524,730 0.07HKD
ANHUI CONCH CEMENT CO. -H- 1,736,000 10,852,647 0.52HKD
BANK OF CHINA LTD -H- 60,610,800 33,724,152 1.62HKD
BBMG -H- 3,828,000 6,247,105 0.30HKD
CHANGSHA ZOOMLIONHEAVY -H- 3,237,600 8,295,670 0.40HKD
CHINA COMMUNICATIONSCONSTRUCTION -H- 5,108,000 4,870,325 0.23HKD
CHINA CONSTRUCTION BANKCO. -H- 36,370,640 34,070,743 1.64HKD
CHINA INTERNATIONALMARINE B 1,625,167 3,648,329 0.18HKD
CHINA LIFE INSURANCE CO.LTD -H- 6,509,000 24,423,070 1.18HKD
CHINA MENGNIU DAIRY CO.LTD 2,632,000 6,967,167 0.34HKD
CHINA PACI INSU (GROUP)LTD -H- 2,206,600 9,272,023 0.45HKD
CHINA PETROLEUM & CHEMCORP. -H- 15,238,000 15,273,047 0.74HKD
CHINA SHENHUA ENERGYCO. -H- 4,081,500 19,221,926 0.93HKD
CHINA SHIPPING CONTAINER-H- 12,214,000 4,834,057 0.23HKD
CHINA TELECOM CORP. LTD -H- 19,808,000 12,090,308 0.58HKD
DONGFENG MOTOR -H- 526,000 894,905 0.04HKD
Description Currency Evaluation % netassets
Quantity/Facevalue
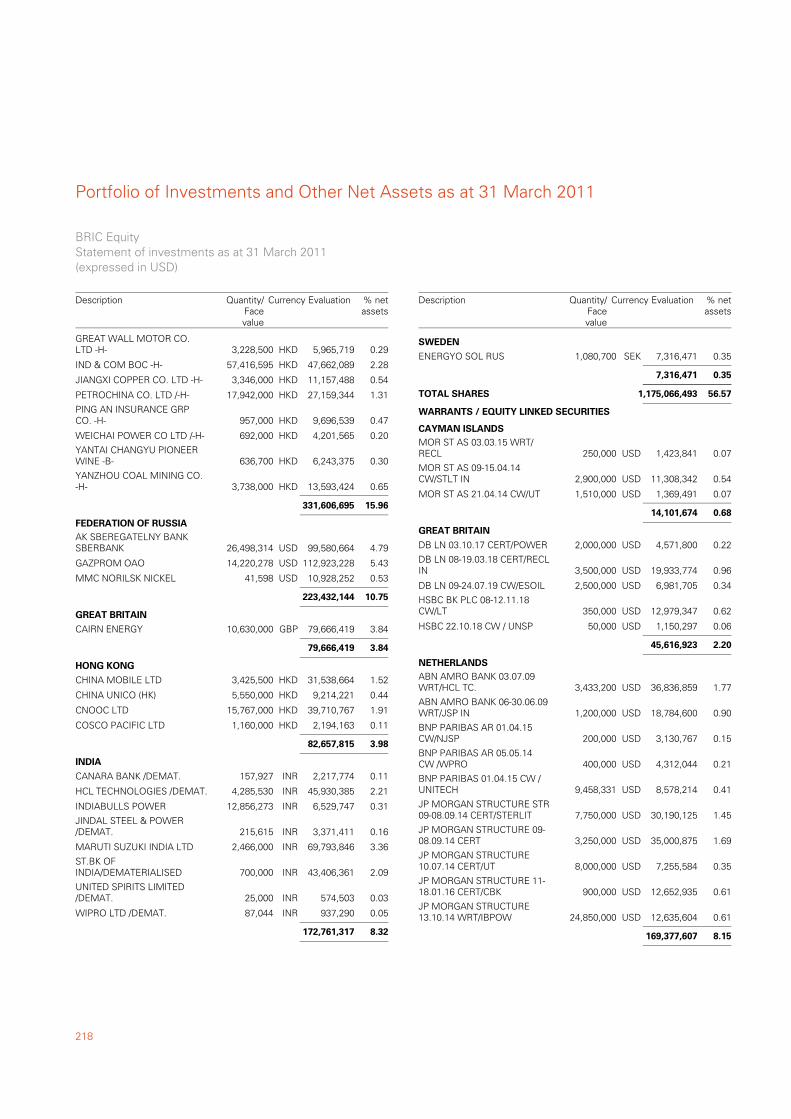
Portfolio of Investments and Other Net Assets as at 31 March 2011
218
GREAT WALL MOTOR CO.LTD -H- 3,228,500 5,965,719 0.29HKD
IND & COM BOC -H- 57,416,595 47,662,089 2.28HKD
JIANGXI COPPER CO. LTD -H- 3,346,000 11,157,488 0.54HKD
PETROCHINA CO. LTD /-H- 17,942,000 27,159,344 1.31HKD
PING AN INSURANCE GRPCO. -H- 957,000 9,696,539 0.47HKD
WEICHAI POWER CO LTD /-H- 692,000 4,201,565 0.20HKD
YANTAI CHANGYU PIONEERWINE -B- 636,700 6,243,375 0.30HKD
YANZHOU COAL MINING CO.-H- 3,738,000 13,593,424 0.65HKD
331,606,695 15.96
AK SBEREGATELNY BANKSBERBANK 26,498,314 99,580,664 4.79USD
FEDERATION OF RUSSIA
GAZPROM OAO 14,220,278 112,923,228 5.43USD
MMC NORILSK NICKEL 41,598 10,928,252 0.53USD
223,432,144 10.75
CAIRN ENERGY 10,630,000 79,666,419 3.84GBP
GREAT BRITAIN
79,666,419 3.84
CHINA MOBILE LTD 3,425,500 31,538,664 1.52HKD
HONG KONG
CHINA UNICO (HK) 5,550,000 9,214,221 0.44HKD
CNOOC LTD 15,767,000 39,710,767 1.91HKD
COSCO PACIFIC LTD 1,160,000 2,194,163 0.11HKD
82,657,815 3.98
CANARA BANK /DEMAT. 157,927 2,217,774 0.11INR
INDIA
HCL TECHNOLOGIES /DEMAT. 4,285,530 45,930,385 2.21INR
INDIABULLS POWER 12,856,273 6,529,747 0.31INR
JINDAL STEEL & POWER/DEMAT. 215,615 3,371,411 0.16INR
MARUTI SUZUKI INDIA LTD 2,466,000 69,793,846 3.36INR
ST.BK OFINDIA/DEMATERIALISED 700,000 43,406,361 2.09INR
UNITED SPIRITS LIMITED/DEMAT. 25,000 574,503 0.03INR
WIPRO LTD /DEMAT. 87,044 937,290 0.05INR
172,761,317 8.32
BRIC EquityStatement of investments as at 31 March 2011(expressed in USD)
Description Currency Evaluation % netassets
Quantity/Facevalue
ENERGYO SOL RUS 1,080,700 7,316,471 0.35SEK
SWEDEN
7,316,471 0.35
56.571,175,066,493TOTAL SHARES
MOR ST AS 03.03.15 WRT/RECL 250,000 1,423,841 0.07USD
WARRANTS / EQUITY LINKED SECURITIES
CAYMAN ISLANDS
MOR ST AS 09-15.04.14CW/STLT IN 2,900,000 11,308,342 0.54USD
MOR ST AS 21.04.14 CW/UT 1,510,000 1,369,491 0.07USD
14,101,674 0.68
DB LN 03.10.17 CERT/POWER 2,000,000 4,571,800 0.22USD
GREAT BRITAIN
DB LN 08-19.03.18 CERT/RECLIN 3,500,000 19,933,774 0.96USD
DB LN 09-24.07.19 CW/ESOIL 2,500,000 6,981,705 0.34USD
HSBC BK PLC 08-12.11.18CW/LT 350,000 12,979,347 0.62USD
HSBC 22.10.18 CW / UNSP 50,000 1,150,297 0.06USD
45,616,923 2.20
ABN AMRO BANK 03.07.09WRT/HCL TC. 3,433,200 36,836,859 1.77USD
NETHERLANDS
ABN AMRO BANK 06-30.06.09WRT/JSP IN 1,200,000 18,784,600 0.90USD
BNP PARIBAS AR 01.04.15CW/NJSP 200,000 3,130,767 0.15USD
BNP PARIBAS AR 05.05.14CW /WPRO 400,000 4,312,044 0.21USD
BNP PARIBAS 01.04.15 CW /UNITECH 9,458,331 8,578,214 0.41USD
JP MORGAN STRUCTURE STR09-08.09.14 CERT/STERLIT 7,750,000 30,190,125 1.45USD
JP MORGAN STRUCTURE 09-08.09.14 CERT 3,250,000 35,000,875 1.69USD
JP MORGAN STRUCTURE10.07.14 CERT/UT 8,000,000 7,255,584 0.35USD
JP MORGAN STRUCTURE 11-18.01.16 CERT/CBK 900,000 12,652,935 0.61USD
JP MORGAN STRUCTURE13.10.14 WRT/IBPOW 24,850,000 12,635,604 0.61USD
169,377,607 8.15
Description Currency Evaluation % netassets
Quantity/Facevalue
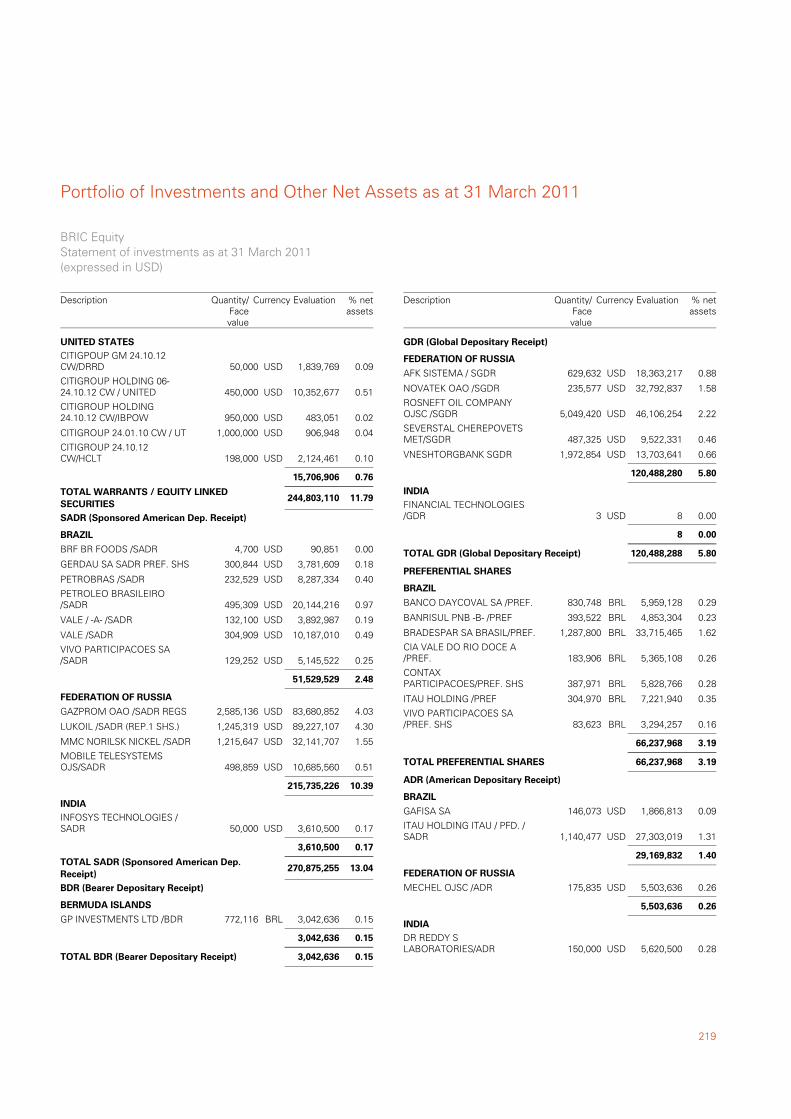
219
Portfolio of Investments and Other Net Assets as at 31 March 2011
CITIGPOUP GM 24.10.12CW/DRRD 50,000 1,839,769 0.09USD
UNITED STATES
CITIGROUP HOLDING 06-24.10.12 CW / UNITED 450,000 10,352,677 0.51USD
CITIGROUP HOLDING24.10.12 CW/IBPOW 950,000 483,051 0.02USD
CITIGROUP 24.01.10 CW / UT 1,000,000 906,948 0.04USD
CITIGROUP 24.10.12CW/HCLT 198,000 2,124,461 0.10USD
15,706,906 0.76
11.79244,803,110TOTAL WARRANTS / EQUITY LINKEDSECURITIES
BRF BR FOODS /SADR 4,700 90,851 0.00USD
SADR (Sponsored American Dep. Receipt)
BRAZIL
GERDAU SA SADR PREF. SHS 300,844 3,781,609 0.18USD
PETROBRAS /SADR 232,529 8,287,334 0.40USD
PETROLEO BRASILEIRO/SADR 495,309 20,144,216 0.97USD
VALE / -A- /SADR 132,100 3,892,987 0.19USD
VALE /SADR 304,909 10,187,010 0.49USD
VIVO PARTICIPACOES SA/SADR 129,252 5,145,522 0.25USD
51,529,529 2.48
GAZPROM OAO /SADR REGS 2,585,136 83,680,852 4.03USD
FEDERATION OF RUSSIA
LUKOIL /SADR (REP.1 SHS.) 1,245,319 89,227,107 4.30USD
MMC NORILSK NICKEL /SADR 1,215,647 32,141,707 1.55USD
MOBILE TELESYSTEMSOJS/SADR 498,859 10,685,560 0.51USD
215,735,226 10.39
INFOSYS TECHNOLOGIES /SADR 50,000 3,610,500 0.17USD
INDIA
3,610,500 0.17
13.04270,875,255TOTAL SADR (Sponsored American Dep.Receipt)
GP INVESTMENTS LTD /BDR 772,116 3,042,636 0.15BRL
BDR (Bearer Depositary Receipt)
BERMUDA ISLANDS
3,042,636 0.15
0.153,042,636TOTAL BDR (Bearer Depositary Receipt)
BRIC EquityStatement of investments as at 31 March 2011(expressed in USD)
Description Currency Evaluation % netassets
Quantity/Facevalue
AFK SISTEMA / SGDR 629,632 18,363,217 0.88USD
GDR (Global Depositary Receipt)
FEDERATION OF RUSSIA
NOVATEK OAO /SGDR 235,577 32,792,837 1.58USD
ROSNEFT OIL COMPANYOJSC /SGDR 5,049,420 46,106,254 2.22USD
SEVERSTAL CHEREPOVETSMET/SGDR 487,325 9,522,331 0.46USD
VNESHTORGBANK SGDR 1,972,854 13,703,641 0.66USD
120,488,280 5.80
FINANCIAL TECHNOLOGIES/GDR 3 8 0.00USD
INDIA
8 0.00
5.80120,488,288TOTAL GDR (Global Depositary Receipt)
BANCO DAYCOVAL SA /PREF. 830,748 5,959,128 0.29BRL
PREFERENTIAL SHARES
BRAZIL
BANRISUL PNB -B- /PREF 393,522 4,853,304 0.23BRL
BRADESPAR SA BRASIL/PREF. 1,287,800 33,715,465 1.62BRL
CIA VALE DO RIO DOCE A/PREF. 183,906 5,365,108 0.26BRL
CONTAXPARTICIPACOES/PREF. SHS 387,971 5,828,766 0.28BRL
ITAU HOLDING /PREF 304,970 7,221,940 0.35BRL
VIVO PARTICIPACOES SA/PREF. SHS 83,623 3,294,257 0.16BRL
66,237,968 3.19
3.1966,237,968TOTAL PREFERENTIAL SHARES
GAFISA SA 146,073 1,866,813 0.09USD
ADR (American Depositary Receipt)
BRAZIL
ITAU HOLDING ITAU / PFD. /SADR 1,140,477 27,303,019 1.31USD
29,169,832 1.40
MECHEL OJSC /ADR 175,835 5,503,636 0.26USD
FEDERATION OF RUSSIA
5,503,636 0.26
DR REDDY SLABORATORIES/ADR 150,000 5,620,500 0.28USD
INDIA
Description Currency Evaluation % netassets
Quantity/Facevalue
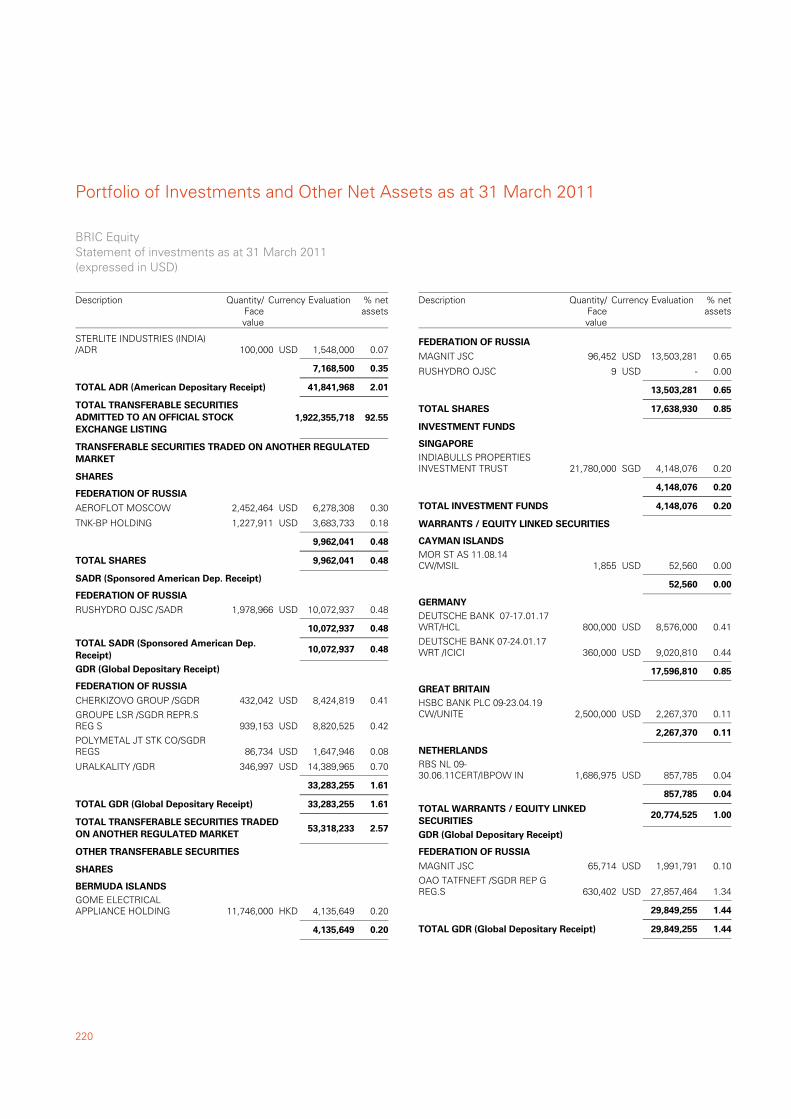
Portfolio of Investments and Other Net Assets as at 31 March 2011
220
STERLITE INDUSTRIES (INDIA)/ADR 100,000 1,548,000 0.07USD
7,168,500 0.35
2.0141,841,968TOTAL ADR (American Depositary Receipt)
92.55TOTAL TRANSFERABLE SECURITIESADMITTED TO AN OFFICIAL STOCKEXCHANGE LISTING
1,922,355,718
AEROFLOT MOSCOW 2,452,464 6,278,308 0.30USD
TRANSFERABLE SECURITIES TRADED ON ANOTHER REGULATEDMARKET
SHARES
FEDERATION OF RUSSIA
TNK-BP HOLDING 1,227,911 3,683,733 0.18USD
9,962,041 0.48
0.489,962,041TOTAL SHARES
RUSHYDRO OJSC /SADR 1,978,966 10,072,937 0.48USD
SADR (Sponsored American Dep. Receipt)
FEDERATION OF RUSSIA
10,072,937 0.48
0.4810,072,937TOTAL SADR (Sponsored American Dep.Receipt)
CHERKIZOVO GROUP /SGDR 432,042 8,424,819 0.41USD
GDR (Global Depositary Receipt)
FEDERATION OF RUSSIA
GROUPE LSR /SGDR REPR.SREG S 939,153 8,820,525 0.42USD
POLYMETAL JT STK CO/SGDRREGS 86,734 1,647,946 0.08USD
URALKALITY /GDR 346,997 14,389,965 0.70USD
33,283,255 1.61
1.6133,283,255TOTAL GDR (Global Depositary Receipt)
2.57TOTAL TRANSFERABLE SECURITIES TRADEDON ANOTHER REGULATED MARKET
53,318,233
GOME ELECTRICALAPPLIANCE HOLDING 11,746,000 4,135,649 0.20HKD
OTHER TRANSFERABLE SECURITIES
SHARES
BERMUDA ISLANDS
4,135,649 0.20
BRIC EquityStatement of investments as at 31 March 2011(expressed in USD)
Description Currency Evaluation % netassets
Quantity/Facevalue
MAGNIT JSC 96,452 13,503,281 0.65USD
FEDERATION OF RUSSIA
RUSHYDRO OJSC 9 - 0.00USD
13,503,281 0.65
0.8517,638,930TOTAL SHARES
INDIABULLS PROPERTIESINVESTMENT TRUST 21,780,000 4,148,076 0.20SGD
INVESTMENT FUNDS
SINGAPORE
4,148,076 0.20
0.204,148,076TOTAL INVESTMENT FUNDS
MOR ST AS 11.08.14CW/MSIL 1,855 52,560 0.00USD
WARRANTS / EQUITY LINKED SECURITIES
CAYMAN ISLANDS
52,560 0.00
DEUTSCHE BANK 07-17.01.17WRT/HCL 800,000 8,576,000 0.41USD
GERMANY
DEUTSCHE BANK 07-24.01.17WRT /ICICI 360,000 9,020,810 0.44USD
17,596,810 0.85
HSBC BANK PLC 09-23.04.19CW/UNITE 2,500,000 2,267,370 0.11USD
GREAT BRITAIN
2,267,370 0.11
RBS NL 09-30.06.11CERT/IBPOW IN 1,686,975 857,785 0.04USD
NETHERLANDS
857,785 0.04
1.0020,774,525TOTAL WARRANTS / EQUITY LINKEDSECURITIES
MAGNIT JSC 65,714 1,991,791 0.10USD
GDR (Global Depositary Receipt)
FEDERATION OF RUSSIA
OAO TATFNEFT /SGDR REP GREG.S 630,402 27,857,464 1.34USD
29,849,255 1.44
1.4429,849,255TOTAL GDR (Global Depositary Receipt)
Description Currency Evaluation % netassets
Quantity/Facevalue
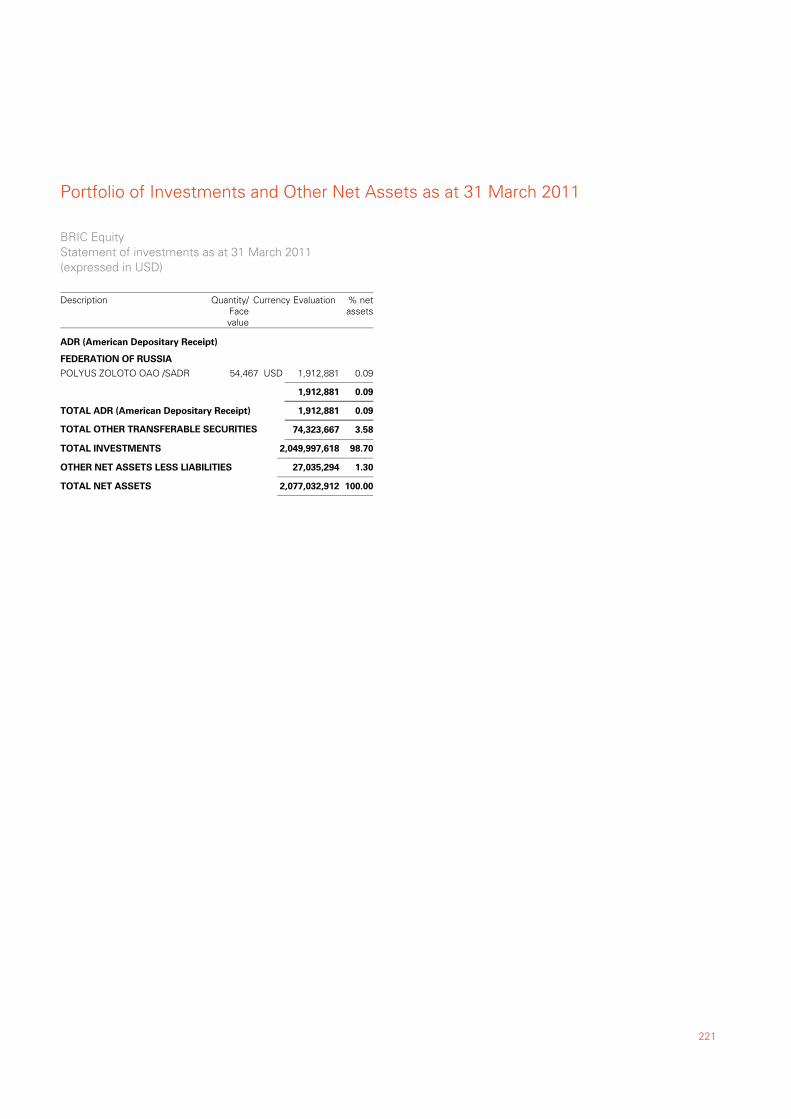
221
Portfolio of Investments and Other Net Assets as at 31 March 2011
POLYUS ZOLOTO OAO /SADR 54,467 1,912,881 0.09USD
ADR (American Depositary Receipt)
FEDERATION OF RUSSIA
1,912,881 0.09
0.091,912,881TOTAL ADR (American Depositary Receipt)
3.58TOTAL OTHER TRANSFERABLE SECURITIES 74,323,667
98.70TOTAL INVESTMENTS 2,049,997,618
1.30OTHER NET ASSETS LESS LIABILITIES 27,035,294
100.00TOTAL NET ASSETS 2,077,032,912
BRIC EquityStatement of investments as at 31 March 2011(expressed in USD)
Description Currency Evaluation % netassets
Quantity/Facevalue
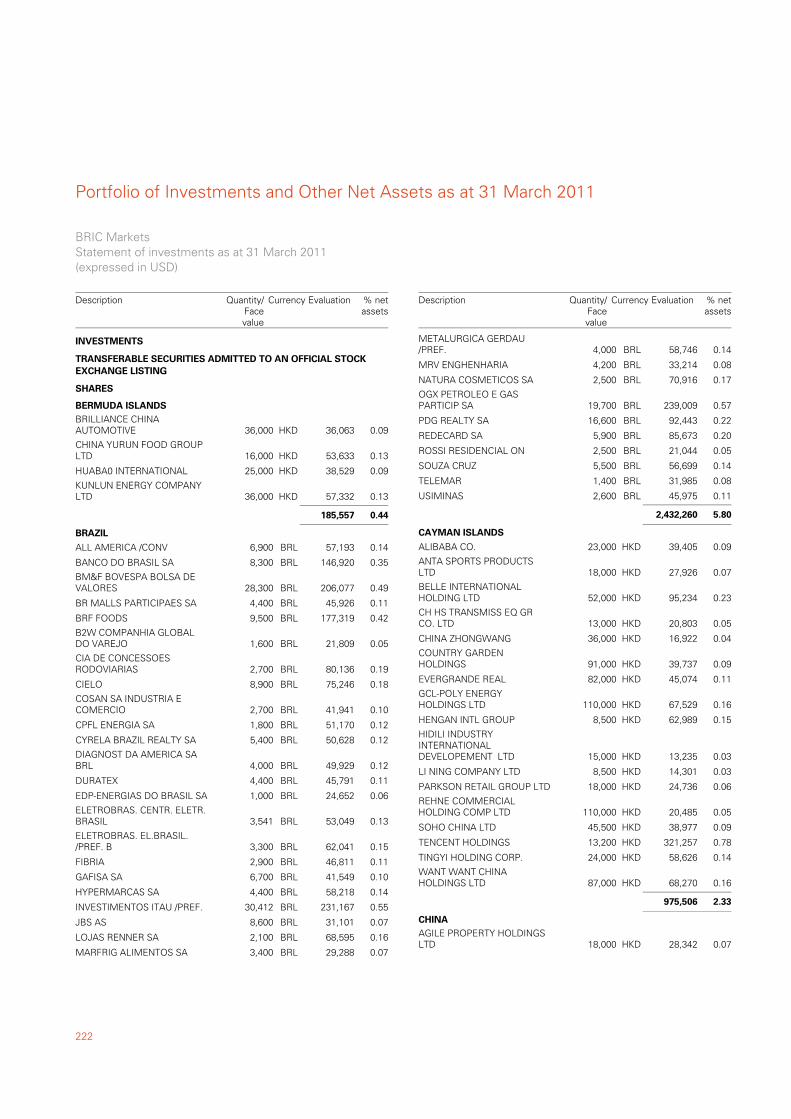
Portfolio of Investments and Other Net Assets as at 31 March 2011
222
BRILLIANCE CHINAAUTOMOTIVE 36,000 36,063 0.09HKD
TRANSFERABLE SECURITIES ADMITTED TO AN OFFICIAL STOCKEXCHANGE LISTING
SHARES
BERMUDA ISLANDS
CHINA YURUN FOOD GROUPLTD 16,000 53,633 0.13HKD
HUABA0 INTERNATIONAL 25,000 38,529 0.09HKD
KUNLUN ENERGY COMPANYLTD 36,000 57,332 0.13HKD
185,557 0.44
ALL AMERICA /CONV 6,900 57,193 0.14BRL
BRAZIL
BANCO DO BRASIL SA 8,300 146,920 0.35BRL
BM&F BOVESPA BOLSA DEVALORES 28,300 206,077 0.49BRL
BR MALLS PARTICIPAES SA 4,400 45,926 0.11BRL
BRF FOODS 9,500 177,319 0.42BRL
B2W COMPANHIA GLOBALDO VAREJO 1,600 21,809 0.05BRL
CIA DE CONCESSOESRODOVIARIAS 2,700 80,136 0.19BRL
CIELO 8,900 75,246 0.18BRL
COSAN SA INDUSTRIA ECOMERCIO 2,700 41,941 0.10BRL
CPFL ENERGIA SA 1,800 51,170 0.12BRL
CYRELA BRAZIL REALTY SA 5,400 50,628 0.12BRL
DIAGNOST DA AMERICA SABRL 4,000 49,929 0.12BRL
DURATEX 4,400 45,791 0.11BRL
EDP-ENERGIAS DO BRASIL SA 1,000 24,652 0.06BRL
ELETROBRAS. CENTR. ELETR.BRASIL 3,541 53,049 0.13BRL
ELETROBRAS. EL.BRASIL./PREF. B 3,300 62,041 0.15BRL
FIBRIA 2,900 46,811 0.11BRL
GAFISA SA 6,700 41,549 0.10BRL
HYPERMARCAS SA 4,400 58,218 0.14BRL
INVESTIMENTOS ITAU /PREF. 30,412 231,167 0.55BRL
JBS AS 8,600 31,101 0.07BRL
LOJAS RENNER SA 2,100 68,595 0.16BRL
MARFRIG ALIMENTOS SA 3,400 29,288 0.07BRL
INVESTMENTS
BRIC MarketsStatement of investments as at 31 March 2011(expressed in USD)
Description Currency Evaluation % netassets
Quantity/Facevalue
METALURGICA GERDAU/PREF. 4,000 58,746 0.14BRL
MRV ENGHENHARIA 4,200 33,214 0.08BRL
NATURA COSMETICOS SA 2,500 70,916 0.17BRL
OGX PETROLEO E GASPARTICIP SA 19,700 239,009 0.57BRL
PDG REALTY SA 16,600 92,443 0.22BRL
REDECARD SA 5,900 85,673 0.20BRL
ROSSI RESIDENCIAL ON 2,500 21,044 0.05BRL
SOUZA CRUZ 5,500 56,699 0.14BRL
TELEMAR 1,400 31,985 0.08BRL
USIMINAS 2,600 45,975 0.11BRL
2,432,260 5.80
ALIBABA CO. 23,000 39,405 0.09HKD
CAYMAN ISLANDS
ANTA SPORTS PRODUCTSLTD 18,000 27,926 0.07HKD
BELLE INTERNATIONALHOLDING LTD 52,000 95,234 0.23HKD
CH HS TRANSMISS EQ GRCO. LTD 13,000 20,803 0.05HKD
CHINA ZHONGWANG 36,000 16,922 0.04HKD
COUNTRY GARDENHOLDINGS 91,000 39,737 0.09HKD
EVERGRANDE REAL 82,000 45,074 0.11HKD
GCL-POLY ENERGYHOLDINGS LTD 110,000 67,529 0.16HKD
HENGAN INTL GROUP 8,500 62,989 0.15HKD
HIDILI INDUSTRYINTERNATIONALDEVELOPEMENT LTD 15,000 13,235 0.03HKD
LI NING COMPANY LTD 8,500 14,301 0.03HKD
PARKSON RETAIL GROUP LTD 18,000 24,736 0.06HKD
REHNE COMMERCIALHOLDING COMP LTD 110,000 20,485 0.05HKD
SOHO CHINA LTD 45,500 38,977 0.09HKD
TENCENT HOLDINGS 13,200 321,257 0.78HKD
TINGYI HOLDING CORP. 24,000 58,626 0.14HKD
WANT WANT CHINAHOLDINGS LTD 87,000 68,270 0.16HKD
975,506 2.33
AGILE PROPERTY HOLDINGSLTD 18,000 28,342 0.07HKD
CHINA
Description Currency Evaluation % netassets
Quantity/Facevalue
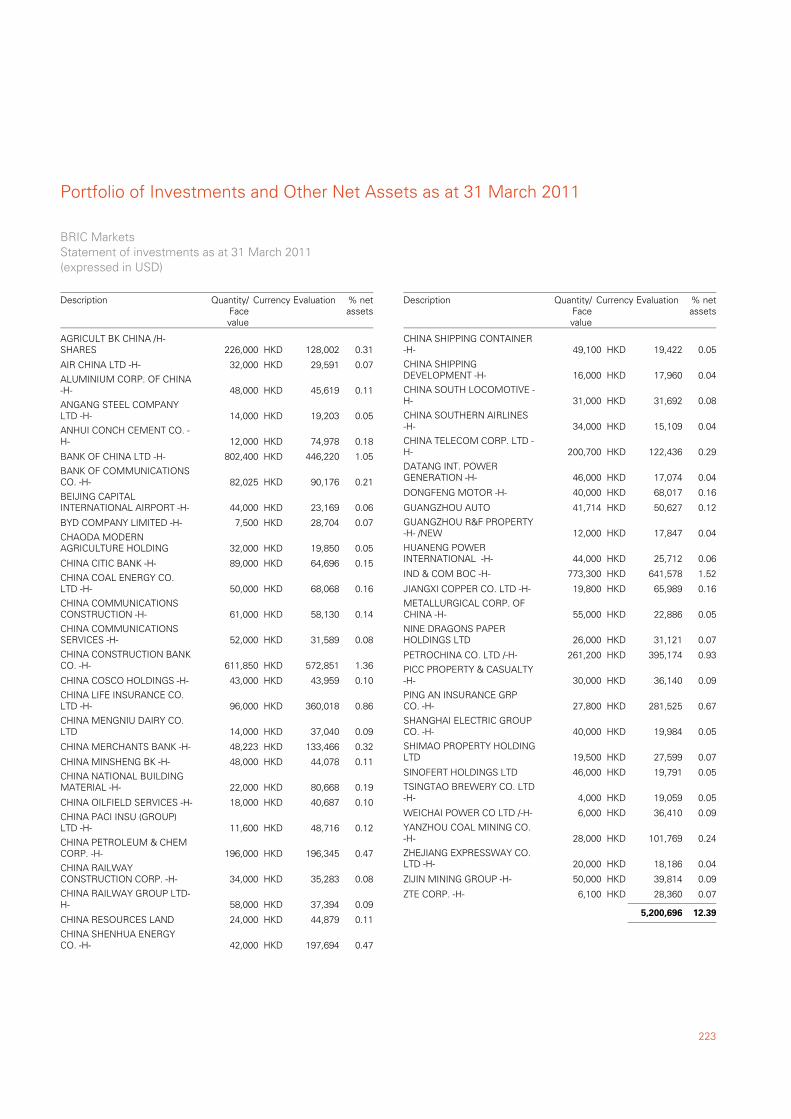
223
Portfolio of Investments and Other Net Assets as at 31 March 2011
AGRICULT BK CHINA /H-SHARES 226,000 128,002 0.31HKD
AIR CHINA LTD -H- 32,000 29,591 0.07HKD
ALUMINIUM CORP. OF CHINA-H- 48,000 45,619 0.11HKD
ANGANG STEEL COMPANYLTD -H- 14,000 19,203 0.05HKD
ANHUI CONCH CEMENT CO. -H- 12,000 74,978 0.18HKD
BANK OF CHINA LTD -H- 802,400 446,220 1.05HKD
BANK OF COMMUNICATIONSCO. -H- 82,025 90,176 0.21HKD
BEIJING CAPITALINTERNATIONAL AIRPORT -H- 44,000 23,169 0.06HKD
BYD COMPANY LIMITED -H- 7,500 28,704 0.07HKD
CHAODA MODERNAGRICULTURE HOLDING 32,000 19,850 0.05HKD
CHINA CITIC BANK -H- 89,000 64,696 0.15HKD
CHINA COAL ENERGY CO.LTD -H- 50,000 68,068 0.16HKD
CHINA COMMUNICATIONSCONSTRUCTION -H- 61,000 58,130 0.14HKD
CHINA COMMUNICATIONSSERVICES -H- 52,000 31,589 0.08HKD
CHINA CONSTRUCTION BANKCO. -H- 611,850 572,851 1.36HKD
CHINA COSCO HOLDINGS -H- 43,000 43,959 0.10HKD
CHINA LIFE INSURANCE CO.LTD -H- 96,000 360,018 0.86HKD
CHINA MENGNIU DAIRY CO.LTD 14,000 37,040 0.09HKD
CHINA MERCHANTS BANK -H- 48,223 133,466 0.32HKD
CHINA MINSHENG BK -H- 48,000 44,078 0.11HKD
CHINA NATIONAL BUILDINGMATERIAL -H- 22,000 80,668 0.19HKD
CHINA OILFIELD SERVICES -H- 18,000 40,687 0.10HKD
CHINA PACI INSU (GROUP)LTD -H- 11,600 48,716 0.12HKD
CHINA PETROLEUM & CHEMCORP. -H- 196,000 196,345 0.47HKD
CHINA RAILWAYCONSTRUCTION CORP. -H- 34,000 35,283 0.08HKD
CHINA RAILWAY GROUP LTD-H- 58,000 37,394 0.09HKD
CHINA RESOURCES LAND 24,000 44,879 0.11HKD
CHINA SHENHUA ENERGYCO. -H- 42,000 197,694 0.47HKD
BRIC MarketsStatement of investments as at 31 March 2011(expressed in USD)
Description Currency Evaluation % netassets
Quantity/Facevalue
CHINA SHIPPING CONTAINER-H- 49,100 19,422 0.05HKD
CHINA SHIPPINGDEVELOPMENT -H- 16,000 17,960 0.04HKD
CHINA SOUTH LOCOMOTIVE -H- 31,000 31,692 0.08HKD
CHINA SOUTHERN AIRLINES-H- 34,000 15,109 0.04HKD
CHINA TELECOM CORP. LTD -H- 200,700 122,436 0.29HKD
DATANG INT. POWERGENERATION -H- 46,000 17,074 0.04HKD
DONGFENG MOTOR -H- 40,000 68,017 0.16HKD
GUANGZHOU AUTO 41,714 50,627 0.12HKD
GUANGZHOU R&F PROPERTY-H- /NEW 12,000 17,847 0.04HKD
HUANENG POWERINTERNATIONAL -H- 44,000 25,712 0.06HKD
IND & COM BOC -H- 773,300 641,578 1.52HKD
JIANGXI COPPER CO. LTD -H- 19,800 65,989 0.16HKD
METALLURGICAL CORP. OFCHINA -H- 55,000 22,886 0.05HKD
NINE DRAGONS PAPERHOLDINGS LTD 26,000 31,121 0.07HKD
PETROCHINA CO. LTD /-H- 261,200 395,174 0.93HKD
PICC PROPERTY & CASUALTY-H- 30,000 36,140 0.09HKD
PING AN INSURANCE GRPCO. -H- 27,800 281,525 0.67HKD
SHANGHAI ELECTRIC GROUPCO. -H- 40,000 19,984 0.05HKD
SHIMAO PROPERTY HOLDINGLTD 19,500 27,599 0.07HKD
SINOFERT HOLDINGS LTD 46,000 19,791 0.05HKD
TSINGTAO BREWERY CO. LTD-H- 4,000 19,059 0.05HKD
WEICHAI POWER CO LTD /-H- 6,000 36,410 0.09HKD
YANZHOU COAL MINING CO.-H- 28,000 101,769 0.24HKD
ZHEJIANG EXPRESSWAY CO.LTD -H- 20,000 18,186 0.04HKD
ZIJIN MINING GROUP -H- 50,000 39,814 0.09HKD
ZTE CORP. -H- 6,100 28,360 0.07HKD
5,200,696 12.39
Description Currency Evaluation % netassets
Quantity/Facevalue
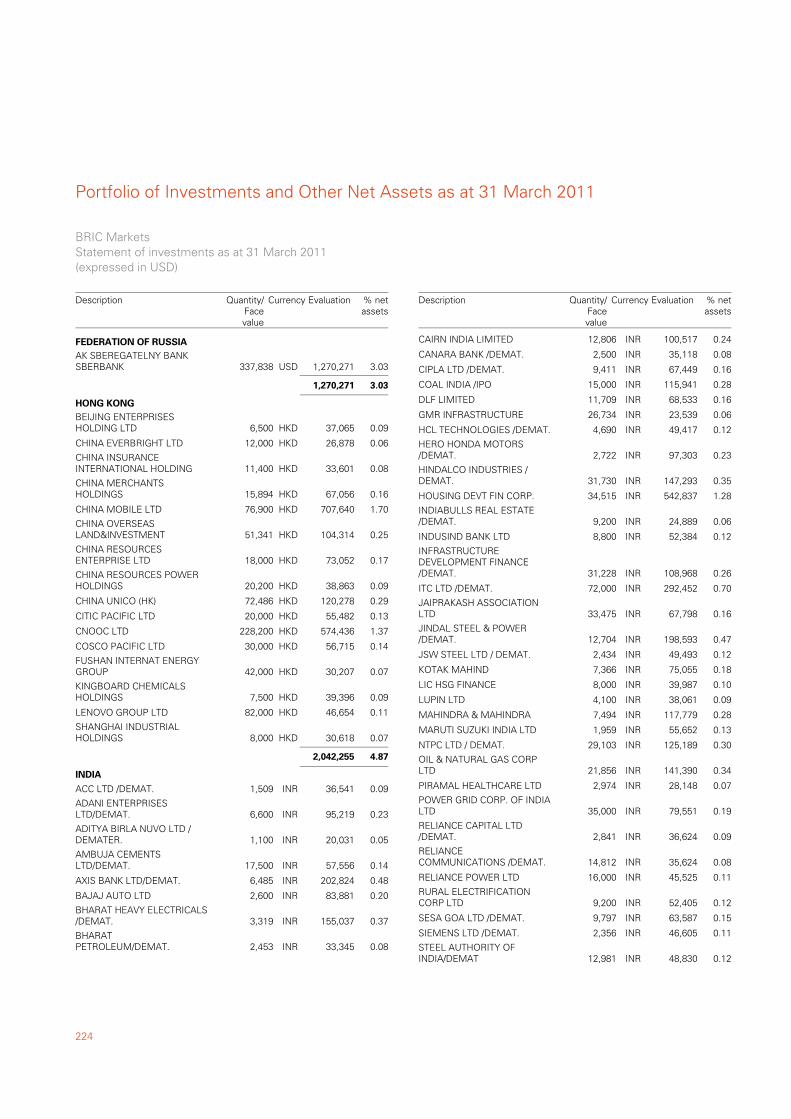
Portfolio of Investments and Other Net Assets as at 31 March 2011
224
AK SBEREGATELNY BANKSBERBANK 337,838 1,270,271 3.03USD
FEDERATION OF RUSSIA
1,270,271 3.03
BEIJING ENTERPRISESHOLDING LTD 6,500 37,065 0.09HKD
HONG KONG
CHINA EVERBRIGHT LTD 12,000 26,878 0.06HKD
CHINA INSURANCEINTERNATIONAL HOLDING 11,400 33,601 0.08HKD
CHINA MERCHANTSHOLDINGS 15,894 67,056 0.16HKD
CHINA MOBILE LTD 76,900 707,640 1.70HKD
CHINA OVERSEASLAND&INVESTMENT 51,341 104,314 0.25HKD
CHINA RESOURCESENTERPRISE LTD 18,000 73,052 0.17HKD
CHINA RESOURCES POWERHOLDINGS 20,200 38,863 0.09HKD
CHINA UNICO (HK) 72,486 120,278 0.29HKD
CITIC PACIFIC LTD 20,000 55,482 0.13HKD
CNOOC LTD 228,200 574,436 1.37HKD
COSCO PACIFIC LTD 30,000 56,715 0.14HKD
FUSHAN INTERNAT ENERGYGROUP 42,000 30,207 0.07HKD
KINGBOARD CHEMICALSHOLDINGS 7,500 39,396 0.09HKD
LENOVO GROUP LTD 82,000 46,654 0.11HKD
SHANGHAI INDUSTRIALHOLDINGS 8,000 30,618 0.07HKD
2,042,255 4.87
ACC LTD /DEMAT. 1,509 36,541 0.09INR
INDIA
ADANI ENTERPRISESLTD/DEMAT. 6,600 95,219 0.23INR
ADITYA BIRLA NUVO LTD /DEMATER. 1,100 20,031 0.05INR
AMBUJA CEMENTSLTD/DEMAT. 17,500 57,556 0.14INR
AXIS BANK LTD/DEMAT. 6,485 202,824 0.48INR
BAJAJ AUTO LTD 2,600 83,881 0.20INR
BHARAT HEAVY ELECTRICALS/DEMAT. 3,319 155,037 0.37INR
BHARATPETROLEUM/DEMAT. 2,453 33,345 0.08INR
BRIC MarketsStatement of investments as at 31 March 2011(expressed in USD)
Description Currency Evaluation % netassets
Quantity/Facevalue
CAIRN INDIA LIMITED 12,806 100,517 0.24INR
CANARA BANK /DEMAT. 2,500 35,118 0.08INR
CIPLA LTD /DEMAT. 9,411 67,449 0.16INR
COAL INDIA /IPO 15,000 115,941 0.28INR
DLF LIMITED 11,709 68,533 0.16INR
GMR INFRASTRUCTURE 26,734 23,539 0.06INR
HCL TECHNOLOGIES /DEMAT. 4,690 49,417 0.12INR
HERO HONDA MOTORS/DEMAT. 2,722 97,303 0.23INR
HINDALCO INDUSTRIES /DEMAT. 31,730 147,293 0.35INR
HOUSING DEVT FIN CORP. 34,515 542,837 1.28INR
INDIABULLS REAL ESTATE/DEMAT. 9,200 24,889 0.06INR
INDUSIND BANK LTD 8,800 52,384 0.12INR
INFRASTRUCTUREDEVELOPMENT FINANCE/DEMAT. 31,228 108,968 0.26INR
ITC LTD /DEMAT. 72,000 292,452 0.70INR
JAIPRAKASH ASSOCIATIONLTD 33,475 67,798 0.16INR
JINDAL STEEL & POWER/DEMAT. 12,704 198,593 0.47INR
JSW STEEL LTD / DEMAT. 2,434 49,493 0.12INR
KOTAK MAHIND 7,366 75,055 0.18INR
LIC HSG FINANCE 8,000 39,987 0.10INR
LUPIN LTD 4,100 38,061 0.09INR
MAHINDRA & MAHINDRA 7,494 117,779 0.28INR
MARUTI SUZUKI INDIA LTD 1,959 55,652 0.13INR
NTPC LTD / DEMAT. 29,103 125,189 0.30INR
OIL & NATURAL GAS CORPLTD 21,856 141,390 0.34INR
PIRAMAL HEALTHCARE LTD 2,974 28,148 0.07INR
POWER GRID CORP. OF INDIALTD 35,000 79,551 0.19INR
RELIANCE CAPITAL LTD/DEMAT. 2,841 36,624 0.09INR
RELIANCECOMMUNICATIONS /DEMAT. 14,812 35,624 0.08INR
RELIANCE POWER LTD 16,000 45,525 0.11INR
RURAL ELECTRIFICATIONCORP LTD 9,200 52,405 0.12INR
SESA GOA LTD /DEMAT. 9,797 63,587 0.15INR
SIEMENS LTD /DEMAT. 2,356 46,605 0.11INR
STEEL AUTHORITY OFINDIA/DEMAT 12,981 48,830 0.12INR
Description Currency Evaluation % netassets
Quantity/Facevalue
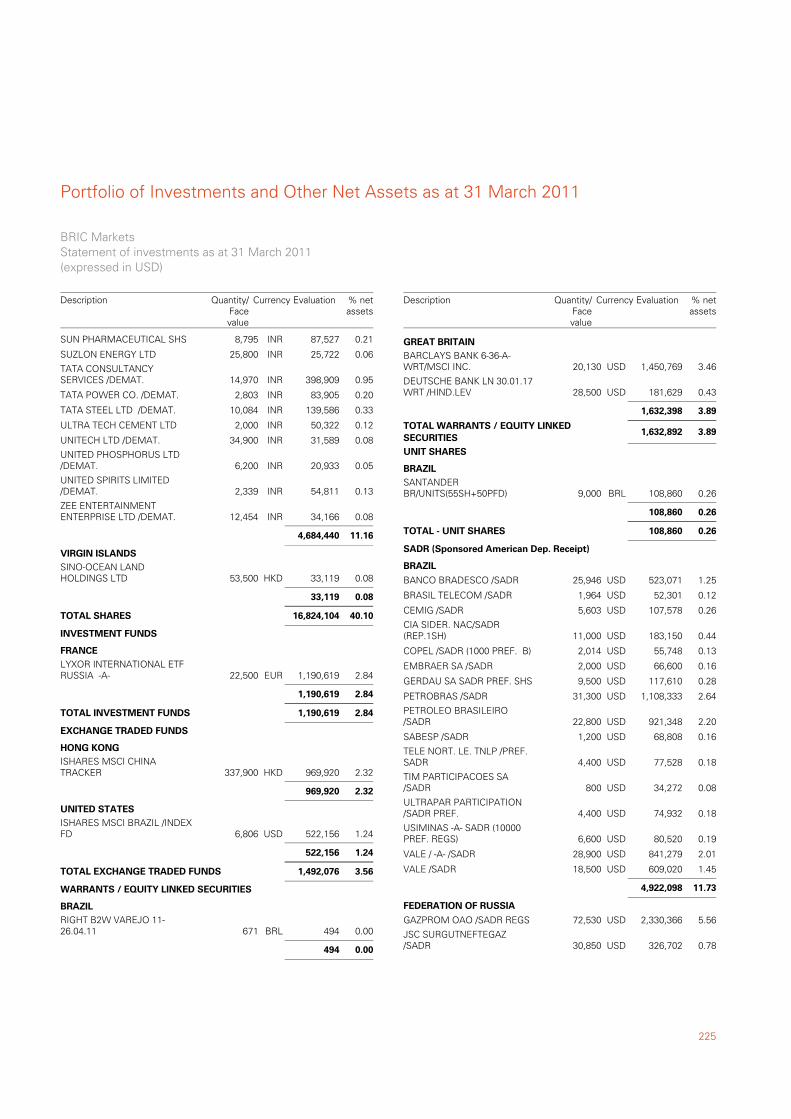
225
Portfolio of Investments and Other Net Assets as at 31 March 2011
SUN PHARMACEUTICAL SHS 8,795 87,527 0.21INR
SUZLON ENERGY LTD 25,800 25,722 0.06INR
TATA CONSULTANCYSERVICES /DEMAT. 14,970 398,909 0.95INR
TATA POWER CO. /DEMAT. 2,803 83,905 0.20INR
TATA STEEL LTD /DEMAT. 10,084 139,586 0.33INR
ULTRA TECH CEMENT LTD 2,000 50,322 0.12INR
UNITECH LTD /DEMAT. 34,900 31,589 0.08INR
UNITED PHOSPHORUS LTD/DEMAT. 6,200 20,933 0.05INR
UNITED SPIRITS LIMITED/DEMAT. 2,339 54,811 0.13INR
ZEE ENTERTAINMENTENTERPRISE LTD /DEMAT. 12,454 34,166 0.08INR
4,684,440 11.16
SINO-OCEAN LANDHOLDINGS LTD 53,500 33,119 0.08HKD
VIRGIN ISLANDS
33,119 0.08
40.1016,824,104TOTAL SHARES
LYXOR INTERNATIONAL ETFRUSSIA -A- 22,500 1,190,619 2.84EUR
INVESTMENT FUNDS
FRANCE
1,190,619 2.84
2.841,190,619TOTAL INVESTMENT FUNDS
ISHARES MSCI CHINATRACKER 337,900 969,920 2.32HKD
EXCHANGE TRADED FUNDS
HONG KONG
969,920 2.32
ISHARES MSCI BRAZIL /INDEXFD 6,806 522,156 1.24USD
UNITED STATES
522,156 1.24
3.561,492,076TOTAL EXCHANGE TRADED FUNDS
RIGHT B2W VAREJO 11-26.04.11 671 494 0.00BRL
WARRANTS / EQUITY LINKED SECURITIES
BRAZIL
494 0.00
BRIC MarketsStatement of investments as at 31 March 2011(expressed in USD)
Description Currency Evaluation % netassets
Quantity/Facevalue
BARCLAYS BANK 6-36-A-WRT/MSCI INC. 20,130 1,450,769 3.46USD
GREAT BRITAIN
DEUTSCHE BANK LN 30.01.17WRT /HIND.LEV 28,500 181,629 0.43USD
1,632,398 3.89
3.891,632,892TOTAL WARRANTS / EQUITY LINKEDSECURITIES
SANTANDERBR/UNITS(55SH+50PFD) 9,000 108,860 0.26BRL
UNIT SHARES
BRAZIL
108,860 0.26
0.26108,860TOTAL - UNIT SHARES
BANCO BRADESCO /SADR 25,946 523,071 1.25USD
SADR (Sponsored American Dep. Receipt)
BRAZIL
BRASIL TELECOM /SADR 1,964 52,301 0.12USD
CEMIG /SADR 5,603 107,578 0.26USD
CIA SIDER. NAC/SADR(REP.1SH) 11,000 183,150 0.44USD
COPEL /SADR (1000 PREF. B) 2,014 55,748 0.13USD
EMBRAER SA /SADR 2,000 66,600 0.16USD
GERDAU SA SADR PREF. SHS 9,500 117,610 0.28USD
PETROBRAS /SADR 31,300 1,108,333 2.64USD
PETROLEO BRASILEIRO/SADR 22,800 921,348 2.20USD
SABESP /SADR 1,200 68,808 0.16USD
TELE NORT. LE. TNLP /PREF.SADR 4,400 77,528 0.18USD
TIM PARTICIPACOES SA/SADR 800 34,272 0.08USD
ULTRAPAR PARTICIPATION/SADR PREF. 4,400 74,932 0.18USD
USIMINAS -A- SADR (10000PREF. REGS) 6,600 80,520 0.19USD
VALE / -A- /SADR 28,900 841,279 2.01USD
VALE /SADR 18,500 609,020 1.45USD
4,922,098 11.73
GAZPROM OAO /SADR REGS 72,530 2,330,366 5.56USD
FEDERATION OF RUSSIA
JSC SURGUTNEFTEGAZ/SADR 30,850 326,702 0.78USD
Description Currency Evaluation % netassets
Quantity/Facevalue
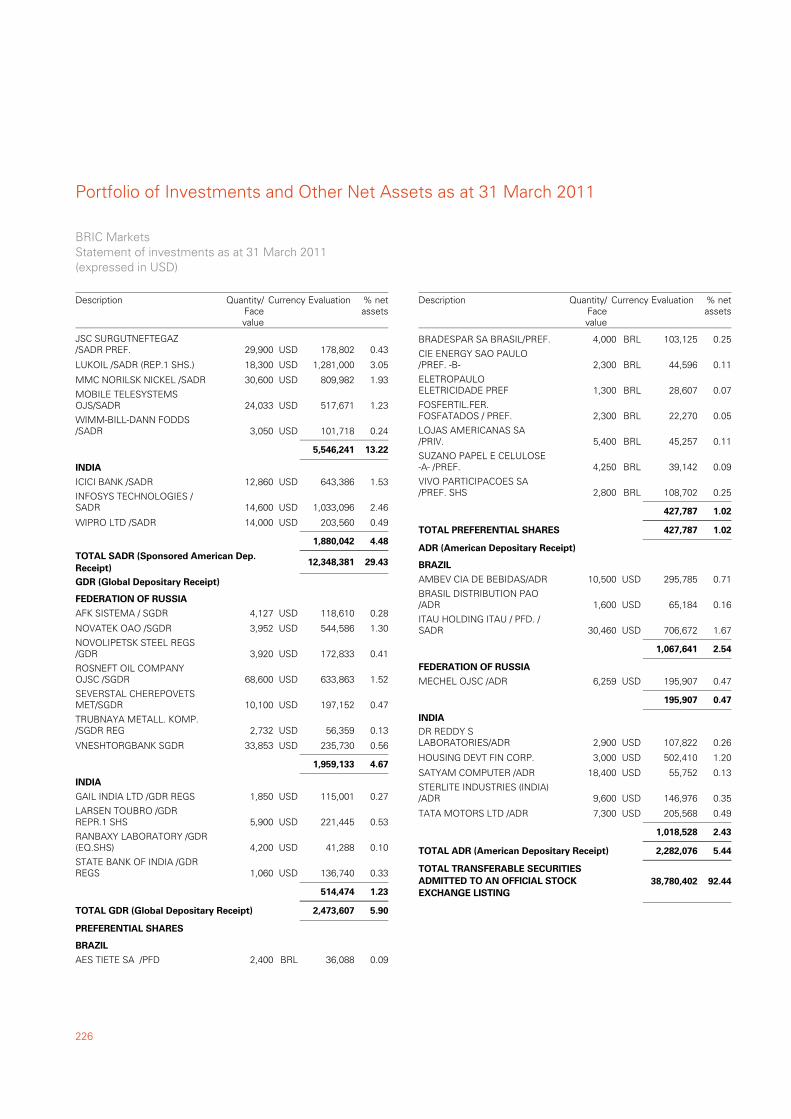
Portfolio of Investments and Other Net Assets as at 31 March 2011
226
JSC SURGUTNEFTEGAZ/SADR PREF. 29,900 178,802 0.43USD
LUKOIL /SADR (REP.1 SHS.) 18,300 1,281,000 3.05USD
MMC NORILSK NICKEL /SADR 30,600 809,982 1.93USD
MOBILE TELESYSTEMSOJS/SADR 24,033 517,671 1.23USD
WIMM-BILL-DANN FODDS/SADR 3,050 101,718 0.24USD
5,546,241 13.22
ICICI BANK /SADR 12,860 643,386 1.53USD
INDIA
INFOSYS TECHNOLOGIES /SADR 14,600 1,033,096 2.46USD
WIPRO LTD /SADR 14,000 203,560 0.49USD
1,880,042 4.48
29.4312,348,381TOTAL SADR (Sponsored American Dep.Receipt)
AFK SISTEMA / SGDR 4,127 118,610 0.28USD
GDR (Global Depositary Receipt)
FEDERATION OF RUSSIA
NOVATEK OAO /SGDR 3,952 544,586 1.30USD
NOVOLIPETSK STEEL REGS/GDR 3,920 172,833 0.41USD
ROSNEFT OIL COMPANYOJSC /SGDR 68,600 633,863 1.52USD
SEVERSTAL CHEREPOVETSMET/SGDR 10,100 197,152 0.47USD
TRUBNAYA METALL. KOMP./SGDR REG 2,732 56,359 0.13USD
VNESHTORGBANK SGDR 33,853 235,730 0.56USD
1,959,133 4.67
GAIL INDIA LTD /GDR REGS 1,850 115,001 0.27USD
INDIA
LARSEN TOUBRO /GDRREPR.1 SHS 5,900 221,445 0.53USD
RANBAXY LABORATORY /GDR(EQ.SHS) 4,200 41,288 0.10USD
STATE BANK OF INDIA /GDRREGS 1,060 136,740 0.33USD
514,474 1.23
5.902,473,607TOTAL GDR (Global Depositary Receipt)
AES TIETE SA /PFD 2,400 36,088 0.09BRL
PREFERENTIAL SHARES
BRAZIL
BRIC MarketsStatement of investments as at 31 March 2011(expressed in USD)
Description Currency Evaluation % netassets
Quantity/Facevalue
BRADESPAR SA BRASIL/PREF. 4,000 103,125 0.25BRL
CIE ENERGY SAO PAULO/PREF. -B- 2,300 44,596 0.11BRL
ELETROPAULOELETRICIDADE PREF 1,300 28,607 0.07BRL
FOSFERTIL.FER.FOSFATADOS / PREF. 2,300 22,270 0.05BRL
LOJAS AMERICANAS SA/PRIV. 5,400 45,257 0.11BRL
SUZANO PAPEL E CELULOSE-A- /PREF. 4,250 39,142 0.09BRL
VIVO PARTICIPACOES SA/PREF. SHS 2,800 108,702 0.25BRL
427,787 1.02
1.02427,787TOTAL PREFERENTIAL SHARES
AMBEV CIA DE BEBIDAS/ADR 10,500 295,785 0.71USD
ADR (American Depositary Receipt)
BRAZIL
BRASIL DISTRIBUTION PAO/ADR 1,600 65,184 0.16USD
ITAU HOLDING ITAU / PFD. /SADR 30,460 706,672 1.67USD
1,067,641 2.54
MECHEL OJSC /ADR 6,259 195,907 0.47USD
FEDERATION OF RUSSIA
195,907 0.47
DR REDDY SLABORATORIES/ADR 2,900 107,822 0.26USD
INDIA
HOUSING DEVT FIN CORP. 3,000 502,410 1.20USD
SATYAM COMPUTER /ADR 18,400 55,752 0.13USD
STERLITE INDUSTRIES (INDIA)/ADR 9,600 146,976 0.35USD
TATA MOTORS LTD /ADR 7,300 205,568 0.49USD
1,018,528 2.43
5.442,282,076TOTAL ADR (American Depositary Receipt)
92.44TOTAL TRANSFERABLE SECURITIESADMITTED TO AN OFFICIAL STOCKEXCHANGE LISTING
38,780,402
Description Currency Evaluation % netassets
Quantity/Facevalue
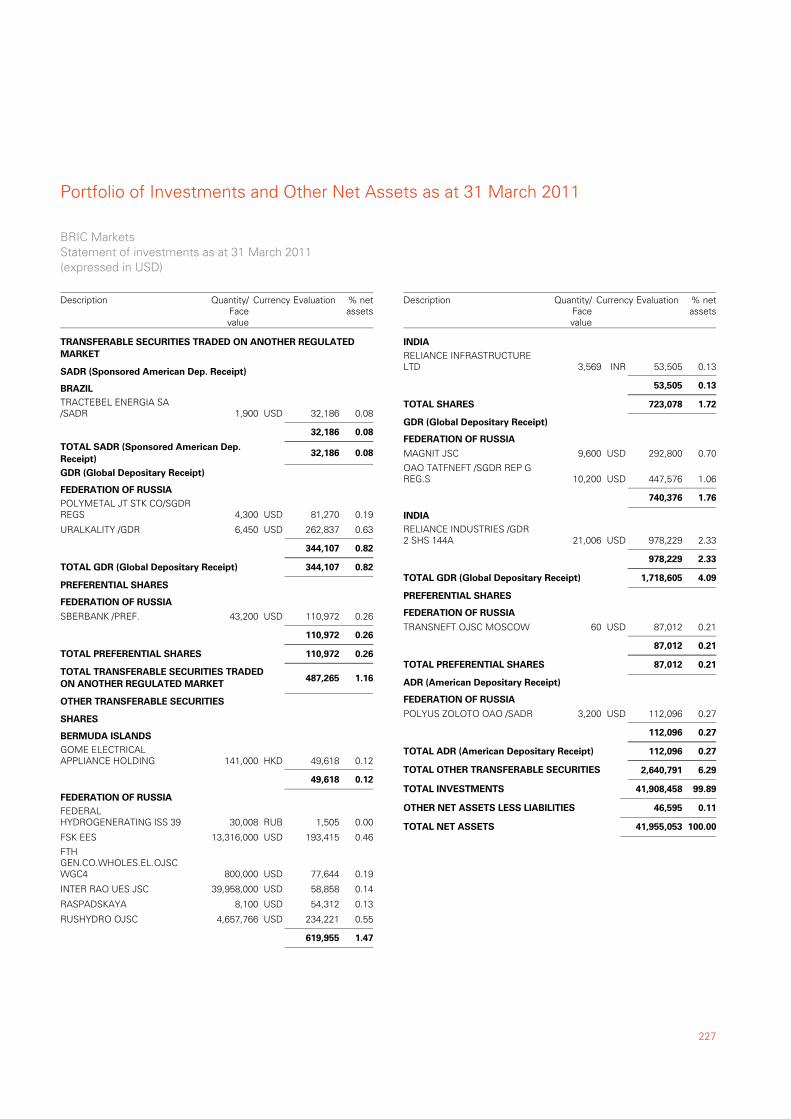
227
Portfolio of Investments and Other Net Assets as at 31 March 2011
TRACTEBEL ENERGIA SA/SADR 1,900 32,186 0.08USD
TRANSFERABLE SECURITIES TRADED ON ANOTHER REGULATEDMARKET
SADR (Sponsored American Dep. Receipt)
BRAZIL
32,186 0.08
0.0832,186TOTAL SADR (Sponsored American Dep.Receipt)
POLYMETAL JT STK CO/SGDRREGS 4,300 81,270 0.19USD
GDR (Global Depositary Receipt)
FEDERATION OF RUSSIA
URALKALITY /GDR 6,450 262,837 0.63USD
344,107 0.82
0.82344,107TOTAL GDR (Global Depositary Receipt)
SBERBANK /PREF. 43,200 110,972 0.26USD
PREFERENTIAL SHARES
FEDERATION OF RUSSIA
110,972 0.26
0.26110,972TOTAL PREFERENTIAL SHARES
1.16TOTAL TRANSFERABLE SECURITIES TRADEDON ANOTHER REGULATED MARKET
487,265
GOME ELECTRICALAPPLIANCE HOLDING 141,000 49,618 0.12HKD
OTHER TRANSFERABLE SECURITIES
SHARES
BERMUDA ISLANDS
49,618 0.12
FEDERALHYDROGENERATING ISS 39 30,008 1,505 0.00RUB
FEDERATION OF RUSSIA
FSK EES 13,316,000 193,415 0.46USD
FTHGEN.CO.WHOLES.EL.OJSCWGC4 800,000 77,644 0.19USD
INTER RAO UES JSC 39,958,000 58,858 0.14USD
RASPADSKAYA 8,100 54,312 0.13USD
RUSHYDRO OJSC 4,657,766 234,221 0.55USD
619,955 1.47
BRIC MarketsStatement of investments as at 31 March 2011(expressed in USD)
Description Currency Evaluation % netassets
Quantity/Facevalue
RELIANCE INFRASTRUCTURELTD 3,569 53,505 0.13INR
INDIA
53,505 0.13
1.72723,078TOTAL SHARES
MAGNIT JSC 9,600 292,800 0.70USD
GDR (Global Depositary Receipt)
FEDERATION OF RUSSIA
OAO TATFNEFT /SGDR REP GREG.S 10,200 447,576 1.06USD
740,376 1.76
RELIANCE INDUSTRIES /GDR2 SHS 144A 21,006 978,229 2.33USD
INDIA
978,229 2.33
4.091,718,605TOTAL GDR (Global Depositary Receipt)
TRANSNEFT OJSC MOSCOW 60 87,012 0.21USD
PREFERENTIAL SHARES
FEDERATION OF RUSSIA
87,012 0.21
0.2187,012TOTAL PREFERENTIAL SHARES
POLYUS ZOLOTO OAO /SADR 3,200 112,096 0.27USD
ADR (American Depositary Receipt)
FEDERATION OF RUSSIA
112,096 0.27
0.27112,096TOTAL ADR (American Depositary Receipt)
6.29TOTAL OTHER TRANSFERABLE SECURITIES 2,640,791
99.89TOTAL INVESTMENTS 41,908,458
0.11OTHER NET ASSETS LESS LIABILITIES 46,595
100.00TOTAL NET ASSETS 41,955,053
Description Currency Evaluation % netassets
Quantity/Facevalue
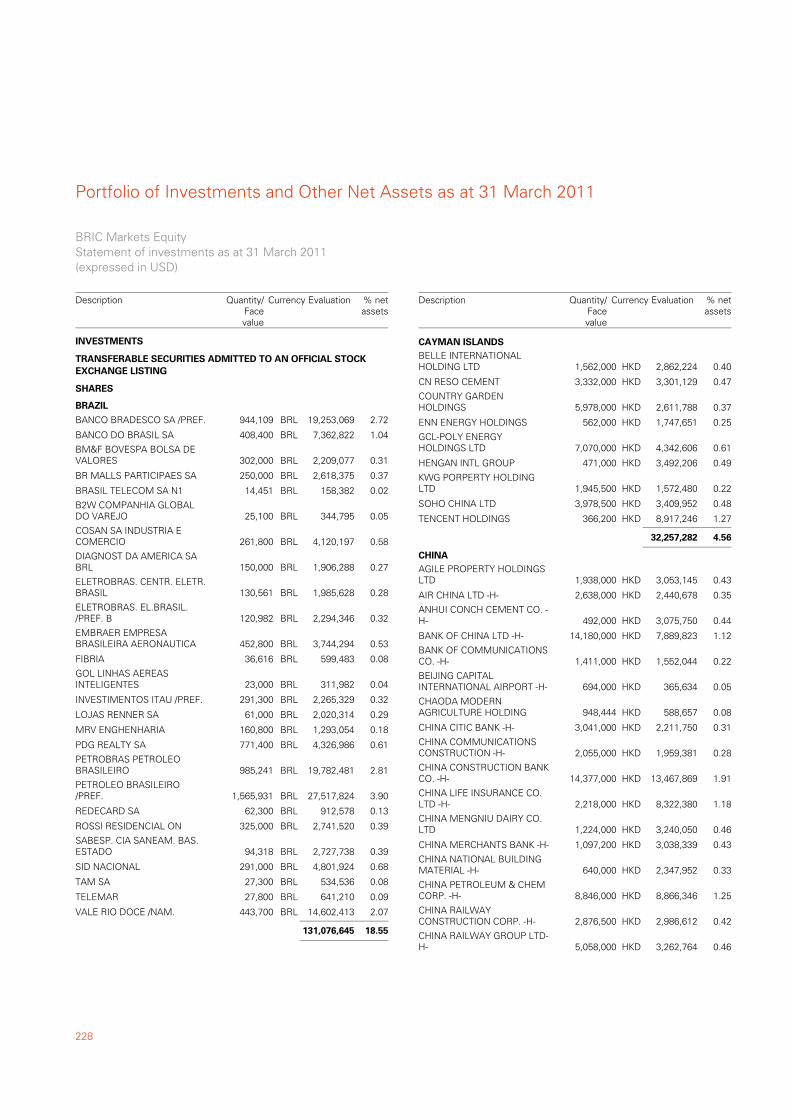
Portfolio of Investments and Other Net Assets as at 31 March 2011
228
BANCO BRADESCO SA /PREF. 944,109 19,253,069 2.72BRL
TRANSFERABLE SECURITIES ADMITTED TO AN OFFICIAL STOCKEXCHANGE LISTING
SHARES
BRAZIL
BANCO DO BRASIL SA 408,400 7,362,822 1.04BRL
BM&F BOVESPA BOLSA DEVALORES 302,000 2,209,077 0.31BRL
BR MALLS PARTICIPAES SA 250,000 2,618,375 0.37BRL
BRASIL TELECOM SA N1 14,451 158,382 0.02BRL
B2W COMPANHIA GLOBALDO VAREJO 25,100 344,795 0.05BRL
COSAN SA INDUSTRIA ECOMERCIO 261,800 4,120,197 0.58BRL
DIAGNOST DA AMERICA SABRL 150,000 1,906,288 0.27BRL
ELETROBRAS. CENTR. ELETR.BRASIL 130,561 1,985,628 0.28BRL
ELETROBRAS. EL.BRASIL./PREF. B 120,982 2,294,346 0.32BRL
EMBRAER EMPRESABRASILEIRA AERONAUTICA 452,800 3,744,294 0.53BRL
FIBRIA 36,616 599,483 0.08BRL
GOL LINHAS AEREASINTELIGENTES 23,000 311,982 0.04BRL
INVESTIMENTOS ITAU /PREF. 291,300 2,265,329 0.32BRL
LOJAS RENNER SA 61,000 2,020,314 0.29BRL
MRV ENGHENHARIA 160,800 1,293,054 0.18BRL
PDG REALTY SA 771,400 4,326,986 0.61BRL
PETROBRAS PETROLEOBRASILEIRO 985,241 19,782,481 2.81BRL
PETROLEO BRASILEIRO/PREF. 1,565,931 27,517,824 3.90BRL
REDECARD SA 62,300 912,578 0.13BRL
ROSSI RESIDENCIAL ON 325,000 2,741,520 0.39BRL
SABESP. CIA SANEAM. BAS.ESTADO 94,318 2,727,738 0.39BRL
SID NACIONAL 291,000 4,801,924 0.68BRL
TAM SA 27,300 534,536 0.08BRL
TELEMAR 27,800 641,210 0.09BRL
VALE RIO DOCE /NAM. 443,700 14,602,413 2.07BRL
131,076,645 18.55
INVESTMENTS
BRIC Markets EquityStatement of investments as at 31 March 2011(expressed in USD)
Description Currency Evaluation % netassets
Quantity/Facevalue
BELLE INTERNATIONALHOLDING LTD 1,562,000 2,862,224 0.40HKD
CAYMAN ISLANDS
CN RESO CEMENT 3,332,000 3,301,129 0.47HKD
COUNTRY GARDENHOLDINGS 5,978,000 2,611,788 0.37HKD
ENN ENERGY HOLDINGS 562,000 1,747,651 0.25HKD
GCL-POLY ENERGYHOLDINGS LTD 7,070,000 4,342,606 0.61HKD
HENGAN INTL GROUP 471,000 3,492,206 0.49HKD
KWG PORPERTY HOLDINGLTD 1,945,500 1,572,480 0.22HKD
SOHO CHINA LTD 3,978,500 3,409,952 0.48HKD
TENCENT HOLDINGS 366,200 8,917,246 1.27HKD
32,257,282 4.56
AGILE PROPERTY HOLDINGSLTD 1,938,000 3,053,145 0.43HKD
CHINA
AIR CHINA LTD -H- 2,638,000 2,440,678 0.35HKD
ANHUI CONCH CEMENT CO. -H- 492,000 3,075,750 0.44HKD
BANK OF CHINA LTD -H- 14,180,000 7,889,823 1.12HKD
BANK OF COMMUNICATIONSCO. -H- 1,411,000 1,552,044 0.22HKD
BEIJING CAPITALINTERNATIONAL AIRPORT -H- 694,000 365,634 0.05HKD
CHAODA MODERNAGRICULTURE HOLDING 948,444 588,657 0.08HKD
CHINA CITIC BANK -H- 3,041,000 2,211,750 0.31HKD
CHINA COMMUNICATIONSCONSTRUCTION -H- 2,055,000 1,959,381 0.28HKD
CHINA CONSTRUCTION BANKCO. -H- 14,377,000 13,467,869 1.91HKD
CHINA LIFE INSURANCE CO.LTD -H- 2,218,000 8,322,380 1.18HKD
CHINA MENGNIU DAIRY CO.LTD 1,224,000 3,240,050 0.46HKD
CHINA MERCHANTS BANK -H- 1,097,200 3,038,339 0.43HKD
CHINA NATIONAL BUILDINGMATERIAL -H- 640,000 2,347,952 0.33HKD
CHINA PETROLEUM & CHEMCORP. -H- 8,846,000 8,866,346 1.25HKD
CHINA RAILWAYCONSTRUCTION CORP. -H- 2,876,500 2,986,612 0.42HKD
CHINA RAILWAY GROUP LTD-H- 5,058,000 3,262,764 0.46HKD
Description Currency Evaluation % netassets
Quantity/Facevalue
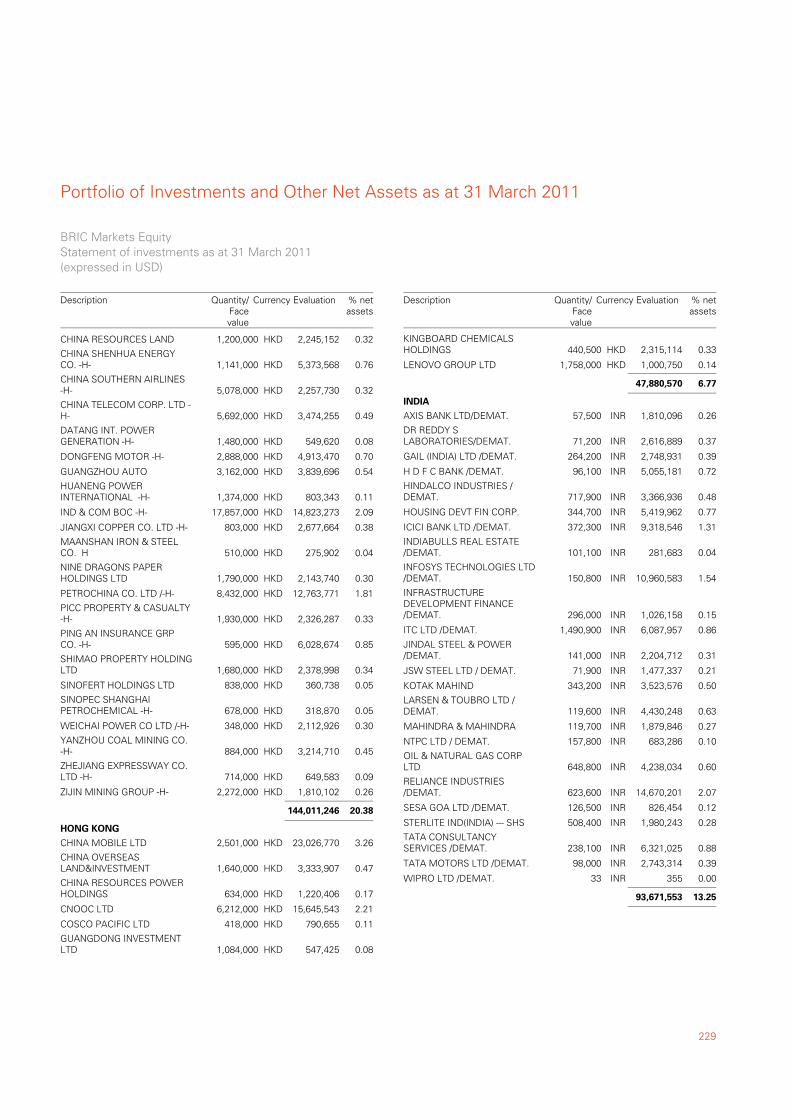
229
Portfolio of Investments and Other Net Assets as at 31 March 2011
CHINA RESOURCES LAND 1,200,000 2,245,152 0.32HKD
CHINA SHENHUA ENERGYCO. -H- 1,141,000 5,373,568 0.76HKD
CHINA SOUTHERN AIRLINES-H- 5,078,000 2,257,730 0.32HKD
CHINA TELECOM CORP. LTD -H- 5,692,000 3,474,255 0.49HKD
DATANG INT. POWERGENERATION -H- 1,480,000 549,620 0.08HKD
DONGFENG MOTOR -H- 2,888,000 4,913,470 0.70HKD
GUANGZHOU AUTO 3,162,000 3,839,696 0.54HKD
HUANENG POWERINTERNATIONAL -H- 1,374,000 803,343 0.11HKD
IND & COM BOC -H- 17,857,000 14,823,273 2.09HKD
JIANGXI COPPER CO. LTD -H- 803,000 2,677,664 0.38HKD
MAANSHAN IRON & STEELCO. H 510,000 275,902 0.04HKD
NINE DRAGONS PAPERHOLDINGS LTD 1,790,000 2,143,740 0.30HKD
PETROCHINA CO. LTD /-H- 8,432,000 12,763,771 1.81HKD
PICC PROPERTY & CASUALTY-H- 1,930,000 2,326,287 0.33HKD
PING AN INSURANCE GRPCO. -H- 595,000 6,028,674 0.85HKD
SHIMAO PROPERTY HOLDINGLTD 1,680,000 2,378,998 0.34HKD
SINOFERT HOLDINGS LTD 838,000 360,738 0.05HKD
SINOPEC SHANGHAIPETROCHEMICAL -H- 678,000 318,870 0.05HKD
WEICHAI POWER CO LTD /-H- 348,000 2,112,926 0.30HKD
YANZHOU COAL MINING CO.-H- 884,000 3,214,710 0.45HKD
ZHEJIANG EXPRESSWAY CO.LTD -H- 714,000 649,583 0.09HKD
ZIJIN MINING GROUP -H- 2,272,000 1,810,102 0.26HKD
144,011,246 20.38
CHINA MOBILE LTD 2,501,000 23,026,770 3.26HKD
HONG KONG
CHINA OVERSEASLAND&INVESTMENT 1,640,000 3,333,907 0.47HKD
CHINA RESOURCES POWERHOLDINGS 634,000 1,220,406 0.17HKD
CNOOC LTD 6,212,000 15,645,543 2.21HKD
COSCO PACIFIC LTD 418,000 790,655 0.11HKD
GUANGDONG INVESTMENTLTD 1,084,000 547,425 0.08HKD
BRIC Markets EquityStatement of investments as at 31 March 2011(expressed in USD)
Description Currency Evaluation % netassets
Quantity/Facevalue
KINGBOARD CHEMICALSHOLDINGS 440,500 2,315,114 0.33HKD
LENOVO GROUP LTD 1,758,000 1,000,750 0.14HKD
47,880,570 6.77
AXIS BANK LTD/DEMAT. 57,500 1,810,096 0.26INR
INDIA
DR REDDY SLABORATORIES/DEMAT. 71,200 2,616,889 0.37INR
GAIL (INDIA) LTD /DEMAT. 264,200 2,748,931 0.39INR
H D F C BANK /DEMAT. 96,100 5,055,181 0.72INR
HINDALCO INDUSTRIES /DEMAT. 717,900 3,366,936 0.48INR
HOUSING DEVT FIN CORP. 344,700 5,419,962 0.77INR
ICICI BANK LTD /DEMAT. 372,300 9,318,546 1.31INR
INDIABULLS REAL ESTATE/DEMAT. 101,100 281,683 0.04INR
INFOSYS TECHNOLOGIES LTD/DEMAT. 150,800 10,960,583 1.54INR
INFRASTRUCTUREDEVELOPMENT FINANCE/DEMAT. 296,000 1,026,158 0.15INR
ITC LTD /DEMAT. 1,490,900 6,087,957 0.86INR
JINDAL STEEL & POWER/DEMAT. 141,000 2,204,712 0.31INR
JSW STEEL LTD / DEMAT. 71,900 1,477,337 0.21INR
KOTAK MAHIND 343,200 3,523,576 0.50INR
LARSEN & TOUBRO LTD /DEMAT. 119,600 4,430,248 0.63INR
MAHINDRA & MAHINDRA 119,700 1,879,846 0.27INR
NTPC LTD / DEMAT. 157,800 683,286 0.10INR
OIL & NATURAL GAS CORPLTD 648,800 4,238,034 0.60INR
RELIANCE INDUSTRIES/DEMAT. 623,600 14,670,201 2.07INR
SESA GOA LTD /DEMAT. 126,500 826,454 0.12INR
STERLITE IND(INDIA) --- SHS 508,400 1,980,243 0.28INR
TATA CONSULTANCYSERVICES /DEMAT. 238,100 6,321,025 0.88INR
TATA MOTORS LTD /DEMAT. 98,000 2,743,314 0.39INR
WIPRO LTD /DEMAT. 33 355 0.00INR
93,671,553 13.25
Description Currency Evaluation % netassets
Quantity/Facevalue
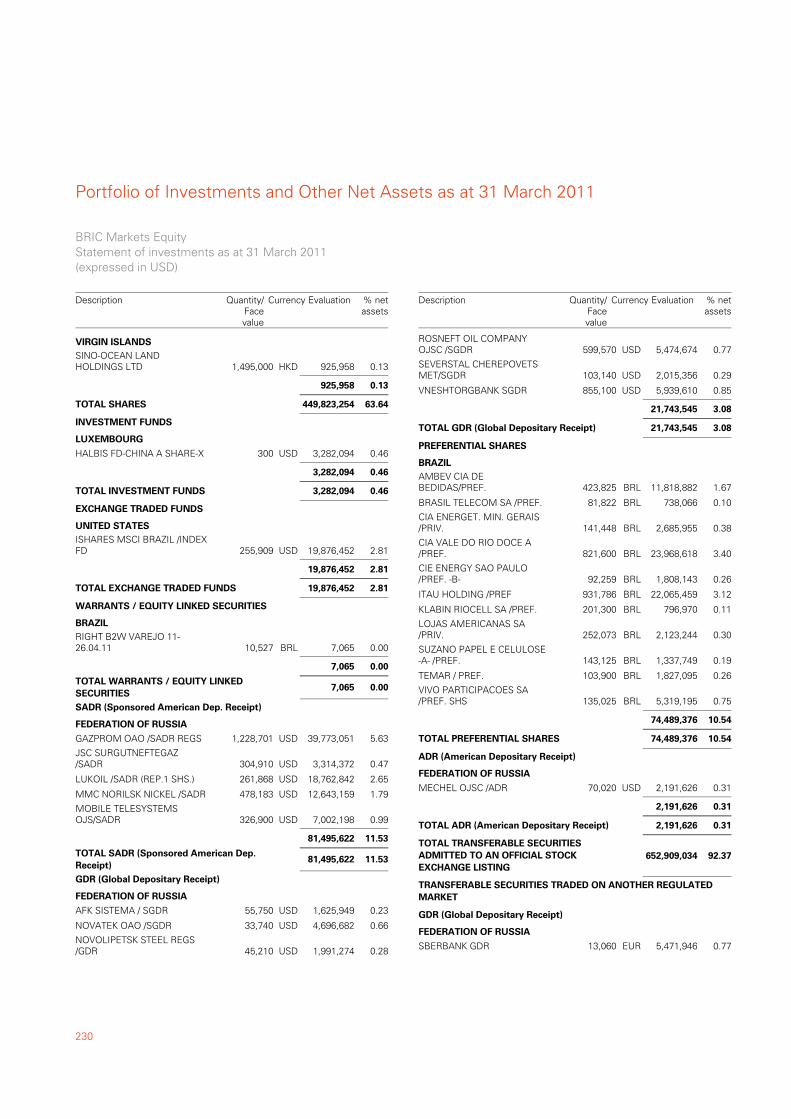
Portfolio of Investments and Other Net Assets as at 31 March 2011
230
SINO-OCEAN LANDHOLDINGS LTD 1,495,000 925,958 0.13HKD
VIRGIN ISLANDS
925,958 0.13
63.64449,823,254TOTAL SHARES
HALBIS FD-CHINA A SHARE-X 300 3,282,094 0.46USD
INVESTMENT FUNDS
LUXEMBOURG
3,282,094 0.46
0.463,282,094TOTAL INVESTMENT FUNDS
ISHARES MSCI BRAZIL /INDEXFD 255,909 19,876,452 2.81USD
EXCHANGE TRADED FUNDS
UNITED STATES
19,876,452 2.81
2.8119,876,452TOTAL EXCHANGE TRADED FUNDS
RIGHT B2W VAREJO 11-26.04.11 10,527 7,065 0.00BRL
WARRANTS / EQUITY LINKED SECURITIES
BRAZIL
7,065 0.00
0.007,065TOTAL WARRANTS / EQUITY LINKEDSECURITIES
GAZPROM OAO /SADR REGS 1,228,701 39,773,051 5.63USD
SADR (Sponsored American Dep. Receipt)
FEDERATION OF RUSSIA
JSC SURGUTNEFTEGAZ/SADR 304,910 3,314,372 0.47USD
LUKOIL /SADR (REP.1 SHS.) 261,868 18,762,842 2.65USD
MMC NORILSK NICKEL /SADR 478,183 12,643,159 1.79USD
MOBILE TELESYSTEMSOJS/SADR 326,900 7,002,198 0.99USD
81,495,622 11.53
11.5381,495,622TOTAL SADR (Sponsored American Dep.Receipt)
AFK SISTEMA / SGDR 55,750 1,625,949 0.23USD
GDR (Global Depositary Receipt)
FEDERATION OF RUSSIA
NOVATEK OAO /SGDR 33,740 4,696,682 0.66USD
NOVOLIPETSK STEEL REGS/GDR 45,210 1,991,274 0.28USD
BRIC Markets EquityStatement of investments as at 31 March 2011(expressed in USD)
Description Currency Evaluation % netassets
Quantity/Facevalue
ROSNEFT OIL COMPANYOJSC /SGDR 599,570 5,474,674 0.77USD
SEVERSTAL CHEREPOVETSMET/SGDR 103,140 2,015,356 0.29USD
VNESHTORGBANK SGDR 855,100 5,939,610 0.85USD
21,743,545 3.08
3.0821,743,545TOTAL GDR (Global Depositary Receipt)
AMBEV CIA DEBEDIDAS/PREF. 423,825 11,818,882 1.67BRL
PREFERENTIAL SHARES
BRAZIL
BRASIL TELECOM SA /PREF. 81,822 738,066 0.10BRL
CIA ENERGET. MIN. GERAIS/PRIV. 141,448 2,685,955 0.38BRL
CIA VALE DO RIO DOCE A/PREF. 821,600 23,968,618 3.40BRL
CIE ENERGY SAO PAULO/PREF. -B- 92,259 1,808,143 0.26BRL
ITAU HOLDING /PREF 931,786 22,065,459 3.12BRL
KLABIN RIOCELL SA /PREF. 201,300 796,970 0.11BRL
LOJAS AMERICANAS SA/PRIV. 252,073 2,123,244 0.30BRL
SUZANO PAPEL E CELULOSE-A- /PREF. 143,125 1,337,749 0.19BRL
TEMAR / PREF. 103,900 1,827,095 0.26BRL
VIVO PARTICIPACOES SA/PREF. SHS 135,025 5,319,195 0.75BRL
74,489,376 10.54
10.5474,489,376TOTAL PREFERENTIAL SHARES
MECHEL OJSC /ADR 70,020 2,191,626 0.31USD
ADR (American Depositary Receipt)
FEDERATION OF RUSSIA
2,191,626 0.31
0.312,191,626TOTAL ADR (American Depositary Receipt)
92.37TOTAL TRANSFERABLE SECURITIESADMITTED TO AN OFFICIAL STOCKEXCHANGE LISTING
652,909,034
SBERBANK GDR 13,060 5,471,946 0.77EUR
TRANSFERABLE SECURITIES TRADED ON ANOTHER REGULATEDMARKET
GDR (Global Depositary Receipt)
FEDERATION OF RUSSIA
Description Currency Evaluation % netassets
Quantity/Facevalue
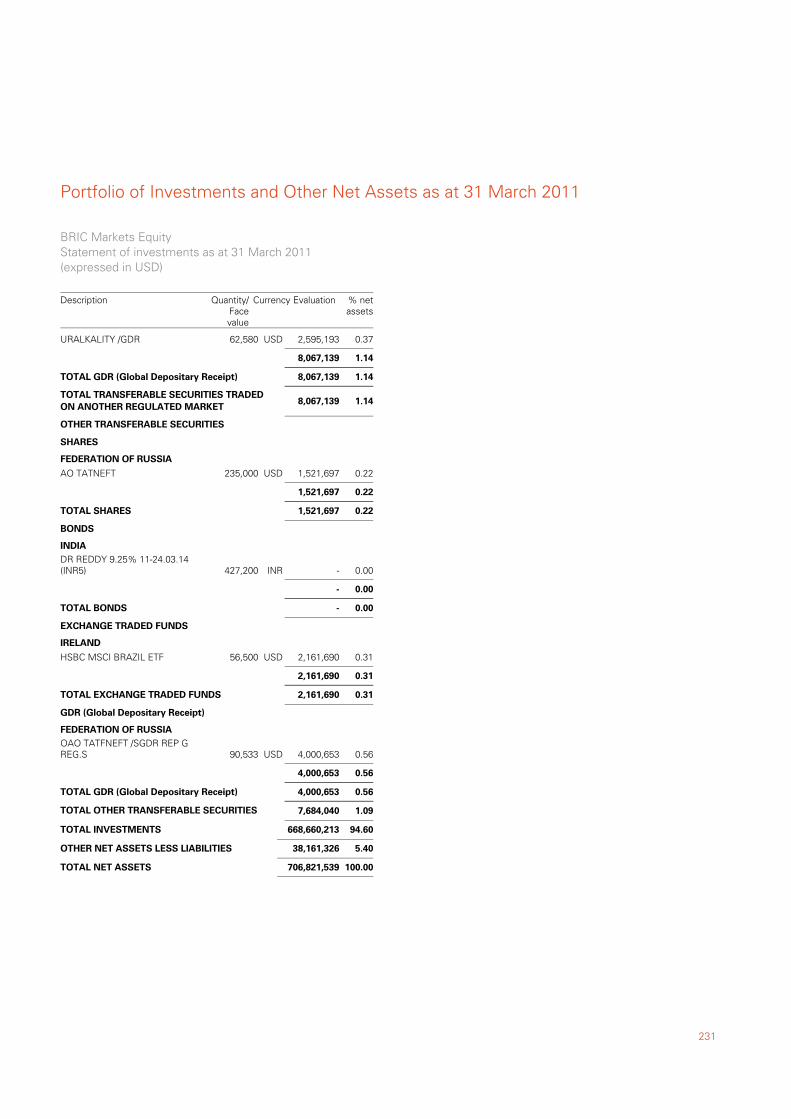
231
Portfolio of Investments and Other Net Assets as at 31 March 2011
URALKALITY /GDR 62,580 2,595,193 0.37USD
8,067,139 1.14
1.148,067,139TOTAL GDR (Global Depositary Receipt)
1.14TOTAL TRANSFERABLE SECURITIES TRADEDON ANOTHER REGULATED MARKET
8,067,139
AO TATNEFT 235,000 1,521,697 0.22USD
OTHER TRANSFERABLE SECURITIES
SHARES
FEDERATION OF RUSSIA
1,521,697 0.22
0.221,521,697TOTAL SHARES
DR REDDY 9.25% 11-24.03.14(INR5) 427,200 - 0.00INR
BONDS
INDIA
- 0.00
0.00-TOTAL BONDS
HSBC MSCI BRAZIL ETF 56,500 2,161,690 0.31USD
EXCHANGE TRADED FUNDS
IRELAND
2,161,690 0.31
0.312,161,690TOTAL EXCHANGE TRADED FUNDS
OAO TATFNEFT /SGDR REP GREG.S 90,533 4,000,653 0.56USD
GDR (Global Depositary Receipt)
FEDERATION OF RUSSIA
4,000,653 0.56
0.564,000,653TOTAL GDR (Global Depositary Receipt)
1.09TOTAL OTHER TRANSFERABLE SECURITIES 7,684,040
94.60TOTAL INVESTMENTS 668,660,213
5.40OTHER NET ASSETS LESS LIABILITIES 38,161,326
100.00TOTAL NET ASSETS 706,821,539
BRIC Markets EquityStatement of investments as at 31 March 2011(expressed in USD)
Description Currency Evaluation % netassets
Quantity/Facevalue
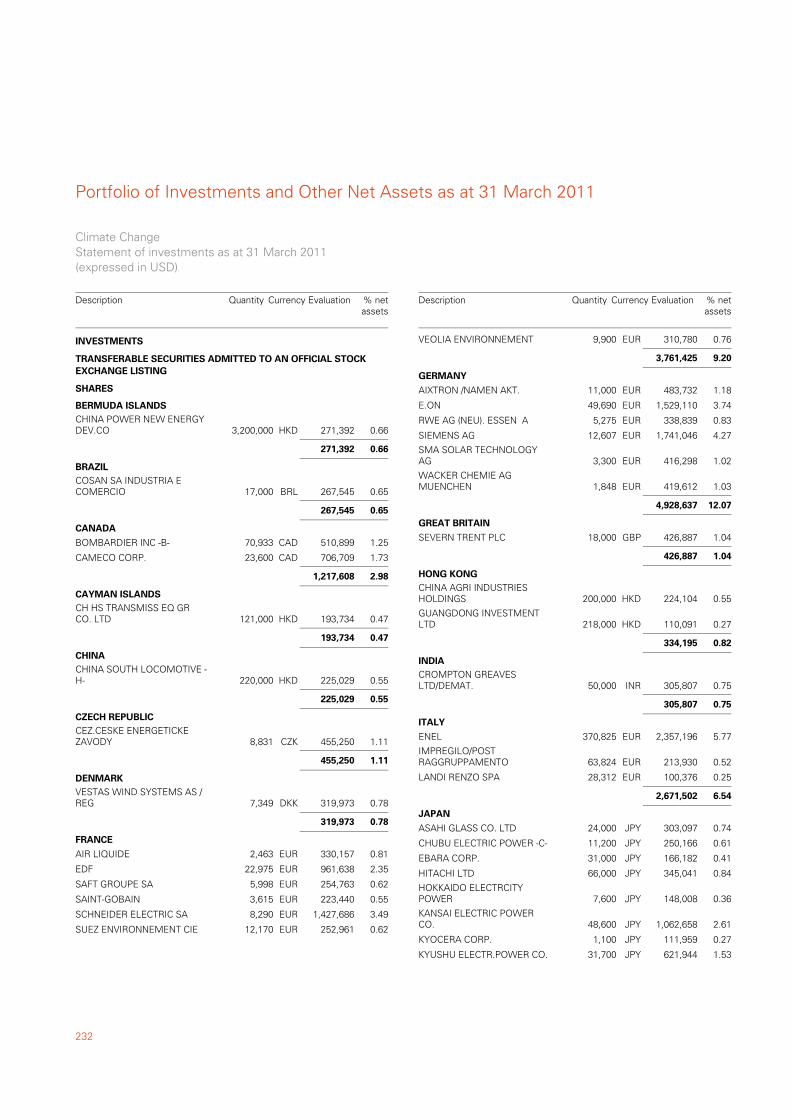
Portfolio of Investments and Other Net Assets as at 31 March 2011
232
CHINA POWER NEW ENERGYDEV.CO 3,200,000 271,392 0.66HKD
TRANSFERABLE SECURITIES ADMITTED TO AN OFFICIAL STOCKEXCHANGE LISTING
SHARES
BERMUDA ISLANDS
271,392 0.66
COSAN SA INDUSTRIA ECOMERCIO 17,000 267,545 0.65BRL
BRAZIL
267,545 0.65
BOMBARDIER INC -B- 70,933 510,899 1.25CAD
CANADA
CAMECO CORP. 23,600 706,709 1.73CAD
1,217,608 2.98
CH HS TRANSMISS EQ GRCO. LTD 121,000 193,734 0.47HKD
CAYMAN ISLANDS
193,734 0.47
CHINA SOUTH LOCOMOTIVE -H- 220,000 225,029 0.55HKD
CHINA
225,029 0.55
CEZ.CESKE ENERGETICKEZAVODY 8,831 455,250 1.11CZK
CZECH REPUBLIC
455,250 1.11
VESTAS WIND SYSTEMS AS /REG 7,349 319,973 0.78DKK
DENMARK
319,973 0.78
AIR LIQUIDE 2,463 330,157 0.81EUR
FRANCE
EDF 22,975 961,638 2.35EUR
SAFT GROUPE SA 5,998 254,763 0.62EUR
SAINT-GOBAIN 3,615 223,440 0.55EUR
SCHNEIDER ELECTRIC SA 8,290 1,427,686 3.49EUR
SUEZ ENVIRONNEMENT CIE 12,170 252,961 0.62EUR
INVESTMENTS
Climate ChangeStatement of investments as at 31 March 2011(expressed in USD)
Description Quantity Currency Evaluation % netassets
VEOLIA ENVIRONNEMENT 9,900 310,780 0.76EUR
3,761,425 9.20
AIXTRON /NAMEN AKT. 11,000 483,732 1.18EUR
GERMANY
E.ON 49,690 1,529,110 3.74EUR
RWE AG (NEU). ESSEN A 5,275 338,839 0.83EUR
SIEMENS AG 12,607 1,741,046 4.27EUR
SMA SOLAR TECHNOLOGYAG 3,300 416,298 1.02EUR
WACKER CHEMIE AGMUENCHEN 1,848 419,612 1.03EUR
4,928,637 12.07
SEVERN TRENT PLC 18,000 426,887 1.04GBP
GREAT BRITAIN
426,887 1.04
CHINA AGRI INDUSTRIESHOLDINGS 200,000 224,104 0.55HKD
HONG KONG
GUANGDONG INVESTMENTLTD 218,000 110,091 0.27HKD
334,195 0.82
CROMPTON GREAVESLTD/DEMAT. 50,000 305,807 0.75INR
INDIA
305,807 0.75
ENEL 370,825 2,357,196 5.77EUR
ITALY
IMPREGILO/POSTRAGGRUPPAMENTO 63,824 213,930 0.52EUR
LANDI RENZO SPA 28,312 100,376 0.25EUR
2,671,502 6.54
ASAHI GLASS CO. LTD 24,000 303,097 0.74JPY
JAPAN
CHUBU ELECTRIC POWER -C- 11,200 250,166 0.61JPY
EBARA CORP. 31,000 166,182 0.41JPY
HITACHI LTD 66,000 345,041 0.84JPY
HOKKAIDO ELECTRCITYPOWER 7,600 148,008 0.36JPY
KANSAI ELECTRIC POWERCO. 48,600 1,062,658 2.61JPY
KYOCERA CORP. 1,100 111,959 0.27JPY
KYUSHU ELECTR.POWER CO. 31,700 621,944 1.53JPY
Description Quantity Currency Evaluation % netassets
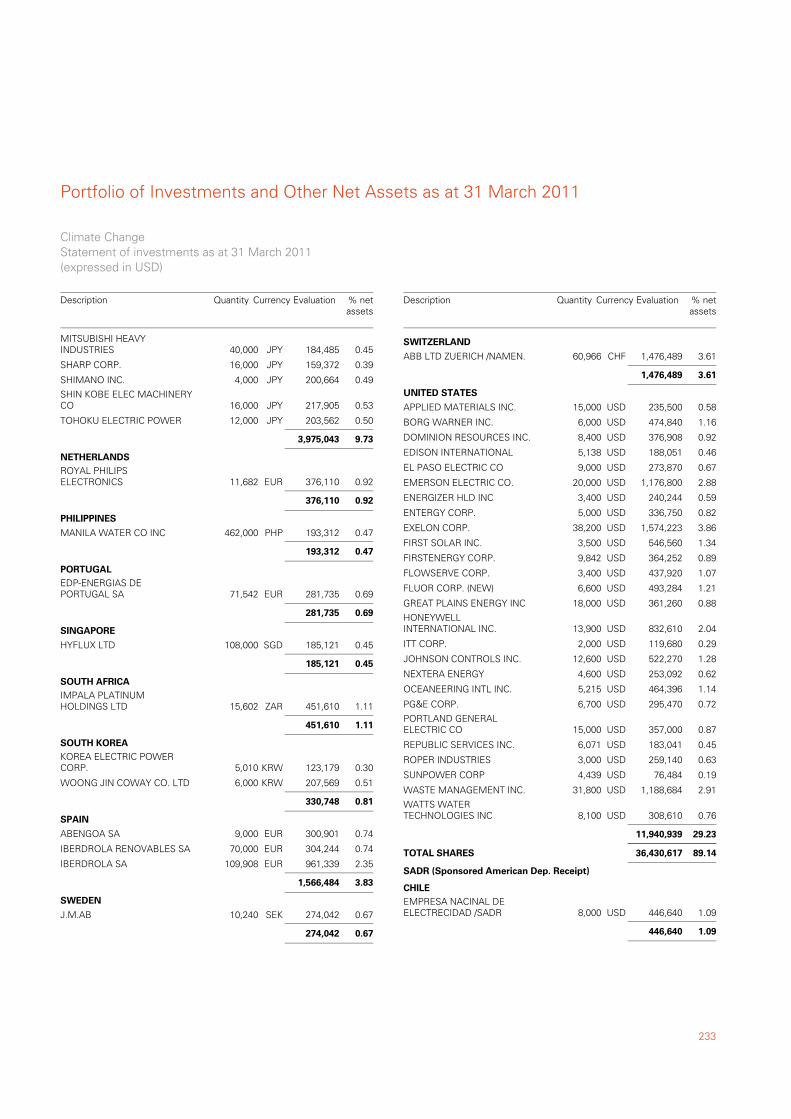
233
Portfolio of Investments and Other Net Assets as at 31 March 2011
MITSUBISHI HEAVYINDUSTRIES 40,000 184,485 0.45JPY
SHARP CORP. 16,000 159,372 0.39JPY
SHIMANO INC. 4,000 200,664 0.49JPY
SHIN KOBE ELEC MACHINERYCO 16,000 217,905 0.53JPY
TOHOKU ELECTRIC POWER 12,000 203,562 0.50JPY
3,975,043 9.73
ROYAL PHILIPSELECTRONICS 11,682 376,110 0.92EUR
NETHERLANDS
376,110 0.92
MANILA WATER CO INC 462,000 193,312 0.47PHP
PHILIPPINES
193,312 0.47
EDP-ENERGIAS DEPORTUGAL SA 71,542 281,735 0.69EUR
PORTUGAL
281,735 0.69
HYFLUX LTD 108,000 185,121 0.45SGD
SINGAPORE
185,121 0.45
IMPALA PLATINUMHOLDINGS LTD 15,602 451,610 1.11ZAR
SOUTH AFRICA
451,610 1.11
KOREA ELECTRIC POWERCORP. 5,010 123,179 0.30KRW
SOUTH KOREA
WOONG JIN COWAY CO. LTD 6,000 207,569 0.51KRW
330,748 0.81
ABENGOA SA 9,000 300,901 0.74EUR
SPAIN
IBERDROLA RENOVABLES SA 70,000 304,244 0.74EUR
IBERDROLA SA 109,908 961,339 2.35EUR
1,566,484 3.83
J.M.AB 10,240 274,042 0.67SEK
SWEDEN
274,042 0.67
Climate ChangeStatement of investments as at 31 March 2011(expressed in USD)
Description Quantity Currency Evaluation % netassets
ABB LTD ZUERICH /NAMEN. 60,966 1,476,489 3.61CHF
SWITZERLAND
1,476,489 3.61
APPLIED MATERIALS INC. 15,000 235,500 0.58USD
UNITED STATES
BORG WARNER INC. 6,000 474,840 1.16USD
DOMINION RESOURCES INC. 8,400 376,908 0.92USD
EDISON INTERNATIONAL 5,138 188,051 0.46USD
EL PASO ELECTRIC CO 9,000 273,870 0.67USD
EMERSON ELECTRIC CO. 20,000 1,176,800 2.88USD
ENERGIZER HLD INC 3,400 240,244 0.59USD
ENTERGY CORP. 5,000 336,750 0.82USD
EXELON CORP. 38,200 1,574,223 3.86USD
FIRST SOLAR INC. 3,500 546,560 1.34USD
FIRSTENERGY CORP. 9,842 364,252 0.89USD
FLOWSERVE CORP. 3,400 437,920 1.07USD
FLUOR CORP. (NEW) 6,600 493,284 1.21USD
GREAT PLAINS ENERGY INC 18,000 361,260 0.88USD
HONEYWELLINTERNATIONAL INC. 13,900 832,610 2.04USD
ITT CORP. 2,000 119,680 0.29USD
JOHNSON CONTROLS INC. 12,600 522,270 1.28USD
NEXTERA ENERGY 4,600 253,092 0.62USD
OCEANEERING INTL INC. 5,215 464,396 1.14USD
PG&E CORP. 6,700 295,470 0.72USD
PORTLAND GENERALELECTRIC CO 15,000 357,000 0.87USD
REPUBLIC SERVICES INC. 6,071 183,041 0.45USD
ROPER INDUSTRIES 3,000 259,140 0.63USD
SUNPOWER CORP 4,439 76,484 0.19USD
WASTE MANAGEMENT INC. 31,800 1,188,684 2.91USD
WATTS WATERTECHNOLOGIES INC 8,100 308,610 0.76USD
11,940,939 29.23
89.1436,430,617TOTAL SHARES
EMPRESA NACINAL DEELECTRECIDAD /SADR 8,000 446,640 1.09USD
SADR (Sponsored American Dep. Receipt)
CHILE
446,640 1.09
Description Quantity Currency Evaluation % netassets
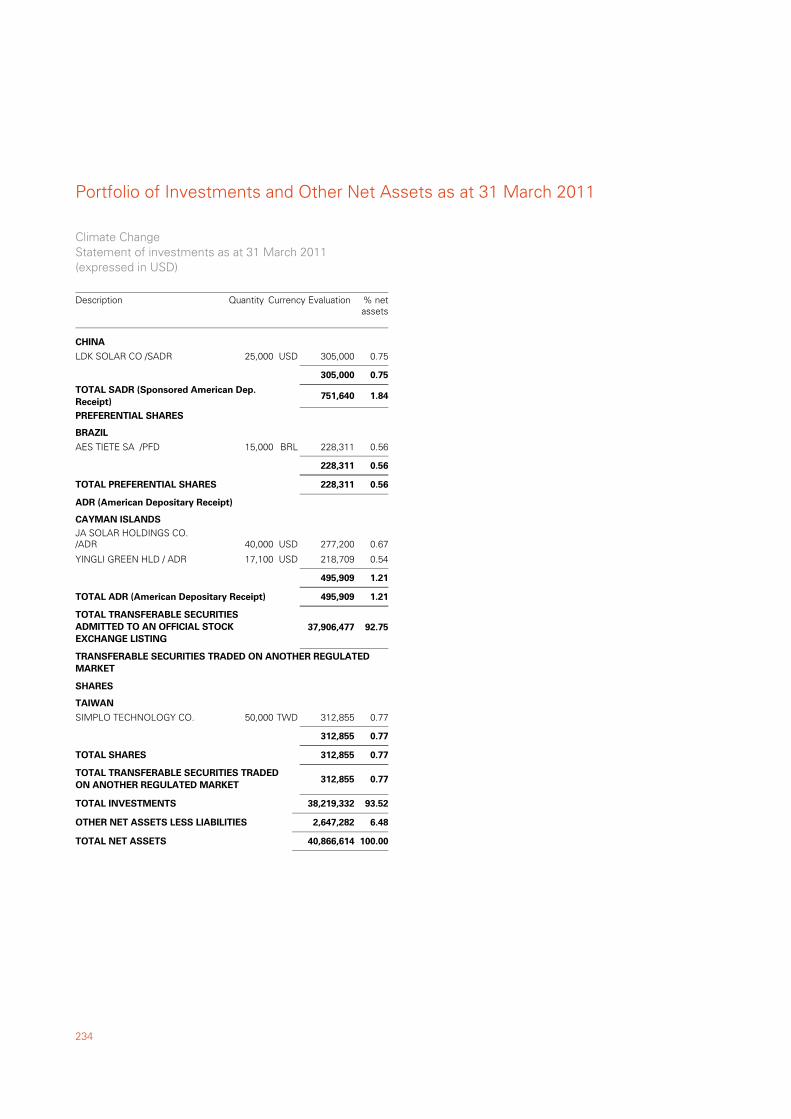
Portfolio of Investments and Other Net Assets as at 31 March 2011
234
LDK SOLAR CO /SADR 25,000 305,000 0.75USD
CHINA
305,000 0.75
1.84751,640TOTAL SADR (Sponsored American Dep.Receipt)
AES TIETE SA /PFD 15,000 228,311 0.56BRL
PREFERENTIAL SHARES
BRAZIL
228,311 0.56
0.56228,311TOTAL PREFERENTIAL SHARES
JA SOLAR HOLDINGS CO./ADR 40,000 277,200 0.67USD
ADR (American Depositary Receipt)
CAYMAN ISLANDS
YINGLI GREEN HLD / ADR 17,100 218,709 0.54USD
495,909 1.21
1.21495,909TOTAL ADR (American Depositary Receipt)
92.75TOTAL TRANSFERABLE SECURITIESADMITTED TO AN OFFICIAL STOCKEXCHANGE LISTING
37,906,477
SIMPLO TECHNOLOGY CO. 50,000 312,855 0.77TWD
TRANSFERABLE SECURITIES TRADED ON ANOTHER REGULATEDMARKET
SHARES
TAIWAN
312,855 0.77
0.77312,855TOTAL SHARES
0.77TOTAL TRANSFERABLE SECURITIES TRADEDON ANOTHER REGULATED MARKET
312,855
93.52TOTAL INVESTMENTS 38,219,332
6.48OTHER NET ASSETS LESS LIABILITIES 2,647,282
100.00TOTAL NET ASSETS 40,866,614
Climate ChangeStatement of investments as at 31 March 2011(expressed in USD)
Description Quantity Currency Evaluation % netassets
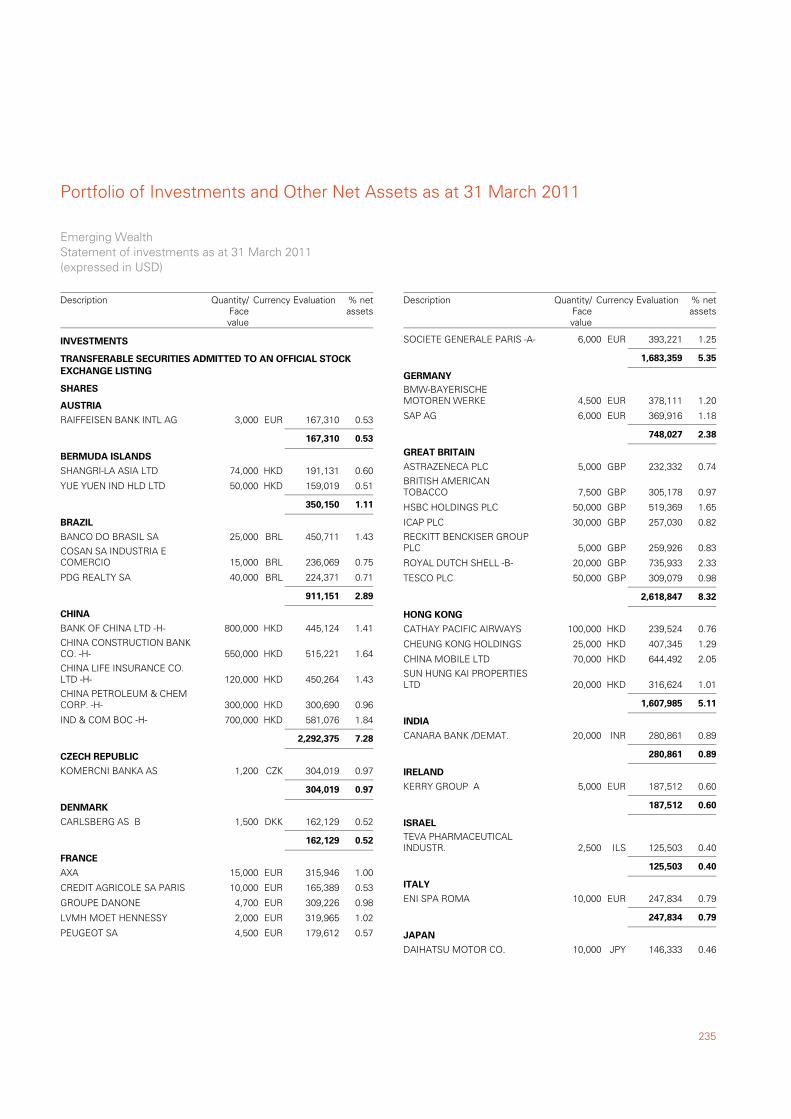
235
Portfolio of Investments and Other Net Assets as at 31 March 2011
RAIFFEISEN BANK INTL AG 3,000 167,310 0.53EUR
TRANSFERABLE SECURITIES ADMITTED TO AN OFFICIAL STOCKEXCHANGE LISTING
SHARES
AUSTRIA
167,310 0.53
SHANGRI-LA ASIA LTD 74,000 191,131 0.60HKD
BERMUDA ISLANDS
YUE YUEN IND HLD LTD 50,000 159,019 0.51HKD
350,150 1.11
BANCO DO BRASIL SA 25,000 450,711 1.43BRL
BRAZIL
COSAN SA INDUSTRIA ECOMERCIO 15,000 236,069 0.75BRL
PDG REALTY SA 40,000 224,371 0.71BRL
911,151 2.89
BANK OF CHINA LTD -H- 800,000 445,124 1.41HKD
CHINA
CHINA CONSTRUCTION BANKCO. -H- 550,000 515,221 1.64HKD
CHINA LIFE INSURANCE CO.LTD -H- 120,000 450,264 1.43HKD
CHINA PETROLEUM & CHEMCORP. -H- 300,000 300,690 0.96HKD
IND & COM BOC -H- 700,000 581,076 1.84HKD
2,292,375 7.28
KOMERCNI BANKA AS 1,200 304,019 0.97CZK
CZECH REPUBLIC
304,019 0.97
CARLSBERG AS B 1,500 162,129 0.52DKK
DENMARK
162,129 0.52
AXA 15,000 315,946 1.00EUR
FRANCE
CREDIT AGRICOLE SA PARIS 10,000 165,389 0.53EUR
GROUPE DANONE 4,700 309,226 0.98EUR
LVMH MOET HENNESSY 2,000 319,965 1.02EUR
PEUGEOT SA 4,500 179,612 0.57EUR
INVESTMENTS
Emerging WealthStatement of investments as at 31 March 2011(expressed in USD)
Description Currency Evaluation % netassets
Quantity/Facevalue
SOCIETE GENERALE PARIS -A- 6,000 393,221 1.25EUR
1,683,359 5.35
BMW-BAYERISCHEMOTOREN WERKE 4,500 378,111 1.20EUR
GERMANY
SAP AG 6,000 369,916 1.18EUR
748,027 2.38
ASTRAZENECA PLC 5,000 232,332 0.74GBP
GREAT BRITAIN
BRITISH AMERICANTOBACCO 7,500 305,178 0.97GBP
HSBC HOLDINGS PLC 50,000 519,369 1.65GBP
ICAP PLC 30,000 257,030 0.82GBP
RECKITT BENCKISER GROUPPLC 5,000 259,926 0.83GBP
ROYAL DUTCH SHELL -B- 20,000 735,933 2.33GBP
TESCO PLC 50,000 309,079 0.98GBP
2,618,847 8.32
CATHAY PACIFIC AIRWAYS 100,000 239,524 0.76HKD
HONG KONG
CHEUNG KONG HOLDINGS 25,000 407,345 1.29HKD
CHINA MOBILE LTD 70,000 644,492 2.05HKD
SUN HUNG KAI PROPERTIESLTD 20,000 316,624 1.01HKD
1,607,985 5.11
CANARA BANK /DEMAT. 20,000 280,861 0.89INR
INDIA
280,861 0.89
KERRY GROUP A 5,000 187,512 0.60EUR
IRELAND
187,512 0.60
TEVA PHARMACEUTICALINDUSTR. 2,500 125,503 0.40ILS
ISRAEL
125,503 0.40
ENI SPA ROMA 10,000 247,834 0.79EUR
ITALY
247,834 0.79
DAIHATSU MOTOR CO. 10,000 146,333 0.46JPY
JAPAN
Description Currency Evaluation % netassets
Quantity/Facevalue
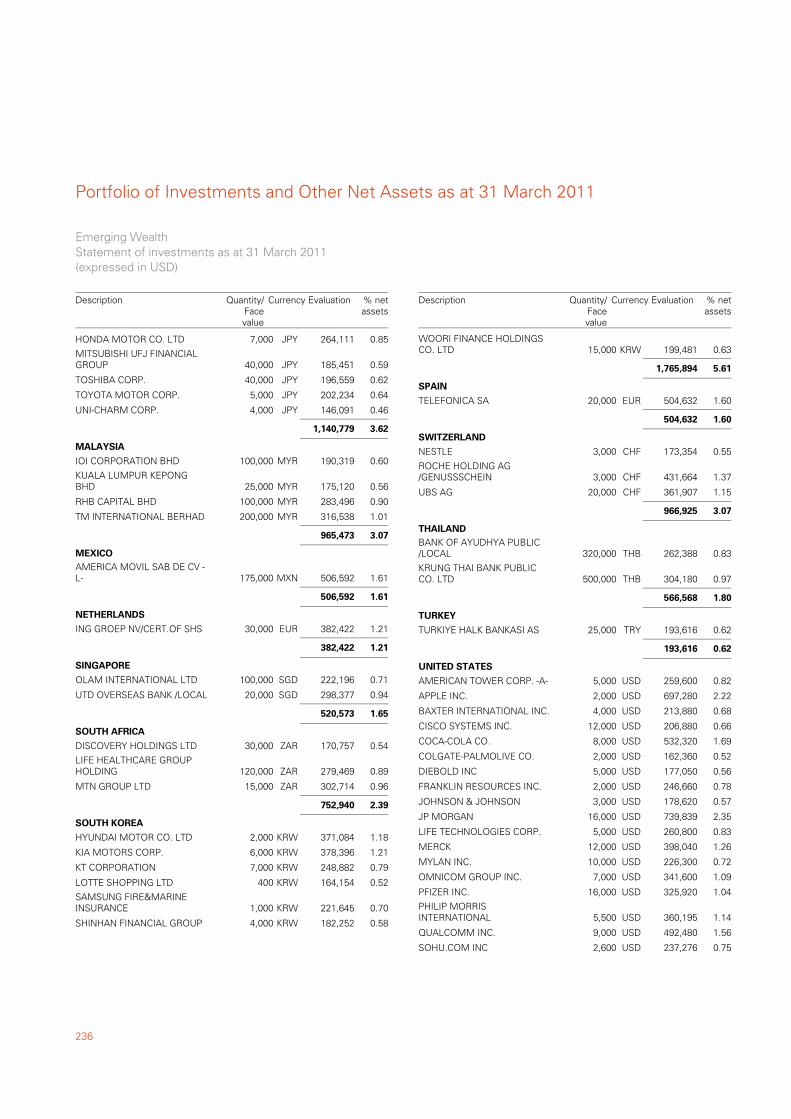
Portfolio of Investments and Other Net Assets as at 31 March 2011
236
HONDA MOTOR CO. LTD 7,000 264,111 0.85JPY
MITSUBISHI UFJ FINANCIALGROUP 40,000 185,451 0.59JPY
TOSHIBA CORP. 40,000 196,559 0.62JPY
TOYOTA MOTOR CORP. 5,000 202,234 0.64JPY
UNI-CHARM CORP. 4,000 146,091 0.46JPY
1,140,779 3.62
IOI CORPORATION BHD 100,000 190,319 0.60MYR
MALAYSIA
KUALA LUMPUR KEPONGBHD 25,000 175,120 0.56MYR
RHB CAPITAL BHD 100,000 283,496 0.90MYR
TM INTERNATIONAL BERHAD 200,000 316,538 1.01MYR
965,473 3.07
AMERICA MOVIL SAB DE CV -L- 175,000 506,592 1.61MXN
MEXICO
506,592 1.61
ING GROEP NV/CERT.OF SHS 30,000 382,422 1.21EUR
NETHERLANDS
382,422 1.21
OLAM INTERNATIONAL LTD 100,000 222,196 0.71SGD
SINGAPORE
UTD OVERSEAS BANK /LOCAL 20,000 298,377 0.94SGD
520,573 1.65
DISCOVERY HOLDINGS LTD 30,000 170,757 0.54ZAR
SOUTH AFRICA
LIFE HEALTHCARE GROUPHOLDING 120,000 279,469 0.89ZAR
MTN GROUP LTD 15,000 302,714 0.96ZAR
752,940 2.39
HYUNDAI MOTOR CO. LTD 2,000 371,084 1.18KRW
SOUTH KOREA
KIA MOTORS CORP. 6,000 378,396 1.21KRW
KT CORPORATION 7,000 248,882 0.79KRW
LOTTE SHOPPING LTD 400 164,154 0.52KRW
SAMSUNG FIRE&MARINEINSURANCE 1,000 221,645 0.70KRW
SHINHAN FINANCIAL GROUP 4,000 182,252 0.58KRW
Emerging WealthStatement of investments as at 31 March 2011(expressed in USD)
Description Currency Evaluation % netassets
Quantity/Facevalue
WOORI FINANCE HOLDINGSCO. LTD 15,000 199,481 0.63KRW
1,765,894 5.61
TELEFONICA SA 20,000 504,632 1.60EUR
SPAIN
504,632 1.60
NESTLE 3,000 173,354 0.55CHF
SWITZERLAND
ROCHE HOLDING AG/GENUSSSCHEIN 3,000 431,664 1.37CHF
UBS AG 20,000 361,907 1.15CHF
966,925 3.07
BANK OF AYUDHYA PUBLIC/LOCAL 320,000 262,388 0.83THB
THAILAND
KRUNG THAI BANK PUBLICCO. LTD 500,000 304,180 0.97THB
566,568 1.80
TURKIYE HALK BANKASI AS 25,000 193,616 0.62TRY
TURKEY
193,616 0.62
AMERICAN TOWER CORP. -A- 5,000 259,600 0.82USD
UNITED STATES
APPLE INC. 2,000 697,280 2.22USD
BAXTER INTERNATIONAL INC. 4,000 213,880 0.68USD
CISCO SYSTEMS INC. 12,000 206,880 0.66USD
COCA-COLA CO. 8,000 532,320 1.69USD
COLGATE-PALMOLIVE CO. 2,000 162,360 0.52USD
DIEBOLD INC 5,000 177,050 0.56USD
FRANKLIN RESOURCES INC. 2,000 246,660 0.78USD
JOHNSON & JOHNSON 3,000 178,620 0.57USD
JP MORGAN 16,000 739,839 2.35USD
LIFE TECHNOLOGIES CORP. 5,000 260,800 0.83USD
MERCK 12,000 398,040 1.26USD
MYLAN INC. 10,000 226,300 0.72USD
OMNICOM GROUP INC. 7,000 341,600 1.09USD
PFIZER INC. 16,000 325,920 1.04USD
PHILIP MORRISINTERNATIONAL 5,500 360,195 1.14USD
QUALCOMM INC. 9,000 492,480 1.56USD
SOHU.COM INC 2,600 237,276 0.75USD
Description Currency Evaluation % netassets
Quantity/Facevalue
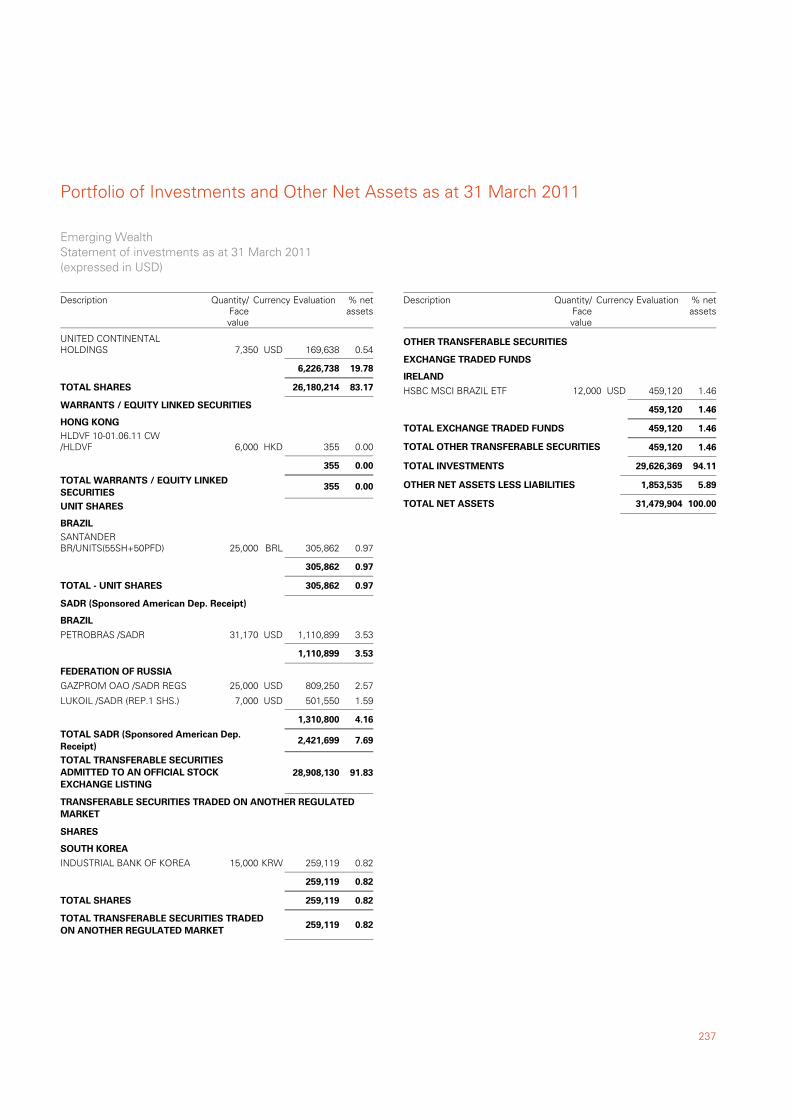
237
Portfolio of Investments and Other Net Assets as at 31 March 2011
UNITED CONTINENTALHOLDINGS 7,350 169,638 0.54USD
6,226,738 19.78
83.1726,180,214TOTAL SHARES
HLDVF 10-01.06.11 CW/HLDVF 6,000 355 0.00HKD
WARRANTS / EQUITY LINKED SECURITIES
HONG KONG
355 0.00
0.00355TOTAL WARRANTS / EQUITY LINKEDSECURITIES
SANTANDERBR/UNITS(55SH+50PFD) 25,000 305,862 0.97BRL
UNIT SHARES
BRAZIL
305,862 0.97
0.97305,862TOTAL - UNIT SHARES
PETROBRAS /SADR 31,170 1,110,899 3.53USD
SADR (Sponsored American Dep. Receipt)
BRAZIL
1,110,899 3.53
GAZPROM OAO /SADR REGS 25,000 809,250 2.57USD
FEDERATION OF RUSSIA
LUKOIL /SADR (REP.1 SHS.) 7,000 501,550 1.59USD
1,310,800 4.16
7.692,421,699TOTAL SADR (Sponsored American Dep.Receipt)
91.83TOTAL TRANSFERABLE SECURITIESADMITTED TO AN OFFICIAL STOCKEXCHANGE LISTING
28,908,130
INDUSTRIAL BANK OF KOREA 15,000 259,119 0.82KRW
TRANSFERABLE SECURITIES TRADED ON ANOTHER REGULATEDMARKET
SHARES
SOUTH KOREA
259,119 0.82
0.82259,119TOTAL SHARES
0.82TOTAL TRANSFERABLE SECURITIES TRADEDON ANOTHER REGULATED MARKET
259,119
Emerging WealthStatement of investments as at 31 March 2011(expressed in USD)
Description Currency Evaluation % netassets
Quantity/Facevalue
HSBC MSCI BRAZIL ETF 12,000 459,120 1.46USD
OTHER TRANSFERABLE SECURITIES
EXCHANGE TRADED FUNDS
IRELAND
459,120 1.46
1.46459,120TOTAL EXCHANGE TRADED FUNDS
1.46TOTAL OTHER TRANSFERABLE SECURITIES 459,120
94.11TOTAL INVESTMENTS 29,626,369
5.89OTHER NET ASSETS LESS LIABILITIES 1,853,535
100.00TOTAL NET ASSETS 31,479,904
Description Currency Evaluation % netassets
Quantity/Facevalue
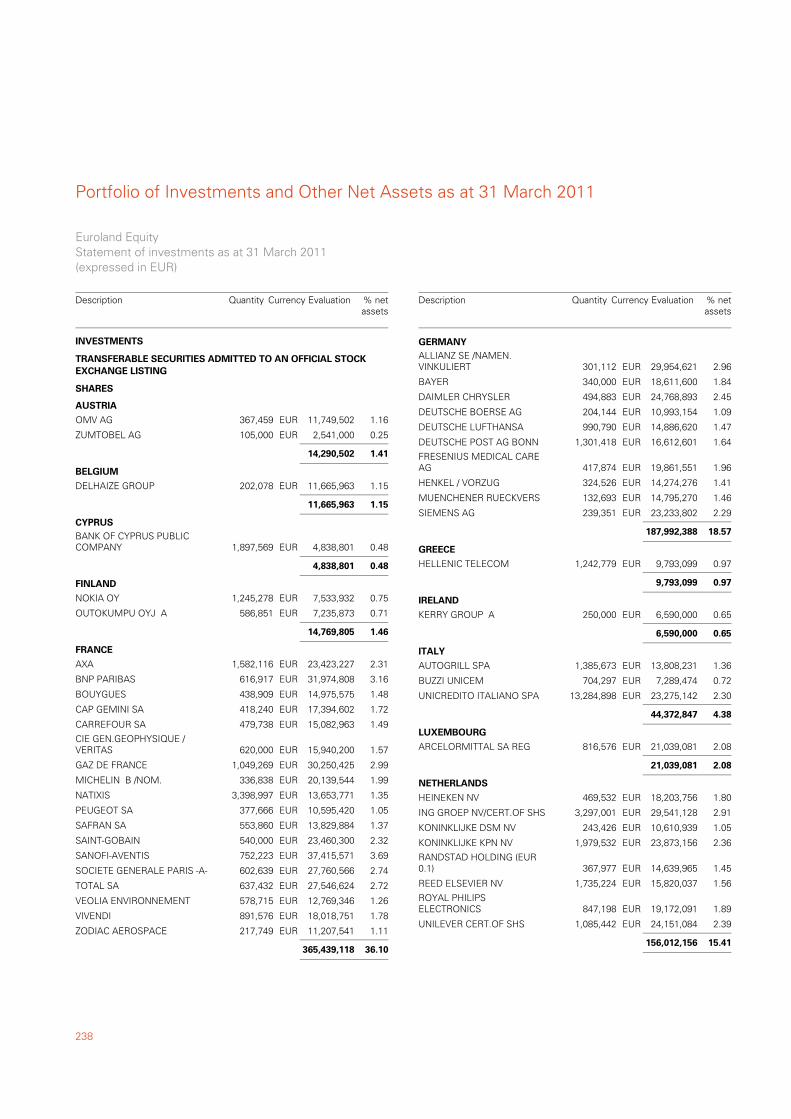
Portfolio of Investments and Other Net Assets as at 31 March 2011
238
OMV AG 367,459 11,749,502 1.16EUR
TRANSFERABLE SECURITIES ADMITTED TO AN OFFICIAL STOCKEXCHANGE LISTING
SHARES
AUSTRIA
ZUMTOBEL AG 105,000 2,541,000 0.25EUR
14,290,502 1.41
DELHAIZE GROUP 202,078 11,665,963 1.15EUR
BELGIUM
11,665,963 1.15
BANK OF CYPRUS PUBLICCOMPANY 1,897,569 4,838,801 0.48EUR
CYPRUS
4,838,801 0.48
NOKIA OY 1,245,278 7,533,932 0.75EUR
FINLAND
OUTOKUMPU OYJ A 586,851 7,235,873 0.71EUR
14,769,805 1.46
AXA 1,582,116 23,423,227 2.31EUR
FRANCE
BNP PARIBAS 616,917 31,974,808 3.16EUR
BOUYGUES 438,909 14,975,575 1.48EUR
CAP GEMINI SA 418,240 17,394,602 1.72EUR
CARREFOUR SA 479,738 15,082,963 1.49EUR
CIE GEN.GEOPHYSIQUE /VERITAS 620,000 15,940,200 1.57EUR
GAZ DE FRANCE 1,049,269 30,250,425 2.99EUR
MICHELIN B /NOM. 336,838 20,139,544 1.99EUR
NATIXIS 3,398,997 13,653,771 1.35EUR
PEUGEOT SA 377,666 10,595,420 1.05EUR
SAFRAN SA 553,860 13,829,884 1.37EUR
SAINT-GOBAIN 540,000 23,460,300 2.32EUR
SANOFI-AVENTIS 752,223 37,415,571 3.69EUR
SOCIETE GENERALE PARIS -A- 602,639 27,760,566 2.74EUR
TOTAL SA 637,432 27,546,624 2.72EUR
VEOLIA ENVIRONNEMENT 578,715 12,769,346 1.26EUR
VIVENDI 891,576 18,018,751 1.78EUR
ZODIAC AEROSPACE 217,749 11,207,541 1.11EUR
365,439,118 36.10
INVESTMENTS
Euroland EquityStatement of investments as at 31 March 2011(expressed in EUR)
Description Quantity Currency Evaluation % netassets
ALLIANZ SE /NAMEN.VINKULIERT 301,112 29,954,621 2.96EUR
GERMANY
BAYER 340,000 18,611,600 1.84EUR
DAIMLER CHRYSLER 494,883 24,768,893 2.45EUR
DEUTSCHE BOERSE AG 204,144 10,993,154 1.09EUR
DEUTSCHE LUFTHANSA 990,790 14,886,620 1.47EUR
DEUTSCHE POST AG BONN 1,301,418 16,612,601 1.64EUR
FRESENIUS MEDICAL CAREAG 417,874 19,861,551 1.96EUR
HENKEL / VORZUG 324,526 14,274,276 1.41EUR
MUENCHENER RUECKVERS 132,693 14,795,270 1.46EUR
SIEMENS AG 239,351 23,233,802 2.29EUR
187,992,388 18.57
HELLENIC TELECOM 1,242,779 9,793,099 0.97EUR
GREECE
9,793,099 0.97
KERRY GROUP A 250,000 6,590,000 0.65EUR
IRELAND
6,590,000 0.65
AUTOGRILL SPA 1,385,673 13,808,231 1.36EUR
ITALY
BUZZI UNICEM 704,297 7,289,474 0.72EUR
UNICREDITO ITALIANO SPA 13,284,898 23,275,142 2.30EUR
44,372,847 4.38
ARCELORMITTAL SA REG 816,576 21,039,081 2.08EUR
LUXEMBOURG
21,039,081 2.08
HEINEKEN NV 469,532 18,203,756 1.80EUR
NETHERLANDS
ING GROEP NV/CERT.OF SHS 3,297,001 29,541,128 2.91EUR
KONINKLIJKE DSM NV 243,426 10,610,939 1.05EUR
KONINKLIJKE KPN NV 1,979,532 23,873,156 2.36EUR
RANDSTAD HOLDING (EUR0.1) 367,977 14,639,965 1.45EUR
REED ELSEVIER NV 1,735,224 15,820,037 1.56EUR
ROYAL PHILIPSELECTRONICS 847,198 19,172,091 1.89EUR
UNILEVER CERT.OF SHS 1,085,442 24,151,084 2.39EUR
156,012,156 15.41
Description Quantity Currency Evaluation % netassets
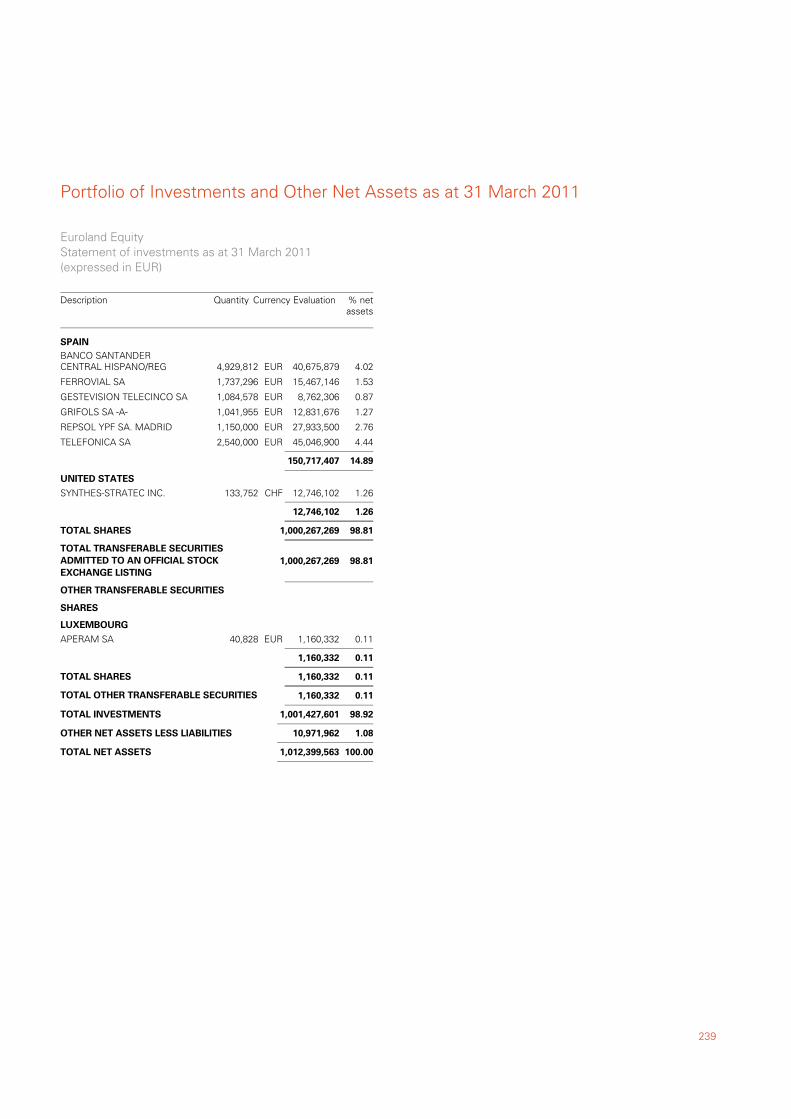
239
Portfolio of Investments and Other Net Assets as at 31 March 2011
BANCO SANTANDERCENTRAL HISPANO/REG 4,929,812 40,675,879 4.02EUR
SPAIN
FERROVIAL SA 1,737,296 15,467,146 1.53EUR
GESTEVISION TELECINCO SA 1,084,578 8,762,306 0.87EUR
GRIFOLS SA -A- 1,041,955 12,831,676 1.27EUR
REPSOL YPF SA. MADRID 1,150,000 27,933,500 2.76EUR
TELEFONICA SA 2,540,000 45,046,900 4.44EUR
150,717,407 14.89
SYNTHES-STRATEC INC. 133,752 12,746,102 1.26CHF
UNITED STATES
12,746,102 1.26
98.811,000,267,269TOTAL SHARES
98.81TOTAL TRANSFERABLE SECURITIESADMITTED TO AN OFFICIAL STOCKEXCHANGE LISTING
1,000,267,269
APERAM SA 40,828 1,160,332 0.11EUR
OTHER TRANSFERABLE SECURITIES
SHARES
LUXEMBOURG
1,160,332 0.11
0.111,160,332TOTAL SHARES
0.11TOTAL OTHER TRANSFERABLE SECURITIES 1,160,332
98.92TOTAL INVESTMENTS 1,001,427,601
1.08OTHER NET ASSETS LESS LIABILITIES 10,971,962
100.00TOTAL NET ASSETS 1,012,399,563
Euroland EquityStatement of investments as at 31 March 2011(expressed in EUR)
Description Quantity Currency Evaluation % netassets
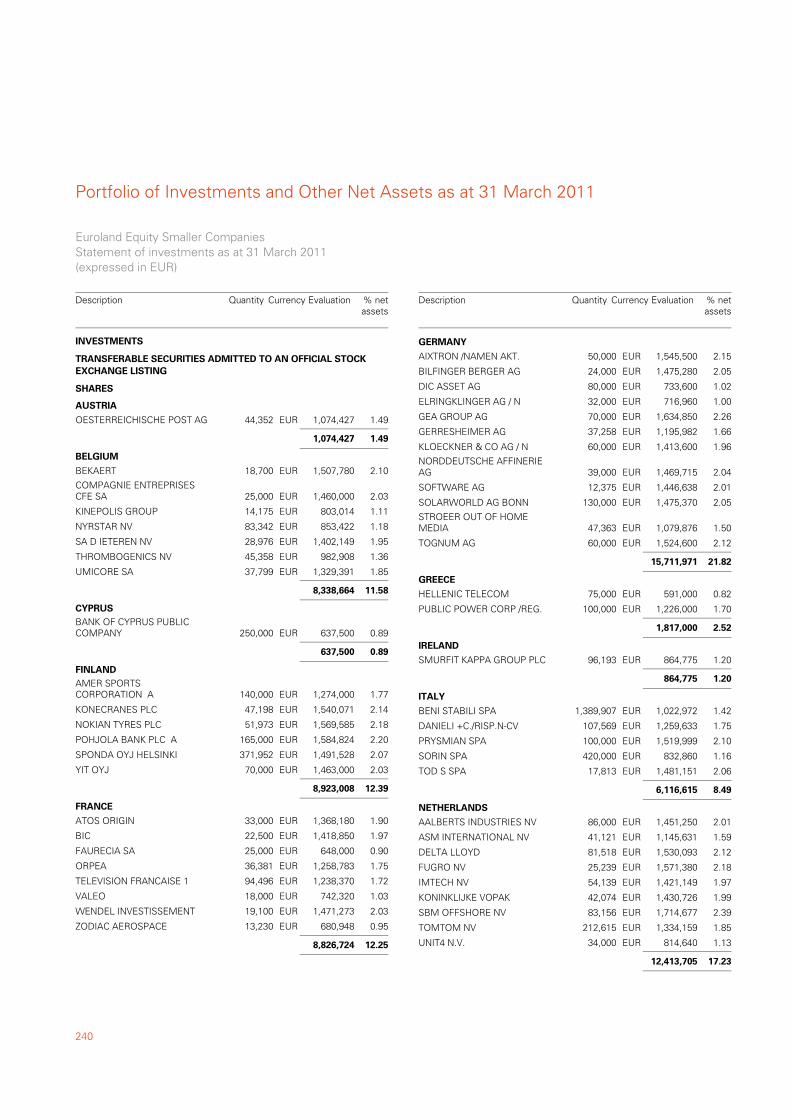
Portfolio of Investments and Other Net Assets as at 31 March 2011
240
OESTERREICHISCHE POST AG 44,352 1,074,427 1.49EUR
TRANSFERABLE SECURITIES ADMITTED TO AN OFFICIAL STOCKEXCHANGE LISTING
SHARES
AUSTRIA
1,074,427 1.49
BEKAERT 18,700 1,507,780 2.10EUR
BELGIUM
COMPAGNIE ENTREPRISESCFE SA 25,000 1,460,000 2.03EUR
KINEPOLIS GROUP 14,175 803,014 1.11EUR
NYRSTAR NV 83,342 853,422 1.18EUR
SA D IETEREN NV 28,976 1,402,149 1.95EUR
THROMBOGENICS NV 45,358 982,908 1.36EUR
UMICORE SA 37,799 1,329,391 1.85EUR
8,338,664 11.58
BANK OF CYPRUS PUBLICCOMPANY 250,000 637,500 0.89EUR
CYPRUS
637,500 0.89
AMER SPORTSCORPORATION A 140,000 1,274,000 1.77EUR
FINLAND
KONECRANES PLC 47,198 1,540,071 2.14EUR
NOKIAN TYRES PLC 51,973 1,569,585 2.18EUR
POHJOLA BANK PLC A 165,000 1,584,824 2.20EUR
SPONDA OYJ HELSINKI 371,952 1,491,528 2.07EUR
YIT OYJ 70,000 1,463,000 2.03EUR
8,923,008 12.39
ATOS ORIGIN 33,000 1,368,180 1.90EUR
FRANCE
BIC 22,500 1,418,850 1.97EUR
FAURECIA SA 25,000 648,000 0.90EUR
ORPEA 36,381 1,258,783 1.75EUR
TELEVISION FRANCAISE 1 94,496 1,238,370 1.72EUR
VALEO 18,000 742,320 1.03EUR
WENDEL INVESTISSEMENT 19,100 1,471,273 2.03EUR
ZODIAC AEROSPACE 13,230 680,948 0.95EUR
8,826,724 12.25
INVESTMENTS
Euroland Equity Smaller CompaniesStatement of investments as at 31 March 2011(expressed in EUR)
Description Quantity Currency Evaluation % netassets
AIXTRON /NAMEN AKT. 50,000 1,545,500 2.15EUR
GERMANY
BILFINGER BERGER AG 24,000 1,475,280 2.05EUR
DIC ASSET AG 80,000 733,600 1.02EUR
ELRINGKLINGER AG / N 32,000 716,960 1.00EUR
GEA GROUP AG 70,000 1,634,850 2.26EUR
GERRESHEIMER AG 37,258 1,195,982 1.66EUR
KLOECKNER & CO AG / N 60,000 1,413,600 1.96EUR
NORDDEUTSCHE AFFINERIEAG 39,000 1,469,715 2.04EUR
SOFTWARE AG 12,375 1,446,638 2.01EUR
SOLARWORLD AG BONN 130,000 1,475,370 2.05EUR
STROEER OUT OF HOMEMEDIA 47,363 1,079,876 1.50EUR
TOGNUM AG 60,000 1,524,600 2.12EUR
15,711,971 21.82
HELLENIC TELECOM 75,000 591,000 0.82EUR
GREECE
PUBLIC POWER CORP /REG. 100,000 1,226,000 1.70EUR
1,817,000 2.52
SMURFIT KAPPA GROUP PLC 96,193 864,775 1.20EUR
IRELAND
864,775 1.20
BENI STABILI SPA 1,389,907 1,022,972 1.42EUR
ITALY
DANIELI +C./RISP.N-CV 107,569 1,259,633 1.75EUR
PRYSMIAN SPA 100,000 1,519,999 2.10EUR
SORIN SPA 420,000 832,860 1.16EUR
TOD S SPA 17,813 1,481,151 2.06EUR
6,116,615 8.49
AALBERTS INDUSTRIES NV 86,000 1,451,250 2.01EUR
NETHERLANDS
ASM INTERNATIONAL NV 41,121 1,145,631 1.59EUR
DELTA LLOYD 81,518 1,530,093 2.12EUR
FUGRO NV 25,239 1,571,380 2.18EUR
IMTECH NV 54,139 1,421,149 1.97EUR
KONINKLIJKE VOPAK 42,074 1,430,726 1.99EUR
SBM OFFSHORE NV 83,156 1,714,677 2.39EUR
TOMTOM NV 212,615 1,334,159 1.85EUR
UNIT4 N.V. 34,000 814,640 1.13EUR
12,413,705 17.23
Description Quantity Currency Evaluation % netassets
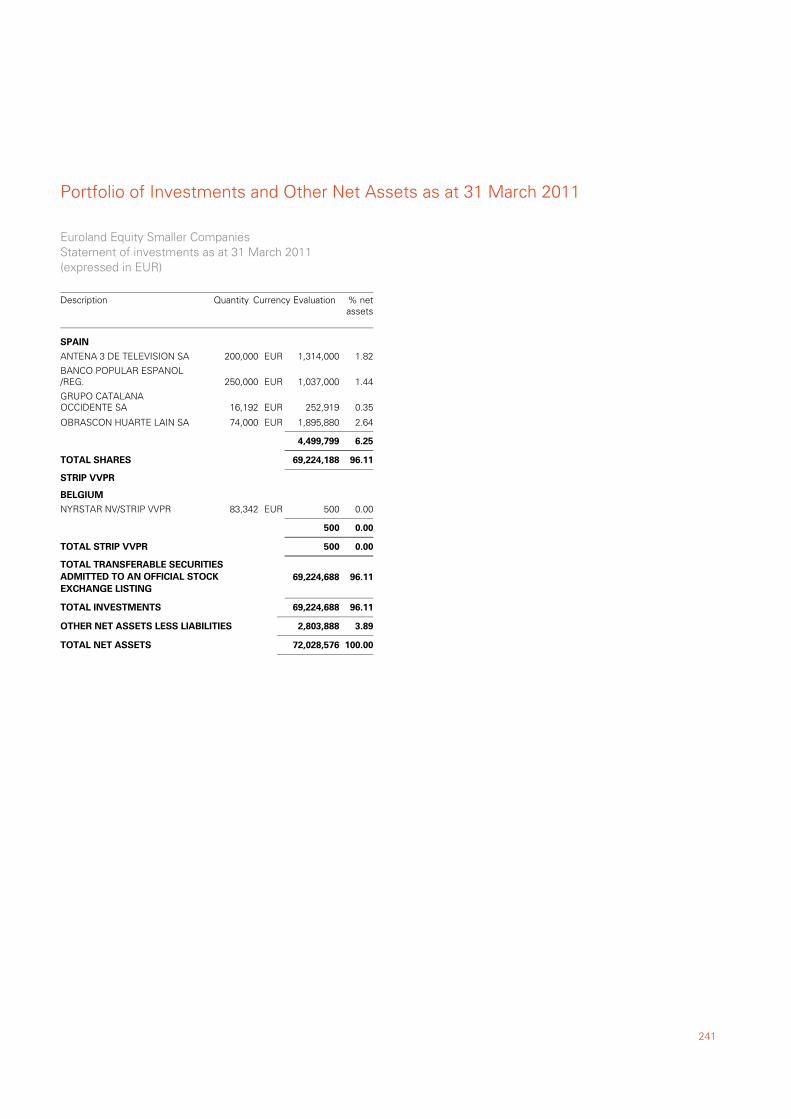
241
Portfolio of Investments and Other Net Assets as at 31 March 2011
ANTENA 3 DE TELEVISION SA 200,000 1,314,000 1.82EUR
SPAIN
BANCO POPULAR ESPANOL/REG. 250,000 1,037,000 1.44EUR
GRUPO CATALANAOCCIDENTE SA 16,192 252,919 0.35EUR
OBRASCON HUARTE LAIN SA 74,000 1,895,880 2.64EUR
4,499,799 6.25
96.1169,224,188TOTAL SHARES
NYRSTAR NV/STRIP VVPR 83,342 500 0.00EUR
STRIP VVPR
BELGIUM
500 0.00
0.00500TOTAL STRIP VVPR
96.11TOTAL TRANSFERABLE SECURITIESADMITTED TO AN OFFICIAL STOCKEXCHANGE LISTING
69,224,688
96.11TOTAL INVESTMENTS 69,224,688
3.89OTHER NET ASSETS LESS LIABILITIES 2,803,888
100.00TOTAL NET ASSETS 72,028,576
Euroland Equity Smaller CompaniesStatement of investments as at 31 March 2011(expressed in EUR)
Description Quantity Currency Evaluation % netassets
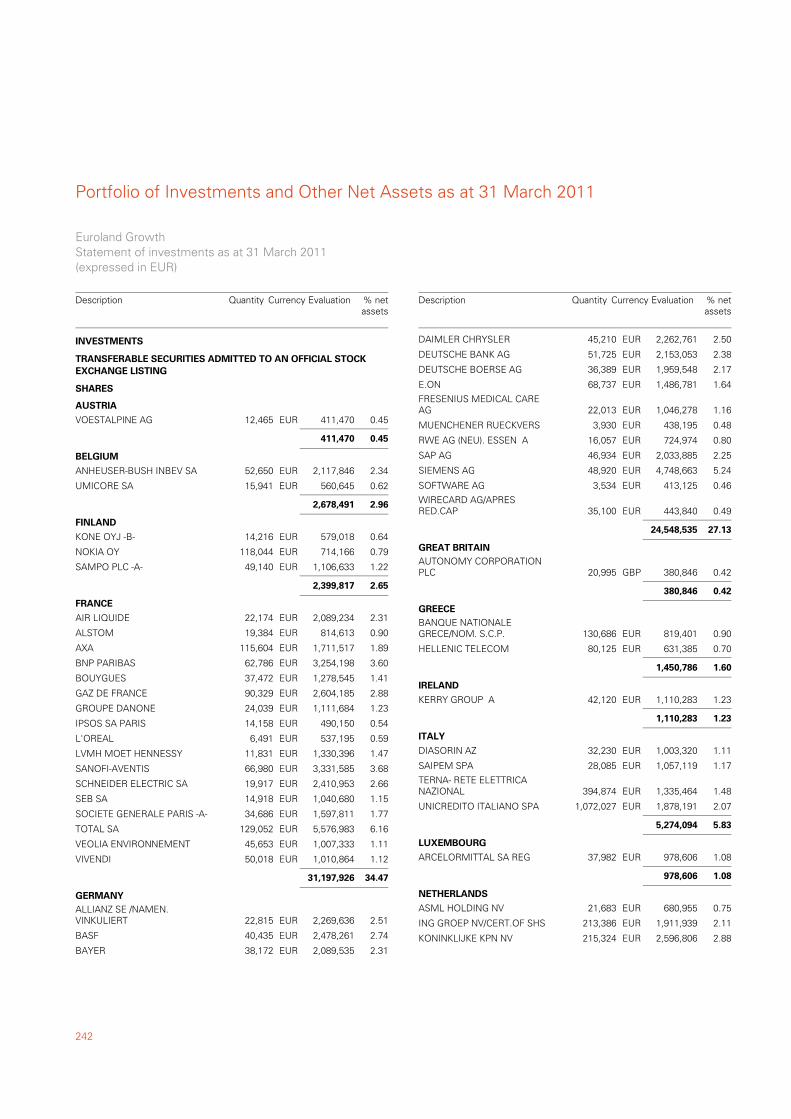
Portfolio of Investments and Other Net Assets as at 31 March 2011
242
VOESTALPINE AG 12,465 411,470 0.45EUR
TRANSFERABLE SECURITIES ADMITTED TO AN OFFICIAL STOCKEXCHANGE LISTING
SHARES
AUSTRIA
411,470 0.45
ANHEUSER-BUSH INBEV SA 52,650 2,117,846 2.34EUR
BELGIUM
UMICORE SA 15,941 560,645 0.62EUR
2,678,491 2.96
KONE OYJ -B- 14,216 579,018 0.64EUR
FINLAND
NOKIA OY 118,044 714,166 0.79EUR
SAMPO PLC -A- 49,140 1,106,633 1.22EUR
2,399,817 2.65
AIR LIQUIDE 22,174 2,089,234 2.31EUR
FRANCE
ALSTOM 19,384 814,613 0.90EUR
AXA 115,604 1,711,517 1.89EUR
BNP PARIBAS 62,786 3,254,198 3.60EUR
BOUYGUES 37,472 1,278,545 1.41EUR
GAZ DE FRANCE 90,329 2,604,185 2.88EUR
GROUPE DANONE 24,039 1,111,684 1.23EUR
IPSOS SA PARIS 14,158 490,150 0.54EUR
L'OREAL 6,491 537,195 0.59EUR
LVMH MOET HENNESSY 11,831 1,330,396 1.47EUR
SANOFI-AVENTIS 66,980 3,331,585 3.68EUR
SCHNEIDER ELECTRIC SA 19,917 2,410,953 2.66EUR
SEB SA 14,918 1,040,680 1.15EUR
SOCIETE GENERALE PARIS -A- 34,686 1,597,811 1.77EUR
TOTAL SA 129,052 5,576,983 6.16EUR
VEOLIA ENVIRONNEMENT 45,653 1,007,333 1.11EUR
VIVENDI 50,018 1,010,864 1.12EUR
31,197,926 34.47
ALLIANZ SE /NAMEN.VINKULIERT 22,815 2,269,636 2.51EUR
GERMANY
BASF 40,435 2,478,261 2.74EUR
BAYER 38,172 2,089,535 2.31EUR
INVESTMENTS
Euroland GrowthStatement of investments as at 31 March 2011(expressed in EUR)
Description Quantity Currency Evaluation % netassets
DAIMLER CHRYSLER 45,210 2,262,761 2.50EUR
DEUTSCHE BANK AG 51,725 2,153,053 2.38EUR
DEUTSCHE BOERSE AG 36,389 1,959,548 2.17EUR
E.ON 68,737 1,486,781 1.64EUR
FRESENIUS MEDICAL CAREAG 22,013 1,046,278 1.16EUR
MUENCHENER RUECKVERS 3,930 438,195 0.48EUR
RWE AG (NEU). ESSEN A 16,057 724,974 0.80EUR
SAP AG 46,934 2,033,885 2.25EUR
SIEMENS AG 48,920 4,748,663 5.24EUR
SOFTWARE AG 3,534 413,125 0.46EUR
WIRECARD AG/APRESRED.CAP 35,100 443,840 0.49EUR
24,548,535 27.13
AUTONOMY CORPORATIONPLC 20,995 380,846 0.42GBP
GREAT BRITAIN
380,846 0.42
BANQUE NATIONALEGRECE/NOM. S.C.P. 130,686 819,401 0.90EUR
GREECE
HELLENIC TELECOM 80,125 631,385 0.70EUR
1,450,786 1.60
KERRY GROUP A 42,120 1,110,283 1.23EUR
IRELAND
1,110,283 1.23
DIASORIN AZ 32,230 1,003,320 1.11EUR
ITALY
SAIPEM SPA 28,085 1,057,119 1.17EUR
TERNA- RETE ELETTRICANAZIONAL 394,874 1,335,464 1.48EUR
UNICREDITO ITALIANO SPA 1,072,027 1,878,191 2.07EUR
5,274,094 5.83
ARCELORMITTAL SA REG 37,982 978,606 1.08EUR
LUXEMBOURG
978,606 1.08
ASML HOLDING NV 21,683 680,955 0.75EUR
NETHERLANDS
ING GROEP NV/CERT.OF SHS 213,386 1,911,939 2.11EUR
KONINKLIJKE KPN NV 215,324 2,596,806 2.88EUR
Description Quantity Currency Evaluation % netassets
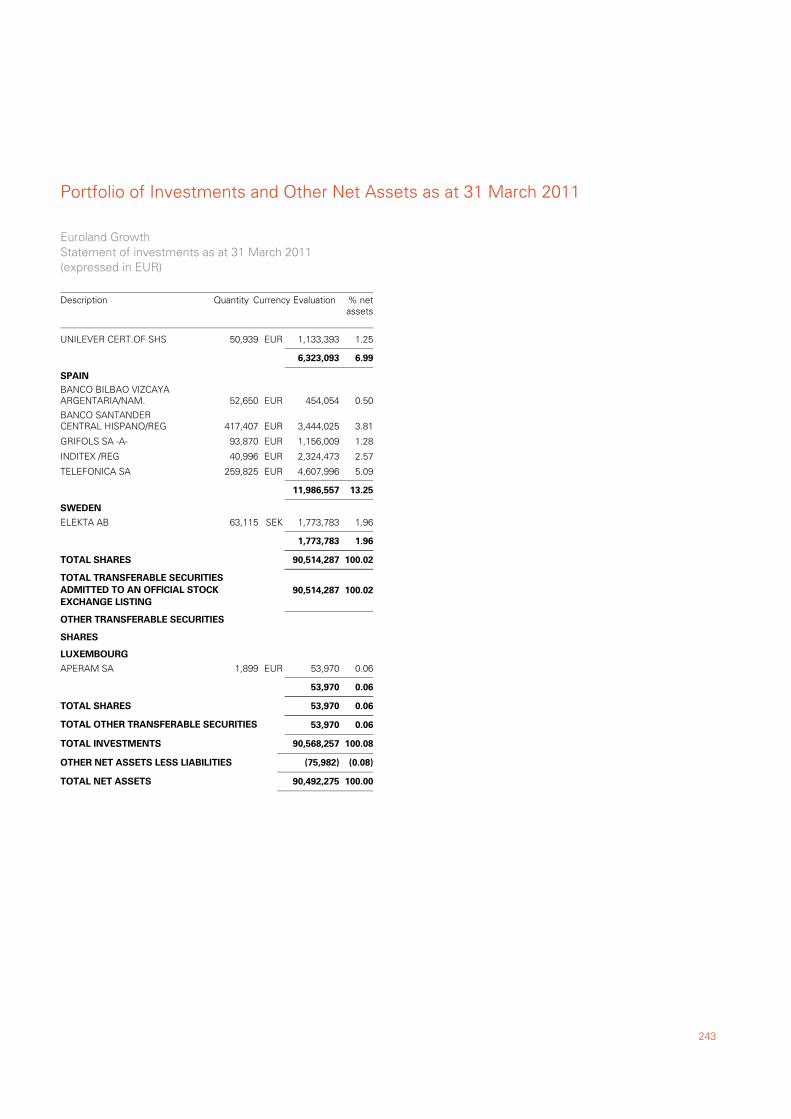
243
Portfolio of Investments and Other Net Assets as at 31 March 2011
UNILEVER CERT.OF SHS 50,939 1,133,393 1.25EUR
6,323,093 6.99
BANCO BILBAO VIZCAYAARGENTARIA/NAM. 52,650 454,054 0.50EUR
SPAIN
BANCO SANTANDERCENTRAL HISPANO/REG 417,407 3,444,025 3.81EUR
GRIFOLS SA -A- 93,870 1,156,009 1.28EUR
INDITEX /REG 40,996 2,324,473 2.57EUR
TELEFONICA SA 259,825 4,607,996 5.09EUR
11,986,557 13.25
ELEKTA AB 63,115 1,773,783 1.96SEK
SWEDEN
1,773,783 1.96
100.0290,514,287TOTAL SHARES
100.02TOTAL TRANSFERABLE SECURITIESADMITTED TO AN OFFICIAL STOCKEXCHANGE LISTING
90,514,287
APERAM SA 1,899 53,970 0.06EUR
OTHER TRANSFERABLE SECURITIES
SHARES
LUXEMBOURG
53,970 0.06
0.0653,970TOTAL SHARES
0.06TOTAL OTHER TRANSFERABLE SECURITIES 53,970
100.08TOTAL INVESTMENTS 90,568,257
(0.08)OTHER NET ASSETS LESS LIABILITIES (75,982)
100.00TOTAL NET ASSETS 90,492,275
Euroland GrowthStatement of investments as at 31 March 2011(expressed in EUR)
Description Quantity Currency Evaluation % netassets
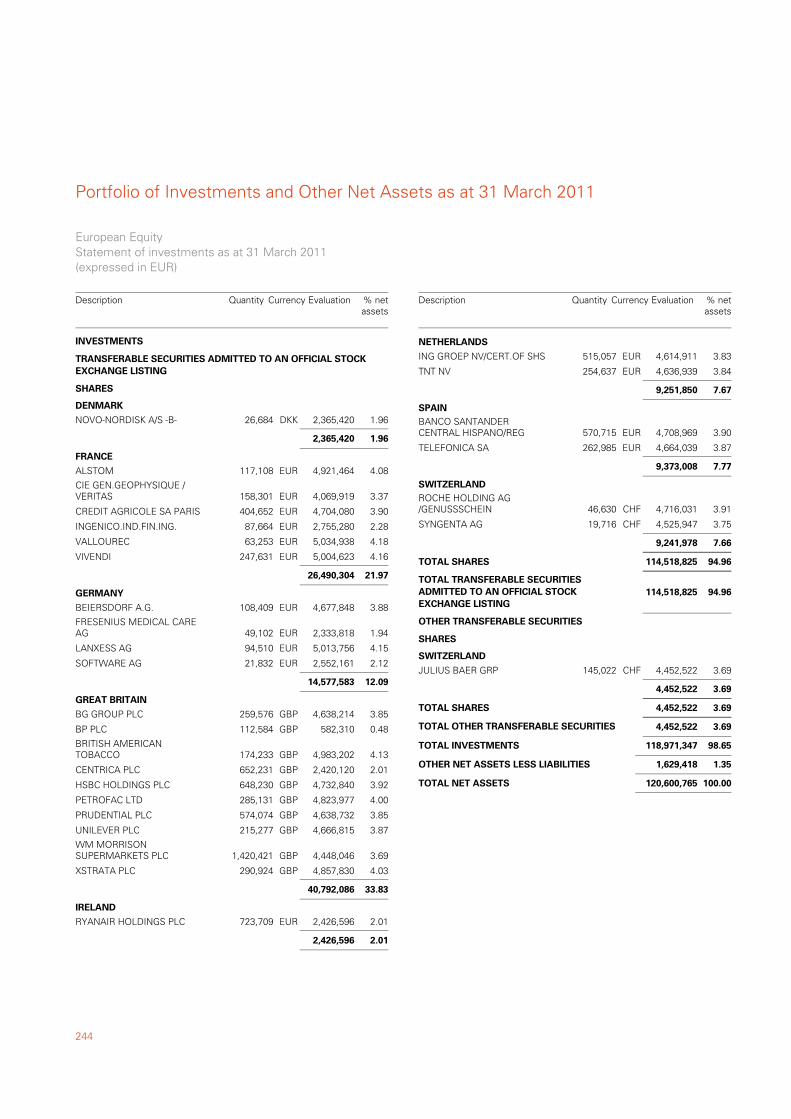
Portfolio of Investments and Other Net Assets as at 31 March 2011
244
NOVO-NORDISK A/S -B- 26,684 2,365,420 1.96DKK
TRANSFERABLE SECURITIES ADMITTED TO AN OFFICIAL STOCKEXCHANGE LISTING
SHARES
DENMARK
2,365,420 1.96
ALSTOM 117,108 4,921,464 4.08EUR
FRANCE
CIE GEN.GEOPHYSIQUE /VERITAS 158,301 4,069,919 3.37EUR
CREDIT AGRICOLE SA PARIS 404,652 4,704,080 3.90EUR
INGENICO.IND.FIN.ING. 87,664 2,755,280 2.28EUR
VALLOUREC 63,253 5,034,938 4.18EUR
VIVENDI 247,631 5,004,623 4.16EUR
26,490,304 21.97
BEIERSDORF A.G. 108,409 4,677,848 3.88EUR
GERMANY
FRESENIUS MEDICAL CAREAG 49,102 2,333,818 1.94EUR
LANXESS AG 94,510 5,013,756 4.15EUR
SOFTWARE AG 21,832 2,552,161 2.12EUR
14,577,583 12.09
BG GROUP PLC 259,576 4,638,214 3.85GBP
GREAT BRITAIN
BP PLC 112,584 582,310 0.48GBP
BRITISH AMERICANTOBACCO 174,233 4,983,202 4.13GBP
CENTRICA PLC 652,231 2,420,120 2.01GBP
HSBC HOLDINGS PLC 648,230 4,732,840 3.92GBP
PETROFAC LTD 285,131 4,823,977 4.00GBP
PRUDENTIAL PLC 574,074 4,638,732 3.85GBP
UNILEVER PLC 215,277 4,666,815 3.87GBP
WM MORRISONSUPERMARKETS PLC 1,420,421 4,448,046 3.69GBP
XSTRATA PLC 290,924 4,857,830 4.03GBP
40,792,086 33.83
RYANAIR HOLDINGS PLC 723,709 2,426,596 2.01EUR
IRELAND
2,426,596 2.01
INVESTMENTS
European EquityStatement of investments as at 31 March 2011(expressed in EUR)
Description Quantity Currency Evaluation % netassets
ING GROEP NV/CERT.OF SHS 515,057 4,614,911 3.83EUR
NETHERLANDS
TNT NV 254,637 4,636,939 3.84EUR
9,251,850 7.67
BANCO SANTANDERCENTRAL HISPANO/REG 570,715 4,708,969 3.90EUR
SPAIN
TELEFONICA SA 262,985 4,664,039 3.87EUR
9,373,008 7.77
ROCHE HOLDING AG/GENUSSSCHEIN 46,630 4,716,031 3.91CHF
SWITZERLAND
SYNGENTA AG 19,716 4,525,947 3.75CHF
9,241,978 7.66
94.96114,518,825TOTAL SHARES
94.96TOTAL TRANSFERABLE SECURITIESADMITTED TO AN OFFICIAL STOCKEXCHANGE LISTING
114,518,825
JULIUS BAER GRP 145,022 4,452,522 3.69CHF
OTHER TRANSFERABLE SECURITIES
SHARES
SWITZERLAND
4,452,522 3.69
3.694,452,522TOTAL SHARES
3.69TOTAL OTHER TRANSFERABLE SECURITIES 4,452,522
98.65TOTAL INVESTMENTS 118,971,347
1.35OTHER NET ASSETS LESS LIABILITIES 1,629,418
100.00TOTAL NET ASSETS 120,600,765
Description Quantity Currency Evaluation % netassets
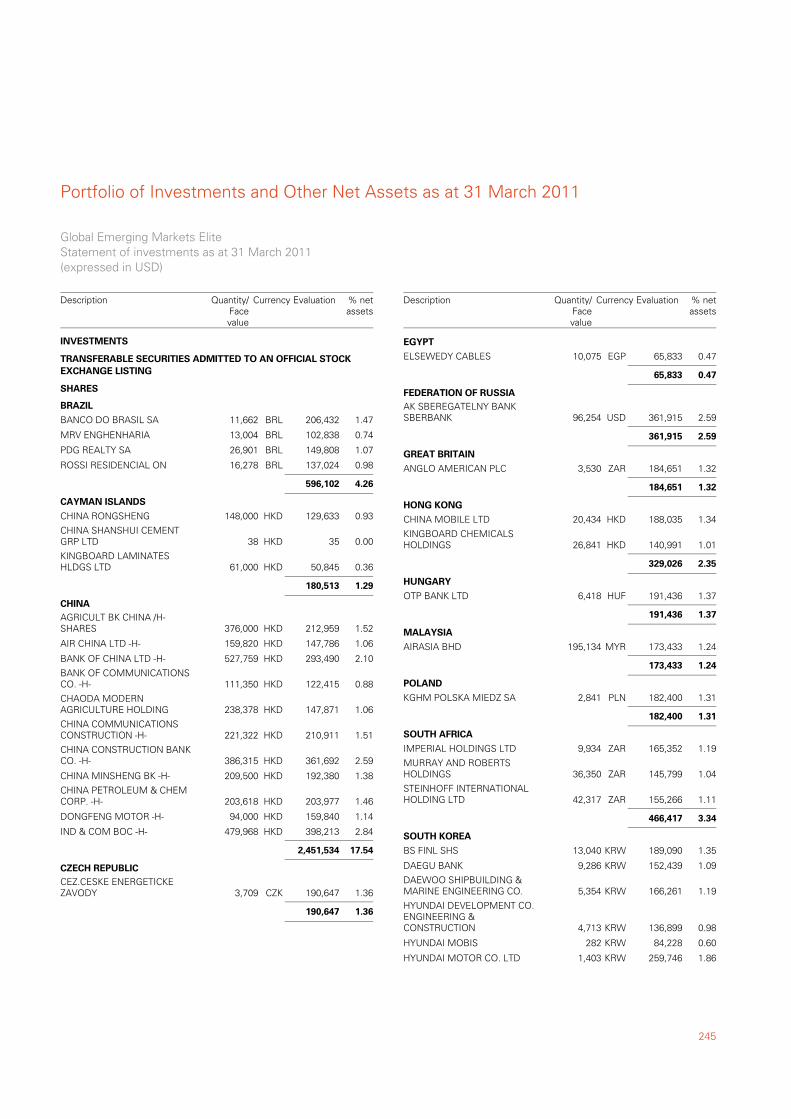
245
Portfolio of Investments and Other Net Assets as at 31 March 2011
BANCO DO BRASIL SA 11,662 206,432 1.47BRL
TRANSFERABLE SECURITIES ADMITTED TO AN OFFICIAL STOCKEXCHANGE LISTING
SHARES
BRAZIL
MRV ENGHENHARIA 13,004 102,838 0.74BRL
PDG REALTY SA 26,901 149,808 1.07BRL
ROSSI RESIDENCIAL ON 16,278 137,024 0.98BRL
596,102 4.26
CHINA RONGSHENG 148,000 129,633 0.93HKD
CAYMAN ISLANDS
CHINA SHANSHUI CEMENTGRP LTD 38 35 0.00HKD
KINGBOARD LAMINATESHLDGS LTD 61,000 50,845 0.36HKD
180,513 1.29
AGRICULT BK CHINA /H-SHARES 376,000 212,959 1.52HKD
CHINA
AIR CHINA LTD -H- 159,820 147,786 1.06HKD
BANK OF CHINA LTD -H- 527,759 293,490 2.10HKD
BANK OF COMMUNICATIONSCO. -H- 111,350 122,415 0.88HKD
CHAODA MODERNAGRICULTURE HOLDING 238,378 147,871 1.06HKD
CHINA COMMUNICATIONSCONSTRUCTION -H- 221,322 210,911 1.51HKD
CHINA CONSTRUCTION BANKCO. -H- 386,315 361,692 2.59HKD
CHINA MINSHENG BK -H- 209,500 192,380 1.38HKD
CHINA PETROLEUM & CHEMCORP. -H- 203,618 203,977 1.46HKD
DONGFENG MOTOR -H- 94,000 159,840 1.14HKD
IND & COM BOC -H- 479,968 398,213 2.84HKD
2,451,534 17.54
CEZ.CESKE ENERGETICKEZAVODY 3,709 190,647 1.36CZK
CZECH REPUBLIC
190,647 1.36
INVESTMENTS
Global Emerging Markets EliteStatement of investments as at 31 March 2011(expressed in USD)
Description Currency Evaluation % netassets
Quantity/Facevalue
ELSEWEDY CABLES 10,075 65,833 0.47EGP
EGYPT
65,833 0.47
AK SBEREGATELNY BANKSBERBANK 96,254 361,915 2.59USD
FEDERATION OF RUSSIA
361,915 2.59
ANGLO AMERICAN PLC 3,530 184,651 1.32ZAR
GREAT BRITAIN
184,651 1.32
CHINA MOBILE LTD 20,434 188,035 1.34HKD
HONG KONG
KINGBOARD CHEMICALSHOLDINGS 26,841 140,991 1.01HKD
329,026 2.35
OTP BANK LTD 6,418 191,436 1.37HUF
HUNGARY
191,436 1.37
AIRASIA BHD 195,134 173,433 1.24MYR
MALAYSIA
173,433 1.24
KGHM POLSKA MIEDZ SA 2,841 182,400 1.31PLN
POLAND
182,400 1.31
IMPERIAL HOLDINGS LTD 9,934 165,352 1.19ZAR
SOUTH AFRICA
MURRAY AND ROBERTSHOLDINGS 36,350 145,799 1.04ZAR
STEINHOFF INTERNATIONALHOLDING LTD 42,317 155,266 1.11ZAR
466,417 3.34
BS FINL SHS 13,040 189,090 1.35KRW
SOUTH KOREA
DAEGU BANK 9,286 152,439 1.09KRW
DAEWOO SHIPBUILDING &MARINE ENGINEERING CO. 5,354 166,261 1.19KRW
HYUNDAI DEVELOPMENT CO.ENGINEERING &CONSTRUCTION 4,713 136,899 0.98KRW
HYUNDAI MOBIS 282 84,228 0.60KRW
HYUNDAI MOTOR CO. LTD 1,403 259,746 1.86KRW
Description Currency Evaluation % netassets
Quantity/Facevalue
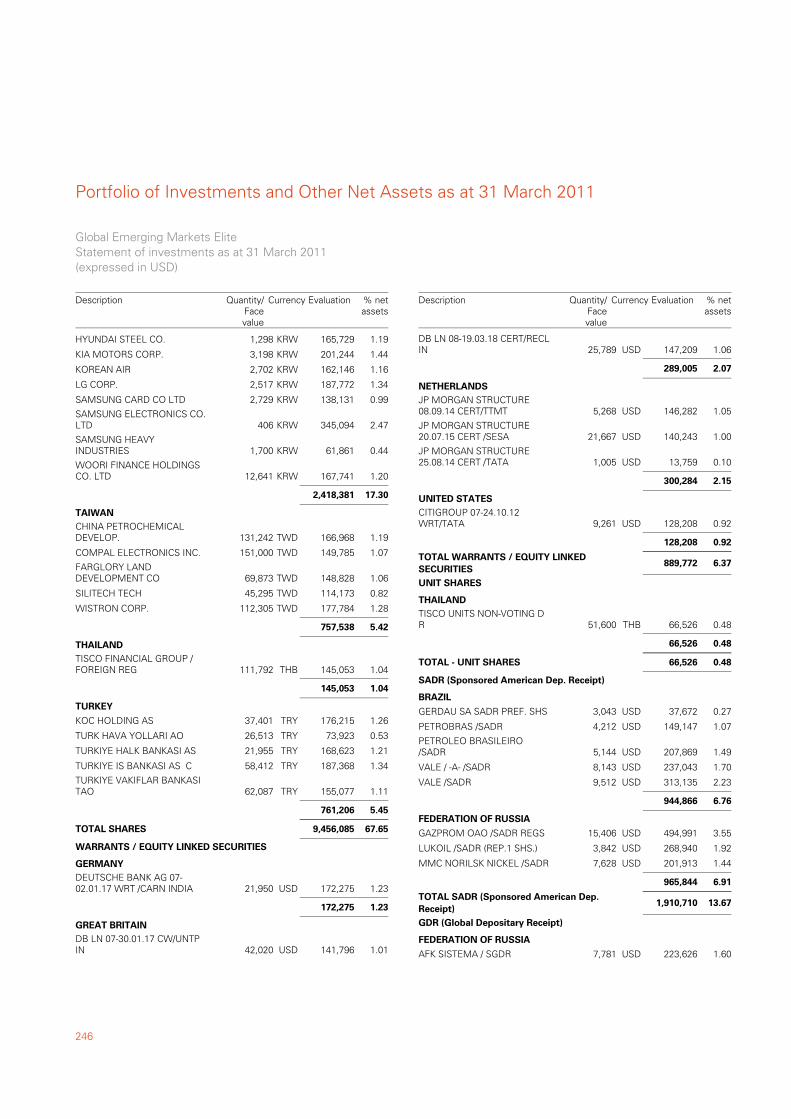
Portfolio of Investments and Other Net Assets as at 31 March 2011
246
HYUNDAI STEEL CO. 1,298 165,729 1.19KRW
KIA MOTORS CORP. 3,198 201,244 1.44KRW
KOREAN AIR 2,702 162,146 1.16KRW
LG CORP. 2,517 187,772 1.34KRW
SAMSUNG CARD CO LTD 2,729 138,131 0.99KRW
SAMSUNG ELECTRONICS CO.LTD 406 345,094 2.47KRW
SAMSUNG HEAVYINDUSTRIES 1,700 61,861 0.44KRW
WOORI FINANCE HOLDINGSCO. LTD 12,641 167,741 1.20KRW
2,418,381 17.30
CHINA PETROCHEMICALDEVELOP. 131,242 166,968 1.19TWD
TAIWAN
COMPAL ELECTRONICS INC. 151,000 149,785 1.07TWD
FARGLORY LANDDEVELOPMENT CO 69,873 148,828 1.06TWD
SILITECH TECH 45,295 114,173 0.82TWD
WISTRON CORP. 112,305 177,784 1.28TWD
757,538 5.42
TISCO FINANCIAL GROUP /FOREIGN REG 111,792 145,053 1.04THB
THAILAND
145,053 1.04
KOC HOLDING AS 37,401 176,215 1.26TRY
TURKEY
TURK HAVA YOLLARI AO 26,513 73,923 0.53TRY
TURKIYE HALK BANKASI AS 21,955 168,623 1.21TRY
TURKIYE IS BANKASI AS C 58,412 187,368 1.34TRY
TURKIYE VAKIFLAR BANKASITAO 62,087 155,077 1.11TRY
761,206 5.45
67.659,456,085TOTAL SHARES
DEUTSCHE BANK AG 07-02.01.17 WRT /CARN INDIA 21,950 172,275 1.23USD
WARRANTS / EQUITY LINKED SECURITIES
GERMANY
172,275 1.23
DB LN 07-30.01.17 CW/UNTPIN 42,020 141,796 1.01USD
GREAT BRITAIN
Global Emerging Markets EliteStatement of investments as at 31 March 2011(expressed in USD)
Description Currency Evaluation % netassets
Quantity/Facevalue
DB LN 08-19.03.18 CERT/RECLIN 25,789 147,209 1.06USD
289,005 2.07
JP MORGAN STRUCTURE08.09.14 CERT/TTMT 5,268 146,282 1.05USD
NETHERLANDS
JP MORGAN STRUCTURE20.07.15 CERT /SESA 21,667 140,243 1.00USD
JP MORGAN STRUCTURE25.08.14 CERT /TATA 1,005 13,759 0.10USD
300,284 2.15
CITIGROUP 07-24.10.12WRT/TATA 9,261 128,208 0.92USD
UNITED STATES
128,208 0.92
6.37889,772TOTAL WARRANTS / EQUITY LINKEDSECURITIES
TISCO UNITS NON-VOTING DR 51,600 66,526 0.48THB
UNIT SHARES
THAILAND
66,526 0.48
0.4866,526TOTAL - UNIT SHARES
GERDAU SA SADR PREF. SHS 3,043 37,672 0.27USD
SADR (Sponsored American Dep. Receipt)
BRAZIL
PETROBRAS /SADR 4,212 149,147 1.07USD
PETROLEO BRASILEIRO/SADR 5,144 207,869 1.49USD
VALE / -A- /SADR 8,143 237,043 1.70USD
VALE /SADR 9,512 313,135 2.23USD
944,866 6.76
GAZPROM OAO /SADR REGS 15,406 494,991 3.55USD
FEDERATION OF RUSSIA
LUKOIL /SADR (REP.1 SHS.) 3,842 268,940 1.92USD
MMC NORILSK NICKEL /SADR 7,628 201,913 1.44USD
965,844 6.91
13.671,910,710TOTAL SADR (Sponsored American Dep.Receipt)
AFK SISTEMA / SGDR 7,781 223,626 1.60USD
GDR (Global Depositary Receipt)
FEDERATION OF RUSSIA
Description Currency Evaluation % netassets
Quantity/Facevalue
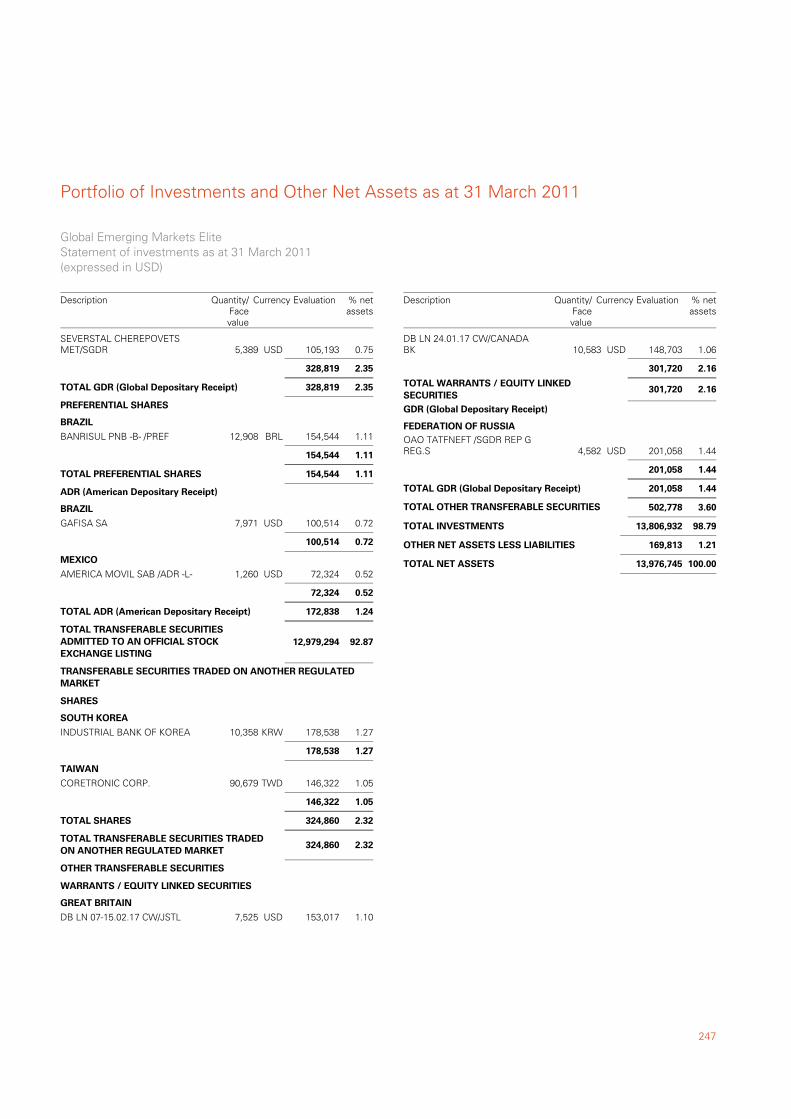
247
Portfolio of Investments and Other Net Assets as at 31 March 2011
SEVERSTAL CHEREPOVETSMET/SGDR 5,389 105,193 0.75USD
328,819 2.35
2.35328,819TOTAL GDR (Global Depositary Receipt)
BANRISUL PNB -B- /PREF 12,908 154,544 1.11BRL
PREFERENTIAL SHARES
BRAZIL
154,544 1.11
1.11154,544TOTAL PREFERENTIAL SHARES
GAFISA SA 7,971 100,514 0.72USD
ADR (American Depositary Receipt)
BRAZIL
100,514 0.72
AMERICA MOVIL SAB /ADR -L- 1,260 72,324 0.52USD
MEXICO
72,324 0.52
1.24172,838TOTAL ADR (American Depositary Receipt)
92.87TOTAL TRANSFERABLE SECURITIESADMITTED TO AN OFFICIAL STOCKEXCHANGE LISTING
12,979,294
INDUSTRIAL BANK OF KOREA 10,358 178,538 1.27KRW
TRANSFERABLE SECURITIES TRADED ON ANOTHER REGULATEDMARKET
SHARES
SOUTH KOREA
178,538 1.27
CORETRONIC CORP. 90,679 146,322 1.05TWD
TAIWAN
146,322 1.05
2.32324,860TOTAL SHARES
2.32TOTAL TRANSFERABLE SECURITIES TRADEDON ANOTHER REGULATED MARKET
324,860
DB LN 07-15.02.17 CW/JSTL 7,525 153,017 1.10USD
OTHER TRANSFERABLE SECURITIES
WARRANTS / EQUITY LINKED SECURITIES
GREAT BRITAIN
Global Emerging Markets EliteStatement of investments as at 31 March 2011(expressed in USD)
Description Currency Evaluation % netassets
Quantity/Facevalue
DB LN 24.01.17 CW/CANADABK 10,583 148,703 1.06USD
301,720 2.16
2.16301,720TOTAL WARRANTS / EQUITY LINKEDSECURITIES
OAO TATFNEFT /SGDR REP GREG.S 4,582 201,058 1.44USD
GDR (Global Depositary Receipt)
FEDERATION OF RUSSIA
201,058 1.44
1.44201,058TOTAL GDR (Global Depositary Receipt)
3.60TOTAL OTHER TRANSFERABLE SECURITIES 502,778
98.79TOTAL INVESTMENTS 13,806,932
1.21OTHER NET ASSETS LESS LIABILITIES 169,813
100.00TOTAL NET ASSETS 13,976,745
Description Currency Evaluation % netassets
Quantity/Facevalue
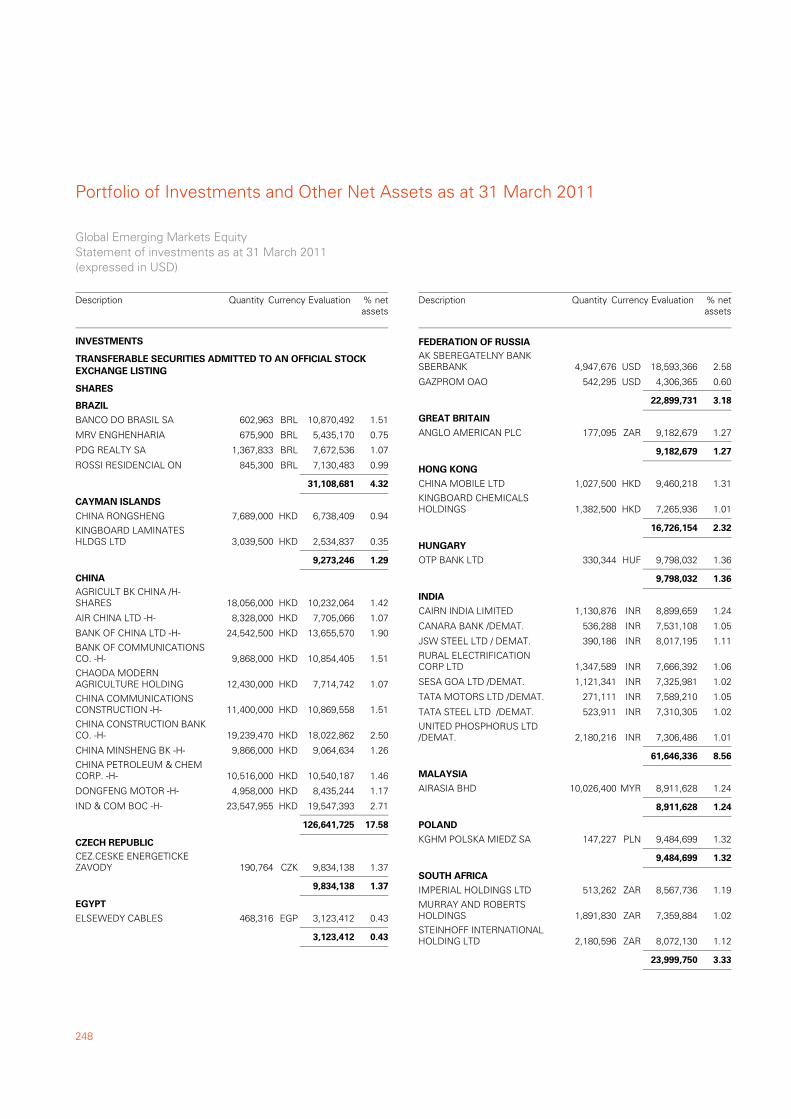
Portfolio of Investments and Other Net Assets as at 31 March 2011
248
BANCO DO BRASIL SA 602,963 10,870,492 1.51BRL
TRANSFERABLE SECURITIES ADMITTED TO AN OFFICIAL STOCKEXCHANGE LISTING
SHARES
BRAZIL
MRV ENGHENHARIA 675,900 5,435,170 0.75BRL
PDG REALTY SA 1,367,833 7,672,536 1.07BRL
ROSSI RESIDENCIAL ON 845,300 7,130,483 0.99BRL
31,108,681 4.32
CHINA RONGSHENG 7,689,000 6,738,409 0.94HKD
CAYMAN ISLANDS
KINGBOARD LAMINATESHLDGS LTD 3,039,500 2,534,837 0.35HKD
9,273,246 1.29
AGRICULT BK CHINA /H-SHARES 18,056,000 10,232,064 1.42HKD
CHINA
AIR CHINA LTD -H- 8,328,000 7,705,066 1.07HKD
BANK OF CHINA LTD -H- 24,542,500 13,655,570 1.90HKD
BANK OF COMMUNICATIONSCO. -H- 9,868,000 10,854,405 1.51HKD
CHAODA MODERNAGRICULTURE HOLDING 12,430,000 7,714,742 1.07HKD
CHINA COMMUNICATIONSCONSTRUCTION -H- 11,400,000 10,869,558 1.51HKD
CHINA CONSTRUCTION BANKCO. -H- 19,239,470 18,022,862 2.50HKD
CHINA MINSHENG BK -H- 9,866,000 9,064,634 1.26HKD
CHINA PETROLEUM & CHEMCORP. -H- 10,516,000 10,540,187 1.46HKD
DONGFENG MOTOR -H- 4,958,000 8,435,244 1.17HKD
IND & COM BOC -H- 23,547,955 19,547,393 2.71HKD
126,641,725 17.58
CEZ.CESKE ENERGETICKEZAVODY 190,764 9,834,138 1.37CZK
CZECH REPUBLIC
9,834,138 1.37
ELSEWEDY CABLES 468,316 3,123,412 0.43EGP
EGYPT
3,123,412 0.43
INVESTMENTS
Global Emerging Markets EquityStatement of investments as at 31 March 2011(expressed in USD)
Description Quantity Currency Evaluation % netassets
AK SBEREGATELNY BANKSBERBANK 4,947,676 18,593,366 2.58USD
FEDERATION OF RUSSIA
GAZPROM OAO 542,295 4,306,365 0.60USD
22,899,731 3.18
ANGLO AMERICAN PLC 177,095 9,182,679 1.27ZAR
GREAT BRITAIN
9,182,679 1.27
CHINA MOBILE LTD 1,027,500 9,460,218 1.31HKD
HONG KONG
KINGBOARD CHEMICALSHOLDINGS 1,382,500 7,265,936 1.01HKD
16,726,154 2.32
OTP BANK LTD 330,344 9,798,032 1.36HUF
HUNGARY
9,798,032 1.36
CAIRN INDIA LIMITED 1,130,876 8,899,659 1.24INR
INDIA
CANARA BANK /DEMAT. 536,288 7,531,108 1.05INR
JSW STEEL LTD / DEMAT. 390,186 8,017,195 1.11INR
RURAL ELECTRIFICATIONCORP LTD 1,347,589 7,666,392 1.06INR
SESA GOA LTD /DEMAT. 1,121,341 7,325,981 1.02INR
TATA MOTORS LTD /DEMAT. 271,111 7,589,210 1.05INR
TATA STEEL LTD /DEMAT. 523,911 7,310,305 1.02INR
UNITED PHOSPHORUS LTD/DEMAT. 2,180,216 7,306,486 1.01INR
61,646,336 8.56
AIRASIA BHD 10,026,400 8,911,628 1.24MYR
MALAYSIA
8,911,628 1.24
KGHM POLSKA MIEDZ SA 147,227 9,484,699 1.32PLN
POLAND
9,484,699 1.32
IMPERIAL HOLDINGS LTD 513,262 8,567,736 1.19ZAR
SOUTH AFRICA
MURRAY AND ROBERTSHOLDINGS 1,891,830 7,359,884 1.02ZAR
STEINHOFF INTERNATIONALHOLDING LTD 2,180,596 8,072,130 1.12ZAR
23,999,750 3.33
Description Quantity Currency Evaluation % netassets
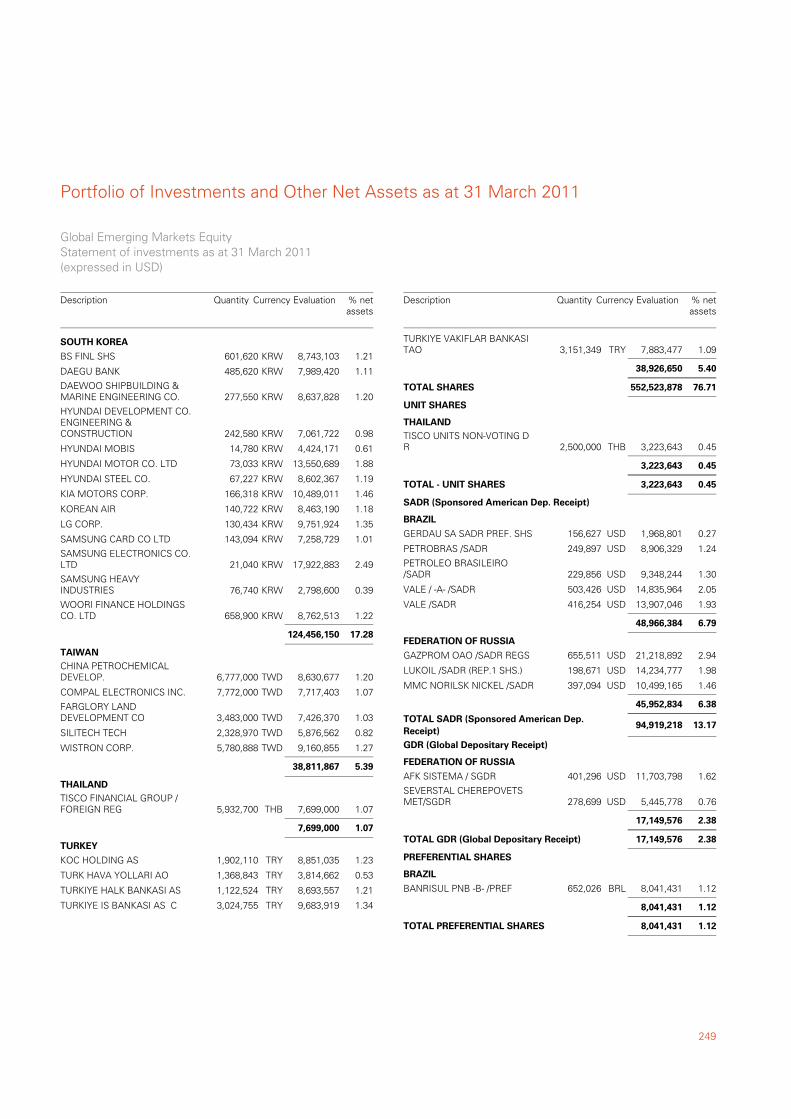
249
Portfolio of Investments and Other Net Assets as at 31 March 2011
BS FINL SHS 601,620 8,743,103 1.21KRW
SOUTH KOREA
DAEGU BANK 485,620 7,989,420 1.11KRW
DAEWOO SHIPBUILDING &MARINE ENGINEERING CO. 277,550 8,637,828 1.20KRW
HYUNDAI DEVELOPMENT CO.ENGINEERING &CONSTRUCTION 242,580 7,061,722 0.98KRW
HYUNDAI MOBIS 14,780 4,424,171 0.61KRW
HYUNDAI MOTOR CO. LTD 73,033 13,550,689 1.88KRW
HYUNDAI STEEL CO. 67,227 8,602,367 1.19KRW
KIA MOTORS CORP. 166,318 10,489,011 1.46KRW
KOREAN AIR 140,722 8,463,190 1.18KRW
LG CORP. 130,434 9,751,924 1.35KRW
SAMSUNG CARD CO LTD 143,094 7,258,729 1.01KRW
SAMSUNG ELECTRONICS CO.LTD 21,040 17,922,883 2.49KRW
SAMSUNG HEAVYINDUSTRIES 76,740 2,798,600 0.39KRW
WOORI FINANCE HOLDINGSCO. LTD 658,900 8,762,513 1.22KRW
124,456,150 17.28
CHINA PETROCHEMICALDEVELOP. 6,777,000 8,630,677 1.20TWD
TAIWAN
COMPAL ELECTRONICS INC. 7,772,000 7,717,403 1.07TWD
FARGLORY LANDDEVELOPMENT CO 3,483,000 7,426,370 1.03TWD
SILITECH TECH 2,328,970 5,876,562 0.82TWD
WISTRON CORP. 5,780,888 9,160,855 1.27TWD
38,811,867 5.39
TISCO FINANCIAL GROUP /FOREIGN REG 5,932,700 7,699,000 1.07THB
THAILAND
7,699,000 1.07
KOC HOLDING AS 1,902,110 8,851,035 1.23TRY
TURKEY
TURK HAVA YOLLARI AO 1,368,843 3,814,662 0.53TRY
TURKIYE HALK BANKASI AS 1,122,524 8,693,557 1.21TRY
TURKIYE IS BANKASI AS C 3,024,755 9,683,919 1.34TRY
Global Emerging Markets EquityStatement of investments as at 31 March 2011(expressed in USD)
Description Quantity Currency Evaluation % netassets
TURKIYE VAKIFLAR BANKASITAO 3,151,349 7,883,477 1.09TRY
38,926,650 5.40
76.71552,523,878TOTAL SHARES
TISCO UNITS NON-VOTING DR 2,500,000 3,223,643 0.45THB
UNIT SHARES
THAILAND
3,223,643 0.45
0.453,223,643TOTAL - UNIT SHARES
GERDAU SA SADR PREF. SHS 156,627 1,968,801 0.27USD
SADR (Sponsored American Dep. Receipt)
BRAZIL
PETROBRAS /SADR 249,897 8,906,329 1.24USD
PETROLEO BRASILEIRO/SADR 229,856 9,348,244 1.30USD
VALE / -A- /SADR 503,426 14,835,964 2.05USD
VALE /SADR 416,254 13,907,046 1.93USD
48,966,384 6.79
GAZPROM OAO /SADR REGS 655,511 21,218,892 2.94USD
FEDERATION OF RUSSIA
LUKOIL /SADR (REP.1 SHS.) 198,671 14,234,777 1.98USD
MMC NORILSK NICKEL /SADR 397,094 10,499,165 1.46USD
45,952,834 6.38
13.1794,919,218TOTAL SADR (Sponsored American Dep.Receipt)
AFK SISTEMA / SGDR 401,296 11,703,798 1.62USD
GDR (Global Depositary Receipt)
FEDERATION OF RUSSIA
SEVERSTAL CHEREPOVETSMET/SGDR 278,699 5,445,778 0.76USD
17,149,576 2.38
2.3817,149,576TOTAL GDR (Global Depositary Receipt)
BANRISUL PNB -B- /PREF 652,026 8,041,431 1.12BRL
PREFERENTIAL SHARES
BRAZIL
8,041,431 1.12
1.128,041,431TOTAL PREFERENTIAL SHARES
Description Quantity Currency Evaluation % netassets
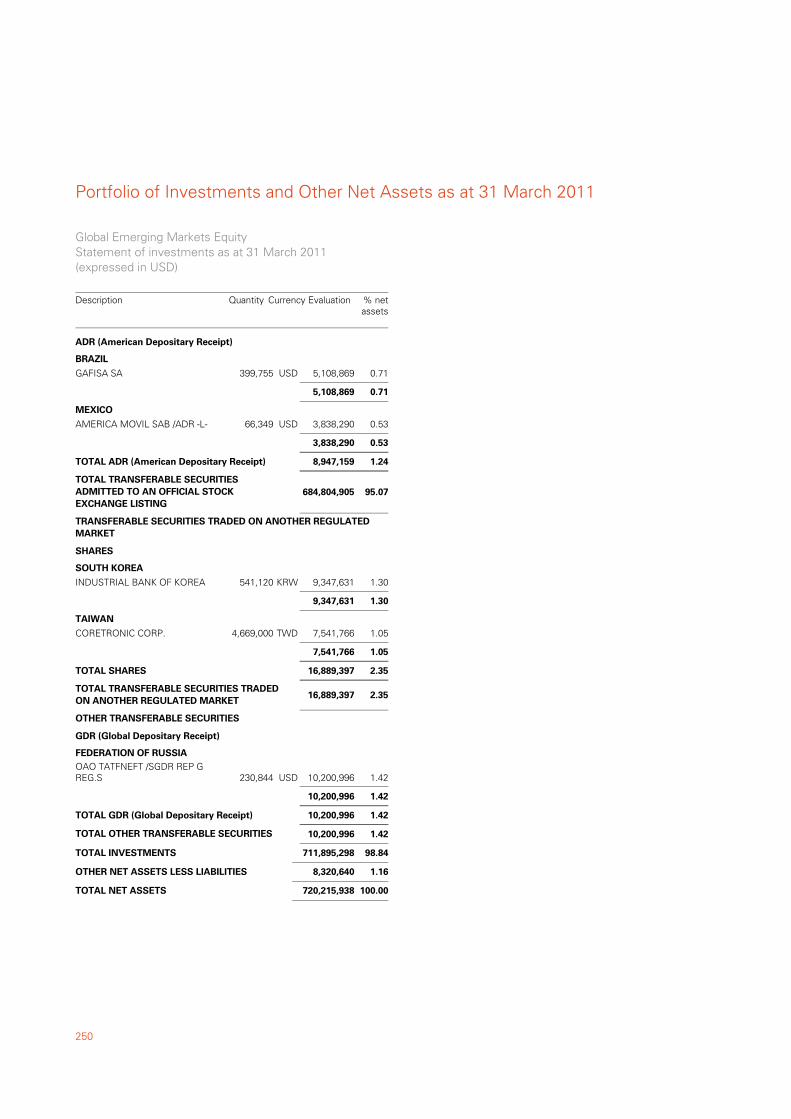
Portfolio of Investments and Other Net Assets as at 31 March 2011
250
GAFISA SA 399,755 5,108,869 0.71USD
ADR (American Depositary Receipt)
BRAZIL
5,108,869 0.71
AMERICA MOVIL SAB /ADR -L- 66,349 3,838,290 0.53USD
MEXICO
3,838,290 0.53
1.248,947,159TOTAL ADR (American Depositary Receipt)
95.07TOTAL TRANSFERABLE SECURITIESADMITTED TO AN OFFICIAL STOCKEXCHANGE LISTING
684,804,905
INDUSTRIAL BANK OF KOREA 541,120 9,347,631 1.30KRW
TRANSFERABLE SECURITIES TRADED ON ANOTHER REGULATEDMARKET
SHARES
SOUTH KOREA
9,347,631 1.30
CORETRONIC CORP. 4,669,000 7,541,766 1.05TWD
TAIWAN
7,541,766 1.05
2.3516,889,397TOTAL SHARES
2.35TOTAL TRANSFERABLE SECURITIES TRADEDON ANOTHER REGULATED MARKET
16,889,397
OAO TATFNEFT /SGDR REP GREG.S 230,844 10,200,996 1.42USD
OTHER TRANSFERABLE SECURITIES
GDR (Global Depositary Receipt)
FEDERATION OF RUSSIA
10,200,996 1.42
1.4210,200,996TOTAL GDR (Global Depositary Receipt)
1.42TOTAL OTHER TRANSFERABLE SECURITIES 10,200,996
98.84TOTAL INVESTMENTS 711,895,298
1.16OTHER NET ASSETS LESS LIABILITIES 8,320,640
100.00TOTAL NET ASSETS 720,215,938
Global Emerging Markets EquityStatement of investments as at 31 March 2011(expressed in USD)
Description Quantity Currency Evaluation % netassets
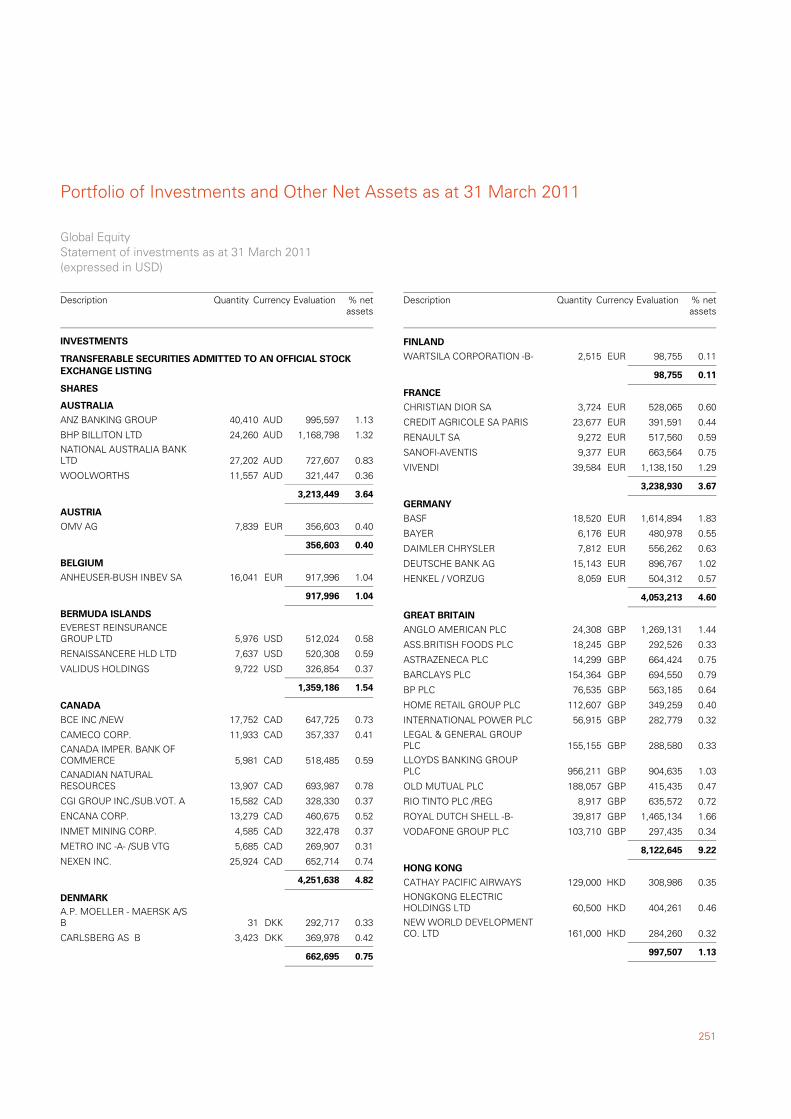
251
Portfolio of Investments and Other Net Assets as at 31 March 2011
ANZ BANKING GROUP 40,410 995,597 1.13AUD
TRANSFERABLE SECURITIES ADMITTED TO AN OFFICIAL STOCKEXCHANGE LISTING
SHARES
AUSTRALIA
BHP BILLITON LTD 24,260 1,168,798 1.32AUD
NATIONAL AUSTRALIA BANKLTD 27,202 727,607 0.83AUD
WOOLWORTHS 11,557 321,447 0.36AUD
3,213,449 3.64
OMV AG 7,839 356,603 0.40EUR
AUSTRIA
356,603 0.40
ANHEUSER-BUSH INBEV SA 16,041 917,996 1.04EUR
BELGIUM
917,996 1.04
EVEREST REINSURANCEGROUP LTD 5,976 512,024 0.58USD
BERMUDA ISLANDS
RENAISSANCERE HLD LTD 7,637 520,308 0.59USD
VALIDUS HOLDINGS 9,722 326,854 0.37USD
1,359,186 1.54
BCE INC /NEW 17,752 647,725 0.73CAD
CANADA
CAMECO CORP. 11,933 357,337 0.41CAD
CANADA IMPER. BANK OFCOMMERCE 5,981 518,485 0.59CAD
CANADIAN NATURALRESOURCES 13,907 693,987 0.78CAD
CGI GROUP INC./SUB.VOT. A 15,582 328,330 0.37CAD
ENCANA CORP. 13,279 460,675 0.52CAD
INMET MINING CORP. 4,585 322,478 0.37CAD
METRO INC -A- /SUB VTG 5,685 269,907 0.31CAD
NEXEN INC. 25,924 652,714 0.74CAD
4,251,638 4.82
A.P. MOELLER - MAERSK A/SB 31 292,717 0.33DKK
DENMARK
CARLSBERG AS B 3,423 369,978 0.42DKK
662,695 0.75
INVESTMENTS
Global EquityStatement of investments as at 31 March 2011(expressed in USD)
Description Quantity Currency Evaluation % netassets
WARTSILA CORPORATION -B- 2,515 98,755 0.11EUR
FINLAND
98,755 0.11
CHRISTIAN DIOR SA 3,724 528,065 0.60EUR
FRANCE
CREDIT AGRICOLE SA PARIS 23,677 391,591 0.44EUR
RENAULT SA 9,272 517,560 0.59EUR
SANOFI-AVENTIS 9,377 663,564 0.75EUR
VIVENDI 39,584 1,138,150 1.29EUR
3,238,930 3.67
BASF 18,520 1,614,894 1.83EUR
GERMANY
BAYER 6,176 480,978 0.55EUR
DAIMLER CHRYSLER 7,812 556,262 0.63EUR
DEUTSCHE BANK AG 15,143 896,767 1.02EUR
HENKEL / VORZUG 8,059 504,312 0.57EUR
4,053,213 4.60
ANGLO AMERICAN PLC 24,308 1,269,131 1.44GBP
GREAT BRITAIN
ASS.BRITISH FOODS PLC 18,245 292,526 0.33GBP
ASTRAZENECA PLC 14,299 664,424 0.75GBP
BARCLAYS PLC 154,364 694,550 0.79GBP
BP PLC 76,535 563,185 0.64GBP
HOME RETAIL GROUP PLC 112,607 349,259 0.40GBP
INTERNATIONAL POWER PLC 56,915 282,779 0.32GBP
LEGAL & GENERAL GROUPPLC 155,155 288,580 0.33GBP
LLOYDS BANKING GROUPPLC 956,211 904,635 1.03GBP
OLD MUTUAL PLC 188,057 415,435 0.47GBP
RIO TINTO PLC /REG 8,917 635,572 0.72GBP
ROYAL DUTCH SHELL -B- 39,817 1,465,134 1.66GBP
VODAFONE GROUP PLC 103,710 297,435 0.34GBP
8,122,645 9.22
CATHAY PACIFIC AIRWAYS 129,000 308,986 0.35HKD
HONG KONG
HONGKONG ELECTRICHOLDINGS LTD 60,500 404,261 0.46HKD
NEW WORLD DEVELOPMENTCO. LTD 161,000 284,260 0.32HKD
997,507 1.13
Description Quantity Currency Evaluation % netassets
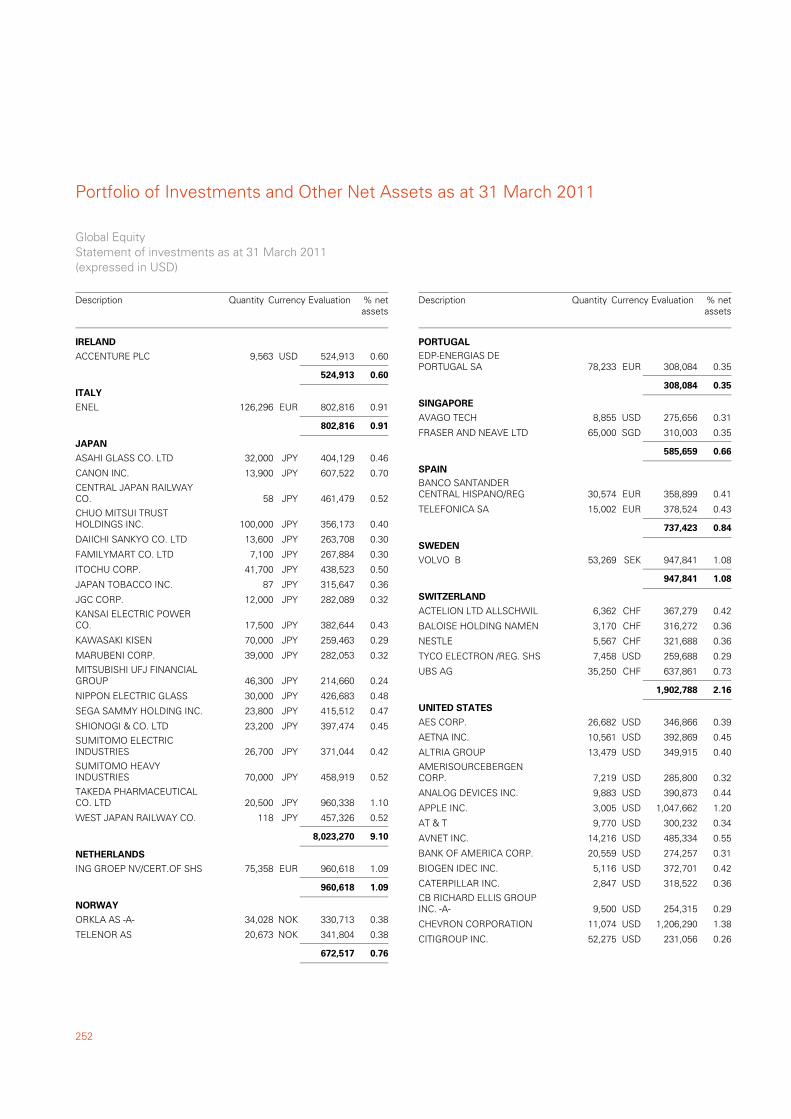
Portfolio of Investments and Other Net Assets as at 31 March 2011
252
ACCENTURE PLC 9,563 524,913 0.60USD
IRELAND
524,913 0.60
ENEL 126,296 802,816 0.91EUR
ITALY
802,816 0.91
ASAHI GLASS CO. LTD 32,000 404,129 0.46JPY
JAPAN
CANON INC. 13,900 607,522 0.70JPY
CENTRAL JAPAN RAILWAYCO. 58 461,479 0.52JPY
CHUO MITSUI TRUSTHOLDINGS INC. 100,000 356,173 0.40JPY
DAIICHI SANKYO CO. LTD 13,600 263,708 0.30JPY
FAMILYMART CO. LTD 7,100 267,884 0.30JPY
ITOCHU CORP. 41,700 438,523 0.50JPY
JAPAN TOBACCO INC. 87 315,647 0.36JPY
JGC CORP. 12,000 282,089 0.32JPY
KANSAI ELECTRIC POWERCO. 17,500 382,644 0.43JPY
KAWASAKI KISEN 70,000 259,463 0.29JPY
MARUBENI CORP. 39,000 282,053 0.32JPY
MITSUBISHI UFJ FINANCIALGROUP 46,300 214,660 0.24JPY
NIPPON ELECTRIC GLASS 30,000 426,683 0.48JPY
SEGA SAMMY HOLDING INC. 23,800 415,512 0.47JPY
SHIONOGI & CO. LTD 23,200 397,474 0.45JPY
SUMITOMO ELECTRICINDUSTRIES 26,700 371,044 0.42JPY
SUMITOMO HEAVYINDUSTRIES 70,000 458,919 0.52JPY
TAKEDA PHARMACEUTICALCO. LTD 20,500 960,338 1.10JPY
WEST JAPAN RAILWAY CO. 118 457,326 0.52JPY
8,023,270 9.10
ING GROEP NV/CERT.OF SHS 75,358 960,618 1.09EUR
NETHERLANDS
960,618 1.09
ORKLA AS -A- 34,028 330,713 0.38NOK
NORWAY
TELENOR AS 20,673 341,804 0.38NOK
672,517 0.76
Global EquityStatement of investments as at 31 March 2011(expressed in USD)
Description Quantity Currency Evaluation % netassets
EDP-ENERGIAS DEPORTUGAL SA 78,233 308,084 0.35EUR
PORTUGAL
308,084 0.35
AVAGO TECH 8,855 275,656 0.31USD
SINGAPORE
FRASER AND NEAVE LTD 65,000 310,003 0.35SGD
585,659 0.66
BANCO SANTANDERCENTRAL HISPANO/REG 30,574 358,899 0.41EUR
SPAIN
TELEFONICA SA 15,002 378,524 0.43EUR
737,423 0.84
VOLVO B 53,269 947,841 1.08SEK
SWEDEN
947,841 1.08
ACTELION LTD ALLSCHWIL 6,362 367,279 0.42CHF
SWITZERLAND
BALOISE HOLDING NAMEN 3,170 316,272 0.36CHF
NESTLE 5,567 321,688 0.36CHF
TYCO ELECTRON /REG. SHS 7,458 259,688 0.29USD
UBS AG 35,250 637,861 0.73CHF
1,902,788 2.16
AES CORP. 26,682 346,866 0.39USD
UNITED STATES
AETNA INC. 10,561 392,869 0.45USD
ALTRIA GROUP 13,479 349,915 0.40USD
AMERISOURCEBERGENCORP. 7,219 285,800 0.32USD
ANALOG DEVICES INC. 9,883 390,873 0.44USD
APPLE INC. 3,005 1,047,662 1.20USD
AT & T 9,770 300,232 0.34USD
AVNET INC. 14,216 485,334 0.55USD
BANK OF AMERICA CORP. 20,559 274,257 0.31USD
BIOGEN IDEC INC. 5,116 372,701 0.42USD
CATERPILLAR INC. 2,847 318,522 0.36USD
CB RICHARD ELLIS GROUPINC. -A- 9,500 254,315 0.29USD
CHEVRON CORPORATION 11,074 1,206,290 1.38USD
CITIGROUP INC. 52,275 231,056 0.26USD
Description Quantity Currency Evaluation % netassets
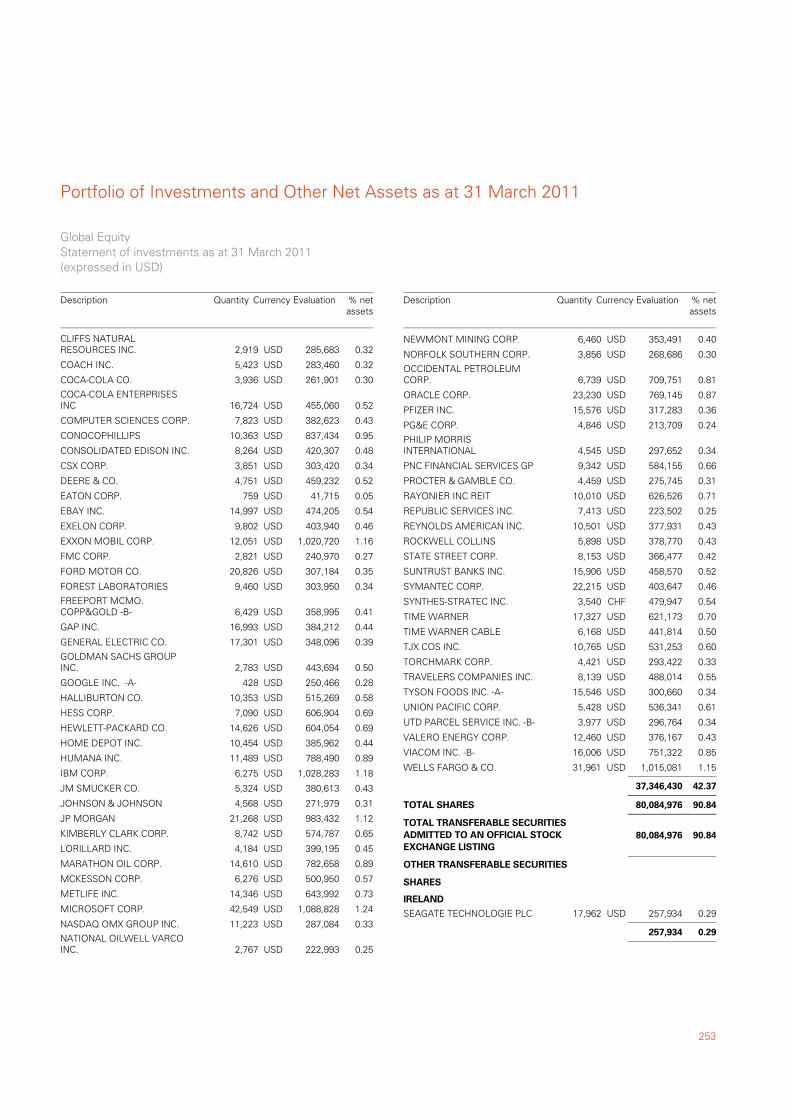
253
Portfolio of Investments and Other Net Assets as at 31 March 2011
CLIFFS NATURALRESOURCES INC. 2,919 285,683 0.32USD
COACH INC. 5,423 283,460 0.32USD
COCA-COLA CO. 3,936 261,901 0.30USD
COCA-COLA ENTERPRISESINC 16,724 455,060 0.52USD
COMPUTER SCIENCES CORP. 7,823 382,623 0.43USD
CONOCOPHILLIPS 10,363 837,434 0.95USD
CONSOLIDATED EDISON INC. 8,264 420,307 0.48USD
CSX CORP. 3,851 303,420 0.34USD
DEERE & CO. 4,751 459,232 0.52USD
EATON CORP. 759 41,715 0.05USD
EBAY INC. 14,997 474,205 0.54USD
EXELON CORP. 9,802 403,940 0.46USD
EXXON MOBIL CORP. 12,051 1,020,720 1.16USD
FMC CORP. 2,821 240,970 0.27USD
FORD MOTOR CO. 20,826 307,184 0.35USD
FOREST LABORATORIES 9,460 303,950 0.34USD
FREEPORT MCMO.COPP&GOLD -B- 6,429 358,995 0.41USD
GAP INC. 16,993 384,212 0.44USD
GENERAL ELECTRIC CO. 17,301 348,096 0.39USD
GOLDMAN SACHS GROUPINC. 2,783 443,694 0.50USD
GOOGLE INC. -A- 428 250,466 0.28USD
HALLIBURTON CO. 10,353 515,269 0.58USD
HESS CORP. 7,090 606,904 0.69USD
HEWLETT-PACKARD CO. 14,626 604,054 0.69USD
HOME DEPOT INC. 10,454 385,962 0.44USD
HUMANA INC. 11,489 788,490 0.89USD
IBM CORP. 6,275 1,028,283 1.18USD
JM SMUCKER CO. 5,324 380,613 0.43USD
JOHNSON & JOHNSON 4,568 271,979 0.31USD
JP MORGAN 21,268 983,432 1.12USD
KIMBERLY CLARK CORP. 8,742 574,787 0.65USD
LORILLARD INC. 4,184 399,195 0.45USD
MARATHON OIL CORP. 14,610 782,658 0.89USD
MCKESSON CORP. 6,276 500,950 0.57USD
METLIFE INC. 14,346 643,992 0.73USD
MICROSOFT CORP. 42,549 1,088,828 1.24USD
NASDAQ OMX GROUP INC. 11,223 287,084 0.33USD
NATIONAL OILWELL VARCOINC. 2,767 222,993 0.25USD
Global EquityStatement of investments as at 31 March 2011(expressed in USD)
Description Quantity Currency Evaluation % netassets
NEWMONT MINING CORP. 6,460 353,491 0.40USD
NORFOLK SOUTHERN CORP. 3,856 268,686 0.30USD
OCCIDENTAL PETROLEUMCORP. 6,739 709,751 0.81USD
ORACLE CORP. 23,230 769,145 0.87USD
PFIZER INC. 15,576 317,283 0.36USD
PG&E CORP. 4,846 213,709 0.24USD
PHILIP MORRISINTERNATIONAL 4,545 297,652 0.34USD
PNC FINANCIAL SERVICES GP 9,342 584,155 0.66USD
PROCTER & GAMBLE CO. 4,459 275,745 0.31USD
RAYONIER INC REIT 10,010 626,526 0.71USD
REPUBLIC SERVICES INC. 7,413 223,502 0.25USD
REYNOLDS AMERICAN INC. 10,501 377,931 0.43USD
ROCKWELL COLLINS 5,898 378,770 0.43USD
STATE STREET CORP. 8,153 366,477 0.42USD
SUNTRUST BANKS INC. 15,906 458,570 0.52USD
SYMANTEC CORP. 22,215 403,647 0.46USD
SYNTHES-STRATEC INC. 3,540 479,947 0.54CHF
TIME WARNER 17,327 621,173 0.70USD
TIME WARNER CABLE 6,168 441,814 0.50USD
TJX COS INC. 10,765 531,253 0.60USD
TORCHMARK CORP. 4,421 293,422 0.33USD
TRAVELERS COMPANIES INC. 8,139 488,014 0.55USD
TYSON FOODS INC. -A- 15,546 300,660 0.34USD
UNION PACIFIC CORP. 5,428 536,341 0.61USD
UTD PARCEL SERVICE INC. -B- 3,977 296,764 0.34USD
VALERO ENERGY CORP. 12,460 376,167 0.43USD
VIACOM INC. -B- 16,006 751,322 0.85USD
WELLS FARGO & CO. 31,961 1,015,081 1.15USD
37,346,430 42.37
90.8480,084,976TOTAL SHARES
90.84TOTAL TRANSFERABLE SECURITIESADMITTED TO AN OFFICIAL STOCKEXCHANGE LISTING
80,084,976
SEAGATE TECHNOLOGIE PLC 17,962 257,934 0.29USD
OTHER TRANSFERABLE SECURITIES
SHARES
IRELAND
257,934 0.29
Description Quantity Currency Evaluation % netassets
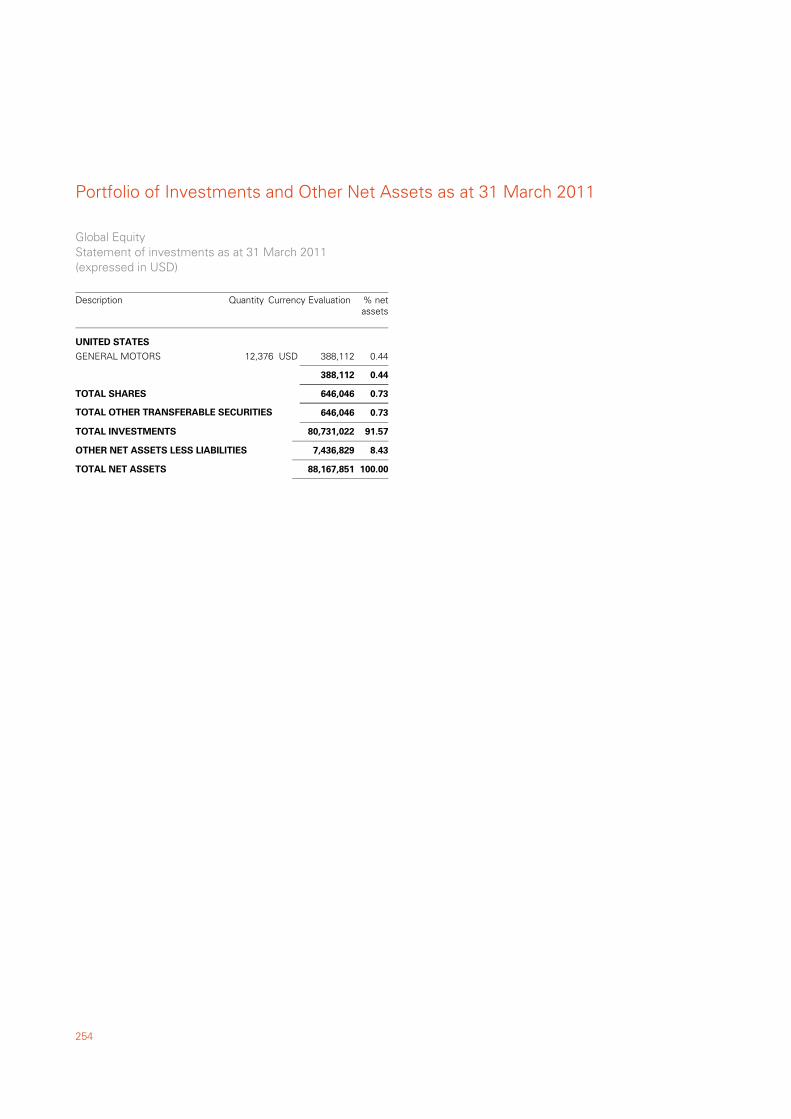
Portfolio of Investments and Other Net Assets as at 31 March 2011
254
GENERAL MOTORS 12,376 388,112 0.44USD
UNITED STATES
388,112 0.44
0.73646,046TOTAL SHARES
0.73TOTAL OTHER TRANSFERABLE SECURITIES 646,046
91.57TOTAL INVESTMENTS 80,731,022
8.43OTHER NET ASSETS LESS LIABILITIES 7,436,829
100.00TOTAL NET ASSETS 88,167,851
Global EquityStatement of investments as at 31 March 2011(expressed in USD)
Description Quantity Currency Evaluation % netassets
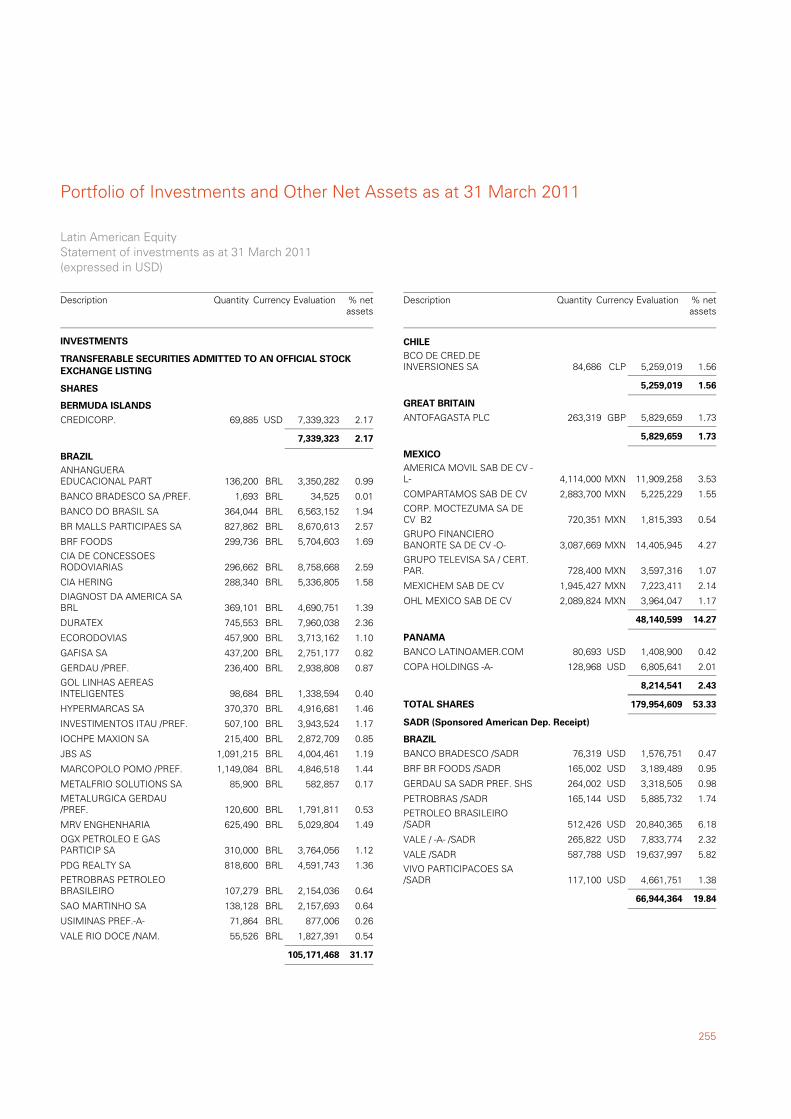
255
Portfolio of Investments and Other Net Assets as at 31 March 2011
CREDICORP. 69,885 7,339,323 2.17USD
TRANSFERABLE SECURITIES ADMITTED TO AN OFFICIAL STOCKEXCHANGE LISTING
SHARES
BERMUDA ISLANDS
7,339,323 2.17
ANHANGUERAEDUCACIONAL PART 136,200 3,350,282 0.99BRL
BRAZIL
BANCO BRADESCO SA /PREF. 1,693 34,525 0.01BRL
BANCO DO BRASIL SA 364,044 6,563,152 1.94BRL
BR MALLS PARTICIPAES SA 827,862 8,670,613 2.57BRL
BRF FOODS 299,736 5,704,603 1.69BRL
CIA DE CONCESSOESRODOVIARIAS 296,662 8,758,668 2.59BRL
CIA HERING 288,340 5,336,805 1.58BRL
DIAGNOST DA AMERICA SABRL 369,101 4,690,751 1.39BRL
DURATEX 745,553 7,960,038 2.36BRL
ECORODOVIAS 457,900 3,713,162 1.10BRL
GAFISA SA 437,200 2,751,177 0.82BRL
GERDAU /PREF. 236,400 2,938,808 0.87BRL
GOL LINHAS AEREASINTELIGENTES 98,684 1,338,594 0.40BRL
HYPERMARCAS SA 370,370 4,916,681 1.46BRL
INVESTIMENTOS ITAU /PREF. 507,100 3,943,524 1.17BRL
IOCHPE MAXION SA 215,400 2,872,709 0.85BRL
JBS AS 1,091,215 4,004,461 1.19BRL
MARCOPOLO POMO /PREF. 1,149,084 4,846,518 1.44BRL
METALFRIO SOLUTIONS SA 85,900 582,857 0.17BRL
METALURGICA GERDAU/PREF. 120,600 1,791,811 0.53BRL
MRV ENGHENHARIA 625,490 5,029,804 1.49BRL
OGX PETROLEO E GASPARTICIP SA 310,000 3,764,056 1.12BRL
PDG REALTY SA 818,600 4,591,743 1.36BRL
PETROBRAS PETROLEOBRASILEIRO 107,279 2,154,036 0.64BRL
SAO MARTINHO SA 138,128 2,157,693 0.64BRL
USIMINAS PREF.-A- 71,864 877,006 0.26BRL
VALE RIO DOCE /NAM. 55,526 1,827,391 0.54BRL
105,171,468 31.17
INVESTMENTS
Latin American EquityStatement of investments as at 31 March 2011(expressed in USD)
Description Quantity Currency Evaluation % netassets
BCO DE CRED.DEINVERSIONES SA 84,686 5,259,019 1.56CLP
CHILE
5,259,019 1.56
ANTOFAGASTA PLC 263,319 5,829,659 1.73GBP
GREAT BRITAIN
5,829,659 1.73
AMERICA MOVIL SAB DE CV -L- 4,114,000 11,909,258 3.53MXN
MEXICO
COMPARTAMOS SAB DE CV 2,883,700 5,225,229 1.55MXN
CORP. MOCTEZUMA SA DECV B2 720,351 1,815,393 0.54MXN
GRUPO FINANCIEROBANORTE SA DE CV -O- 3,087,669 14,405,945 4.27MXN
GRUPO TELEVISA SA / CERT.PAR. 728,400 3,597,316 1.07MXN
MEXICHEM SAB DE CV 1,945,427 7,223,411 2.14MXN
OHL MEXICO SAB DE CV 2,089,824 3,964,047 1.17MXN
48,140,599 14.27
BANCO LATINOAMER.COM 80,693 1,408,900 0.42USD
PANAMA
COPA HOLDINGS -A- 128,968 6,805,641 2.01USD
8,214,541 2.43
53.33179,954,609TOTAL SHARES
BANCO BRADESCO /SADR 76,319 1,576,751 0.47USD
SADR (Sponsored American Dep. Receipt)
BRAZIL
BRF BR FOODS /SADR 165,002 3,189,489 0.95USD
GERDAU SA SADR PREF. SHS 264,002 3,318,505 0.98USD
PETROBRAS /SADR 165,144 5,885,732 1.74USD
PETROLEO BRASILEIRO/SADR 512,426 20,840,365 6.18USD
VALE / -A- /SADR 265,822 7,833,774 2.32USD
VALE /SADR 587,788 19,637,997 5.82USD
VIVO PARTICIPACOES SA/SADR 117,100 4,661,751 1.38USD
66,944,364 19.84
Description Quantity Currency Evaluation % netassets
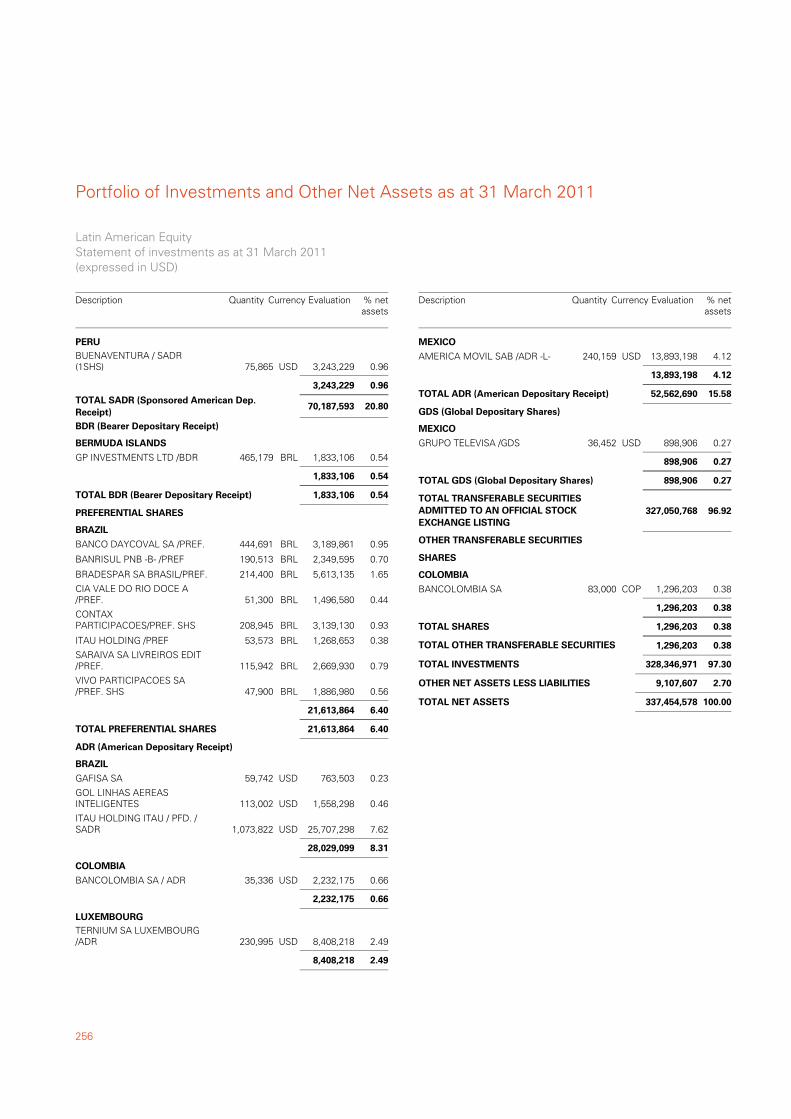
Portfolio of Investments and Other Net Assets as at 31 March 2011
256
BUENAVENTURA / SADR(1SHS) 75,865 3,243,229 0.96USD
PERU
3,243,229 0.96
20.8070,187,593TOTAL SADR (Sponsored American Dep.Receipt)
GP INVESTMENTS LTD /BDR 465,179 1,833,106 0.54BRL
BDR (Bearer Depositary Receipt)
BERMUDA ISLANDS
1,833,106 0.54
0.541,833,106TOTAL BDR (Bearer Depositary Receipt)
BANCO DAYCOVAL SA /PREF. 444,691 3,189,861 0.95BRL
PREFERENTIAL SHARES
BRAZIL
BANRISUL PNB -B- /PREF 190,513 2,349,595 0.70BRL
BRADESPAR SA BRASIL/PREF. 214,400 5,613,135 1.65BRL
CIA VALE DO RIO DOCE A/PREF. 51,300 1,496,580 0.44BRL
CONTAXPARTICIPACOES/PREF. SHS 208,945 3,139,130 0.93BRL
ITAU HOLDING /PREF 53,573 1,268,653 0.38BRL
SARAIVA SA LIVREIROS EDIT/PREF. 115,942 2,669,930 0.79BRL
VIVO PARTICIPACOES SA/PREF. SHS 47,900 1,886,980 0.56BRL
21,613,864 6.40
6.4021,613,864TOTAL PREFERENTIAL SHARES
GAFISA SA 59,742 763,503 0.23USD
ADR (American Depositary Receipt)
BRAZIL
GOL LINHAS AEREASINTELIGENTES 113,002 1,558,298 0.46USD
ITAU HOLDING ITAU / PFD. /SADR 1,073,822 25,707,298 7.62USD
28,029,099 8.31
BANCOLOMBIA SA / ADR 35,336 2,232,175 0.66USD
COLOMBIA
2,232,175 0.66
TERNIUM SA LUXEMBOURG/ADR 230,995 8,408,218 2.49USD
LUXEMBOURG
8,408,218 2.49
Latin American EquityStatement of investments as at 31 March 2011(expressed in USD)
Description Quantity Currency Evaluation % netassets
AMERICA MOVIL SAB /ADR -L- 240,159 13,893,198 4.12USD
MEXICO
13,893,198 4.12
15.5852,562,690TOTAL ADR (American Depositary Receipt)
GRUPO TELEVISA /GDS 36,452 898,906 0.27USD
GDS (Global Depositary Shares)
MEXICO
898,906 0.27
0.27898,906TOTAL GDS (Global Depositary Shares)
96.92TOTAL TRANSFERABLE SECURITIESADMITTED TO AN OFFICIAL STOCKEXCHANGE LISTING
327,050,768
BANCOLOMBIA SA 83,000 1,296,203 0.38COP
OTHER TRANSFERABLE SECURITIES
SHARES
COLOMBIA
1,296,203 0.38
0.381,296,203TOTAL SHARES
0.38TOTAL OTHER TRANSFERABLE SECURITIES 1,296,203
97.30TOTAL INVESTMENTS 328,346,971
2.70OTHER NET ASSETS LESS LIABILITIES 9,107,607
100.00TOTAL NET ASSETS 337,454,578
Description Quantity Currency Evaluation % netassets
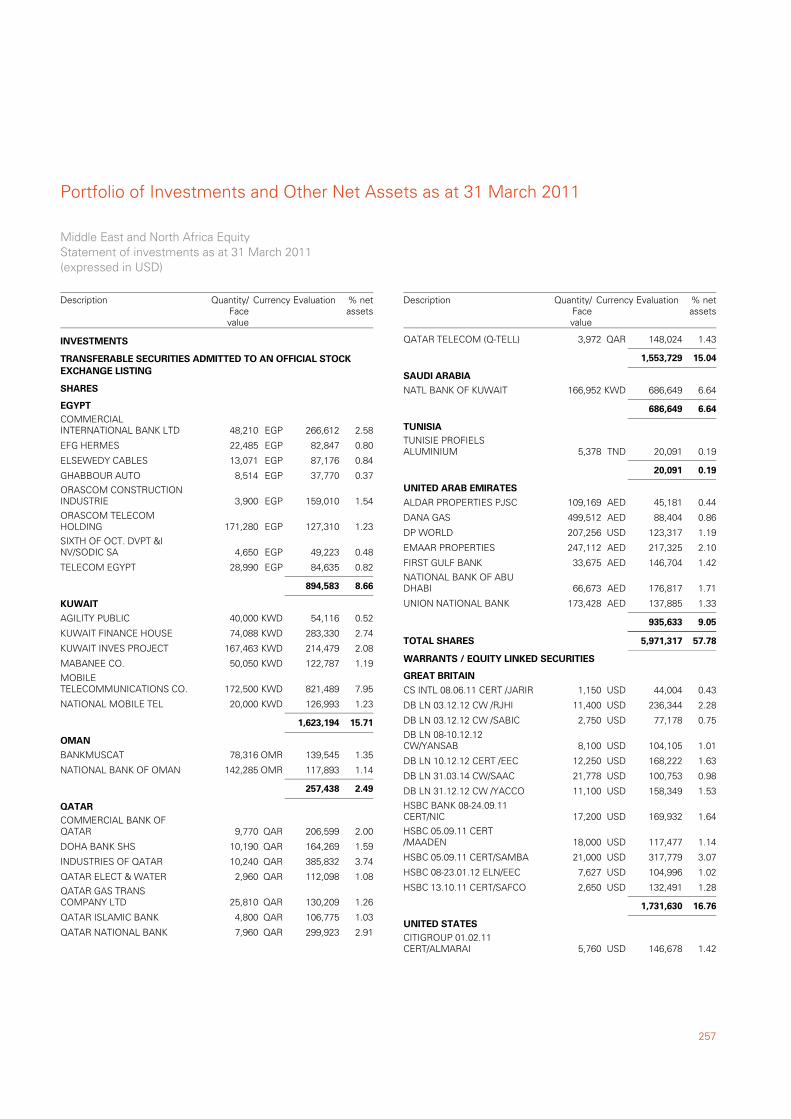
257
Portfolio of Investments and Other Net Assets as at 31 March 2011
COMMERCIALINTERNATIONAL BANK LTD 48,210 266,612 2.58EGP
TRANSFERABLE SECURITIES ADMITTED TO AN OFFICIAL STOCKEXCHANGE LISTING
SHARES
EGYPT
EFG HERMES 22,485 82,847 0.80EGP
ELSEWEDY CABLES 13,071 87,176 0.84EGP
GHABBOUR AUTO 8,514 37,770 0.37EGP
ORASCOM CONSTRUCTIONINDUSTRIE 3,900 159,010 1.54EGP
ORASCOM TELECOMHOLDING 171,280 127,310 1.23EGP
SIXTH OF OCT. DVPT &INV/SODIC SA 4,650 49,223 0.48EGP
TELECOM EGYPT 28,990 84,635 0.82EGP
894,583 8.66
AGILITY PUBLIC 40,000 54,116 0.52KWD
KUWAIT
KUWAIT FINANCE HOUSE 74,088 283,330 2.74KWD
KUWAIT INVES PROJECT 167,463 214,479 2.08KWD
MABANEE CO. 50,050 122,787 1.19KWD
MOBILETELECOMMUNICATIONS CO. 172,500 821,489 7.95KWD
NATIONAL MOBILE TEL 20,000 126,993 1.23KWD
1,623,194 15.71
BANKMUSCAT 78,316 139,545 1.35OMR
OMAN
NATIONAL BANK OF OMAN 142,285 117,893 1.14OMR
257,438 2.49
COMMERCIAL BANK OFQATAR 9,770 206,599 2.00QAR
QATAR
DOHA BANK SHS 10,190 164,269 1.59QAR
INDUSTRIES OF QATAR 10,240 385,832 3.74QAR
QATAR ELECT & WATER 2,960 112,098 1.08QAR
QATAR GAS TRANSCOMPANY LTD 25,810 130,209 1.26QAR
QATAR ISLAMIC BANK 4,800 106,775 1.03QAR
QATAR NATIONAL BANK 7,960 299,923 2.91QAR
INVESTMENTS
Middle East and North Africa EquityStatement of investments as at 31 March 2011(expressed in USD)
Description Currency Evaluation % netassets
Quantity/Facevalue
QATAR TELECOM (Q-TELL) 3,972 148,024 1.43QAR
1,553,729 15.04
NATL BANK OF KUWAIT 166,952 686,649 6.64KWD
SAUDI ARABIA
686,649 6.64
TUNISIE PROFIELSALUMINIUM 5,378 20,091 0.19TND
TUNISIA
20,091 0.19
ALDAR PROPERTIES PJSC 109,169 45,181 0.44AED
UNITED ARAB EMIRATES
DANA GAS 499,512 88,404 0.86AED
DP WORLD 207,256 123,317 1.19USD
EMAAR PROPERTIES 247,112 217,325 2.10AED
FIRST GULF BANK 33,675 146,704 1.42AED
NATIONAL BANK OF ABUDHABI 66,673 176,817 1.71AED
UNION NATIONAL BANK 173,428 137,885 1.33AED
935,633 9.05
57.785,971,317TOTAL SHARES
CS INTL 08.06.11 CERT /JARIR 1,150 44,004 0.43USD
WARRANTS / EQUITY LINKED SECURITIES
GREAT BRITAIN
DB LN 03.12.12 CW /RJHI 11,400 236,344 2.28USD
DB LN 03.12.12 CW /SABIC 2,750 77,178 0.75USD
DB LN 08-10.12.12CW/YANSAB 8,100 104,105 1.01USD
DB LN 10.12.12 CERT /EEC 12,250 168,222 1.63USD
DB LN 31.03.14 CW/SAAC 21,778 100,753 0.98USD
DB LN 31.12.12 CW /YACCO 11,100 158,349 1.53USD
HSBC BANK 08-24.09.11CERT/NIC 17,200 169,932 1.64USD
HSBC 05.09.11 CERT/MAADEN 18,000 117,477 1.14USD
HSBC 05.09.11 CERT/SAMBA 21,000 317,779 3.07USD
HSBC 08-23.01.12 ELN/EEC 7,627 104,996 1.02USD
HSBC 13.10.11 CERT/SAFCO 2,650 132,491 1.28USD
1,731,630 16.76
CITIGROUP 01.02.11CERT/ALMARAI 5,760 146,678 1.42USD
UNITED STATES
Description Currency Evaluation % netassets
Quantity/Facevalue
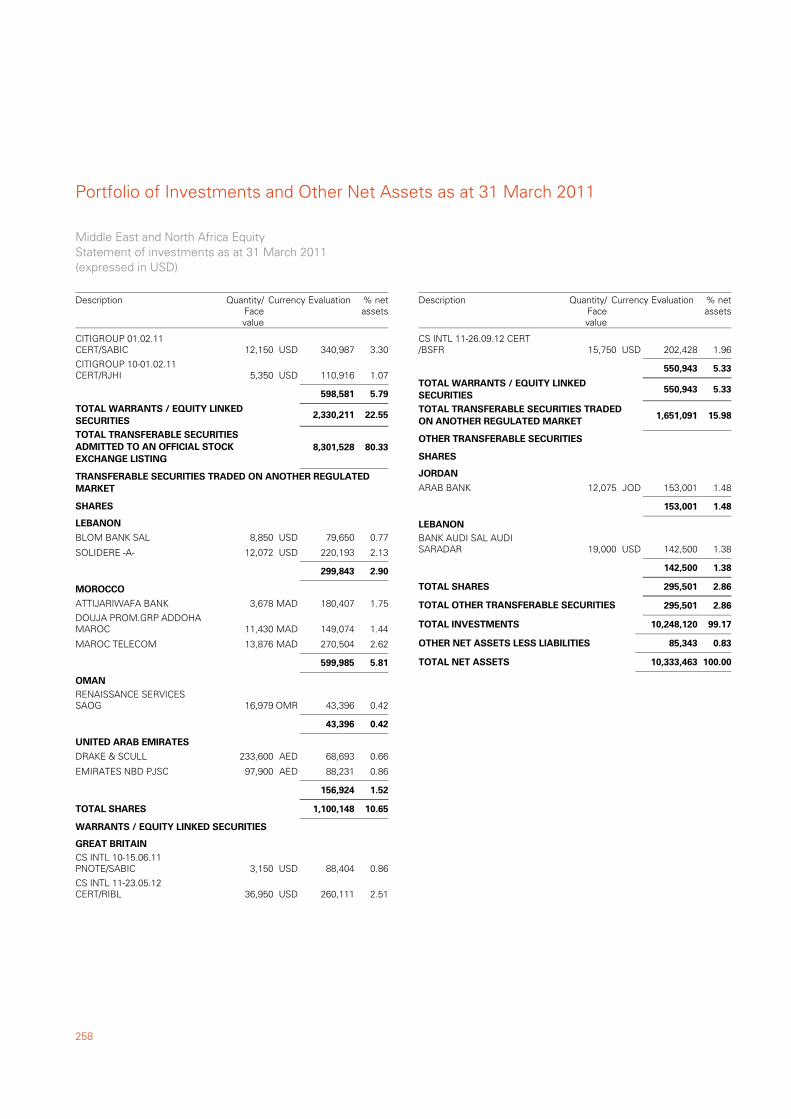
Portfolio of Investments and Other Net Assets as at 31 March 2011
258
CITIGROUP 01.02.11CERT/SABIC 12,150 340,987 3.30USD
CITIGROUP 10-01.02.11CERT/RJHI 5,350 110,916 1.07USD
598,581 5.79
22.552,330,211TOTAL WARRANTS / EQUITY LINKEDSECURITIES
80.33TOTAL TRANSFERABLE SECURITIESADMITTED TO AN OFFICIAL STOCKEXCHANGE LISTING
8,301,528
BLOM BANK SAL 8,850 79,650 0.77USD
TRANSFERABLE SECURITIES TRADED ON ANOTHER REGULATEDMARKET
SHARES
LEBANON
SOLIDERE -A- 12,072 220,193 2.13USD
299,843 2.90
ATTIJARIWAFA BANK 3,678 180,407 1.75MAD
MOROCCO
DOUJA PROM.GRP ADDOHAMAROC 11,430 149,074 1.44MAD
MAROC TELECOM 13,876 270,504 2.62MAD
599,985 5.81
RENAISSANCE SERVICESSAOG 16,979 43,396 0.42OMR
OMAN
43,396 0.42
DRAKE & SCULL 233,600 68,693 0.66AED
UNITED ARAB EMIRATES
EMIRATES NBD PJSC 97,900 88,231 0.86AED
156,924 1.52
10.651,100,148TOTAL SHARES
CS INTL 10-15.06.11PNOTE/SABIC 3,150 88,404 0.86USD
WARRANTS / EQUITY LINKED SECURITIES
GREAT BRITAIN
CS INTL 11-23.05.12CERT/RIBL 36,950 260,111 2.51USD
Middle East and North Africa EquityStatement of investments as at 31 March 2011(expressed in USD)
Description Currency Evaluation % netassets
Quantity/Facevalue
CS INTL 11-26.09.12 CERT/BSFR 15,750 202,428 1.96USD
550,943 5.33
5.33550,943TOTAL WARRANTS / EQUITY LINKEDSECURITIES
15.98TOTAL TRANSFERABLE SECURITIES TRADEDON ANOTHER REGULATED MARKET
1,651,091
ARAB BANK 12,075 153,001 1.48JOD
OTHER TRANSFERABLE SECURITIES
SHARES
JORDAN
153,001 1.48
BANK AUDI SAL AUDISARADAR 19,000 142,500 1.38USD
LEBANON
142,500 1.38
2.86295,501TOTAL SHARES
2.86TOTAL OTHER TRANSFERABLE SECURITIES 295,501
99.17TOTAL INVESTMENTS 10,248,120
0.83OTHER NET ASSETS LESS LIABILITIES 85,343
100.00TOTAL NET ASSETS 10,333,463
Description Currency Evaluation % netassets
Quantity/Facevalue
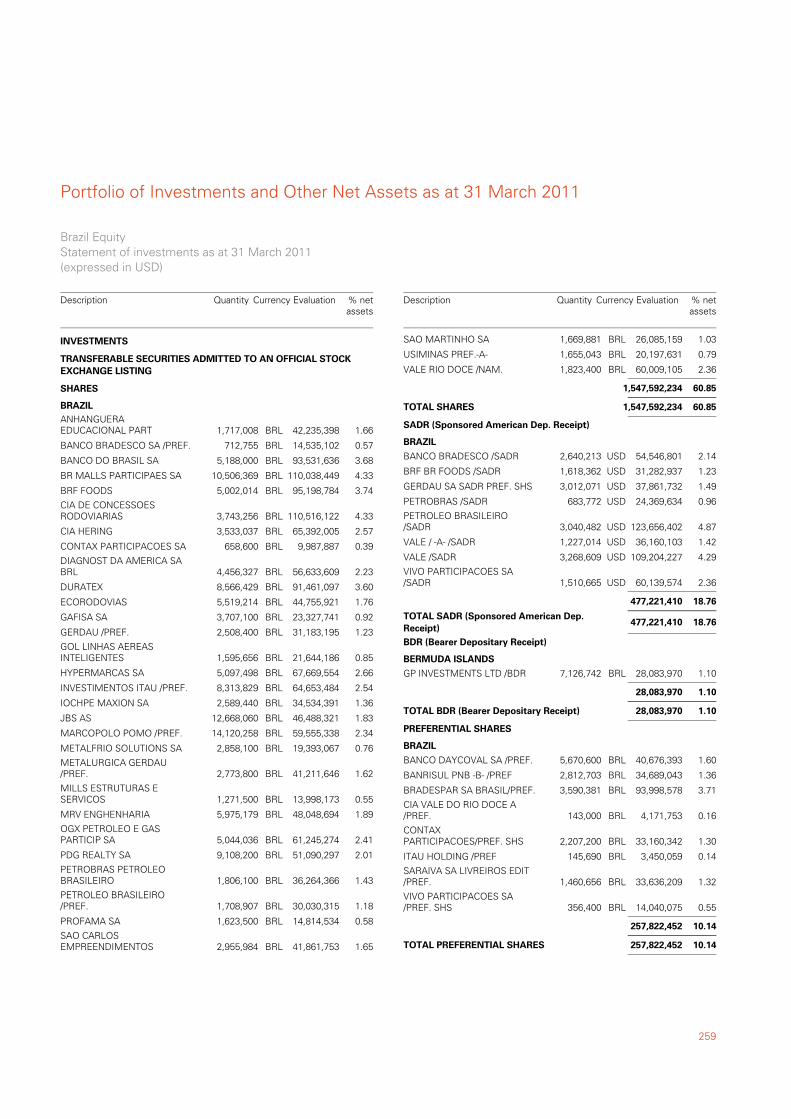
259
Portfolio of Investments and Other Net Assets as at 31 March 2011
ANHANGUERAEDUCACIONAL PART 1,717,008 42,235,398 1.66BRL
TRANSFERABLE SECURITIES ADMITTED TO AN OFFICIAL STOCKEXCHANGE LISTING
SHARES
BRAZIL
BANCO BRADESCO SA /PREF. 712,755 14,535,102 0.57BRL
BANCO DO BRASIL SA 5,188,000 93,531,636 3.68BRL
BR MALLS PARTICIPAES SA 10,506,369 110,038,449 4.33BRL
BRF FOODS 5,002,014 95,198,784 3.74BRL
CIA DE CONCESSOESRODOVIARIAS 3,743,256 110,516,122 4.33BRL
CIA HERING 3,533,037 65,392,005 2.57BRL
CONTAX PARTICIPACOES SA 658,600 9,987,887 0.39BRL
DIAGNOST DA AMERICA SABRL 4,456,327 56,633,609 2.23BRL
DURATEX 8,566,429 91,461,097 3.60BRL
ECORODOVIAS 5,519,214 44,755,921 1.76BRL
GAFISA SA 3,707,100 23,327,741 0.92BRL
GERDAU /PREF. 2,508,400 31,183,195 1.23BRL
GOL LINHAS AEREASINTELIGENTES 1,595,656 21,644,186 0.85BRL
HYPERMARCAS SA 5,097,498 67,669,554 2.66BRL
INVESTIMENTOS ITAU /PREF. 8,313,829 64,653,484 2.54BRL
IOCHPE MAXION SA 2,589,440 34,534,391 1.36BRL
JBS AS 12,668,060 46,488,321 1.83BRL
MARCOPOLO POMO /PREF. 14,120,258 59,555,338 2.34BRL
METALFRIO SOLUTIONS SA 2,858,100 19,393,067 0.76BRL
METALURGICA GERDAU/PREF. 2,773,800 41,211,646 1.62BRL
MILLS ESTRUTURAS ESERVICOS 1,271,500 13,998,173 0.55BRL
MRV ENGHENHARIA 5,975,179 48,048,694 1.89BRL
OGX PETROLEO E GASPARTICIP SA 5,044,036 61,245,274 2.41BRL
PDG REALTY SA 9,108,200 51,090,297 2.01BRL
PETROBRAS PETROLEOBRASILEIRO 1,806,100 36,264,366 1.43BRL
PETROLEO BRASILEIRO/PREF. 1,708,907 30,030,315 1.18BRL
PROFAMA SA 1,623,500 14,814,534 0.58BRL
SAO CARLOSEMPREENDIMENTOS 2,955,984 41,861,753 1.65BRL
INVESTMENTS
Brazil EquityStatement of investments as at 31 March 2011(expressed in USD)
Description Quantity Currency Evaluation % netassets
SAO MARTINHO SA 1,669,881 26,085,159 1.03BRL
USIMINAS PREF.-A- 1,655,043 20,197,631 0.79BRL
VALE RIO DOCE /NAM. 1,823,400 60,009,105 2.36BRL
1,547,592,234 60.85
60.851,547,592,234TOTAL SHARES
BANCO BRADESCO /SADR 2,640,213 54,546,801 2.14USD
SADR (Sponsored American Dep. Receipt)
BRAZIL
BRF BR FOODS /SADR 1,618,362 31,282,937 1.23USD
GERDAU SA SADR PREF. SHS 3,012,071 37,861,732 1.49USD
PETROBRAS /SADR 683,772 24,369,634 0.96USD
PETROLEO BRASILEIRO/SADR 3,040,482 123,656,402 4.87USD
VALE / -A- /SADR 1,227,014 36,160,103 1.42USD
VALE /SADR 3,268,609 109,204,227 4.29USD
VIVO PARTICIPACOES SA/SADR 1,510,665 60,139,574 2.36USD
477,221,410 18.76
18.76477,221,410TOTAL SADR (Sponsored American Dep.Receipt)
GP INVESTMENTS LTD /BDR 7,126,742 28,083,970 1.10BRL
BDR (Bearer Depositary Receipt)
BERMUDA ISLANDS
28,083,970 1.10
1.1028,083,970TOTAL BDR (Bearer Depositary Receipt)
BANCO DAYCOVAL SA /PREF. 5,670,600 40,676,393 1.60BRL
PREFERENTIAL SHARES
BRAZIL
BANRISUL PNB -B- /PREF 2,812,703 34,689,043 1.36BRL
BRADESPAR SA BRASIL/PREF. 3,590,381 93,998,578 3.71BRL
CIA VALE DO RIO DOCE A/PREF. 143,000 4,171,753 0.16BRL
CONTAXPARTICIPACOES/PREF. SHS 2,207,200 33,160,342 1.30BRL
ITAU HOLDING /PREF 145,690 3,450,059 0.14BRL
SARAIVA SA LIVREIROS EDIT/PREF. 1,460,656 33,636,209 1.32BRL
VIVO PARTICIPACOES SA/PREF. SHS 356,400 14,040,075 0.55BRL
257,822,452 10.14
10.14257,822,452TOTAL PREFERENTIAL SHARES
Description Quantity Currency Evaluation % netassets
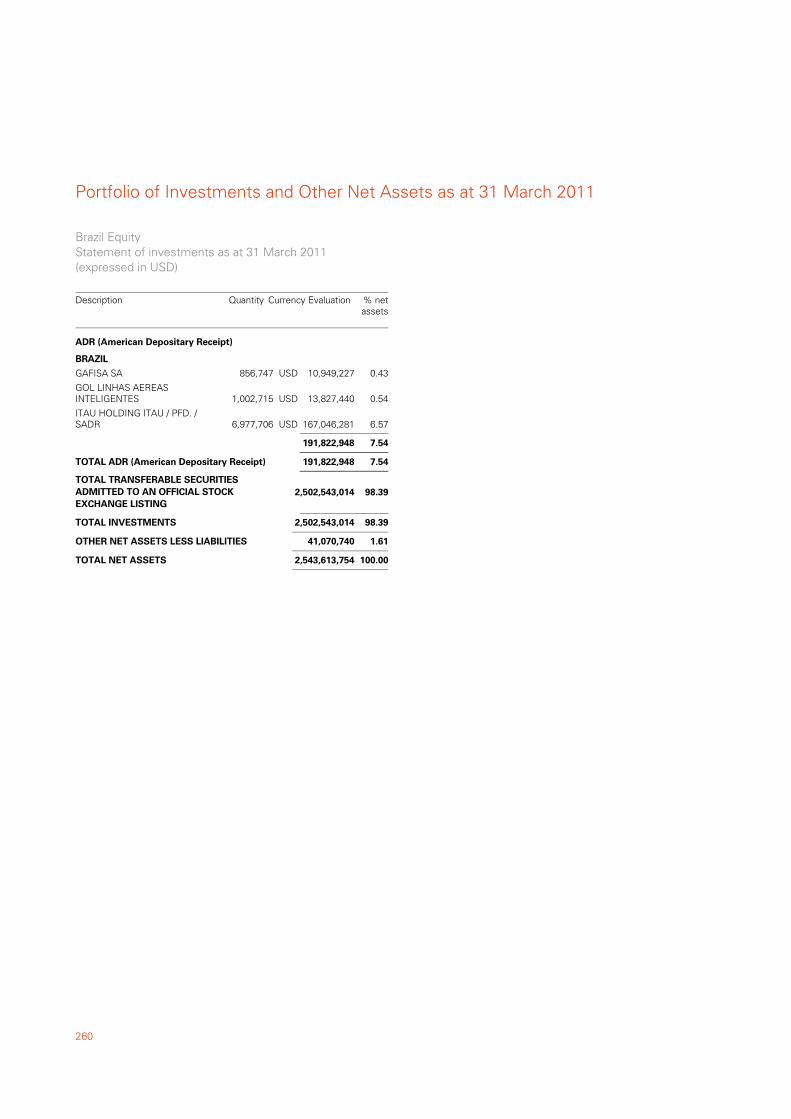
Portfolio of Investments and Other Net Assets as at 31 March 2011
260
GAFISA SA 856,747 10,949,227 0.43USD
ADR (American Depositary Receipt)
BRAZIL
GOL LINHAS AEREASINTELIGENTES 1,002,715 13,827,440 0.54USD
ITAU HOLDING ITAU / PFD. /SADR 6,977,706 167,046,281 6.57USD
191,822,948 7.54
7.54191,822,948TOTAL ADR (American Depositary Receipt)
98.39TOTAL TRANSFERABLE SECURITIESADMITTED TO AN OFFICIAL STOCKEXCHANGE LISTING
2,502,543,014
98.39TOTAL INVESTMENTS 2,502,543,014
1.61OTHER NET ASSETS LESS LIABILITIES 41,070,740
100.00TOTAL NET ASSETS 2,543,613,754
Brazil EquityStatement of investments as at 31 March 2011(expressed in USD)
Description Quantity Currency Evaluation % netassets
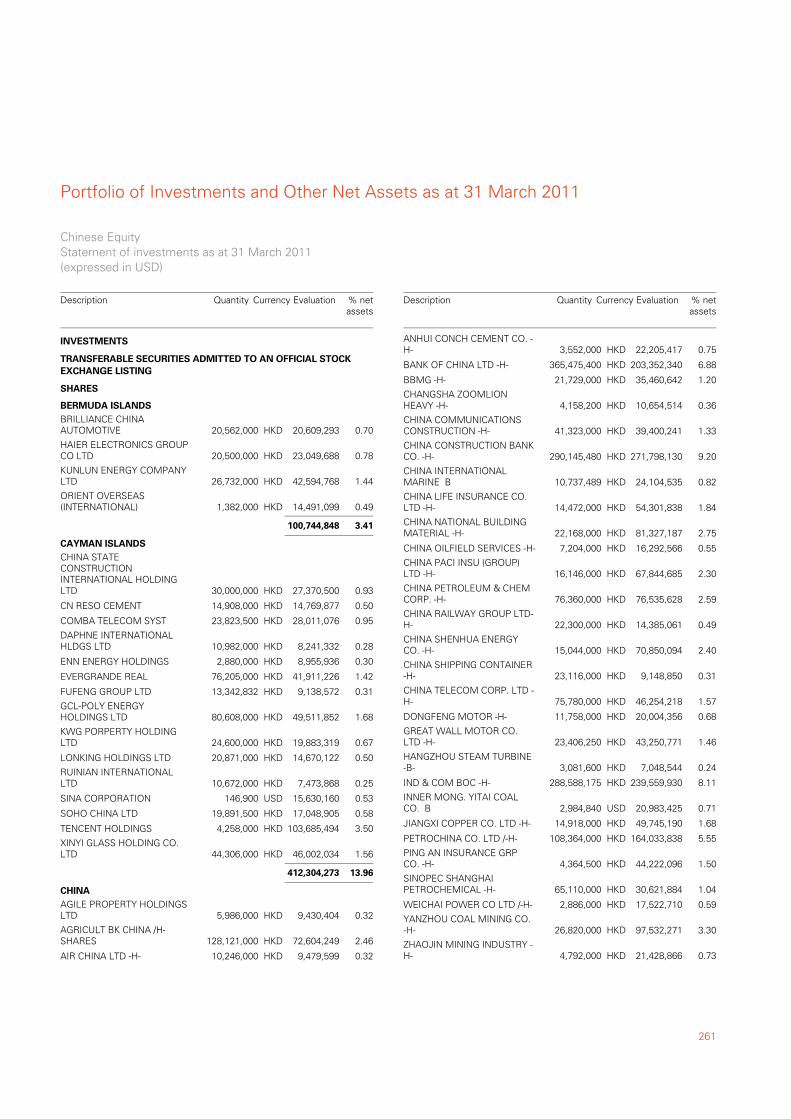
261
Portfolio of Investments and Other Net Assets as at 31 March 2011
BRILLIANCE CHINAAUTOMOTIVE 20,562,000 20,609,293 0.70HKD
TRANSFERABLE SECURITIES ADMITTED TO AN OFFICIAL STOCKEXCHANGE LISTING
SHARES
BERMUDA ISLANDS
HAIER ELECTRONICS GROUPCO LTD 20,500,000 23,049,688 0.78HKD
KUNLUN ENERGY COMPANYLTD 26,732,000 42,594,768 1.44HKD
ORIENT OVERSEAS(INTERNATIONAL) 1,382,000 14,491,099 0.49HKD
100,744,848 3.41
CHINA STATECONSTRUCTIONINTERNATIONAL HOLDINGLTD 30,000,000 27,370,500 0.93HKD
CAYMAN ISLANDS
CN RESO CEMENT 14,908,000 14,769,877 0.50HKD
COMBA TELECOM SYST 23,823,500 28,011,076 0.95HKD
DAPHNE INTERNATIONALHLDGS LTD 10,982,000 8,241,332 0.28HKD
ENN ENERGY HOLDINGS 2,880,000 8,955,936 0.30HKD
EVERGRANDE REAL 76,205,000 41,911,226 1.42HKD
FUFENG GROUP LTD 13,342,832 9,138,572 0.31HKD
GCL-POLY ENERGYHOLDINGS LTD 80,608,000 49,511,852 1.68HKD
KWG PORPERTY HOLDINGLTD 24,600,000 19,883,319 0.67HKD
LONKING HOLDINGS LTD 20,871,000 14,670,122 0.50HKD
RUINIAN INTERNATIONALLTD 10,672,000 7,473,868 0.25HKD
SINA CORPORATION 146,900 15,630,160 0.53USD
SOHO CHINA LTD 19,891,500 17,048,905 0.58HKD
TENCENT HOLDINGS 4,258,000 103,685,494 3.50HKD
XINYI GLASS HOLDING CO.LTD 44,306,000 46,002,034 1.56HKD
412,304,273 13.96
AGILE PROPERTY HOLDINGSLTD 5,986,000 9,430,404 0.32HKD
CHINA
AGRICULT BK CHINA /H-SHARES 128,121,000 72,604,249 2.46HKD
AIR CHINA LTD -H- 10,246,000 9,479,599 0.32HKD
INVESTMENTS
Chinese EquityStatement of investments as at 31 March 2011(expressed in USD)
Description Quantity Currency Evaluation % netassets
ANHUI CONCH CEMENT CO. -H- 3,552,000 22,205,417 0.75HKD
BANK OF CHINA LTD -H- 365,475,400 203,352,340 6.88HKD
BBMG -H- 21,729,000 35,460,642 1.20HKD
CHANGSHA ZOOMLIONHEAVY -H- 4,158,200 10,654,514 0.36HKD
CHINA COMMUNICATIONSCONSTRUCTION -H- 41,323,000 39,400,241 1.33HKD
CHINA CONSTRUCTION BANKCO. -H- 290,145,480 271,798,130 9.20HKD
CHINA INTERNATIONALMARINE B 10,737,489 24,104,535 0.82HKD
CHINA LIFE INSURANCE CO.LTD -H- 14,472,000 54,301,838 1.84HKD
CHINA NATIONAL BUILDINGMATERIAL -H- 22,168,000 81,327,187 2.75HKD
CHINA OILFIELD SERVICES -H- 7,204,000 16,292,566 0.55HKD
CHINA PACI INSU (GROUP)LTD -H- 16,146,000 67,844,685 2.30HKD
CHINA PETROLEUM & CHEMCORP. -H- 76,360,000 76,535,628 2.59HKD
CHINA RAILWAY GROUP LTD-H- 22,300,000 14,385,061 0.49HKD
CHINA SHENHUA ENERGYCO. -H- 15,044,000 70,850,094 2.40HKD
CHINA SHIPPING CONTAINER-H- 23,116,000 9,148,850 0.31HKD
CHINA TELECOM CORP. LTD -H- 75,780,000 46,254,218 1.57HKD
DONGFENG MOTOR -H- 11,758,000 20,004,356 0.68HKD
GREAT WALL MOTOR CO.LTD -H- 23,406,250 43,250,771 1.46HKD
HANGZHOU STEAM TURBINE-B- 3,081,600 7,048,544 0.24HKD
IND & COM BOC -H- 288,588,175 239,559,930 8.11HKD
INNER MONG. YITAI COALCO. B 2,984,840 20,983,425 0.71USD
JIANGXI COPPER CO. LTD -H- 14,918,000 49,745,190 1.68HKD
PETROCHINA CO. LTD /-H- 108,364,000 164,033,838 5.55HKD
PING AN INSURANCE GRPCO. -H- 4,364,500 44,222,096 1.50HKD
SINOPEC SHANGHAIPETROCHEMICAL -H- 65,110,000 30,621,884 1.04HKD
WEICHAI POWER CO LTD /-H- 2,886,000 17,522,710 0.59HKD
YANZHOU COAL MINING CO.-H- 26,820,000 97,532,271 3.30HKD
ZHAOJIN MINING INDUSTRY -H- 4,792,000 21,428,866 0.73HKD
Description Quantity Currency Evaluation % netassets
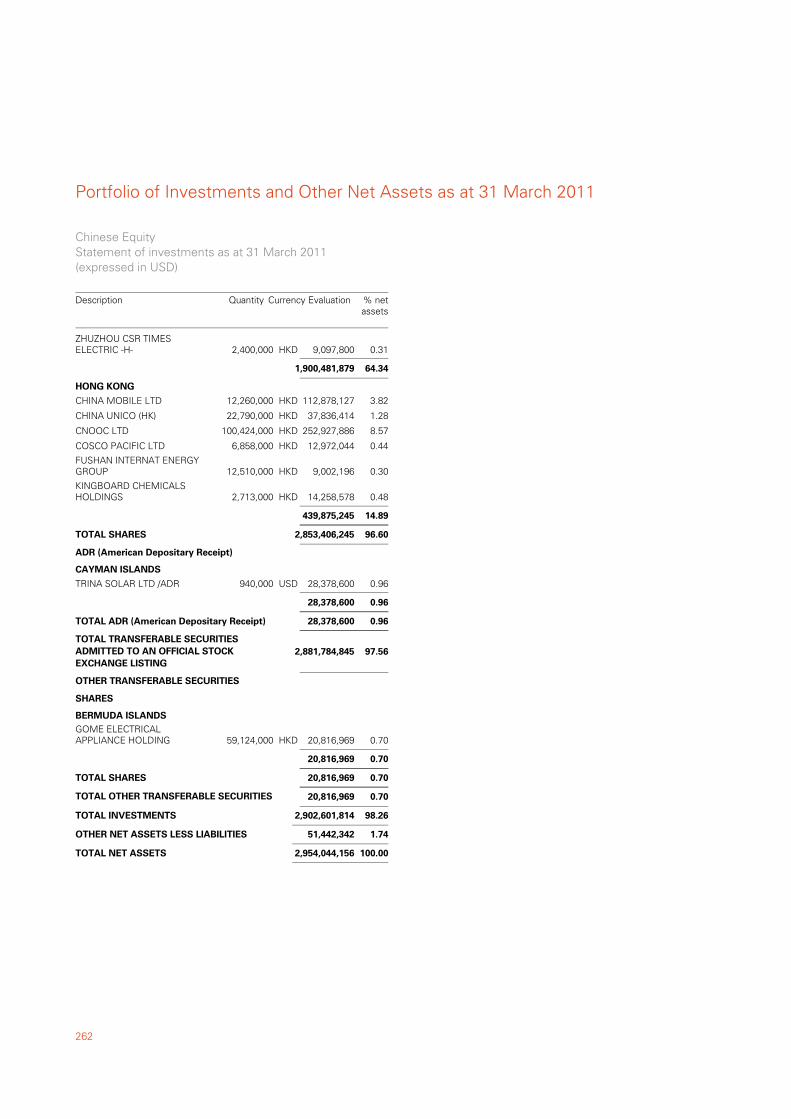
Portfolio of Investments and Other Net Assets as at 31 March 2011
262
ZHUZHOU CSR TIMESELECTRIC -H- 2,400,000 9,097,800 0.31HKD
1,900,481,879 64.34
CHINA MOBILE LTD 12,260,000 112,878,127 3.82HKD
HONG KONG
CHINA UNICO (HK) 22,790,000 37,836,414 1.28HKD
CNOOC LTD 100,424,000 252,927,886 8.57HKD
COSCO PACIFIC LTD 6,858,000 12,972,044 0.44HKD
FUSHAN INTERNAT ENERGYGROUP 12,510,000 9,002,196 0.30HKD
KINGBOARD CHEMICALSHOLDINGS 2,713,000 14,258,578 0.48HKD
439,875,245 14.89
96.602,853,406,245TOTAL SHARES
TRINA SOLAR LTD /ADR 940,000 28,378,600 0.96USD
ADR (American Depositary Receipt)
CAYMAN ISLANDS
28,378,600 0.96
0.9628,378,600TOTAL ADR (American Depositary Receipt)
97.56TOTAL TRANSFERABLE SECURITIESADMITTED TO AN OFFICIAL STOCKEXCHANGE LISTING
2,881,784,845
GOME ELECTRICALAPPLIANCE HOLDING 59,124,000 20,816,969 0.70HKD
OTHER TRANSFERABLE SECURITIES
SHARES
BERMUDA ISLANDS
20,816,969 0.70
0.7020,816,969TOTAL SHARES
0.70TOTAL OTHER TRANSFERABLE SECURITIES 20,816,969
98.26TOTAL INVESTMENTS 2,902,601,814
1.74OTHER NET ASSETS LESS LIABILITIES 51,442,342
100.00TOTAL NET ASSETS 2,954,044,156
Chinese EquityStatement of investments as at 31 March 2011(expressed in USD)
Description Quantity Currency Evaluation % netassets
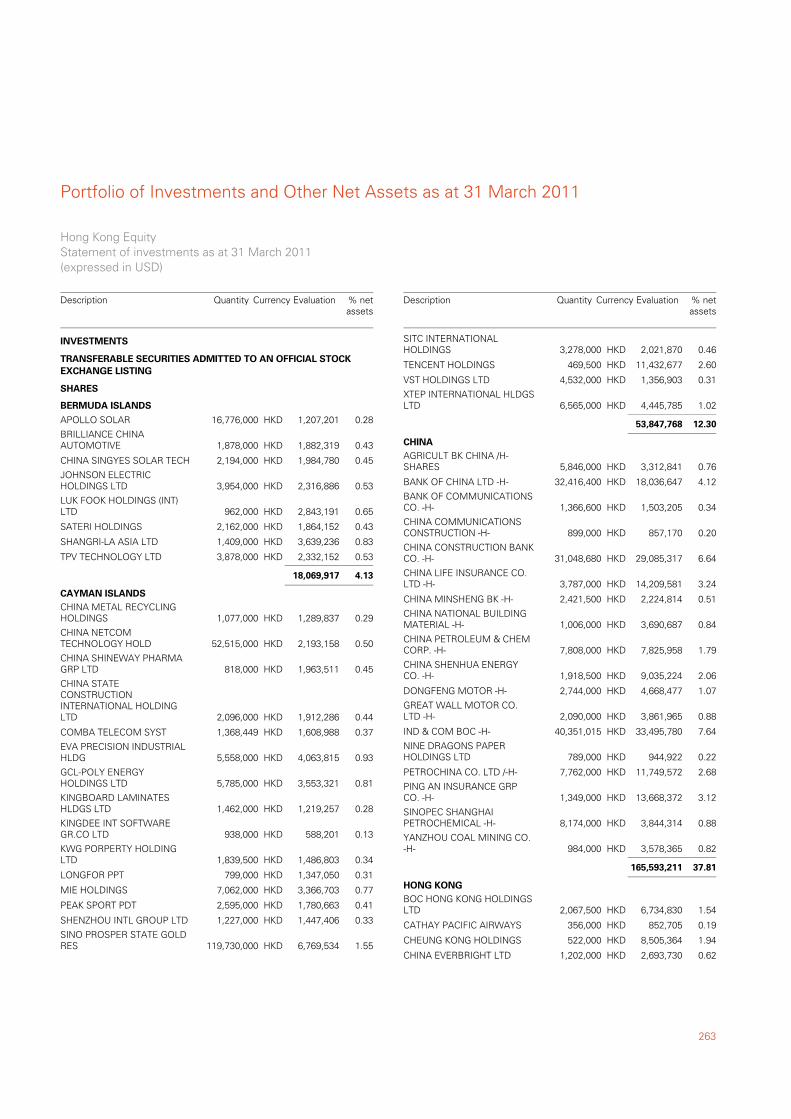
263
Portfolio of Investments and Other Net Assets as at 31 March 2011
APOLLO SOLAR 16,776,000 1,207,201 0.28HKD
TRANSFERABLE SECURITIES ADMITTED TO AN OFFICIAL STOCKEXCHANGE LISTING
SHARES
BERMUDA ISLANDS
BRILLIANCE CHINAAUTOMOTIVE 1,878,000 1,882,319 0.43HKD
CHINA SINGYES SOLAR TECH 2,194,000 1,984,780 0.45HKD
JOHNSON ELECTRICHOLDINGS LTD 3,954,000 2,316,886 0.53HKD
LUK FOOK HOLDINGS (INT)LTD 962,000 2,843,191 0.65HKD
SATERI HOLDINGS 2,162,000 1,864,152 0.43HKD
SHANGRI-LA ASIA LTD 1,409,000 3,639,236 0.83HKD
TPV TECHNOLOGY LTD 3,878,000 2,332,152 0.53HKD
18,069,917 4.13
CHINA METAL RECYCLINGHOLDINGS 1,077,000 1,289,837 0.29HKD
CAYMAN ISLANDS
CHINA NETCOMTECHNOLOGY HOLD 52,515,000 2,193,158 0.50HKD
CHINA SHINEWAY PHARMAGRP LTD 818,000 1,963,511 0.45HKD
CHINA STATECONSTRUCTIONINTERNATIONAL HOLDINGLTD 2,096,000 1,912,286 0.44HKD
COMBA TELECOM SYST 1,368,449 1,608,988 0.37HKD
EVA PRECISION INDUSTRIALHLDG 5,558,000 4,063,815 0.93HKD
GCL-POLY ENERGYHOLDINGS LTD 5,785,000 3,553,321 0.81HKD
KINGBOARD LAMINATESHLDGS LTD 1,462,000 1,219,257 0.28HKD
KINGDEE INT SOFTWAREGR.CO LTD 938,000 588,201 0.13HKD
KWG PORPERTY HOLDINGLTD 1,839,500 1,486,803 0.34HKD
LONGFOR PPT 799,000 1,347,050 0.31HKD
MIE HOLDINGS 7,062,000 3,366,703 0.77HKD
PEAK SPORT PDT 2,595,000 1,780,663 0.41HKD
SHENZHOU INTL GROUP LTD 1,227,000 1,447,406 0.33HKD
SINO PROSPER STATE GOLDRES 119,730,000 6,769,534 1.55HKD
INVESTMENTS
Hong Kong EquityStatement of investments as at 31 March 2011(expressed in USD)
Description Quantity Currency Evaluation % netassets
SITC INTERNATIONALHOLDINGS 3,278,000 2,021,870 0.46HKD
TENCENT HOLDINGS 469,500 11,432,677 2.60HKD
VST HOLDINGS LTD 4,532,000 1,356,903 0.31HKD
XTEP INTERNATIONAL HLDGSLTD 6,565,000 4,445,785 1.02HKD
53,847,768 12.30
AGRICULT BK CHINA /H-SHARES 5,846,000 3,312,841 0.76HKD
CHINA
BANK OF CHINA LTD -H- 32,416,400 18,036,647 4.12HKD
BANK OF COMMUNICATIONSCO. -H- 1,366,600 1,503,205 0.34HKD
CHINA COMMUNICATIONSCONSTRUCTION -H- 899,000 857,170 0.20HKD
CHINA CONSTRUCTION BANKCO. -H- 31,048,680 29,085,317 6.64HKD
CHINA LIFE INSURANCE CO.LTD -H- 3,787,000 14,209,581 3.24HKD
CHINA MINSHENG BK -H- 2,421,500 2,224,814 0.51HKD
CHINA NATIONAL BUILDINGMATERIAL -H- 1,006,000 3,690,687 0.84HKD
CHINA PETROLEUM & CHEMCORP. -H- 7,808,000 7,825,958 1.79HKD
CHINA SHENHUA ENERGYCO. -H- 1,918,500 9,035,224 2.06HKD
DONGFENG MOTOR -H- 2,744,000 4,668,477 1.07HKD
GREAT WALL MOTOR CO.LTD -H- 2,090,000 3,861,965 0.88HKD
IND & COM BOC -H- 40,351,015 33,495,780 7.64HKD
NINE DRAGONS PAPERHOLDINGS LTD 789,000 944,922 0.22HKD
PETROCHINA CO. LTD /-H- 7,762,000 11,749,572 2.68HKD
PING AN INSURANCE GRPCO. -H- 1,349,000 13,668,372 3.12HKD
SINOPEC SHANGHAIPETROCHEMICAL -H- 8,174,000 3,844,314 0.88HKD
YANZHOU COAL MINING CO.-H- 984,000 3,578,365 0.82HKD
165,593,211 37.81
BOC HONG KONG HOLDINGSLTD 2,067,500 6,734,830 1.54HKD
HONG KONG
CATHAY PACIFIC AIRWAYS 356,000 852,705 0.19HKD
CHEUNG KONG HOLDINGS 522,000 8,505,364 1.94HKD
CHINA EVERBRIGHT LTD 1,202,000 2,693,730 0.62HKD
Description Quantity Currency Evaluation % netassets
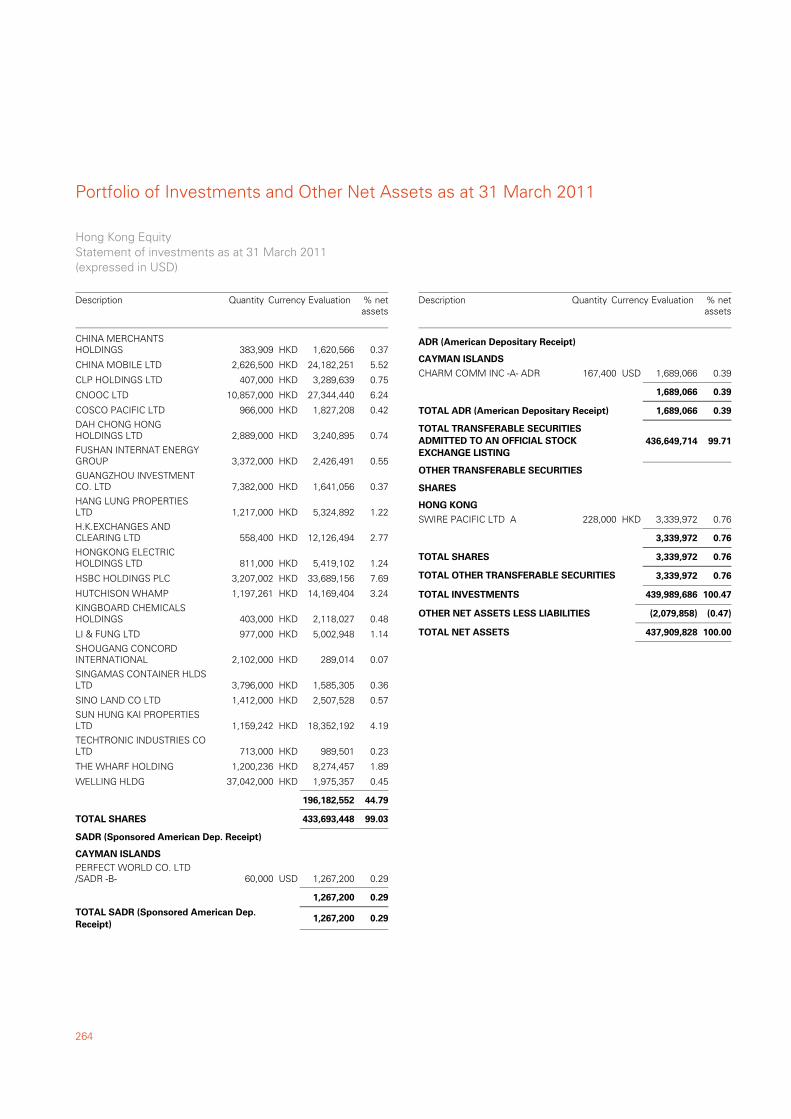
Portfolio of Investments and Other Net Assets as at 31 March 2011
264
CHINA MERCHANTSHOLDINGS 383,909 1,620,566 0.37HKD
CHINA MOBILE LTD 2,626,500 24,182,251 5.52HKD
CLP HOLDINGS LTD 407,000 3,289,639 0.75HKD
CNOOC LTD 10,857,000 27,344,440 6.24HKD
COSCO PACIFIC LTD 966,000 1,827,208 0.42HKD
DAH CHONG HONGHOLDINGS LTD 2,889,000 3,240,895 0.74HKD
FUSHAN INTERNAT ENERGYGROUP 3,372,000 2,426,491 0.55HKD
GUANGZHOU INVESTMENTCO. LTD 7,382,000 1,641,056 0.37HKD
HANG LUNG PROPERTIESLTD 1,217,000 5,324,892 1.22HKD
H.K.EXCHANGES ANDCLEARING LTD 558,400 12,126,494 2.77HKD
HONGKONG ELECTRICHOLDINGS LTD 811,000 5,419,102 1.24HKD
HSBC HOLDINGS PLC 3,207,002 33,689,156 7.69HKD
HUTCHISON WHAMP 1,197,261 14,169,404 3.24HKD
KINGBOARD CHEMICALSHOLDINGS 403,000 2,118,027 0.48HKD
LI & FUNG LTD 977,000 5,002,948 1.14HKD
SHOUGANG CONCORDINTERNATIONAL 2,102,000 289,014 0.07HKD
SINGAMAS CONTAINER HLDSLTD 3,796,000 1,585,305 0.36HKD
SINO LAND CO LTD 1,412,000 2,507,528 0.57HKD
SUN HUNG KAI PROPERTIESLTD 1,159,242 18,352,192 4.19HKD
TECHTRONIC INDUSTRIES COLTD 713,000 989,501 0.23HKD
THE WHARF HOLDING 1,200,236 8,274,457 1.89HKD
WELLING HLDG 37,042,000 1,975,357 0.45HKD
196,182,552 44.79
99.03433,693,448TOTAL SHARES
PERFECT WORLD CO. LTD/SADR -B- 60,000 1,267,200 0.29USD
SADR (Sponsored American Dep. Receipt)
CAYMAN ISLANDS
1,267,200 0.29
0.291,267,200TOTAL SADR (Sponsored American Dep.Receipt)
Hong Kong EquityStatement of investments as at 31 March 2011(expressed in USD)
Description Quantity Currency Evaluation % netassets
CHARM COMM INC -A- ADR 167,400 1,689,066 0.39USD
ADR (American Depositary Receipt)
CAYMAN ISLANDS
1,689,066 0.39
0.391,689,066TOTAL ADR (American Depositary Receipt)
99.71TOTAL TRANSFERABLE SECURITIESADMITTED TO AN OFFICIAL STOCKEXCHANGE LISTING
436,649,714
SWIRE PACIFIC LTD A 228,000 3,339,972 0.76HKD
OTHER TRANSFERABLE SECURITIES
SHARES
HONG KONG
3,339,972 0.76
0.763,339,972TOTAL SHARES
0.76TOTAL OTHER TRANSFERABLE SECURITIES 3,339,972
100.47TOTAL INVESTMENTS 439,989,686
(0.47)OTHER NET ASSETS LESS LIABILITIES (2,079,858)
100.00TOTAL NET ASSETS 437,909,828
Description Quantity Currency Evaluation % netassets
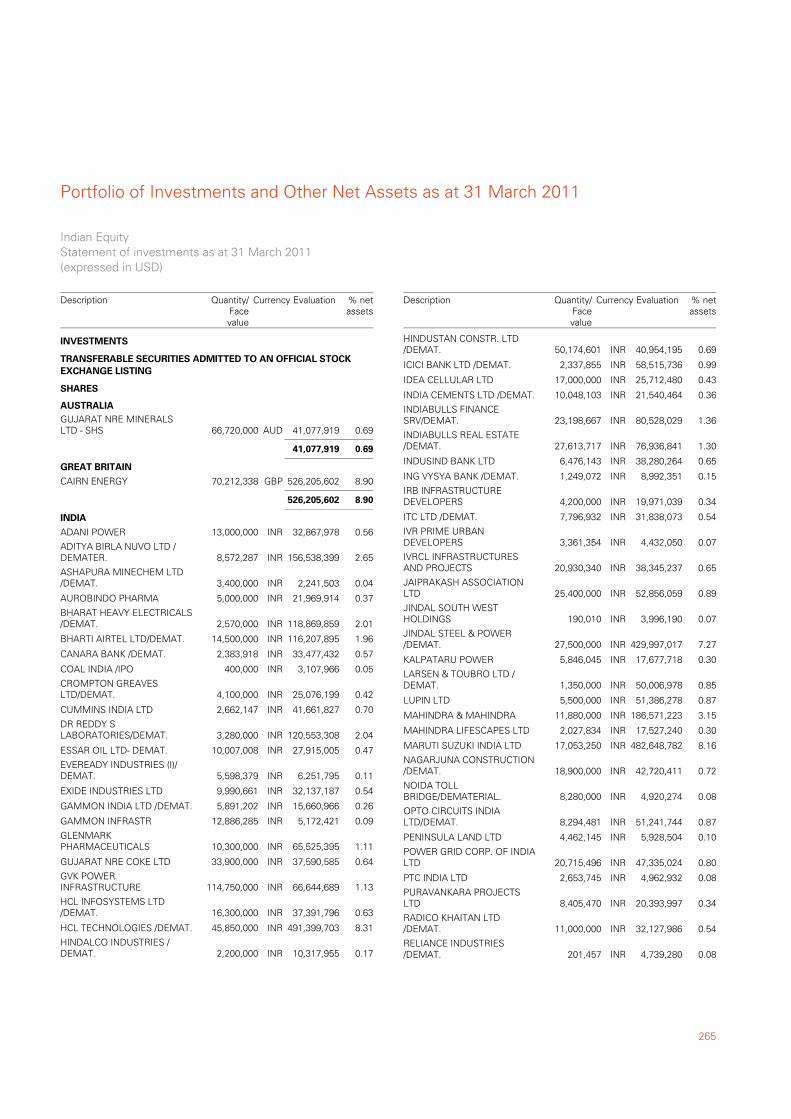
265
Portfolio of Investments and Other Net Assets as at 31 March 2011
GUJARAT NRE MINERALSLTD - SHS 66,720,000 41,077,919 0.69AUD
TRANSFERABLE SECURITIES ADMITTED TO AN OFFICIAL STOCKEXCHANGE LISTING
SHARES
AUSTRALIA
41,077,919 0.69
CAIRN ENERGY 70,212,338 526,205,602 8.90GBP
GREAT BRITAIN
526,205,602 8.90
ADANI POWER 13,000,000 32,867,978 0.56INR
INDIA
ADITYA BIRLA NUVO LTD /DEMATER. 8,572,287 156,538,399 2.65INR
ASHAPURA MINECHEM LTD/DEMAT. 3,400,000 2,241,503 0.04INR
AUROBINDO PHARMA 5,000,000 21,969,914 0.37INR
BHARAT HEAVY ELECTRICALS/DEMAT. 2,570,000 118,869,859 2.01INR
BHARTI AIRTEL LTD/DEMAT. 14,500,000 116,207,895 1.96INR
CANARA BANK /DEMAT. 2,383,918 33,477,432 0.57INR
COAL INDIA /IPO 400,000 3,107,966 0.05INR
CROMPTON GREAVESLTD/DEMAT. 4,100,000 25,076,199 0.42INR
CUMMINS INDIA LTD 2,662,147 41,661,827 0.70INR
DR REDDY SLABORATORIES/DEMAT. 3,280,000 120,553,308 2.04INR
ESSAR OIL LTD- DEMAT. 10,007,008 27,915,005 0.47INR
EVEREADY INDUSTRIES (I)/DEMAT. 5,598,379 6,251,795 0.11INR
EXIDE INDUSTRIES LTD 9,990,661 32,137,187 0.54INR
GAMMON INDIA LTD /DEMAT. 5,891,202 15,660,966 0.26INR
GAMMON INFRASTR 12,886,285 5,172,421 0.09INR
GLENMARKPHARMACEUTICALS 10,300,000 65,525,395 1.11INR
GUJARAT NRE COKE LTD 33,900,000 37,590,585 0.64INR
GVK POWERINFRASTRUCTURE 114,750,000 66,644,689 1.13INR
HCL INFOSYSTEMS LTD/DEMAT. 16,300,000 37,391,796 0.63INR
HCL TECHNOLOGIES /DEMAT. 45,850,000 491,399,703 8.31INR
HINDALCO INDUSTRIES /DEMAT. 2,200,000 10,317,955 0.17INR
INVESTMENTS
Indian EquityStatement of investments as at 31 March 2011(expressed in USD)
Description Currency Evaluation % netassets
Quantity/Facevalue
HINDUSTAN CONSTR. LTD/DEMAT. 50,174,601 40,954,195 0.69INR
ICICI BANK LTD /DEMAT. 2,337,855 58,515,736 0.99INR
IDEA CELLULAR LTD 17,000,000 25,712,480 0.43INR
INDIA CEMENTS LTD /DEMAT. 10,048,103 21,540,464 0.36INR
INDIABULLS FINANCESRV/DEMAT. 23,198,667 80,528,029 1.36INR
INDIABULLS REAL ESTATE/DEMAT. 27,613,717 76,936,841 1.30INR
INDUSIND BANK LTD 6,476,143 38,280,264 0.65INR
ING VYSYA BANK /DEMAT. 1,249,072 8,992,351 0.15INR
IRB INFRASTRUCTUREDEVELOPERS 4,200,000 19,971,039 0.34INR
ITC LTD /DEMAT. 7,796,932 31,838,073 0.54INR
IVR PRIME URBANDEVELOPERS 3,361,354 4,432,050 0.07INR
IVRCL INFRASTRUCTURESAND PROJECTS 20,930,340 38,345,237 0.65INR
JAIPRAKASH ASSOCIATIONLTD 25,400,000 52,856,059 0.89INR
JINDAL SOUTH WESTHOLDINGS 190,010 3,996,190 0.07INR
JINDAL STEEL & POWER/DEMAT. 27,500,000 429,997,017 7.27INR
KALPATARU POWER 5,846,045 17,677,718 0.30INR
LARSEN & TOUBRO LTD /DEMAT. 1,350,000 50,006,978 0.85INR
LUPIN LTD 5,500,000 51,386,278 0.87INR
MAHINDRA & MAHINDRA 11,880,000 186,571,223 3.15INR
MAHINDRA LIFESCAPES LTD 2,027,834 17,527,240 0.30INR
MARUTI SUZUKI INDIA LTD 17,053,250 482,648,782 8.16INR
NAGARJUNA CONSTRUCTION/DEMAT. 18,900,000 42,720,411 0.72INR
NOIDA TOLLBRIDGE/DEMATERIAL. 8,280,000 4,920,274 0.08INR
OPTO CIRCUITS INDIALTD/DEMAT. 8,294,481 51,241,744 0.87INR
PENINSULA LAND LTD 4,462,145 5,928,504 0.10INR
POWER GRID CORP. OF INDIALTD 20,715,496 47,335,024 0.80INR
PTC INDIA LTD 2,653,745 4,962,932 0.08INR
PURAVANKARA PROJECTSLTD 8,405,470 20,393,997 0.34INR
RADICO KHAITAN LTD/DEMAT. 11,000,000 32,127,986 0.54INR
RELIANCE INDUSTRIES/DEMAT. 201,457 4,739,280 0.08INR
Description Currency Evaluation % netassets
Quantity/Facevalue
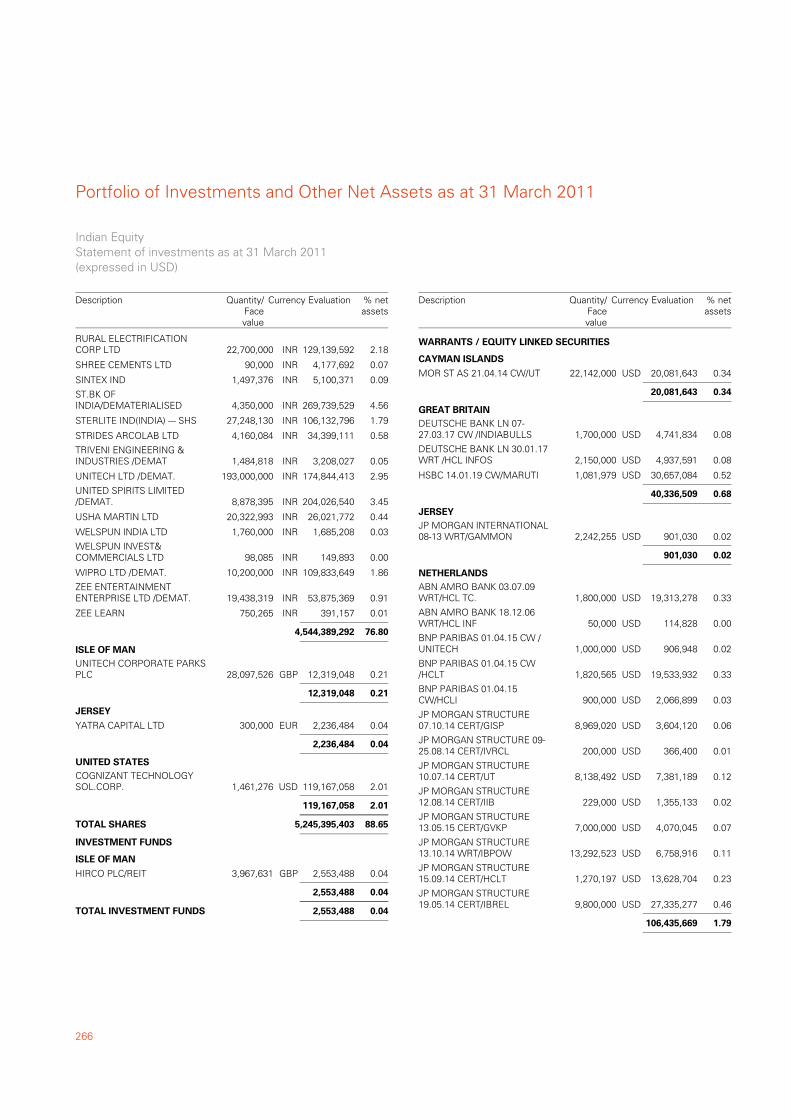
Portfolio of Investments and Other Net Assets as at 31 March 2011
266
RURAL ELECTRIFICATIONCORP LTD 22,700,000 129,139,592 2.18INR
SHREE CEMENTS LTD 90,000 4,177,692 0.07INR
SINTEX IND 1,497,376 5,100,371 0.09INR
ST.BK OFINDIA/DEMATERIALISED 4,350,000 269,739,529 4.56INR
STERLITE IND(INDIA) --- SHS 27,248,130 106,132,796 1.79INR
STRIDES ARCOLAB LTD 4,160,084 34,399,111 0.58INR
TRIVENI ENGINEERING &INDUSTRIES /DEMAT 1,484,818 3,208,027 0.05INR
UNITECH LTD /DEMAT. 193,000,000 174,844,413 2.95INR
UNITED SPIRITS LIMITED/DEMAT. 8,878,395 204,026,540 3.45INR
USHA MARTIN LTD 20,322,993 26,021,772 0.44INR
WELSPUN INDIA LTD 1,760,000 1,685,208 0.03INR
WELSPUN INVEST&COMMERCIALS LTD 98,085 149,893 0.00INR
WIPRO LTD /DEMAT. 10,200,000 109,833,649 1.86INR
ZEE ENTERTAINMENTENTERPRISE LTD /DEMAT. 19,438,319 53,875,369 0.91INR
ZEE LEARN 750,265 391,157 0.01INR
4,544,389,292 76.80
UNITECH CORPORATE PARKSPLC 28,097,526 12,319,048 0.21GBP
ISLE OF MAN
12,319,048 0.21
YATRA CAPITAL LTD 300,000 2,236,484 0.04EUR
JERSEY
2,236,484 0.04
COGNIZANT TECHNOLOGYSOL.CORP. 1,461,276 119,167,058 2.01USD
UNITED STATES
119,167,058 2.01
88.655,245,395,403TOTAL SHARES
HIRCO PLC/REIT 3,967,631 2,553,488 0.04GBP
INVESTMENT FUNDS
ISLE OF MAN
2,553,488 0.04
0.042,553,488TOTAL INVESTMENT FUNDS
Indian EquityStatement of investments as at 31 March 2011(expressed in USD)
Description Currency Evaluation % netassets
Quantity/Facevalue
MOR ST AS 21.04.14 CW/UT 22,142,000 20,081,643 0.34USD
WARRANTS / EQUITY LINKED SECURITIES
CAYMAN ISLANDS
20,081,643 0.34
DEUTSCHE BANK LN 07-27.03.17 CW /INDIABULLS 1,700,000 4,741,834 0.08USD
GREAT BRITAIN
DEUTSCHE BANK LN 30.01.17WRT /HCL INFOS 2,150,000 4,937,591 0.08USD
HSBC 14.01.19 CW/MARUTI 1,081,979 30,657,084 0.52USD
40,336,509 0.68
JP MORGAN INTERNATIONAL08-13 WRT/GAMMON 2,242,255 901,030 0.02USD
JERSEY
901,030 0.02
ABN AMRO BANK 03.07.09WRT/HCL TC. 1,800,000 19,313,278 0.33USD
NETHERLANDS
ABN AMRO BANK 18.12.06WRT/HCL INF 50,000 114,828 0.00USD
BNP PARIBAS 01.04.15 CW /UNITECH 1,000,000 906,948 0.02USD
BNP PARIBAS 01.04.15 CW/HCLT 1,820,565 19,533,932 0.33USD
BNP PARIBAS 01.04.15CW/HCLI 900,000 2,066,899 0.03USD
JP MORGAN STRUCTURE07.10.14 CERT/GISP 8,969,020 3,604,120 0.06USD
JP MORGAN STRUCTURE 09-25.08.14 CERT/IVRCL 200,000 366,400 0.01USD
JP MORGAN STRUCTURE10.07.14 CERT/UT 8,138,492 7,381,189 0.12USD
JP MORGAN STRUCTURE12.08.14 CERT/IIB 229,000 1,355,133 0.02USD
JP MORGAN STRUCTURE13.05.15 CERT/GVKP 7,000,000 4,070,045 0.07USD
JP MORGAN STRUCTURE13.10.14 WRT/IBPOW 13,292,523 6,758,916 0.11USD
JP MORGAN STRUCTURE15.09.14 CERT/HCLT 1,270,197 13,628,704 0.23USD
JP MORGAN STRUCTURE19.05.14 CERT/IBREL 9,800,000 27,335,277 0.46USD
106,435,669 1.79
Description Currency Evaluation % netassets
Quantity/Facevalue
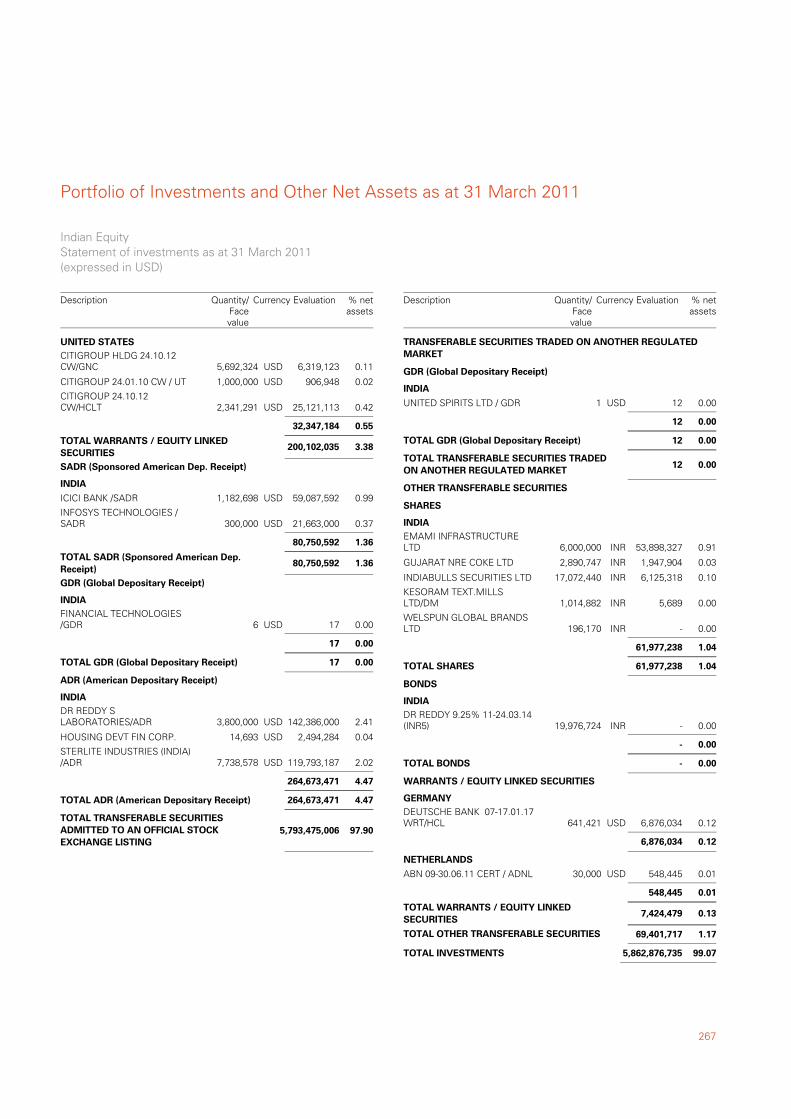
267
Portfolio of Investments and Other Net Assets as at 31 March 2011
CITIGROUP HLDG 24.10.12CW/GNC 5,692,324 6,319,123 0.11USD
UNITED STATES
CITIGROUP 24.01.10 CW / UT 1,000,000 906,948 0.02USD
CITIGROUP 24.10.12CW/HCLT 2,341,291 25,121,113 0.42USD
32,347,184 0.55
3.38200,102,035TOTAL WARRANTS / EQUITY LINKEDSECURITIES
ICICI BANK /SADR 1,182,698 59,087,592 0.99USD
SADR (Sponsored American Dep. Receipt)
INDIA
INFOSYS TECHNOLOGIES /SADR 300,000 21,663,000 0.37USD
80,750,592 1.36
1.3680,750,592TOTAL SADR (Sponsored American Dep.Receipt)
FINANCIAL TECHNOLOGIES/GDR 6 17 0.00USD
GDR (Global Depositary Receipt)
INDIA
17 0.00
0.0017TOTAL GDR (Global Depositary Receipt)
DR REDDY SLABORATORIES/ADR 3,800,000 142,386,000 2.41USD
ADR (American Depositary Receipt)
INDIA
HOUSING DEVT FIN CORP. 14,693 2,494,284 0.04USD
STERLITE INDUSTRIES (INDIA)/ADR 7,738,578 119,793,187 2.02USD
264,673,471 4.47
4.47264,673,471TOTAL ADR (American Depositary Receipt)
97.90TOTAL TRANSFERABLE SECURITIESADMITTED TO AN OFFICIAL STOCKEXCHANGE LISTING
5,793,475,006
Indian EquityStatement of investments as at 31 March 2011(expressed in USD)
Description Currency Evaluation % netassets
Quantity/Facevalue
UNITED SPIRITS LTD / GDR 1 12 0.00USD
TRANSFERABLE SECURITIES TRADED ON ANOTHER REGULATEDMARKET
GDR (Global Depositary Receipt)
INDIA
12 0.00
0.0012TOTAL GDR (Global Depositary Receipt)
0.00TOTAL TRANSFERABLE SECURITIES TRADEDON ANOTHER REGULATED MARKET
12
EMAMI INFRASTRUCTURELTD 6,000,000 53,898,327 0.91INR
OTHER TRANSFERABLE SECURITIES
SHARES
INDIA
GUJARAT NRE COKE LTD 2,890,747 1,947,904 0.03INR
INDIABULLS SECURITIES LTD 17,072,440 6,125,318 0.10INR
KESORAM TEXT.MILLSLTD/DM 1,014,882 5,689 0.00INR
WELSPUN GLOBAL BRANDSLTD 196,170 - 0.00INR
61,977,238 1.04
1.0461,977,238TOTAL SHARES
DR REDDY 9.25% 11-24.03.14(INR5) 19,976,724 - 0.00INR
BONDS
INDIA
- 0.00
0.00-TOTAL BONDS
DEUTSCHE BANK 07-17.01.17WRT/HCL 641,421 6,876,034 0.12USD
WARRANTS / EQUITY LINKED SECURITIES
GERMANY
6,876,034 0.12
ABN 09-30.06.11 CERT / ADNL 30,000 548,445 0.01USD
NETHERLANDS
548,445 0.01
0.137,424,479TOTAL WARRANTS / EQUITY LINKEDSECURITIES
1.17TOTAL OTHER TRANSFERABLE SECURITIES 69,401,717
99.07TOTAL INVESTMENTS 5,862,876,735
Description Currency Evaluation % netassets
Quantity/Facevalue
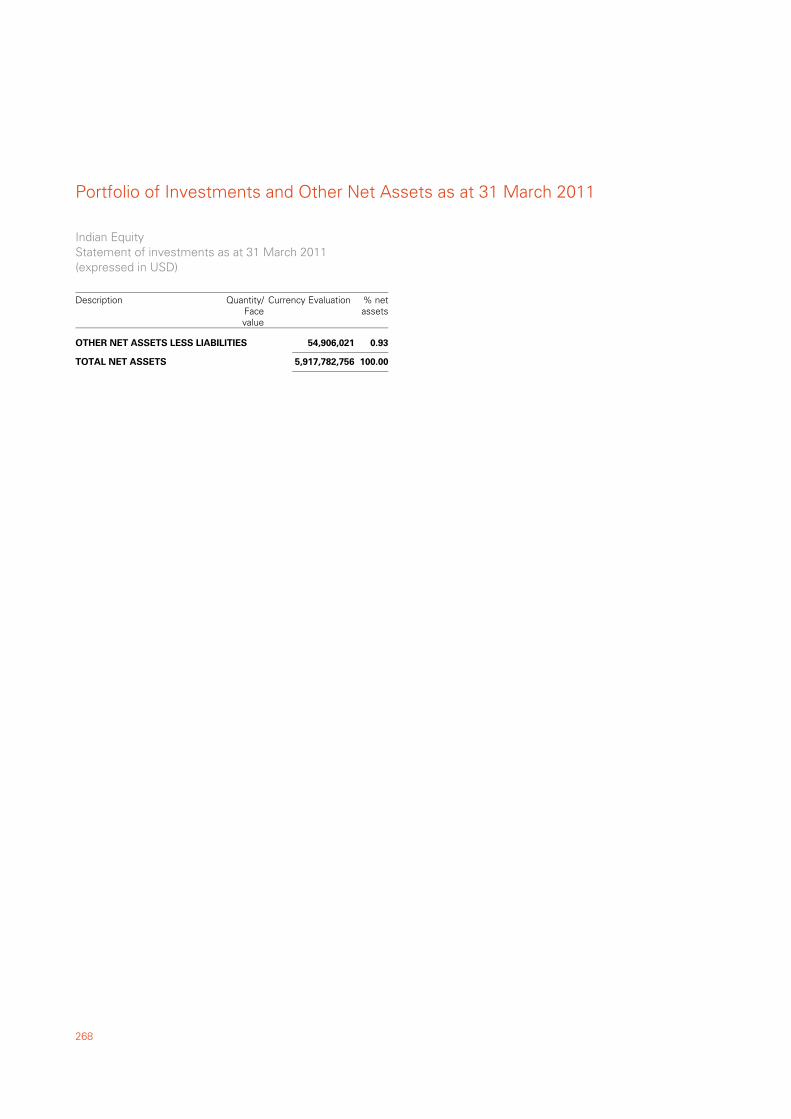
Portfolio of Investments and Other Net Assets as at 31 March 2011
268
0.93OTHER NET ASSETS LESS LIABILITIES 54,906,021
100.00TOTAL NET ASSETS 5,917,782,756
Indian EquityStatement of investments as at 31 March 2011(expressed in USD)
Description Currency Evaluation % netassets
Quantity/Facevalue
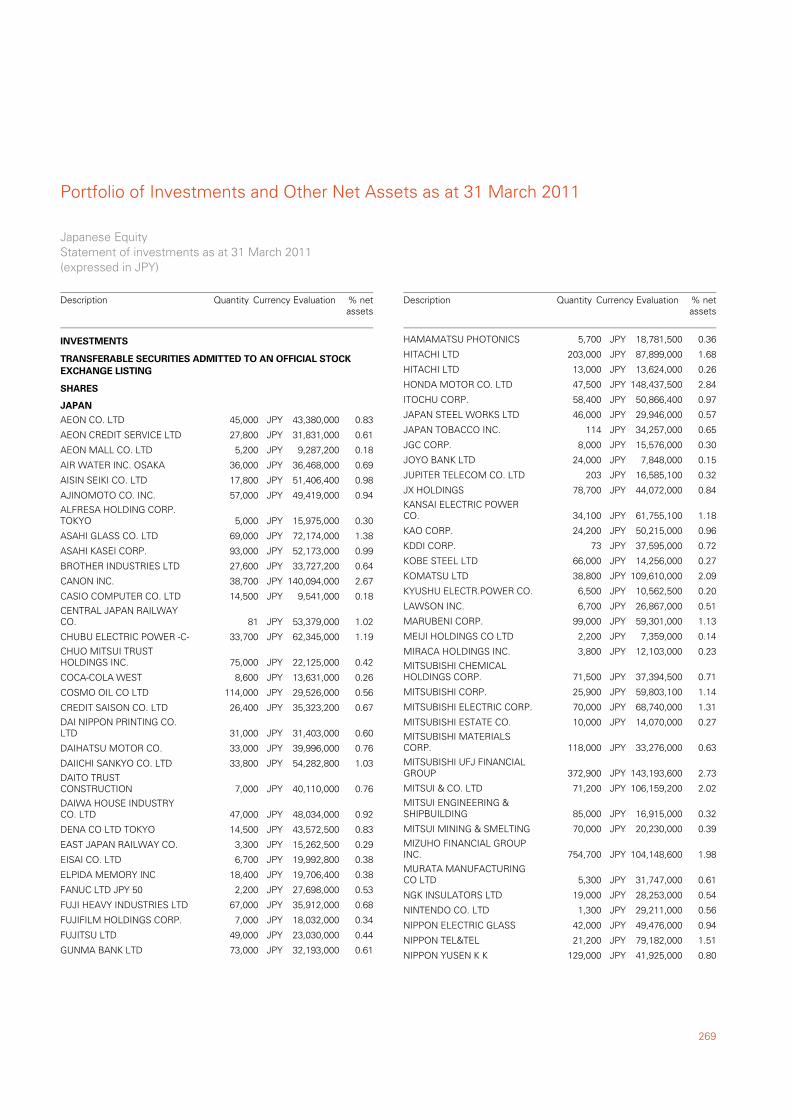
269
Portfolio of Investments and Other Net Assets as at 31 March 2011
AEON CO. LTD 45,000 43,380,000 0.83JPY
TRANSFERABLE SECURITIES ADMITTED TO AN OFFICIAL STOCKEXCHANGE LISTING
SHARES
JAPAN
AEON CREDIT SERVICE LTD 27,800 31,831,000 0.61JPY
AEON MALL CO. LTD 5,200 9,287,200 0.18JPY
AIR WATER INC. OSAKA 36,000 36,468,000 0.69JPY
AISIN SEIKI CO. LTD 17,800 51,406,400 0.98JPY
AJINOMOTO CO. INC. 57,000 49,419,000 0.94JPY
ALFRESA HOLDING CORP.TOKYO 5,000 15,975,000 0.30JPY
ASAHI GLASS CO. LTD 69,000 72,174,000 1.38JPY
ASAHI KASEI CORP. 93,000 52,173,000 0.99JPY
BROTHER INDUSTRIES LTD 27,600 33,727,200 0.64JPY
CANON INC. 38,700 140,094,000 2.67JPY
CASIO COMPUTER CO. LTD 14,500 9,541,000 0.18JPY
CENTRAL JAPAN RAILWAYCO. 81 53,379,000 1.02JPY
CHUBU ELECTRIC POWER -C- 33,700 62,345,000 1.19JPY
CHUO MITSUI TRUSTHOLDINGS INC. 75,000 22,125,000 0.42JPY
COCA-COLA WEST 8,600 13,631,000 0.26JPY
COSMO OIL CO LTD 114,000 29,526,000 0.56JPY
CREDIT SAISON CO. LTD 26,400 35,323,200 0.67JPY
DAI NIPPON PRINTING CO.LTD 31,000 31,403,000 0.60JPY
DAIHATSU MOTOR CO. 33,000 39,996,000 0.76JPY
DAIICHI SANKYO CO. LTD 33,800 54,282,800 1.03JPY
DAITO TRUSTCONSTRUCTION 7,000 40,110,000 0.76JPY
DAIWA HOUSE INDUSTRYCO. LTD 47,000 48,034,000 0.92JPY
DENA CO LTD TOKYO 14,500 43,572,500 0.83JPY
EAST JAPAN RAILWAY CO. 3,300 15,262,500 0.29JPY
EISAI CO. LTD 6,700 19,992,800 0.38JPY
ELPIDA MEMORY INC 18,400 19,706,400 0.38JPY
FANUC LTD JPY 50 2,200 27,698,000 0.53JPY
FUJI HEAVY INDUSTRIES LTD 67,000 35,912,000 0.68JPY
FUJIFILM HOLDINGS CORP. 7,000 18,032,000 0.34JPY
FUJITSU LTD 49,000 23,030,000 0.44JPY
GUNMA BANK LTD 73,000 32,193,000 0.61JPY
INVESTMENTS
Japanese EquityStatement of investments as at 31 March 2011(expressed in JPY)
Description Quantity Currency Evaluation % netassets
HAMAMATSU PHOTONICS 5,700 18,781,500 0.36JPY
HITACHI LTD 203,000 87,899,000 1.68JPY
HITACHI LTD 13,000 13,624,000 0.26JPY
HONDA MOTOR CO. LTD 47,500 148,437,500 2.84JPY
ITOCHU CORP. 58,400 50,866,400 0.97JPY
JAPAN STEEL WORKS LTD 46,000 29,946,000 0.57JPY
JAPAN TOBACCO INC. 114 34,257,000 0.65JPY
JGC CORP. 8,000 15,576,000 0.30JPY
JOYO BANK LTD 24,000 7,848,000 0.15JPY
JUPITER TELECOM CO. LTD 203 16,585,100 0.32JPY
JX HOLDINGS 78,700 44,072,000 0.84JPY
KANSAI ELECTRIC POWERCO. 34,100 61,755,100 1.18JPY
KAO CORP. 24,200 50,215,000 0.96JPY
KDDI CORP. 73 37,595,000 0.72JPY
KOBE STEEL LTD 66,000 14,256,000 0.27JPY
KOMATSU LTD 38,800 109,610,000 2.09JPY
KYUSHU ELECTR.POWER CO. 6,500 10,562,500 0.20JPY
LAWSON INC. 6,700 26,867,000 0.51JPY
MARUBENI CORP. 99,000 59,301,000 1.13JPY
MEIJI HOLDINGS CO LTD 2,200 7,359,000 0.14JPY
MIRACA HOLDINGS INC. 3,800 12,103,000 0.23JPY
MITSUBISHI CHEMICALHOLDINGS CORP. 71,500 37,394,500 0.71JPY
MITSUBISHI CORP. 25,900 59,803,100 1.14JPY
MITSUBISHI ELECTRIC CORP. 70,000 68,740,000 1.31JPY
MITSUBISHI ESTATE CO. 10,000 14,070,000 0.27JPY
MITSUBISHI MATERIALSCORP. 118,000 33,276,000 0.63JPY
MITSUBISHI UFJ FINANCIALGROUP 372,900 143,193,600 2.73JPY
MITSUI & CO. LTD 71,200 106,159,200 2.02JPY
MITSUI ENGINEERING &SHIPBUILDING 85,000 16,915,000 0.32JPY
MITSUI MINING & SMELTING 70,000 20,230,000 0.39JPY
MIZUHO FINANCIAL GROUPINC. 754,700 104,148,600 1.98JPY
MURATA MANUFACTURINGCO LTD 5,300 31,747,000 0.61JPY
NGK INSULATORS LTD 19,000 28,253,000 0.54JPY
NINTENDO CO. LTD 1,300 29,211,000 0.56JPY
NIPPON ELECTRIC GLASS 42,000 49,476,000 0.94JPY
NIPPON TEL&TEL 21,200 79,182,000 1.51JPY
NIPPON YUSEN K K 129,000 41,925,000 0.80JPY
Description Quantity Currency Evaluation % netassets
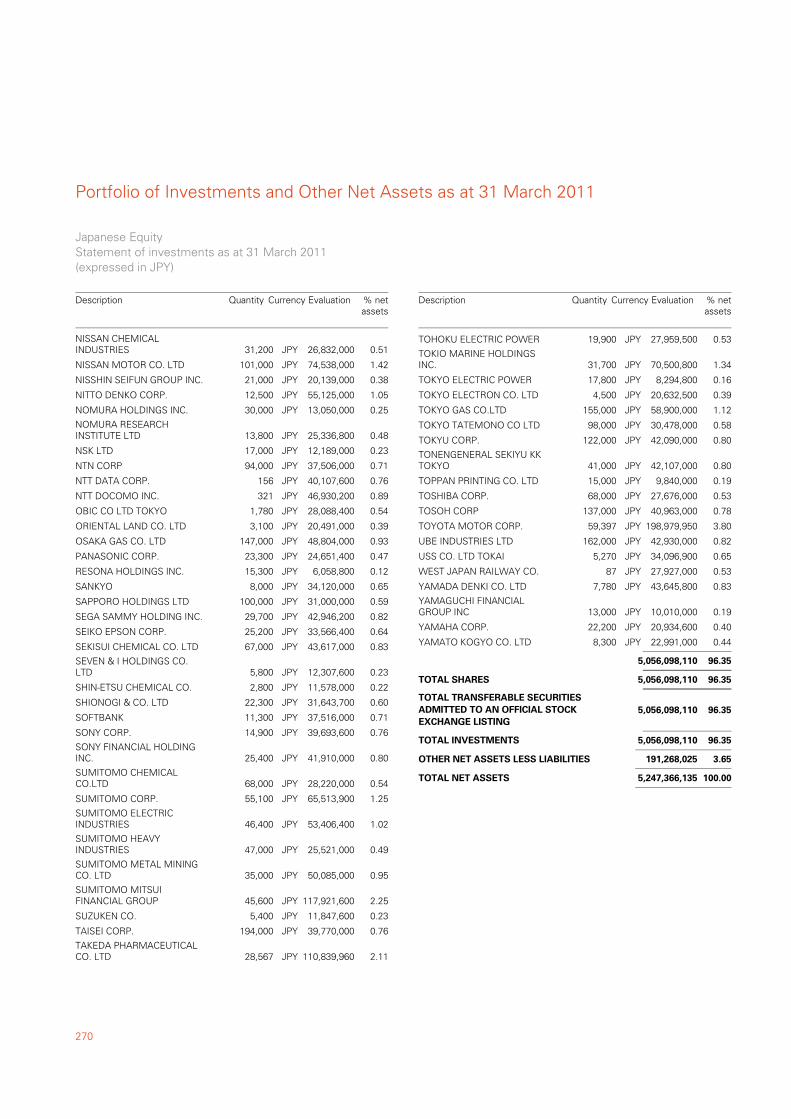
Portfolio of Investments and Other Net Assets as at 31 March 2011
270
NISSAN CHEMICALINDUSTRIES 31,200 26,832,000 0.51JPY
NISSAN MOTOR CO. LTD 101,000 74,538,000 1.42JPY
NISSHIN SEIFUN GROUP INC. 21,000 20,139,000 0.38JPY
NITTO DENKO CORP. 12,500 55,125,000 1.05JPY
NOMURA HOLDINGS INC. 30,000 13,050,000 0.25JPY
NOMURA RESEARCHINSTITUTE LTD 13,800 25,336,800 0.48JPY
NSK LTD 17,000 12,189,000 0.23JPY
NTN CORP 94,000 37,506,000 0.71JPY
NTT DATA CORP. 156 40,107,600 0.76JPY
NTT DOCOMO INC. 321 46,930,200 0.89JPY
OBIC CO LTD TOKYO 1,780 28,088,400 0.54JPY
ORIENTAL LAND CO. LTD 3,100 20,491,000 0.39JPY
OSAKA GAS CO. LTD 147,000 48,804,000 0.93JPY
PANASONIC CORP. 23,300 24,651,400 0.47JPY
RESONA HOLDINGS INC. 15,300 6,058,800 0.12JPY
SANKYO 8,000 34,120,000 0.65JPY
SAPPORO HOLDINGS LTD 100,000 31,000,000 0.59JPY
SEGA SAMMY HOLDING INC. 29,700 42,946,200 0.82JPY
SEIKO EPSON CORP. 25,200 33,566,400 0.64JPY
SEKISUI CHEMICAL CO. LTD 67,000 43,617,000 0.83JPY
SEVEN & I HOLDINGS CO.LTD 5,800 12,307,600 0.23JPY
SHIN-ETSU CHEMICAL CO. 2,800 11,578,000 0.22JPY
SHIONOGI & CO. LTD 22,300 31,643,700 0.60JPY
SOFTBANK 11,300 37,516,000 0.71JPY
SONY CORP. 14,900 39,693,600 0.76JPY
SONY FINANCIAL HOLDINGINC. 25,400 41,910,000 0.80JPY
SUMITOMO CHEMICALCO.LTD 68,000 28,220,000 0.54JPY
SUMITOMO CORP. 55,100 65,513,900 1.25JPY
SUMITOMO ELECTRICINDUSTRIES 46,400 53,406,400 1.02JPY
SUMITOMO HEAVYINDUSTRIES 47,000 25,521,000 0.49JPY
SUMITOMO METAL MININGCO. LTD 35,000 50,085,000 0.95JPY
SUMITOMO MITSUIFINANCIAL GROUP 45,600 117,921,600 2.25JPY
SUZUKEN CO. 5,400 11,847,600 0.23JPY
TAISEI CORP. 194,000 39,770,000 0.76JPY
TAKEDA PHARMACEUTICALCO. LTD 28,567 110,839,960 2.11JPY
Japanese EquityStatement of investments as at 31 March 2011(expressed in JPY)
Description Quantity Currency Evaluation % netassets
TOHOKU ELECTRIC POWER 19,900 27,959,500 0.53JPY
TOKIO MARINE HOLDINGSINC. 31,700 70,500,800 1.34JPY
TOKYO ELECTRIC POWER 17,800 8,294,800 0.16JPY
TOKYO ELECTRON CO. LTD 4,500 20,632,500 0.39JPY
TOKYO GAS CO.LTD 155,000 58,900,000 1.12JPY
TOKYO TATEMONO CO LTD 98,000 30,478,000 0.58JPY
TOKYU CORP. 122,000 42,090,000 0.80JPY
TONENGENERAL SEKIYU KKTOKYO 41,000 42,107,000 0.80JPY
TOPPAN PRINTING CO. LTD 15,000 9,840,000 0.19JPY
TOSHIBA CORP. 68,000 27,676,000 0.53JPY
TOSOH CORP 137,000 40,963,000 0.78JPY
TOYOTA MOTOR CORP. 59,397 198,979,950 3.80JPY
UBE INDUSTRIES LTD 162,000 42,930,000 0.82JPY
USS CO. LTD TOKAI 5,270 34,096,900 0.65JPY
WEST JAPAN RAILWAY CO. 87 27,927,000 0.53JPY
YAMADA DENKI CO. LTD 7,780 43,645,800 0.83JPY
YAMAGUCHI FINANCIALGROUP INC 13,000 10,010,000 0.19JPY
YAMAHA CORP. 22,200 20,934,600 0.40JPY
YAMATO KOGYO CO. LTD 8,300 22,991,000 0.44JPY
5,056,098,110 96.35
96.355,056,098,110TOTAL SHARES
96.35TOTAL TRANSFERABLE SECURITIESADMITTED TO AN OFFICIAL STOCKEXCHANGE LISTING
5,056,098,110
96.35TOTAL INVESTMENTS 5,056,098,110
3.65OTHER NET ASSETS LESS LIABILITIES 191,268,025
100.00TOTAL NET ASSETS 5,247,366,135
Description Quantity Currency Evaluation % netassets
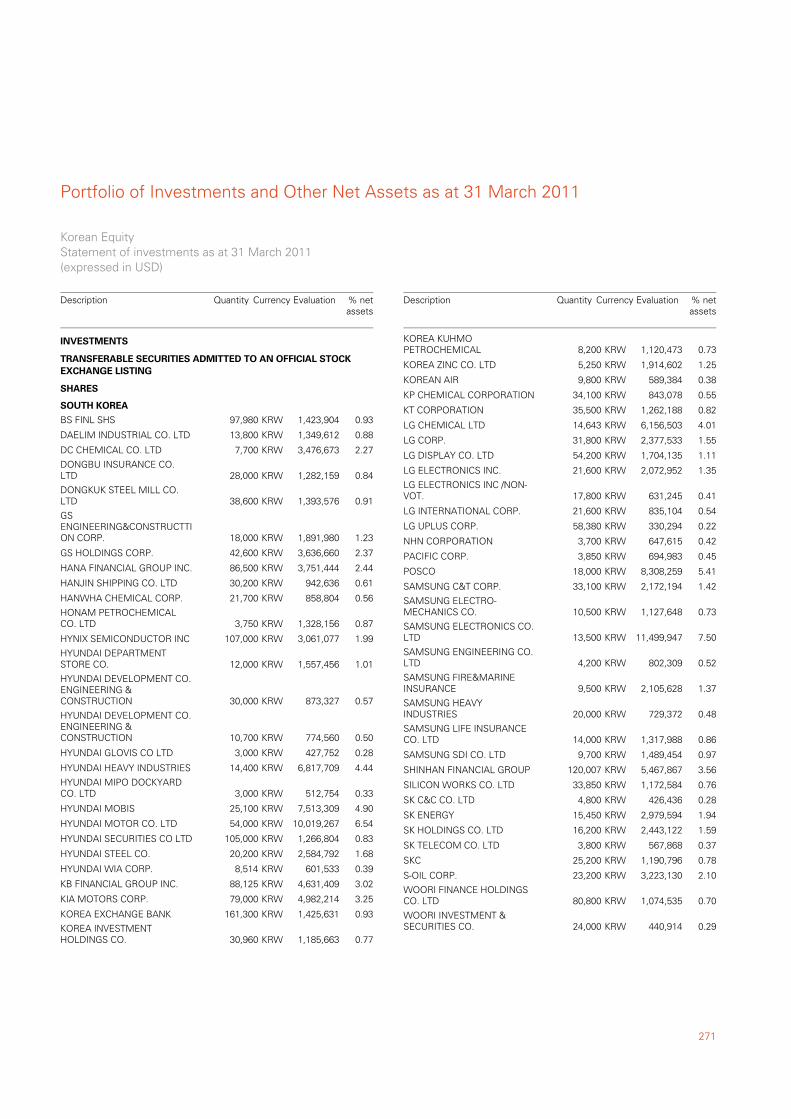
271
Portfolio of Investments and Other Net Assets as at 31 March 2011
BS FINL SHS 97,980 1,423,904 0.93KRW
TRANSFERABLE SECURITIES ADMITTED TO AN OFFICIAL STOCKEXCHANGE LISTING
SHARES
SOUTH KOREA
DAELIM INDUSTRIAL CO. LTD 13,800 1,349,612 0.88KRW
DC CHEMICAL CO. LTD 7,700 3,476,673 2.27KRW
DONGBU INSURANCE CO.LTD 28,000 1,282,159 0.84KRW
DONGKUK STEEL MILL CO.LTD 38,600 1,393,576 0.91KRW
GSENGINEERING&CONSTRUCTTION CORP. 18,000 1,891,980 1.23KRW
GS HOLDINGS CORP. 42,600 3,636,660 2.37KRW
HANA FINANCIAL GROUP INC. 86,500 3,751,444 2.44KRW
HANJIN SHIPPING CO. LTD 30,200 942,636 0.61KRW
HANWHA CHEMICAL CORP. 21,700 858,804 0.56KRW
HONAM PETROCHEMICALCO. LTD 3,750 1,328,156 0.87KRW
HYNIX SEMICONDUCTOR INC 107,000 3,061,077 1.99KRW
HYUNDAI DEPARTMENTSTORE CO. 12,000 1,557,456 1.01KRW
HYUNDAI DEVELOPMENT CO.ENGINEERING &CONSTRUCTION 30,000 873,327 0.57KRW
HYUNDAI DEVELOPMENT CO.ENGINEERING &CONSTRUCTION 10,700 774,560 0.50KRW
HYUNDAI GLOVIS CO LTD 3,000 427,752 0.28KRW
HYUNDAI HEAVY INDUSTRIES 14,400 6,817,709 4.44KRW
HYUNDAI MIPO DOCKYARDCO. LTD 3,000 512,754 0.33KRW
HYUNDAI MOBIS 25,100 7,513,309 4.90KRW
HYUNDAI MOTOR CO. LTD 54,000 10,019,267 6.54KRW
HYUNDAI SECURITIES CO LTD 105,000 1,266,804 0.83KRW
HYUNDAI STEEL CO. 20,200 2,584,792 1.68KRW
HYUNDAI WIA CORP. 8,514 601,533 0.39KRW
KB FINANCIAL GROUP INC. 88,125 4,631,409 3.02KRW
KIA MOTORS CORP. 79,000 4,982,214 3.25KRW
KOREA EXCHANGE BANK 161,300 1,425,631 0.93KRW
KOREA INVESTMENTHOLDINGS CO. 30,960 1,185,663 0.77KRW
INVESTMENTS
Korean EquityStatement of investments as at 31 March 2011(expressed in USD)
Description Quantity Currency Evaluation % netassets
KOREA KUHMOPETROCHEMICAL 8,200 1,120,473 0.73KRW
KOREA ZINC CO. LTD 5,250 1,914,602 1.25KRW
KOREAN AIR 9,800 589,384 0.38KRW
KP CHEMICAL CORPORATION 34,100 843,078 0.55KRW
KT CORPORATION 35,500 1,262,188 0.82KRW
LG CHEMICAL LTD 14,643 6,156,503 4.01KRW
LG CORP. 31,800 2,377,533 1.55KRW
LG DISPLAY CO. LTD 54,200 1,704,135 1.11KRW
LG ELECTRONICS INC. 21,600 2,072,952 1.35KRW
LG ELECTRONICS INC /NON-VOT. 17,800 631,245 0.41KRW
LG INTERNATIONAL CORP. 21,600 835,104 0.54KRW
LG UPLUS CORP. 58,380 330,294 0.22KRW
NHN CORPORATION 3,700 647,615 0.42KRW
PACIFIC CORP. 3,850 694,983 0.45KRW
POSCO 18,000 8,308,259 5.41KRW
SAMSUNG C&T CORP. 33,100 2,172,194 1.42KRW
SAMSUNG ELECTRO-MECHANICS CO. 10,500 1,127,648 0.73KRW
SAMSUNG ELECTRONICS CO.LTD 13,500 11,499,947 7.50KRW
SAMSUNG ENGINEERING CO.LTD 4,200 802,309 0.52KRW
SAMSUNG FIRE&MARINEINSURANCE 9,500 2,105,628 1.37KRW
SAMSUNG HEAVYINDUSTRIES 20,000 729,372 0.48KRW
SAMSUNG LIFE INSURANCECO. LTD 14,000 1,317,988 0.86KRW
SAMSUNG SDI CO. LTD 9,700 1,489,454 0.97KRW
SHINHAN FINANCIAL GROUP 120,007 5,467,867 3.56KRW
SILICON WORKS CO. LTD 33,850 1,172,584 0.76KRW
SK C&C CO. LTD 4,800 426,436 0.28KRW
SK ENERGY 15,450 2,979,594 1.94KRW
SK HOLDINGS CO. LTD 16,200 2,443,122 1.59KRW
SK TELECOM CO. LTD 3,800 567,868 0.37KRW
SKC 25,200 1,190,796 0.78KRW
S-OIL CORP. 23,200 3,223,130 2.10KRW
WOORI FINANCE HOLDINGSCO. LTD 80,800 1,074,535 0.70KRW
WOORI INVESTMENT &SECURITIES CO. 24,000 440,914 0.29KRW
Description Quantity Currency Evaluation % netassets
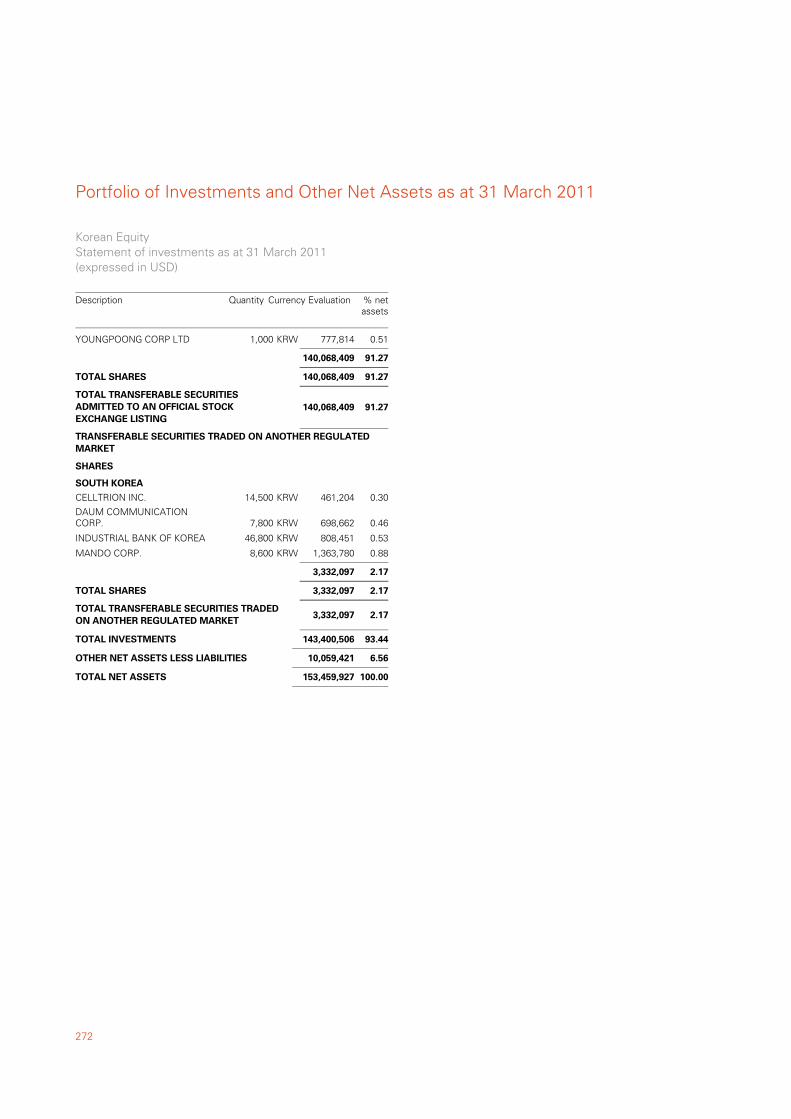
Portfolio of Investments and Other Net Assets as at 31 March 2011
272
YOUNGPOONG CORP LTD 1,000 777,814 0.51KRW
140,068,409 91.27
91.27140,068,409TOTAL SHARES
91.27TOTAL TRANSFERABLE SECURITIESADMITTED TO AN OFFICIAL STOCKEXCHANGE LISTING
140,068,409
CELLTRION INC. 14,500 461,204 0.30KRW
TRANSFERABLE SECURITIES TRADED ON ANOTHER REGULATEDMARKET
SHARES
SOUTH KOREA
DAUM COMMUNICATIONCORP. 7,800 698,662 0.46KRW
INDUSTRIAL BANK OF KOREA 46,800 808,451 0.53KRW
MANDO CORP. 8,600 1,363,780 0.88KRW
3,332,097 2.17
2.173,332,097TOTAL SHARES
2.17TOTAL TRANSFERABLE SECURITIES TRADEDON ANOTHER REGULATED MARKET
3,332,097
93.44TOTAL INVESTMENTS 143,400,506
6.56OTHER NET ASSETS LESS LIABILITIES 10,059,421
100.00TOTAL NET ASSETS 153,459,927
Korean EquityStatement of investments as at 31 March 2011(expressed in USD)
Description Quantity Currency Evaluation % netassets
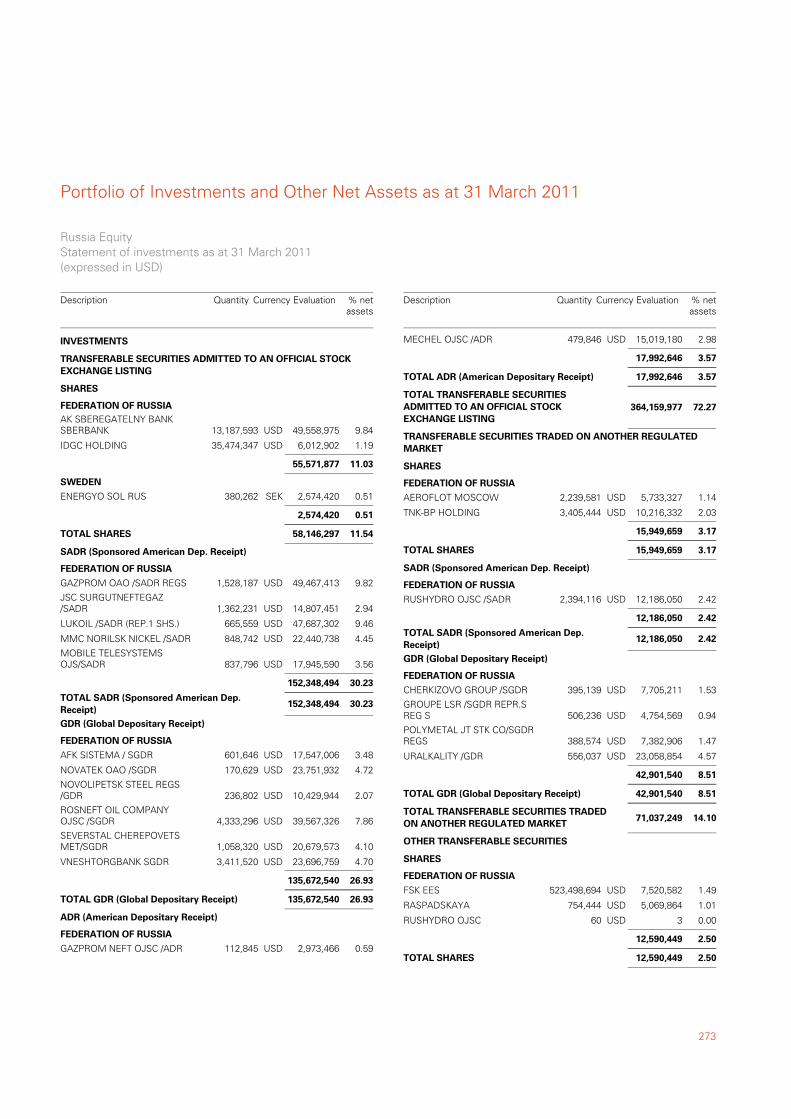
273
Portfolio of Investments and Other Net Assets as at 31 March 2011
AK SBEREGATELNY BANKSBERBANK 13,187,593 49,558,975 9.84USD
TRANSFERABLE SECURITIES ADMITTED TO AN OFFICIAL STOCKEXCHANGE LISTING
SHARES
FEDERATION OF RUSSIA
IDGC HOLDING 35,474,347 6,012,902 1.19USD
55,571,877 11.03
ENERGYO SOL RUS 380,262 2,574,420 0.51SEK
SWEDEN
2,574,420 0.51
11.5458,146,297TOTAL SHARES
GAZPROM OAO /SADR REGS 1,528,187 49,467,413 9.82USD
SADR (Sponsored American Dep. Receipt)
FEDERATION OF RUSSIA
JSC SURGUTNEFTEGAZ/SADR 1,362,231 14,807,451 2.94USD
LUKOIL /SADR (REP.1 SHS.) 665,559 47,687,302 9.46USD
MMC NORILSK NICKEL /SADR 848,742 22,440,738 4.45USD
MOBILE TELESYSTEMSOJS/SADR 837,796 17,945,590 3.56USD
152,348,494 30.23
30.23152,348,494TOTAL SADR (Sponsored American Dep.Receipt)
AFK SISTEMA / SGDR 601,646 17,547,006 3.48USD
GDR (Global Depositary Receipt)
FEDERATION OF RUSSIA
NOVATEK OAO /SGDR 170,629 23,751,932 4.72USD
NOVOLIPETSK STEEL REGS/GDR 236,802 10,429,944 2.07USD
ROSNEFT OIL COMPANYOJSC /SGDR 4,333,296 39,567,326 7.86USD
SEVERSTAL CHEREPOVETSMET/SGDR 1,058,320 20,679,573 4.10USD
VNESHTORGBANK SGDR 3,411,520 23,696,759 4.70USD
135,672,540 26.93
26.93135,672,540TOTAL GDR (Global Depositary Receipt)
GAZPROM NEFT OJSC /ADR 112,845 2,973,466 0.59USD
ADR (American Depositary Receipt)
FEDERATION OF RUSSIA
INVESTMENTS
Russia EquityStatement of investments as at 31 March 2011(expressed in USD)
Description Quantity Currency Evaluation % netassets
MECHEL OJSC /ADR 479,846 15,019,180 2.98USD
17,992,646 3.57
3.5717,992,646TOTAL ADR (American Depositary Receipt)
72.27TOTAL TRANSFERABLE SECURITIESADMITTED TO AN OFFICIAL STOCKEXCHANGE LISTING
364,159,977
AEROFLOT MOSCOW 2,239,581 5,733,327 1.14USD
TRANSFERABLE SECURITIES TRADED ON ANOTHER REGULATEDMARKET
SHARES
FEDERATION OF RUSSIA
TNK-BP HOLDING 3,405,444 10,216,332 2.03USD
15,949,659 3.17
3.1715,949,659TOTAL SHARES
RUSHYDRO OJSC /SADR 2,394,116 12,186,050 2.42USD
SADR (Sponsored American Dep. Receipt)
FEDERATION OF RUSSIA
12,186,050 2.42
2.4212,186,050TOTAL SADR (Sponsored American Dep.Receipt)
CHERKIZOVO GROUP /SGDR 395,139 7,705,211 1.53USD
GDR (Global Depositary Receipt)
FEDERATION OF RUSSIA
GROUPE LSR /SGDR REPR.SREG S 506,236 4,754,569 0.94USD
POLYMETAL JT STK CO/SGDRREGS 388,574 7,382,906 1.47USD
URALKALITY /GDR 556,037 23,058,854 4.57USD
42,901,540 8.51
8.5142,901,540TOTAL GDR (Global Depositary Receipt)
14.10TOTAL TRANSFERABLE SECURITIES TRADEDON ANOTHER REGULATED MARKET
71,037,249
FSK EES 523,498,694 7,520,582 1.49USD
OTHER TRANSFERABLE SECURITIES
SHARES
FEDERATION OF RUSSIA
RASPADSKAYA 754,444 5,069,864 1.01USD
RUSHYDRO OJSC 60 3 0.00USD
12,590,449 2.50
2.5012,590,449TOTAL SHARES
Description Quantity Currency Evaluation % netassets
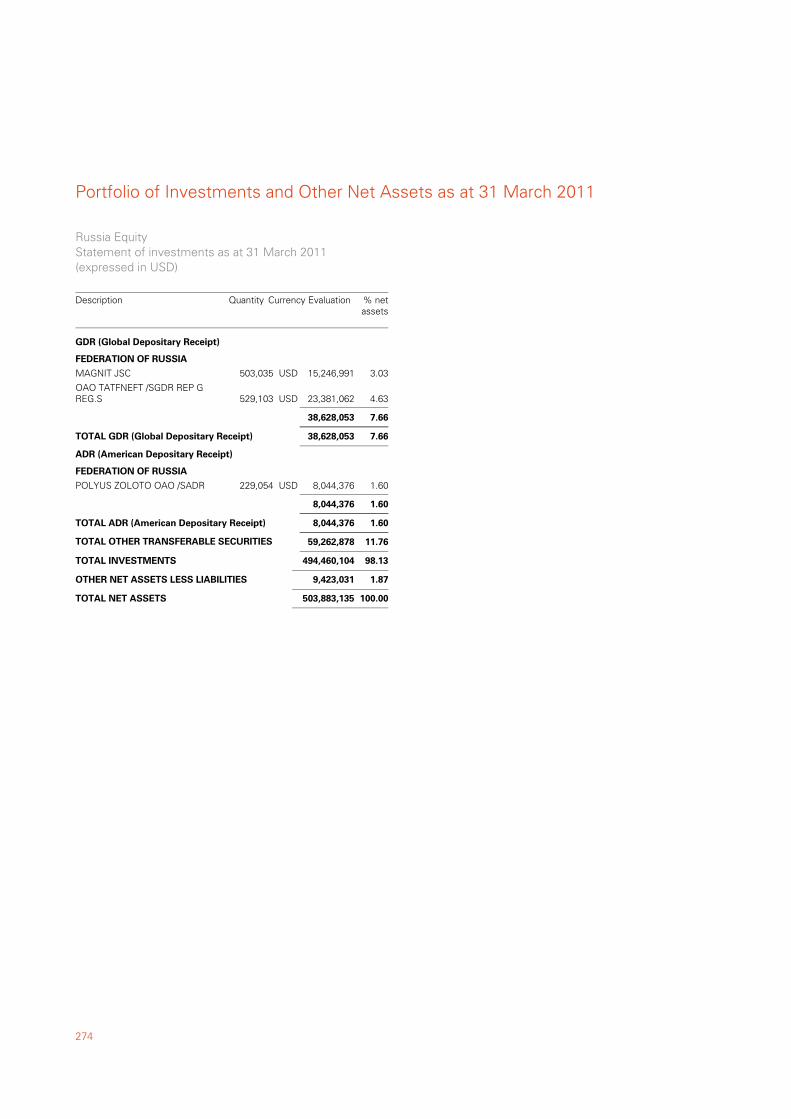
Portfolio of Investments and Other Net Assets as at 31 March 2011
274
MAGNIT JSC 503,035 15,246,991 3.03USD
GDR (Global Depositary Receipt)
FEDERATION OF RUSSIA
OAO TATFNEFT /SGDR REP GREG.S 529,103 23,381,062 4.63USD
38,628,053 7.66
7.6638,628,053TOTAL GDR (Global Depositary Receipt)
POLYUS ZOLOTO OAO /SADR 229,054 8,044,376 1.60USD
ADR (American Depositary Receipt)
FEDERATION OF RUSSIA
8,044,376 1.60
1.608,044,376TOTAL ADR (American Depositary Receipt)
11.76TOTAL OTHER TRANSFERABLE SECURITIES 59,262,878
98.13TOTAL INVESTMENTS 494,460,104
1.87OTHER NET ASSETS LESS LIABILITIES 9,423,031
100.00TOTAL NET ASSETS 503,883,135
Russia EquityStatement of investments as at 31 March 2011(expressed in USD)
Description Quantity Currency Evaluation % netassets
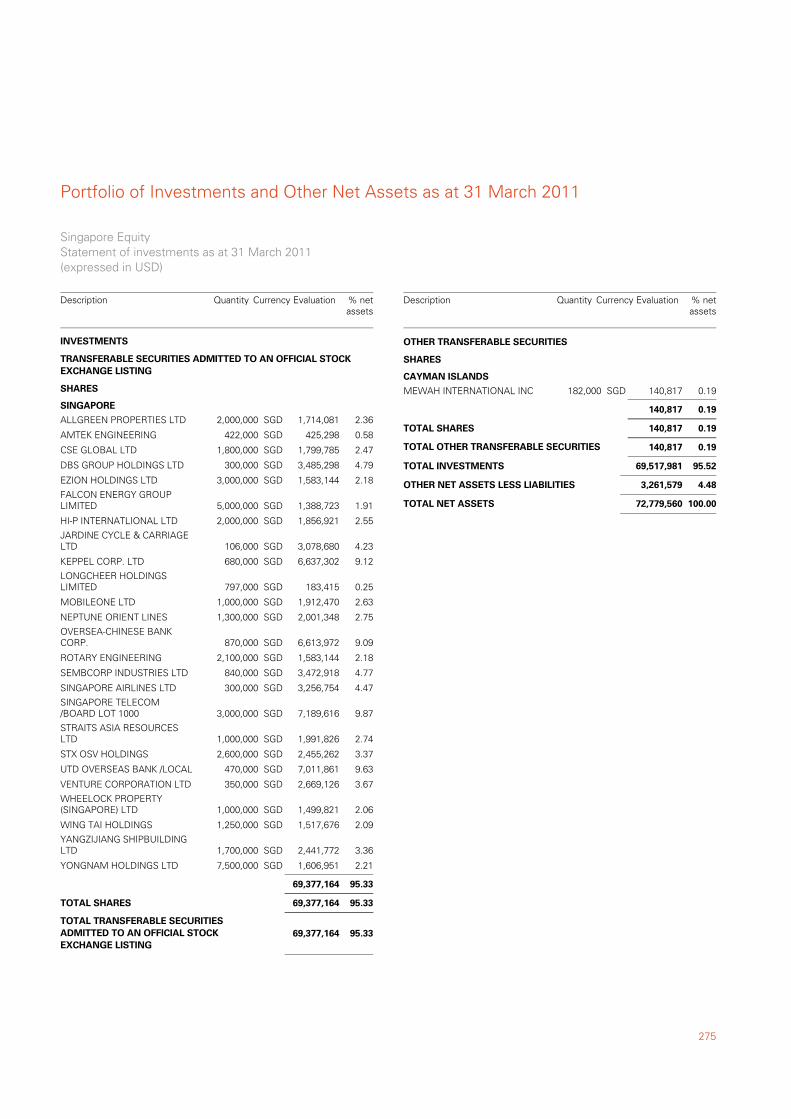
275
Portfolio of Investments and Other Net Assets as at 31 March 2011
ALLGREEN PROPERTIES LTD 2,000,000 1,714,081 2.36SGD
TRANSFERABLE SECURITIES ADMITTED TO AN OFFICIAL STOCKEXCHANGE LISTING
SHARES
SINGAPORE
AMTEK ENGINEERING 422,000 425,298 0.58SGD
CSE GLOBAL LTD 1,800,000 1,799,785 2.47SGD
DBS GROUP HOLDINGS LTD 300,000 3,485,298 4.79SGD
EZION HOLDINGS LTD 3,000,000 1,583,144 2.18SGD
FALCON ENERGY GROUPLIMITED 5,000,000 1,388,723 1.91SGD
HI-P INTERNATLIONAL LTD 2,000,000 1,856,921 2.55SGD
JARDINE CYCLE & CARRIAGELTD 106,000 3,078,680 4.23SGD
KEPPEL CORP. LTD 680,000 6,637,302 9.12SGD
LONGCHEER HOLDINGSLIMITED 797,000 183,415 0.25SGD
MOBILEONE LTD 1,000,000 1,912,470 2.63SGD
NEPTUNE ORIENT LINES 1,300,000 2,001,348 2.75SGD
OVERSEA-CHINESE BANKCORP. 870,000 6,613,972 9.09SGD
ROTARY ENGINEERING 2,100,000 1,583,144 2.18SGD
SEMBCORP INDUSTRIES LTD 840,000 3,472,918 4.77SGD
SINGAPORE AIRLINES LTD 300,000 3,256,754 4.47SGD
SINGAPORE TELECOM/BOARD LOT 1000 3,000,000 7,189,616 9.87SGD
STRAITS ASIA RESOURCESLTD 1,000,000 1,991,826 2.74SGD
STX OSV HOLDINGS 2,600,000 2,455,262 3.37SGD
UTD OVERSEAS BANK /LOCAL 470,000 7,011,861 9.63SGD
VENTURE CORPORATION LTD 350,000 2,669,126 3.67SGD
WHEELOCK PROPERTY(SINGAPORE) LTD 1,000,000 1,499,821 2.06SGD
WING TAI HOLDINGS 1,250,000 1,517,676 2.09SGD
YANGZIJIANG SHIPBUILDINGLTD 1,700,000 2,441,772 3.36SGD
YONGNAM HOLDINGS LTD 7,500,000 1,606,951 2.21SGD
69,377,164 95.33
95.3369,377,164TOTAL SHARES
95.33TOTAL TRANSFERABLE SECURITIESADMITTED TO AN OFFICIAL STOCKEXCHANGE LISTING
69,377,164
INVESTMENTS
Singapore EquityStatement of investments as at 31 March 2011(expressed in USD)
Description Quantity Currency Evaluation % netassets
MEWAH INTERNATIONAL INC 182,000 140,817 0.19SGD
OTHER TRANSFERABLE SECURITIES
SHARES
CAYMAN ISLANDS
140,817 0.19
0.19140,817TOTAL SHARES
0.19TOTAL OTHER TRANSFERABLE SECURITIES 140,817
95.52TOTAL INVESTMENTS 69,517,981
4.48OTHER NET ASSETS LESS LIABILITIES 3,261,579
100.00TOTAL NET ASSETS 72,779,560
Description Quantity Currency Evaluation % netassets
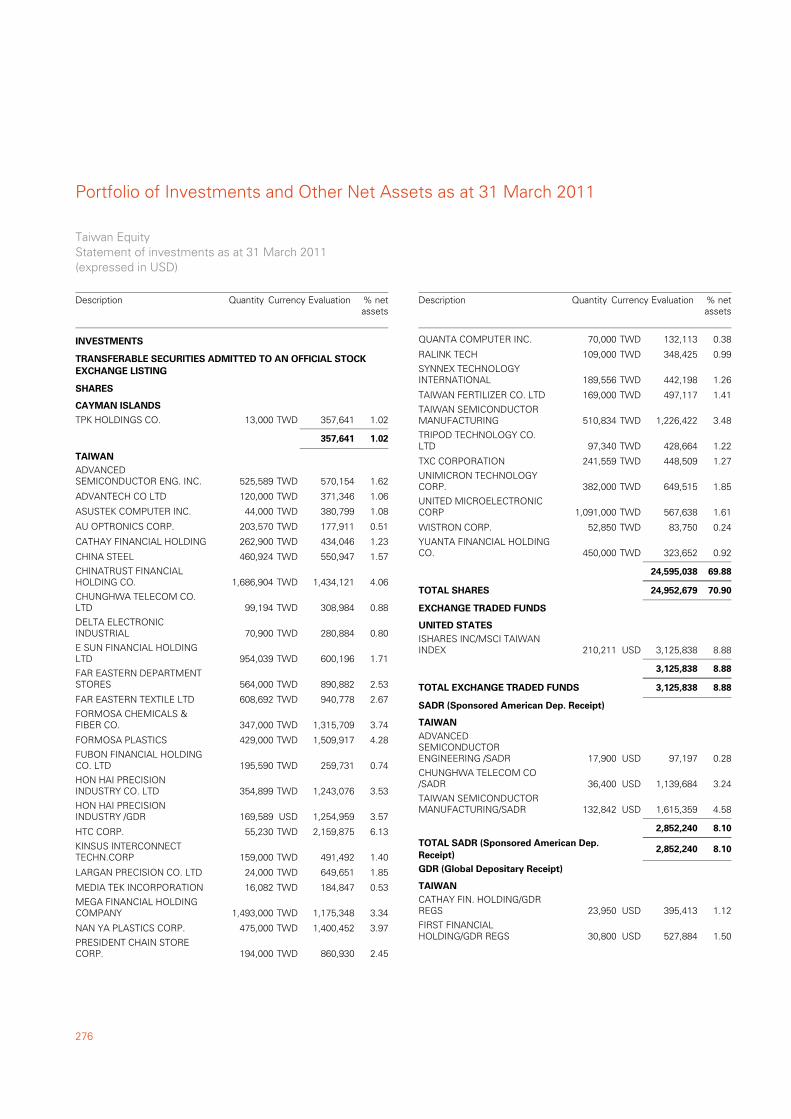
Portfolio of Investments and Other Net Assets as at 31 March 2011
276
TPK HOLDINGS CO. 13,000 357,641 1.02TWD
TRANSFERABLE SECURITIES ADMITTED TO AN OFFICIAL STOCKEXCHANGE LISTING
SHARES
CAYMAN ISLANDS
357,641 1.02
ADVANCEDSEMICONDUCTOR ENG. INC. 525,589 570,154 1.62TWD
TAIWAN
ADVANTECH CO LTD 120,000 371,346 1.06TWD
ASUSTEK COMPUTER INC. 44,000 380,799 1.08TWD
AU OPTRONICS CORP. 203,570 177,911 0.51TWD
CATHAY FINANCIAL HOLDING 262,900 434,046 1.23TWD
CHINA STEEL 460,924 550,947 1.57TWD
CHINATRUST FINANCIALHOLDING CO. 1,686,904 1,434,121 4.06TWD
CHUNGHWA TELECOM CO.LTD 99,194 308,984 0.88TWD
DELTA ELECTRONICINDUSTRIAL 70,900 280,884 0.80TWD
E SUN FINANCIAL HOLDINGLTD 954,039 600,196 1.71TWD
FAR EASTERN DEPARTMENTSTORES 564,000 890,882 2.53TWD
FAR EASTERN TEXTILE LTD 608,692 940,778 2.67TWD
FORMOSA CHEMICALS &FIBER CO. 347,000 1,315,709 3.74TWD
FORMOSA PLASTICS 429,000 1,509,917 4.28TWD
FUBON FINANCIAL HOLDINGCO. LTD 195,590 259,731 0.74TWD
HON HAI PRECISIONINDUSTRY CO. LTD 354,899 1,243,076 3.53TWD
HON HAI PRECISIONINDUSTRY /GDR 169,589 1,254,959 3.57USD
HTC CORP. 55,230 2,159,875 6.13TWD
KINSUS INTERCONNECTTECHN.CORP 159,000 491,492 1.40TWD
LARGAN PRECISION CO. LTD 24,000 649,651 1.85TWD
MEDIA TEK INCORPORATION 16,082 184,847 0.53TWD
MEGA FINANCIAL HOLDINGCOMPANY 1,493,000 1,175,348 3.34TWD
NAN YA PLASTICS CORP. 475,000 1,400,452 3.97TWD
PRESIDENT CHAIN STORECORP. 194,000 860,930 2.45TWD
INVESTMENTS
Taiwan EquityStatement of investments as at 31 March 2011(expressed in USD)
Description Quantity Currency Evaluation % netassets
QUANTA COMPUTER INC. 70,000 132,113 0.38TWD
RALINK TECH 109,000 348,425 0.99TWD
SYNNEX TECHNOLOGYINTERNATIONAL 189,556 442,198 1.26TWD
TAIWAN FERTILIZER CO. LTD 169,000 497,117 1.41TWD
TAIWAN SEMICONDUCTORMANUFACTURING 510,834 1,226,422 3.48TWD
TRIPOD TECHNOLOGY CO.LTD 97,340 428,664 1.22TWD
TXC CORPORATION 241,559 448,509 1.27TWD
UNIMICRON TECHNOLOGYCORP. 382,000 649,515 1.85TWD
UNITED MICROELECTRONICCORP 1,091,000 567,638 1.61TWD
WISTRON CORP. 52,850 83,750 0.24TWD
YUANTA FINANCIAL HOLDINGCO. 450,000 323,652 0.92TWD
24,595,038 69.88
70.9024,952,679TOTAL SHARES
ISHARES INC/MSCI TAIWANINDEX 210,211 3,125,838 8.88USD
EXCHANGE TRADED FUNDS
UNITED STATES
3,125,838 8.88
8.883,125,838TOTAL EXCHANGE TRADED FUNDS
ADVANCEDSEMICONDUCTORENGINEERING /SADR 17,900 97,197 0.28USD
SADR (Sponsored American Dep. Receipt)
TAIWAN
CHUNGHWA TELECOM CO/SADR 36,400 1,139,684 3.24USD
TAIWAN SEMICONDUCTORMANUFACTURING/SADR 132,842 1,615,359 4.58USD
2,852,240 8.10
8.102,852,240TOTAL SADR (Sponsored American Dep.Receipt)
CATHAY FIN. HOLDING/GDRREGS 23,950 395,413 1.12USD
GDR (Global Depositary Receipt)
TAIWAN
FIRST FINANCIALHOLDING/GDR REGS 30,800 527,884 1.50USD
Description Quantity Currency Evaluation % netassets
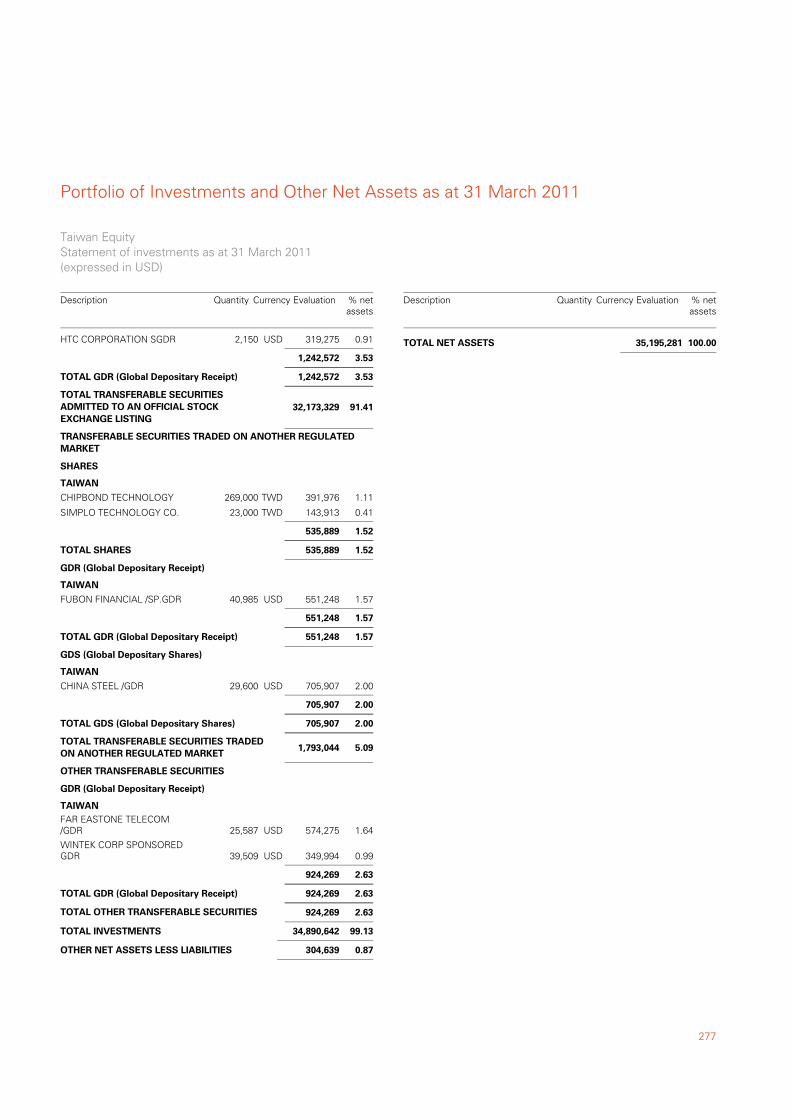
277
Portfolio of Investments and Other Net Assets as at 31 March 2011
HTC CORPORATION SGDR 2,150 319,275 0.91USD
1,242,572 3.53
3.531,242,572TOTAL GDR (Global Depositary Receipt)
91.41TOTAL TRANSFERABLE SECURITIESADMITTED TO AN OFFICIAL STOCKEXCHANGE LISTING
32,173,329
CHIPBOND TECHNOLOGY 269,000 391,976 1.11TWD
TRANSFERABLE SECURITIES TRADED ON ANOTHER REGULATEDMARKET
SHARES
TAIWAN
SIMPLO TECHNOLOGY CO. 23,000 143,913 0.41TWD
535,889 1.52
1.52535,889TOTAL SHARES
FUBON FINANCIAL /SP.GDR 40,985 551,248 1.57USD
GDR (Global Depositary Receipt)
TAIWAN
551,248 1.57
1.57551,248TOTAL GDR (Global Depositary Receipt)
CHINA STEEL /GDR 29,600 705,907 2.00USD
GDS (Global Depositary Shares)
TAIWAN
705,907 2.00
2.00705,907TOTAL GDS (Global Depositary Shares)
5.09TOTAL TRANSFERABLE SECURITIES TRADEDON ANOTHER REGULATED MARKET
1,793,044
FAR EASTONE TELECOM/GDR 25,587 574,275 1.64USD
OTHER TRANSFERABLE SECURITIES
GDR (Global Depositary Receipt)
TAIWAN
WINTEK CORP SPONSOREDGDR 39,509 349,994 0.99USD
924,269 2.63
2.63924,269TOTAL GDR (Global Depositary Receipt)
2.63TOTAL OTHER TRANSFERABLE SECURITIES 924,269
99.13TOTAL INVESTMENTS 34,890,642
0.87OTHER NET ASSETS LESS LIABILITIES 304,639
Taiwan EquityStatement of investments as at 31 March 2011(expressed in USD)
Description Quantity Currency Evaluation % netassets
100.00TOTAL NET ASSETS 35,195,281
Description Quantity Currency Evaluation % netassets
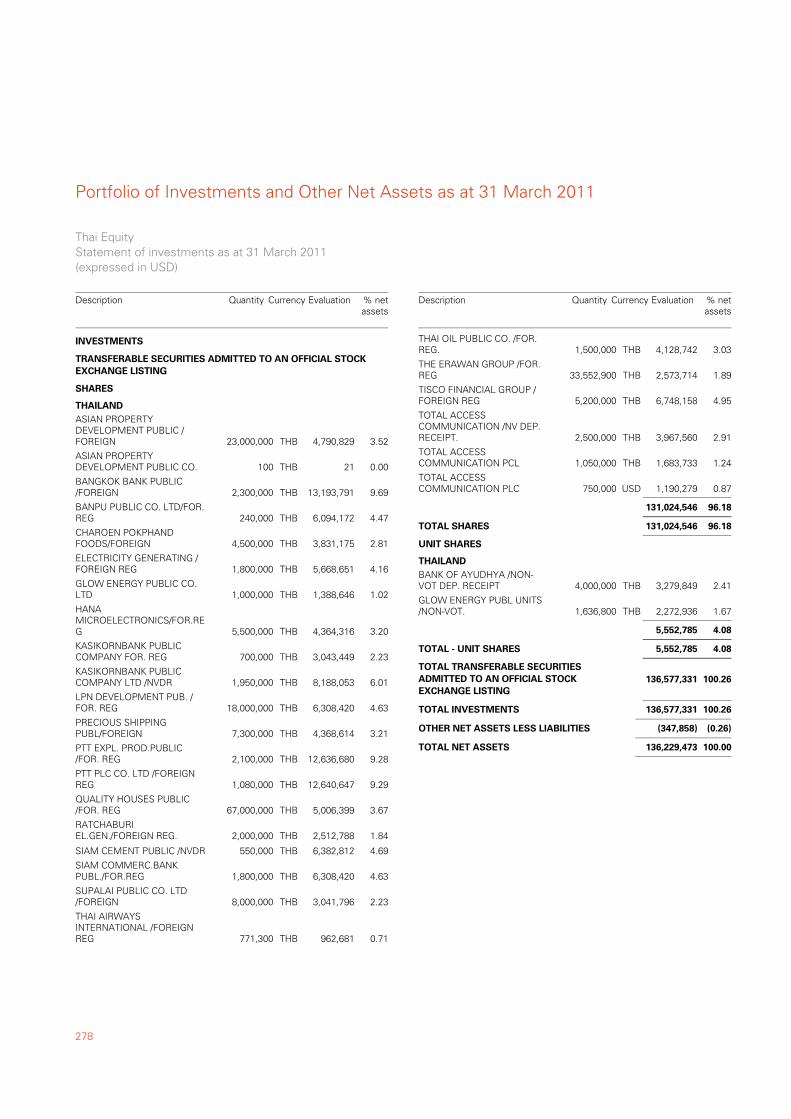
Portfolio of Investments and Other Net Assets as at 31 March 2011
278
ASIAN PROPERTYDEVELOPMENT PUBLIC /FOREIGN 23,000,000 4,790,829 3.52THB
TRANSFERABLE SECURITIES ADMITTED TO AN OFFICIAL STOCKEXCHANGE LISTING
SHARES
THAILAND
ASIAN PROPERTYDEVELOPMENT PUBLIC CO. 100 21 0.00THB
BANGKOK BANK PUBLIC/FOREIGN 2,300,000 13,193,791 9.69THB
BANPU PUBLIC CO. LTD/FOR.REG 240,000 6,094,172 4.47THB
CHAROEN POKPHANDFOODS/FOREIGN 4,500,000 3,831,175 2.81THB
ELECTRICITY GENERATING /FOREIGN REG 1,800,000 5,668,651 4.16THB
GLOW ENERGY PUBLIC CO.LTD 1,000,000 1,388,646 1.02THB
HANAMICROELECTRONICS/FOR.REG 5,500,000 4,364,316 3.20THB
KASIKORNBANK PUBLICCOMPANY FOR. REG 700,000 3,043,449 2.23THB
KASIKORNBANK PUBLICCOMPANY LTD /NVDR 1,950,000 8,188,053 6.01THB
LPN DEVELOPMENT PUB. /FOR. REG 18,000,000 6,308,420 4.63THB
PRECIOUS SHIPPINGPUBL/FOREIGN 7,300,000 4,368,614 3.21THB
PTT EXPL. PROD.PUBLIC/FOR. REG 2,100,000 12,636,680 9.28THB
PTT PLC CO. LTD /FOREIGNREG 1,080,000 12,640,647 9.29THB
QUALITY HOUSES PUBLIC/FOR. REG 67,000,000 5,006,399 3.67THB
RATCHABURIEL.GEN./FOREIGN REG. 2,000,000 2,512,788 1.84THB
SIAM CEMENT PUBLIC /NVDR 550,000 6,382,812 4.69THB
SIAM COMMERC.BANKPUBL./FOR.REG 1,800,000 6,308,420 4.63THB
SUPALAI PUBLIC CO. LTD/FOREIGN 8,000,000 3,041,796 2.23THB
THAI AIRWAYSINTERNATIONAL /FOREIGNREG 771,300 962,681 0.71THB
INVESTMENTS
Thai EquityStatement of investments as at 31 March 2011(expressed in USD)
Description Quantity Currency Evaluation % netassets
THAI OIL PUBLIC CO. /FOR.REG. 1,500,000 4,128,742 3.03THB
THE ERAWAN GROUP /FOR.REG 33,552,900 2,573,714 1.89THB
TISCO FINANCIAL GROUP /FOREIGN REG 5,200,000 6,748,158 4.95THB
TOTAL ACCESSCOMMUNICATION /NV DEP.RECEIPT. 2,500,000 3,967,560 2.91THB
TOTAL ACCESSCOMMUNICATION PCL 1,050,000 1,683,733 1.24THB
TOTAL ACCESSCOMMUNICATION PLC 750,000 1,190,279 0.87USD
131,024,546 96.18
96.18131,024,546TOTAL SHARES
BANK OF AYUDHYA /NON-VOT DEP. RECEIPT 4,000,000 3,279,849 2.41THB
UNIT SHARES
THAILAND
GLOW ENERGY PUBL UNITS/NON-VOT. 1,636,800 2,272,936 1.67THB
5,552,785 4.08
4.085,552,785TOTAL - UNIT SHARES
100.26TOTAL TRANSFERABLE SECURITIESADMITTED TO AN OFFICIAL STOCKEXCHANGE LISTING
136,577,331
100.26TOTAL INVESTMENTS 136,577,331
(0.26)OTHER NET ASSETS LESS LIABILITIES (347,858)
100.00TOTAL NET ASSETS 136,229,473
Description Quantity Currency Evaluation % netassets
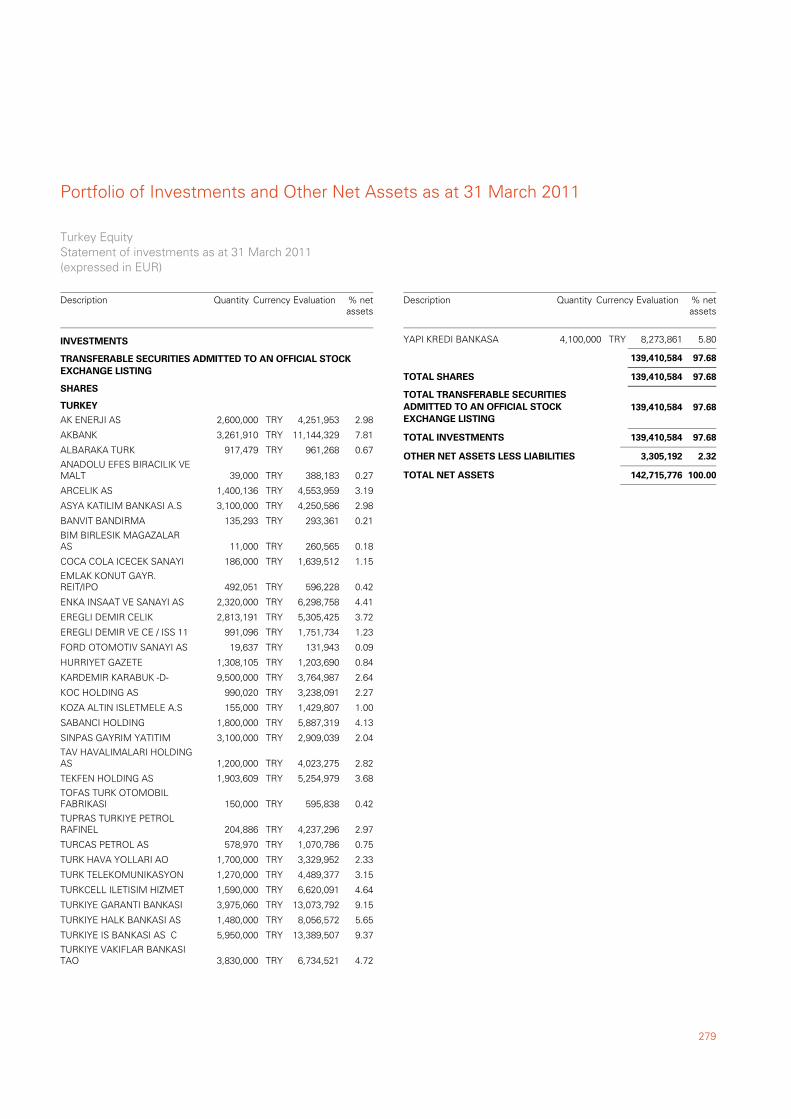
279
Portfolio of Investments and Other Net Assets as at 31 March 2011
AK ENERJI AS 2,600,000 4,251,953 2.98TRY
TRANSFERABLE SECURITIES ADMITTED TO AN OFFICIAL STOCKEXCHANGE LISTING
SHARES
TURKEY
AKBANK 3,261,910 11,144,329 7.81TRY
ALBARAKA TURK 917,479 961,268 0.67TRY
ANADOLU EFES BIRACILIK VEMALT 39,000 388,183 0.27TRY
ARCELIK AS 1,400,136 4,553,959 3.19TRY
ASYA KATILIM BANKASI A.S 3,100,000 4,250,586 2.98TRY
BANVIT BANDIRMA 135,293 293,361 0.21TRY
BIM BIRLESIK MAGAZALARAS 11,000 260,565 0.18TRY
COCA COLA ICECEK SANAYI 186,000 1,639,512 1.15TRY
EMLAK KONUT GAYR.REIT/IPO 492,051 596,228 0.42TRY
ENKA INSAAT VE SANAYI AS 2,320,000 6,298,758 4.41TRY
EREGLI DEMIR CELIK 2,813,191 5,305,425 3.72TRY
EREGLI DEMIR VE CE / ISS 11 991,096 1,751,734 1.23TRY
FORD OTOMOTIV SANAYI AS 19,637 131,943 0.09TRY
HURRIYET GAZETE 1,308,105 1,203,690 0.84TRY
KARDEMIR KARABUK -D- 9,500,000 3,764,987 2.64TRY
KOC HOLDING AS 990,020 3,238,091 2.27TRY
KOZA ALTIN ISLETMELE A.S 155,000 1,429,807 1.00TRY
SABANCI HOLDING 1,800,000 5,887,319 4.13TRY
SINPAS GAYRIM YATITIM 3,100,000 2,909,039 2.04TRY
TAV HAVALIMALARI HOLDINGAS 1,200,000 4,023,275 2.82TRY
TEKFEN HOLDING AS 1,903,609 5,254,979 3.68TRY
TOFAS TURK OTOMOBILFABRIKASI 150,000 595,838 0.42TRY
TUPRAS TURKIYE PETROLRAFINEL 204,886 4,237,296 2.97TRY
TURCAS PETROL AS 578,970 1,070,786 0.75TRY
TURK HAVA YOLLARI AO 1,700,000 3,329,952 2.33TRY
TURK TELEKOMUNIKASYON 1,270,000 4,489,377 3.15TRY
TURKCELL ILETISIM HIZMET 1,590,000 6,620,091 4.64TRY
TURKIYE GARANTI BANKASI 3,975,060 13,073,792 9.15TRY
TURKIYE HALK BANKASI AS 1,480,000 8,056,572 5.65TRY
TURKIYE IS BANKASI AS C 5,950,000 13,389,507 9.37TRY
TURKIYE VAKIFLAR BANKASITAO 3,830,000 6,734,521 4.72TRY
INVESTMENTS
Turkey EquityStatement of investments as at 31 March 2011(expressed in EUR)
Description Quantity Currency Evaluation % netassets
YAPI KREDI BANKASA 4,100,000 8,273,861 5.80TRY
139,410,584 97.68
97.68139,410,584TOTAL SHARES
97.68TOTAL TRANSFERABLE SECURITIESADMITTED TO AN OFFICIAL STOCKEXCHANGE LISTING
139,410,584
97.68TOTAL INVESTMENTS 139,410,584
2.32OTHER NET ASSETS LESS LIABILITIES 3,305,192
100.00TOTAL NET ASSETS 142,715,776
Description Quantity Currency Evaluation % netassets
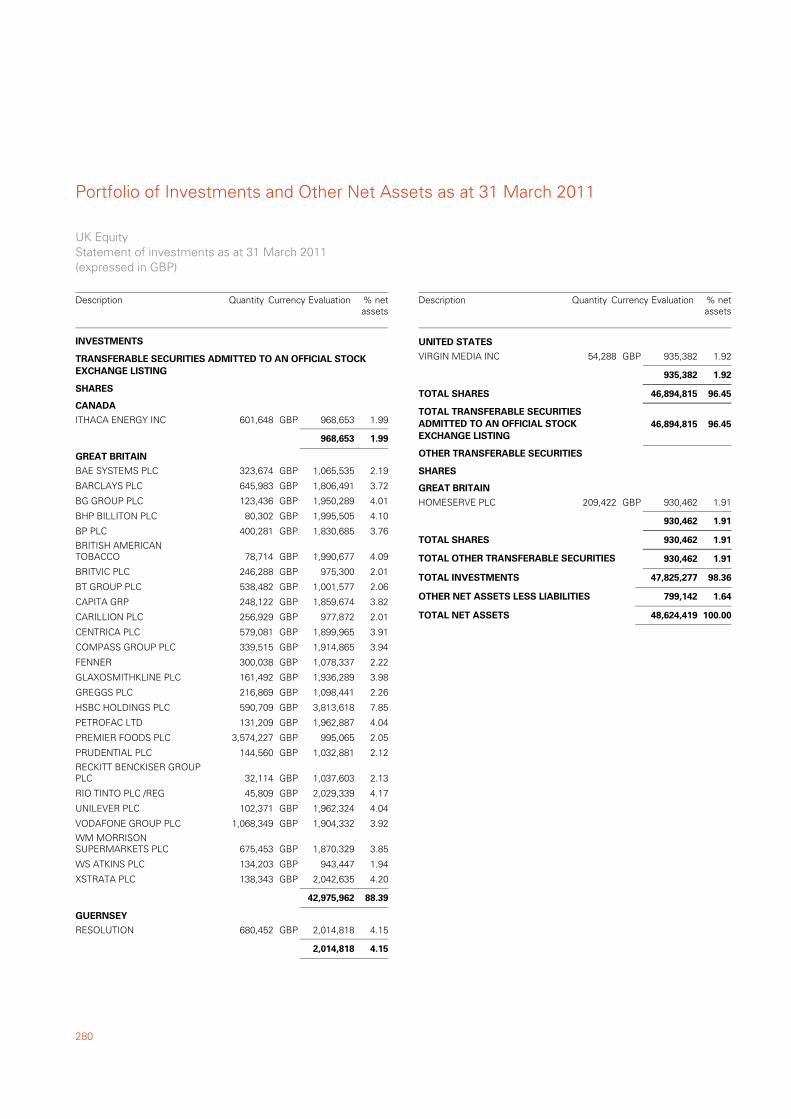
Portfolio of Investments and Other Net Assets as at 31 March 2011
280
ITHACA ENERGY INC 601,648 968,653 1.99GBP
TRANSFERABLE SECURITIES ADMITTED TO AN OFFICIAL STOCKEXCHANGE LISTING
SHARES
CANADA
968,653 1.99
BAE SYSTEMS PLC 323,674 1,065,535 2.19GBP
GREAT BRITAIN
BARCLAYS PLC 645,983 1,806,491 3.72GBP
BG GROUP PLC 123,436 1,950,289 4.01GBP
BHP BILLITON PLC 80,302 1,995,505 4.10GBP
BP PLC 400,281 1,830,685 3.76GBP
BRITISH AMERICANTOBACCO 78,714 1,990,677 4.09GBP
BRITVIC PLC 246,288 975,300 2.01GBP
BT GROUP PLC 538,482 1,001,577 2.06GBP
CAPITA GRP 248,122 1,859,674 3.82GBP
CARILLION PLC 256,929 977,872 2.01GBP
CENTRICA PLC 579,081 1,899,965 3.91GBP
COMPASS GROUP PLC 339,515 1,914,865 3.94GBP
FENNER 300,038 1,078,337 2.22GBP
GLAXOSMITHKLINE PLC 161,492 1,936,289 3.98GBP
GREGGS PLC 216,869 1,098,441 2.26GBP
HSBC HOLDINGS PLC 590,709 3,813,618 7.85GBP
PETROFAC LTD 131,209 1,962,887 4.04GBP
PREMIER FOODS PLC 3,574,227 995,065 2.05GBP
PRUDENTIAL PLC 144,560 1,032,881 2.12GBP
RECKITT BENCKISER GROUPPLC 32,114 1,037,603 2.13GBP
RIO TINTO PLC /REG 45,809 2,029,339 4.17GBP
UNILEVER PLC 102,371 1,962,324 4.04GBP
VODAFONE GROUP PLC 1,068,349 1,904,332 3.92GBP
WM MORRISONSUPERMARKETS PLC 675,453 1,870,329 3.85GBP
WS ATKINS PLC 134,203 943,447 1.94GBP
XSTRATA PLC 138,343 2,042,635 4.20GBP
42,975,962 88.39
RESOLUTION 680,452 2,014,818 4.15GBP
GUERNSEY
2,014,818 4.15
INVESTMENTS
UK EquityStatement of investments as at 31 March 2011(expressed in GBP)
Description Quantity Currency Evaluation % netassets
VIRGIN MEDIA INC 54,288 935,382 1.92GBP
UNITED STATES
935,382 1.92
96.4546,894,815TOTAL SHARES
96.45TOTAL TRANSFERABLE SECURITIESADMITTED TO AN OFFICIAL STOCKEXCHANGE LISTING
46,894,815
HOMESERVE PLC 209,422 930,462 1.91GBP
OTHER TRANSFERABLE SECURITIES
SHARES
GREAT BRITAIN
930,462 1.91
1.91930,462TOTAL SHARES
1.91TOTAL OTHER TRANSFERABLE SECURITIES 930,462
98.36TOTAL INVESTMENTS 47,825,277
1.64OTHER NET ASSETS LESS LIABILITIES 799,142
100.00TOTAL NET ASSETS 48,624,419
Description Quantity Currency Evaluation % netassets
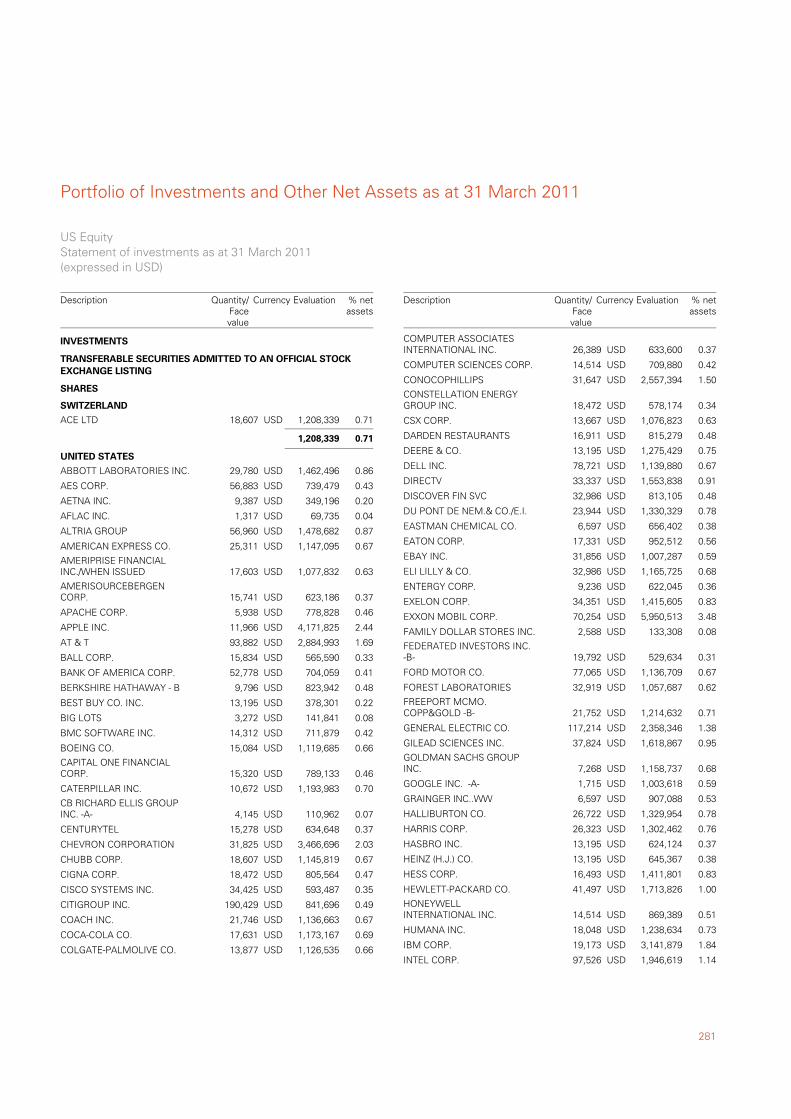
281
Portfolio of Investments and Other Net Assets as at 31 March 2011
ACE LTD 18,607 1,208,339 0.71USD
TRANSFERABLE SECURITIES ADMITTED TO AN OFFICIAL STOCKEXCHANGE LISTING
SHARES
SWITZERLAND
1,208,339 0.71
ABBOTT LABORATORIES INC. 29,780 1,462,496 0.86USD
UNITED STATES
AES CORP. 56,883 739,479 0.43USD
AETNA INC. 9,387 349,196 0.20USD
AFLAC INC. 1,317 69,735 0.04USD
ALTRIA GROUP 56,960 1,478,682 0.87USD
AMERICAN EXPRESS CO. 25,311 1,147,095 0.67USD
AMERIPRISE FINANCIALINC./WHEN ISSUED 17,603 1,077,832 0.63USD
AMERISOURCEBERGENCORP. 15,741 623,186 0.37USD
APACHE CORP. 5,938 778,828 0.46USD
APPLE INC. 11,966 4,171,825 2.44USD
AT & T 93,882 2,884,993 1.69USD
BALL CORP. 15,834 565,590 0.33USD
BANK OF AMERICA CORP. 52,778 704,059 0.41USD
BERKSHIRE HATHAWAY - B 9,796 823,942 0.48USD
BEST BUY CO. INC. 13,195 378,301 0.22USD
BIG LOTS 3,272 141,841 0.08USD
BMC SOFTWARE INC. 14,312 711,879 0.42USD
BOEING CO. 15,084 1,119,685 0.66USD
CAPITAL ONE FINANCIALCORP. 15,320 789,133 0.46USD
CATERPILLAR INC. 10,672 1,193,983 0.70USD
CB RICHARD ELLIS GROUPINC. -A- 4,145 110,962 0.07USD
CENTURYTEL 15,278 634,648 0.37USD
CHEVRON CORPORATION 31,825 3,466,696 2.03USD
CHUBB CORP. 18,607 1,145,819 0.67USD
CIGNA CORP. 18,472 805,564 0.47USD
CISCO SYSTEMS INC. 34,425 593,487 0.35USD
CITIGROUP INC. 190,429 841,696 0.49USD
COACH INC. 21,746 1,136,663 0.67USD
COCA-COLA CO. 17,631 1,173,167 0.69USD
COLGATE-PALMOLIVE CO. 13,877 1,126,535 0.66USD
INVESTMENTS
US EquityStatement of investments as at 31 March 2011(expressed in USD)
Description Currency Evaluation % netassets
Quantity/Facevalue
COMPUTER ASSOCIATESINTERNATIONAL INC. 26,389 633,600 0.37USD
COMPUTER SCIENCES CORP. 14,514 709,880 0.42USD
CONOCOPHILLIPS 31,647 2,557,394 1.50USD
CONSTELLATION ENERGYGROUP INC. 18,472 578,174 0.34USD
CSX CORP. 13,667 1,076,823 0.63USD
DARDEN RESTAURANTS 16,911 815,279 0.48USD
DEERE & CO. 13,195 1,275,429 0.75USD
DELL INC. 78,721 1,139,880 0.67USD
DIRECTV 33,337 1,553,838 0.91USD
DISCOVER FIN SVC 32,986 813,105 0.48USD
DU PONT DE NEM.& CO./E.I. 23,944 1,330,329 0.78USD
EASTMAN CHEMICAL CO. 6,597 656,402 0.38USD
EATON CORP. 17,331 952,512 0.56USD
EBAY INC. 31,856 1,007,287 0.59USD
ELI LILLY & CO. 32,986 1,165,725 0.68USD
ENTERGY CORP. 9,236 622,045 0.36USD
EXELON CORP. 34,351 1,415,605 0.83USD
EXXON MOBIL CORP. 70,254 5,950,513 3.48USD
FAMILY DOLLAR STORES INC. 2,588 133,308 0.08USD
FEDERATED INVESTORS INC.-B- 19,792 529,634 0.31USD
FORD MOTOR CO. 77,065 1,136,709 0.67USD
FOREST LABORATORIES 32,919 1,057,687 0.62USD
FREEPORT MCMO.COPP&GOLD -B- 21,752 1,214,632 0.71USD
GENERAL ELECTRIC CO. 117,214 2,358,346 1.38USD
GILEAD SCIENCES INC. 37,824 1,618,867 0.95USD
GOLDMAN SACHS GROUPINC. 7,268 1,158,737 0.68USD
GOOGLE INC. -A- 1,715 1,003,618 0.59USD
GRAINGER INC..WW 6,597 907,088 0.53USD
HALLIBURTON CO. 26,722 1,329,954 0.78USD
HARRIS CORP. 26,323 1,302,462 0.76USD
HASBRO INC. 13,195 624,124 0.37USD
HEINZ (H.J.) CO. 13,195 645,367 0.38USD
HESS CORP. 16,493 1,411,801 0.83USD
HEWLETT-PACKARD CO. 41,497 1,713,826 1.00USD
HONEYWELLINTERNATIONAL INC. 14,514 869,389 0.51USD
HUMANA INC. 18,048 1,238,634 0.73USD
IBM CORP. 19,173 3,141,879 1.84USD
INTEL CORP. 97,526 1,946,619 1.14USD
Description Currency Evaluation % netassets
Quantity/Facevalue
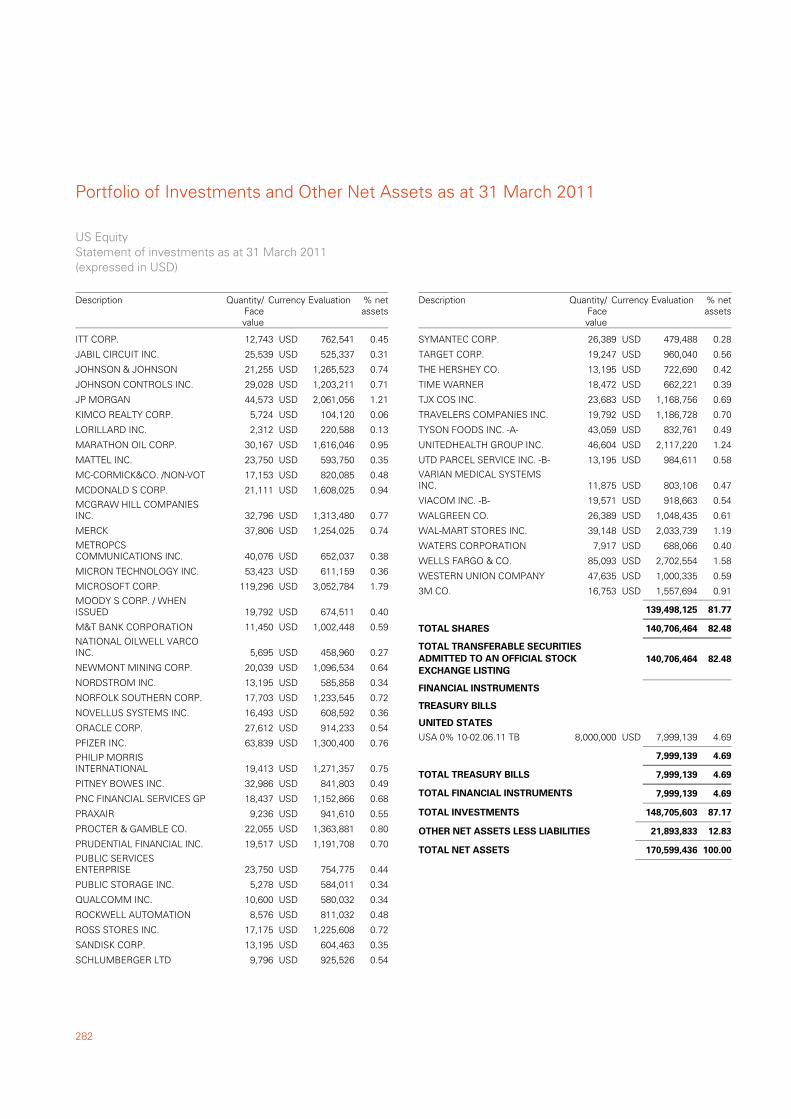
Portfolio of Investments and Other Net Assets as at 31 March 2011
282
ITT CORP. 12,743 762,541 0.45USD
JABIL CIRCUIT INC. 25,539 525,337 0.31USD
JOHNSON & JOHNSON 21,255 1,265,523 0.74USD
JOHNSON CONTROLS INC. 29,028 1,203,211 0.71USD
JP MORGAN 44,573 2,061,056 1.21USD
KIMCO REALTY CORP. 5,724 104,120 0.06USD
LORILLARD INC. 2,312 220,588 0.13USD
MARATHON OIL CORP. 30,167 1,616,046 0.95USD
MATTEL INC. 23,750 593,750 0.35USD
MC-CORMICK&CO. /NON-VOT 17,153 820,085 0.48USD
MCDONALD S CORP. 21,111 1,608,025 0.94USD
MCGRAW HILL COMPANIESINC. 32,796 1,313,480 0.77USD
MERCK 37,806 1,254,025 0.74USD
METROPCSCOMMUNICATIONS INC. 40,076 652,037 0.38USD
MICRON TECHNOLOGY INC. 53,423 611,159 0.36USD
MICROSOFT CORP. 119,296 3,052,784 1.79USD
MOODY S CORP. / WHENISSUED 19,792 674,511 0.40USD
M&T BANK CORPORATION 11,450 1,002,448 0.59USD
NATIONAL OILWELL VARCOINC. 5,695 458,960 0.27USD
NEWMONT MINING CORP. 20,039 1,096,534 0.64USD
NORDSTROM INC. 13,195 585,858 0.34USD
NORFOLK SOUTHERN CORP. 17,703 1,233,545 0.72USD
NOVELLUS SYSTEMS INC. 16,493 608,592 0.36USD
ORACLE CORP. 27,612 914,233 0.54USD
PFIZER INC. 63,839 1,300,400 0.76USD
PHILIP MORRISINTERNATIONAL 19,413 1,271,357 0.75USD
PITNEY BOWES INC. 32,986 841,803 0.49USD
PNC FINANCIAL SERVICES GP 18,437 1,152,866 0.68USD
PRAXAIR 9,236 941,610 0.55USD
PROCTER & GAMBLE CO. 22,055 1,363,881 0.80USD
PRUDENTIAL FINANCIAL INC. 19,517 1,191,708 0.70USD
PUBLIC SERVICESENTERPRISE 23,750 754,775 0.44USD
PUBLIC STORAGE INC. 5,278 584,011 0.34USD
QUALCOMM INC. 10,600 580,032 0.34USD
ROCKWELL AUTOMATION 8,576 811,032 0.48USD
ROSS STORES INC. 17,175 1,225,608 0.72USD
SANDISK CORP. 13,195 604,463 0.35USD
SCHLUMBERGER LTD 9,796 925,526 0.54USD
US EquityStatement of investments as at 31 March 2011(expressed in USD)
Description Currency Evaluation % netassets
Quantity/Facevalue
SYMANTEC CORP. 26,389 479,488 0.28USD
TARGET CORP. 19,247 960,040 0.56USD
THE HERSHEY CO. 13,195 722,690 0.42USD
TIME WARNER 18,472 662,221 0.39USD
TJX COS INC. 23,683 1,168,756 0.69USD
TRAVELERS COMPANIES INC. 19,792 1,186,728 0.70USD
TYSON FOODS INC. -A- 43,059 832,761 0.49USD
UNITEDHEALTH GROUP INC. 46,604 2,117,220 1.24USD
UTD PARCEL SERVICE INC. -B- 13,195 984,611 0.58USD
VARIAN MEDICAL SYSTEMSINC. 11,875 803,106 0.47USD
VIACOM INC. -B- 19,571 918,663 0.54USD
WALGREEN CO. 26,389 1,048,435 0.61USD
WAL-MART STORES INC. 39,148 2,033,739 1.19USD
WATERS CORPORATION 7,917 688,066 0.40USD
WELLS FARGO & CO. 85,093 2,702,554 1.58USD
WESTERN UNION COMPANY 47,635 1,000,335 0.59USD
3M CO. 16,753 1,557,694 0.91USD
139,498,125 81.77
82.48140,706,464TOTAL SHARES
82.48TOTAL TRANSFERABLE SECURITIESADMITTED TO AN OFFICIAL STOCKEXCHANGE LISTING
140,706,464
USA 0% 10-02.06.11 TB 8,000,000 7,999,139 4.69USD
FINANCIAL INSTRUMENTS
TREASURY BILLS
UNITED STATES
7,999,139 4.69
4.697,999,139TOTAL TREASURY BILLS
4.69TOTAL FINANCIAL INSTRUMENTS 7,999,139
87.17TOTAL INVESTMENTS 148,705,603
12.83OTHER NET ASSETS LESS LIABILITIES 21,893,833
100.00TOTAL NET ASSETS 170,599,436
Description Currency Evaluation % netassets
Quantity/Facevalue
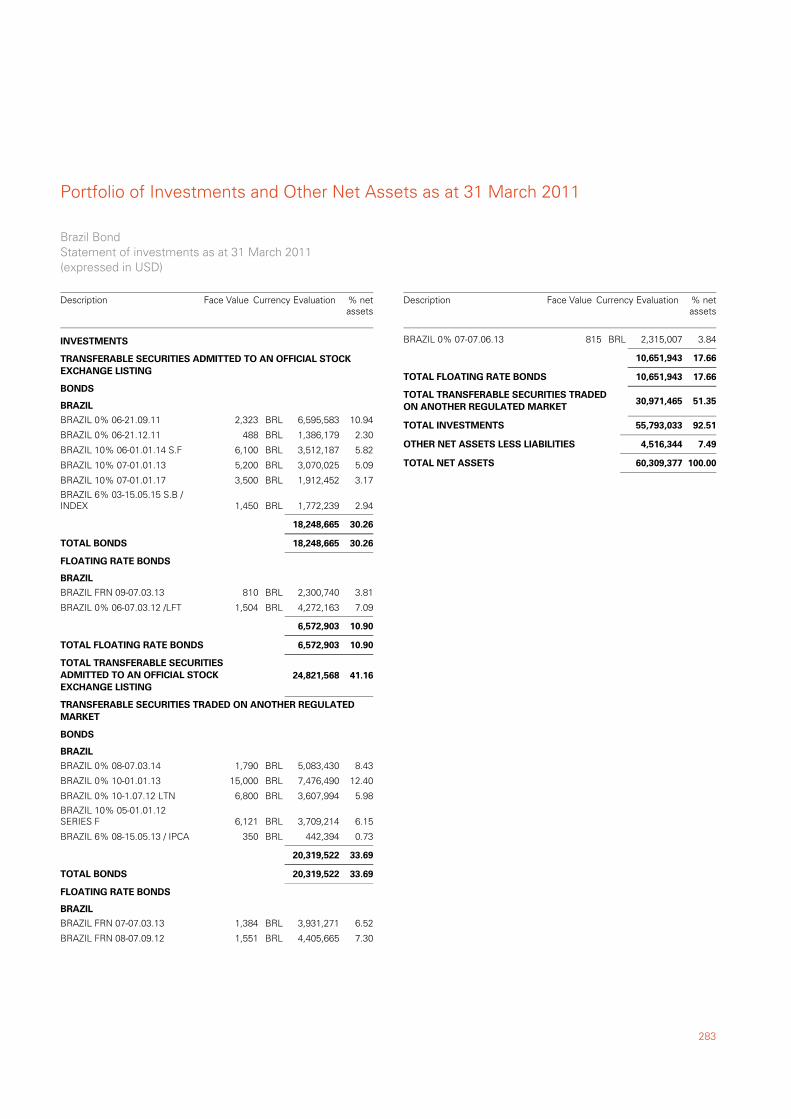
283
Portfolio of Investments and Other Net Assets as at 31 March 2011
BRAZIL 0% 06-21.09.11 2,323 6,595,583 10.94BRL
TRANSFERABLE SECURITIES ADMITTED TO AN OFFICIAL STOCKEXCHANGE LISTING
BONDS
BRAZIL
BRAZIL 0% 06-21.12.11 488 1,386,179 2.30BRL
BRAZIL 10% 06-01.01.14 S.F 6,100 3,512,187 5.82BRL
BRAZIL 10% 07-01.01.13 5,200 3,070,025 5.09BRL
BRAZIL 10% 07-01.01.17 3,500 1,912,452 3.17BRL
BRAZIL 6% 03-15.05.15 S.B /INDEX 1,450 1,772,239 2.94BRL
18,248,665 30.26
30.2618,248,665TOTAL BONDS
BRAZIL FRN 09-07.03.13 810 2,300,740 3.81BRL
FLOATING RATE BONDS
BRAZIL
BRAZIL 0% 06-07.03.12 /LFT 1,504 4,272,163 7.09BRL
6,572,903 10.90
10.906,572,903TOTAL FLOATING RATE BONDS
41.16TOTAL TRANSFERABLE SECURITIESADMITTED TO AN OFFICIAL STOCKEXCHANGE LISTING
24,821,568
BRAZIL 0% 08-07.03.14 1,790 5,083,430 8.43BRL
TRANSFERABLE SECURITIES TRADED ON ANOTHER REGULATEDMARKET
BONDS
BRAZIL
BRAZIL 0% 10-01.01.13 15,000 7,476,490 12.40BRL
BRAZIL 0% 10-1.07.12 LTN 6,800 3,607,994 5.98BRL
BRAZIL 10% 05-01.01.12SERIES F 6,121 3,709,214 6.15BRL
BRAZIL 6% 08-15.05.13 / IPCA 350 442,394 0.73BRL
20,319,522 33.69
33.6920,319,522TOTAL BONDS
BRAZIL FRN 07-07.03.13 1,384 3,931,271 6.52BRL
FLOATING RATE BONDS
BRAZIL
BRAZIL FRN 08-07.09.12 1,551 4,405,665 7.30BRL
INVESTMENTS
Brazil BondStatement of investments as at 31 March 2011(expressed in USD)
Description Currency Evaluation % netassets
Face Value
BRAZIL 0% 07-07.06.13 815 2,315,007 3.84BRL
10,651,943 17.66
17.6610,651,943TOTAL FLOATING RATE BONDS
51.35TOTAL TRANSFERABLE SECURITIES TRADEDON ANOTHER REGULATED MARKET
30,971,465
92.51TOTAL INVESTMENTS 55,793,033
7.49OTHER NET ASSETS LESS LIABILITIES 4,516,344
100.00TOTAL NET ASSETS 60,309,377
Description Currency Evaluation % netassets
Face Value
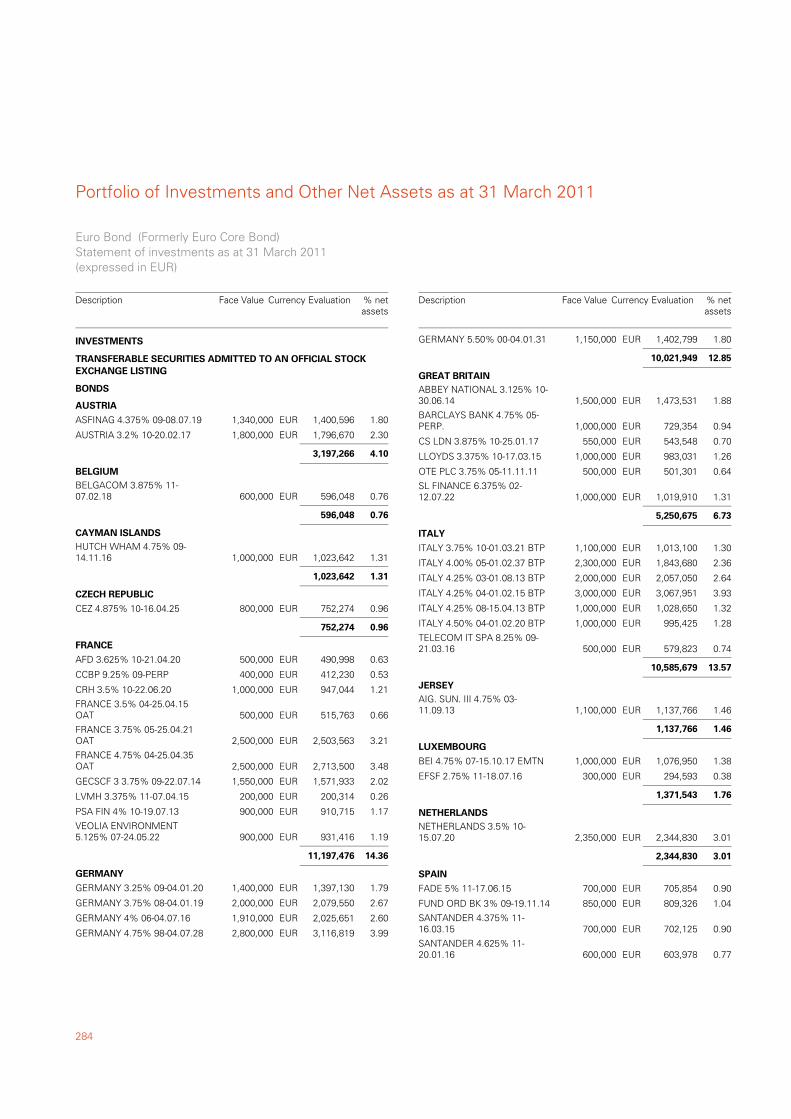
Portfolio of Investments and Other Net Assets as at 31 March 2011
284
ASFINAG 4.375% 09-08.07.19 1,340,000 1,400,596 1.80EUR
TRANSFERABLE SECURITIES ADMITTED TO AN OFFICIAL STOCKEXCHANGE LISTING
BONDS
AUSTRIA
AUSTRIA 3.2% 10-20.02.17 1,800,000 1,796,670 2.30EUR
3,197,266 4.10
BELGACOM 3.875% 11-07.02.18 600,000 596,048 0.76EUR
BELGIUM
596,048 0.76
HUTCH WHAM 4.75% 09-14.11.16 1,000,000 1,023,642 1.31EUR
CAYMAN ISLANDS
1,023,642 1.31
CEZ 4.875% 10-16.04.25 800,000 752,274 0.96EUR
CZECH REPUBLIC
752,274 0.96
AFD 3.625% 10-21.04.20 500,000 490,998 0.63EUR
FRANCE
CCBP 9.25% 09-PERP 400,000 412,230 0.53EUR
CRH 3.5% 10-22.06.20 1,000,000 947,044 1.21EUR
FRANCE 3.5% 04-25.04.15OAT 500,000 515,763 0.66EUR
FRANCE 3.75% 05-25.04.21OAT 2,500,000 2,503,563 3.21EUR
FRANCE 4.75% 04-25.04.35OAT 2,500,000 2,713,500 3.48EUR
GECSCF 3 3.75% 09-22.07.14 1,550,000 1,571,933 2.02EUR
LVMH 3.375% 11-07.04.15 200,000 200,314 0.26EUR
PSA FIN 4% 10-19.07.13 900,000 910,715 1.17EUR
VEOLIA ENVIRONMENT5.125% 07-24.05.22 900,000 931,416 1.19EUR
11,197,476 14.36
GERMANY 3.25% 09-04.01.20 1,400,000 1,397,130 1.79EUR
GERMANY
GERMANY 3.75% 08-04.01.19 2,000,000 2,079,550 2.67EUR
GERMANY 4% 06-04.07.16 1,910,000 2,025,651 2.60EUR
GERMANY 4.75% 98-04.07.28 2,800,000 3,116,819 3.99EUR
INVESTMENTS
Euro Bond (Formerly Euro Core Bond)Statement of investments as at 31 March 2011(expressed in EUR)
Description Currency Evaluation % netassets
Face Value
GERMANY 5.50% 00-04.01.31 1,150,000 1,402,799 1.80EUR
10,021,949 12.85
ABBEY NATIONAL 3.125% 10-30.06.14 1,500,000 1,473,531 1.88EUR
GREAT BRITAIN
BARCLAYS BANK 4.75% 05-PERP. 1,000,000 729,354 0.94EUR
CS LDN 3.875% 10-25.01.17 550,000 543,548 0.70EUR
LLOYDS 3.375% 10-17.03.15 1,000,000 983,031 1.26EUR
OTE PLC 3.75% 05-11.11.11 500,000 501,301 0.64EUR
SL FINANCE 6.375% 02-12.07.22 1,000,000 1,019,910 1.31EUR
5,250,675 6.73
ITALY 3.75% 10-01.03.21 BTP 1,100,000 1,013,100 1.30EUR
ITALY
ITALY 4.00% 05-01.02.37 BTP 2,300,000 1,843,680 2.36EUR
ITALY 4.25% 03-01.08.13 BTP 2,000,000 2,057,050 2.64EUR
ITALY 4.25% 04-01.02.15 BTP 3,000,000 3,067,951 3.93EUR
ITALY 4.25% 08-15.04.13 BTP 1,000,000 1,028,650 1.32EUR
ITALY 4.50% 04-01.02.20 BTP 1,000,000 995,425 1.28EUR
TELECOM IT SPA 8.25% 09-21.03.16 500,000 579,823 0.74EUR
10,585,679 13.57
AIG. SUN. III 4.75% 03-11.09.13 1,100,000 1,137,766 1.46EUR
JERSEY
1,137,766 1.46
BEI 4.75% 07-15.10.17 EMTN 1,000,000 1,076,950 1.38EUR
LUXEMBOURG
EFSF 2.75% 11-18.07.16 300,000 294,593 0.38EUR
1,371,543 1.76
NETHERLANDS 3.5% 10-15.07.20 2,350,000 2,344,830 3.01EUR
NETHERLANDS
2,344,830 3.01
FADE 5% 11-17.06.15 700,000 705,854 0.90EUR
SPAIN
FUND ORD BK 3% 09-19.11.14 850,000 809,326 1.04EUR
SANTANDER 4.375% 11-16.03.15 700,000 702,125 0.90EUR
SANTANDER 4.625% 11-20.01.16 600,000 603,978 0.77EUR
Description Currency Evaluation % netassets
Face Value
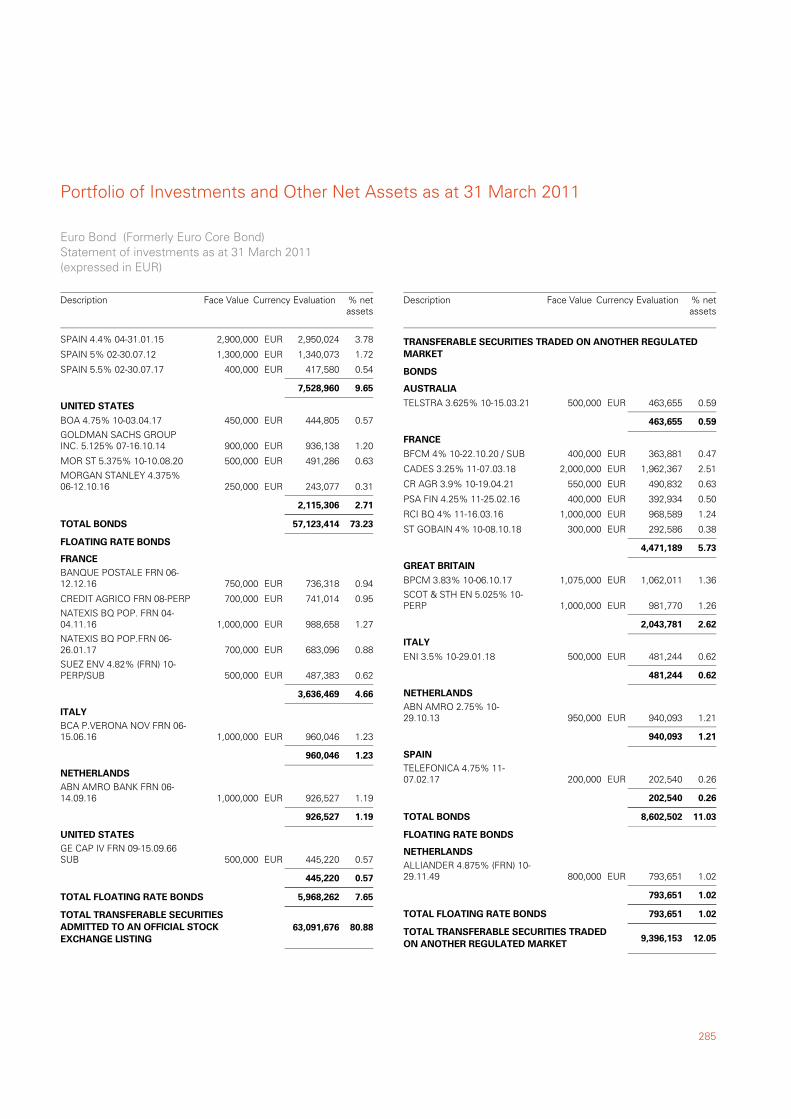
285
Portfolio of Investments and Other Net Assets as at 31 March 2011
SPAIN 4.4% 04-31.01.15 2,900,000 2,950,024 3.78EUR
SPAIN 5% 02-30.07.12 1,300,000 1,340,073 1.72EUR
SPAIN 5.5% 02-30.07.17 400,000 417,580 0.54EUR
7,528,960 9.65
BOA 4.75% 10-03.04.17 450,000 444,805 0.57EUR
UNITED STATES
GOLDMAN SACHS GROUPINC. 5.125% 07-16.10.14 900,000 936,138 1.20EUR
MOR ST 5.375% 10-10.08.20 500,000 491,286 0.63EUR
MORGAN STANLEY 4.375%06-12.10.16 250,000 243,077 0.31EUR
2,115,306 2.71
73.2357,123,414TOTAL BONDS
BANQUE POSTALE FRN 06-12.12.16 750,000 736,318 0.94EUR
FLOATING RATE BONDS
FRANCE
CREDIT AGRICO FRN 08-PERP 700,000 741,014 0.95EUR
NATEXIS BQ POP. FRN 04-04.11.16 1,000,000 988,658 1.27EUR
NATEXIS BQ POP.FRN 06-26.01.17 700,000 683,096 0.88EUR
SUEZ ENV 4.82% (FRN) 10-PERP/SUB 500,000 487,383 0.62EUR
3,636,469 4.66
BCA P.VERONA NOV FRN 06-15.06.16 1,000,000 960,046 1.23EUR
ITALY
960,046 1.23
ABN AMRO BANK FRN 06-14.09.16 1,000,000 926,527 1.19EUR
NETHERLANDS
926,527 1.19
GE CAP IV FRN 09-15.09.66SUB 500,000 445,220 0.57EUR
UNITED STATES
445,220 0.57
7.655,968,262TOTAL FLOATING RATE BONDS
80.88TOTAL TRANSFERABLE SECURITIESADMITTED TO AN OFFICIAL STOCKEXCHANGE LISTING
63,091,676
Euro Bond (Formerly Euro Core Bond)Statement of investments as at 31 March 2011(expressed in EUR)
Description Currency Evaluation % netassets
Face Value
TELSTRA 3.625% 10-15.03.21 500,000 463,655 0.59EUR
TRANSFERABLE SECURITIES TRADED ON ANOTHER REGULATEDMARKET
BONDS
AUSTRALIA
463,655 0.59
BFCM 4% 10-22.10.20 / SUB 400,000 363,881 0.47EUR
FRANCE
CADES 3.25% 11-07.03.18 2,000,000 1,962,367 2.51EUR
CR AGR 3.9% 10-19.04.21 550,000 490,832 0.63EUR
PSA FIN 4.25% 11-25.02.16 400,000 392,934 0.50EUR
RCI BQ 4% 11-16.03.16 1,000,000 968,589 1.24EUR
ST GOBAIN 4% 10-08.10.18 300,000 292,586 0.38EUR
4,471,189 5.73
BPCM 3.83% 10-06.10.17 1,075,000 1,062,011 1.36EUR
GREAT BRITAIN
SCOT & STH EN 5.025% 10-PERP 1,000,000 981,770 1.26EUR
2,043,781 2.62
ENI 3.5% 10-29.01.18 500,000 481,244 0.62EUR
ITALY
481,244 0.62
ABN AMRO 2.75% 10-29.10.13 950,000 940,093 1.21EUR
NETHERLANDS
940,093 1.21
TELEFONICA 4.75% 11-07.02.17 200,000 202,540 0.26EUR
SPAIN
202,540 0.26
11.038,602,502TOTAL BONDS
ALLIANDER 4.875% (FRN) 10-29.11.49 800,000 793,651 1.02EUR
FLOATING RATE BONDS
NETHERLANDS
793,651 1.02
1.02793,651TOTAL FLOATING RATE BONDS
12.05TOTAL TRANSFERABLE SECURITIES TRADEDON ANOTHER REGULATED MARKET
9,396,153
Description Currency Evaluation % netassets
Face Value
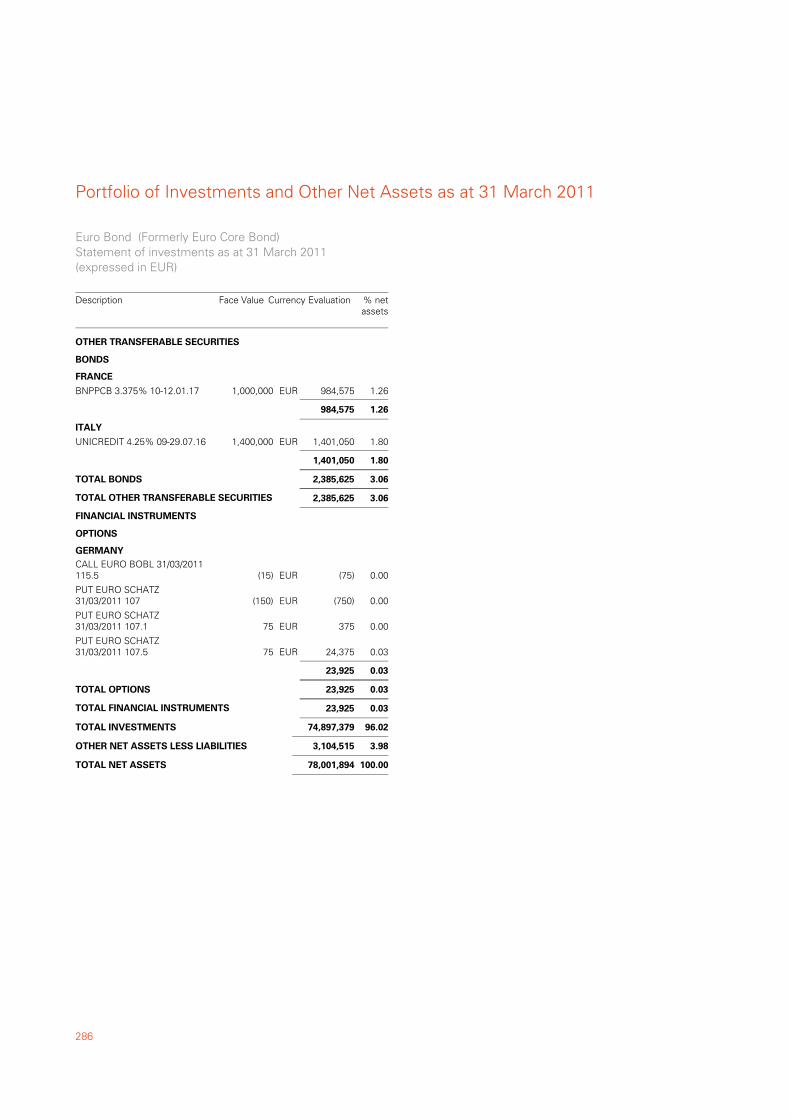
Portfolio of Investments and Other Net Assets as at 31 March 2011
286
BNPPCB 3.375% 10-12.01.17 1,000,000 984,575 1.26EUR
OTHER TRANSFERABLE SECURITIES
BONDS
FRANCE
984,575 1.26
UNICREDIT 4.25% 09-29.07.16 1,400,000 1,401,050 1.80EUR
ITALY
1,401,050 1.80
3.062,385,625TOTAL BONDS
3.06TOTAL OTHER TRANSFERABLE SECURITIES 2,385,625
CALL EURO BOBL 31/03/2011115.5 (15) (75) 0.00EUR
FINANCIAL INSTRUMENTS
OPTIONS
GERMANY
PUT EURO SCHATZ31/03/2011 107 (150) (750) 0.00EUR
PUT EURO SCHATZ31/03/2011 107.1 75 375 0.00EUR
PUT EURO SCHATZ31/03/2011 107.5 75 24,375 0.03EUR
23,925 0.03
0.0323,925TOTAL OPTIONS
0.03TOTAL FINANCIAL INSTRUMENTS 23,925
96.02TOTAL INVESTMENTS 74,897,379
3.98OTHER NET ASSETS LESS LIABILITIES 3,104,515
100.00TOTAL NET ASSETS 78,001,894
Euro Bond (Formerly Euro Core Bond)Statement of investments as at 31 March 2011(expressed in EUR)
Description Currency Evaluation % netassets
Face Value
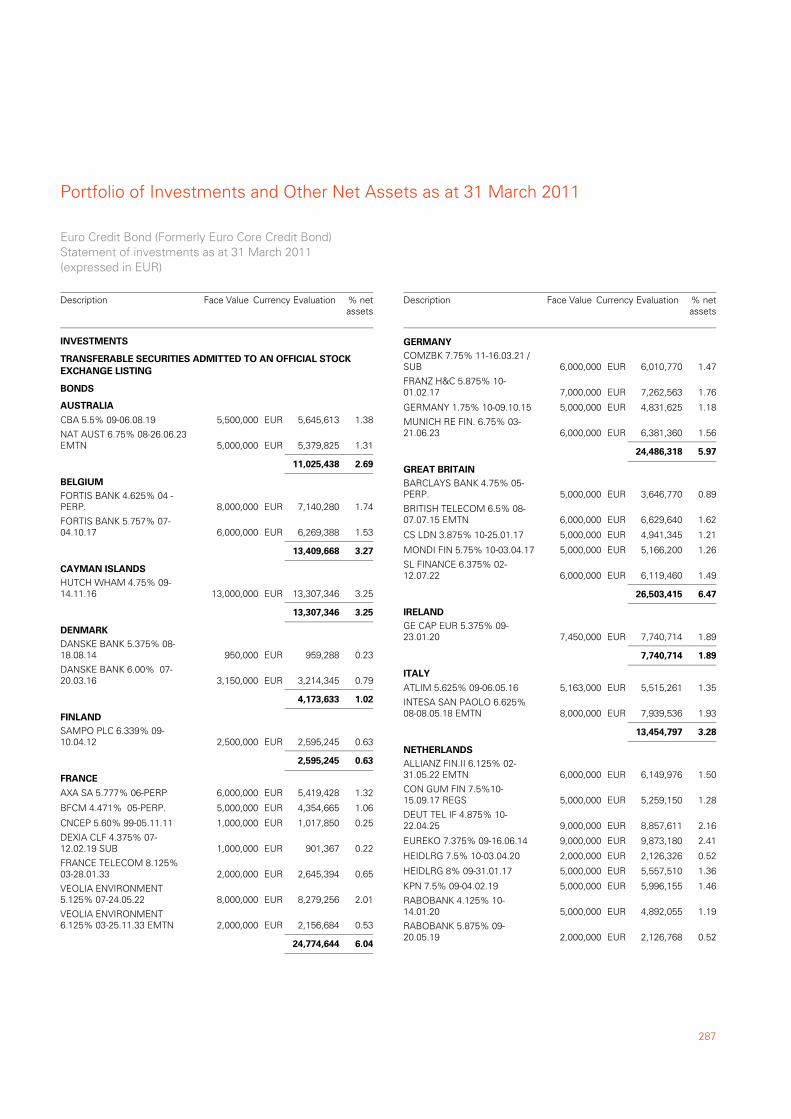
287
Portfolio of Investments and Other Net Assets as at 31 March 2011
CBA 5.5% 09-06.08.19 5,500,000 5,645,613 1.38EUR
TRANSFERABLE SECURITIES ADMITTED TO AN OFFICIAL STOCKEXCHANGE LISTING
BONDS
AUSTRALIA
NAT AUST 6.75% 08-26.06.23EMTN 5,000,000 5,379,825 1.31EUR
11,025,438 2.69
FORTIS BANK 4.625% 04 -PERP. 8,000,000 7,140,280 1.74EUR
BELGIUM
FORTIS BANK 5.757% 07-04.10.17 6,000,000 6,269,388 1.53EUR
13,409,668 3.27
HUTCH WHAM 4.75% 09-14.11.16 13,000,000 13,307,346 3.25EUR
CAYMAN ISLANDS
13,307,346 3.25
DANSKE BANK 5.375% 08-18.08.14 950,000 959,288 0.23EUR
DENMARK
DANSKE BANK 6.00% 07-20.03.16 3,150,000 3,214,345 0.79EUR
4,173,633 1.02
SAMPO PLC 6.339% 09-10.04.12 2,500,000 2,595,245 0.63EUR
FINLAND
2,595,245 0.63
AXA SA 5.777% 06-PERP 6,000,000 5,419,428 1.32EUR
FRANCE
BFCM 4.471% 05-PERP. 5,000,000 4,354,665 1.06EUR
CNCEP 5.60% 99-05.11.11 1,000,000 1,017,850 0.25EUR
DEXIA CLF 4.375% 07-12.02.19 SUB 1,000,000 901,367 0.22EUR
FRANCE TELECOM 8.125%03-28.01.33 2,000,000 2,645,394 0.65EUR
VEOLIA ENVIRONMENT5.125% 07-24.05.22 8,000,000 8,279,256 2.01EUR
VEOLIA ENVIRONMENT6.125% 03-25.11.33 EMTN 2,000,000 2,156,684 0.53EUR
24,774,644 6.04
INVESTMENTS
Euro Credit Bond (Formerly Euro Core Credit Bond)Statement of investments as at 31 March 2011(expressed in EUR)
Description Currency Evaluation % netassets
Face Value
COMZBK 7.75% 11-16.03.21 /SUB 6,000,000 6,010,770 1.47EUR
GERMANY
FRANZ H&C 5.875% 10-01.02.17 7,000,000 7,262,563 1.76EUR
GERMANY 1.75% 10-09.10.15 5,000,000 4,831,625 1.18EUR
MUNICH RE FIN. 6.75% 03-21.06.23 6,000,000 6,381,360 1.56EUR
24,486,318 5.97
BARCLAYS BANK 4.75% 05-PERP. 5,000,000 3,646,770 0.89EUR
GREAT BRITAIN
BRITISH TELECOM 6.5% 08-07.07.15 EMTN 6,000,000 6,629,640 1.62EUR
CS LDN 3.875% 10-25.01.17 5,000,000 4,941,345 1.21EUR
MONDI FIN 5.75% 10-03.04.17 5,000,000 5,166,200 1.26EUR
SL FINANCE 6.375% 02-12.07.22 6,000,000 6,119,460 1.49EUR
26,503,415 6.47
GE CAP EUR 5.375% 09-23.01.20 7,450,000 7,740,714 1.89EUR
IRELAND
7,740,714 1.89
ATLIM 5.625% 09-06.05.16 5,163,000 5,515,261 1.35EUR
ITALY
INTESA SAN PAOLO 6.625%08-08.05.18 EMTN 8,000,000 7,939,536 1.93EUR
13,454,797 3.28
ALLIANZ FIN.II 6.125% 02-31.05.22 EMTN 6,000,000 6,149,976 1.50EUR
NETHERLANDS
CON GUM FIN 7.5%10-15.09.17 REGS 5,000,000 5,259,150 1.28EUR
DEUT TEL IF 4.875% 10-22.04.25 9,000,000 8,857,611 2.16EUR
EUREKO 7.375% 09-16.06.14 9,000,000 9,873,180 2.41EUR
HEIDLRG 7.5% 10-03.04.20 2,000,000 2,126,326 0.52EUR
HEIDLRG 8% 09-31.01.17 5,000,000 5,557,510 1.36EUR
KPN 7.5% 09-04.02.19 5,000,000 5,996,155 1.46EUR
RABOBANK 4.125% 10-14.01.20 5,000,000 4,892,055 1.19EUR
RABOBANK 5.875% 09-20.05.19 2,000,000 2,126,768 0.52EUR
Description Currency Evaluation % netassets
Face Value
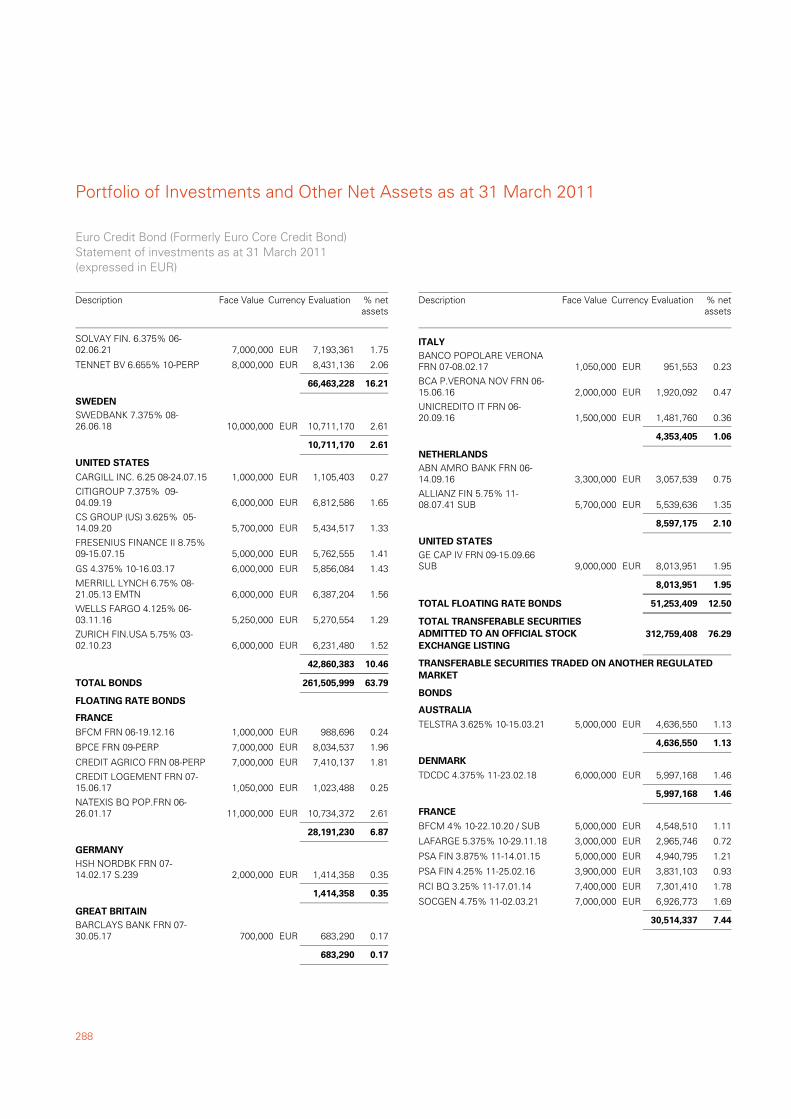
Portfolio of Investments and Other Net Assets as at 31 March 2011
288
SOLVAY FIN. 6.375% 06-02.06.21 7,000,000 7,193,361 1.75EUR
TENNET BV 6.655% 10-PERP 8,000,000 8,431,136 2.06EUR
66,463,228 16.21
SWEDBANK 7.375% 08-26.06.18 10,000,000 10,711,170 2.61EUR
SWEDEN
10,711,170 2.61
CARGILL INC. 6.25 08-24.07.15 1,000,000 1,105,403 0.27EUR
UNITED STATES
CITIGROUP 7.375% 09-04.09.19 6,000,000 6,812,586 1.65EUR
CS GROUP (US) 3.625% 05-14.09.20 5,700,000 5,434,517 1.33EUR
FRESENIUS FINANCE II 8.75%09-15.07.15 5,000,000 5,762,555 1.41EUR
GS 4.375% 10-16.03.17 6,000,000 5,856,084 1.43EUR
MERRILL LYNCH 6.75% 08-21.05.13 EMTN 6,000,000 6,387,204 1.56EUR
WELLS FARGO 4.125% 06-03.11.16 5,250,000 5,270,554 1.29EUR
ZURICH FIN.USA 5.75% 03-02.10.23 6,000,000 6,231,480 1.52EUR
42,860,383 10.46
63.79261,505,999TOTAL BONDS
BFCM FRN 06-19.12.16 1,000,000 988,696 0.24EUR
FLOATING RATE BONDS
FRANCE
BPCE FRN 09-PERP 7,000,000 8,034,537 1.96EUR
CREDIT AGRICO FRN 08-PERP 7,000,000 7,410,137 1.81EUR
CREDIT LOGEMENT FRN 07-15.06.17 1,050,000 1,023,488 0.25EUR
NATEXIS BQ POP.FRN 06-26.01.17 11,000,000 10,734,372 2.61EUR
28,191,230 6.87
HSH NORDBK FRN 07-14.02.17 S.239 2,000,000 1,414,358 0.35EUR
GERMANY
1,414,358 0.35
BARCLAYS BANK FRN 07-30.05.17 700,000 683,290 0.17EUR
GREAT BRITAIN
683,290 0.17
Euro Credit Bond (Formerly Euro Core Credit Bond)Statement of investments as at 31 March 2011(expressed in EUR)
Description Currency Evaluation % netassets
Face Value
BANCO POPOLARE VERONAFRN 07-08.02.17 1,050,000 951,553 0.23EUR
ITALY
BCA P.VERONA NOV FRN 06-15.06.16 2,000,000 1,920,092 0.47EUR
UNICREDITO IT FRN 06-20.09.16 1,500,000 1,481,760 0.36EUR
4,353,405 1.06
ABN AMRO BANK FRN 06-14.09.16 3,300,000 3,057,539 0.75EUR
NETHERLANDS
ALLIANZ FIN 5.75% 11-08.07.41 SUB 5,700,000 5,539,636 1.35EUR
8,597,175 2.10
GE CAP IV FRN 09-15.09.66SUB 9,000,000 8,013,951 1.95EUR
UNITED STATES
8,013,951 1.95
12.5051,253,409TOTAL FLOATING RATE BONDS
76.29TOTAL TRANSFERABLE SECURITIESADMITTED TO AN OFFICIAL STOCKEXCHANGE LISTING
312,759,408
TELSTRA 3.625% 10-15.03.21 5,000,000 4,636,550 1.13EUR
TRANSFERABLE SECURITIES TRADED ON ANOTHER REGULATEDMARKET
BONDS
AUSTRALIA
4,636,550 1.13
TDCDC 4.375% 11-23.02.18 6,000,000 5,997,168 1.46EUR
DENMARK
5,997,168 1.46
BFCM 4% 10-22.10.20 / SUB 5,000,000 4,548,510 1.11EUR
FRANCE
LAFARGE 5.375% 10-29.11.18 3,000,000 2,965,746 0.72EUR
PSA FIN 3.875% 11-14.01.15 5,000,000 4,940,795 1.21EUR
PSA FIN 4.25% 11-25.02.16 3,900,000 3,831,103 0.93EUR
RCI BQ 3.25% 11-17.01.14 7,400,000 7,301,410 1.78EUR
SOCGEN 4.75% 11-02.03.21 7,000,000 6,926,773 1.69EUR
30,514,337 7.44
Description Currency Evaluation % netassets
Face Value
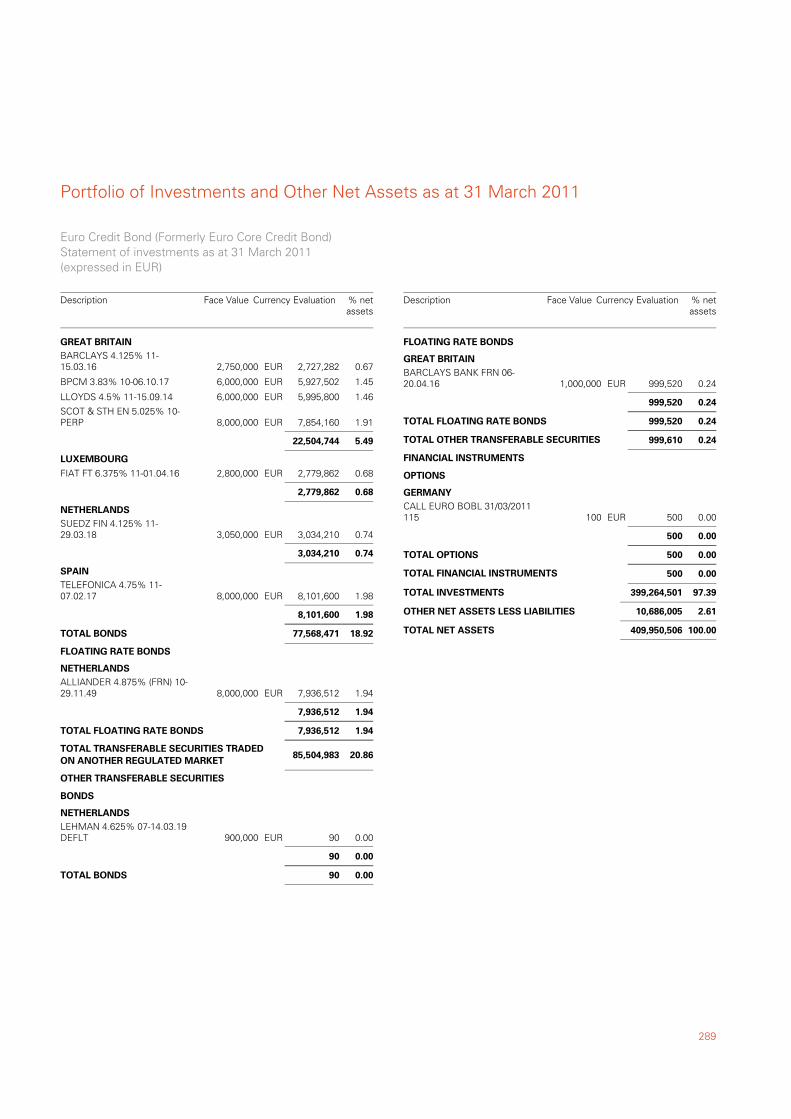
289
Portfolio of Investments and Other Net Assets as at 31 March 2011
BARCLAYS 4.125% 11-15.03.16 2,750,000 2,727,282 0.67EUR
GREAT BRITAIN
BPCM 3.83% 10-06.10.17 6,000,000 5,927,502 1.45EUR
LLOYDS 4.5% 11-15.09.14 6,000,000 5,995,800 1.46EUR
SCOT & STH EN 5.025% 10-PERP 8,000,000 7,854,160 1.91EUR
22,504,744 5.49
FIAT FT 6.375% 11-01.04.16 2,800,000 2,779,862 0.68EUR
LUXEMBOURG
2,779,862 0.68
SUEDZ FIN 4.125% 11-29.03.18 3,050,000 3,034,210 0.74EUR
NETHERLANDS
3,034,210 0.74
TELEFONICA 4.75% 11-07.02.17 8,000,000 8,101,600 1.98EUR
SPAIN
8,101,600 1.98
18.9277,568,471TOTAL BONDS
ALLIANDER 4.875% (FRN) 10-29.11.49 8,000,000 7,936,512 1.94EUR
FLOATING RATE BONDS
NETHERLANDS
7,936,512 1.94
1.947,936,512TOTAL FLOATING RATE BONDS
20.86TOTAL TRANSFERABLE SECURITIES TRADEDON ANOTHER REGULATED MARKET
85,504,983
LEHMAN 4.625% 07-14.03.19DEFLT 900,000 90 0.00EUR
OTHER TRANSFERABLE SECURITIES
BONDS
NETHERLANDS
90 0.00
0.0090TOTAL BONDS
Euro Credit Bond (Formerly Euro Core Credit Bond)Statement of investments as at 31 March 2011(expressed in EUR)
Description Currency Evaluation % netassets
Face Value
BARCLAYS BANK FRN 06-20.04.16 1,000,000 999,520 0.24EUR
FLOATING RATE BONDS
GREAT BRITAIN
999,520 0.24
0.24999,520TOTAL FLOATING RATE BONDS
0.24TOTAL OTHER TRANSFERABLE SECURITIES 999,610
CALL EURO BOBL 31/03/2011115 100 500 0.00EUR
FINANCIAL INSTRUMENTS
OPTIONS
GERMANY
500 0.00
0.00500TOTAL OPTIONS
0.00TOTAL FINANCIAL INSTRUMENTS 500
97.39TOTAL INVESTMENTS 399,264,501
2.61OTHER NET ASSETS LESS LIABILITIES 10,686,005
100.00TOTAL NET ASSETS 409,950,506
Description Currency Evaluation % netassets
Face Value
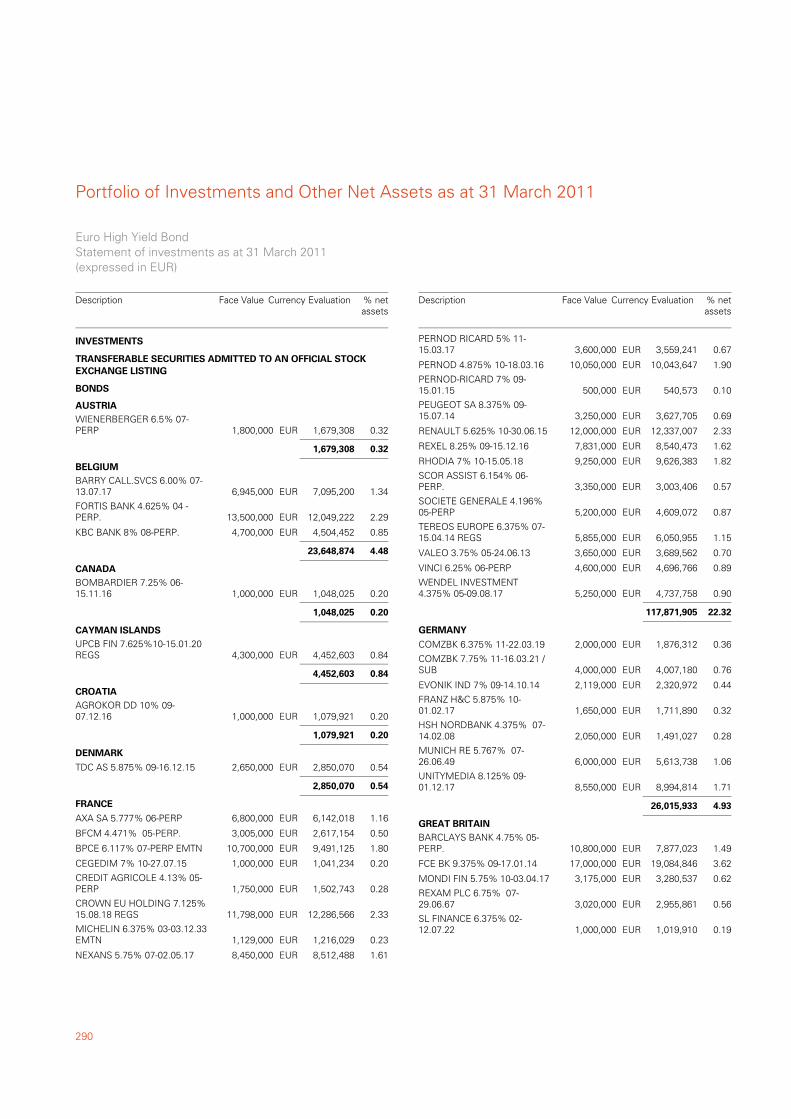
Portfolio of Investments and Other Net Assets as at 31 March 2011
290
WIENERBERGER 6.5% 07-PERP 1,800,000 1,679,308 0.32EUR
TRANSFERABLE SECURITIES ADMITTED TO AN OFFICIAL STOCKEXCHANGE LISTING
BONDS
AUSTRIA
1,679,308 0.32
BARRY CALL.SVCS 6.00% 07-13.07.17 6,945,000 7,095,200 1.34EUR
BELGIUM
FORTIS BANK 4.625% 04 -PERP. 13,500,000 12,049,222 2.29EUR
KBC BANK 8% 08-PERP. 4,700,000 4,504,452 0.85EUR
23,648,874 4.48
BOMBARDIER 7.25% 06-15.11.16 1,000,000 1,048,025 0.20EUR
CANADA
1,048,025 0.20
UPCB FIN 7.625%10-15.01.20REGS 4,300,000 4,452,603 0.84EUR
CAYMAN ISLANDS
4,452,603 0.84
AGROKOR DD 10% 09-07.12.16 1,000,000 1,079,921 0.20EUR
CROATIA
1,079,921 0.20
TDC AS 5.875% 09-16.12.15 2,650,000 2,850,070 0.54EUR
DENMARK
2,850,070 0.54
AXA SA 5.777% 06-PERP 6,800,000 6,142,018 1.16EUR
FRANCE
BFCM 4.471% 05-PERP. 3,005,000 2,617,154 0.50EUR
BPCE 6.117% 07-PERP EMTN 10,700,000 9,491,125 1.80EUR
CEGEDIM 7% 10-27.07.15 1,000,000 1,041,234 0.20EUR
CREDIT AGRICOLE 4.13% 05-PERP 1,750,000 1,502,743 0.28EUR
CROWN EU HOLDING 7.125%15.08.18 REGS 11,798,000 12,286,566 2.33EUR
MICHELIN 6.375% 03-03.12.33EMTN 1,129,000 1,216,029 0.23EUR
NEXANS 5.75% 07-02.05.17 8,450,000 8,512,488 1.61EUR
INVESTMENTS
Euro High Yield BondStatement of investments as at 31 March 2011(expressed in EUR)
Description Currency Evaluation % netassets
Face Value
PERNOD RICARD 5% 11-15.03.17 3,600,000 3,559,241 0.67EUR
PERNOD 4.875% 10-18.03.16 10,050,000 10,043,647 1.90EUR
PERNOD-RICARD 7% 09-15.01.15 500,000 540,573 0.10EUR
PEUGEOT SA 8.375% 09-15.07.14 3,250,000 3,627,705 0.69EUR
RENAULT 5.625% 10-30.06.15 12,000,000 12,337,007 2.33EUR
REXEL 8.25% 09-15.12.16 7,831,000 8,540,473 1.62EUR
RHODIA 7% 10-15.05.18 9,250,000 9,626,383 1.82EUR
SCOR ASSIST 6.154% 06-PERP. 3,350,000 3,003,406 0.57EUR
SOCIETE GENERALE 4.196%05-PERP 5,200,000 4,609,072 0.87EUR
TEREOS EUROPE 6.375% 07-15.04.14 REGS 5,855,000 6,050,955 1.15EUR
VALEO 3.75% 05-24.06.13 3,650,000 3,689,562 0.70EUR
VINCI 6.25% 06-PERP 4,600,000 4,696,766 0.89EUR
WENDEL INVESTMENT4.375% 05-09.08.17 5,250,000 4,737,758 0.90EUR
117,871,905 22.32
COMZBK 6.375% 11-22.03.19 2,000,000 1,876,312 0.36EUR
GERMANY
COMZBK 7.75% 11-16.03.21 /SUB 4,000,000 4,007,180 0.76EUR
EVONIK IND 7% 09-14.10.14 2,119,000 2,320,972 0.44EUR
FRANZ H&C 5.875% 10-01.02.17 1,650,000 1,711,890 0.32EUR
HSH NORDBANK 4.375% 07-14.02.08 2,050,000 1,491,027 0.28EUR
MUNICH RE 5.767% 07-26.06.49 6,000,000 5,613,738 1.06EUR
UNITYMEDIA 8.125% 09-01.12.17 8,550,000 8,994,814 1.71EUR
26,015,933 4.93
BARCLAYS BANK 4.75% 05-PERP. 10,800,000 7,877,023 1.49EUR
GREAT BRITAIN
FCE BK 9.375% 09-17.01.14 17,000,000 19,084,846 3.62EUR
MONDI FIN 5.75% 10-03.04.17 3,175,000 3,280,537 0.62EUR
REXAM PLC 6.75% 07-29.06.67 3,020,000 2,955,861 0.56EUR
SL FINANCE 6.375% 02-12.07.22 1,000,000 1,019,910 0.19EUR
Description Currency Evaluation % netassets
Face Value
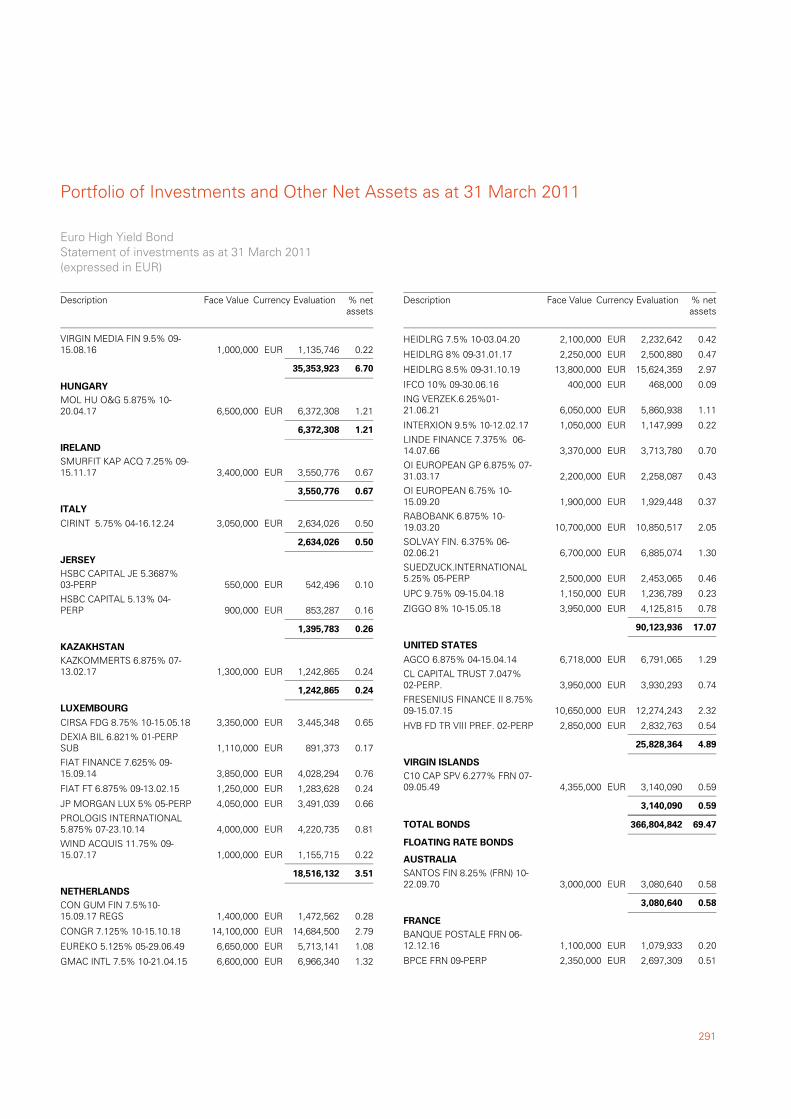
291
Portfolio of Investments and Other Net Assets as at 31 March 2011
VIRGIN MEDIA FIN 9.5% 09-15.08.16 1,000,000 1,135,746 0.22EUR
35,353,923 6.70
MOL HU O&G 5.875% 10-20.04.17 6,500,000 6,372,308 1.21EUR
HUNGARY
6,372,308 1.21
SMURFIT KAP ACQ 7.25% 09-15.11.17 3,400,000 3,550,776 0.67EUR
IRELAND
3,550,776 0.67
CIRINT 5.75% 04-16.12.24 3,050,000 2,634,026 0.50EUR
ITALY
2,634,026 0.50
HSBC CAPITAL JE 5.3687%03-PERP 550,000 542,496 0.10EUR
JERSEY
HSBC CAPITAL 5.13% 04-PERP 900,000 853,287 0.16EUR
1,395,783 0.26
KAZKOMMERTS 6.875% 07-13.02.17 1,300,000 1,242,865 0.24EUR
KAZAKHSTAN
1,242,865 0.24
CIRSA FDG 8.75% 10-15.05.18 3,350,000 3,445,348 0.65EUR
LUXEMBOURG
DEXIA BIL 6.821% 01-PERPSUB 1,110,000 891,373 0.17EUR
FIAT FINANCE 7.625% 09-15.09.14 3,850,000 4,028,294 0.76EUR
FIAT FT 6.875% 09-13.02.15 1,250,000 1,283,628 0.24EUR
JP MORGAN LUX 5% 05-PERP 4,050,000 3,491,039 0.66EUR
PROLOGIS INTERNATIONAL5.875% 07-23.10.14 4,000,000 4,220,735 0.81EUR
WIND ACQUIS 11.75% 09-15.07.17 1,000,000 1,155,715 0.22EUR
18,516,132 3.51
CON GUM FIN 7.5%10-15.09.17 REGS 1,400,000 1,472,562 0.28EUR
NETHERLANDS
CONGR 7.125% 10-15.10.18 14,100,000 14,684,500 2.79EUR
EUREKO 5.125% 05-29.06.49 6,650,000 5,713,141 1.08EUR
GMAC INTL 7.5% 10-21.04.15 6,600,000 6,966,340 1.32EUR
Euro High Yield BondStatement of investments as at 31 March 2011(expressed in EUR)
Description Currency Evaluation % netassets
Face Value
HEIDLRG 7.5% 10-03.04.20 2,100,000 2,232,642 0.42EUR
HEIDLRG 8% 09-31.01.17 2,250,000 2,500,880 0.47EUR
HEIDLRG 8.5% 09-31.10.19 13,800,000 15,624,359 2.97EUR
IFCO 10% 09-30.06.16 400,000 468,000 0.09EUR
ING VERZEK.6.25%01-21.06.21 6,050,000 5,860,938 1.11EUR
INTERXION 9.5% 10-12.02.17 1,050,000 1,147,999 0.22EUR
LINDE FINANCE 7.375% 06-14.07.66 3,370,000 3,713,780 0.70EUR
OI EUROPEAN GP 6.875% 07-31.03.17 2,200,000 2,258,087 0.43EUR
OI EUROPEAN 6.75% 10-15.09.20 1,900,000 1,929,448 0.37EUR
RABOBANK 6.875% 10-19.03.20 10,700,000 10,850,517 2.05EUR
SOLVAY FIN. 6.375% 06-02.06.21 6,700,000 6,885,074 1.30EUR
SUEDZUCK.INTERNATIONAL5.25% 05-PERP 2,500,000 2,453,065 0.46EUR
UPC 9.75% 09-15.04.18 1,150,000 1,236,789 0.23EUR
ZIGGO 8% 10-15.05.18 3,950,000 4,125,815 0.78EUR
90,123,936 17.07
AGCO 6.875% 04-15.04.14 6,718,000 6,791,065 1.29EUR
UNITED STATES
CL CAPITAL TRUST 7.047%02-PERP. 3,950,000 3,930,293 0.74EUR
FRESENIUS FINANCE II 8.75%09-15.07.15 10,650,000 12,274,243 2.32EUR
HVB FD TR VIII PREF. 02-PERP 2,850,000 2,832,763 0.54EUR
25,828,364 4.89
C10 CAP SPV 6.277% FRN 07-09.05.49 4,355,000 3,140,090 0.59EUR
VIRGIN ISLANDS
3,140,090 0.59
69.47366,804,842TOTAL BONDS
SANTOS FIN 8.25% (FRN) 10-22.09.70 3,000,000 3,080,640 0.58EUR
FLOATING RATE BONDS
AUSTRALIA
3,080,640 0.58
BANQUE POSTALE FRN 06-12.12.16 1,100,000 1,079,933 0.20EUR
FRANCE
BPCE FRN 09-PERP 2,350,000 2,697,309 0.51EUR
Description Currency Evaluation % netassets
Face Value
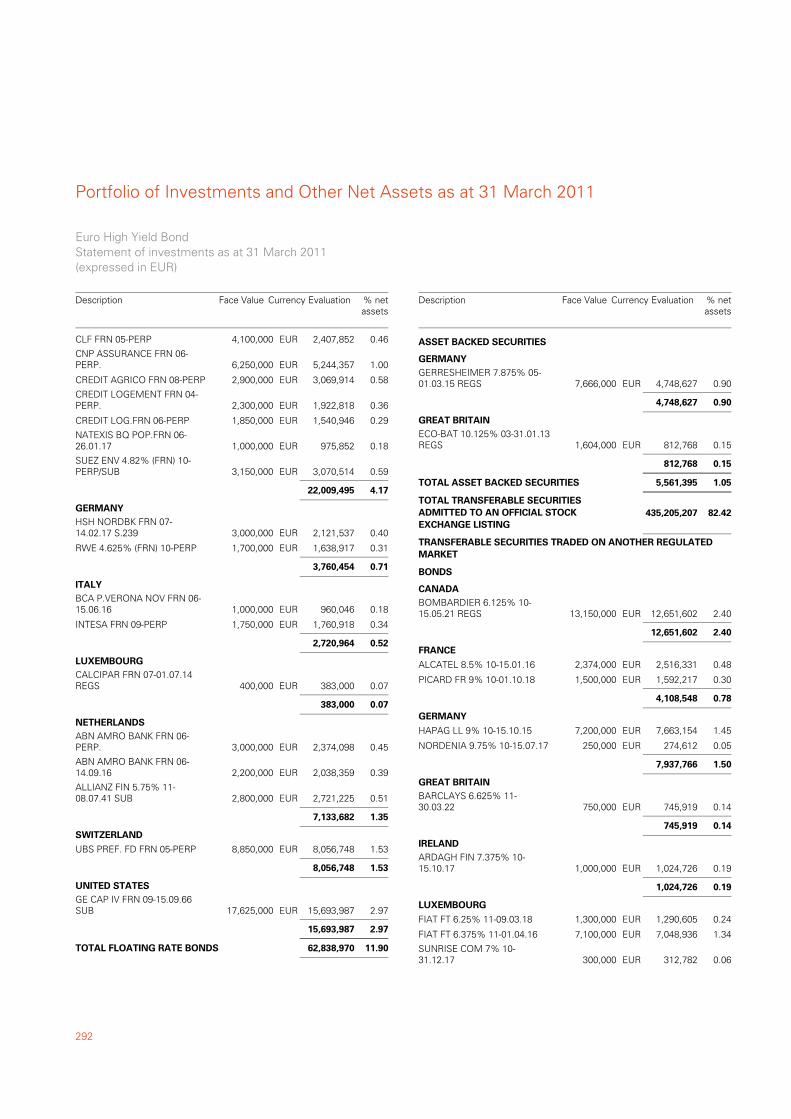
Portfolio of Investments and Other Net Assets as at 31 March 2011
292
CLF FRN 05-PERP 4,100,000 2,407,852 0.46EUR
CNP ASSURANCE FRN 06-PERP. 6,250,000 5,244,357 1.00EUR
CREDIT AGRICO FRN 08-PERP 2,900,000 3,069,914 0.58EUR
CREDIT LOGEMENT FRN 04-PERP. 2,300,000 1,922,818 0.36EUR
CREDIT LOG.FRN 06-PERP 1,850,000 1,540,946 0.29EUR
NATEXIS BQ POP.FRN 06-26.01.17 1,000,000 975,852 0.18EUR
SUEZ ENV 4.82% (FRN) 10-PERP/SUB 3,150,000 3,070,514 0.59EUR
22,009,495 4.17
HSH NORDBK FRN 07-14.02.17 S.239 3,000,000 2,121,537 0.40EUR
GERMANY
RWE 4.625% (FRN) 10-PERP 1,700,000 1,638,917 0.31EUR
3,760,454 0.71
BCA P.VERONA NOV FRN 06-15.06.16 1,000,000 960,046 0.18EUR
ITALY
INTESA FRN 09-PERP 1,750,000 1,760,918 0.34EUR
2,720,964 0.52
CALCIPAR FRN 07-01.07.14REGS 400,000 383,000 0.07EUR
LUXEMBOURG
383,000 0.07
ABN AMRO BANK FRN 06-PERP. 3,000,000 2,374,098 0.45EUR
NETHERLANDS
ABN AMRO BANK FRN 06-14.09.16 2,200,000 2,038,359 0.39EUR
ALLIANZ FIN 5.75% 11-08.07.41 SUB 2,800,000 2,721,225 0.51EUR
7,133,682 1.35
UBS PREF. FD FRN 05-PERP 8,850,000 8,056,748 1.53EUR
SWITZERLAND
8,056,748 1.53
GE CAP IV FRN 09-15.09.66SUB 17,625,000 15,693,987 2.97EUR
UNITED STATES
15,693,987 2.97
11.9062,838,970TOTAL FLOATING RATE BONDS
Euro High Yield BondStatement of investments as at 31 March 2011(expressed in EUR)
Description Currency Evaluation % netassets
Face Value
GERRESHEIMER 7.875% 05-01.03.15 REGS 7,666,000 4,748,627 0.90EUR
ASSET BACKED SECURITIES
GERMANY
4,748,627 0.90
ECO-BAT 10.125% 03-31.01.13REGS 1,604,000 812,768 0.15EUR
GREAT BRITAIN
812,768 0.15
1.055,561,395TOTAL ASSET BACKED SECURITIES
82.42TOTAL TRANSFERABLE SECURITIESADMITTED TO AN OFFICIAL STOCKEXCHANGE LISTING
435,205,207
BOMBARDIER 6.125% 10-15.05.21 REGS 13,150,000 12,651,602 2.40EUR
TRANSFERABLE SECURITIES TRADED ON ANOTHER REGULATEDMARKET
BONDS
CANADA
12,651,602 2.40
ALCATEL 8.5% 10-15.01.16 2,374,000 2,516,331 0.48EUR
FRANCE
PICARD FR 9% 10-01.10.18 1,500,000 1,592,217 0.30EUR
4,108,548 0.78
HAPAG LL 9% 10-15.10.15 7,200,000 7,663,154 1.45EUR
GERMANY
NORDENIA 9.75% 10-15.07.17 250,000 274,612 0.05EUR
7,937,766 1.50
BARCLAYS 6.625% 11-30.03.22 750,000 745,919 0.14EUR
GREAT BRITAIN
745,919 0.14
ARDAGH FIN 7.375% 10-15.10.17 1,000,000 1,024,726 0.19EUR
IRELAND
1,024,726 0.19
FIAT FT 6.25% 11-09.03.18 1,300,000 1,290,605 0.24EUR
LUXEMBOURG
FIAT FT 6.375% 11-01.04.16 7,100,000 7,048,936 1.34EUR
SUNRISE COM 7% 10-31.12.17 300,000 312,782 0.06EUR
Description Currency Evaluation % netassets
Face Value
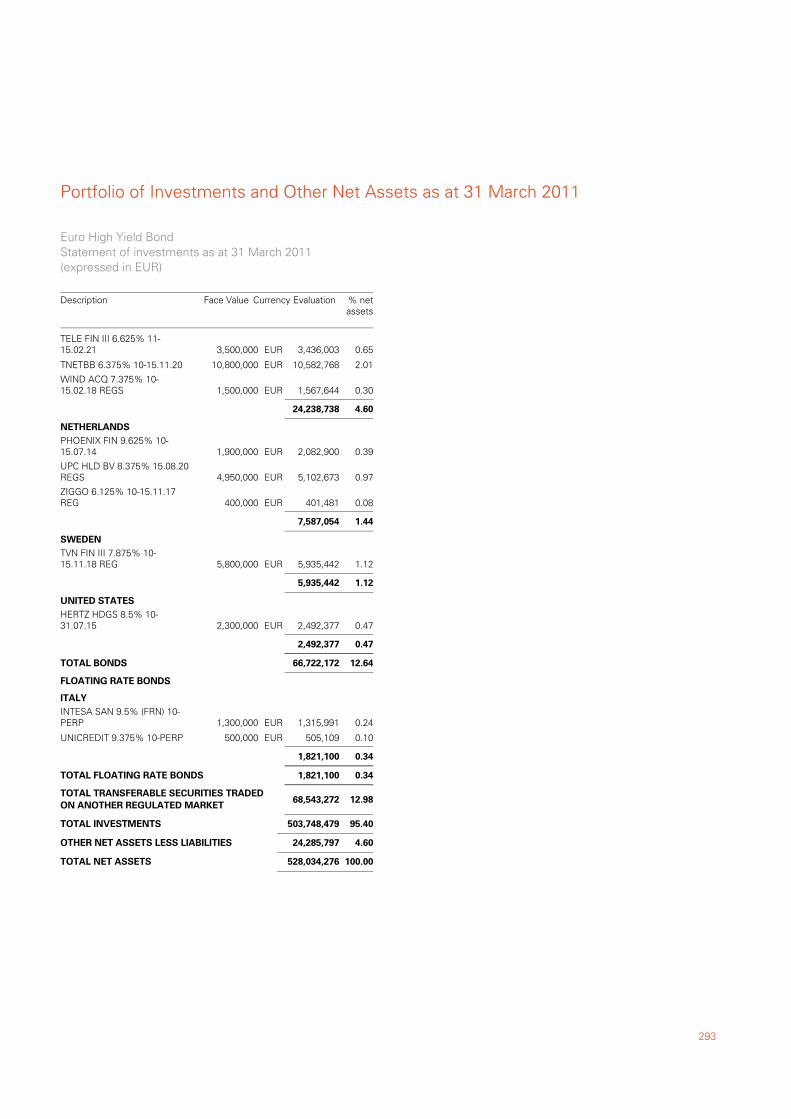
293
Portfolio of Investments and Other Net Assets as at 31 March 2011
TELE FIN III 6.625% 11-15.02.21 3,500,000 3,436,003 0.65EUR
TNETBB 6.375% 10-15.11.20 10,800,000 10,582,768 2.01EUR
WIND ACQ 7.375% 10-15.02.18 REGS 1,500,000 1,567,644 0.30EUR
24,238,738 4.60
PHOENIX FIN 9.625% 10-15.07.14 1,900,000 2,082,900 0.39EUR
NETHERLANDS
UPC HLD BV 8.375% 15.08.20REGS 4,950,000 5,102,673 0.97EUR
ZIGGO 6.125% 10-15.11.17REG 400,000 401,481 0.08EUR
7,587,054 1.44
TVN FIN III 7.875% 10-15.11.18 REG 5,800,000 5,935,442 1.12EUR
SWEDEN
5,935,442 1.12
HERTZ HDGS 8.5% 10-31.07.15 2,300,000 2,492,377 0.47EUR
UNITED STATES
2,492,377 0.47
12.6466,722,172TOTAL BONDS
INTESA SAN 9.5% (FRN) 10-PERP 1,300,000 1,315,991 0.24EUR
FLOATING RATE BONDS
ITALY
UNICREDIT 9.375% 10-PERP 500,000 505,109 0.10EUR
1,821,100 0.34
0.341,821,100TOTAL FLOATING RATE BONDS
12.98TOTAL TRANSFERABLE SECURITIES TRADEDON ANOTHER REGULATED MARKET
68,543,272
95.40TOTAL INVESTMENTS 503,748,479
4.60OTHER NET ASSETS LESS LIABILITIES 24,285,797
100.00TOTAL NET ASSETS 528,034,276
Euro High Yield BondStatement of investments as at 31 March 2011(expressed in EUR)
Description Currency Evaluation % netassets
Face Value
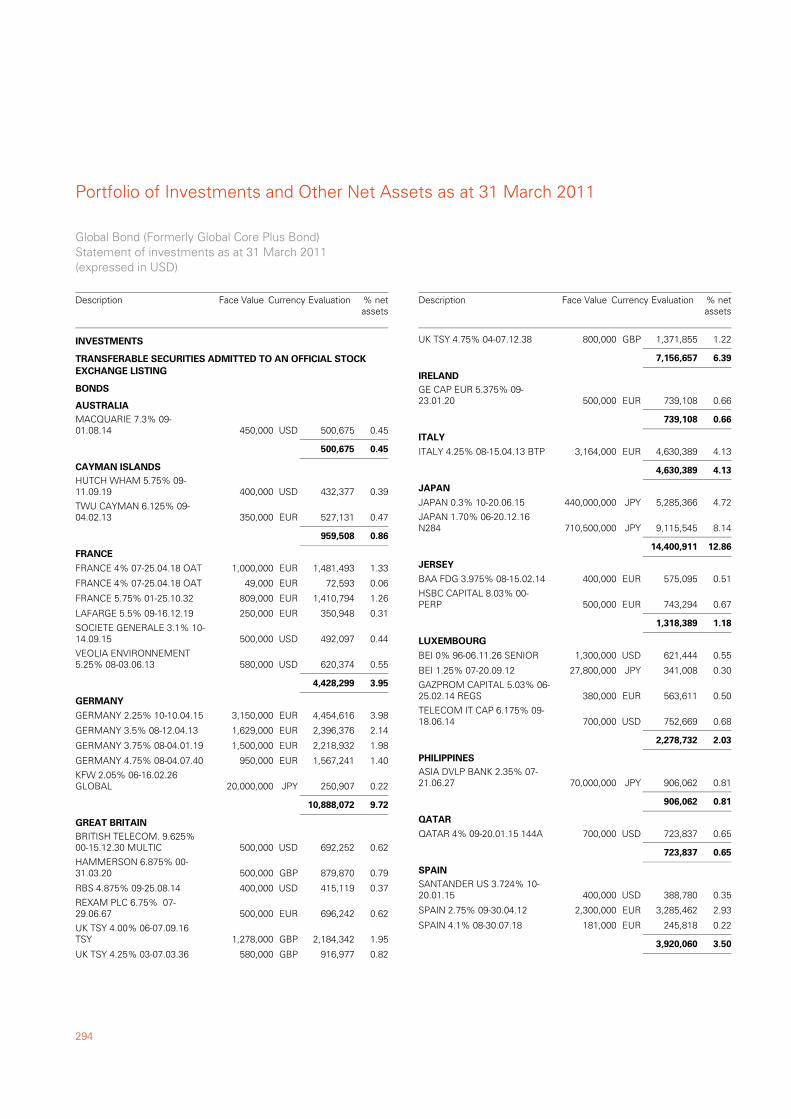
Portfolio of Investments and Other Net Assets as at 31 March 2011
294
MACQUARIE 7.3% 09-01.08.14 450,000 500,675 0.45USD
TRANSFERABLE SECURITIES ADMITTED TO AN OFFICIAL STOCKEXCHANGE LISTING
BONDS
AUSTRALIA
500,675 0.45
HUTCH WHAM 5.75% 09-11.09.19 400,000 432,377 0.39USD
CAYMAN ISLANDS
TWU CAYMAN 6.125% 09-04.02.13 350,000 527,131 0.47EUR
959,508 0.86
FRANCE 4% 07-25.04.18 OAT 1,000,000 1,481,493 1.33EUR
FRANCE
FRANCE 4% 07-25.04.18 OAT 49,000 72,593 0.06EUR
FRANCE 5.75% 01-25.10.32 809,000 1,410,794 1.26EUR
LAFARGE 5.5% 09-16.12.19 250,000 350,948 0.31EUR
SOCIETE GENERALE 3.1% 10-14.09.15 500,000 492,097 0.44USD
VEOLIA ENVIRONNEMENT5.25% 08-03.06.13 580,000 620,374 0.55USD
4,428,299 3.95
GERMANY 2.25% 10-10.04.15 3,150,000 4,454,616 3.98EUR
GERMANY
GERMANY 3.5% 08-12.04.13 1,629,000 2,396,376 2.14EUR
GERMANY 3.75% 08-04.01.19 1,500,000 2,218,932 1.98EUR
GERMANY 4.75% 08-04.07.40 950,000 1,567,241 1.40EUR
KFW 2.05% 06-16.02.26GLOBAL 20,000,000 250,907 0.22JPY
10,888,072 9.72
BRITISH TELECOM. 9.625%00-15.12.30 MULTIC 500,000 692,252 0.62USD
GREAT BRITAIN
HAMMERSON 6.875% 00-31.03.20 500,000 879,870 0.79GBP
RBS 4.875% 09-25.08.14 400,000 415,119 0.37USD
REXAM PLC 6.75% 07-29.06.67 500,000 696,242 0.62EUR
UK TSY 4.00% 06-07.09.16TSY 1,278,000 2,184,342 1.95GBP
UK TSY 4.25% 03-07.03.36 580,000 916,977 0.82GBP
INVESTMENTS
Global Bond (Formerly Global Core Plus Bond)Statement of investments as at 31 March 2011(expressed in USD)
Description Currency Evaluation % netassets
Face Value
UK TSY 4.75% 04-07.12.38 800,000 1,371,855 1.22GBP
7,156,657 6.39
GE CAP EUR 5.375% 09-23.01.20 500,000 739,108 0.66EUR
IRELAND
739,108 0.66
ITALY 4.25% 08-15.04.13 BTP 3,164,000 4,630,389 4.13EUR
ITALY
4,630,389 4.13
JAPAN 0.3% 10-20.06.15 440,000,000 5,285,366 4.72JPY
JAPAN
JAPAN 1.70% 06-20.12.16N284 710,500,000 9,115,545 8.14JPY
14,400,911 12.86
BAA FDG 3.975% 08-15.02.14 400,000 575,095 0.51EUR
JERSEY
HSBC CAPITAL 8.03% 00-PERP 500,000 743,294 0.67EUR
1,318,389 1.18
BEI 0% 96-06.11.26 SENIOR 1,300,000 621,444 0.55USD
LUXEMBOURG
BEI 1.25% 07-20.09.12 27,800,000 341,008 0.30JPY
GAZPROM CAPITAL 5.03% 06-25.02.14 REGS 380,000 563,611 0.50EUR
TELECOM IT CAP 6.175% 09-18.06.14 700,000 752,669 0.68USD
2,278,732 2.03
ASIA DVLP BANK 2.35% 07-21.06.27 70,000,000 906,062 0.81JPY
PHILIPPINES
906,062 0.81
QATAR 4% 09-20.01.15 144A 700,000 723,837 0.65USD
QATAR
723,837 0.65
SANTANDER US 3.724% 10-20.01.15 400,000 388,780 0.35USD
SPAIN
SPAIN 2.75% 09-30.04.12 2,300,000 3,285,462 2.93EUR
SPAIN 4.1% 08-30.07.18 181,000 245,818 0.22EUR
3,920,060 3.50
Description Currency Evaluation % netassets
Face Value
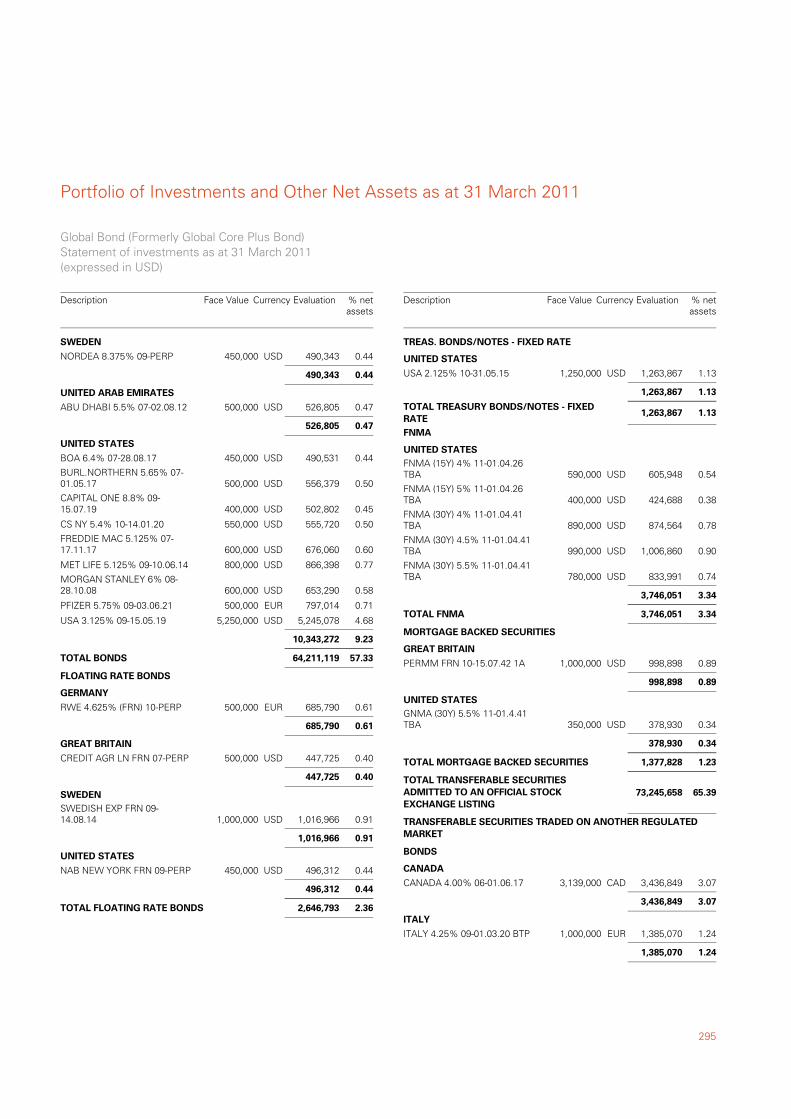
295
Portfolio of Investments and Other Net Assets as at 31 March 2011
NORDEA 8.375% 09-PERP 450,000 490,343 0.44USD
SWEDEN
490,343 0.44
ABU DHABI 5.5% 07-02.08.12 500,000 526,805 0.47USD
UNITED ARAB EMIRATES
526,805 0.47
BOA 6.4% 07-28.08.17 450,000 490,531 0.44USD
UNITED STATES
BURL.NORTHERN 5.65% 07-01.05.17 500,000 556,379 0.50USD
CAPITAL ONE 8.8% 09-15.07.19 400,000 502,802 0.45USD
CS NY 5.4% 10-14.01.20 550,000 555,720 0.50USD
FREDDIE MAC 5.125% 07-17.11.17 600,000 676,060 0.60USD
MET LIFE 5.125% 09-10.06.14 800,000 866,398 0.77USD
MORGAN STANLEY 6% 08-28.10.08 600,000 653,290 0.58USD
PFIZER 5.75% 09-03.06.21 500,000 797,014 0.71EUR
USA 3.125% 09-15.05.19 5,250,000 5,245,078 4.68USD
10,343,272 9.23
57.3364,211,119TOTAL BONDS
RWE 4.625% (FRN) 10-PERP 500,000 685,790 0.61EUR
FLOATING RATE BONDS
GERMANY
685,790 0.61
CREDIT AGR LN FRN 07-PERP 500,000 447,725 0.40USD
GREAT BRITAIN
447,725 0.40
SWEDISH EXP FRN 09-14.08.14 1,000,000 1,016,966 0.91USD
SWEDEN
1,016,966 0.91
NAB NEW YORK FRN 09-PERP 450,000 496,312 0.44USD
UNITED STATES
496,312 0.44
2.362,646,793TOTAL FLOATING RATE BONDS
Global Bond (Formerly Global Core Plus Bond)Statement of investments as at 31 March 2011(expressed in USD)
Description Currency Evaluation % netassets
Face Value
USA 2.125% 10-31.05.15 1,250,000 1,263,867 1.13USD
TREAS. BONDS/NOTES - FIXED RATE
UNITED STATES
1,263,867 1.13
1.131,263,867TOTAL TREASURY BONDS/NOTES - FIXEDRATE
FNMA (15Y) 4% 11-01.04.26TBA 590,000 605,948 0.54USD
FNMA
UNITED STATES
FNMA (15Y) 5% 11-01.04.26TBA 400,000 424,688 0.38USD
FNMA (30Y) 4% 11-01.04.41TBA 890,000 874,564 0.78USD
FNMA (30Y) 4.5% 11-01.04.41TBA 990,000 1,006,860 0.90USD
FNMA (30Y) 5.5% 11-01.04.41TBA 780,000 833,991 0.74USD
3,746,051 3.34
3.343,746,051TOTAL FNMA
PERMM FRN 10-15.07.42 1A 1,000,000 998,898 0.89USD
MORTGAGE BACKED SECURITIES
GREAT BRITAIN
998,898 0.89
GNMA (30Y) 5.5% 11-01.4.41TBA 350,000 378,930 0.34USD
UNITED STATES
378,930 0.34
1.231,377,828TOTAL MORTGAGE BACKED SECURITIES
65.39TOTAL TRANSFERABLE SECURITIESADMITTED TO AN OFFICIAL STOCKEXCHANGE LISTING
73,245,658
CANADA 4.00% 06-01.06.17 3,139,000 3,436,849 3.07CAD
TRANSFERABLE SECURITIES TRADED ON ANOTHER REGULATEDMARKET
BONDS
CANADA
3,436,849 3.07
ITALY 4.25% 09-01.03.20 BTP 1,000,000 1,385,070 1.24EUR
ITALY
1,385,070 1.24
Description Currency Evaluation % netassets
Face Value
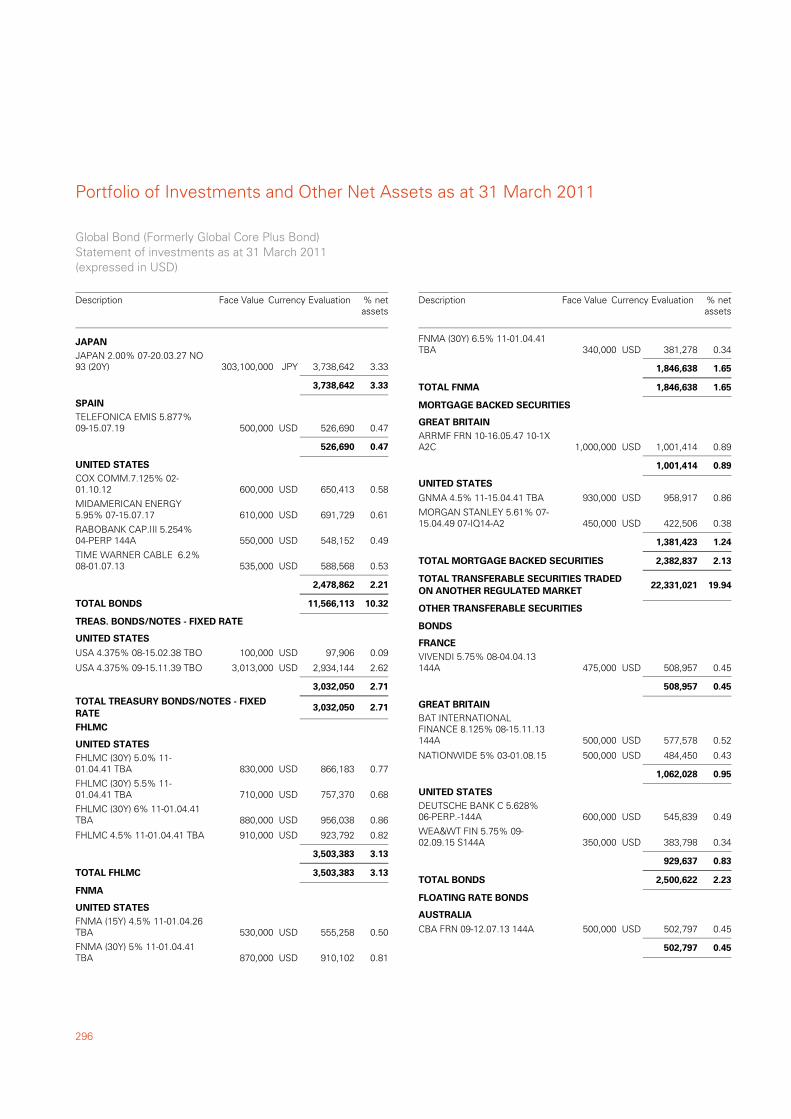
Portfolio of Investments and Other Net Assets as at 31 March 2011
296
JAPAN 2.00% 07-20.03.27 NO93 (20Y) 303,100,000 3,738,642 3.33JPY
JAPAN
3,738,642 3.33
TELEFONICA EMIS 5.877%09-15.07.19 500,000 526,690 0.47USD
SPAIN
526,690 0.47
COX COMM.7.125% 02-01.10.12 600,000 650,413 0.58USD
UNITED STATES
MIDAMERICAN ENERGY5.95% 07-15.07.17 610,000 691,729 0.61USD
RABOBANK CAP.III 5.254%04-PERP 144A 550,000 548,152 0.49USD
TIME WARNER CABLE 6.2%08-01.07.13 535,000 588,568 0.53USD
2,478,862 2.21
10.3211,566,113TOTAL BONDS
USA 4.375% 08-15.02.38 TBO 100,000 97,906 0.09USD
TREAS. BONDS/NOTES - FIXED RATE
UNITED STATES
USA 4.375% 09-15.11.39 TBO 3,013,000 2,934,144 2.62USD
3,032,050 2.71
2.713,032,050TOTAL TREASURY BONDS/NOTES - FIXEDRATE
FHLMC (30Y) 5.0% 11-01.04.41 TBA 830,000 866,183 0.77USD
FHLMC
UNITED STATES
FHLMC (30Y) 5.5% 11-01.04.41 TBA 710,000 757,370 0.68USD
FHLMC (30Y) 6% 11-01.04.41TBA 880,000 956,038 0.86USD
FHLMC 4.5% 11-01.04.41 TBA 910,000 923,792 0.82USD
3,503,383 3.13
3.133,503,383TOTAL FHLMC
FNMA (15Y) 4.5% 11-01.04.26TBA 530,000 555,258 0.50USD
FNMA
UNITED STATES
FNMA (30Y) 5% 11-01.04.41TBA 870,000 910,102 0.81USD
Global Bond (Formerly Global Core Plus Bond)Statement of investments as at 31 March 2011(expressed in USD)
Description Currency Evaluation % netassets
Face Value
FNMA (30Y) 6.5% 11-01.04.41TBA 340,000 381,278 0.34USD
1,846,638 1.65
1.651,846,638TOTAL FNMA
ARRMF FRN 10-16.05.47 10-1XA2C 1,000,000 1,001,414 0.89USD
MORTGAGE BACKED SECURITIES
GREAT BRITAIN
1,001,414 0.89
GNMA 4.5% 11-15.04.41 TBA 930,000 958,917 0.86USD
UNITED STATES
MORGAN STANLEY 5.61% 07-15.04.49 07-IQ14-A2 450,000 422,506 0.38USD
1,381,423 1.24
2.132,382,837TOTAL MORTGAGE BACKED SECURITIES
19.94TOTAL TRANSFERABLE SECURITIES TRADEDON ANOTHER REGULATED MARKET
22,331,021
VIVENDI 5.75% 08-04.04.13144A 475,000 508,957 0.45USD
OTHER TRANSFERABLE SECURITIES
BONDS
FRANCE
508,957 0.45
BAT INTERNATIONALFINANCE 8.125% 08-15.11.13144A 500,000 577,578 0.52USD
GREAT BRITAIN
NATIONWIDE 5% 03-01.08.15 500,000 484,450 0.43USD
1,062,028 0.95
DEUTSCHE BANK C 5.628%06-PERP.-144A 600,000 545,839 0.49USD
UNITED STATES
WEA&WT FIN 5.75% 09-02.09.15 S144A 350,000 383,798 0.34USD
929,637 0.83
2.232,500,622TOTAL BONDS
CBA FRN 09-12.07.13 144A 500,000 502,797 0.45USD
FLOATING RATE BONDS
AUSTRALIA
502,797 0.45
Description Currency Evaluation % netassets
Face Value
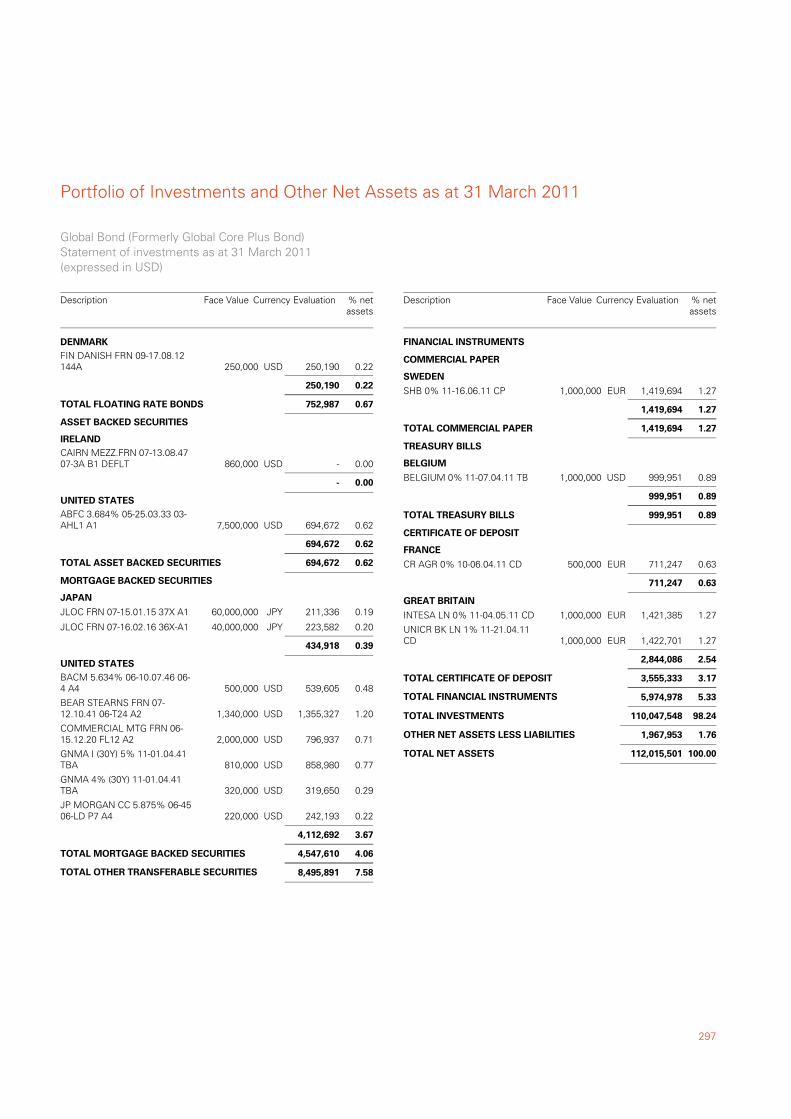
297
Portfolio of Investments and Other Net Assets as at 31 March 2011
FIN DANISH FRN 09-17.08.12144A 250,000 250,190 0.22USD
DENMARK
250,190 0.22
0.67752,987TOTAL FLOATING RATE BONDS
CAIRN MEZZ.FRN 07-13.08.4707-3A B1 DEFLT 860,000 - 0.00USD
ASSET BACKED SECURITIES
IRELAND
- 0.00
ABFC 3.684% 05-25.03.33 03-AHL1 A1 7,500,000 694,672 0.62USD
UNITED STATES
694,672 0.62
0.62694,672TOTAL ASSET BACKED SECURITIES
JLOC FRN 07-15.01.15 37X A1 60,000,000 211,336 0.19JPY
MORTGAGE BACKED SECURITIES
JAPAN
JLOC FRN 07-16.02.16 36X-A1 40,000,000 223,582 0.20JPY
434,918 0.39
BACM 5.634% 06-10.07.46 06-4 A4 500,000 539,605 0.48USD
UNITED STATES
BEAR STEARNS FRN 07-12.10.41 06-T24 A2 1,340,000 1,355,327 1.20USD
COMMERCIAL MTG FRN 06-15.12.20 FL12 A2 2,000,000 796,937 0.71USD
GNMA I (30Y) 5% 11-01.04.41TBA 810,000 858,980 0.77USD
GNMA 4% (30Y) 11-01.04.41TBA 320,000 319,650 0.29USD
JP MORGAN CC 5.875% 06-4506-LD P7 A4 220,000 242,193 0.22USD
4,112,692 3.67
4.064,547,610TOTAL MORTGAGE BACKED SECURITIES
7.58TOTAL OTHER TRANSFERABLE SECURITIES 8,495,891
Global Bond (Formerly Global Core Plus Bond)Statement of investments as at 31 March 2011(expressed in USD)
Description Currency Evaluation % netassets
Face Value
SHB 0% 11-16.06.11 CP 1,000,000 1,419,694 1.27EUR
FINANCIAL INSTRUMENTS
COMMERCIAL PAPER
SWEDEN
1,419,694 1.27
1.271,419,694TOTAL COMMERCIAL PAPER
BELGIUM 0% 11-07.04.11 TB 1,000,000 999,951 0.89USD
TREASURY BILLS
BELGIUM
999,951 0.89
0.89999,951TOTAL TREASURY BILLS
CR AGR 0% 10-06.04.11 CD 500,000 711,247 0.63EUR
CERTIFICATE OF DEPOSIT
FRANCE
711,247 0.63
INTESA LN 0% 11-04.05.11 CD 1,000,000 1,421,385 1.27EUR
GREAT BRITAIN
UNICR BK LN 1% 11-21.04.11CD 1,000,000 1,422,701 1.27EUR
2,844,086 2.54
3.173,555,333TOTAL CERTIFICATE OF DEPOSIT
5.33TOTAL FINANCIAL INSTRUMENTS 5,974,978
98.24TOTAL INVESTMENTS 110,047,548
1.76OTHER NET ASSETS LESS LIABILITIES 1,967,953
100.00TOTAL NET ASSETS 112,015,501
Description Currency Evaluation % netassets
Face Value
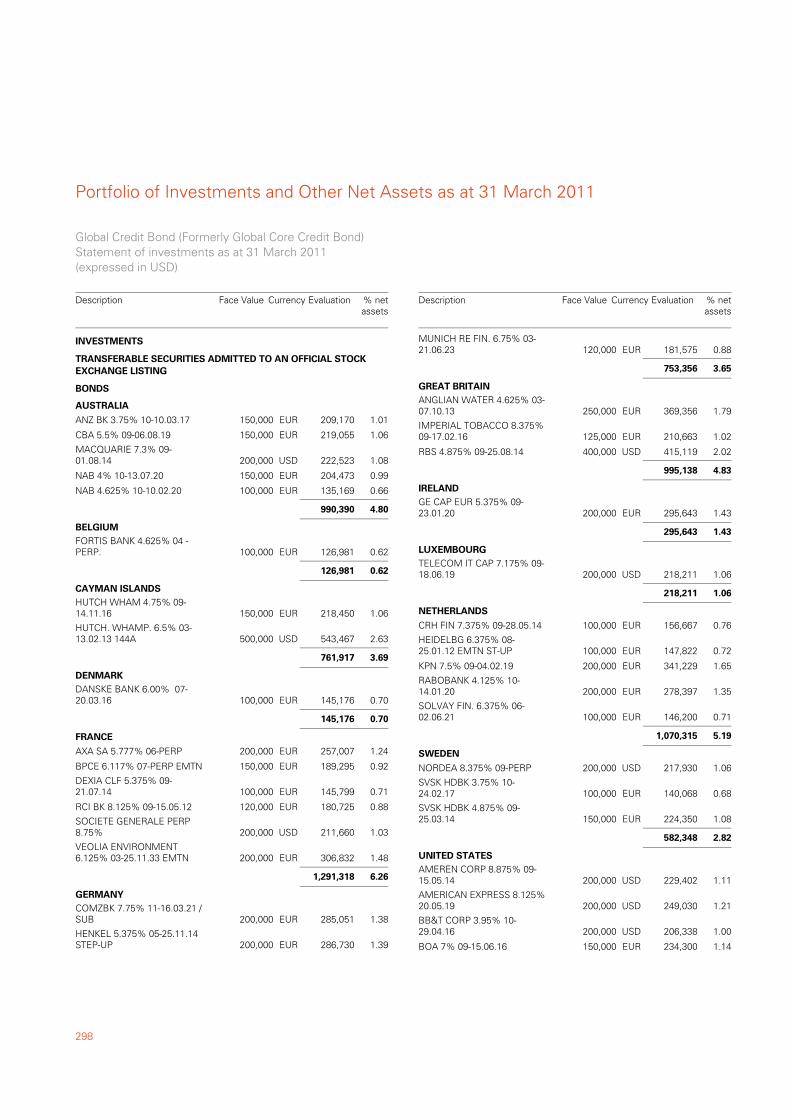
Portfolio of Investments and Other Net Assets as at 31 March 2011
298
ANZ BK 3.75% 10-10.03.17 150,000 209,170 1.01EUR
TRANSFERABLE SECURITIES ADMITTED TO AN OFFICIAL STOCKEXCHANGE LISTING
BONDS
AUSTRALIA
CBA 5.5% 09-06.08.19 150,000 219,055 1.06EUR
MACQUARIE 7.3% 09-01.08.14 200,000 222,523 1.08USD
NAB 4% 10-13.07.20 150,000 204,473 0.99EUR
NAB 4.625% 10-10.02.20 100,000 135,169 0.66EUR
990,390 4.80
FORTIS BANK 4.625% 04 -PERP. 100,000 126,981 0.62EUR
BELGIUM
126,981 0.62
HUTCH WHAM 4.75% 09-14.11.16 150,000 218,450 1.06EUR
CAYMAN ISLANDS
HUTCH. WHAMP. 6.5% 03-13.02.13 144A 500,000 543,467 2.63USD
761,917 3.69
DANSKE BANK 6.00% 07-20.03.16 100,000 145,176 0.70EUR
DENMARK
145,176 0.70
AXA SA 5.777% 06-PERP 200,000 257,007 1.24EUR
FRANCE
BPCE 6.117% 07-PERP EMTN 150,000 189,295 0.92EUR
DEXIA CLF 5.375% 09-21.07.14 100,000 145,799 0.71EUR
RCI BK 8.125% 09-15.05.12 120,000 180,725 0.88EUR
SOCIETE GENERALE PERP8.75% 200,000 211,660 1.03USD
VEOLIA ENVIRONMENT6.125% 03-25.11.33 EMTN 200,000 306,832 1.48EUR
1,291,318 6.26
COMZBK 7.75% 11-16.03.21 /SUB 200,000 285,051 1.38EUR
GERMANY
HENKEL 5.375% 05-25.11.14STEP-UP 200,000 286,730 1.39EUR
INVESTMENTS
Global Credit Bond (Formerly Global Core Credit Bond)Statement of investments as at 31 March 2011(expressed in USD)
Description Currency Evaluation % netassets
Face Value
MUNICH RE FIN. 6.75% 03-21.06.23 120,000 181,575 0.88EUR
753,356 3.65
ANGLIAN WATER 4.625% 03-07.10.13 250,000 369,356 1.79EUR
GREAT BRITAIN
IMPERIAL TOBACCO 8.375%09-17.02.16 125,000 210,663 1.02EUR
RBS 4.875% 09-25.08.14 400,000 415,119 2.02USD
995,138 4.83
GE CAP EUR 5.375% 09-23.01.20 200,000 295,643 1.43EUR
IRELAND
295,643 1.43
TELECOM IT CAP 7.175% 09-18.06.19 200,000 218,211 1.06USD
LUXEMBOURG
218,211 1.06
CRH FIN 7.375% 09-28.05.14 100,000 156,667 0.76EUR
NETHERLANDS
HEIDELBG 6.375% 08-25.01.12 EMTN ST-UP 100,000 147,822 0.72EUR
KPN 7.5% 09-04.02.19 200,000 341,229 1.65EUR
RABOBANK 4.125% 10-14.01.20 200,000 278,397 1.35EUR
SOLVAY FIN. 6.375% 06-02.06.21 100,000 146,200 0.71EUR
1,070,315 5.19
NORDEA 8.375% 09-PERP 200,000 217,930 1.06USD
SWEDEN
SVSK HDBK 3.75% 10-24.02.17 100,000 140,068 0.68EUR
SVSK HDBK 4.875% 09-25.03.14 150,000 224,350 1.08EUR
582,348 2.82
AMEREN CORP 8.875% 09-15.05.14 200,000 229,402 1.11USD
UNITED STATES
AMERICAN EXPRESS 8.125%20.05.19 200,000 249,030 1.21USD
BB&T CORP 3.95% 10-29.04.16 200,000 206,338 1.00USD
BOA 7% 09-15.06.16 150,000 234,300 1.14EUR
Description Currency Evaluation % netassets
Face Value
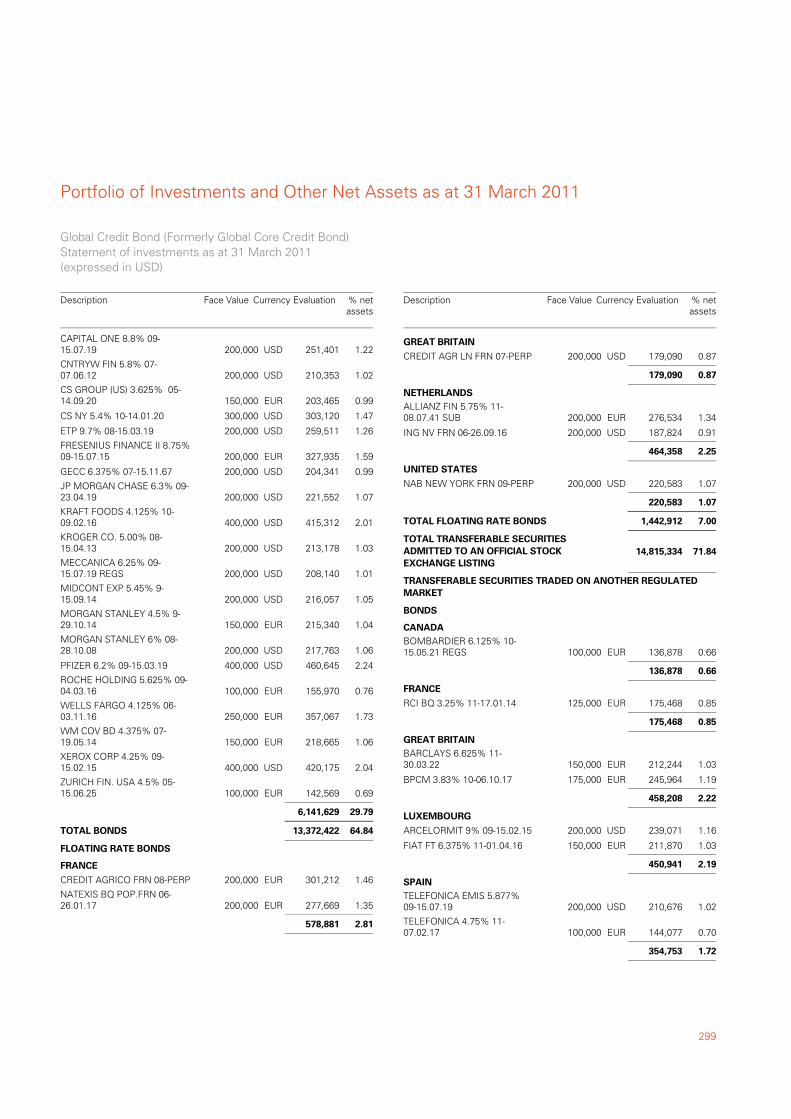
299
Portfolio of Investments and Other Net Assets as at 31 March 2011
CAPITAL ONE 8.8% 09-15.07.19 200,000 251,401 1.22USD
CNTRYW FIN 5.8% 07-07.06.12 200,000 210,353 1.02USD
CS GROUP (US) 3.625% 05-14.09.20 150,000 203,465 0.99EUR
CS NY 5.4% 10-14.01.20 300,000 303,120 1.47USD
ETP 9.7% 08-15.03.19 200,000 259,511 1.26USD
FRESENIUS FINANCE II 8.75%09-15.07.15 200,000 327,935 1.59EUR
GECC 6.375% 07-15.11.67 200,000 204,341 0.99USD
JP MORGAN CHASE 6.3% 09-23.04.19 200,000 221,552 1.07USD
KRAFT FOODS 4.125% 10-09.02.16 400,000 415,312 2.01USD
KROGER CO. 5.00% 08-15.04.13 200,000 213,178 1.03USD
MECCANICA 6.25% 09-15.07.19 REGS 200,000 208,140 1.01USD
MIDCONT EXP 5.45% 9-15.09.14 200,000 216,057 1.05USD
MORGAN STANLEY 4.5% 9-29.10.14 150,000 215,340 1.04EUR
MORGAN STANLEY 6% 08-28.10.08 200,000 217,763 1.06USD
PFIZER 6.2% 09-15.03.19 400,000 460,645 2.24USD
ROCHE HOLDING 5.625% 09-04.03.16 100,000 155,970 0.76EUR
WELLS FARGO 4.125% 06-03.11.16 250,000 357,067 1.73EUR
WM COV BD 4.375% 07-19.05.14 150,000 218,665 1.06EUR
XEROX CORP 4.25% 09-15.02.15 400,000 420,175 2.04USD
ZURICH FIN. USA 4.5% 05-15.06.25 100,000 142,569 0.69EUR
6,141,629 29.79
64.8413,372,422TOTAL BONDS
CREDIT AGRICO FRN 08-PERP 200,000 301,212 1.46EUR
FLOATING RATE BONDS
FRANCE
NATEXIS BQ POP.FRN 06-26.01.17 200,000 277,669 1.35EUR
578,881 2.81
Global Credit Bond (Formerly Global Core Credit Bond)Statement of investments as at 31 March 2011(expressed in USD)
Description Currency Evaluation % netassets
Face Value
CREDIT AGR LN FRN 07-PERP 200,000 179,090 0.87USD
GREAT BRITAIN
179,090 0.87
ALLIANZ FIN 5.75% 11-08.07.41 SUB 200,000 276,534 1.34EUR
NETHERLANDS
ING NV FRN 06-26.09.16 200,000 187,824 0.91USD
464,358 2.25
NAB NEW YORK FRN 09-PERP 200,000 220,583 1.07USD
UNITED STATES
220,583 1.07
7.001,442,912TOTAL FLOATING RATE BONDS
71.84TOTAL TRANSFERABLE SECURITIESADMITTED TO AN OFFICIAL STOCKEXCHANGE LISTING
14,815,334
BOMBARDIER 6.125% 10-15.05.21 REGS 100,000 136,878 0.66EUR
TRANSFERABLE SECURITIES TRADED ON ANOTHER REGULATEDMARKET
BONDS
CANADA
136,878 0.66
RCI BQ 3.25% 11-17.01.14 125,000 175,468 0.85EUR
FRANCE
175,468 0.85
BARCLAYS 6.625% 11-30.03.22 150,000 212,244 1.03EUR
GREAT BRITAIN
BPCM 3.83% 10-06.10.17 175,000 245,964 1.19EUR
458,208 2.22
ARCELORMIT 9% 09-15.02.15 200,000 239,071 1.16USD
LUXEMBOURG
FIAT FT 6.375% 11-01.04.16 150,000 211,870 1.03EUR
450,941 2.19
TELEFONICA EMIS 5.877%09-15.07.19 200,000 210,676 1.02USD
SPAIN
TELEFONICA 4.75% 11-07.02.17 100,000 144,077 0.70EUR
354,753 1.72
Description Currency Evaluation % netassets
Face Value
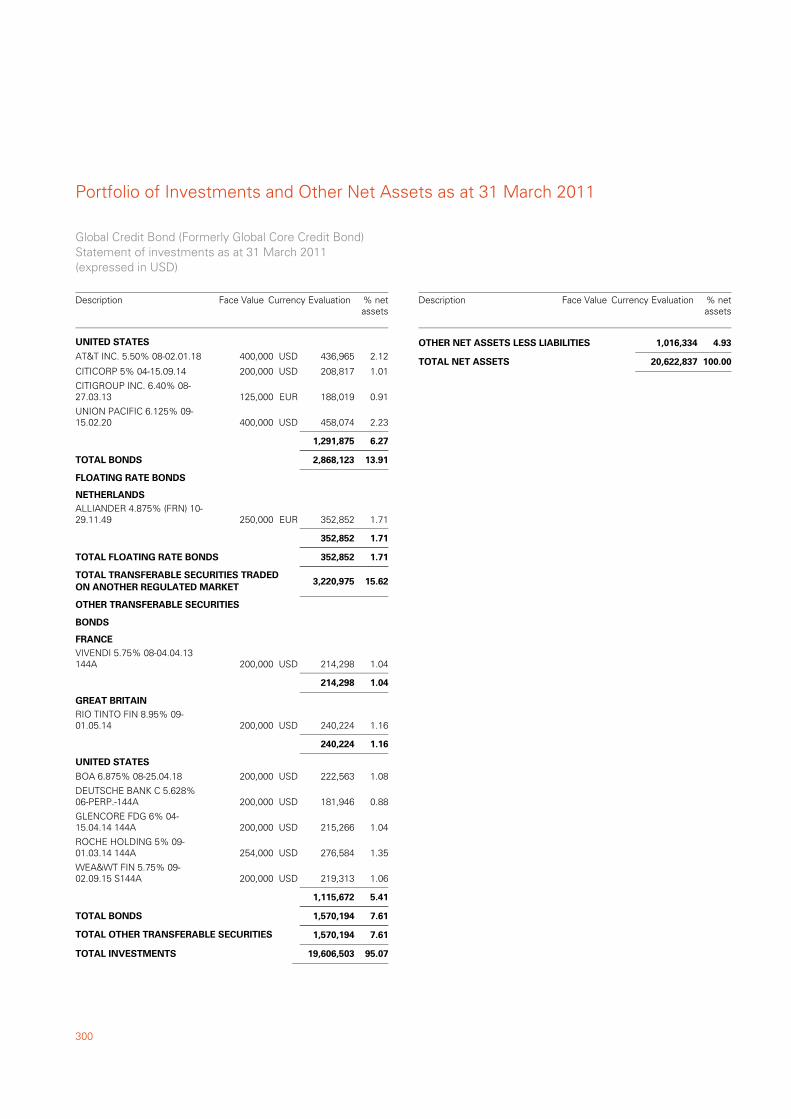
Portfolio of Investments and Other Net Assets as at 31 March 2011
300
AT&T INC. 5.50% 08-02.01.18 400,000 436,965 2.12USD
UNITED STATES
CITICORP 5% 04-15.09.14 200,000 208,817 1.01USD
CITIGROUP INC. 6.40% 08-27.03.13 125,000 188,019 0.91EUR
UNION PACIFIC 6.125% 09-15.02.20 400,000 458,074 2.23USD
1,291,875 6.27
13.912,868,123TOTAL BONDS
ALLIANDER 4.875% (FRN) 10-29.11.49 250,000 352,852 1.71EUR
FLOATING RATE BONDS
NETHERLANDS
352,852 1.71
1.71352,852TOTAL FLOATING RATE BONDS
15.62TOTAL TRANSFERABLE SECURITIES TRADEDON ANOTHER REGULATED MARKET
3,220,975
VIVENDI 5.75% 08-04.04.13144A 200,000 214,298 1.04USD
OTHER TRANSFERABLE SECURITIES
BONDS
FRANCE
214,298 1.04
RIO TINTO FIN 8.95% 09-01.05.14 200,000 240,224 1.16USD
GREAT BRITAIN
240,224 1.16
BOA 6.875% 08-25.04.18 200,000 222,563 1.08USD
UNITED STATES
DEUTSCHE BANK C 5.628%06-PERP.-144A 200,000 181,946 0.88USD
GLENCORE FDG 6% 04-15.04.14 144A 200,000 215,266 1.04USD
ROCHE HOLDING 5% 09-01.03.14 144A 254,000 276,584 1.35USD
WEA&WT FIN 5.75% 09-02.09.15 S144A 200,000 219,313 1.06USD
1,115,672 5.41
7.611,570,194TOTAL BONDS
7.61TOTAL OTHER TRANSFERABLE SECURITIES 1,570,194
95.07TOTAL INVESTMENTS 19,606,503
Global Credit Bond (Formerly Global Core Credit Bond)Statement of investments as at 31 March 2011(expressed in USD)
Description Currency Evaluation % netassets
Face Value
4.93OTHER NET ASSETS LESS LIABILITIES 1,016,334
100.00TOTAL NET ASSETS 20,622,837
Description Currency Evaluation % netassets
Face Value
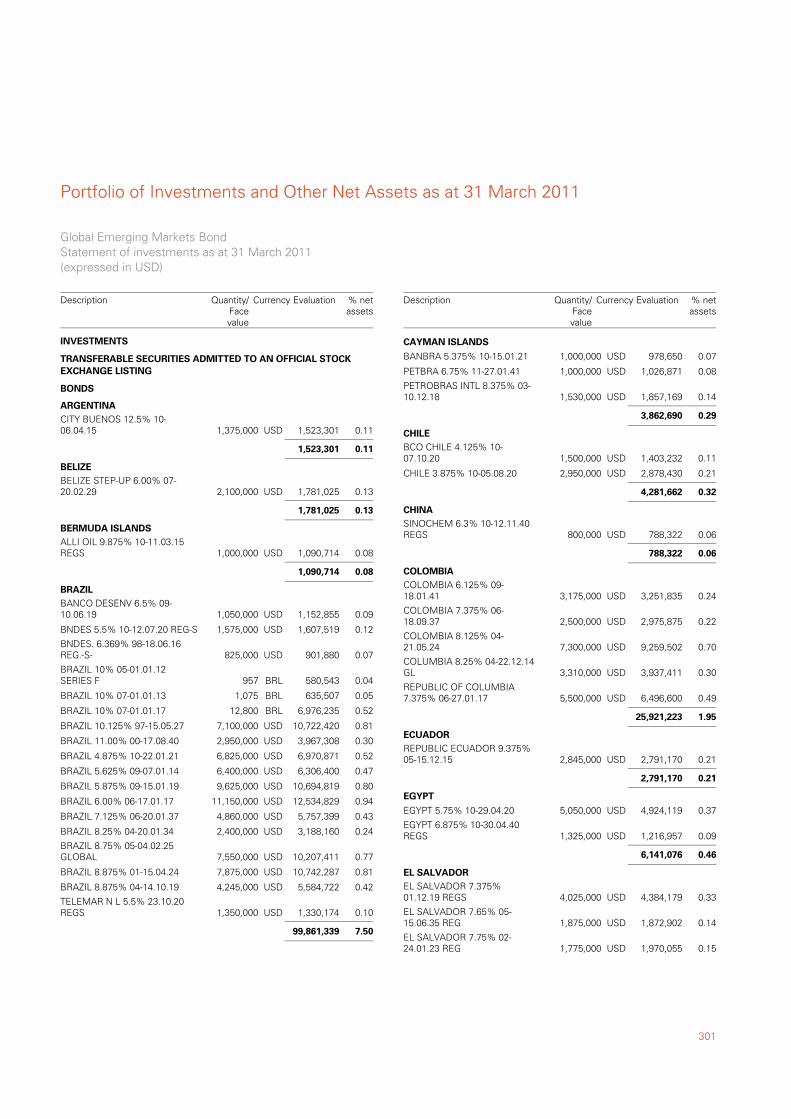
301
Portfolio of Investments and Other Net Assets as at 31 March 2011
CITY BUENOS 12.5% 10-06.04.15 1,375,000 1,523,301 0.11USD
TRANSFERABLE SECURITIES ADMITTED TO AN OFFICIAL STOCKEXCHANGE LISTING
BONDS
ARGENTINA
1,523,301 0.11
BELIZE STEP-UP 6.00% 07-20.02.29 2,100,000 1,781,025 0.13USD
BELIZE
1,781,025 0.13
ALLI OIL 9.875% 10-11.03.15REGS 1,000,000 1,090,714 0.08USD
BERMUDA ISLANDS
1,090,714 0.08
BANCO DESENV 6.5% 09-10.06.19 1,050,000 1,152,855 0.09USD
BRAZIL
BNDES 5.5% 10-12.07.20 REG-S 1,575,000 1,607,519 0.12USD
BNDES. 6.369% 98-18.06.16REG.-S- 825,000 901,880 0.07USD
BRAZIL 10% 05-01.01.12SERIES F 957 580,543 0.04BRL
BRAZIL 10% 07-01.01.13 1,075 635,507 0.05BRL
BRAZIL 10% 07-01.01.17 12,800 6,976,235 0.52BRL
BRAZIL 10.125% 97-15.05.27 7,100,000 10,722,420 0.81USD
BRAZIL 11.00% 00-17.08.40 2,950,000 3,967,308 0.30USD
BRAZIL 4.875% 10-22.01.21 6,825,000 6,970,871 0.52USD
BRAZIL 5.625% 09-07.01.14 6,400,000 6,306,400 0.47USD
BRAZIL 5.875% 09-15.01.19 9,625,000 10,694,819 0.80USD
BRAZIL 6.00% 06-17.01.17 11,150,000 12,534,829 0.94USD
BRAZIL 7.125% 06-20.01.37 4,860,000 5,757,399 0.43USD
BRAZIL 8.25% 04-20.01.34 2,400,000 3,188,160 0.24USD
BRAZIL 8.75% 05-04.02.25GLOBAL 7,550,000 10,207,411 0.77USD
BRAZIL 8.875% 01-15.04.24 7,875,000 10,742,287 0.81USD
BRAZIL 8.875% 04-14.10.19 4,245,000 5,584,722 0.42USD
TELEMAR N L 5.5% 23.10.20REGS 1,350,000 1,330,174 0.10USD
99,861,339 7.50
INVESTMENTS
Global Emerging Markets BondStatement of investments as at 31 March 2011(expressed in USD)
Description Currency Evaluation % netassets
Quantity/Facevalue
BANBRA 5.375% 10-15.01.21 1,000,000 978,650 0.07USD
CAYMAN ISLANDS
PETBRA 6.75% 11-27.01.41 1,000,000 1,026,871 0.08USD
PETROBRAS INTL 8.375% 03-10.12.18 1,530,000 1,857,169 0.14USD
3,862,690 0.29
BCO CHILE 4.125% 10-07.10.20 1,500,000 1,403,232 0.11USD
CHILE
CHILE 3.875% 10-05.08.20 2,950,000 2,878,430 0.21USD
4,281,662 0.32
SINOCHEM 6.3% 10-12.11.40REGS 800,000 788,322 0.06USD
CHINA
788,322 0.06
COLOMBIA 6.125% 09-18.01.41 3,175,000 3,251,835 0.24USD
COLOMBIA
COLOMBIA 7.375% 06-18.09.37 2,500,000 2,975,875 0.22USD
COLOMBIA 8.125% 04-21.05.24 7,300,000 9,259,502 0.70USD
COLUMBIA 8.25% 04-22.12.14GL 3,310,000 3,937,411 0.30USD
REPUBLIC OF COLUMBIA7.375% 06-27.01.17 5,500,000 6,496,600 0.49USD
25,921,223 1.95
REPUBLIC ECUADOR 9.375%05-15.12.15 2,845,000 2,791,170 0.21USD
ECUADOR
2,791,170 0.21
EGYPT 5.75% 10-29.04.20 5,050,000 4,924,119 0.37USD
EGYPT
EGYPT 6.875% 10-30.04.40REGS 1,325,000 1,216,957 0.09USD
6,141,076 0.46
EL SALVADOR 7.375%01.12.19 REGS 4,025,000 4,384,179 0.33USD
EL SALVADOR
EL SALVADOR 7.65% 05-15.06.35 REG 1,875,000 1,872,902 0.14USD
EL SALVADOR 7.75% 02-24.01.23 REG 1,775,000 1,970,055 0.15USD
Description Currency Evaluation % netassets
Quantity/Facevalue
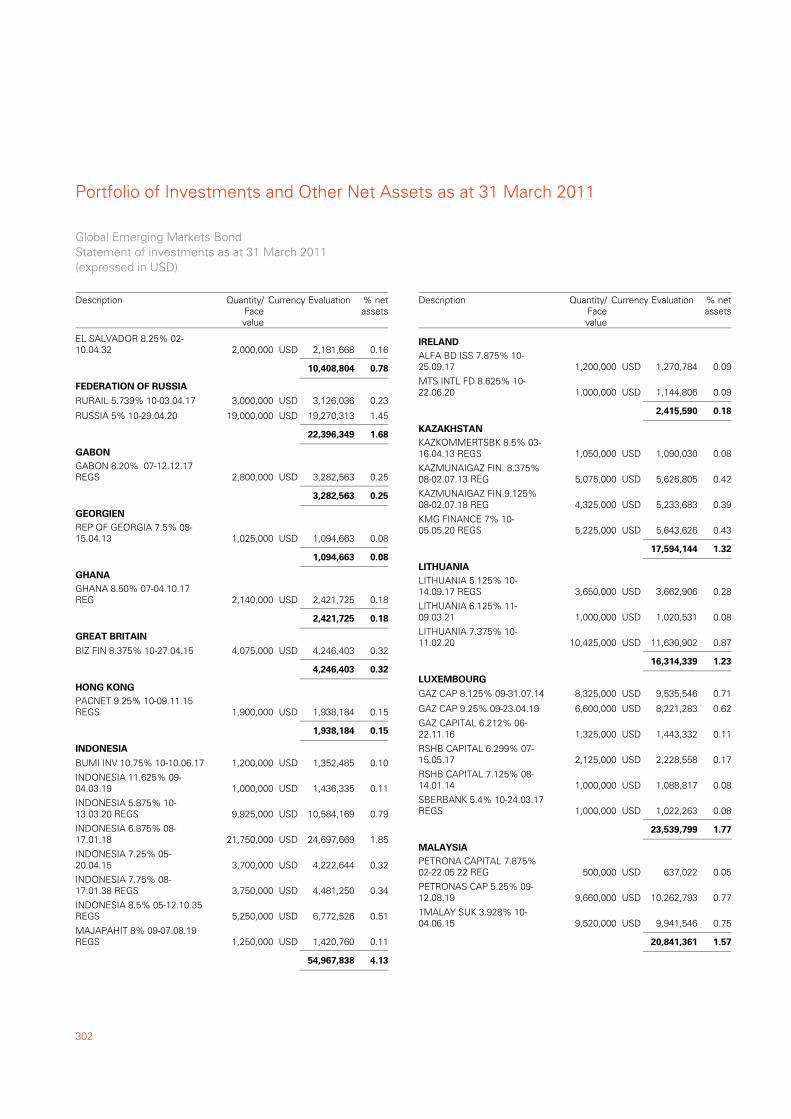
Portfolio of Investments and Other Net Assets as at 31 March 2011
302
EL SALVADOR 8.25% 02-10.04.32 2,000,000 2,181,668 0.16USD
10,408,804 0.78
RURAIL 5.739% 10-03.04.17 3,000,000 3,126,036 0.23USD
FEDERATION OF RUSSIA
RUSSIA 5% 10-29.04.20 19,000,000 19,270,313 1.45USD
22,396,349 1.68
GABON 8.20% 07-12.12.17REGS 2,800,000 3,282,563 0.25USD
GABON
3,282,563 0.25
REP OF GEORGIA 7.5% 08-15.04.13 1,025,000 1,094,663 0.08USD
GEORGIEN
1,094,663 0.08
GHANA 8.50% 07-04.10.17REG 2,140,000 2,421,725 0.18USD
GHANA
2,421,725 0.18
BIZ FIN 8.375% 10-27.04.15 4,075,000 4,246,403 0.32USD
GREAT BRITAIN
4,246,403 0.32
PACNET 9.25% 10-09.11.15REGS 1,900,000 1,938,184 0.15USD
HONG KONG
1,938,184 0.15
BUMI INV 10.75% 10-10.06.17 1,200,000 1,352,485 0.10USD
INDONESIA
INDONESIA 11.625% 09-04.03.19 1,000,000 1,436,335 0.11USD
INDONESIA 5.875% 10-13.03.20 REGS 9,925,000 10,584,169 0.79USD
INDONESIA 6.875% 08-17.01.18 21,750,000 24,697,669 1.85USD
INDONESIA 7.25% 05-20.04.15 3,700,000 4,222,644 0.32USD
INDONESIA 7.75% 08-17.01.38 REGS 3,750,000 4,481,250 0.34USD
INDONESIA 8.5% 05-12.10.35REGS 5,250,000 6,772,526 0.51USD
MAJAPAHIT 8% 09-07.08.19REGS 1,250,000 1,420,760 0.11USD
54,967,838 4.13
Global Emerging Markets BondStatement of investments as at 31 March 2011(expressed in USD)
Description Currency Evaluation % netassets
Quantity/Facevalue
ALFA BD ISS 7.875% 10-25.09.17 1,200,000 1,270,784 0.09USD
IRELAND
MTS INTL FD 8.625% 10-22.06.20 1,000,000 1,144,806 0.09USD
2,415,590 0.18
KAZKOMMERTSBK 8.5% 03-16.04.13 REGS 1,050,000 1,090,030 0.08USD
KAZAKHSTAN
KAZMUNAIGAZ FIN. 8.375%08-02.07.13 REG 5,075,000 5,626,805 0.42USD
KAZMUNAIGAZ FIN.9.125%08-02.07.18 REG 4,325,000 5,233,683 0.39USD
KMG FINANCE 7% 10-05.05.20 REGS 5,225,000 5,643,626 0.43USD
17,594,144 1.32
LITHUANIA 5.125% 10-14.09.17 REGS 3,650,000 3,662,906 0.28USD
LITHUANIA
LITHUANIA 6.125% 11-09.03.21 1,000,000 1,020,531 0.08USD
LITHUANIA 7.375% 10-11.02.20 10,425,000 11,630,902 0.87USD
16,314,339 1.23
GAZ CAP 8.125% 09-31.07.14 8,325,000 9,535,546 0.71USD
LUXEMBOURG
GAZ CAP 9.25% 09-23.04.19 6,600,000 8,221,283 0.62USD
GAZ CAPITAL 6.212% 06-22.11.16 1,325,000 1,443,332 0.11USD
RSHB CAPITAL 6.299% 07-15.05.17 2,125,000 2,228,558 0.17USD
RSHB CAPITAL 7.125% 08-14.01.14 1,000,000 1,088,817 0.08USD
SBERBANK 5.4% 10-24.03.17REGS 1,000,000 1,022,263 0.08USD
23,539,799 1.77
PETRONA CAPITAL 7.875%02-22.05.22 REG 500,000 637,022 0.05USD
MALAYSIA
PETRONAS CAP 5.25% 09-12.08.19 9,660,000 10,262,793 0.77USD
1MALAY SUK 3.928% 10-04.06.15 9,520,000 9,941,546 0.75USD
20,841,361 1.57
Description Currency Evaluation % netassets
Quantity/Facevalue
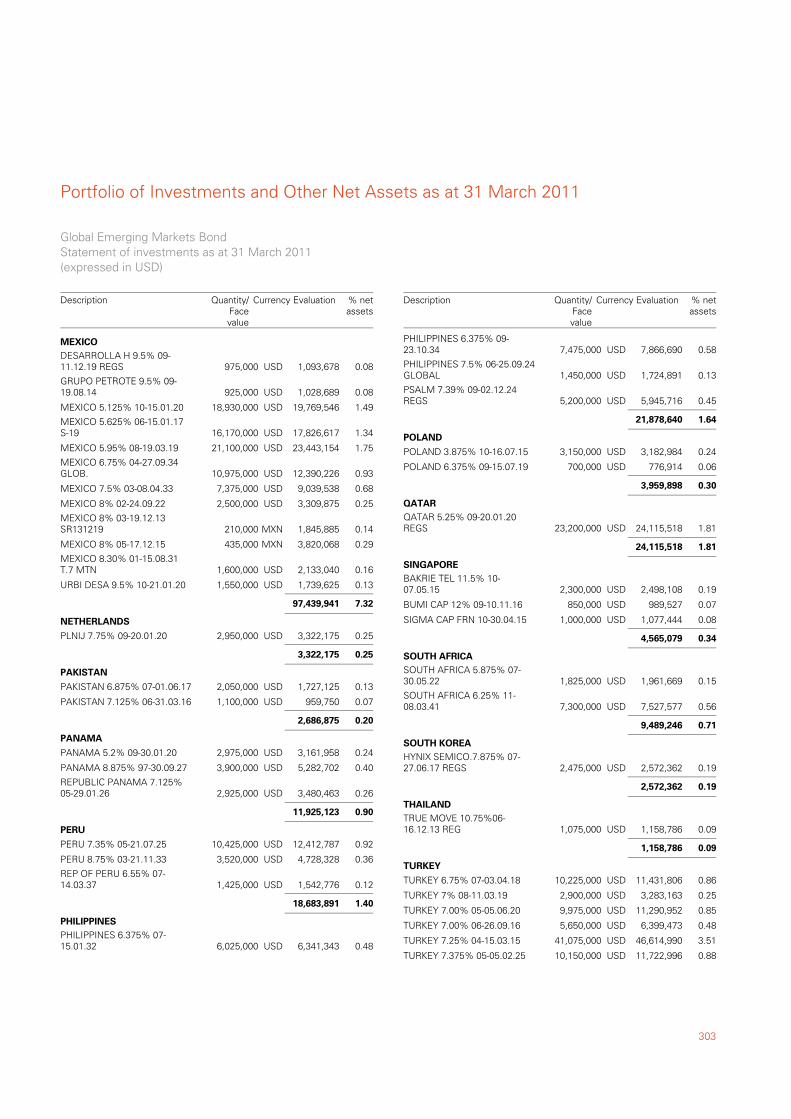
303
Portfolio of Investments and Other Net Assets as at 31 March 2011
DESARROLLA H 9.5% 09-11.12.19 REGS 975,000 1,093,678 0.08USD
MEXICO
GRUPO PETROTE 9.5% 09-19.08.14 925,000 1,028,689 0.08USD
MEXICO 5.125% 10-15.01.20 18,930,000 19,769,546 1.49USD
MEXICO 5.625% 06-15.01.17S-19 16,170,000 17,826,617 1.34USD
MEXICO 5.95% 08-19.03.19 21,100,000 23,443,154 1.75USD
MEXICO 6.75% 04-27.09.34GLOB. 10,975,000 12,390,226 0.93USD
MEXICO 7.5% 03-08.04.33 7,375,000 9,039,538 0.68USD
MEXICO 8% 02-24.09.22 2,500,000 3,309,875 0.25USD
MEXICO 8% 03-19.12.13SR131219 210,000 1,845,885 0.14MXN
MEXICO 8% 05-17.12.15 435,000 3,820,068 0.29MXN
MEXICO 8.30% 01-15.08.31T.7 MTN 1,600,000 2,133,040 0.16USD
URBI DESA 9.5% 10-21.01.20 1,550,000 1,739,625 0.13USD
97,439,941 7.32
PLNIJ 7.75% 09-20.01.20 2,950,000 3,322,175 0.25USD
NETHERLANDS
3,322,175 0.25
PAKISTAN 6.875% 07-01.06.17 2,050,000 1,727,125 0.13USD
PAKISTAN
PAKISTAN 7.125% 06-31.03.16 1,100,000 959,750 0.07USD
2,686,875 0.20
PANAMA 5.2% 09-30.01.20 2,975,000 3,161,958 0.24USD
PANAMA
PANAMA 8.875% 97-30.09.27 3,900,000 5,282,702 0.40USD
REPUBLIC PANAMA 7.125%05-29.01.26 2,925,000 3,480,463 0.26USD
11,925,123 0.90
PERU 7.35% 05-21.07.25 10,425,000 12,412,787 0.92USD
PERU
PERU 8.75% 03-21.11.33 3,520,000 4,728,328 0.36USD
REP OF PERU 6.55% 07-14.03.37 1,425,000 1,542,776 0.12USD
18,683,891 1.40
PHILIPPINES 6.375% 07-15.01.32 6,025,000 6,341,343 0.48USD
PHILIPPINES
Global Emerging Markets BondStatement of investments as at 31 March 2011(expressed in USD)
Description Currency Evaluation % netassets
Quantity/Facevalue
PHILIPPINES 6.375% 09-23.10.34 7,475,000 7,866,690 0.58USD
PHILIPPINES 7.5% 06-25.09.24GLOBAL 1,450,000 1,724,891 0.13USD
PSALM 7.39% 09-02.12.24REGS 5,200,000 5,945,716 0.45USD
21,878,640 1.64
POLAND 3.875% 10-16.07.15 3,150,000 3,182,984 0.24USD
POLAND
POLAND 6.375% 09-15.07.19 700,000 776,914 0.06USD
3,959,898 0.30
QATAR 5.25% 09-20.01.20REGS 23,200,000 24,115,518 1.81USD
QATAR
24,115,518 1.81
BAKRIE TEL 11.5% 10-07.05.15 2,300,000 2,498,108 0.19USD
SINGAPORE
BUMI CAP 12% 09-10.11.16 850,000 989,527 0.07USD
SIGMA CAP FRN 10-30.04.15 1,000,000 1,077,444 0.08USD
4,565,079 0.34
SOUTH AFRICA 5.875% 07-30.05.22 1,825,000 1,961,669 0.15USD
SOUTH AFRICA
SOUTH AFRICA 6.25% 11-08.03.41 7,300,000 7,527,577 0.56USD
9,489,246 0.71
HYNIX SEMICO.7.875% 07-27.06.17 REGS 2,475,000 2,572,362 0.19USD
SOUTH KOREA
2,572,362 0.19
TRUE MOVE 10.75%06-16.12.13 REG 1,075,000 1,158,786 0.09USD
THAILAND
1,158,786 0.09
TURKEY 6.75% 07-03.04.18 10,225,000 11,431,806 0.86USD
TURKEY
TURKEY 7% 08-11.03.19 2,900,000 3,283,163 0.25USD
TURKEY 7.00% 05-05.06.20 9,975,000 11,290,952 0.85USD
TURKEY 7.00% 06-26.09.16 5,650,000 6,399,473 0.48USD
TURKEY 7.25% 04-15.03.15 41,075,000 46,614,990 3.51USD
TURKEY 7.375% 05-05.02.25 10,150,000 11,722,996 0.88USD
Description Currency Evaluation % netassets
Quantity/Facevalue
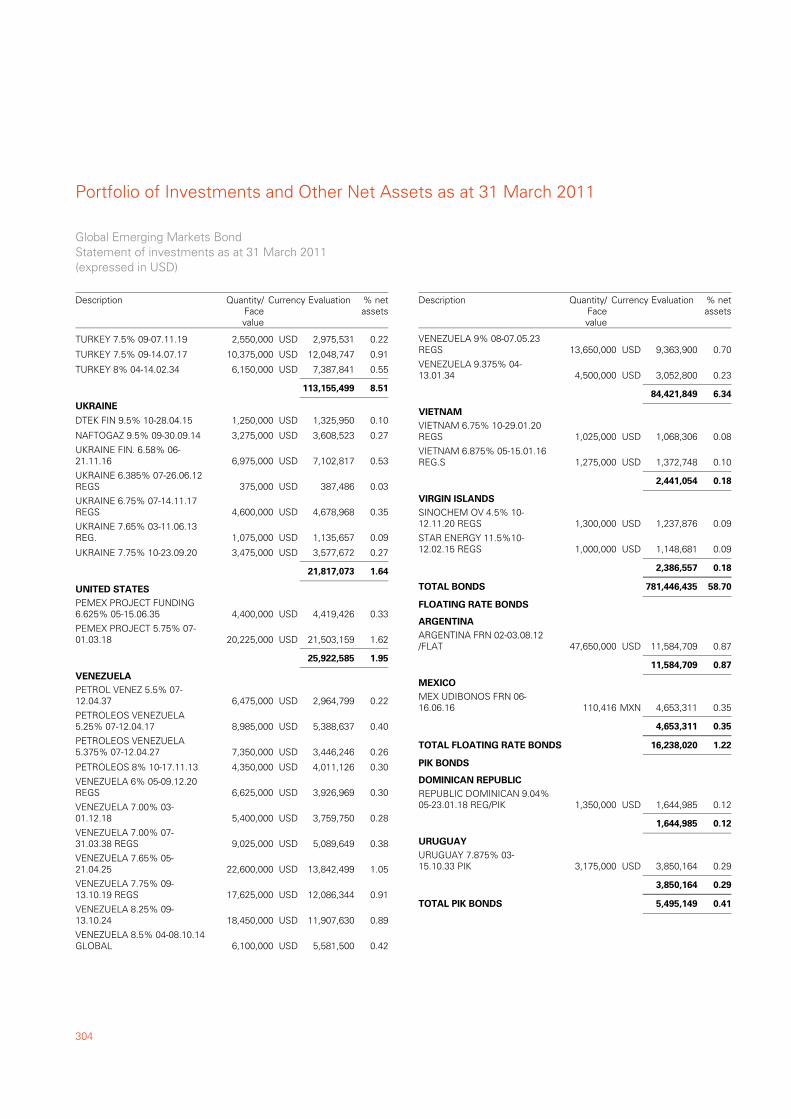
Portfolio of Investments and Other Net Assets as at 31 March 2011
304
TURKEY 7.5% 09-07.11.19 2,550,000 2,975,531 0.22USD
TURKEY 7.5% 09-14.07.17 10,375,000 12,048,747 0.91USD
TURKEY 8% 04-14.02.34 6,150,000 7,387,841 0.55USD
113,155,499 8.51
DTEK FIN 9.5% 10-28.04.15 1,250,000 1,325,950 0.10USD
UKRAINE
NAFTOGAZ 9.5% 09-30.09.14 3,275,000 3,608,523 0.27USD
UKRAINE FIN. 6.58% 06-21.11.16 6,975,000 7,102,817 0.53USD
UKRAINE 6.385% 07-26.06.12REGS 375,000 387,486 0.03USD
UKRAINE 6.75% 07-14.11.17REGS 4,600,000 4,678,968 0.35USD
UKRAINE 7.65% 03-11.06.13REG. 1,075,000 1,135,657 0.09USD
UKRAINE 7.75% 10-23.09.20 3,475,000 3,577,672 0.27USD
21,817,073 1.64
PEMEX PROJECT FUNDING6.625% 05-15.06.35 4,400,000 4,419,426 0.33USD
UNITED STATES
PEMEX PROJECT 5.75% 07-01.03.18 20,225,000 21,503,159 1.62USD
25,922,585 1.95
PETROL VENEZ 5.5% 07-12.04.37 6,475,000 2,964,799 0.22USD
VENEZUELA
PETROLEOS VENEZUELA5.25% 07-12.04.17 8,985,000 5,388,637 0.40USD
PETROLEOS VENEZUELA5.375% 07-12.04.27 7,350,000 3,446,246 0.26USD
PETROLEOS 8% 10-17.11.13 4,350,000 4,011,126 0.30USD
VENEZUELA 6% 05-09.12.20REGS 6,625,000 3,926,969 0.30USD
VENEZUELA 7.00% 03-01.12.18 5,400,000 3,759,750 0.28USD
VENEZUELA 7.00% 07-31.03.38 REGS 9,025,000 5,089,649 0.38USD
VENEZUELA 7.65% 05-21.04.25 22,600,000 13,842,499 1.05USD
VENEZUELA 7.75% 09-13.10.19 REGS 17,625,000 12,086,344 0.91USD
VENEZUELA 8.25% 09-13.10.24 18,450,000 11,907,630 0.89USD
VENEZUELA 8.5% 04-08.10.14GLOBAL 6,100,000 5,581,500 0.42USD
Global Emerging Markets BondStatement of investments as at 31 March 2011(expressed in USD)
Description Currency Evaluation % netassets
Quantity/Facevalue
VENEZUELA 9% 08-07.05.23REGS 13,650,000 9,363,900 0.70USD
VENEZUELA 9.375% 04-13.01.34 4,500,000 3,052,800 0.23USD
84,421,849 6.34
VIETNAM 6.75% 10-29.01.20REGS 1,025,000 1,068,306 0.08USD
VIETNAM
VIETNAM 6.875% 05-15.01.16REG.S 1,275,000 1,372,748 0.10USD
2,441,054 0.18
SINOCHEM OV 4.5% 10-12.11.20 REGS 1,300,000 1,237,876 0.09USD
VIRGIN ISLANDS
STAR ENERGY 11.5%10-12.02.15 REGS 1,000,000 1,148,681 0.09USD
2,386,557 0.18
58.70781,446,435TOTAL BONDS
ARGENTINA FRN 02-03.08.12/FLAT 47,650,000 11,584,709 0.87USD
FLOATING RATE BONDS
ARGENTINA
11,584,709 0.87
MEX UDIBONOS FRN 06-16.06.16 110,416 4,653,311 0.35MXN
MEXICO
4,653,311 0.35
1.2216,238,020TOTAL FLOATING RATE BONDS
REPUBLIC DOMINICAN 9.04%05-23.01.18 REG/PIK 1,350,000 1,644,985 0.12USD
PIK BONDS
DOMINICAN REPUBLIC
1,644,985 0.12
URUGUAY 7.875% 03-15.10.33 PIK 3,175,000 3,850,164 0.29USD
URUGUAY
3,850,164 0.29
0.415,495,149TOTAL PIK BONDS
Description Currency Evaluation % netassets
Quantity/Facevalue
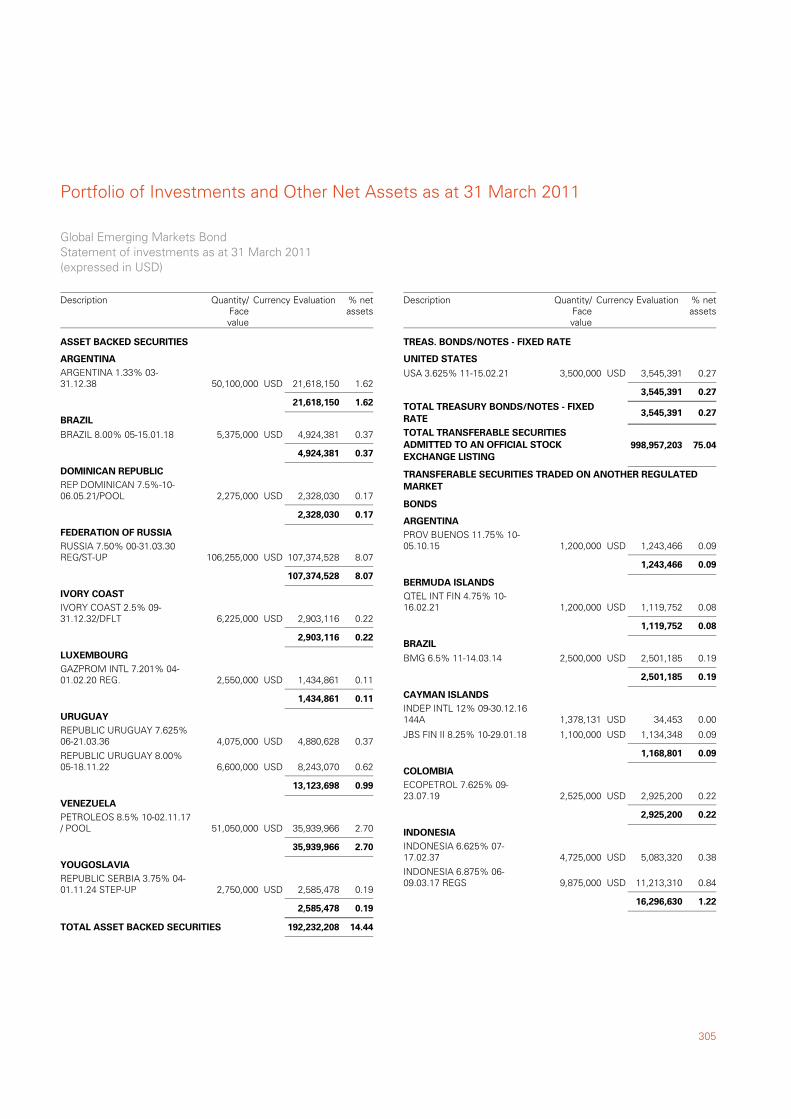
305
Portfolio of Investments and Other Net Assets as at 31 March 2011
ARGENTINA 1.33% 03-31.12.38 50,100,000 21,618,150 1.62USD
ASSET BACKED SECURITIES
ARGENTINA
21,618,150 1.62
BRAZIL 8.00% 05-15.01.18 5,375,000 4,924,381 0.37USD
BRAZIL
4,924,381 0.37
REP DOMINICAN 7.5%-10-06.05.21/POOL 2,275,000 2,328,030 0.17USD
DOMINICAN REPUBLIC
2,328,030 0.17
RUSSIA 7.50% 00-31.03.30REG/ST-UP 106,255,000 107,374,528 8.07USD
FEDERATION OF RUSSIA
107,374,528 8.07
IVORY COAST 2.5% 09-31.12.32/DFLT 6,225,000 2,903,116 0.22USD
IVORY COAST
2,903,116 0.22
GAZPROM INTL 7.201% 04-01.02.20 REG. 2,550,000 1,434,861 0.11USD
LUXEMBOURG
1,434,861 0.11
REPUBLIC URUGUAY 7.625%06-21.03.36 4,075,000 4,880,628 0.37USD
URUGUAY
REPUBLIC URUGUAY 8.00%05-18.11.22 6,600,000 8,243,070 0.62USD
13,123,698 0.99
PETROLEOS 8.5% 10-02.11.17/ POOL 51,050,000 35,939,966 2.70USD
VENEZUELA
35,939,966 2.70
REPUBLIC SERBIA 3.75% 04-01.11.24 STEP-UP 2,750,000 2,585,478 0.19USD
YOUGOSLAVIA
2,585,478 0.19
14.44192,232,208TOTAL ASSET BACKED SECURITIES
Global Emerging Markets BondStatement of investments as at 31 March 2011(expressed in USD)
Description Currency Evaluation % netassets
Quantity/Facevalue
USA 3.625% 11-15.02.21 3,500,000 3,545,391 0.27USD
TREAS. BONDS/NOTES - FIXED RATE
UNITED STATES
3,545,391 0.27
0.273,545,391TOTAL TREASURY BONDS/NOTES - FIXEDRATE
75.04TOTAL TRANSFERABLE SECURITIESADMITTED TO AN OFFICIAL STOCKEXCHANGE LISTING
998,957,203
PROV BUENOS 11.75% 10-05.10.15 1,200,000 1,243,466 0.09USD
TRANSFERABLE SECURITIES TRADED ON ANOTHER REGULATEDMARKET
BONDS
ARGENTINA
1,243,466 0.09
QTEL INT FIN 4.75% 10-16.02.21 1,200,000 1,119,752 0.08USD
BERMUDA ISLANDS
1,119,752 0.08
BMG 6.5% 11-14.03.14 2,500,000 2,501,185 0.19USD
BRAZIL
2,501,185 0.19
INDEP INTL 12% 09-30.12.16144A 1,378,131 34,453 0.00USD
CAYMAN ISLANDS
JBS FIN II 8.25% 10-29.01.18 1,100,000 1,134,348 0.09USD
1,168,801 0.09
ECOPETROL 7.625% 09-23.07.19 2,525,000 2,925,200 0.22USD
COLOMBIA
2,925,200 0.22
INDONESIA 6.625% 07-17.02.37 4,725,000 5,083,320 0.38USD
INDONESIA
INDONESIA 6.875% 06-09.03.17 REGS 9,875,000 11,213,310 0.84USD
16,296,630 1.22
Description Currency Evaluation % netassets
Quantity/Facevalue
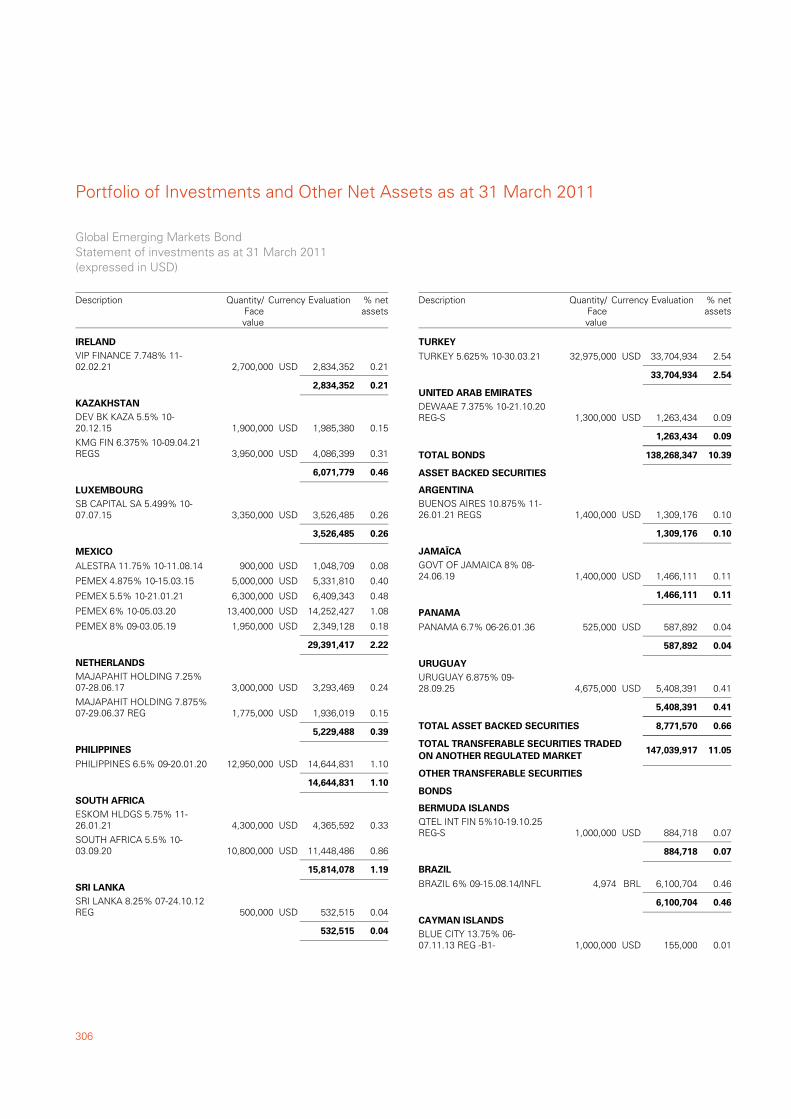
Portfolio of Investments and Other Net Assets as at 31 March 2011
306
VIP FINANCE 7.748% 11-02.02.21 2,700,000 2,834,352 0.21USD
IRELAND
2,834,352 0.21
DEV BK KAZA 5.5% 10-20.12.15 1,900,000 1,985,380 0.15USD
KAZAKHSTAN
KMG FIN 6.375% 10-09.04.21REGS 3,950,000 4,086,399 0.31USD
6,071,779 0.46
SB CAPITAL SA 5.499% 10-07.07.15 3,350,000 3,526,485 0.26USD
LUXEMBOURG
3,526,485 0.26
ALESTRA 11.75% 10-11.08.14 900,000 1,048,709 0.08USD
MEXICO
PEMEX 4.875% 10-15.03.15 5,000,000 5,331,810 0.40USD
PEMEX 5.5% 10-21.01.21 6,300,000 6,409,343 0.48USD
PEMEX 6% 10-05.03.20 13,400,000 14,252,427 1.08USD
PEMEX 8% 09-03.05.19 1,950,000 2,349,128 0.18USD
29,391,417 2.22
MAJAPAHIT HOLDING 7.25%07-28.06.17 3,000,000 3,293,469 0.24USD
NETHERLANDS
MAJAPAHIT HOLDING 7.875%07-29.06.37 REG 1,775,000 1,936,019 0.15USD
5,229,488 0.39
PHILIPPINES 6.5% 09-20.01.20 12,950,000 14,644,831 1.10USD
PHILIPPINES
14,644,831 1.10
ESKOM HLDGS 5.75% 11-26.01.21 4,300,000 4,365,592 0.33USD
SOUTH AFRICA
SOUTH AFRICA 5.5% 10-03.09.20 10,800,000 11,448,486 0.86USD
15,814,078 1.19
SRI LANKA 8.25% 07-24.10.12REG 500,000 532,515 0.04USD
SRI LANKA
532,515 0.04
Global Emerging Markets BondStatement of investments as at 31 March 2011(expressed in USD)
Description Currency Evaluation % netassets
Quantity/Facevalue
TURKEY 5.625% 10-30.03.21 32,975,000 33,704,934 2.54USD
TURKEY
33,704,934 2.54
DEWAAE 7.375% 10-21.10.20REG-S 1,300,000 1,263,434 0.09USD
UNITED ARAB EMIRATES
1,263,434 0.09
10.39138,268,347TOTAL BONDS
BUENOS AIRES 10.875% 11-26.01.21 REGS 1,400,000 1,309,176 0.10USD
ASSET BACKED SECURITIES
ARGENTINA
1,309,176 0.10
GOVT OF JAMAICA 8% 08-24.06.19 1,400,000 1,466,111 0.11USD
JAMAÏCA
1,466,111 0.11
PANAMA 6.7% 06-26.01.36 525,000 587,892 0.04USD
PANAMA
587,892 0.04
URUGUAY 6.875% 09-28.09.25 4,675,000 5,408,391 0.41USD
URUGUAY
5,408,391 0.41
0.668,771,570TOTAL ASSET BACKED SECURITIES
11.05TOTAL TRANSFERABLE SECURITIES TRADEDON ANOTHER REGULATED MARKET
147,039,917
QTEL INT FIN 5%10-19.10.25REG-S 1,000,000 884,718 0.07USD
OTHER TRANSFERABLE SECURITIES
BONDS
BERMUDA ISLANDS
884,718 0.07
BRAZIL 6% 09-15.08.14/INFL 4,974 6,100,704 0.46BRL
BRAZIL
6,100,704 0.46
BLUE CITY 13.75% 06-07.11.13 REG -B1- 1,000,000 155,000 0.01USD
CAYMAN ISLANDS
Description Currency Evaluation % netassets
Quantity/Facevalue
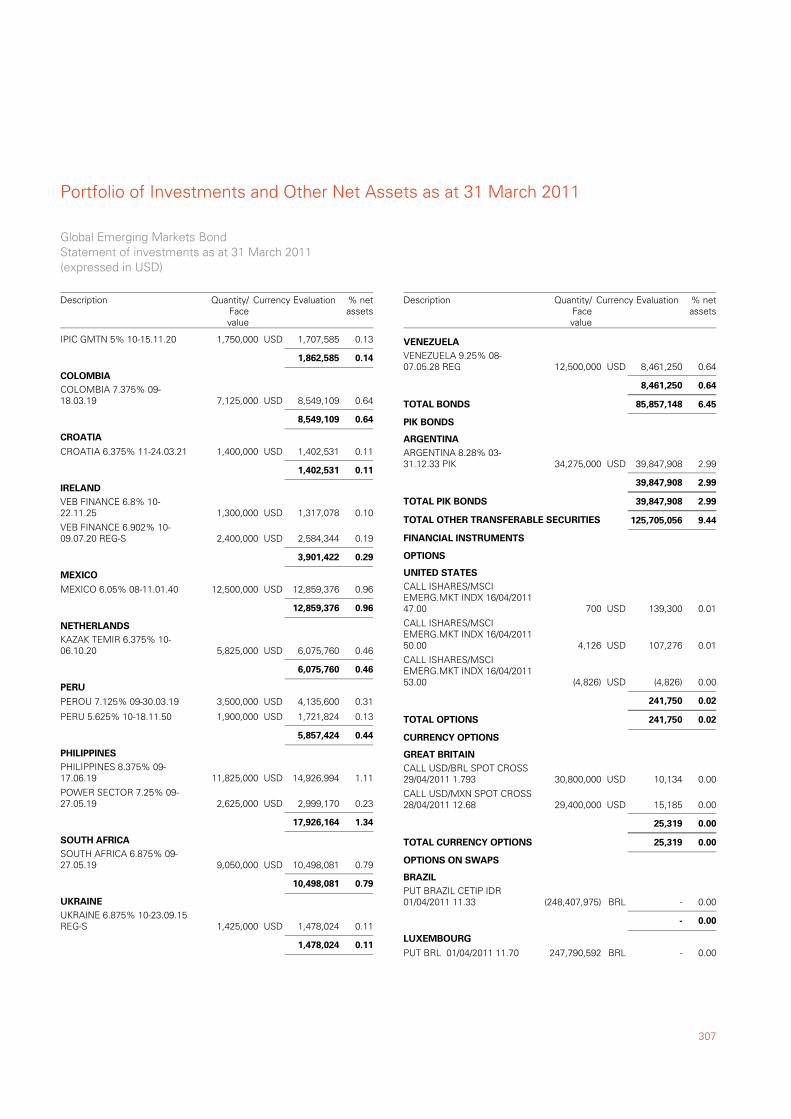
307
Portfolio of Investments and Other Net Assets as at 31 March 2011
IPIC GMTN 5% 10-15.11.20 1,750,000 1,707,585 0.13USD
1,862,585 0.14
COLOMBIA 7.375% 09-18.03.19 7,125,000 8,549,109 0.64USD
COLOMBIA
8,549,109 0.64
CROATIA 6.375% 11-24.03.21 1,400,000 1,402,531 0.11USD
CROATIA
1,402,531 0.11
VEB FINANCE 6.8% 10-22.11.25 1,300,000 1,317,078 0.10USD
IRELAND
VEB FINANCE 6.902% 10-09.07.20 REG-S 2,400,000 2,584,344 0.19USD
3,901,422 0.29
MEXICO 6.05% 08-11.01.40 12,500,000 12,859,376 0.96USD
MEXICO
12,859,376 0.96
KAZAK TEMIR 6.375% 10-06.10.20 5,825,000 6,075,760 0.46USD
NETHERLANDS
6,075,760 0.46
PEROU 7.125% 09-30.03.19 3,500,000 4,135,600 0.31USD
PERU
PERU 5.625% 10-18.11.50 1,900,000 1,721,824 0.13USD
5,857,424 0.44
PHILIPPINES 8.375% 09-17.06.19 11,825,000 14,926,994 1.11USD
PHILIPPINES
POWER SECTOR 7.25% 09-27.05.19 2,625,000 2,999,170 0.23USD
17,926,164 1.34
SOUTH AFRICA 6.875% 09-27.05.19 9,050,000 10,498,081 0.79USD
SOUTH AFRICA
10,498,081 0.79
UKRAINE 6.875% 10-23.09.15REG-S 1,425,000 1,478,024 0.11USD
UKRAINE
1,478,024 0.11
Global Emerging Markets BondStatement of investments as at 31 March 2011(expressed in USD)
Description Currency Evaluation % netassets
Quantity/Facevalue
VENEZUELA 9.25% 08-07.05.28 REG 12,500,000 8,461,250 0.64USD
VENEZUELA
8,461,250 0.64
6.4585,857,148TOTAL BONDS
ARGENTINA 8.28% 03-31.12.33 PIK 34,275,000 39,847,908 2.99USD
PIK BONDS
ARGENTINA
39,847,908 2.99
2.9939,847,908TOTAL PIK BONDS
9.44TOTAL OTHER TRANSFERABLE SECURITIES 125,705,056
CALL ISHARES/MSCIEMERG.MKT INDX 16/04/201147.00 700 139,300 0.01USD
FINANCIAL INSTRUMENTS
OPTIONS
UNITED STATES
CALL ISHARES/MSCIEMERG.MKT INDX 16/04/201150.00 4,126 107,276 0.01USD
CALL ISHARES/MSCIEMERG.MKT INDX 16/04/201153.00 (4,826) (4,826) 0.00USD
241,750 0.02
0.02241,750TOTAL OPTIONS
CALL USD/BRL SPOT CROSS29/04/2011 1.793 30,800,000 10,134 0.00USD
CURRENCY OPTIONS
GREAT BRITAIN
CALL USD/MXN SPOT CROSS28/04/2011 12.68 29,400,000 15,185 0.00USD
25,319 0.00
0.0025,319TOTAL CURRENCY OPTIONS
PUT BRAZIL CETIP IDR01/04/2011 11.33 (248,407,975) - 0.00BRL
OPTIONS ON SWAPS
BRAZIL
- 0.00
PUT BRL 01/04/2011 11.70 247,790,592 - 0.00BRL
LUXEMBOURG
Description Currency Evaluation % netassets
Quantity/Facevalue
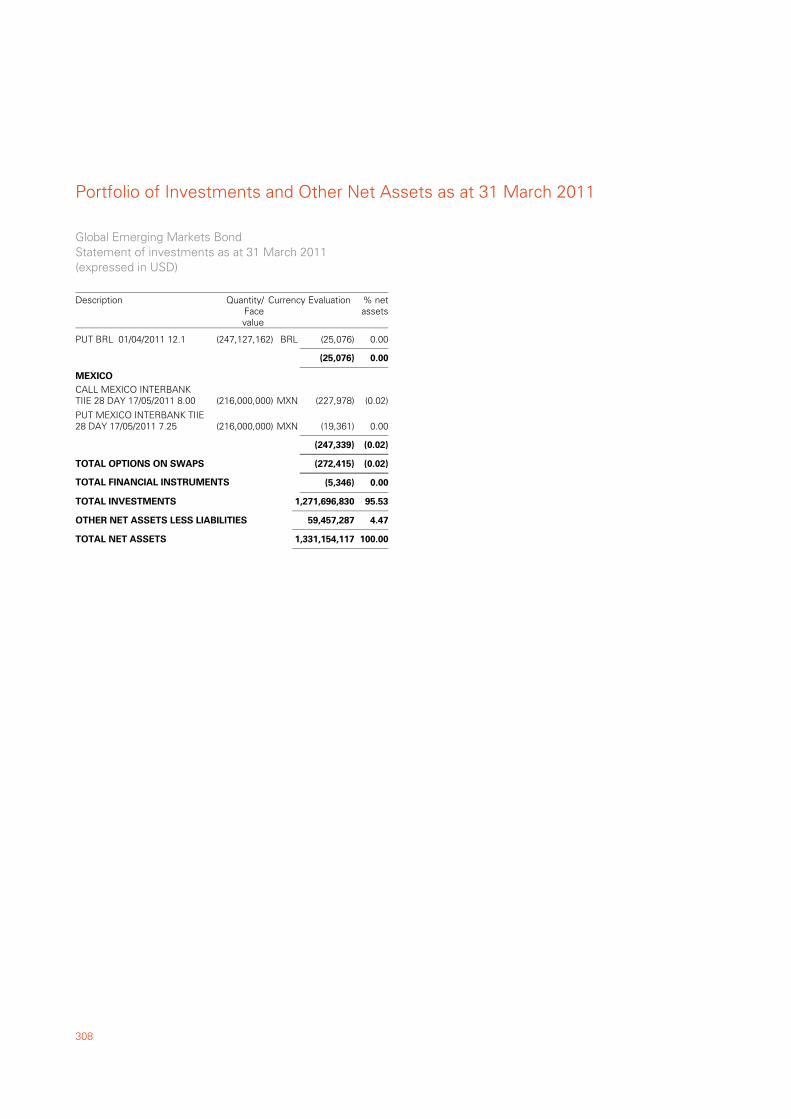
Portfolio of Investments and Other Net Assets as at 31 March 2011
308
PUT BRL 01/04/2011 12.1 (247,127,162) (25,076) 0.00BRL
(25,076) 0.00
CALL MEXICO INTERBANKTIIE 28 DAY 17/05/2011 8.00 (216,000,000) (227,978) (0.02)MXN
MEXICO
PUT MEXICO INTERBANK TIIE28 DAY 17/05/2011 7.25 (216,000,000) (19,361) 0.00MXN
(247,339) (0.02)
(0.02)(272,415)TOTAL OPTIONS ON SWAPS
0.00TOTAL FINANCIAL INSTRUMENTS (5,346)
95.53TOTAL INVESTMENTS 1,271,696,830
4.47OTHER NET ASSETS LESS LIABILITIES 59,457,287
100.00TOTAL NET ASSETS 1,331,154,117
Global Emerging Markets BondStatement of investments as at 31 March 2011(expressed in USD)
Description Currency Evaluation % netassets
Quantity/Facevalue
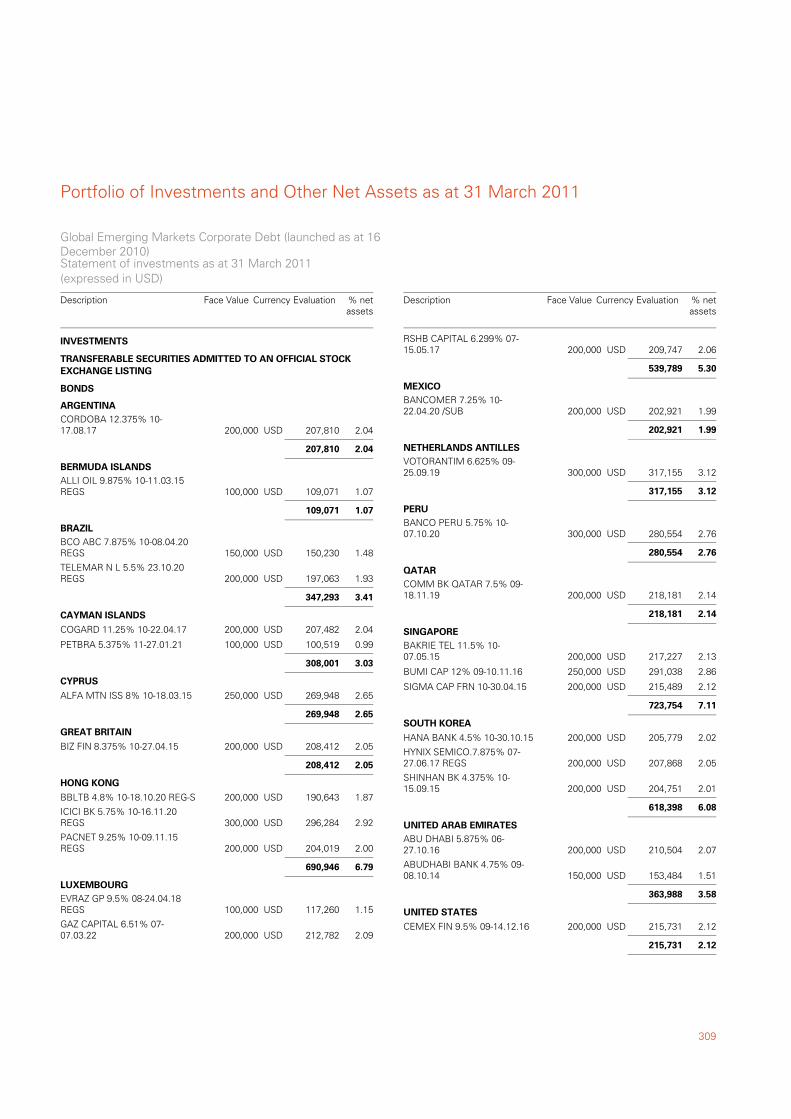
309
Portfolio of Investments and Other Net Assets as at 31 March 2011
CORDOBA 12.375% 10-17.08.17 200,000 207,810 2.04USD
TRANSFERABLE SECURITIES ADMITTED TO AN OFFICIAL STOCKEXCHANGE LISTING
BONDS
ARGENTINA
207,810 2.04
ALLI OIL 9.875% 10-11.03.15REGS 100,000 109,071 1.07USD
BERMUDA ISLANDS
109,071 1.07
BCO ABC 7.875% 10-08.04.20REGS 150,000 150,230 1.48USD
BRAZIL
TELEMAR N L 5.5% 23.10.20REGS 200,000 197,063 1.93USD
347,293 3.41
COGARD 11.25% 10-22.04.17 200,000 207,482 2.04USD
CAYMAN ISLANDS
PETBRA 5.375% 11-27.01.21 100,000 100,519 0.99USD
308,001 3.03
ALFA MTN ISS 8% 10-18.03.15 250,000 269,948 2.65USD
CYPRUS
269,948 2.65
BIZ FIN 8.375% 10-27.04.15 200,000 208,412 2.05USD
GREAT BRITAIN
208,412 2.05
BBLTB 4.8% 10-18.10.20 REG-S 200,000 190,643 1.87USD
HONG KONG
ICICI BK 5.75% 10-16.11.20REGS 300,000 296,284 2.92USD
PACNET 9.25% 10-09.11.15REGS 200,000 204,019 2.00USD
690,946 6.79
EVRAZ GP 9.5% 08-24.04.18REGS 100,000 117,260 1.15USD
LUXEMBOURG
GAZ CAPITAL 6.51% 07-07.03.22 200,000 212,782 2.09USD
INVESTMENTS
Global Emerging Markets Corporate Debt (launched as at 16December 2010)Statement of investments as at 31 March 2011(expressed in USD)
Description Currency Evaluation % netassets
Face Value
RSHB CAPITAL 6.299% 07-15.05.17 200,000 209,747 2.06USD
539,789 5.30
BANCOMER 7.25% 10-22.04.20 /SUB 200,000 202,921 1.99USD
MEXICO
202,921 1.99
VOTORANTIM 6.625% 09-25.09.19 300,000 317,155 3.12USD
NETHERLANDS ANTILLES
317,155 3.12
BANCO PERU 5.75% 10-07.10.20 300,000 280,554 2.76USD
PERU
280,554 2.76
COMM BK QATAR 7.5% 09-18.11.19 200,000 218,181 2.14USD
QATAR
218,181 2.14
BAKRIE TEL 11.5% 10-07.05.15 200,000 217,227 2.13USD
SINGAPORE
BUMI CAP 12% 09-10.11.16 250,000 291,038 2.86USD
SIGMA CAP FRN 10-30.04.15 200,000 215,489 2.12USD
723,754 7.11
HANA BANK 4.5% 10-30.10.15 200,000 205,779 2.02USD
SOUTH KOREA
HYNIX SEMICO.7.875% 07-27.06.17 REGS 200,000 207,868 2.05USD
SHINHAN BK 4.375% 10-15.09.15 200,000 204,751 2.01USD
618,398 6.08
ABU DHABI 5.875% 06-27.10.16 200,000 210,504 2.07USD
UNITED ARAB EMIRATES
ABUDHABI BANK 4.75% 09-08.10.14 150,000 153,484 1.51USD
363,988 3.58
CEMEX FIN 9.5% 09-14.12.16 200,000 215,731 2.12USD
UNITED STATES
215,731 2.12
Description Currency Evaluation % netassets
Face Value
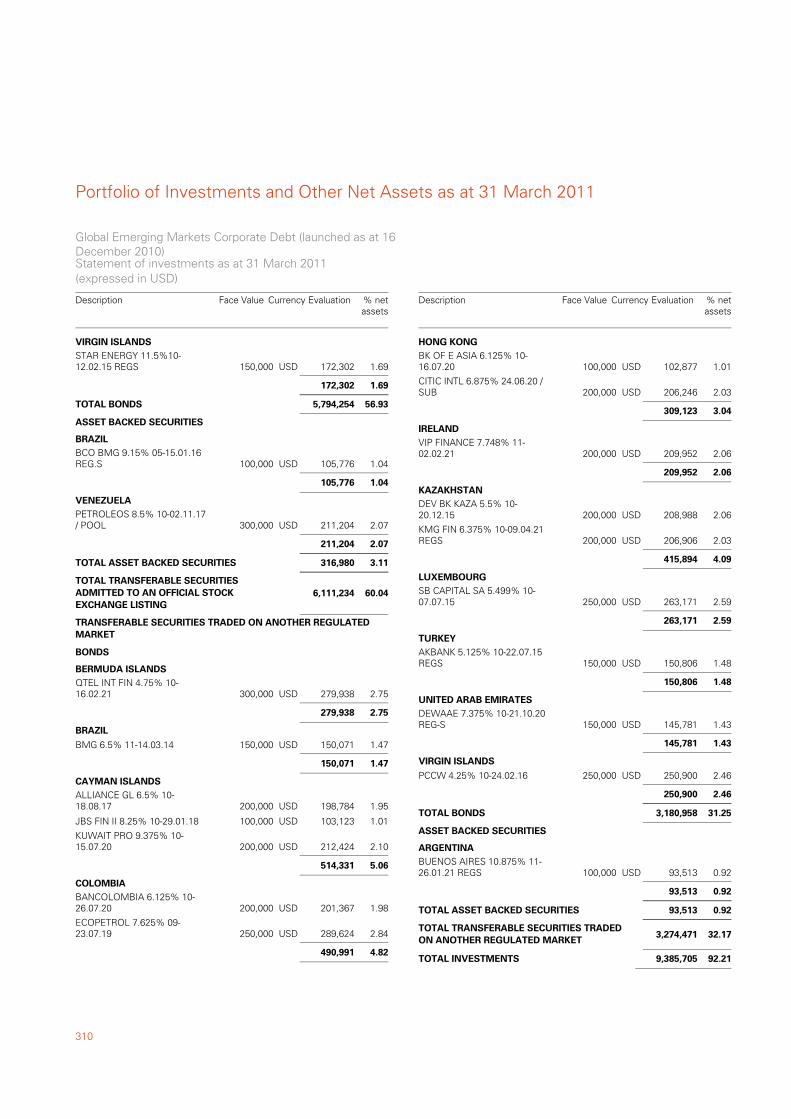
Portfolio of Investments and Other Net Assets as at 31 March 2011
310
STAR ENERGY 11.5%10-12.02.15 REGS 150,000 172,302 1.69USD
VIRGIN ISLANDS
172,302 1.69
56.935,794,254TOTAL BONDS
BCO BMG 9.15% 05-15.01.16REG.S 100,000 105,776 1.04USD
ASSET BACKED SECURITIES
BRAZIL
105,776 1.04
PETROLEOS 8.5% 10-02.11.17/ POOL 300,000 211,204 2.07USD
VENEZUELA
211,204 2.07
3.11316,980TOTAL ASSET BACKED SECURITIES
60.04TOTAL TRANSFERABLE SECURITIESADMITTED TO AN OFFICIAL STOCKEXCHANGE LISTING
6,111,234
QTEL INT FIN 4.75% 10-16.02.21 300,000 279,938 2.75USD
TRANSFERABLE SECURITIES TRADED ON ANOTHER REGULATEDMARKET
BONDS
BERMUDA ISLANDS
279,938 2.75
BMG 6.5% 11-14.03.14 150,000 150,071 1.47USD
BRAZIL
150,071 1.47
ALLIANCE GL 6.5% 10-18.08.17 200,000 198,784 1.95USD
CAYMAN ISLANDS
JBS FIN II 8.25% 10-29.01.18 100,000 103,123 1.01USD
KUWAIT PRO 9.375% 10-15.07.20 200,000 212,424 2.10USD
514,331 5.06
BANCOLOMBIA 6.125% 10-26.07.20 200,000 201,367 1.98USD
COLOMBIA
ECOPETROL 7.625% 09-23.07.19 250,000 289,624 2.84USD
490,991 4.82
Global Emerging Markets Corporate Debt (launched as at 16December 2010)Statement of investments as at 31 March 2011(expressed in USD)
Description Currency Evaluation % netassets
Face Value
BK OF E ASIA 6.125% 10-16.07.20 100,000 102,877 1.01USD
HONG KONG
CITIC INTL 6.875% 24.06.20 /SUB 200,000 206,246 2.03USD
309,123 3.04
VIP FINANCE 7.748% 11-02.02.21 200,000 209,952 2.06USD
IRELAND
209,952 2.06
DEV BK KAZA 5.5% 10-20.12.15 200,000 208,988 2.06USD
KAZAKHSTAN
KMG FIN 6.375% 10-09.04.21REGS 200,000 206,906 2.03USD
415,894 4.09
SB CAPITAL SA 5.499% 10-07.07.15 250,000 263,171 2.59USD
LUXEMBOURG
263,171 2.59
AKBANK 5.125% 10-22.07.15REGS 150,000 150,806 1.48USD
TURKEY
150,806 1.48
DEWAAE 7.375% 10-21.10.20REG-S 150,000 145,781 1.43USD
UNITED ARAB EMIRATES
145,781 1.43
PCCW 4.25% 10-24.02.16 250,000 250,900 2.46USD
VIRGIN ISLANDS
250,900 2.46
31.253,180,958TOTAL BONDS
BUENOS AIRES 10.875% 11-26.01.21 REGS 100,000 93,513 0.92USD
ASSET BACKED SECURITIES
ARGENTINA
93,513 0.92
0.9293,513TOTAL ASSET BACKED SECURITIES
32.17TOTAL TRANSFERABLE SECURITIES TRADEDON ANOTHER REGULATED MARKET
3,274,471
92.21TOTAL INVESTMENTS 9,385,705
Description Currency Evaluation % netassets
Face Value
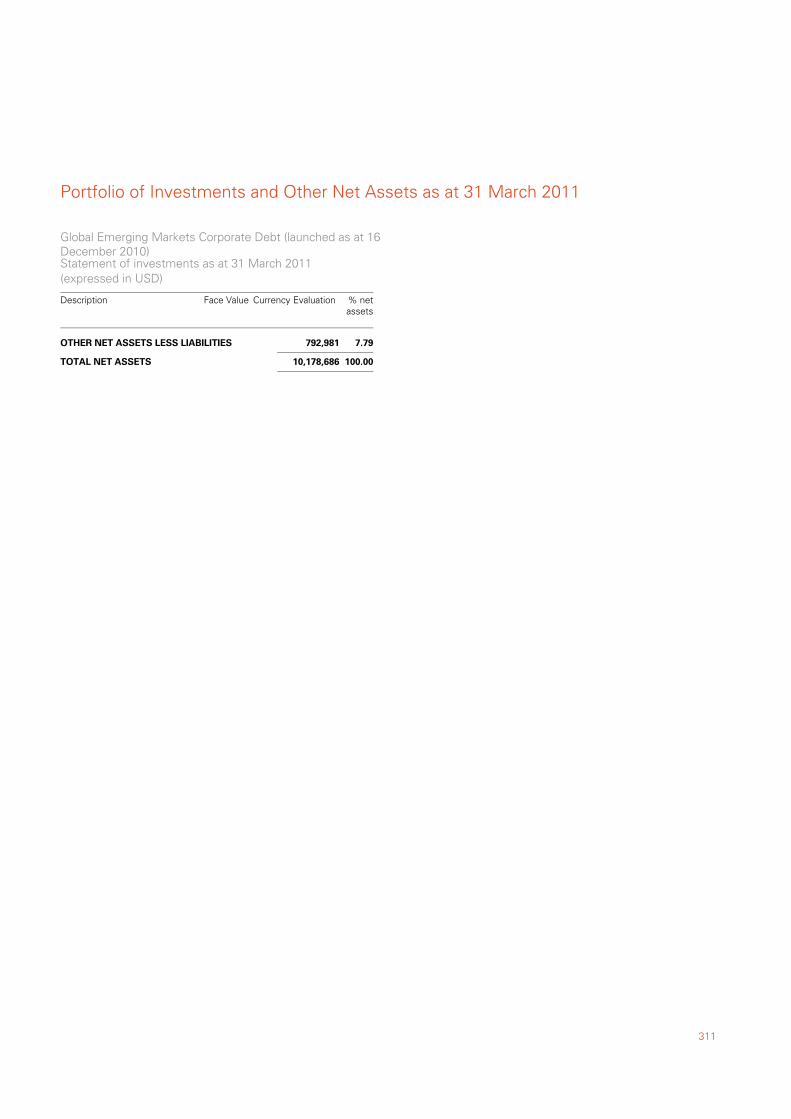
311
Portfolio of Investments and Other Net Assets as at 31 March 2011
7.79OTHER NET ASSETS LESS LIABILITIES 792,981
100.00TOTAL NET ASSETS 10,178,686
Global Emerging Markets Corporate Debt (launched as at 16December 2010)Statement of investments as at 31 March 2011(expressed in USD)
Description Currency Evaluation % netassets
Face Value
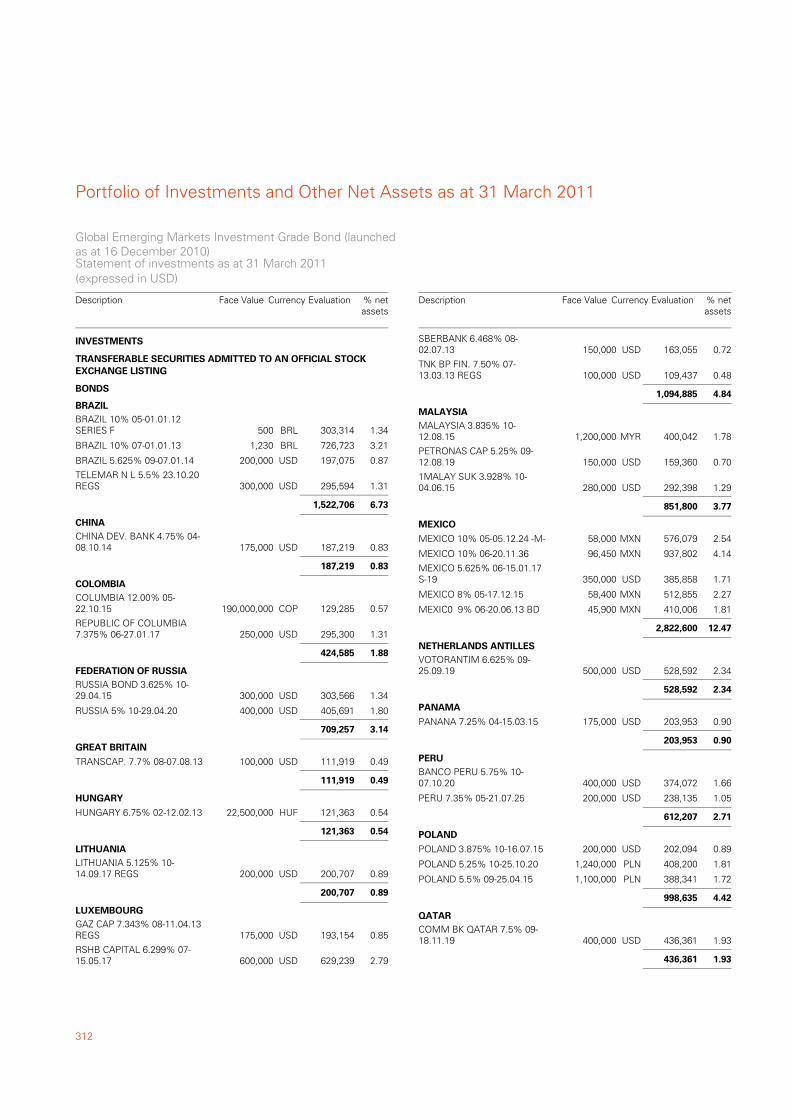
Portfolio of Investments and Other Net Assets as at 31 March 2011
312
BRAZIL 10% 05-01.01.12SERIES F 500 303,314 1.34BRL
TRANSFERABLE SECURITIES ADMITTED TO AN OFFICIAL STOCKEXCHANGE LISTING
BONDS
BRAZIL
BRAZIL 10% 07-01.01.13 1,230 726,723 3.21BRL
BRAZIL 5.625% 09-07.01.14 200,000 197,075 0.87USD
TELEMAR N L 5.5% 23.10.20REGS 300,000 295,594 1.31USD
1,522,706 6.73
CHINA DEV. BANK 4.75% 04-08.10.14 175,000 187,219 0.83USD
CHINA
187,219 0.83
COLUMBIA 12.00% 05-22.10.15 190,000,000 129,285 0.57COP
COLOMBIA
REPUBLIC OF COLUMBIA7.375% 06-27.01.17 250,000 295,300 1.31USD
424,585 1.88
RUSSIA BOND 3.625% 10-29.04.15 300,000 303,566 1.34USD
FEDERATION OF RUSSIA
RUSSIA 5% 10-29.04.20 400,000 405,691 1.80USD
709,257 3.14
TRANSCAP. 7.7% 08-07.08.13 100,000 111,919 0.49USD
GREAT BRITAIN
111,919 0.49
HUNGARY 6.75% 02-12.02.13 22,500,000 121,363 0.54HUF
HUNGARY
121,363 0.54
LITHUANIA 5.125% 10-14.09.17 REGS 200,000 200,707 0.89USD
LITHUANIA
200,707 0.89
GAZ CAP 7.343% 08-11.04.13REGS 175,000 193,154 0.85USD
LUXEMBOURG
RSHB CAPITAL 6.299% 07-15.05.17 600,000 629,239 2.79USD
INVESTMENTS
Global Emerging Markets Investment Grade Bond (launchedas at 16 December 2010)Statement of investments as at 31 March 2011(expressed in USD)
Description Currency Evaluation % netassets
Face Value
SBERBANK 6.468% 08-02.07.13 150,000 163,055 0.72USD
TNK BP FIN. 7.50% 07-13.03.13 REGS 100,000 109,437 0.48USD
1,094,885 4.84
MALAYSIA 3.835% 10-12.08.15 1,200,000 400,042 1.78MYR
MALAYSIA
PETRONAS CAP 5.25% 09-12.08.19 150,000 159,360 0.70USD
1MALAY SUK 3.928% 10-04.06.15 280,000 292,398 1.29USD
851,800 3.77
MEXICO 10% 05-05.12.24 -M- 58,000 576,079 2.54MXN
MEXICO
MEXICO 10% 06-20.11.36 96,450 937,802 4.14MXN
MEXICO 5.625% 06-15.01.17S-19 350,000 385,858 1.71USD
MEXICO 8% 05-17.12.15 58,400 512,855 2.27MXN
MEXIC0 9% 06-20.06.13 BD 45,900 410,006 1.81MXN
2,822,600 12.47
VOTORANTIM 6.625% 09-25.09.19 500,000 528,592 2.34USD
NETHERLANDS ANTILLES
528,592 2.34
PANANA 7.25% 04-15.03.15 175,000 203,953 0.90USD
PANAMA
203,953 0.90
BANCO PERU 5.75% 10-07.10.20 400,000 374,072 1.66USD
PERU
PERU 7.35% 05-21.07.25 200,000 238,135 1.05USD
612,207 2.71
POLAND 3.875% 10-16.07.15 200,000 202,094 0.89USD
POLAND
POLAND 5.25% 10-25.10.20 1,240,000 408,200 1.81PLN
POLAND 5.5% 09-25.04.15 1,100,000 388,341 1.72PLN
998,635 4.42
COMM BK QATAR 7.5% 09-18.11.19 400,000 436,361 1.93USD
QATAR
436,361 1.93
Description Currency Evaluation % netassets
Face Value
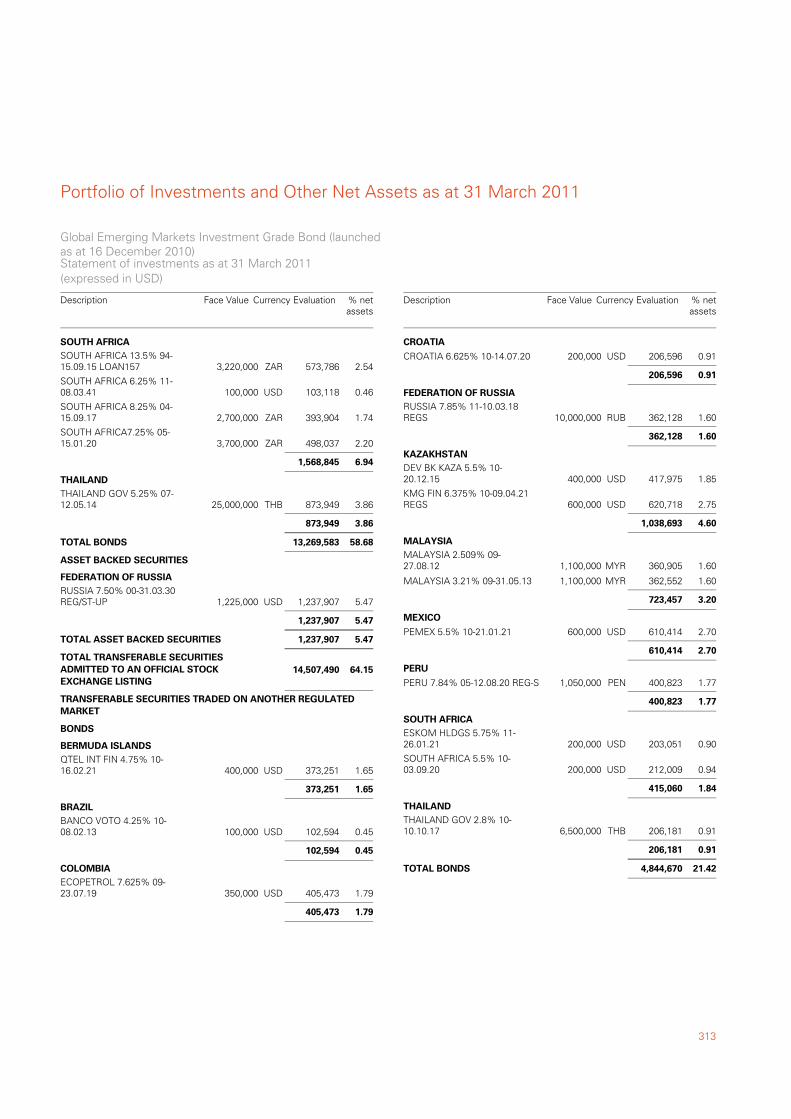
313
Portfolio of Investments and Other Net Assets as at 31 March 2011
SOUTH AFRICA 13.5% 94-15.09.15 LOAN157 3,220,000 573,786 2.54ZAR
SOUTH AFRICA
SOUTH AFRICA 6.25% 11-08.03.41 100,000 103,118 0.46USD
SOUTH AFRICA 8.25% 04-15.09.17 2,700,000 393,904 1.74ZAR
SOUTH AFRICA7.25% 05-15.01.20 3,700,000 498,037 2.20ZAR
1,568,845 6.94
THAILAND GOV 5.25% 07-12.05.14 25,000,000 873,949 3.86THB
THAILAND
873,949 3.86
58.6813,269,583TOTAL BONDS
RUSSIA 7.50% 00-31.03.30REG/ST-UP 1,225,000 1,237,907 5.47USD
ASSET BACKED SECURITIES
FEDERATION OF RUSSIA
1,237,907 5.47
5.471,237,907TOTAL ASSET BACKED SECURITIES
64.15TOTAL TRANSFERABLE SECURITIESADMITTED TO AN OFFICIAL STOCKEXCHANGE LISTING
14,507,490
QTEL INT FIN 4.75% 10-16.02.21 400,000 373,251 1.65USD
TRANSFERABLE SECURITIES TRADED ON ANOTHER REGULATEDMARKET
BONDS
BERMUDA ISLANDS
373,251 1.65
BANCO VOTO 4.25% 10-08.02.13 100,000 102,594 0.45USD
BRAZIL
102,594 0.45
ECOPETROL 7.625% 09-23.07.19 350,000 405,473 1.79USD
COLOMBIA
405,473 1.79
Global Emerging Markets Investment Grade Bond (launchedas at 16 December 2010)Statement of investments as at 31 March 2011(expressed in USD)
Description Currency Evaluation % netassets
Face Value
CROATIA 6.625% 10-14.07.20 200,000 206,596 0.91USD
CROATIA
206,596 0.91
RUSSIA 7.85% 11-10.03.18REGS 10,000,000 362,128 1.60RUB
FEDERATION OF RUSSIA
362,128 1.60
DEV BK KAZA 5.5% 10-20.12.15 400,000 417,975 1.85USD
KAZAKHSTAN
KMG FIN 6.375% 10-09.04.21REGS 600,000 620,718 2.75USD
1,038,693 4.60
MALAYSIA 2.509% 09-27.08.12 1,100,000 360,905 1.60MYR
MALAYSIA
MALAYSIA 3.21% 09-31.05.13 1,100,000 362,552 1.60MYR
723,457 3.20
PEMEX 5.5% 10-21.01.21 600,000 610,414 2.70USD
MEXICO
610,414 2.70
PERU 7.84% 05-12.08.20 REG-S 1,050,000 400,823 1.77PEN
PERU
400,823 1.77
ESKOM HLDGS 5.75% 11-26.01.21 200,000 203,051 0.90USD
SOUTH AFRICA
SOUTH AFRICA 5.5% 10-03.09.20 200,000 212,009 0.94USD
415,060 1.84
THAILAND GOV 2.8% 10-10.10.17 6,500,000 206,181 0.91THB
THAILAND
206,181 0.91
21.424,844,670TOTAL BONDS
Description Currency Evaluation % netassets
Face Value
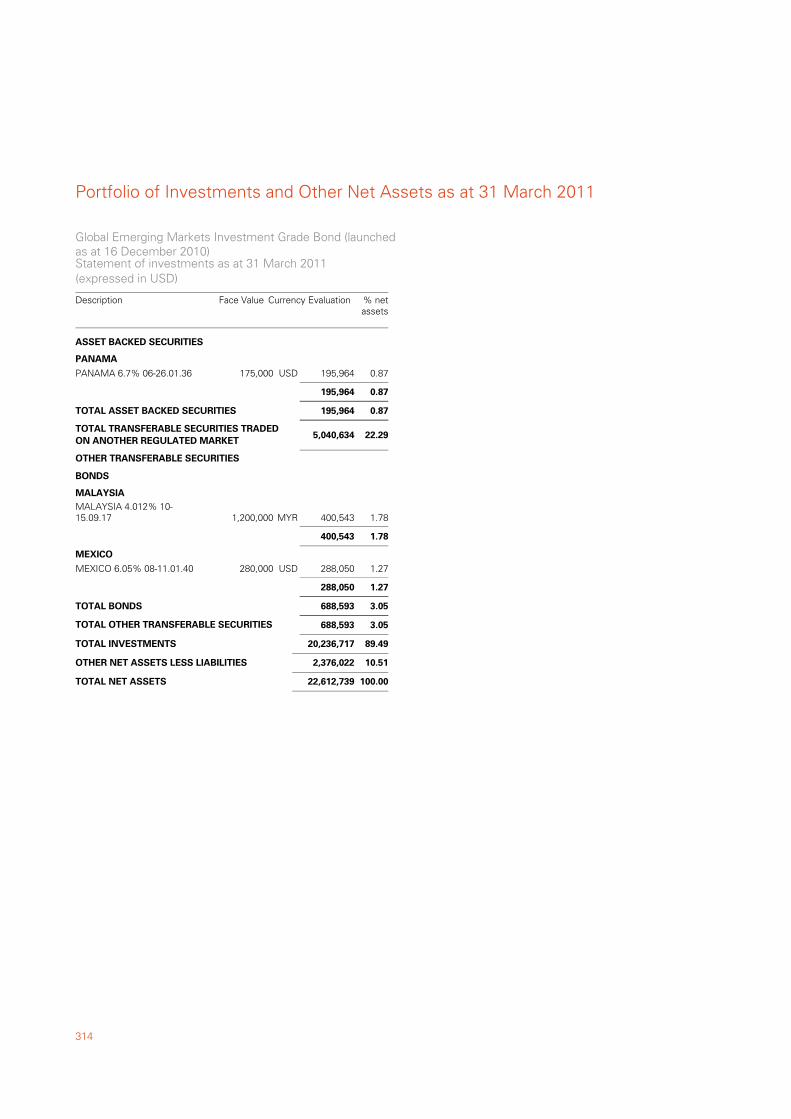
Portfolio of Investments and Other Net Assets as at 31 March 2011
314
PANAMA 6.7% 06-26.01.36 175,000 195,964 0.87USD
ASSET BACKED SECURITIES
PANAMA
195,964 0.87
0.87195,964TOTAL ASSET BACKED SECURITIES
22.29TOTAL TRANSFERABLE SECURITIES TRADEDON ANOTHER REGULATED MARKET
5,040,634
MALAYSIA 4.012% 10-15.09.17 1,200,000 400,543 1.78MYR
OTHER TRANSFERABLE SECURITIES
BONDS
MALAYSIA
400,543 1.78
MEXICO 6.05% 08-11.01.40 280,000 288,050 1.27USD
MEXICO
288,050 1.27
3.05688,593TOTAL BONDS
3.05TOTAL OTHER TRANSFERABLE SECURITIES 688,593
89.49TOTAL INVESTMENTS 20,236,717
10.51OTHER NET ASSETS LESS LIABILITIES 2,376,022
100.00TOTAL NET ASSETS 22,612,739
Global Emerging Markets Investment Grade Bond (launchedas at 16 December 2010)Statement of investments as at 31 March 2011(expressed in USD)
Description Currency Evaluation % netassets
Face Value
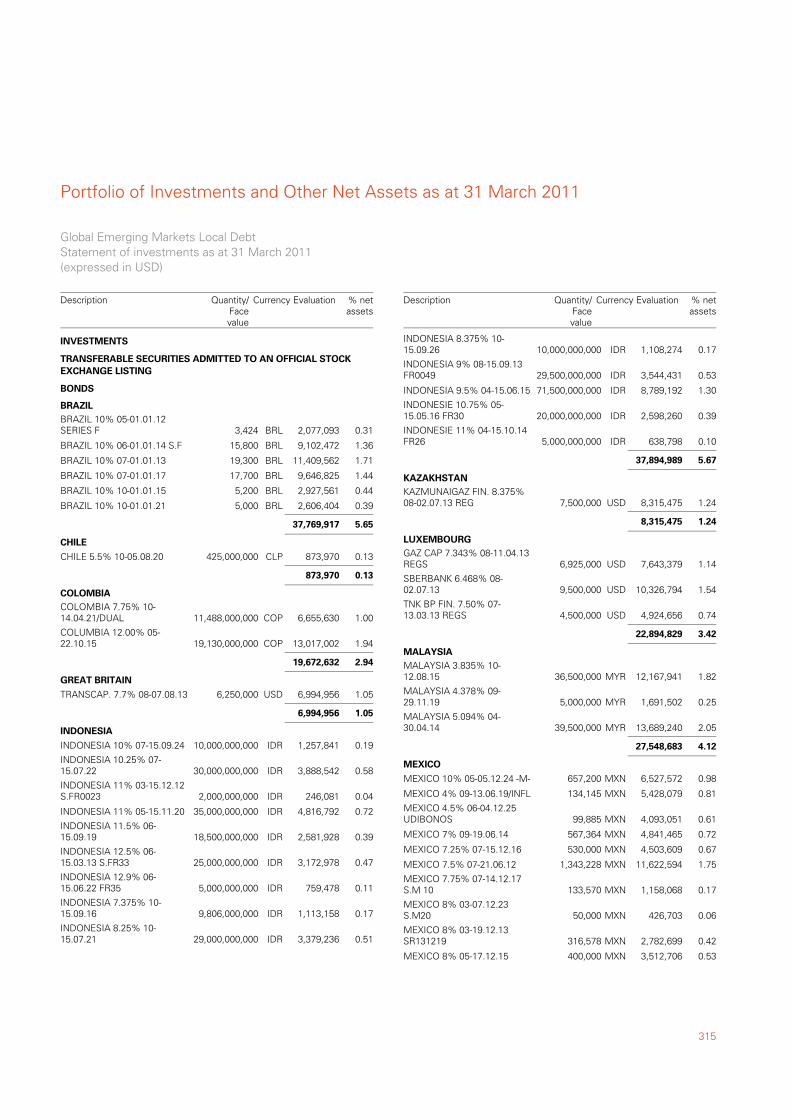
315
Portfolio of Investments and Other Net Assets as at 31 March 2011
BRAZIL 10% 05-01.01.12SERIES F 3,424 2,077,093 0.31BRL
TRANSFERABLE SECURITIES ADMITTED TO AN OFFICIAL STOCKEXCHANGE LISTING
BONDS
BRAZIL
BRAZIL 10% 06-01.01.14 S.F 15,800 9,102,472 1.36BRL
BRAZIL 10% 07-01.01.13 19,300 11,409,562 1.71BRL
BRAZIL 10% 07-01.01.17 17,700 9,646,825 1.44BRL
BRAZIL 10% 10-01.01.15 5,200 2,927,561 0.44BRL
BRAZIL 10% 10-01.01.21 5,000 2,606,404 0.39BRL
37,769,917 5.65
CHILE 5.5% 10-05.08.20 425,000,000 873,970 0.13CLP
CHILE
873,970 0.13
COLOMBIA 7.75% 10-14.04.21/DUAL 11,488,000,000 6,655,630 1.00COP
COLOMBIA
COLUMBIA 12.00% 05-22.10.15 19,130,000,000 13,017,002 1.94COP
19,672,632 2.94
TRANSCAP. 7.7% 08-07.08.13 6,250,000 6,994,956 1.05USD
GREAT BRITAIN
6,994,956 1.05
INDONESIA 10% 07-15.09.24 10,000,000,000 1,257,841 0.19IDR
INDONESIA
INDONESIA 10.25% 07-15.07.22 30,000,000,000 3,888,542 0.58IDR
INDONESIA 11% 03-15.12.12S.FR0023 2,000,000,000 246,081 0.04IDR
INDONESIA 11% 05-15.11.20 35,000,000,000 4,816,792 0.72IDR
INDONESIA 11.5% 06-15.09.19 18,500,000,000 2,581,928 0.39IDR
INDONESIA 12.5% 06-15.03.13 S.FR33 25,000,000,000 3,172,978 0.47IDR
INDONESIA 12.9% 06-15.06.22 FR35 5,000,000,000 759,478 0.11IDR
INDONESIA 7.375% 10-15.09.16 9,806,000,000 1,113,158 0.17IDR
INDONESIA 8.25% 10-15.07.21 29,000,000,000 3,379,236 0.51IDR
INVESTMENTS
Global Emerging Markets Local DebtStatement of investments as at 31 March 2011(expressed in USD)
Description Currency Evaluation % netassets
Quantity/Facevalue
INDONESIA 8.375% 10-15.09.26 10,000,000,000 1,108,274 0.17IDR
INDONESIA 9% 08-15.09.13FR0049 29,500,000,000 3,544,431 0.53IDR
INDONESIA 9.5% 04-15.06.15 71,500,000,000 8,789,192 1.30IDR
INDONESIE 10.75% 05-15.05.16 FR30 20,000,000,000 2,598,260 0.39IDR
INDONESIE 11% 04-15.10.14FR26 5,000,000,000 638,798 0.10IDR
37,894,989 5.67
KAZMUNAIGAZ FIN. 8.375%08-02.07.13 REG 7,500,000 8,315,475 1.24USD
KAZAKHSTAN
8,315,475 1.24
GAZ CAP 7.343% 08-11.04.13REGS 6,925,000 7,643,379 1.14USD
LUXEMBOURG
SBERBANK 6.468% 08-02.07.13 9,500,000 10,326,794 1.54USD
TNK BP FIN. 7.50% 07-13.03.13 REGS 4,500,000 4,924,656 0.74USD
22,894,829 3.42
MALAYSIA 3.835% 10-12.08.15 36,500,000 12,167,941 1.82MYR
MALAYSIA
MALAYSIA 4.378% 09-29.11.19 5,000,000 1,691,502 0.25MYR
MALAYSIA 5.094% 04-30.04.14 39,500,000 13,689,240 2.05MYR
27,548,683 4.12
MEXICO 10% 05-05.12.24 -M- 657,200 6,527,572 0.98MXN
MEXICO
MEXICO 4% 09-13.06.19/INFL 134,145 5,428,079 0.81MXN
MEXICO 4.5% 06-04.12.25UDIBONOS 99,885 4,093,051 0.61MXN
MEXICO 7% 09-19.06.14 567,364 4,841,465 0.72MXN
MEXICO 7.25% 07-15.12.16 530,000 4,503,609 0.67MXN
MEXICO 7.5% 07-21.06.12 1,343,228 11,622,594 1.75MXN
MEXICO 7.75% 07-14.12.17S.M 10 133,570 1,158,068 0.17MXN
MEXICO 8% 03-07.12.23S.M20 50,000 426,703 0.06MXN
MEXICO 8% 03-19.12.13SR131219 316,578 2,782,699 0.42MXN
MEXICO 8% 05-17.12.15 400,000 3,512,706 0.53MXN
Description Currency Evaluation % netassets
Quantity/Facevalue
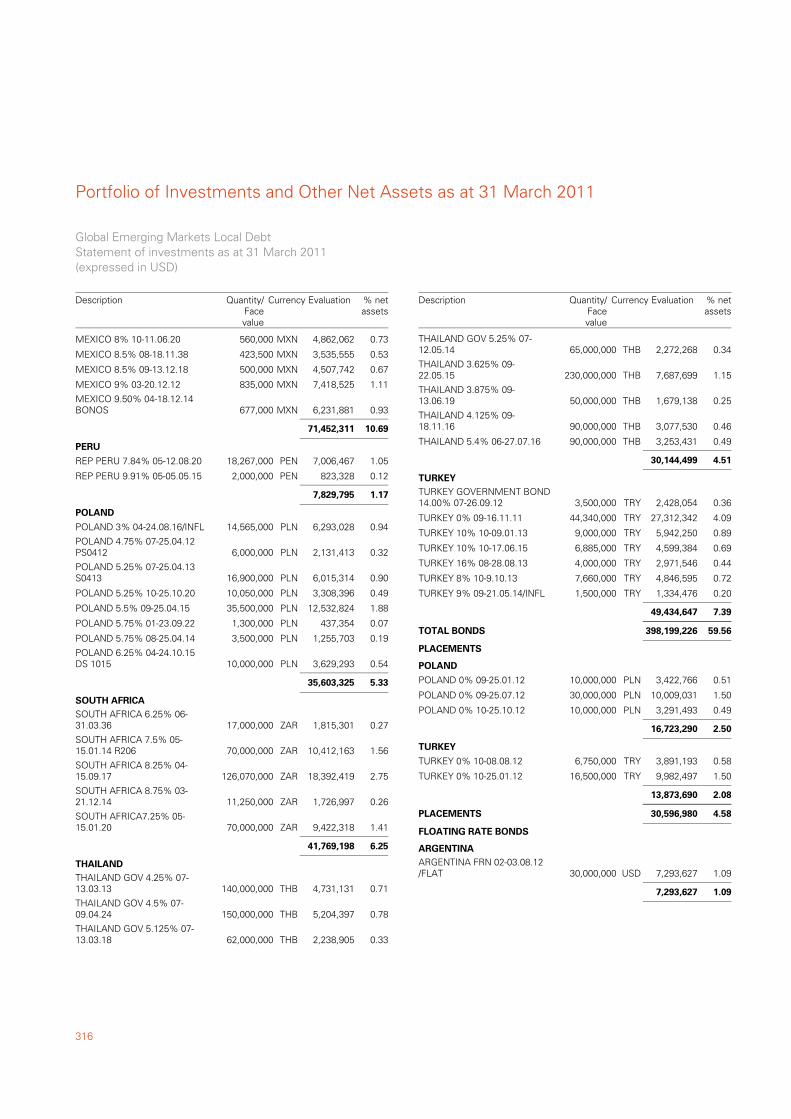
Portfolio of Investments and Other Net Assets as at 31 March 2011
316
MEXICO 8% 10-11.06.20 560,000 4,862,062 0.73MXN
MEXICO 8.5% 08-18.11.38 423,500 3,535,555 0.53MXN
MEXICO 8.5% 09-13.12.18 500,000 4,507,742 0.67MXN
MEXICO 9% 03-20.12.12 835,000 7,418,525 1.11MXN
MEXICO 9.50% 04-18.12.14BONOS 677,000 6,231,881 0.93MXN
71,452,311 10.69
REP PERU 7.84% 05-12.08.20 18,267,000 7,006,467 1.05PEN
PERU
REP PERU 9.91% 05-05.05.15 2,000,000 823,328 0.12PEN
7,829,795 1.17
POLAND 3% 04-24.08.16/INFL 14,565,000 6,293,028 0.94PLN
POLAND
POLAND 4.75% 07-25.04.12PS0412 6,000,000 2,131,413 0.32PLN
POLAND 5.25% 07-25.04.13S0413 16,900,000 6,015,314 0.90PLN
POLAND 5.25% 10-25.10.20 10,050,000 3,308,396 0.49PLN
POLAND 5.5% 09-25.04.15 35,500,000 12,532,824 1.88PLN
POLAND 5.75% 01-23.09.22 1,300,000 437,354 0.07PLN
POLAND 5.75% 08-25.04.14 3,500,000 1,255,703 0.19PLN
POLAND 6.25% 04-24.10.15DS 1015 10,000,000 3,629,293 0.54PLN
35,603,325 5.33
SOUTH AFRICA 6.25% 06-31.03.36 17,000,000 1,815,301 0.27ZAR
SOUTH AFRICA
SOUTH AFRICA 7.5% 05-15.01.14 R206 70,000,000 10,412,163 1.56ZAR
SOUTH AFRICA 8.25% 04-15.09.17 126,070,000 18,392,419 2.75ZAR
SOUTH AFRICA 8.75% 03-21.12.14 11,250,000 1,726,997 0.26ZAR
SOUTH AFRICA7.25% 05-15.01.20 70,000,000 9,422,318 1.41ZAR
41,769,198 6.25
THAILAND GOV 4.25% 07-13.03.13 140,000,000 4,731,131 0.71THB
THAILAND
THAILAND GOV 4.5% 07-09.04.24 150,000,000 5,204,397 0.78THB
THAILAND GOV 5.125% 07-13.03.18 62,000,000 2,238,905 0.33THB
Global Emerging Markets Local DebtStatement of investments as at 31 March 2011(expressed in USD)
Description Currency Evaluation % netassets
Quantity/Facevalue
THAILAND GOV 5.25% 07-12.05.14 65,000,000 2,272,268 0.34THB
THAILAND 3.625% 09-22.05.15 230,000,000 7,687,699 1.15THB
THAILAND 3.875% 09-13.06.19 50,000,000 1,679,138 0.25THB
THAILAND 4.125% 09-18.11.16 90,000,000 3,077,530 0.46THB
THAILAND 5.4% 06-27.07.16 90,000,000 3,253,431 0.49THB
30,144,499 4.51
TURKEY GOVERNMENT BOND14.00% 07-26.09.12 3,500,000 2,428,054 0.36TRY
TURKEY
TURKEY 0% 09-16.11.11 44,340,000 27,312,342 4.09TRY
TURKEY 10% 10-09.01.13 9,000,000 5,942,250 0.89TRY
TURKEY 10% 10-17.06.15 6,885,000 4,599,384 0.69TRY
TURKEY 16% 08-28.08.13 4,000,000 2,971,546 0.44TRY
TURKEY 8% 10-9.10.13 7,660,000 4,846,595 0.72TRY
TURKEY 9% 09-21.05.14/INFL 1,500,000 1,334,476 0.20TRY
49,434,647 7.39
59.56398,199,226TOTAL BONDS
POLAND 0% 09-25.01.12 10,000,000 3,422,766 0.51PLN
PLACEMENTS
POLAND
POLAND 0% 09-25.07.12 30,000,000 10,009,031 1.50PLN
POLAND 0% 10-25.10.12 10,000,000 3,291,493 0.49PLN
16,723,290 2.50
TURKEY 0% 10-08.08.12 6,750,000 3,891,193 0.58TRY
TURKEY
TURKEY 0% 10-25.01.12 16,500,000 9,982,497 1.50TRY
13,873,690 2.08
4.5830,596,980PLACEMENTS
ARGENTINA FRN 02-03.08.12/FLAT 30,000,000 7,293,627 1.09USD
FLOATING RATE BONDS
ARGENTINA
7,293,627 1.09
Description Currency Evaluation % netassets
Quantity/Facevalue
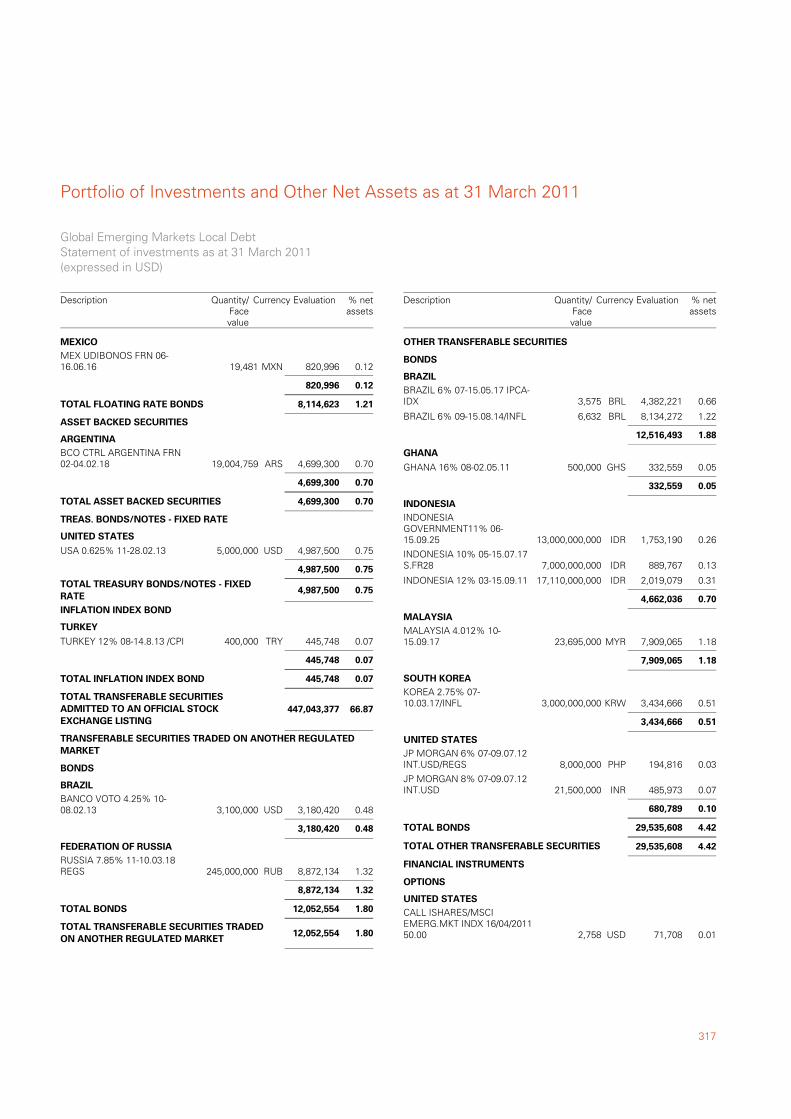
317
Portfolio of Investments and Other Net Assets as at 31 March 2011
MEX UDIBONOS FRN 06-16.06.16 19,481 820,996 0.12MXN
MEXICO
820,996 0.12
1.218,114,623TOTAL FLOATING RATE BONDS
BCO CTRL ARGENTINA FRN02-04.02.18 19,004,759 4,699,300 0.70ARS
ASSET BACKED SECURITIES
ARGENTINA
4,699,300 0.70
0.704,699,300TOTAL ASSET BACKED SECURITIES
USA 0.625% 11-28.02.13 5,000,000 4,987,500 0.75USD
TREAS. BONDS/NOTES - FIXED RATE
UNITED STATES
4,987,500 0.75
0.754,987,500TOTAL TREASURY BONDS/NOTES - FIXEDRATE
TURKEY 12% 08-14.8.13 /CPI 400,000 445,748 0.07TRY
INFLATION INDEX BOND
TURKEY
445,748 0.07
0.07445,748TOTAL INFLATION INDEX BOND
66.87TOTAL TRANSFERABLE SECURITIESADMITTED TO AN OFFICIAL STOCKEXCHANGE LISTING
447,043,377
BANCO VOTO 4.25% 10-08.02.13 3,100,000 3,180,420 0.48USD
TRANSFERABLE SECURITIES TRADED ON ANOTHER REGULATEDMARKET
BONDS
BRAZIL
3,180,420 0.48
RUSSIA 7.85% 11-10.03.18REGS 245,000,000 8,872,134 1.32RUB
FEDERATION OF RUSSIA
8,872,134 1.32
1.8012,052,554TOTAL BONDS
1.80TOTAL TRANSFERABLE SECURITIES TRADEDON ANOTHER REGULATED MARKET
12,052,554
Global Emerging Markets Local DebtStatement of investments as at 31 March 2011(expressed in USD)
Description Currency Evaluation % netassets
Quantity/Facevalue
BRAZIL 6% 07-15.05.17 IPCA-IDX 3,575 4,382,221 0.66BRL
OTHER TRANSFERABLE SECURITIES
BONDS
BRAZIL
BRAZIL 6% 09-15.08.14/INFL 6,632 8,134,272 1.22BRL
12,516,493 1.88
GHANA 16% 08-02.05.11 500,000 332,559 0.05GHS
GHANA
332,559 0.05
INDONESIAGOVERNMENT11% 06-15.09.25 13,000,000,000 1,753,190 0.26IDR
INDONESIA
INDONESIA 10% 05-15.07.17S.FR28 7,000,000,000 889,767 0.13IDR
INDONESIA 12% 03-15.09.11 17,110,000,000 2,019,079 0.31IDR
4,662,036 0.70
MALAYSIA 4.012% 10-15.09.17 23,695,000 7,909,065 1.18MYR
MALAYSIA
7,909,065 1.18
KOREA 2.75% 07-10.03.17/INFL 3,000,000,000 3,434,666 0.51KRW
SOUTH KOREA
3,434,666 0.51
JP MORGAN 6% 07-09.07.12INT.USD/REGS 8,000,000 194,816 0.03PHP
UNITED STATES
JP MORGAN 8% 07-09.07.12INT.USD 21,500,000 485,973 0.07INR
680,789 0.10
4.4229,535,608TOTAL BONDS
4.42TOTAL OTHER TRANSFERABLE SECURITIES 29,535,608
CALL ISHARES/MSCIEMERG.MKT INDX 16/04/201150.00 2,758 71,708 0.01USD
FINANCIAL INSTRUMENTS
OPTIONS
UNITED STATES
Description Currency Evaluation % netassets
Quantity/Facevalue
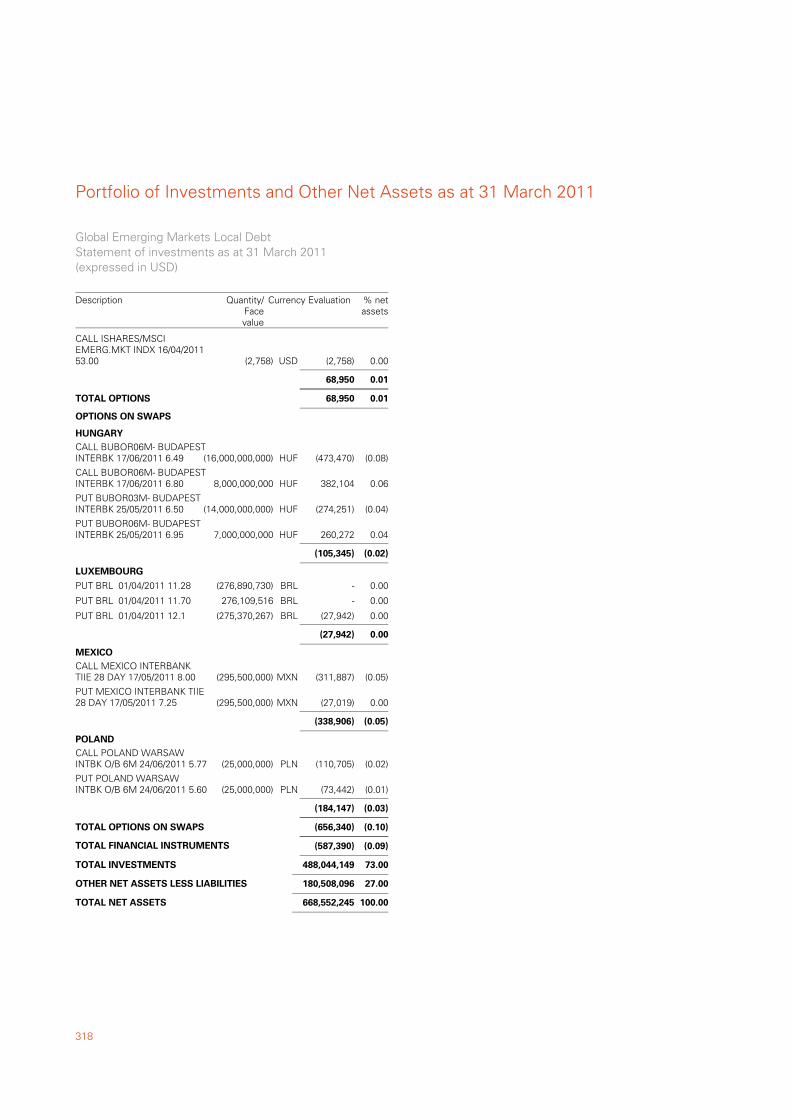
Portfolio of Investments and Other Net Assets as at 31 March 2011
318
CALL ISHARES/MSCIEMERG.MKT INDX 16/04/201153.00 (2,758) (2,758) 0.00USD
68,950 0.01
0.0168,950TOTAL OPTIONS
CALL BUBOR06M- BUDAPESTINTERBK 17/06/2011 6.49 (16,000,000,000) (473,470) (0.08)HUF
OPTIONS ON SWAPS
HUNGARY
CALL BUBOR06M- BUDAPESTINTERBK 17/06/2011 6.80 8,000,000,000 382,104 0.06HUF
PUT BUBOR03M- BUDAPESTINTERBK 25/05/2011 6.50 (14,000,000,000) (274,251) (0.04)HUF
PUT BUBOR06M- BUDAPESTINTERBK 25/05/2011 6.95 7,000,000,000 260,272 0.04HUF
(105,345) (0.02)
PUT BRL 01/04/2011 11.28 (276,890,730) - 0.00BRL
LUXEMBOURG
PUT BRL 01/04/2011 11.70 276,109,516 - 0.00BRL
PUT BRL 01/04/2011 12.1 (275,370,267) (27,942) 0.00BRL
(27,942) 0.00
CALL MEXICO INTERBANKTIIE 28 DAY 17/05/2011 8.00 (295,500,000) (311,887) (0.05)MXN
MEXICO
PUT MEXICO INTERBANK TIIE28 DAY 17/05/2011 7.25 (295,500,000) (27,019) 0.00MXN
(338,906) (0.05)
CALL POLAND WARSAWINTBK O/B 6M 24/06/2011 5.77 (25,000,000) (110,705) (0.02)PLN
POLAND
PUT POLAND WARSAWINTBK O/B 6M 24/06/2011 5.60 (25,000,000) (73,442) (0.01)PLN
(184,147) (0.03)
(0.10)(656,340)TOTAL OPTIONS ON SWAPS
(0.09)TOTAL FINANCIAL INSTRUMENTS (587,390)
73.00TOTAL INVESTMENTS 488,044,149
27.00OTHER NET ASSETS LESS LIABILITIES 180,508,096
100.00TOTAL NET ASSETS 668,552,245
Global Emerging Markets Local DebtStatement of investments as at 31 March 2011(expressed in USD)
Description Currency Evaluation % netassets
Quantity/Facevalue
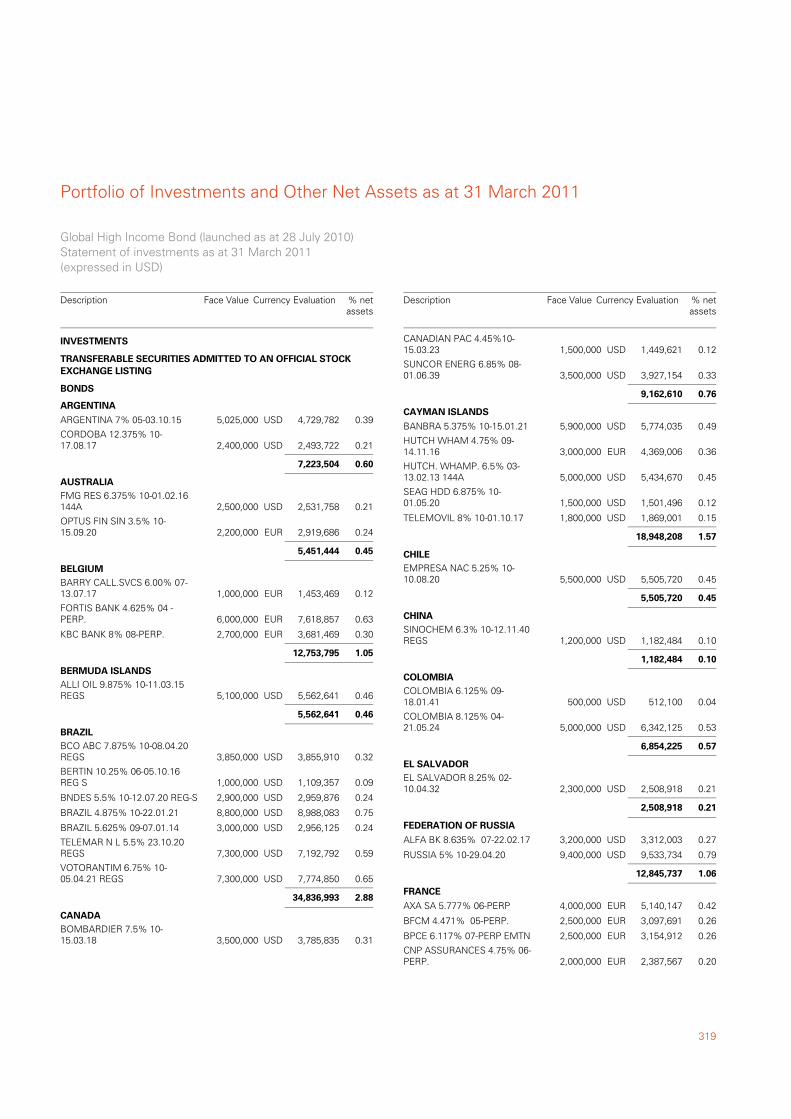
319
Portfolio of Investments and Other Net Assets as at 31 March 2011
ARGENTINA 7% 05-03.10.15 5,025,000 4,729,782 0.39USD
TRANSFERABLE SECURITIES ADMITTED TO AN OFFICIAL STOCKEXCHANGE LISTING
BONDS
ARGENTINA
CORDOBA 12.375% 10-17.08.17 2,400,000 2,493,722 0.21USD
7,223,504 0.60
FMG RES 6.375% 10-01.02.16144A 2,500,000 2,531,758 0.21USD
AUSTRALIA
OPTUS FIN SIN 3.5% 10-15.09.20 2,200,000 2,919,686 0.24EUR
5,451,444 0.45
BARRY CALL.SVCS 6.00% 07-13.07.17 1,000,000 1,453,469 0.12EUR
BELGIUM
FORTIS BANK 4.625% 04 -PERP. 6,000,000 7,618,857 0.63EUR
KBC BANK 8% 08-PERP. 2,700,000 3,681,469 0.30EUR
12,753,795 1.05
ALLI OIL 9.875% 10-11.03.15REGS 5,100,000 5,562,641 0.46USD
BERMUDA ISLANDS
5,562,641 0.46
BCO ABC 7.875% 10-08.04.20REGS 3,850,000 3,855,910 0.32USD
BRAZIL
BERTIN 10.25% 06-05.10.16REG S 1,000,000 1,109,357 0.09USD
BNDES 5.5% 10-12.07.20 REG-S 2,900,000 2,959,876 0.24USD
BRAZIL 4.875% 10-22.01.21 8,800,000 8,988,083 0.75USD
BRAZIL 5.625% 09-07.01.14 3,000,000 2,956,125 0.24USD
TELEMAR N L 5.5% 23.10.20REGS 7,300,000 7,192,792 0.59USD
VOTORANTIM 6.75% 10-05.04.21 REGS 7,300,000 7,774,850 0.65USD
34,836,993 2.88
BOMBARDIER 7.5% 10-15.03.18 3,500,000 3,785,835 0.31USD
CANADA
INVESTMENTS
Global High Income Bond (launched as at 28 July 2010)Statement of investments as at 31 March 2011(expressed in USD)
Description Currency Evaluation % netassets
Face Value
CANADIAN PAC 4.45%10-15.03.23 1,500,000 1,449,621 0.12USD
SUNCOR ENERG 6.85% 08-01.06.39 3,500,000 3,927,154 0.33USD
9,162,610 0.76
BANBRA 5.375% 10-15.01.21 5,900,000 5,774,035 0.49USD
CAYMAN ISLANDS
HUTCH WHAM 4.75% 09-14.11.16 3,000,000 4,369,006 0.36EUR
HUTCH. WHAMP. 6.5% 03-13.02.13 144A 5,000,000 5,434,670 0.45USD
SEAG HDD 6.875% 10-01.05.20 1,500,000 1,501,496 0.12USD
TELEMOVIL 8% 10-01.10.17 1,800,000 1,869,001 0.15USD
18,948,208 1.57
EMPRESA NAC 5.25% 10-10.08.20 5,500,000 5,505,720 0.45USD
CHILE
5,505,720 0.45
SINOCHEM 6.3% 10-12.11.40REGS 1,200,000 1,182,484 0.10USD
CHINA
1,182,484 0.10
COLOMBIA 6.125% 09-18.01.41 500,000 512,100 0.04USD
COLOMBIA
COLOMBIA 8.125% 04-21.05.24 5,000,000 6,342,125 0.53USD
6,854,225 0.57
EL SALVADOR 8.25% 02-10.04.32 2,300,000 2,508,918 0.21USD
EL SALVADOR
2,508,918 0.21
ALFA BK 8.635% 07-22.02.17 3,200,000 3,312,003 0.27USD
FEDERATION OF RUSSIA
RUSSIA 5% 10-29.04.20 9,400,000 9,533,734 0.79USD
12,845,737 1.06
AXA SA 5.777% 06-PERP 4,000,000 5,140,147 0.42EUR
FRANCE
BFCM 4.471% 05-PERP. 2,500,000 3,097,691 0.26EUR
BPCE 6.117% 07-PERP EMTN 2,500,000 3,154,912 0.26EUR
CNP ASSURANCES 4.75% 06-PERP. 2,000,000 2,387,567 0.20EUR
Description Currency Evaluation % netassets
Face Value
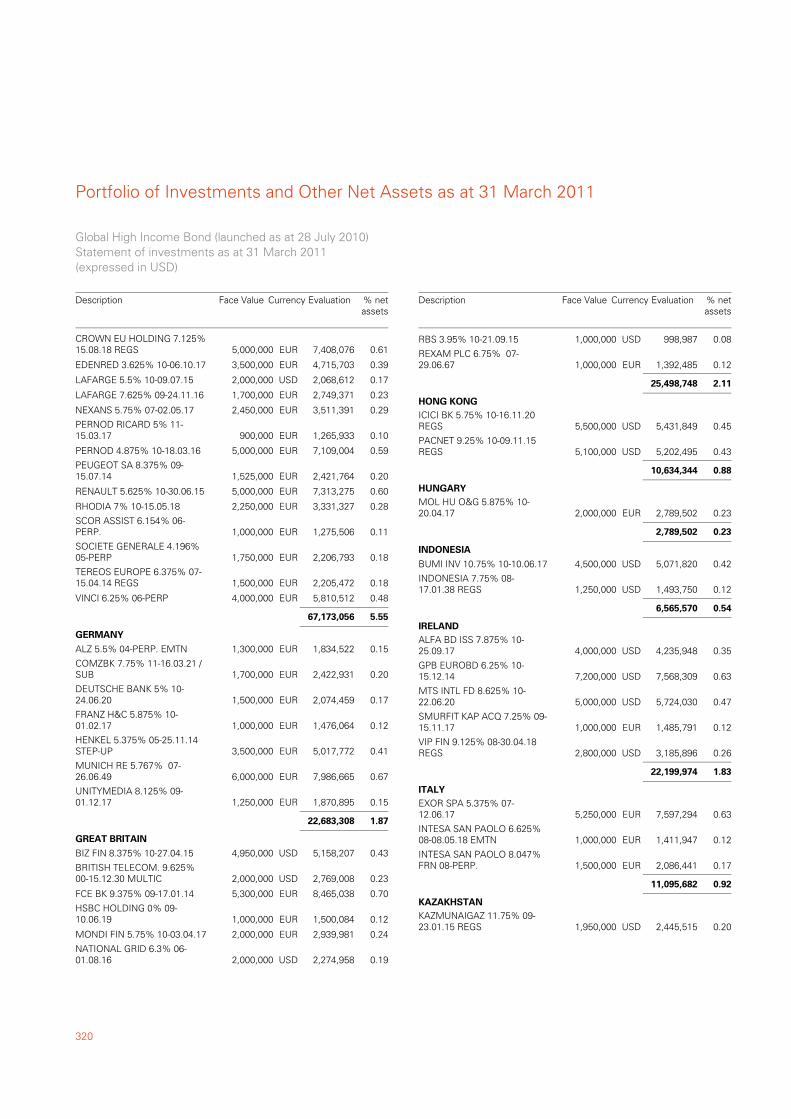
Portfolio of Investments and Other Net Assets as at 31 March 2011
320
CROWN EU HOLDING 7.125%15.08.18 REGS 5,000,000 7,408,076 0.61EUR
EDENRED 3.625% 10-06.10.17 3,500,000 4,715,703 0.39EUR
LAFARGE 5.5% 10-09.07.15 2,000,000 2,068,612 0.17USD
LAFARGE 7.625% 09-24.11.16 1,700,000 2,749,371 0.23EUR
NEXANS 5.75% 07-02.05.17 2,450,000 3,511,391 0.29EUR
PERNOD RICARD 5% 11-15.03.17 900,000 1,265,933 0.10EUR
PERNOD 4.875% 10-18.03.16 5,000,000 7,109,004 0.59EUR
PEUGEOT SA 8.375% 09-15.07.14 1,525,000 2,421,764 0.20EUR
RENAULT 5.625% 10-30.06.15 5,000,000 7,313,275 0.60EUR
RHODIA 7% 10-15.05.18 2,250,000 3,331,327 0.28EUR
SCOR ASSIST 6.154% 06-PERP. 1,000,000 1,275,506 0.11EUR
SOCIETE GENERALE 4.196%05-PERP 1,750,000 2,206,793 0.18EUR
TEREOS EUROPE 6.375% 07-15.04.14 REGS 1,500,000 2,205,472 0.18EUR
VINCI 6.25% 06-PERP 4,000,000 5,810,512 0.48EUR
67,173,056 5.55
ALZ 5.5% 04-PERP. EMTN 1,300,000 1,834,522 0.15EUR
GERMANY
COMZBK 7.75% 11-16.03.21 /SUB 1,700,000 2,422,931 0.20EUR
DEUTSCHE BANK 5% 10-24.06.20 1,500,000 2,074,459 0.17EUR
FRANZ H&C 5.875% 10-01.02.17 1,000,000 1,476,064 0.12EUR
HENKEL 5.375% 05-25.11.14STEP-UP 3,500,000 5,017,772 0.41EUR
MUNICH RE 5.767% 07-26.06.49 6,000,000 7,986,665 0.67EUR
UNITYMEDIA 8.125% 09-01.12.17 1,250,000 1,870,895 0.15EUR
22,683,308 1.87
BIZ FIN 8.375% 10-27.04.15 4,950,000 5,158,207 0.43USD
GREAT BRITAIN
BRITISH TELECOM. 9.625%00-15.12.30 MULTIC 2,000,000 2,769,008 0.23USD
FCE BK 9.375% 09-17.01.14 5,300,000 8,465,038 0.70EUR
HSBC HOLDING 0% 09-10.06.19 1,000,000 1,500,084 0.12EUR
MONDI FIN 5.75% 10-03.04.17 2,000,000 2,939,981 0.24EUR
NATIONAL GRID 6.3% 06-01.08.16 2,000,000 2,274,958 0.19USD
Global High Income Bond (launched as at 28 July 2010)Statement of investments as at 31 March 2011(expressed in USD)
Description Currency Evaluation % netassets
Face Value
RBS 3.95% 10-21.09.15 1,000,000 998,987 0.08USD
REXAM PLC 6.75% 07-29.06.67 1,000,000 1,392,485 0.12EUR
25,498,748 2.11
ICICI BK 5.75% 10-16.11.20REGS 5,500,000 5,431,849 0.45USD
HONG KONG
PACNET 9.25% 10-09.11.15REGS 5,100,000 5,202,495 0.43USD
10,634,344 0.88
MOL HU O&G 5.875% 10-20.04.17 2,000,000 2,789,502 0.23EUR
HUNGARY
2,789,502 0.23
BUMI INV 10.75% 10-10.06.17 4,500,000 5,071,820 0.42USD
INDONESIA
INDONESIA 7.75% 08-17.01.38 REGS 1,250,000 1,493,750 0.12USD
6,565,570 0.54
ALFA BD ISS 7.875% 10-25.09.17 4,000,000 4,235,948 0.35USD
IRELAND
GPB EUROBD 6.25% 10-15.12.14 7,200,000 7,568,309 0.63USD
MTS INTL FD 8.625% 10-22.06.20 5,000,000 5,724,030 0.47USD
SMURFIT KAP ACQ 7.25% 09-15.11.17 1,000,000 1,485,791 0.12EUR
VIP FIN 9.125% 08-30.04.18REGS 2,800,000 3,185,896 0.26USD
22,199,974 1.83
EXOR SPA 5.375% 07-12.06.17 5,250,000 7,597,294 0.63EUR
ITALY
INTESA SAN PAOLO 6.625%08-08.05.18 EMTN 1,000,000 1,411,947 0.12EUR
INTESA SAN PAOLO 8.047%FRN 08-PERP. 1,500,000 2,086,441 0.17EUR
11,095,682 0.92
KAZMUNAIGAZ 11.75% 09-23.01.15 REGS 1,950,000 2,445,515 0.20USD
KAZAKHSTAN
Description Currency Evaluation % netassets
Face Value
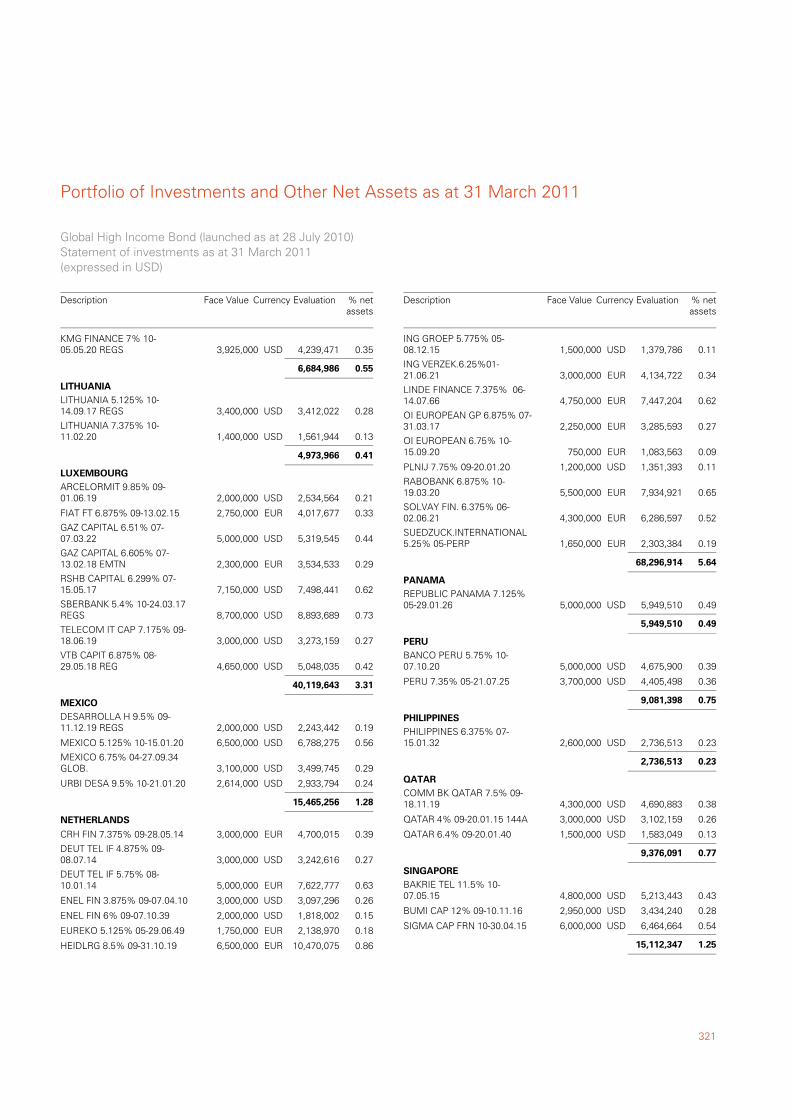
321
Portfolio of Investments and Other Net Assets as at 31 March 2011
KMG FINANCE 7% 10-05.05.20 REGS 3,925,000 4,239,471 0.35USD
6,684,986 0.55
LITHUANIA 5.125% 10-14.09.17 REGS 3,400,000 3,412,022 0.28USD
LITHUANIA
LITHUANIA 7.375% 10-11.02.20 1,400,000 1,561,944 0.13USD
4,973,966 0.41
ARCELORMIT 9.85% 09-01.06.19 2,000,000 2,534,564 0.21USD
LUXEMBOURG
FIAT FT 6.875% 09-13.02.15 2,750,000 4,017,677 0.33EUR
GAZ CAPITAL 6.51% 07-07.03.22 5,000,000 5,319,545 0.44USD
GAZ CAPITAL 6.605% 07-13.02.18 EMTN 2,300,000 3,534,533 0.29EUR
RSHB CAPITAL 6.299% 07-15.05.17 7,150,000 7,498,441 0.62USD
SBERBANK 5.4% 10-24.03.17REGS 8,700,000 8,893,689 0.73USD
TELECOM IT CAP 7.175% 09-18.06.19 3,000,000 3,273,159 0.27USD
VTB CAPIT 6.875% 08-29.05.18 REG 4,650,000 5,048,035 0.42USD
40,119,643 3.31
DESARROLLA H 9.5% 09-11.12.19 REGS 2,000,000 2,243,442 0.19USD
MEXICO
MEXICO 5.125% 10-15.01.20 6,500,000 6,788,275 0.56USD
MEXICO 6.75% 04-27.09.34GLOB. 3,100,000 3,499,745 0.29USD
URBI DESA 9.5% 10-21.01.20 2,614,000 2,933,794 0.24USD
15,465,256 1.28
CRH FIN 7.375% 09-28.05.14 3,000,000 4,700,015 0.39EUR
NETHERLANDS
DEUT TEL IF 4.875% 09-08.07.14 3,000,000 3,242,616 0.27USD
DEUT TEL IF 5.75% 08-10.01.14 5,000,000 7,622,777 0.63EUR
ENEL FIN 3.875% 09-07.04.10 3,000,000 3,097,296 0.26USD
ENEL FIN 6% 09-07.10.39 2,000,000 1,818,002 0.15USD
EUREKO 5.125% 05-29.06.49 1,750,000 2,138,970 0.18EUR
HEIDLRG 8.5% 09-31.10.19 6,500,000 10,470,075 0.86EUR
Global High Income Bond (launched as at 28 July 2010)Statement of investments as at 31 March 2011(expressed in USD)
Description Currency Evaluation % netassets
Face Value
ING GROEP 5.775% 05-08.12.15 1,500,000 1,379,786 0.11USD
ING VERZEK.6.25%01-21.06.21 3,000,000 4,134,722 0.34EUR
LINDE FINANCE 7.375% 06-14.07.66 4,750,000 7,447,204 0.62EUR
OI EUROPEAN GP 6.875% 07-31.03.17 2,250,000 3,285,593 0.27EUR
OI EUROPEAN 6.75% 10-15.09.20 750,000 1,083,563 0.09EUR
PLNIJ 7.75% 09-20.01.20 1,200,000 1,351,393 0.11USD
RABOBANK 6.875% 10-19.03.20 5,500,000 7,934,921 0.65EUR
SOLVAY FIN. 6.375% 06-02.06.21 4,300,000 6,286,597 0.52EUR
SUEDZUCK.INTERNATIONAL5.25% 05-PERP 1,650,000 2,303,384 0.19EUR
68,296,914 5.64
REPUBLIC PANAMA 7.125%05-29.01.26 5,000,000 5,949,510 0.49USD
PANAMA
5,949,510 0.49
BANCO PERU 5.75% 10-07.10.20 5,000,000 4,675,900 0.39USD
PERU
PERU 7.35% 05-21.07.25 3,700,000 4,405,498 0.36USD
9,081,398 0.75
PHILIPPINES 6.375% 07-15.01.32 2,600,000 2,736,513 0.23USD
PHILIPPINES
2,736,513 0.23
COMM BK QATAR 7.5% 09-18.11.19 4,300,000 4,690,883 0.38USD
QATAR
QATAR 4% 09-20.01.15 144A 3,000,000 3,102,159 0.26USD
QATAR 6.4% 09-20.01.40 1,500,000 1,583,049 0.13USD
9,376,091 0.77
BAKRIE TEL 11.5% 10-07.05.15 4,800,000 5,213,443 0.43USD
SINGAPORE
BUMI CAP 12% 09-10.11.16 2,950,000 3,434,240 0.28USD
SIGMA CAP FRN 10-30.04.15 6,000,000 6,464,664 0.54USD
15,112,347 1.25
Description Currency Evaluation % netassets
Face Value
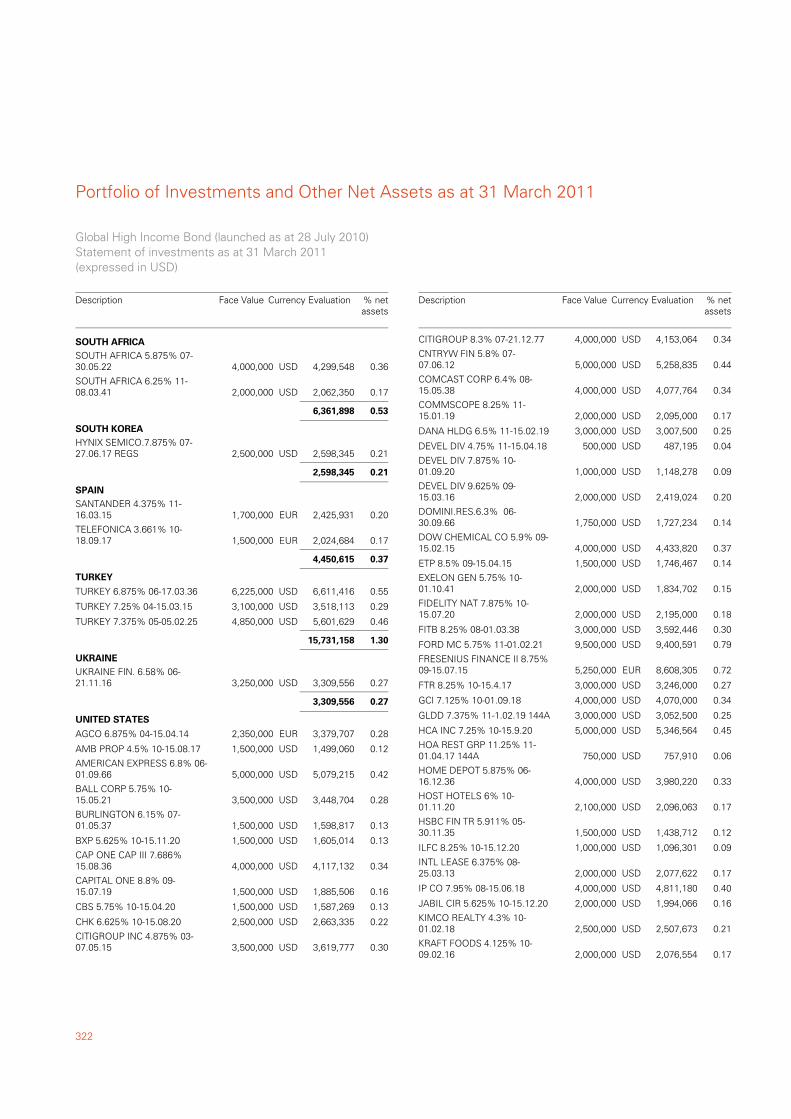
Portfolio of Investments and Other Net Assets as at 31 March 2011
322
SOUTH AFRICA 5.875% 07-30.05.22 4,000,000 4,299,548 0.36USD
SOUTH AFRICA
SOUTH AFRICA 6.25% 11-08.03.41 2,000,000 2,062,350 0.17USD
6,361,898 0.53
HYNIX SEMICO.7.875% 07-27.06.17 REGS 2,500,000 2,598,345 0.21USD
SOUTH KOREA
2,598,345 0.21
SANTANDER 4.375% 11-16.03.15 1,700,000 2,425,931 0.20EUR
SPAIN
TELEFONICA 3.661% 10-18.09.17 1,500,000 2,024,684 0.17EUR
4,450,615 0.37
TURKEY 6.875% 06-17.03.36 6,225,000 6,611,416 0.55USD
TURKEY
TURKEY 7.25% 04-15.03.15 3,100,000 3,518,113 0.29USD
TURKEY 7.375% 05-05.02.25 4,850,000 5,601,629 0.46USD
15,731,158 1.30
UKRAINE FIN. 6.58% 06-21.11.16 3,250,000 3,309,556 0.27USD
UKRAINE
3,309,556 0.27
AGCO 6.875% 04-15.04.14 2,350,000 3,379,707 0.28EUR
UNITED STATES
AMB PROP 4.5% 10-15.08.17 1,500,000 1,499,060 0.12USD
AMERICAN EXPRESS 6.8% 06-01.09.66 5,000,000 5,079,215 0.42USD
BALL CORP 5.75% 10-15.05.21 3,500,000 3,448,704 0.28USD
BURLINGTON 6.15% 07-01.05.37 1,500,000 1,598,817 0.13USD
BXP 5.625% 10-15.11.20 1,500,000 1,605,014 0.13USD
CAP ONE CAP III 7.686%15.08.36 4,000,000 4,117,132 0.34USD
CAPITAL ONE 8.8% 09-15.07.19 1,500,000 1,885,506 0.16USD
CBS 5.75% 10-15.04.20 1,500,000 1,587,269 0.13USD
CHK 6.625% 10-15.08.20 2,500,000 2,663,335 0.22USD
CITIGROUP INC 4.875% 03-07.05.15 3,500,000 3,619,777 0.30USD
Global High Income Bond (launched as at 28 July 2010)Statement of investments as at 31 March 2011(expressed in USD)
Description Currency Evaluation % netassets
Face Value
CITIGROUP 8.3% 07-21.12.77 4,000,000 4,153,064 0.34USD
CNTRYW FIN 5.8% 07-07.06.12 5,000,000 5,258,835 0.44USD
COMCAST CORP 6.4% 08-15.05.38 4,000,000 4,077,764 0.34USD
COMMSCOPE 8.25% 11-15.01.19 2,000,000 2,095,000 0.17USD
DANA HLDG 6.5% 11-15.02.19 3,000,000 3,007,500 0.25USD
DEVEL DIV 4.75% 11-15.04.18 500,000 487,195 0.04USD
DEVEL DIV 7.875% 10-01.09.20 1,000,000 1,148,278 0.09USD
DEVEL DIV 9.625% 09-15.03.16 2,000,000 2,419,024 0.20USD
DOMINI.RES.6.3% 06-30.09.66 1,750,000 1,727,234 0.14USD
DOW CHEMICAL CO 5.9% 09-15.02.15 4,000,000 4,433,820 0.37USD
ETP 8.5% 09-15.04.15 1,500,000 1,746,467 0.14USD
EXELON GEN 5.75% 10-01.10.41 2,000,000 1,834,702 0.15USD
FIDELITY NAT 7.875% 10-15.07.20 2,000,000 2,195,000 0.18USD
FITB 8.25% 08-01.03.38 3,000,000 3,592,446 0.30USD
FORD MC 5.75% 11-01.02.21 9,500,000 9,400,591 0.79USD
FRESENIUS FINANCE II 8.75%09-15.07.15 5,250,000 8,608,305 0.72EUR
FTR 8.25% 10-15.4.17 3,000,000 3,246,000 0.27USD
GCI 7.125% 10-01.09.18 4,000,000 4,070,000 0.34USD
GLDD 7.375% 11-1.02.19 144A 3,000,000 3,052,500 0.25USD
HCA INC 7.25% 10-15.9.20 5,000,000 5,346,564 0.45USD
HOA REST GRP 11.25% 11-01.04.17 144A 750,000 757,910 0.06USD
HOME DEPOT 5.875% 06-16.12.36 4,000,000 3,980,220 0.33USD
HOST HOTELS 6% 10-01.11.20 2,100,000 2,096,063 0.17USD
HSBC FIN TR 5.911% 05-30.11.35 1,500,000 1,438,712 0.12USD
ILFC 8.25% 10-15.12.20 1,000,000 1,096,301 0.09USD
INTL LEASE 6.375% 08-25.03.13 2,000,000 2,077,622 0.17USD
IP CO 7.95% 08-15.06.18 4,000,000 4,811,180 0.40USD
JABIL CIR 5.625% 10-15.12.20 2,000,000 1,994,066 0.16USD
KIMCO REALTY 4.3% 10-01.02.18 2,500,000 2,507,673 0.21USD
KRAFT FOODS 4.125% 10-09.02.16 2,000,000 2,076,554 0.17USD
Description Currency Evaluation % netassets
Face Value
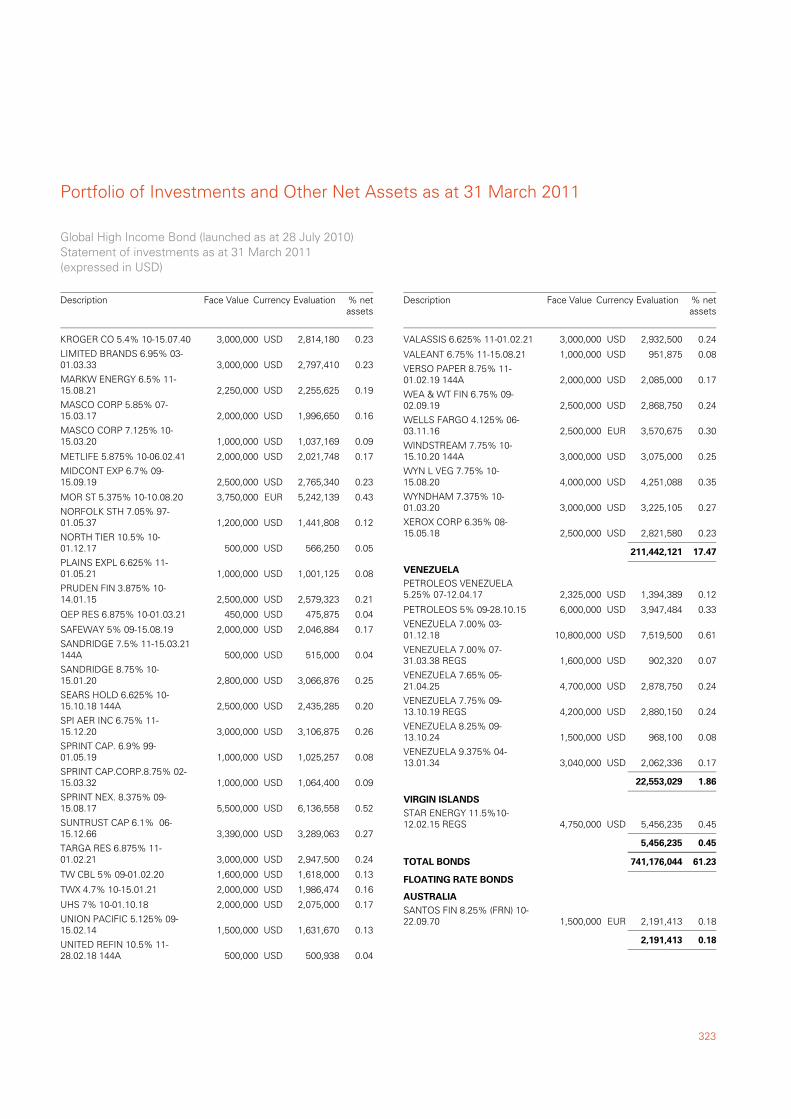
323
Portfolio of Investments and Other Net Assets as at 31 March 2011
KROGER CO 5.4% 10-15.07.40 3,000,000 2,814,180 0.23USD
LIMITED BRANDS 6.95% 03-01.03.33 3,000,000 2,797,410 0.23USD
MARKW ENERGY 6.5% 11-15.08.21 2,250,000 2,255,625 0.19USD
MASCO CORP 5.85% 07-15.03.17 2,000,000 1,996,650 0.16USD
MASCO CORP 7.125% 10-15.03.20 1,000,000 1,037,169 0.09USD
METLIFE 5.875% 10-06.02.41 2,000,000 2,021,748 0.17USD
MIDCONT EXP 6.7% 09-15.09.19 2,500,000 2,765,340 0.23USD
MOR ST 5.375% 10-10.08.20 3,750,000 5,242,139 0.43EUR
NORFOLK STH 7.05% 97-01.05.37 1,200,000 1,441,808 0.12USD
NORTH TIER 10.5% 10-01.12.17 500,000 566,250 0.05USD
PLAINS EXPL 6.625% 11-01.05.21 1,000,000 1,001,125 0.08USD
PRUDEN FIN 3.875% 10-14.01.15 2,500,000 2,579,323 0.21USD
QEP RES 6.875% 10-01.03.21 450,000 475,875 0.04USD
SAFEWAY 5% 09-15.08.19 2,000,000 2,046,884 0.17USD
SANDRIDGE 7.5% 11-15.03.21144A 500,000 515,000 0.04USD
SANDRIDGE 8.75% 10-15.01.20 2,800,000 3,066,876 0.25USD
SEARS HOLD 6.625% 10-15.10.18 144A 2,500,000 2,435,285 0.20USD
SPI AER INC 6.75% 11-15.12.20 3,000,000 3,106,875 0.26USD
SPRINT CAP. 6.9% 99-01.05.19 1,000,000 1,025,257 0.08USD
SPRINT CAP.CORP.8.75% 02-15.03.32 1,000,000 1,064,400 0.09USD
SPRINT NEX. 8.375% 09-15.08.17 5,500,000 6,136,558 0.52USD
SUNTRUST CAP 6.1% 06-15.12.66 3,390,000 3,289,063 0.27USD
TARGA RES 6.875% 11-01.02.21 3,000,000 2,947,500 0.24USD
TW CBL 5% 09-01.02.20 1,600,000 1,618,000 0.13USD
TWX 4.7% 10-15.01.21 2,000,000 1,986,474 0.16USD
UHS 7% 10-01.10.18 2,000,000 2,075,000 0.17USD
UNION PACIFIC 5.125% 09-15.02.14 1,500,000 1,631,670 0.13USD
UNITED REFIN 10.5% 11-28.02.18 144A 500,000 500,938 0.04USD
Global High Income Bond (launched as at 28 July 2010)Statement of investments as at 31 March 2011(expressed in USD)
Description Currency Evaluation % netassets
Face Value
VALASSIS 6.625% 11-01.02.21 3,000,000 2,932,500 0.24USD
VALEANT 6.75% 11-15.08.21 1,000,000 951,875 0.08USD
VERSO PAPER 8.75% 11-01.02.19 144A 2,000,000 2,085,000 0.17USD
WEA & WT FIN 6.75% 09-02.09.19 2,500,000 2,868,750 0.24USD
WELLS FARGO 4.125% 06-03.11.16 2,500,000 3,570,675 0.30EUR
WINDSTREAM 7.75% 10-15.10.20 144A 3,000,000 3,075,000 0.25USD
WYN L VEG 7.75% 10-15.08.20 4,000,000 4,251,088 0.35USD
WYNDHAM 7.375% 10-01.03.20 3,000,000 3,225,105 0.27USD
XEROX CORP 6.35% 08-15.05.18 2,500,000 2,821,580 0.23USD
211,442,121 17.47
PETROLEOS VENEZUELA5.25% 07-12.04.17 2,325,000 1,394,389 0.12USD
VENEZUELA
PETROLEOS 5% 09-28.10.15 6,000,000 3,947,484 0.33USD
VENEZUELA 7.00% 03-01.12.18 10,800,000 7,519,500 0.61USD
VENEZUELA 7.00% 07-31.03.38 REGS 1,600,000 902,320 0.07USD
VENEZUELA 7.65% 05-21.04.25 4,700,000 2,878,750 0.24USD
VENEZUELA 7.75% 09-13.10.19 REGS 4,200,000 2,880,150 0.24USD
VENEZUELA 8.25% 09-13.10.24 1,500,000 968,100 0.08USD
VENEZUELA 9.375% 04-13.01.34 3,040,000 2,062,336 0.17USD
22,553,029 1.86
STAR ENERGY 11.5%10-12.02.15 REGS 4,750,000 5,456,235 0.45USD
VIRGIN ISLANDS
5,456,235 0.45
61.23741,176,044TOTAL BONDS
SANTOS FIN 8.25% (FRN) 10-22.09.70 1,500,000 2,191,413 0.18EUR
FLOATING RATE BONDS
AUSTRALIA
2,191,413 0.18
Description Currency Evaluation % netassets
Face Value
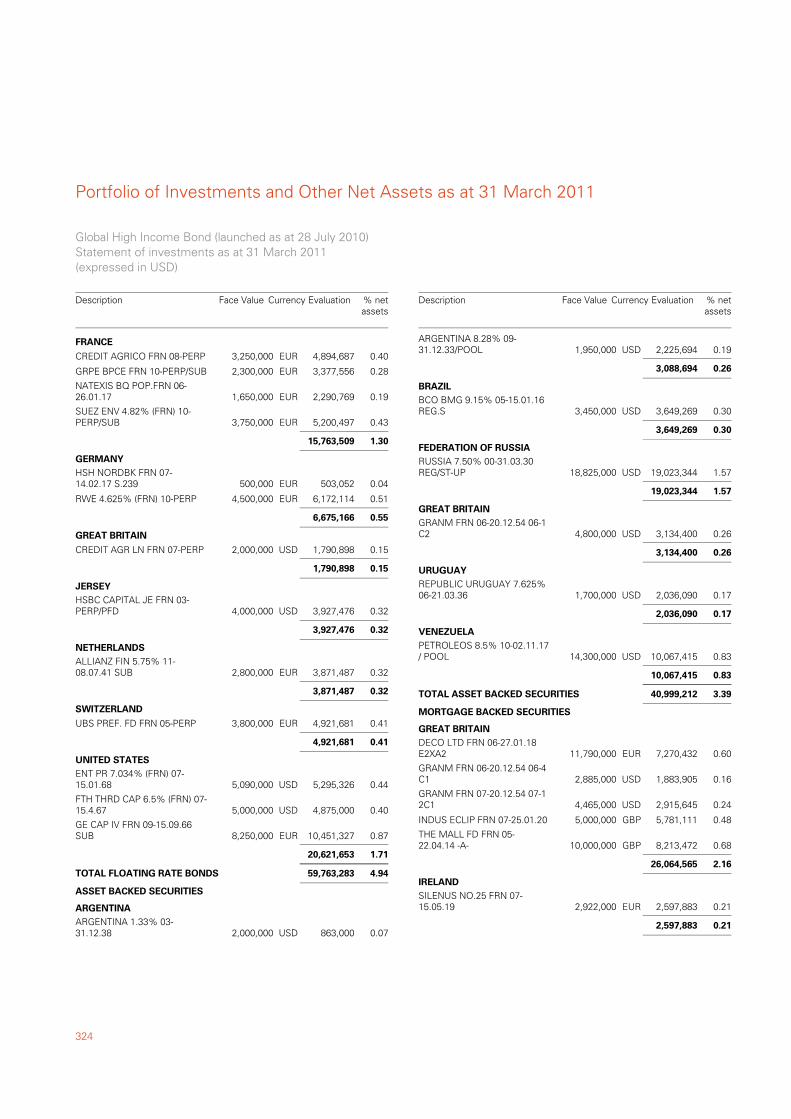
Portfolio of Investments and Other Net Assets as at 31 March 2011
324
CREDIT AGRICO FRN 08-PERP 3,250,000 4,894,687 0.40EUR
FRANCE
GRPE BPCE FRN 10-PERP/SUB 2,300,000 3,377,556 0.28EUR
NATEXIS BQ POP.FRN 06-26.01.17 1,650,000 2,290,769 0.19EUR
SUEZ ENV 4.82% (FRN) 10-PERP/SUB 3,750,000 5,200,497 0.43EUR
15,763,509 1.30
HSH NORDBK FRN 07-14.02.17 S.239 500,000 503,052 0.04EUR
GERMANY
RWE 4.625% (FRN) 10-PERP 4,500,000 6,172,114 0.51EUR
6,675,166 0.55
CREDIT AGR LN FRN 07-PERP 2,000,000 1,790,898 0.15USD
GREAT BRITAIN
1,790,898 0.15
HSBC CAPITAL JE FRN 03-PERP/PFD 4,000,000 3,927,476 0.32USD
JERSEY
3,927,476 0.32
ALLIANZ FIN 5.75% 11-08.07.41 SUB 2,800,000 3,871,487 0.32EUR
NETHERLANDS
3,871,487 0.32
UBS PREF. FD FRN 05-PERP 3,800,000 4,921,681 0.41EUR
SWITZERLAND
4,921,681 0.41
ENT PR 7.034% (FRN) 07-15.01.68 5,090,000 5,295,326 0.44USD
UNITED STATES
FTH THRD CAP 6.5% (FRN) 07-15.4.67 5,000,000 4,875,000 0.40USD
GE CAP IV FRN 09-15.09.66SUB 8,250,000 10,451,327 0.87EUR
20,621,653 1.71
4.9459,763,283TOTAL FLOATING RATE BONDS
ARGENTINA 1.33% 03-31.12.38 2,000,000 863,000 0.07USD
ASSET BACKED SECURITIES
ARGENTINA
Global High Income Bond (launched as at 28 July 2010)Statement of investments as at 31 March 2011(expressed in USD)
Description Currency Evaluation % netassets
Face Value
ARGENTINA 8.28% 09-31.12.33/POOL 1,950,000 2,225,694 0.19USD
3,088,694 0.26
BCO BMG 9.15% 05-15.01.16REG.S 3,450,000 3,649,269 0.30USD
BRAZIL
3,649,269 0.30
RUSSIA 7.50% 00-31.03.30REG/ST-UP 18,825,000 19,023,344 1.57USD
FEDERATION OF RUSSIA
19,023,344 1.57
GRANM FRN 06-20.12.54 06-1C2 4,800,000 3,134,400 0.26USD
GREAT BRITAIN
3,134,400 0.26
REPUBLIC URUGUAY 7.625%06-21.03.36 1,700,000 2,036,090 0.17USD
URUGUAY
2,036,090 0.17
PETROLEOS 8.5% 10-02.11.17/ POOL 14,300,000 10,067,415 0.83USD
VENEZUELA
10,067,415 0.83
3.3940,999,212TOTAL ASSET BACKED SECURITIES
DECO LTD FRN 06-27.01.18E2XA2 11,790,000 7,270,432 0.60EUR
MORTGAGE BACKED SECURITIES
GREAT BRITAIN
GRANM FRN 06-20.12.54 06-4C1 2,885,000 1,883,905 0.16USD
GRANM FRN 07-20.12.54 07-12C1 4,465,000 2,915,645 0.24USD
INDUS ECLIP FRN 07-25.01.20 5,000,000 5,781,111 0.48GBP
THE MALL FD FRN 05-22.04.14 -A- 10,000,000 8,213,472 0.68GBP
26,064,565 2.16
SILENUS NO.25 FRN 07-15.05.19 2,922,000 2,597,883 0.21EUR
IRELAND
2,597,883 0.21
Description Currency Evaluation % netassets
Face Value
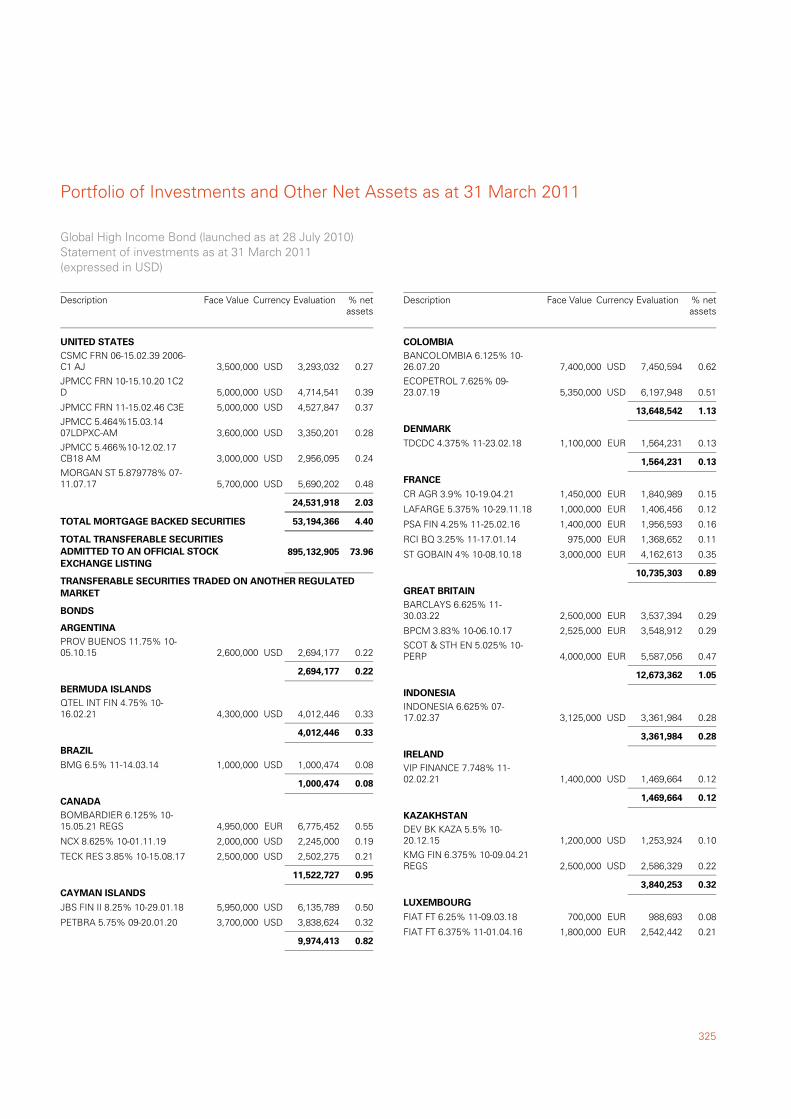
325
Portfolio of Investments and Other Net Assets as at 31 March 2011
CSMC FRN 06-15.02.39 2006-C1 AJ 3,500,000 3,293,032 0.27USD
UNITED STATES
JPMCC FRN 10-15.10.20 1C2D 5,000,000 4,714,541 0.39USD
JPMCC FRN 11-15.02.46 C3E 5,000,000 4,527,847 0.37USD
JPMCC 5.464%15.03.1407LDPXC-AM 3,600,000 3,350,201 0.28USD
JPMCC 5.466%10-12.02.17CB18 AM 3,000,000 2,956,095 0.24USD
MORGAN ST 5.879778% 07-11.07.17 5,700,000 5,690,202 0.48USD
24,531,918 2.03
4.4053,194,366TOTAL MORTGAGE BACKED SECURITIES
73.96TOTAL TRANSFERABLE SECURITIESADMITTED TO AN OFFICIAL STOCKEXCHANGE LISTING
895,132,905
PROV BUENOS 11.75% 10-05.10.15 2,600,000 2,694,177 0.22USD
TRANSFERABLE SECURITIES TRADED ON ANOTHER REGULATEDMARKET
BONDS
ARGENTINA
2,694,177 0.22
QTEL INT FIN 4.75% 10-16.02.21 4,300,000 4,012,446 0.33USD
BERMUDA ISLANDS
4,012,446 0.33
BMG 6.5% 11-14.03.14 1,000,000 1,000,474 0.08USD
BRAZIL
1,000,474 0.08
BOMBARDIER 6.125% 10-15.05.21 REGS 4,950,000 6,775,452 0.55EUR
CANADA
NCX 8.625% 10-01.11.19 2,000,000 2,245,000 0.19USD
TECK RES 3.85% 10-15.08.17 2,500,000 2,502,275 0.21USD
11,522,727 0.95
JBS FIN II 8.25% 10-29.01.18 5,950,000 6,135,789 0.50USD
CAYMAN ISLANDS
PETBRA 5.75% 09-20.01.20 3,700,000 3,838,624 0.32USD
9,974,413 0.82
Global High Income Bond (launched as at 28 July 2010)Statement of investments as at 31 March 2011(expressed in USD)
Description Currency Evaluation % netassets
Face Value
BANCOLOMBIA 6.125% 10-26.07.20 7,400,000 7,450,594 0.62USD
COLOMBIA
ECOPETROL 7.625% 09-23.07.19 5,350,000 6,197,948 0.51USD
13,648,542 1.13
TDCDC 4.375% 11-23.02.18 1,100,000 1,564,231 0.13EUR
DENMARK
1,564,231 0.13
CR AGR 3.9% 10-19.04.21 1,450,000 1,840,989 0.15EUR
FRANCE
LAFARGE 5.375% 10-29.11.18 1,000,000 1,406,456 0.12EUR
PSA FIN 4.25% 11-25.02.16 1,400,000 1,956,593 0.16EUR
RCI BQ 3.25% 11-17.01.14 975,000 1,368,652 0.11EUR
ST GOBAIN 4% 10-08.10.18 3,000,000 4,162,613 0.35EUR
10,735,303 0.89
BARCLAYS 6.625% 11-30.03.22 2,500,000 3,537,394 0.29EUR
GREAT BRITAIN
BPCM 3.83% 10-06.10.17 2,525,000 3,548,912 0.29EUR
SCOT & STH EN 5.025% 10-PERP 4,000,000 5,587,056 0.47EUR
12,673,362 1.05
INDONESIA 6.625% 07-17.02.37 3,125,000 3,361,984 0.28USD
INDONESIA
3,361,984 0.28
VIP FINANCE 7.748% 11-02.02.21 1,400,000 1,469,664 0.12USD
IRELAND
1,469,664 0.12
DEV BK KAZA 5.5% 10-20.12.15 1,200,000 1,253,924 0.10USD
KAZAKHSTAN
KMG FIN 6.375% 10-09.04.21REGS 2,500,000 2,586,329 0.22USD
3,840,253 0.32
FIAT FT 6.25% 11-09.03.18 700,000 988,693 0.08EUR
LUXEMBOURG
FIAT FT 6.375% 11-01.04.16 1,800,000 2,542,442 0.21EUR
Description Currency Evaluation % netassets
Face Value
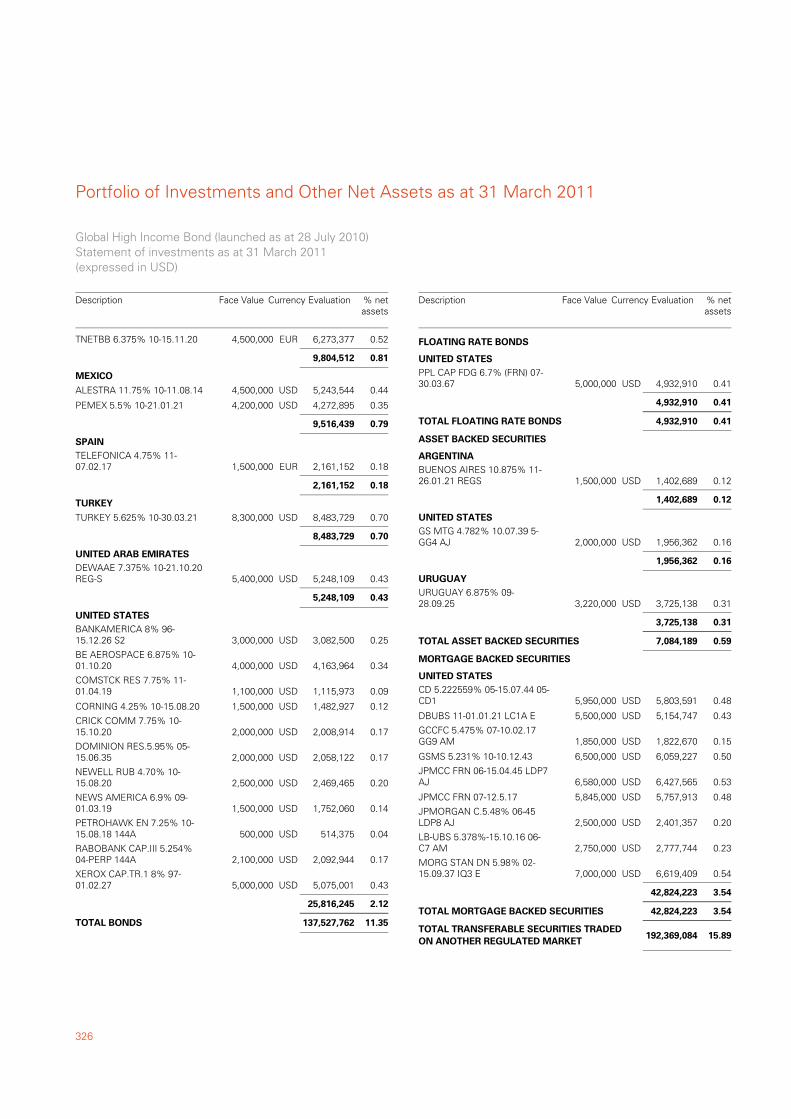
Portfolio of Investments and Other Net Assets as at 31 March 2011
326
TNETBB 6.375% 10-15.11.20 4,500,000 6,273,377 0.52EUR
9,804,512 0.81
ALESTRA 11.75% 10-11.08.14 4,500,000 5,243,544 0.44USD
MEXICO
PEMEX 5.5% 10-21.01.21 4,200,000 4,272,895 0.35USD
9,516,439 0.79
TELEFONICA 4.75% 11-07.02.17 1,500,000 2,161,152 0.18EUR
SPAIN
2,161,152 0.18
TURKEY 5.625% 10-30.03.21 8,300,000 8,483,729 0.70USD
TURKEY
8,483,729 0.70
DEWAAE 7.375% 10-21.10.20REG-S 5,400,000 5,248,109 0.43USD
UNITED ARAB EMIRATES
5,248,109 0.43
BANKAMERICA 8% 96-15.12.26 S2 3,000,000 3,082,500 0.25USD
UNITED STATES
BE AEROSPACE 6.875% 10-01.10.20 4,000,000 4,163,964 0.34USD
COMSTCK RES 7.75% 11-01.04.19 1,100,000 1,115,973 0.09USD
CORNING 4.25% 10-15.08.20 1,500,000 1,482,927 0.12USD
CRICK COMM 7.75% 10-15.10.20 2,000,000 2,008,914 0.17USD
DOMINION RES.5.95% 05-15.06.35 2,000,000 2,058,122 0.17USD
NEWELL RUB 4.70% 10-15.08.20 2,500,000 2,469,465 0.20USD
NEWS AMERICA 6.9% 09-01.03.19 1,500,000 1,752,060 0.14USD
PETROHAWK EN 7.25% 10-15.08.18 144A 500,000 514,375 0.04USD
RABOBANK CAP.III 5.254%04-PERP 144A 2,100,000 2,092,944 0.17USD
XEROX CAP.TR.1 8% 97-01.02.27 5,000,000 5,075,001 0.43USD
25,816,245 2.12
11.35137,527,762TOTAL BONDS
Global High Income Bond (launched as at 28 July 2010)Statement of investments as at 31 March 2011(expressed in USD)
Description Currency Evaluation % netassets
Face Value
PPL CAP FDG 6.7% (FRN) 07-30.03.67 5,000,000 4,932,910 0.41USD
FLOATING RATE BONDS
UNITED STATES
4,932,910 0.41
0.414,932,910TOTAL FLOATING RATE BONDS
BUENOS AIRES 10.875% 11-26.01.21 REGS 1,500,000 1,402,689 0.12USD
ASSET BACKED SECURITIES
ARGENTINA
1,402,689 0.12
GS MTG 4.782% 10.07.39 5-GG4 AJ 2,000,000 1,956,362 0.16USD
UNITED STATES
1,956,362 0.16
URUGUAY 6.875% 09-28.09.25 3,220,000 3,725,138 0.31USD
URUGUAY
3,725,138 0.31
0.597,084,189TOTAL ASSET BACKED SECURITIES
CD 5.222559% 05-15.07.44 05-CD1 5,950,000 5,803,591 0.48USD
MORTGAGE BACKED SECURITIES
UNITED STATES
DBUBS 11-01.01.21 LC1A E 5,500,000 5,154,747 0.43USD
GCCFC 5.475% 07-10.02.17GG9 AM 1,850,000 1,822,670 0.15USD
GSMS 5.231% 10-10.12.43 6,500,000 6,059,227 0.50USD
JPMCC FRN 06-15.04.45 LDP7AJ 6,580,000 6,427,565 0.53USD
JPMCC FRN 07-12.5.17 5,845,000 5,757,913 0.48USD
JPMORGAN C.5.48% 06-45LDP8 AJ 2,500,000 2,401,357 0.20USD
LB-UBS 5.378%-15.10.16 06-C7 AM 2,750,000 2,777,744 0.23USD
MORG STAN DN 5.98% 02-15.09.37 IQ3 E 7,000,000 6,619,409 0.54USD
42,824,223 3.54
3.5442,824,223TOTAL MORTGAGE BACKED SECURITIES
15.89TOTAL TRANSFERABLE SECURITIES TRADEDON ANOTHER REGULATED MARKET
192,369,084
Description Currency Evaluation % netassets
Face Value
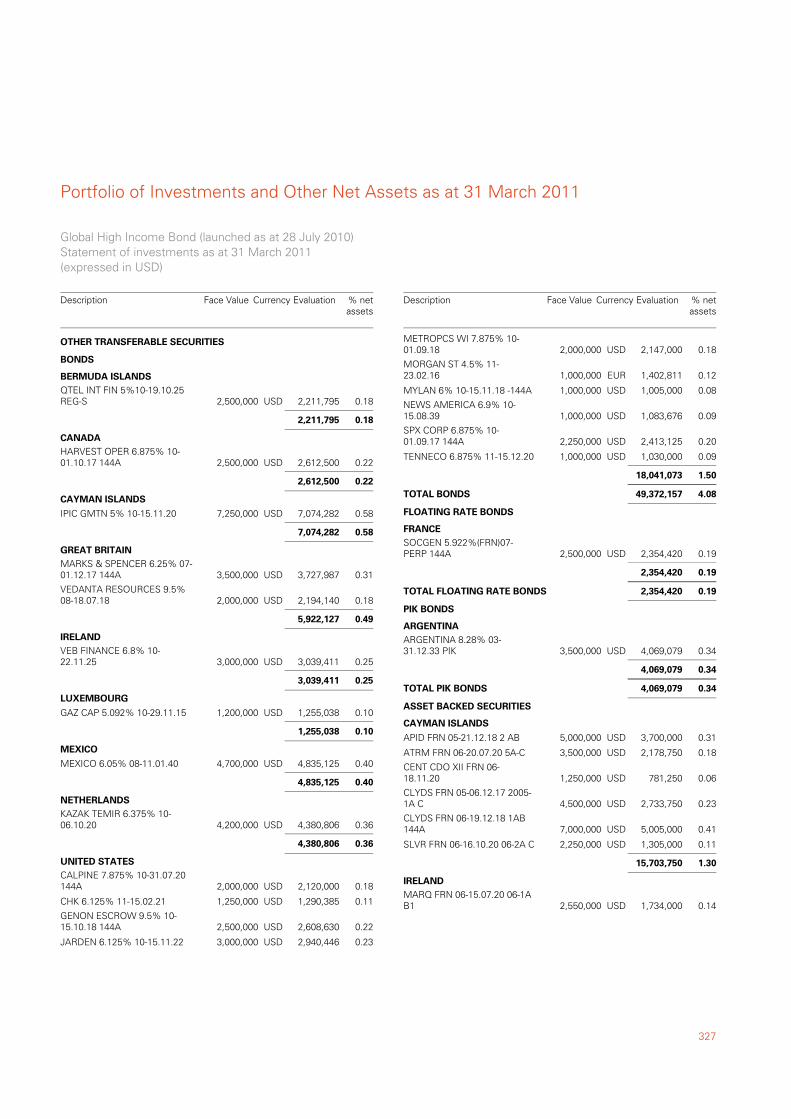
327
Portfolio of Investments and Other Net Assets as at 31 March 2011
QTEL INT FIN 5%10-19.10.25REG-S 2,500,000 2,211,795 0.18USD
OTHER TRANSFERABLE SECURITIES
BONDS
BERMUDA ISLANDS
2,211,795 0.18
HARVEST OPER 6.875% 10-01.10.17 144A 2,500,000 2,612,500 0.22USD
CANADA
2,612,500 0.22
IPIC GMTN 5% 10-15.11.20 7,250,000 7,074,282 0.58USD
CAYMAN ISLANDS
7,074,282 0.58
MARKS & SPENCER 6.25% 07-01.12.17 144A 3,500,000 3,727,987 0.31USD
GREAT BRITAIN
VEDANTA RESOURCES 9.5%08-18.07.18 2,000,000 2,194,140 0.18USD
5,922,127 0.49
VEB FINANCE 6.8% 10-22.11.25 3,000,000 3,039,411 0.25USD
IRELAND
3,039,411 0.25
GAZ CAP 5.092% 10-29.11.15 1,200,000 1,255,038 0.10USD
LUXEMBOURG
1,255,038 0.10
MEXICO 6.05% 08-11.01.40 4,700,000 4,835,125 0.40USD
MEXICO
4,835,125 0.40
KAZAK TEMIR 6.375% 10-06.10.20 4,200,000 4,380,806 0.36USD
NETHERLANDS
4,380,806 0.36
CALPINE 7.875% 10-31.07.20144A 2,000,000 2,120,000 0.18USD
UNITED STATES
CHK 6.125% 11-15.02.21 1,250,000 1,290,385 0.11USD
GENON ESCROW 9.5% 10-15.10.18 144A 2,500,000 2,608,630 0.22USD
JARDEN 6.125% 10-15.11.22 3,000,000 2,940,446 0.23USD
Global High Income Bond (launched as at 28 July 2010)Statement of investments as at 31 March 2011(expressed in USD)
Description Currency Evaluation % netassets
Face Value
METROPCS WI 7.875% 10-01.09.18 2,000,000 2,147,000 0.18USD
MORGAN ST 4.5% 11-23.02.16 1,000,000 1,402,811 0.12EUR
MYLAN 6% 10-15.11.18 -144A 1,000,000 1,005,000 0.08USD
NEWS AMERICA 6.9% 10-15.08.39 1,000,000 1,083,676 0.09USD
SPX CORP 6.875% 10-01.09.17 144A 2,250,000 2,413,125 0.20USD
TENNECO 6.875% 11-15.12.20 1,000,000 1,030,000 0.09USD
18,041,073 1.50
4.0849,372,157TOTAL BONDS
SOCGEN 5.922%(FRN)07-PERP 144A 2,500,000 2,354,420 0.19USD
FLOATING RATE BONDS
FRANCE
2,354,420 0.19
0.192,354,420TOTAL FLOATING RATE BONDS
ARGENTINA 8.28% 03-31.12.33 PIK 3,500,000 4,069,079 0.34USD
PIK BONDS
ARGENTINA
4,069,079 0.34
0.344,069,079TOTAL PIK BONDS
APID FRN 05-21.12.18 2 AB 5,000,000 3,700,000 0.31USD
ASSET BACKED SECURITIES
CAYMAN ISLANDS
ATRM FRN 06-20.07.20 5A-C 3,500,000 2,178,750 0.18USD
CENT CDO XII FRN 06-18.11.20 1,250,000 781,250 0.06USD
CLYDS FRN 05-06.12.17 2005-1A C 4,500,000 2,733,750 0.23USD
CLYDS FRN 06-19.12.18 1AB144A 7,000,000 5,005,000 0.41USD
SLVR FRN 06-16.10.20 06-2A C 2,250,000 1,305,000 0.11USD
15,703,750 1.30
MARQ FRN 06-15.07.20 06-1AB1 2,550,000 1,734,000 0.14USD
IRELAND
Description Currency Evaluation % netassets
Face Value
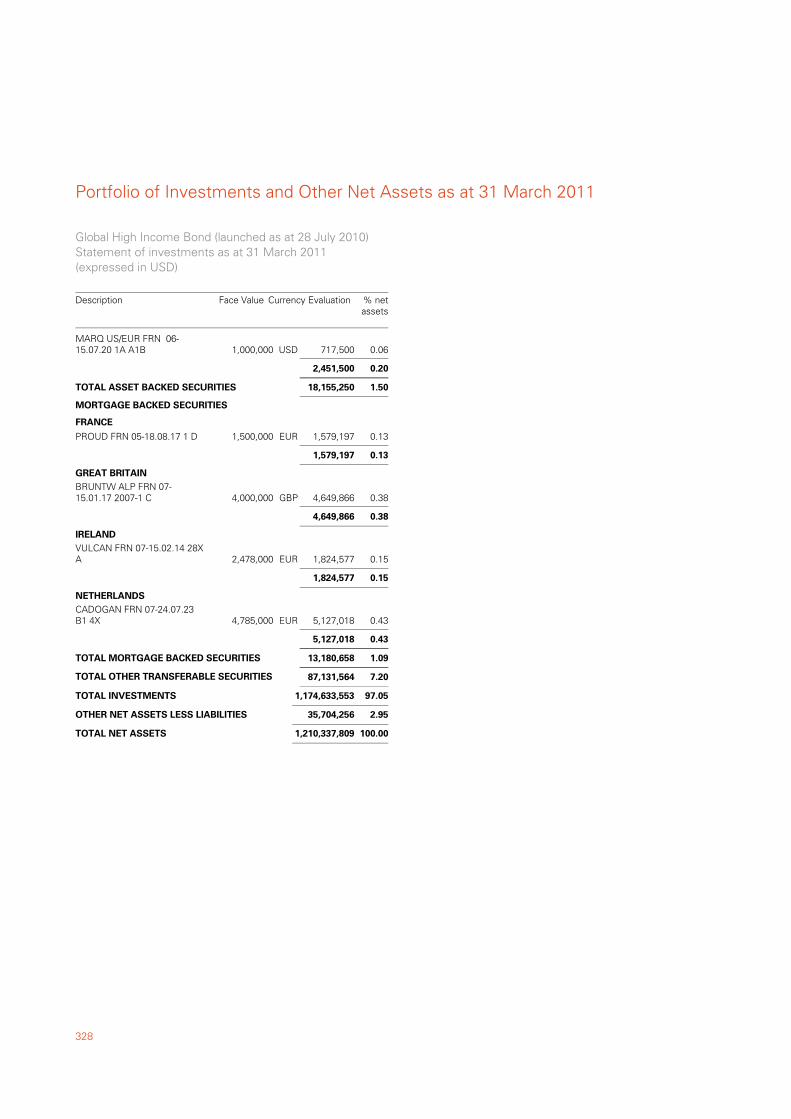
Portfolio of Investments and Other Net Assets as at 31 March 2011
328
MARQ US/EUR FRN 06-15.07.20 1A A1B 1,000,000 717,500 0.06USD
2,451,500 0.20
1.5018,155,250TOTAL ASSET BACKED SECURITIES
PROUD FRN 05-18.08.17 1 D 1,500,000 1,579,197 0.13EUR
MORTGAGE BACKED SECURITIES
FRANCE
1,579,197 0.13
BRUNTW ALP FRN 07-15.01.17 2007-1 C 4,000,000 4,649,866 0.38GBP
GREAT BRITAIN
4,649,866 0.38
VULCAN FRN 07-15.02.14 28XA 2,478,000 1,824,577 0.15EUR
IRELAND
1,824,577 0.15
CADOGAN FRN 07-24.07.23B1 4X 4,785,000 5,127,018 0.43EUR
NETHERLANDS
5,127,018 0.43
1.0913,180,658TOTAL MORTGAGE BACKED SECURITIES
7.20TOTAL OTHER TRANSFERABLE SECURITIES 87,131,564
97.05TOTAL INVESTMENTS 1,174,633,553
2.95OTHER NET ASSETS LESS LIABILITIES 35,704,256
100.00TOTAL NET ASSETS 1,210,337,809
Global High Income Bond (launched as at 28 July 2010)Statement of investments as at 31 March 2011(expressed in USD)
Description Currency Evaluation % netassets
Face Value
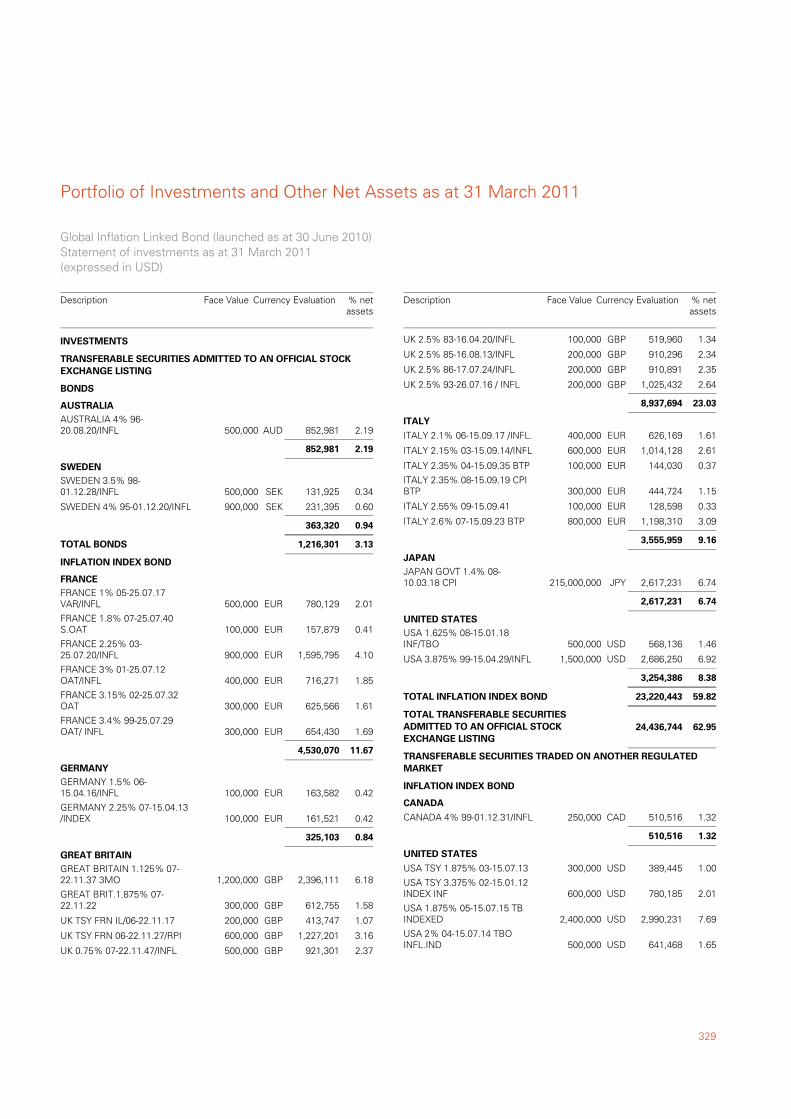
329
Portfolio of Investments and Other Net Assets as at 31 March 2011
AUSTRALIA 4% 96-20.08.20/INFL 500,000 852,981 2.19AUD
TRANSFERABLE SECURITIES ADMITTED TO AN OFFICIAL STOCKEXCHANGE LISTING
BONDS
AUSTRALIA
852,981 2.19
SWEDEN 3.5% 98-01.12.28/INFL 500,000 131,925 0.34SEK
SWEDEN
SWEDEN 4% 95-01.12.20/INFL 900,000 231,395 0.60SEK
363,320 0.94
3.131,216,301TOTAL BONDS
FRANCE 1% 05-25.07.17VAR/INFL 500,000 780,129 2.01EUR
INFLATION INDEX BOND
FRANCE
FRANCE 1.8% 07-25.07.40S.OAT 100,000 157,879 0.41EUR
FRANCE 2.25% 03-25.07.20/INFL 900,000 1,595,795 4.10EUR
FRANCE 3% 01-25.07.12OAT/INFL 400,000 716,271 1.85EUR
FRANCE 3.15% 02-25.07.32OAT 300,000 625,566 1.61EUR
FRANCE 3.4% 99-25.07.29OAT/ INFL 300,000 654,430 1.69EUR
4,530,070 11.67
GERMANY 1.5% 06-15.04.16/INFL 100,000 163,582 0.42EUR
GERMANY
GERMANY 2.25% 07-15.04.13/INDEX 100,000 161,521 0.42EUR
325,103 0.84
GREAT BRITAIN 1.125% 07-22.11.37 3MO 1,200,000 2,396,111 6.18GBP
GREAT BRITAIN
GREAT BRIT.1.875% 07-22.11.22 300,000 612,755 1.58GBP
UK TSY FRN IL/06-22.11.17 200,000 413,747 1.07GBP
UK TSY FRN 06-22.11.27/RPI 600,000 1,227,201 3.16GBP
UK 0.75% 07-22.11.47/INFL 500,000 921,301 2.37GBP
INVESTMENTS
Global Inflation Linked Bond (launched as at 30 June 2010)Statement of investments as at 31 March 2011(expressed in USD)
Description Currency Evaluation % netassets
Face Value
UK 2.5% 83-16.04.20/INFL 100,000 519,960 1.34GBP
UK 2.5% 85-16.08.13/INFL 200,000 910,296 2.34GBP
UK 2.5% 86-17.07.24/INFL 200,000 910,891 2.35GBP
UK 2.5% 93-26.07.16 / INFL 200,000 1,025,432 2.64GBP
8,937,694 23.03
ITALY 2.1% 06-15.09.17 /INFL. 400,000 626,169 1.61EUR
ITALY
ITALY 2.15% 03-15.09.14/INFL 600,000 1,014,128 2.61EUR
ITALY 2.35% 04-15.09.35 BTP 100,000 144,030 0.37EUR
ITALY 2.35% 08-15.09.19 CPIBTP 300,000 444,724 1.15EUR
ITALY 2.55% 09-15.09.41 100,000 128,598 0.33EUR
ITALY 2.6% 07-15.09.23 BTP 800,000 1,198,310 3.09EUR
3,555,959 9.16
JAPAN GOVT 1.4% 08-10.03.18 CPI 215,000,000 2,617,231 6.74JPY
JAPAN
2,617,231 6.74
USA 1.625% 08-15.01.18INF/TBO 500,000 568,136 1.46USD
UNITED STATES
USA 3.875% 99-15.04.29/INFL 1,500,000 2,686,250 6.92USD
3,254,386 8.38
59.8223,220,443TOTAL INFLATION INDEX BOND
62.95TOTAL TRANSFERABLE SECURITIESADMITTED TO AN OFFICIAL STOCKEXCHANGE LISTING
24,436,744
CANADA 4% 99-01.12.31/INFL 250,000 510,516 1.32CAD
TRANSFERABLE SECURITIES TRADED ON ANOTHER REGULATEDMARKET
INFLATION INDEX BOND
CANADA
510,516 1.32
USA TSY 1.875% 03-15.07.13 300,000 389,445 1.00USD
UNITED STATES
USA TSY 3.375% 02-15.01.12INDEX INF 600,000 780,185 2.01USD
USA 1.875% 05-15.07.15 TBINDEXED 2,400,000 2,990,231 7.69USD
USA 2% 04-15.07.14 TBOINFL.IND 500,000 641,468 1.65USD
Description Currency Evaluation % netassets
Face Value

Portfolio of Investments and Other Net Assets as at 31 March 2011
330
USA 2% 06-15.01.26TSY/INFL.IDX 1,100,000 1,303,845 3.36USD
USA 2.125% 09-15.01.19 1,600,000 1,830,625 4.72USD
USA 2.375% 04-15.01.25/INFL 600,000 787,721 2.03USD
USA 2.375% 07-15.01.17TSY/INDEX 800,000 985,813 2.54USD
USA 3%15.07.12 S.C-2012INFLAT. 800,000 1,050,273 2.71USD
USA 3.375% 01-15.04.32INFLATION 800,000 1,276,785 3.29USD
12,036,391 31.00
32.3212,546,907TOTAL INFLATION INDEX BOND
32.32TOTAL TRANSFERABLE SECURITIES TRADEDON ANOTHER REGULATED MARKET
12,546,907
USA 1.875% 09-15.07.19/INFL 800,000 904,913 2.33USD
OTHER TRANSFERABLE SECURITIES
INFLATION INDEX BOND
UNITED STATES
904,913 2.33
2.33904,913TOTAL INFLATION INDEX BOND
2.33TOTAL OTHER TRANSFERABLE SECURITIES 904,913
97.60TOTAL INVESTMENTS 37,888,564
2.40OTHER NET ASSETS LESS LIABILITIES 931,706
100.00TOTAL NET ASSETS 38,820,270
Global Inflation Linked Bond (launched as at 30 June 2010)Statement of investments as at 31 March 2011(expressed in USD)
Description Currency Evaluation % netassets
Face Value
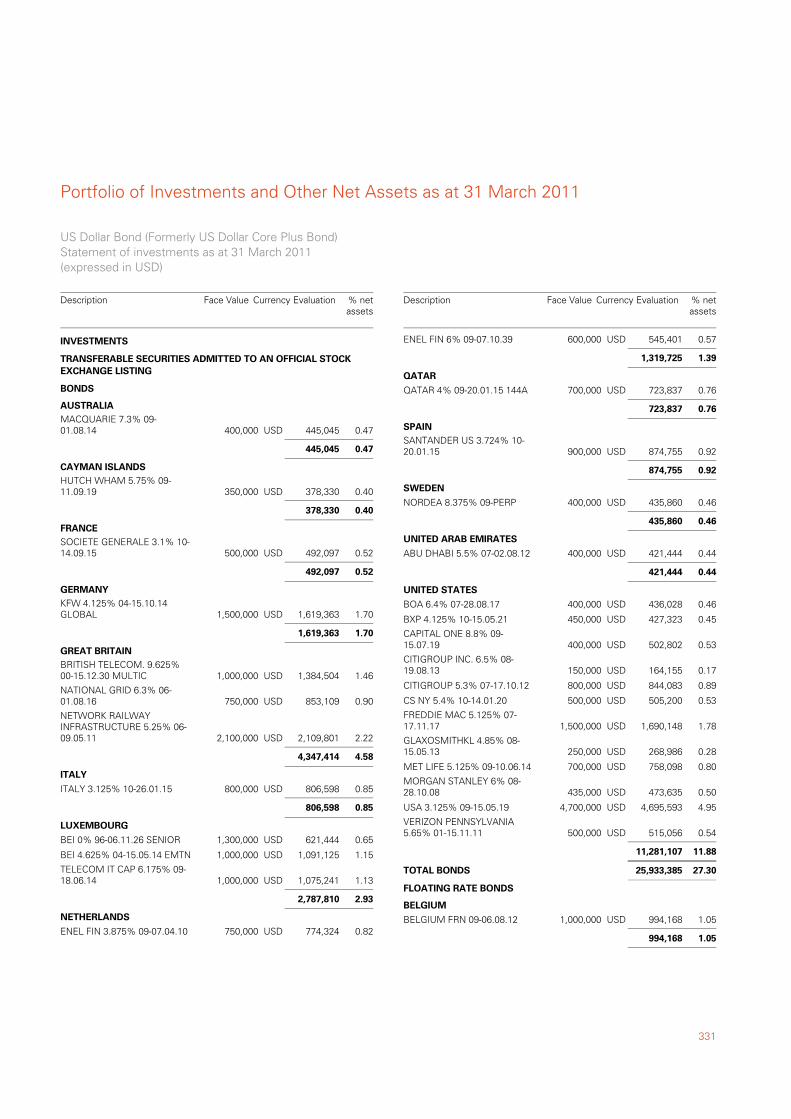
331
Portfolio of Investments and Other Net Assets as at 31 March 2011
MACQUARIE 7.3% 09-01.08.14 400,000 445,045 0.47USD
TRANSFERABLE SECURITIES ADMITTED TO AN OFFICIAL STOCKEXCHANGE LISTING
BONDS
AUSTRALIA
445,045 0.47
HUTCH WHAM 5.75% 09-11.09.19 350,000 378,330 0.40USD
CAYMAN ISLANDS
378,330 0.40
SOCIETE GENERALE 3.1% 10-14.09.15 500,000 492,097 0.52USD
FRANCE
492,097 0.52
KFW 4.125% 04-15.10.14GLOBAL 1,500,000 1,619,363 1.70USD
GERMANY
1,619,363 1.70
BRITISH TELECOM. 9.625%00-15.12.30 MULTIC 1,000,000 1,384,504 1.46USD
GREAT BRITAIN
NATIONAL GRID 6.3% 06-01.08.16 750,000 853,109 0.90USD
NETWORK RAILWAYINFRASTRUCTURE 5.25% 06-09.05.11 2,100,000 2,109,801 2.22USD
4,347,414 4.58
ITALY 3.125% 10-26.01.15 800,000 806,598 0.85USD
ITALY
806,598 0.85
BEI 0% 96-06.11.26 SENIOR 1,300,000 621,444 0.65USD
LUXEMBOURG
BEI 4.625% 04-15.05.14 EMTN 1,000,000 1,091,125 1.15USD
TELECOM IT CAP 6.175% 09-18.06.14 1,000,000 1,075,241 1.13USD
2,787,810 2.93
ENEL FIN 3.875% 09-07.04.10 750,000 774,324 0.82USD
NETHERLANDS
INVESTMENTS
US Dollar Bond (Formerly US Dollar Core Plus Bond)Statement of investments as at 31 March 2011(expressed in USD)
Description Currency Evaluation % netassets
Face Value
ENEL FIN 6% 09-07.10.39 600,000 545,401 0.57USD
1,319,725 1.39
QATAR 4% 09-20.01.15 144A 700,000 723,837 0.76USD
QATAR
723,837 0.76
SANTANDER US 3.724% 10-20.01.15 900,000 874,755 0.92USD
SPAIN
874,755 0.92
NORDEA 8.375% 09-PERP 400,000 435,860 0.46USD
SWEDEN
435,860 0.46
ABU DHABI 5.5% 07-02.08.12 400,000 421,444 0.44USD
UNITED ARAB EMIRATES
421,444 0.44
BOA 6.4% 07-28.08.17 400,000 436,028 0.46USD
UNITED STATES
BXP 4.125% 10-15.05.21 450,000 427,323 0.45USD
CAPITAL ONE 8.8% 09-15.07.19 400,000 502,802 0.53USD
CITIGROUP INC. 6.5% 08-19.08.13 150,000 164,155 0.17USD
CITIGROUP 5.3% 07-17.10.12 800,000 844,083 0.89USD
CS NY 5.4% 10-14.01.20 500,000 505,200 0.53USD
FREDDIE MAC 5.125% 07-17.11.17 1,500,000 1,690,148 1.78USD
GLAXOSMITHKL 4.85% 08-15.05.13 250,000 268,986 0.28USD
MET LIFE 5.125% 09-10.06.14 700,000 758,098 0.80USD
MORGAN STANLEY 6% 08-28.10.08 435,000 473,635 0.50USD
USA 3.125% 09-15.05.19 4,700,000 4,695,593 4.95USD
VERIZON PENNSYLVANIA5.65% 01-15.11.11 500,000 515,056 0.54USD
11,281,107 11.88
27.3025,933,385TOTAL BONDS
BELGIUM FRN 09-06.08.12 1,000,000 994,168 1.05USD
FLOATING RATE BONDS
BELGIUM
994,168 1.05
Description Currency Evaluation % netassets
Face Value
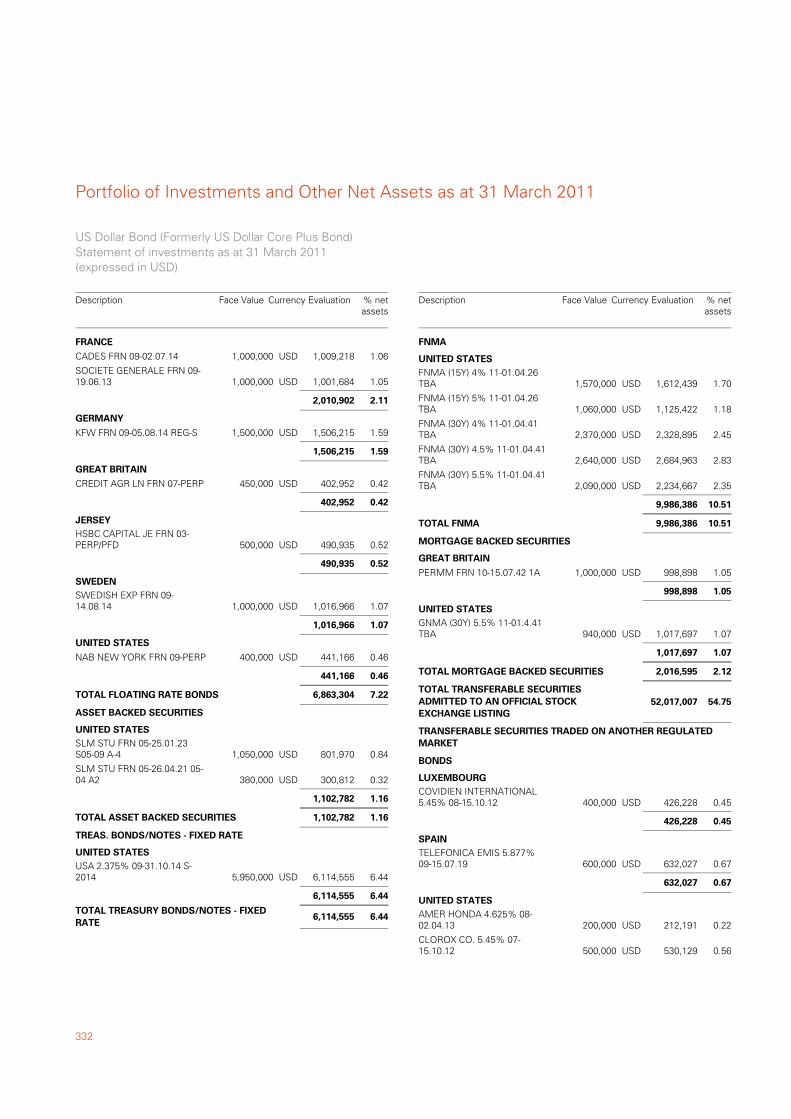
Portfolio of Investments and Other Net Assets as at 31 March 2011
332
CADES FRN 09-02.07.14 1,000,000 1,009,218 1.06USD
FRANCE
SOCIETE GENERALE FRN 09-19.06.13 1,000,000 1,001,684 1.05USD
2,010,902 2.11
KFW FRN 09-05.08.14 REG-S 1,500,000 1,506,215 1.59USD
GERMANY
1,506,215 1.59
CREDIT AGR LN FRN 07-PERP 450,000 402,952 0.42USD
GREAT BRITAIN
402,952 0.42
HSBC CAPITAL JE FRN 03-PERP/PFD 500,000 490,935 0.52USD
JERSEY
490,935 0.52
SWEDISH EXP FRN 09-14.08.14 1,000,000 1,016,966 1.07USD
SWEDEN
1,016,966 1.07
NAB NEW YORK FRN 09-PERP 400,000 441,166 0.46USD
UNITED STATES
441,166 0.46
7.226,863,304TOTAL FLOATING RATE BONDS
SLM STU FRN 05-25.01.23S05-09 A-4 1,050,000 801,970 0.84USD
ASSET BACKED SECURITIES
UNITED STATES
SLM STU FRN 05-26.04.21 05-04 A2 380,000 300,812 0.32USD
1,102,782 1.16
1.161,102,782TOTAL ASSET BACKED SECURITIES
USA 2.375% 09-31.10.14 S-2014 5,950,000 6,114,555 6.44USD
TREAS. BONDS/NOTES - FIXED RATE
UNITED STATES
6,114,555 6.44
6.446,114,555TOTAL TREASURY BONDS/NOTES - FIXEDRATE
US Dollar Bond (Formerly US Dollar Core Plus Bond)Statement of investments as at 31 March 2011(expressed in USD)
Description Currency Evaluation % netassets
Face Value
FNMA (15Y) 4% 11-01.04.26TBA 1,570,000 1,612,439 1.70USD
FNMA
UNITED STATES
FNMA (15Y) 5% 11-01.04.26TBA 1,060,000 1,125,422 1.18USD
FNMA (30Y) 4% 11-01.04.41TBA 2,370,000 2,328,895 2.45USD
FNMA (30Y) 4.5% 11-01.04.41TBA 2,640,000 2,684,963 2.83USD
FNMA (30Y) 5.5% 11-01.04.41TBA 2,090,000 2,234,667 2.35USD
9,986,386 10.51
10.519,986,386TOTAL FNMA
PERMM FRN 10-15.07.42 1A 1,000,000 998,898 1.05USD
MORTGAGE BACKED SECURITIES
GREAT BRITAIN
998,898 1.05
GNMA (30Y) 5.5% 11-01.4.41TBA 940,000 1,017,697 1.07USD
UNITED STATES
1,017,697 1.07
2.122,016,595TOTAL MORTGAGE BACKED SECURITIES
54.75TOTAL TRANSFERABLE SECURITIESADMITTED TO AN OFFICIAL STOCKEXCHANGE LISTING
52,017,007
COVIDIEN INTERNATIONAL5.45% 08-15.10.12 400,000 426,228 0.45USD
TRANSFERABLE SECURITIES TRADED ON ANOTHER REGULATEDMARKET
BONDS
LUXEMBOURG
426,228 0.45
TELEFONICA EMIS 5.877%09-15.07.19 600,000 632,027 0.67USD
SPAIN
632,027 0.67
AMER HONDA 4.625% 08-02.04.13 200,000 212,191 0.22USD
UNITED STATES
CLOROX CO. 5.45% 07-15.10.12 500,000 530,129 0.56USD
Description Currency Evaluation % netassets
Face Value
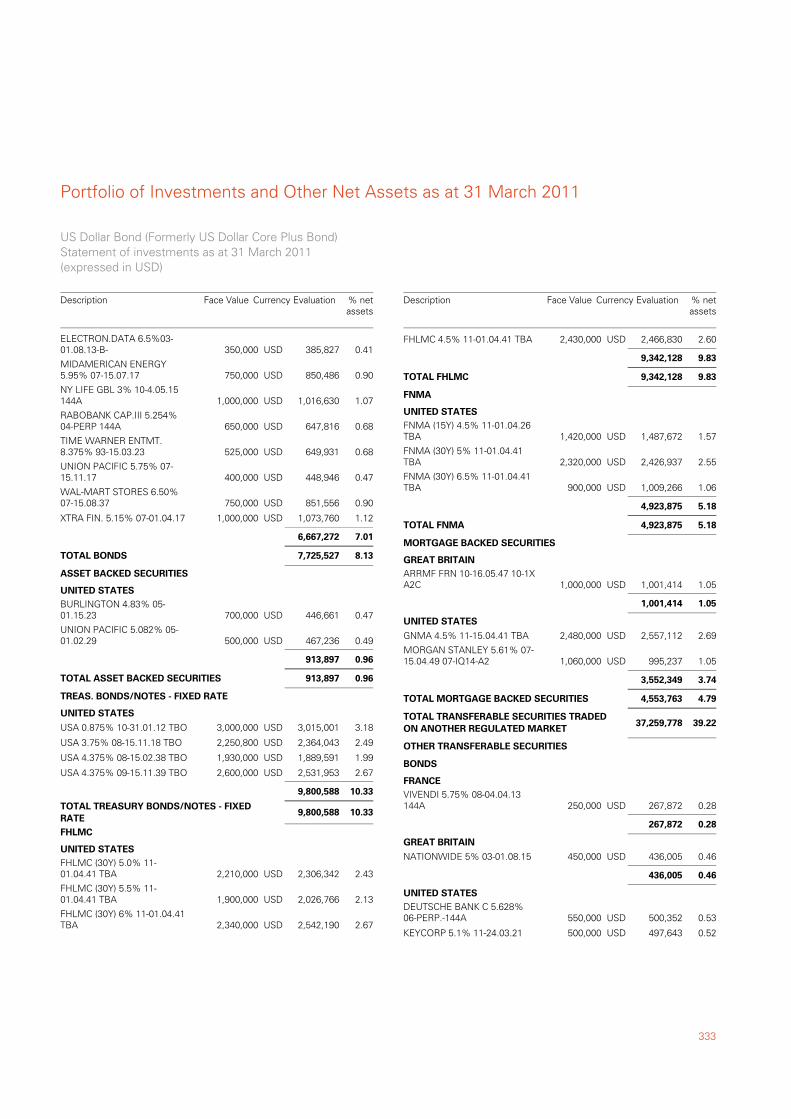
333
Portfolio of Investments and Other Net Assets as at 31 March 2011
ELECTRON.DATA 6.5%03-01.08.13-B- 350,000 385,827 0.41USD
MIDAMERICAN ENERGY5.95% 07-15.07.17 750,000 850,486 0.90USD
NY LIFE GBL 3% 10-4.05.15144A 1,000,000 1,016,630 1.07USD
RABOBANK CAP.III 5.254%04-PERP 144A 650,000 647,816 0.68USD
TIME WARNER ENTMT.8.375% 93-15.03.23 525,000 649,931 0.68USD
UNION PACIFIC 5.75% 07-15.11.17 400,000 448,946 0.47USD
WAL-MART STORES 6.50%07-15.08.37 750,000 851,556 0.90USD
XTRA FIN. 5.15% 07-01.04.17 1,000,000 1,073,760 1.12USD
6,667,272 7.01
8.137,725,527TOTAL BONDS
BURLINGTON 4.83% 05-01.15.23 700,000 446,661 0.47USD
ASSET BACKED SECURITIES
UNITED STATES
UNION PACIFIC 5.082% 05-01.02.29 500,000 467,236 0.49USD
913,897 0.96
0.96913,897TOTAL ASSET BACKED SECURITIES
USA 0.875% 10-31.01.12 TBO 3,000,000 3,015,001 3.18USD
TREAS. BONDS/NOTES - FIXED RATE
UNITED STATES
USA 3.75% 08-15.11.18 TBO 2,250,800 2,364,043 2.49USD
USA 4.375% 08-15.02.38 TBO 1,930,000 1,889,591 1.99USD
USA 4.375% 09-15.11.39 TBO 2,600,000 2,531,953 2.67USD
9,800,588 10.33
10.339,800,588TOTAL TREASURY BONDS/NOTES - FIXEDRATE
FHLMC (30Y) 5.0% 11-01.04.41 TBA 2,210,000 2,306,342 2.43USD
FHLMC
UNITED STATES
FHLMC (30Y) 5.5% 11-01.04.41 TBA 1,900,000 2,026,766 2.13USD
FHLMC (30Y) 6% 11-01.04.41TBA 2,340,000 2,542,190 2.67USD
US Dollar Bond (Formerly US Dollar Core Plus Bond)Statement of investments as at 31 March 2011(expressed in USD)
Description Currency Evaluation % netassets
Face Value
FHLMC 4.5% 11-01.04.41 TBA 2,430,000 2,466,830 2.60USD
9,342,128 9.83
9.839,342,128TOTAL FHLMC
FNMA (15Y) 4.5% 11-01.04.26TBA 1,420,000 1,487,672 1.57USD
FNMA
UNITED STATES
FNMA (30Y) 5% 11-01.04.41TBA 2,320,000 2,426,937 2.55USD
FNMA (30Y) 6.5% 11-01.04.41TBA 900,000 1,009,266 1.06USD
4,923,875 5.18
5.184,923,875TOTAL FNMA
ARRMF FRN 10-16.05.47 10-1XA2C 1,000,000 1,001,414 1.05USD
MORTGAGE BACKED SECURITIES
GREAT BRITAIN
1,001,414 1.05
GNMA 4.5% 11-15.04.41 TBA 2,480,000 2,557,112 2.69USD
UNITED STATES
MORGAN STANLEY 5.61% 07-15.04.49 07-IQ14-A2 1,060,000 995,237 1.05USD
3,552,349 3.74
4.794,553,763TOTAL MORTGAGE BACKED SECURITIES
39.22TOTAL TRANSFERABLE SECURITIES TRADEDON ANOTHER REGULATED MARKET
37,259,778
VIVENDI 5.75% 08-04.04.13144A 250,000 267,872 0.28USD
OTHER TRANSFERABLE SECURITIES
BONDS
FRANCE
267,872 0.28
NATIONWIDE 5% 03-01.08.15 450,000 436,005 0.46USD
GREAT BRITAIN
436,005 0.46
DEUTSCHE BANK C 5.628%06-PERP.-144A 550,000 500,352 0.53USD
UNITED STATES
KEYCORP 5.1% 11-24.03.21 500,000 497,643 0.52USD
Description Currency Evaluation % netassets
Face Value
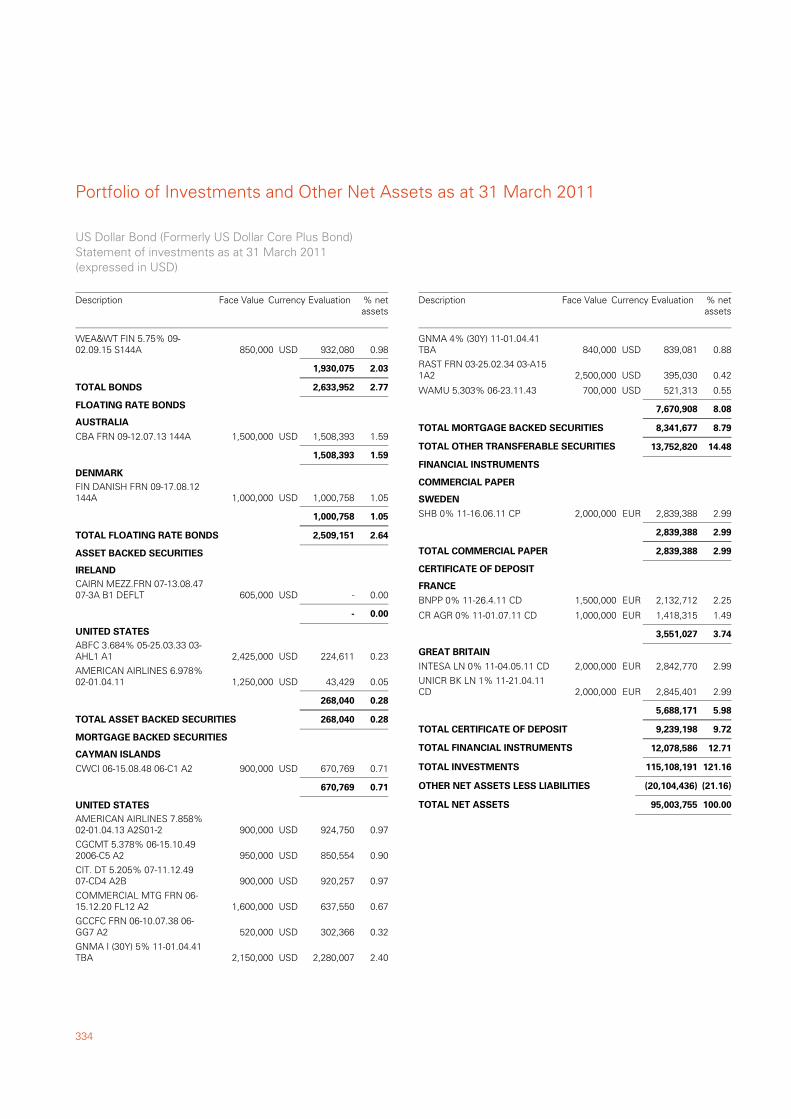
Portfolio of Investments and Other Net Assets as at 31 March 2011
334
WEA&WT FIN 5.75% 09-02.09.15 S144A 850,000 932,080 0.98USD
1,930,075 2.03
2.772,633,952TOTAL BONDS
CBA FRN 09-12.07.13 144A 1,500,000 1,508,393 1.59USD
FLOATING RATE BONDS
AUSTRALIA
1,508,393 1.59
FIN DANISH FRN 09-17.08.12144A 1,000,000 1,000,758 1.05USD
DENMARK
1,000,758 1.05
2.642,509,151TOTAL FLOATING RATE BONDS
CAIRN MEZZ.FRN 07-13.08.4707-3A B1 DEFLT 605,000 - 0.00USD
ASSET BACKED SECURITIES
IRELAND
- 0.00
ABFC 3.684% 05-25.03.33 03-AHL1 A1 2,425,000 224,611 0.23USD
UNITED STATES
AMERICAN AIRLINES 6.978%02-01.04.11 1,250,000 43,429 0.05USD
268,040 0.28
0.28268,040TOTAL ASSET BACKED SECURITIES
CWCI 06-15.08.48 06-C1 A2 900,000 670,769 0.71USD
MORTGAGE BACKED SECURITIES
CAYMAN ISLANDS
670,769 0.71
AMERICAN AIRLINES 7.858%02-01.04.13 A2S01-2 900,000 924,750 0.97USD
UNITED STATES
CGCMT 5.378% 06-15.10.492006-C5 A2 950,000 850,554 0.90USD
CIT. DT 5.205% 07-11.12.4907-CD4 A2B 900,000 920,257 0.97USD
COMMERCIAL MTG FRN 06-15.12.20 FL12 A2 1,600,000 637,550 0.67USD
GCCFC FRN 06-10.07.38 06-GG7 A2 520,000 302,366 0.32USD
GNMA I (30Y) 5% 11-01.04.41TBA 2,150,000 2,280,007 2.40USD
US Dollar Bond (Formerly US Dollar Core Plus Bond)Statement of investments as at 31 March 2011(expressed in USD)
Description Currency Evaluation % netassets
Face Value
GNMA 4% (30Y) 11-01.04.41TBA 840,000 839,081 0.88USD
RAST FRN 03-25.02.34 03-A151A2 2,500,000 395,030 0.42USD
WAMU 5.303% 06-23.11.43 700,000 521,313 0.55USD
7,670,908 8.08
8.798,341,677TOTAL MORTGAGE BACKED SECURITIES
14.48TOTAL OTHER TRANSFERABLE SECURITIES 13,752,820
SHB 0% 11-16.06.11 CP 2,000,000 2,839,388 2.99EUR
FINANCIAL INSTRUMENTS
COMMERCIAL PAPER
SWEDEN
2,839,388 2.99
2.992,839,388TOTAL COMMERCIAL PAPER
BNPP 0% 11-26.4.11 CD 1,500,000 2,132,712 2.25EUR
CERTIFICATE OF DEPOSIT
FRANCE
CR AGR 0% 11-01.07.11 CD 1,000,000 1,418,315 1.49EUR
3,551,027 3.74
INTESA LN 0% 11-04.05.11 CD 2,000,000 2,842,770 2.99EUR
GREAT BRITAIN
UNICR BK LN 1% 11-21.04.11CD 2,000,000 2,845,401 2.99EUR
5,688,171 5.98
9.729,239,198TOTAL CERTIFICATE OF DEPOSIT
12.71TOTAL FINANCIAL INSTRUMENTS 12,078,586
121.16TOTAL INVESTMENTS 115,108,191
(21.16)OTHER NET ASSETS LESS LIABILITIES (20,104,436)
100.00TOTAL NET ASSETS 95,003,755
Description Currency Evaluation % netassets
Face Value
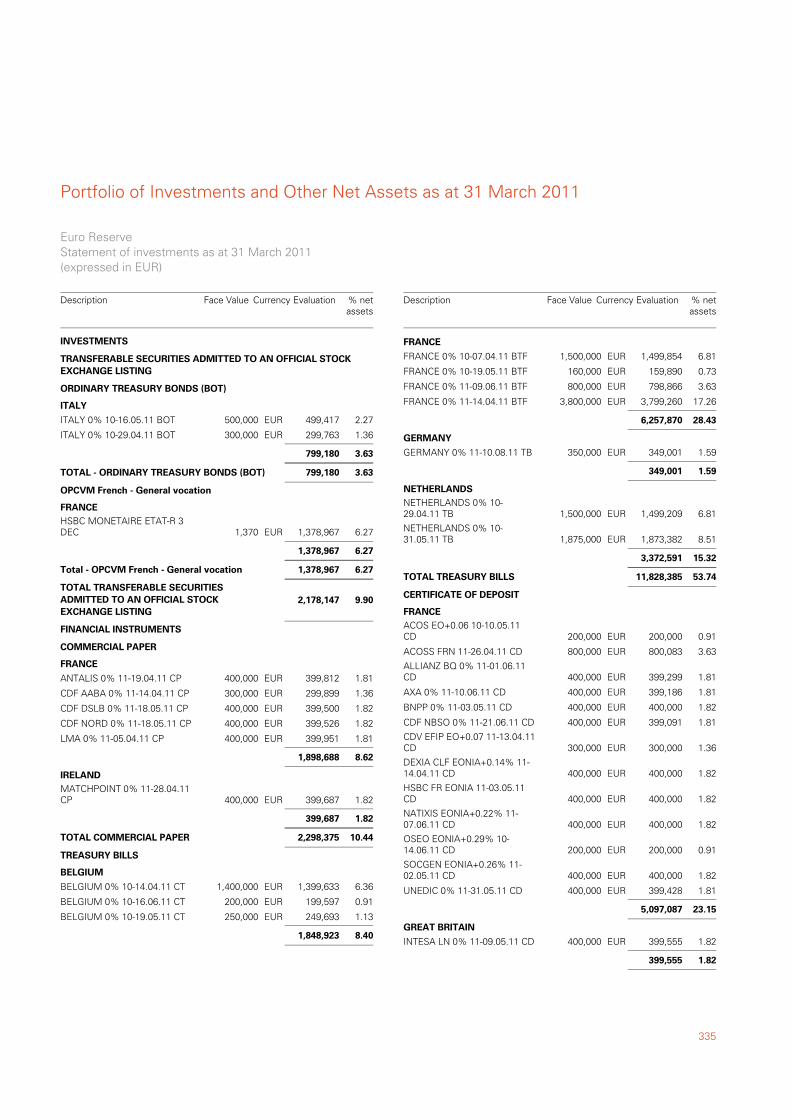
335
Portfolio of Investments and Other Net Assets as at 31 March 2011
ITALY 0% 10-16.05.11 BOT 500,000 499,417 2.27EUR
TRANSFERABLE SECURITIES ADMITTED TO AN OFFICIAL STOCKEXCHANGE LISTING
ORDINARY TREASURY BONDS (BOT)
ITALY
ITALY 0% 10-29.04.11 BOT 300,000 299,763 1.36EUR
799,180 3.63
3.63799,180TOTAL - ORDINARY TREASURY BONDS (BOT)
HSBC MONETAIRE ETAT-R 3DEC 1,370 1,378,967 6.27EUR
OPCVM French - General vocation
FRANCE
1,378,967 6.27
6.271,378,967Total - OPCVM French - General vocation
9.90TOTAL TRANSFERABLE SECURITIESADMITTED TO AN OFFICIAL STOCKEXCHANGE LISTING
2,178,147
ANTALIS 0% 11-19.04.11 CP 400,000 399,812 1.81EUR
FINANCIAL INSTRUMENTS
COMMERCIAL PAPER
FRANCE
CDF AABA 0% 11-14.04.11 CP 300,000 299,899 1.36EUR
CDF DSLB 0% 11-18.05.11 CP 400,000 399,500 1.82EUR
CDF NORD 0% 11-18.05.11 CP 400,000 399,526 1.82EUR
LMA 0% 11-05.04.11 CP 400,000 399,951 1.81EUR
1,898,688 8.62
MATCHPOINT 0% 11-28.04.11CP 400,000 399,687 1.82EUR
IRELAND
399,687 1.82
10.442,298,375TOTAL COMMERCIAL PAPER
BELGIUM 0% 10-14.04.11 CT 1,400,000 1,399,633 6.36EUR
TREASURY BILLS
BELGIUM
BELGIUM 0% 10-16.06.11 CT 200,000 199,597 0.91EUR
BELGIUM 0% 10-19.05.11 CT 250,000 249,693 1.13EUR
1,848,923 8.40
INVESTMENTS
Euro ReserveStatement of investments as at 31 March 2011(expressed in EUR)
Description Currency Evaluation % netassets
Face Value
FRANCE 0% 10-07.04.11 BTF 1,500,000 1,499,854 6.81EUR
FRANCE
FRANCE 0% 10-19.05.11 BTF 160,000 159,890 0.73EUR
FRANCE 0% 11-09.06.11 BTF 800,000 798,866 3.63EUR
FRANCE 0% 11-14.04.11 BTF 3,800,000 3,799,260 17.26EUR
6,257,870 28.43
GERMANY 0% 11-10.08.11 TB 350,000 349,001 1.59EUR
GERMANY
349,001 1.59
NETHERLANDS 0% 10-29.04.11 TB 1,500,000 1,499,209 6.81EUR
NETHERLANDS
NETHERLANDS 0% 10-31.05.11 TB 1,875,000 1,873,382 8.51EUR
3,372,591 15.32
53.7411,828,385TOTAL TREASURY BILLS
ACOS EO+0.06 10-10.05.11CD 200,000 200,000 0.91EUR
CERTIFICATE OF DEPOSIT
FRANCE
ACOSS FRN 11-26.04.11 CD 800,000 800,083 3.63EUR
ALLIANZ BQ 0% 11-01.06.11CD 400,000 399,299 1.81EUR
AXA 0% 11-10.06.11 CD 400,000 399,186 1.81EUR
BNPP 0% 11-03.05.11 CD 400,000 400,000 1.82EUR
CDF NBSO 0% 11-21.06.11 CD 400,000 399,091 1.81EUR
CDV EFIP EO+0.07 11-13.04.11CD 300,000 300,000 1.36EUR
DEXIA CLF EONIA+0.14% 11-14.04.11 CD 400,000 400,000 1.82EUR
HSBC FR EONIA 11-03.05.11CD 400,000 400,000 1.82EUR
NATIXIS EONIA+0.22% 11-07.06.11 CD 400,000 400,000 1.82EUR
OSEO EONIA+0.29% 10-14.06.11 CD 200,000 200,000 0.91EUR
SOCGEN EONIA+0.26% 11-02.05.11 CD 400,000 400,000 1.82EUR
UNEDIC 0% 11-31.05.11 CD 400,000 399,428 1.81EUR
5,097,087 23.15
INTESA LN 0% 11-09.05.11 CD 400,000 399,555 1.82EUR
GREAT BRITAIN
399,555 1.82
Description Currency Evaluation % netassets
Face Value
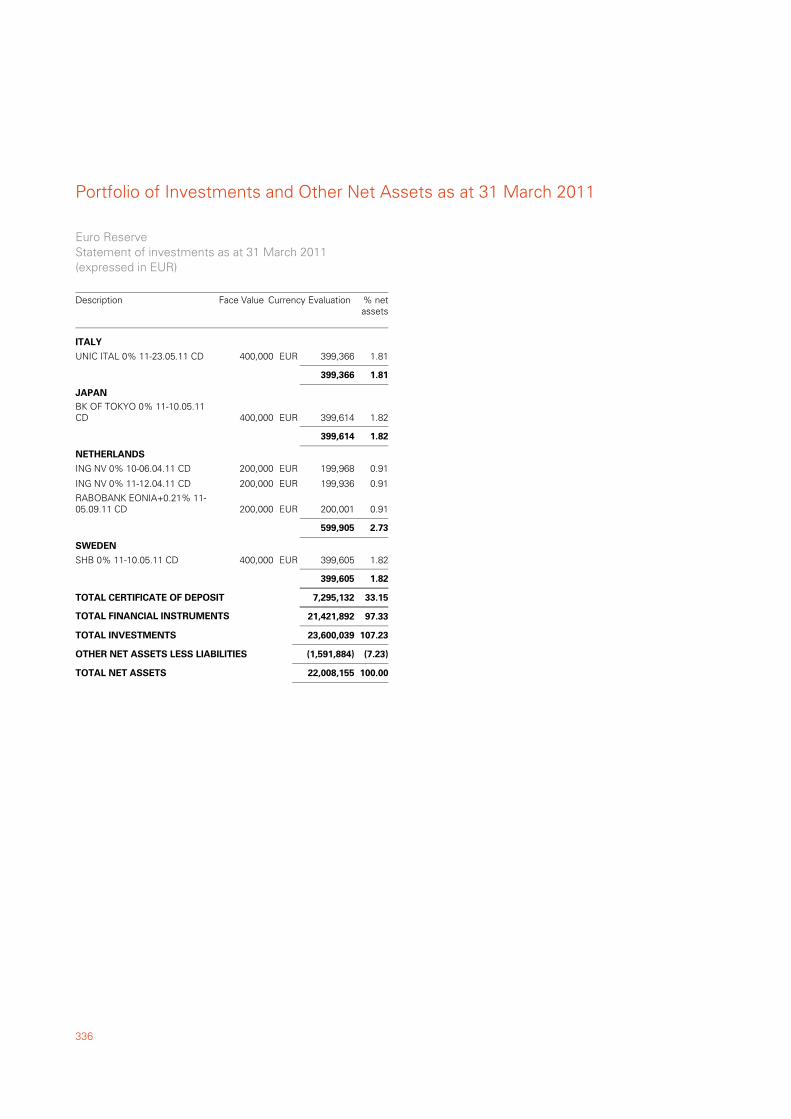
Portfolio of Investments and Other Net Assets as at 31 March 2011
336
UNIC ITAL 0% 11-23.05.11 CD 400,000 399,366 1.81EUR
ITALY
399,366 1.81
BK OF TOKYO 0% 11-10.05.11CD 400,000 399,614 1.82EUR
JAPAN
399,614 1.82
ING NV 0% 10-06.04.11 CD 200,000 199,968 0.91EUR
NETHERLANDS
ING NV 0% 11-12.04.11 CD 200,000 199,936 0.91EUR
RABOBANK EONIA+0.21% 11-05.09.11 CD 200,000 200,001 0.91EUR
599,905 2.73
SHB 0% 11-10.05.11 CD 400,000 399,605 1.82EUR
SWEDEN
399,605 1.82
33.157,295,132TOTAL CERTIFICATE OF DEPOSIT
97.33TOTAL FINANCIAL INSTRUMENTS 21,421,892
107.23TOTAL INVESTMENTS 23,600,039
(7.23)OTHER NET ASSETS LESS LIABILITIES (1,591,884)
100.00TOTAL NET ASSETS 22,008,155
Euro ReserveStatement of investments as at 31 March 2011(expressed in EUR)
Description Currency Evaluation % netassets
Face Value
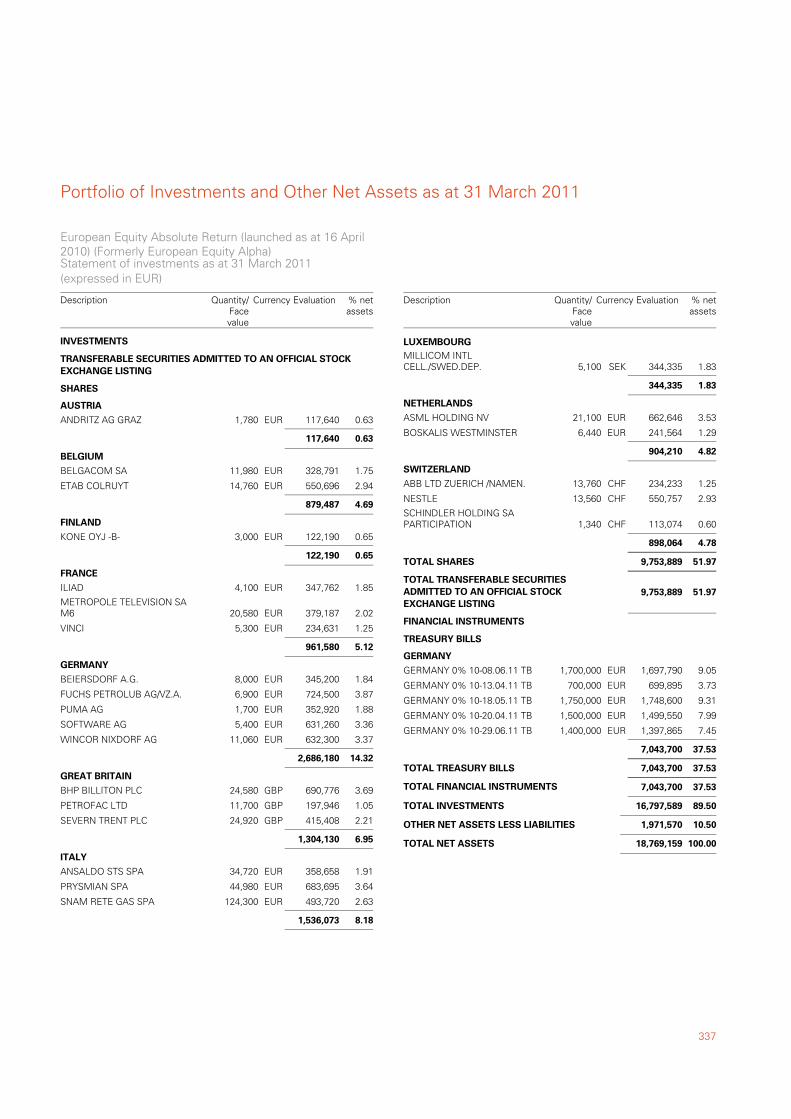
337
Portfolio of Investments and Other Net Assets as at 31 March 2011
ANDRITZ AG GRAZ 1,780 117,640 0.63EUR
TRANSFERABLE SECURITIES ADMITTED TO AN OFFICIAL STOCKEXCHANGE LISTING
SHARES
AUSTRIA
117,640 0.63
BELGACOM SA 11,980 328,791 1.75EUR
BELGIUM
ETAB COLRUYT 14,760 550,696 2.94EUR
879,487 4.69
KONE OYJ -B- 3,000 122,190 0.65EUR
FINLAND
122,190 0.65
ILIAD 4,100 347,762 1.85EUR
FRANCE
METROPOLE TELEVISION SAM6 20,580 379,187 2.02EUR
VINCI 5,300 234,631 1.25EUR
961,580 5.12
BEIERSDORF A.G. 8,000 345,200 1.84EUR
GERMANY
FUCHS PETROLUB AG/VZ.A. 6,900 724,500 3.87EUR
PUMA AG 1,700 352,920 1.88EUR
SOFTWARE AG 5,400 631,260 3.36EUR
WINCOR NIXDORF AG 11,060 632,300 3.37EUR
2,686,180 14.32
BHP BILLITON PLC 24,580 690,776 3.69GBP
GREAT BRITAIN
PETROFAC LTD 11,700 197,946 1.05GBP
SEVERN TRENT PLC 24,920 415,408 2.21GBP
1,304,130 6.95
ANSALDO STS SPA 34,720 358,658 1.91EUR
ITALY
PRYSMIAN SPA 44,980 683,695 3.64EUR
SNAM RETE GAS SPA 124,300 493,720 2.63EUR
1,536,073 8.18
INVESTMENTS
European Equity Absolute Return (launched as at 16 April2010) (Formerly European Equity Alpha)Statement of investments as at 31 March 2011(expressed in EUR)
Description Currency Evaluation % netassets
Quantity/Facevalue
MILLICOM INTLCELL./SWED.DEP. 5,100 344,335 1.83SEK
LUXEMBOURG
344,335 1.83
ASML HOLDING NV 21,100 662,646 3.53EUR
NETHERLANDS
BOSKALIS WESTMINSTER 6,440 241,564 1.29EUR
904,210 4.82
ABB LTD ZUERICH /NAMEN. 13,760 234,233 1.25CHF
SWITZERLAND
NESTLE 13,560 550,757 2.93CHF
SCHINDLER HOLDING SAPARTICIPATION 1,340 113,074 0.60CHF
898,064 4.78
51.979,753,889TOTAL SHARES
51.97TOTAL TRANSFERABLE SECURITIESADMITTED TO AN OFFICIAL STOCKEXCHANGE LISTING
9,753,889
GERMANY 0% 10-08.06.11 TB 1,700,000 1,697,790 9.05EUR
FINANCIAL INSTRUMENTS
TREASURY BILLS
GERMANY
GERMANY 0% 10-13.04.11 TB 700,000 699,895 3.73EUR
GERMANY 0% 10-18.05.11 TB 1,750,000 1,748,600 9.31EUR
GERMANY 0% 10-20.04.11 TB 1,500,000 1,499,550 7.99EUR
GERMANY 0% 10-29.06.11 TB 1,400,000 1,397,865 7.45EUR
7,043,700 37.53
37.537,043,700TOTAL TREASURY BILLS
37.53TOTAL FINANCIAL INSTRUMENTS 7,043,700
89.50TOTAL INVESTMENTS 16,797,589
10.50OTHER NET ASSETS LESS LIABILITIES 1,971,570
100.00TOTAL NET ASSETS 18,769,159
Description Currency Evaluation % netassets
Quantity/Facevalue
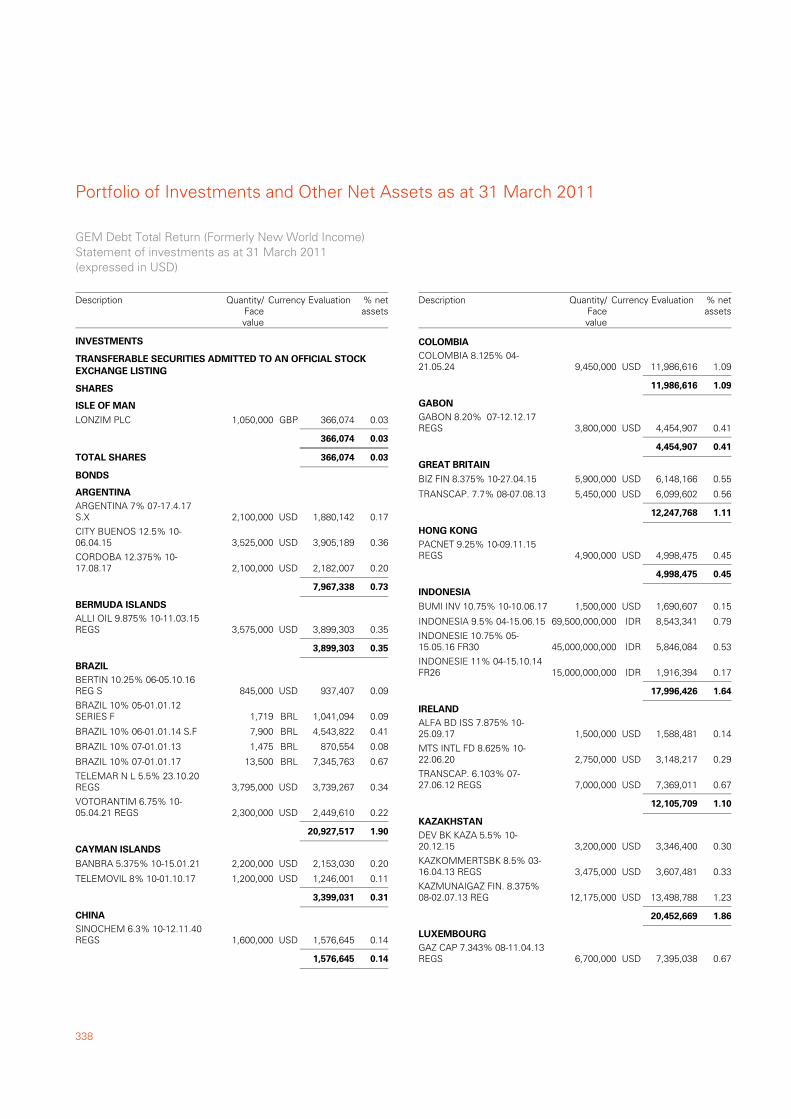
Portfolio of Investments and Other Net Assets as at 31 March 2011
338
LONZIM PLC 1,050,000 366,074 0.03GBP
TRANSFERABLE SECURITIES ADMITTED TO AN OFFICIAL STOCKEXCHANGE LISTING
SHARES
ISLE OF MAN
366,074 0.03
0.03366,074TOTAL SHARES
ARGENTINA 7% 07-17.4.17S.X 2,100,000 1,880,142 0.17USD
BONDS
ARGENTINA
CITY BUENOS 12.5% 10-06.04.15 3,525,000 3,905,189 0.36USD
CORDOBA 12.375% 10-17.08.17 2,100,000 2,182,007 0.20USD
7,967,338 0.73
ALLI OIL 9.875% 10-11.03.15REGS 3,575,000 3,899,303 0.35USD
BERMUDA ISLANDS
3,899,303 0.35
BERTIN 10.25% 06-05.10.16REG S 845,000 937,407 0.09USD
BRAZIL
BRAZIL 10% 05-01.01.12SERIES F 1,719 1,041,094 0.09BRL
BRAZIL 10% 06-01.01.14 S.F 7,900 4,543,822 0.41BRL
BRAZIL 10% 07-01.01.13 1,475 870,554 0.08BRL
BRAZIL 10% 07-01.01.17 13,500 7,345,763 0.67BRL
TELEMAR N L 5.5% 23.10.20REGS 3,795,000 3,739,267 0.34USD
VOTORANTIM 6.75% 10-05.04.21 REGS 2,300,000 2,449,610 0.22USD
20,927,517 1.90
BANBRA 5.375% 10-15.01.21 2,200,000 2,153,030 0.20USD
CAYMAN ISLANDS
TELEMOVIL 8% 10-01.10.17 1,200,000 1,246,001 0.11USD
3,399,031 0.31
SINOCHEM 6.3% 10-12.11.40REGS 1,600,000 1,576,645 0.14USD
CHINA
1,576,645 0.14
INVESTMENTS
GEM Debt Total Return (Formerly New World Income)Statement of investments as at 31 March 2011(expressed in USD)
Description Currency Evaluation % netassets
Quantity/Facevalue
COLOMBIA 8.125% 04-21.05.24 9,450,000 11,986,616 1.09USD
COLOMBIA
11,986,616 1.09
GABON 8.20% 07-12.12.17REGS 3,800,000 4,454,907 0.41USD
GABON
4,454,907 0.41
BIZ FIN 8.375% 10-27.04.15 5,900,000 6,148,166 0.55USD
GREAT BRITAIN
TRANSCAP. 7.7% 08-07.08.13 5,450,000 6,099,602 0.56USD
12,247,768 1.11
PACNET 9.25% 10-09.11.15REGS 4,900,000 4,998,475 0.45USD
HONG KONG
4,998,475 0.45
BUMI INV 10.75% 10-10.06.17 1,500,000 1,690,607 0.15USD
INDONESIA
INDONESIA 9.5% 04-15.06.15 69,500,000,000 8,543,341 0.79IDR
INDONESIE 10.75% 05-15.05.16 FR30 45,000,000,000 5,846,084 0.53IDR
INDONESIE 11% 04-15.10.14FR26 15,000,000,000 1,916,394 0.17IDR
17,996,426 1.64
ALFA BD ISS 7.875% 10-25.09.17 1,500,000 1,588,481 0.14USD
IRELAND
MTS INTL FD 8.625% 10-22.06.20 2,750,000 3,148,217 0.29USD
TRANSCAP. 6.103% 07-27.06.12 REGS 7,000,000 7,369,011 0.67USD
12,105,709 1.10
DEV BK KAZA 5.5% 10-20.12.15 3,200,000 3,346,400 0.30USD
KAZAKHSTAN
KAZKOMMERTSBK 8.5% 03-16.04.13 REGS 3,475,000 3,607,481 0.33USD
KAZMUNAIGAZ FIN. 8.375%08-02.07.13 REG 12,175,000 13,498,788 1.23USD
20,452,669 1.86
GAZ CAP 7.343% 08-11.04.13REGS 6,700,000 7,395,038 0.67USD
LUXEMBOURG
Description Currency Evaluation % netassets
Quantity/Facevalue
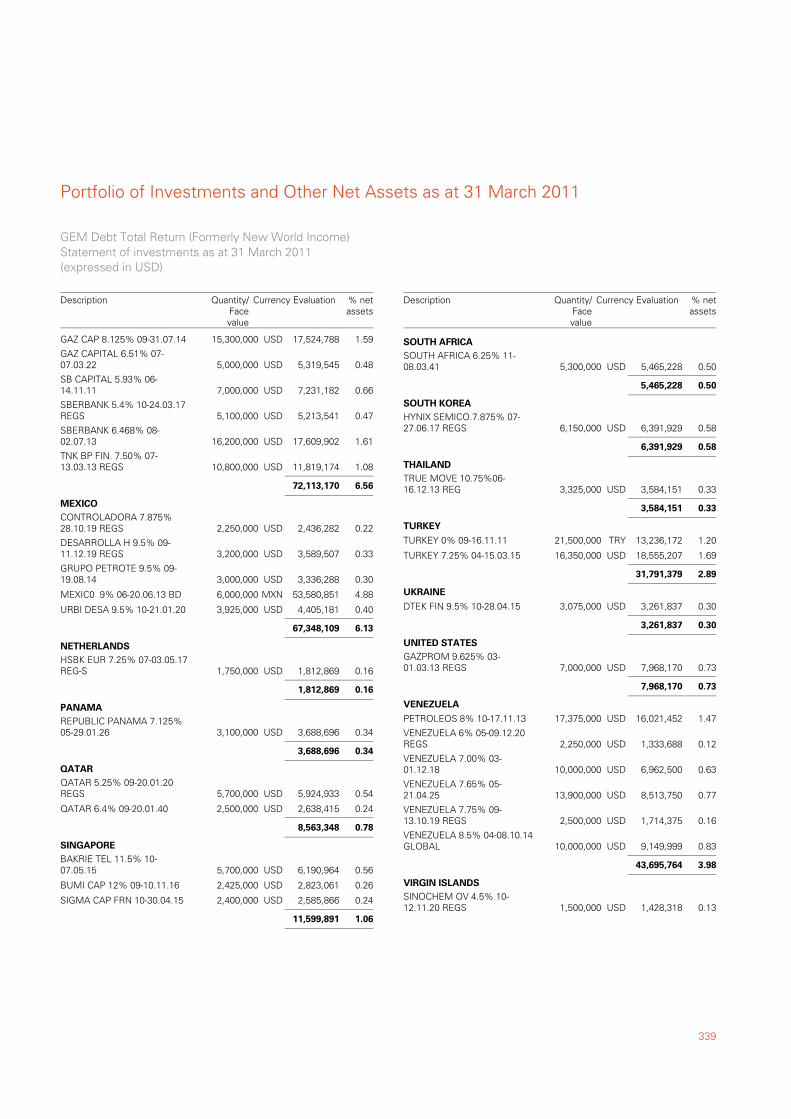
339
Portfolio of Investments and Other Net Assets as at 31 March 2011
GAZ CAP 8.125% 09-31.07.14 15,300,000 17,524,788 1.59USD
GAZ CAPITAL 6.51% 07-07.03.22 5,000,000 5,319,545 0.48USD
SB CAPITAL 5.93% 06-14.11.11 7,000,000 7,231,182 0.66USD
SBERBANK 5.4% 10-24.03.17REGS 5,100,000 5,213,541 0.47USD
SBERBANK 6.468% 08-02.07.13 16,200,000 17,609,902 1.61USD
TNK BP FIN. 7.50% 07-13.03.13 REGS 10,800,000 11,819,174 1.08USD
72,113,170 6.56
CONTROLADORA 7.875%28.10.19 REGS 2,250,000 2,436,282 0.22USD
MEXICO
DESARROLLA H 9.5% 09-11.12.19 REGS 3,200,000 3,589,507 0.33USD
GRUPO PETROTE 9.5% 09-19.08.14 3,000,000 3,336,288 0.30USD
MEXIC0 9% 06-20.06.13 BD 6,000,000 53,580,851 4.88MXN
URBI DESA 9.5% 10-21.01.20 3,925,000 4,405,181 0.40USD
67,348,109 6.13
HSBK EUR 7.25% 07-03.05.17REG-S 1,750,000 1,812,869 0.16USD
NETHERLANDS
1,812,869 0.16
REPUBLIC PANAMA 7.125%05-29.01.26 3,100,000 3,688,696 0.34USD
PANAMA
3,688,696 0.34
QATAR 5.25% 09-20.01.20REGS 5,700,000 5,924,933 0.54USD
QATAR
QATAR 6.4% 09-20.01.40 2,500,000 2,638,415 0.24USD
8,563,348 0.78
BAKRIE TEL 11.5% 10-07.05.15 5,700,000 6,190,964 0.56USD
SINGAPORE
BUMI CAP 12% 09-10.11.16 2,425,000 2,823,061 0.26USD
SIGMA CAP FRN 10-30.04.15 2,400,000 2,585,866 0.24USD
11,599,891 1.06
GEM Debt Total Return (Formerly New World Income)Statement of investments as at 31 March 2011(expressed in USD)
Description Currency Evaluation % netassets
Quantity/Facevalue
SOUTH AFRICA 6.25% 11-08.03.41 5,300,000 5,465,228 0.50USD
SOUTH AFRICA
5,465,228 0.50
HYNIX SEMICO.7.875% 07-27.06.17 REGS 6,150,000 6,391,929 0.58USD
SOUTH KOREA
6,391,929 0.58
TRUE MOVE 10.75%06-16.12.13 REG 3,325,000 3,584,151 0.33USD
THAILAND
3,584,151 0.33
TURKEY 0% 09-16.11.11 21,500,000 13,236,172 1.20TRY
TURKEY
TURKEY 7.25% 04-15.03.15 16,350,000 18,555,207 1.69USD
31,791,379 2.89
DTEK FIN 9.5% 10-28.04.15 3,075,000 3,261,837 0.30USD
UKRAINE
3,261,837 0.30
GAZPROM 9.625% 03-01.03.13 REGS 7,000,000 7,968,170 0.73USD
UNITED STATES
7,968,170 0.73
PETROLEOS 8% 10-17.11.13 17,375,000 16,021,452 1.47USD
VENEZUELA
VENEZUELA 6% 05-09.12.20REGS 2,250,000 1,333,688 0.12USD
VENEZUELA 7.00% 03-01.12.18 10,000,000 6,962,500 0.63USD
VENEZUELA 7.65% 05-21.04.25 13,900,000 8,513,750 0.77USD
VENEZUELA 7.75% 09-13.10.19 REGS 2,500,000 1,714,375 0.16USD
VENEZUELA 8.5% 04-08.10.14GLOBAL 10,000,000 9,149,999 0.83USD
43,695,764 3.98
SINOCHEM OV 4.5% 10-12.11.20 REGS 1,500,000 1,428,318 0.13USD
VIRGIN ISLANDS
Description Currency Evaluation % netassets
Quantity/Facevalue
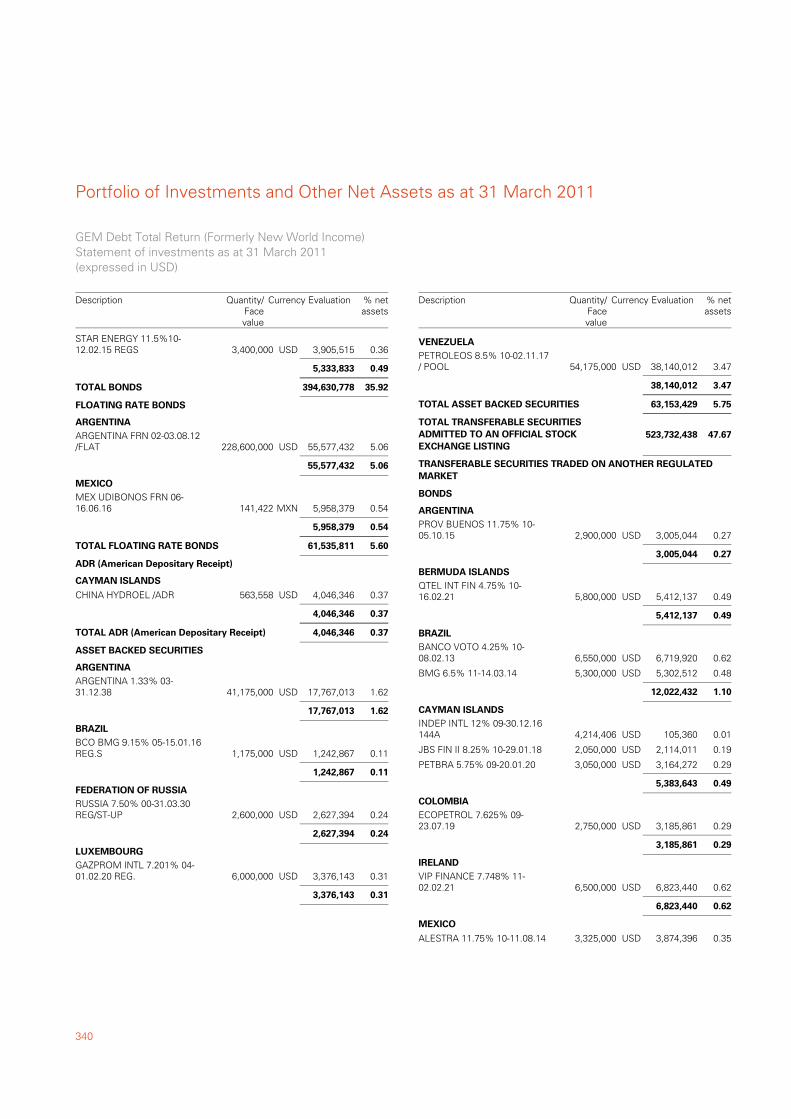
Portfolio of Investments and Other Net Assets as at 31 March 2011
340
STAR ENERGY 11.5%10-12.02.15 REGS 3,400,000 3,905,515 0.36USD
5,333,833 0.49
35.92394,630,778TOTAL BONDS
ARGENTINA FRN 02-03.08.12/FLAT 228,600,000 55,577,432 5.06USD
FLOATING RATE BONDS
ARGENTINA
55,577,432 5.06
MEX UDIBONOS FRN 06-16.06.16 141,422 5,958,379 0.54MXN
MEXICO
5,958,379 0.54
5.6061,535,811TOTAL FLOATING RATE BONDS
CHINA HYDROEL /ADR 563,558 4,046,346 0.37USD
ADR (American Depositary Receipt)
CAYMAN ISLANDS
4,046,346 0.37
0.374,046,346TOTAL ADR (American Depositary Receipt)
ARGENTINA 1.33% 03-31.12.38 41,175,000 17,767,013 1.62USD
ASSET BACKED SECURITIES
ARGENTINA
17,767,013 1.62
BCO BMG 9.15% 05-15.01.16REG.S 1,175,000 1,242,867 0.11USD
BRAZIL
1,242,867 0.11
RUSSIA 7.50% 00-31.03.30REG/ST-UP 2,600,000 2,627,394 0.24USD
FEDERATION OF RUSSIA
2,627,394 0.24
GAZPROM INTL 7.201% 04-01.02.20 REG. 6,000,000 3,376,143 0.31USD
LUXEMBOURG
3,376,143 0.31
GEM Debt Total Return (Formerly New World Income)Statement of investments as at 31 March 2011(expressed in USD)
Description Currency Evaluation % netassets
Quantity/Facevalue
PETROLEOS 8.5% 10-02.11.17/ POOL 54,175,000 38,140,012 3.47USD
VENEZUELA
38,140,012 3.47
5.7563,153,429TOTAL ASSET BACKED SECURITIES
47.67TOTAL TRANSFERABLE SECURITIESADMITTED TO AN OFFICIAL STOCKEXCHANGE LISTING
523,732,438
PROV BUENOS 11.75% 10-05.10.15 2,900,000 3,005,044 0.27USD
TRANSFERABLE SECURITIES TRADED ON ANOTHER REGULATEDMARKET
BONDS
ARGENTINA
3,005,044 0.27
QTEL INT FIN 4.75% 10-16.02.21 5,800,000 5,412,137 0.49USD
BERMUDA ISLANDS
5,412,137 0.49
BANCO VOTO 4.25% 10-08.02.13 6,550,000 6,719,920 0.62USD
BRAZIL
BMG 6.5% 11-14.03.14 5,300,000 5,302,512 0.48USD
12,022,432 1.10
INDEP INTL 12% 09-30.12.16144A 4,214,406 105,360 0.01USD
CAYMAN ISLANDS
JBS FIN II 8.25% 10-29.01.18 2,050,000 2,114,011 0.19USD
PETBRA 5.75% 09-20.01.20 3,050,000 3,164,272 0.29USD
5,383,643 0.49
ECOPETROL 7.625% 09-23.07.19 2,750,000 3,185,861 0.29USD
COLOMBIA
3,185,861 0.29
VIP FINANCE 7.748% 11-02.02.21 6,500,000 6,823,440 0.62USD
IRELAND
6,823,440 0.62
ALESTRA 11.75% 10-11.08.14 3,325,000 3,874,396 0.35USD
MEXICO
Description Currency Evaluation % netassets
Quantity/Facevalue
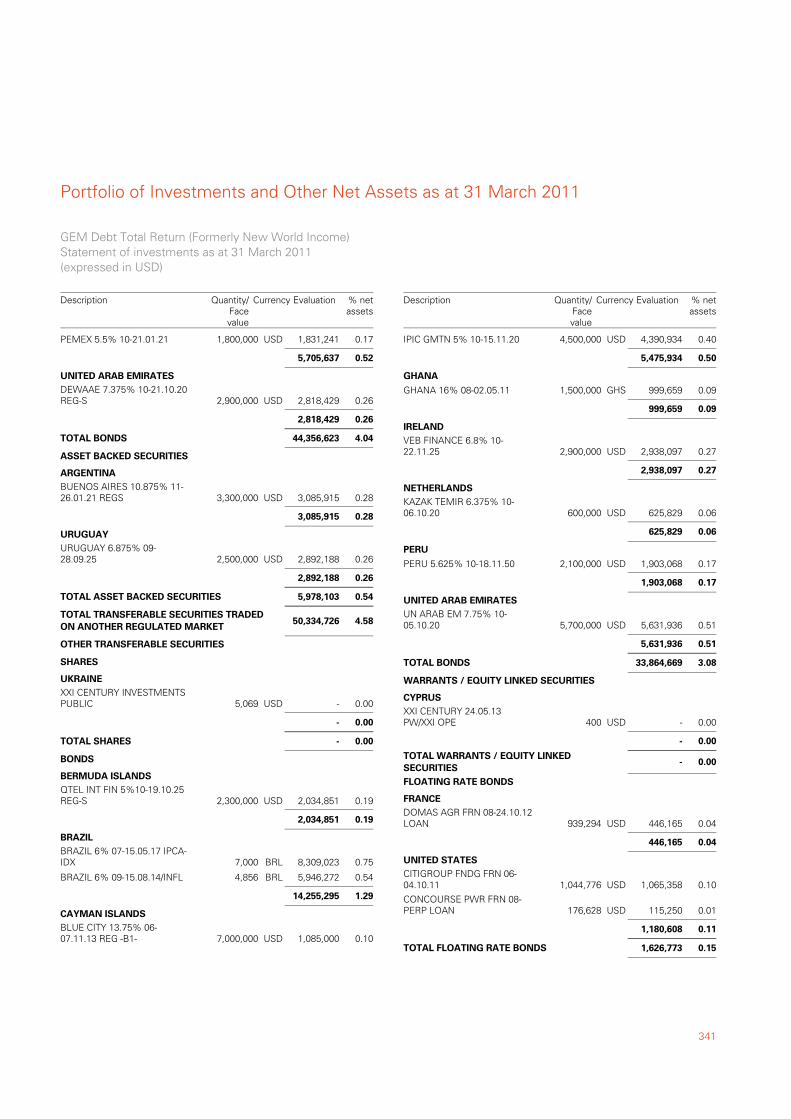
341
Portfolio of Investments and Other Net Assets as at 31 March 2011
PEMEX 5.5% 10-21.01.21 1,800,000 1,831,241 0.17USD
5,705,637 0.52
DEWAAE 7.375% 10-21.10.20REG-S 2,900,000 2,818,429 0.26USD
UNITED ARAB EMIRATES
2,818,429 0.26
4.0444,356,623TOTAL BONDS
BUENOS AIRES 10.875% 11-26.01.21 REGS 3,300,000 3,085,915 0.28USD
ASSET BACKED SECURITIES
ARGENTINA
3,085,915 0.28
URUGUAY 6.875% 09-28.09.25 2,500,000 2,892,188 0.26USD
URUGUAY
2,892,188 0.26
0.545,978,103TOTAL ASSET BACKED SECURITIES
4.58TOTAL TRANSFERABLE SECURITIES TRADEDON ANOTHER REGULATED MARKET
50,334,726
XXI CENTURY INVESTMENTSPUBLIC 5,069 - 0.00USD
OTHER TRANSFERABLE SECURITIES
SHARES
UKRAINE
- 0.00
0.00-TOTAL SHARES
QTEL INT FIN 5%10-19.10.25REG-S 2,300,000 2,034,851 0.19USD
BONDS
BERMUDA ISLANDS
2,034,851 0.19
BRAZIL 6% 07-15.05.17 IPCA-IDX 7,000 8,309,023 0.75BRL
BRAZIL
BRAZIL 6% 09-15.08.14/INFL 4,856 5,946,272 0.54BRL
14,255,295 1.29
BLUE CITY 13.75% 06-07.11.13 REG -B1- 7,000,000 1,085,000 0.10USD
CAYMAN ISLANDS
GEM Debt Total Return (Formerly New World Income)Statement of investments as at 31 March 2011(expressed in USD)
Description Currency Evaluation % netassets
Quantity/Facevalue
IPIC GMTN 5% 10-15.11.20 4,500,000 4,390,934 0.40USD
5,475,934 0.50
GHANA 16% 08-02.05.11 1,500,000 999,659 0.09GHS
GHANA
999,659 0.09
VEB FINANCE 6.8% 10-22.11.25 2,900,000 2,938,097 0.27USD
IRELAND
2,938,097 0.27
KAZAK TEMIR 6.375% 10-06.10.20 600,000 625,829 0.06USD
NETHERLANDS
625,829 0.06
PERU 5.625% 10-18.11.50 2,100,000 1,903,068 0.17USD
PERU
1,903,068 0.17
UN ARAB EM 7.75% 10-05.10.20 5,700,000 5,631,936 0.51USD
UNITED ARAB EMIRATES
5,631,936 0.51
3.0833,864,669TOTAL BONDS
XXI CENTURY 24.05.13PW/XXI OPE 400 - 0.00USD
WARRANTS / EQUITY LINKED SECURITIES
CYPRUS
- 0.00
0.00-TOTAL WARRANTS / EQUITY LINKEDSECURITIES
DOMAS AGR FRN 08-24.10.12LOAN 939,294 446,165 0.04USD
FLOATING RATE BONDS
FRANCE
446,165 0.04
CITIGROUP FNDG FRN 06-04.10.11 1,044,776 1,065,358 0.10USD
UNITED STATES
CONCOURSE PWR FRN 08-PERP LOAN 176,628 115,250 0.01USD
1,180,608 0.11
0.151,626,773TOTAL FLOATING RATE BONDS
Description Currency Evaluation % netassets
Quantity/Facevalue
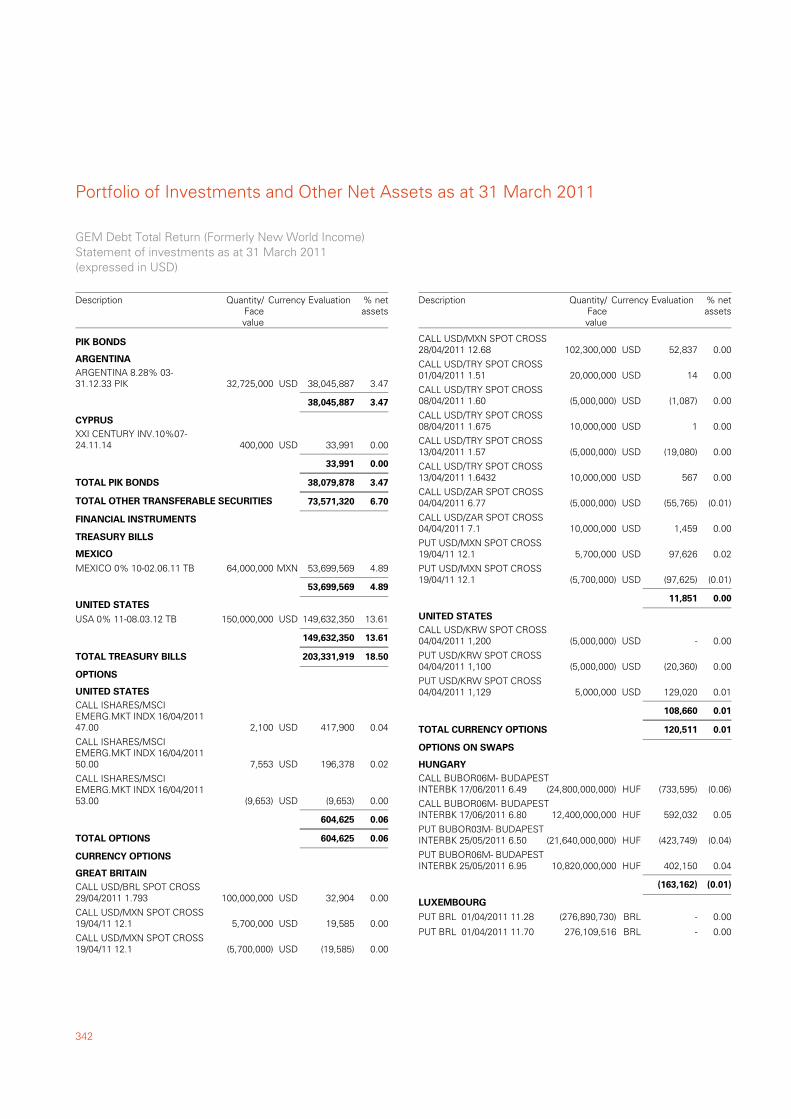
Portfolio of Investments and Other Net Assets as at 31 March 2011
342
ARGENTINA 8.28% 03-31.12.33 PIK 32,725,000 38,045,887 3.47USD
PIK BONDS
ARGENTINA
38,045,887 3.47
XXI CENTURY INV.10%07-24.11.14 400,000 33,991 0.00USD
CYPRUS
33,991 0.00
3.4738,079,878TOTAL PIK BONDS
6.70TOTAL OTHER TRANSFERABLE SECURITIES 73,571,320
MEXICO 0% 10-02.06.11 TB 64,000,000 53,699,569 4.89MXN
FINANCIAL INSTRUMENTS
TREASURY BILLS
MEXICO
53,699,569 4.89
USA 0% 11-08.03.12 TB 150,000,000 149,632,350 13.61USD
UNITED STATES
149,632,350 13.61
18.50203,331,919TOTAL TREASURY BILLS
CALL ISHARES/MSCIEMERG.MKT INDX 16/04/201147.00 2,100 417,900 0.04USD
OPTIONS
UNITED STATES
CALL ISHARES/MSCIEMERG.MKT INDX 16/04/201150.00 7,553 196,378 0.02USD
CALL ISHARES/MSCIEMERG.MKT INDX 16/04/201153.00 (9,653) (9,653) 0.00USD
604,625 0.06
0.06604,625TOTAL OPTIONS
CALL USD/BRL SPOT CROSS29/04/2011 1.793 100,000,000 32,904 0.00USD
CURRENCY OPTIONS
GREAT BRITAIN
CALL USD/MXN SPOT CROSS19/04/11 12.1 5,700,000 19,585 0.00USD
CALL USD/MXN SPOT CROSS19/04/11 12.1 (5,700,000) (19,585) 0.00USD
GEM Debt Total Return (Formerly New World Income)Statement of investments as at 31 March 2011(expressed in USD)
Description Currency Evaluation % netassets
Quantity/Facevalue
CALL USD/MXN SPOT CROSS28/04/2011 12.68 102,300,000 52,837 0.00USD
CALL USD/TRY SPOT CROSS01/04/2011 1.51 20,000,000 14 0.00USD
CALL USD/TRY SPOT CROSS08/04/2011 1.60 (5,000,000) (1,087) 0.00USD
CALL USD/TRY SPOT CROSS08/04/2011 1.675 10,000,000 1 0.00USD
CALL USD/TRY SPOT CROSS13/04/2011 1.57 (5,000,000) (19,080) 0.00USD
CALL USD/TRY SPOT CROSS13/04/2011 1.6432 10,000,000 567 0.00USD
CALL USD/ZAR SPOT CROSS04/04/2011 6.77 (5,000,000) (55,765) (0.01)USD
CALL USD/ZAR SPOT CROSS04/04/2011 7.1 10,000,000 1,459 0.00USD
PUT USD/MXN SPOT CROSS19/04/11 12.1 5,700,000 97,626 0.02USD
PUT USD/MXN SPOT CROSS19/04/11 12.1 (5,700,000) (97,625) (0.01)USD
11,851 0.00
CALL USD/KRW SPOT CROSS04/04/2011 1,200 (5,000,000) - 0.00USD
UNITED STATES
PUT USD/KRW SPOT CROSS04/04/2011 1,100 (5,000,000) (20,360) 0.00USD
PUT USD/KRW SPOT CROSS04/04/2011 1,129 5,000,000 129,020 0.01USD
108,660 0.01
0.01120,511TOTAL CURRENCY OPTIONS
CALL BUBOR06M- BUDAPESTINTERBK 17/06/2011 6.49 (24,800,000,000) (733,595) (0.06)HUF
OPTIONS ON SWAPS
HUNGARY
CALL BUBOR06M- BUDAPESTINTERBK 17/06/2011 6.80 12,400,000,000 592,032 0.05HUF
PUT BUBOR03M- BUDAPESTINTERBK 25/05/2011 6.50 (21,640,000,000) (423,749) (0.04)HUF
PUT BUBOR06M- BUDAPESTINTERBK 25/05/2011 6.95 10,820,000,000 402,150 0.04HUF
(163,162) (0.01)
PUT BRL 01/04/2011 11.28 (276,890,730) - 0.00BRL
LUXEMBOURG
PUT BRL 01/04/2011 11.70 276,109,516 - 0.00BRL
Description Currency Evaluation % netassets
Quantity/Facevalue
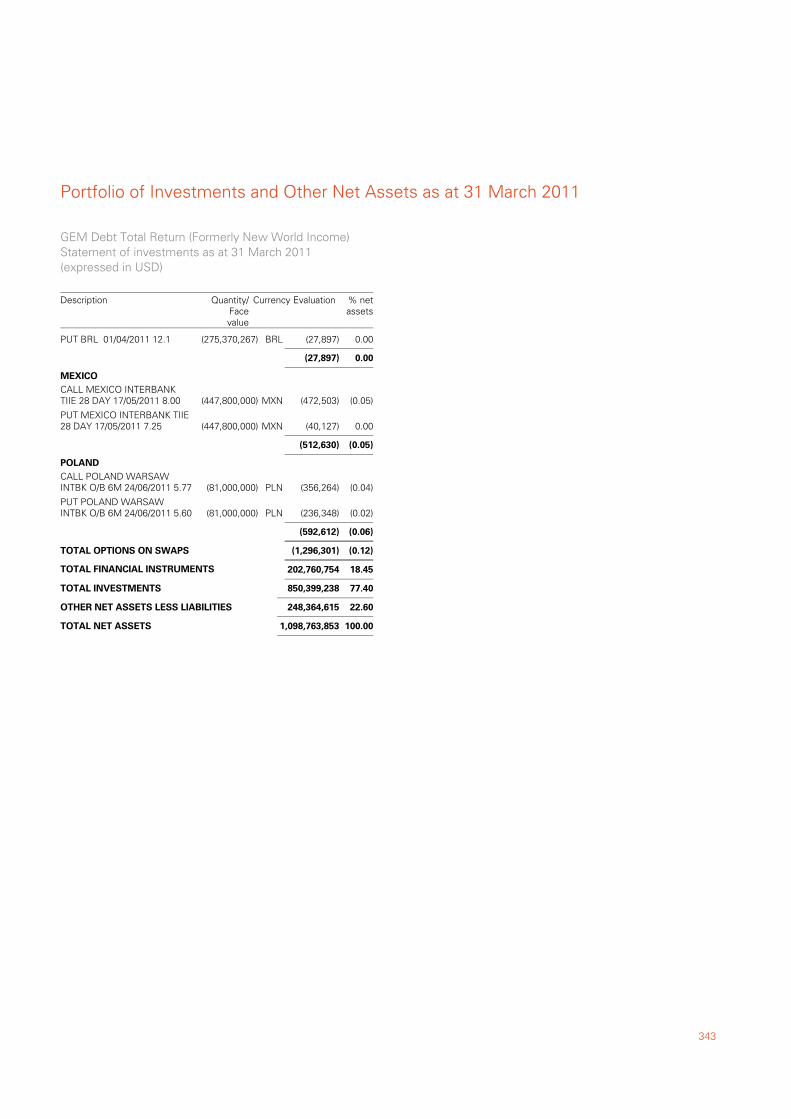
343
Portfolio of Investments and Other Net Assets as at 31 March 2011
PUT BRL 01/04/2011 12.1 (275,370,267) (27,897) 0.00BRL
(27,897) 0.00
CALL MEXICO INTERBANKTIIE 28 DAY 17/05/2011 8.00 (447,800,000) (472,503) (0.05)MXN
MEXICO
PUT MEXICO INTERBANK TIIE28 DAY 17/05/2011 7.25 (447,800,000) (40,127) 0.00MXN
(512,630) (0.05)
CALL POLAND WARSAWINTBK O/B 6M 24/06/2011 5.77 (81,000,000) (356,264) (0.04)PLN
POLAND
PUT POLAND WARSAWINTBK O/B 6M 24/06/2011 5.60 (81,000,000) (236,348) (0.02)PLN
(592,612) (0.06)
(0.12)(1,296,301)TOTAL OPTIONS ON SWAPS
18.45TOTAL FINANCIAL INSTRUMENTS 202,760,754
77.40TOTAL INVESTMENTS 850,399,238
22.60OTHER NET ASSETS LESS LIABILITIES 248,364,615
100.00TOTAL NET ASSETS 1,098,763,853
GEM Debt Total Return (Formerly New World Income)Statement of investments as at 31 March 2011(expressed in USD)
Description Currency Evaluation % netassets
Quantity/Facevalue
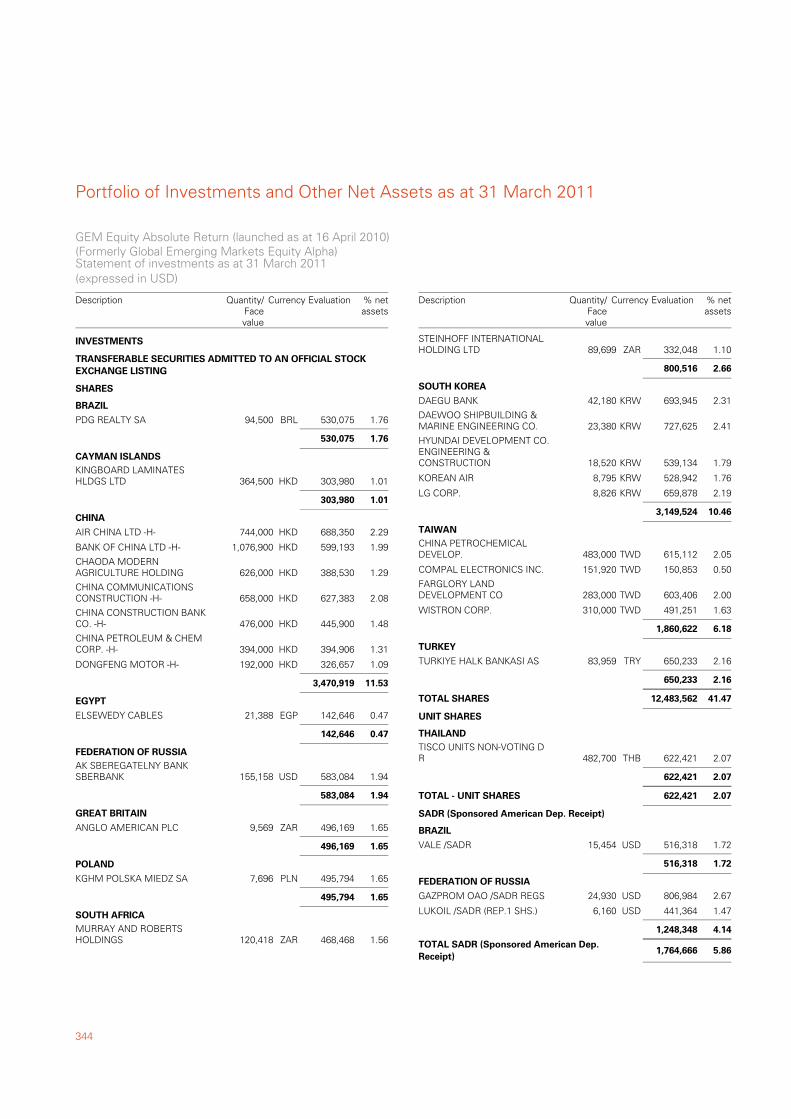
Portfolio of Investments and Other Net Assets as at 31 March 2011
344
PDG REALTY SA 94,500 530,075 1.76BRL
TRANSFERABLE SECURITIES ADMITTED TO AN OFFICIAL STOCKEXCHANGE LISTING
SHARES
BRAZIL
530,075 1.76
KINGBOARD LAMINATESHLDGS LTD 364,500 303,980 1.01HKD
CAYMAN ISLANDS
303,980 1.01
AIR CHINA LTD -H- 744,000 688,350 2.29HKD
CHINA
BANK OF CHINA LTD -H- 1,076,900 599,193 1.99HKD
CHAODA MODERNAGRICULTURE HOLDING 626,000 388,530 1.29HKD
CHINA COMMUNICATIONSCONSTRUCTION -H- 658,000 627,383 2.08HKD
CHINA CONSTRUCTION BANKCO. -H- 476,000 445,900 1.48HKD
CHINA PETROLEUM & CHEMCORP. -H- 394,000 394,906 1.31HKD
DONGFENG MOTOR -H- 192,000 326,657 1.09HKD
3,470,919 11.53
ELSEWEDY CABLES 21,388 142,646 0.47EGP
EGYPT
142,646 0.47
AK SBEREGATELNY BANKSBERBANK 155,158 583,084 1.94USD
FEDERATION OF RUSSIA
583,084 1.94
ANGLO AMERICAN PLC 9,569 496,169 1.65ZAR
GREAT BRITAIN
496,169 1.65
KGHM POLSKA MIEDZ SA 7,696 495,794 1.65PLN
POLAND
495,794 1.65
MURRAY AND ROBERTSHOLDINGS 120,418 468,468 1.56ZAR
SOUTH AFRICA
INVESTMENTS
GEM Equity Absolute Return (launched as at 16 April 2010)(Formerly Global Emerging Markets Equity Alpha)Statement of investments as at 31 March 2011(expressed in USD)
Description Currency Evaluation % netassets
Quantity/Facevalue
STEINHOFF INTERNATIONALHOLDING LTD 89,699 332,048 1.10ZAR
800,516 2.66
DAEGU BANK 42,180 693,945 2.31KRW
SOUTH KOREA
DAEWOO SHIPBUILDING &MARINE ENGINEERING CO. 23,380 727,625 2.41KRW
HYUNDAI DEVELOPMENT CO.ENGINEERING &CONSTRUCTION 18,520 539,134 1.79KRW
KOREAN AIR 8,795 528,942 1.76KRW
LG CORP. 8,826 659,878 2.19KRW
3,149,524 10.46
CHINA PETROCHEMICALDEVELOP. 483,000 615,112 2.05TWD
TAIWAN
COMPAL ELECTRONICS INC. 151,920 150,853 0.50TWD
FARGLORY LANDDEVELOPMENT CO 283,000 603,406 2.00TWD
WISTRON CORP. 310,000 491,251 1.63TWD
1,860,622 6.18
TURKIYE HALK BANKASI AS 83,959 650,233 2.16TRY
TURKEY
650,233 2.16
41.4712,483,562TOTAL SHARES
TISCO UNITS NON-VOTING DR 482,700 622,421 2.07THB
UNIT SHARES
THAILAND
622,421 2.07
2.07622,421TOTAL - UNIT SHARES
VALE /SADR 15,454 516,318 1.72USD
SADR (Sponsored American Dep. Receipt)
BRAZIL
516,318 1.72
GAZPROM OAO /SADR REGS 24,930 806,984 2.67USD
FEDERATION OF RUSSIA
LUKOIL /SADR (REP.1 SHS.) 6,160 441,364 1.47USD
1,248,348 4.14
5.861,764,666TOTAL SADR (Sponsored American Dep.Receipt)
Description Currency Evaluation % netassets
Quantity/Facevalue
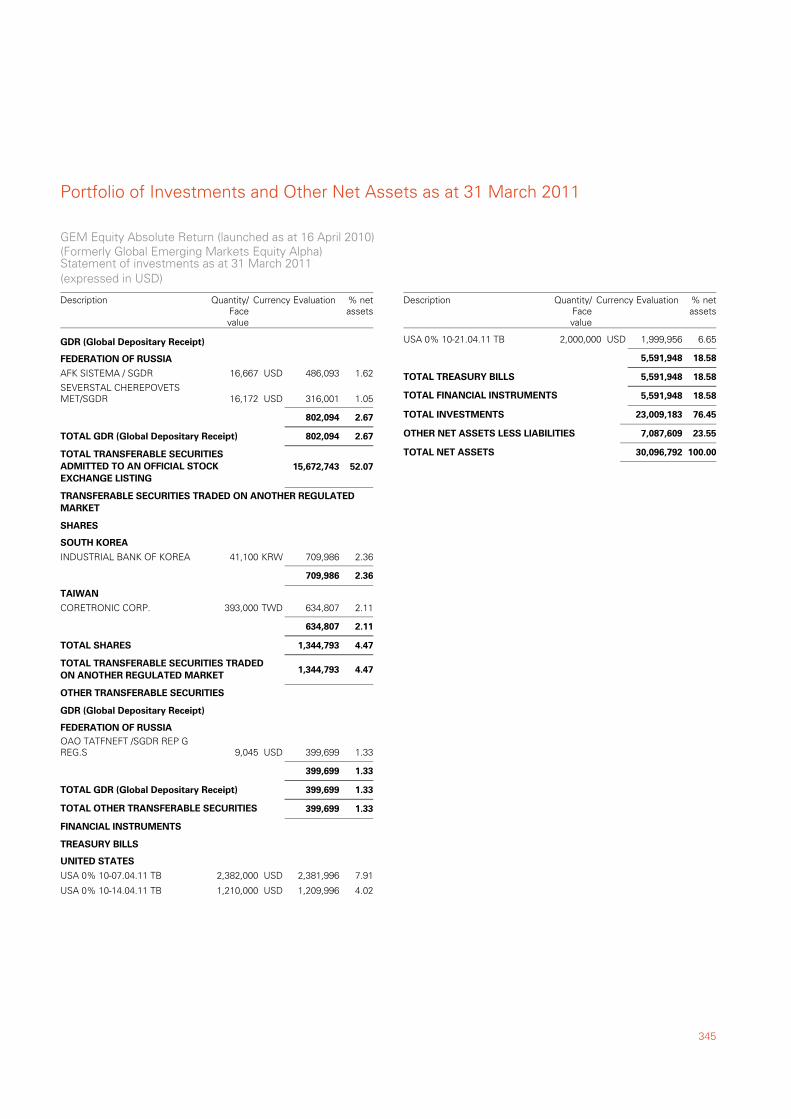
345
Portfolio of Investments and Other Net Assets as at 31 March 2011
AFK SISTEMA / SGDR 16,667 486,093 1.62USD
GDR (Global Depositary Receipt)
FEDERATION OF RUSSIA
SEVERSTAL CHEREPOVETSMET/SGDR 16,172 316,001 1.05USD
802,094 2.67
2.67802,094TOTAL GDR (Global Depositary Receipt)
52.07TOTAL TRANSFERABLE SECURITIESADMITTED TO AN OFFICIAL STOCKEXCHANGE LISTING
15,672,743
INDUSTRIAL BANK OF KOREA 41,100 709,986 2.36KRW
TRANSFERABLE SECURITIES TRADED ON ANOTHER REGULATEDMARKET
SHARES
SOUTH KOREA
709,986 2.36
CORETRONIC CORP. 393,000 634,807 2.11TWD
TAIWAN
634,807 2.11
4.471,344,793TOTAL SHARES
4.47TOTAL TRANSFERABLE SECURITIES TRADEDON ANOTHER REGULATED MARKET
1,344,793
OAO TATFNEFT /SGDR REP GREG.S 9,045 399,699 1.33USD
OTHER TRANSFERABLE SECURITIES
GDR (Global Depositary Receipt)
FEDERATION OF RUSSIA
399,699 1.33
1.33399,699TOTAL GDR (Global Depositary Receipt)
1.33TOTAL OTHER TRANSFERABLE SECURITIES 399,699
USA 0% 10-07.04.11 TB 2,382,000 2,381,996 7.91USD
FINANCIAL INSTRUMENTS
TREASURY BILLS
UNITED STATES
USA 0% 10-14.04.11 TB 1,210,000 1,209,996 4.02USD
GEM Equity Absolute Return (launched as at 16 April 2010)(Formerly Global Emerging Markets Equity Alpha)Statement of investments as at 31 March 2011(expressed in USD)
Description Currency Evaluation % netassets
Quantity/Facevalue
USA 0% 10-21.04.11 TB 2,000,000 1,999,956 6.65USD
5,591,948 18.58
18.585,591,948TOTAL TREASURY BILLS
18.58TOTAL FINANCIAL INSTRUMENTS 5,591,948
76.45TOTAL INVESTMENTS 23,009,183
23.55OTHER NET ASSETS LESS LIABILITIES 7,087,609
100.00TOTAL NET ASSETS 30,096,792
Description Currency Evaluation % netassets
Quantity/Facevalue
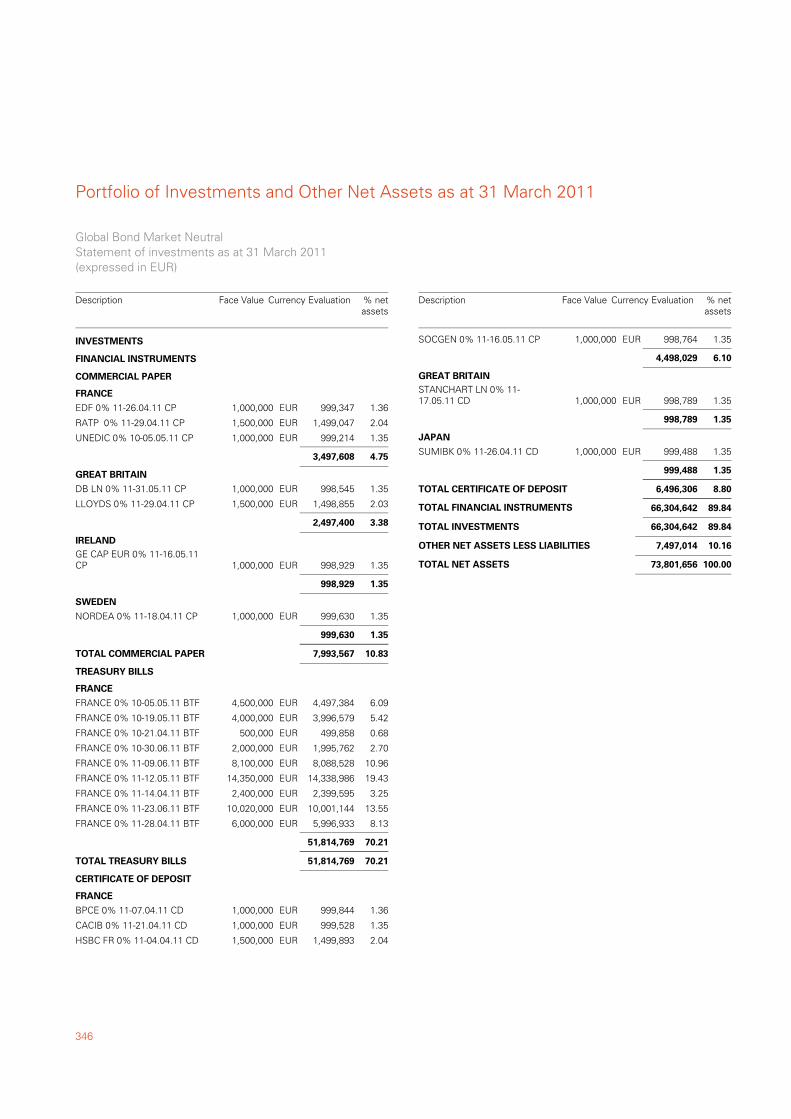
Portfolio of Investments and Other Net Assets as at 31 March 2011
346
EDF 0% 11-26.04.11 CP 1,000,000 999,347 1.36EUR
FINANCIAL INSTRUMENTS
COMMERCIAL PAPER
FRANCE
RATP 0% 11-29.04.11 CP 1,500,000 1,499,047 2.04EUR
UNEDIC 0% 10-05.05.11 CP 1,000,000 999,214 1.35EUR
3,497,608 4.75
DB LN 0% 11-31.05.11 CP 1,000,000 998,545 1.35EUR
GREAT BRITAIN
LLOYDS 0% 11-29.04.11 CP 1,500,000 1,498,855 2.03EUR
2,497,400 3.38
GE CAP EUR 0% 11-16.05.11CP 1,000,000 998,929 1.35EUR
IRELAND
998,929 1.35
NORDEA 0% 11-18.04.11 CP 1,000,000 999,630 1.35EUR
SWEDEN
999,630 1.35
10.837,993,567TOTAL COMMERCIAL PAPER
FRANCE 0% 10-05.05.11 BTF 4,500,000 4,497,384 6.09EUR
TREASURY BILLS
FRANCE
FRANCE 0% 10-19.05.11 BTF 4,000,000 3,996,579 5.42EUR
FRANCE 0% 10-21.04.11 BTF 500,000 499,858 0.68EUR
FRANCE 0% 10-30.06.11 BTF 2,000,000 1,995,762 2.70EUR
FRANCE 0% 11-09.06.11 BTF 8,100,000 8,088,528 10.96EUR
FRANCE 0% 11-12.05.11 BTF 14,350,000 14,338,986 19.43EUR
FRANCE 0% 11-14.04.11 BTF 2,400,000 2,399,595 3.25EUR
FRANCE 0% 11-23.06.11 BTF 10,020,000 10,001,144 13.55EUR
FRANCE 0% 11-28.04.11 BTF 6,000,000 5,996,933 8.13EUR
51,814,769 70.21
70.2151,814,769TOTAL TREASURY BILLS
BPCE 0% 11-07.04.11 CD 1,000,000 999,844 1.36EUR
CERTIFICATE OF DEPOSIT
FRANCE
CACIB 0% 11-21.04.11 CD 1,000,000 999,528 1.35EUR
HSBC FR 0% 11-04.04.11 CD 1,500,000 1,499,893 2.04EUR
INVESTMENTS
Global Bond Market NeutralStatement of investments as at 31 March 2011(expressed in EUR)
Description Currency Evaluation % netassets
Face Value
SOCGEN 0% 11-16.05.11 CP 1,000,000 998,764 1.35EUR
4,498,029 6.10
STANCHART LN 0% 11-17.05.11 CD 1,000,000 998,789 1.35EUR
GREAT BRITAIN
998,789 1.35
SUMIBK 0% 11-26.04.11 CD 1,000,000 999,488 1.35EUR
JAPAN
999,488 1.35
8.806,496,306TOTAL CERTIFICATE OF DEPOSIT
89.84TOTAL FINANCIAL INSTRUMENTS 66,304,642
89.84TOTAL INVESTMENTS 66,304,642
10.16OTHER NET ASSETS LESS LIABILITIES 7,497,014
100.00TOTAL NET ASSETS 73,801,656
Description Currency Evaluation % netassets
Face Value
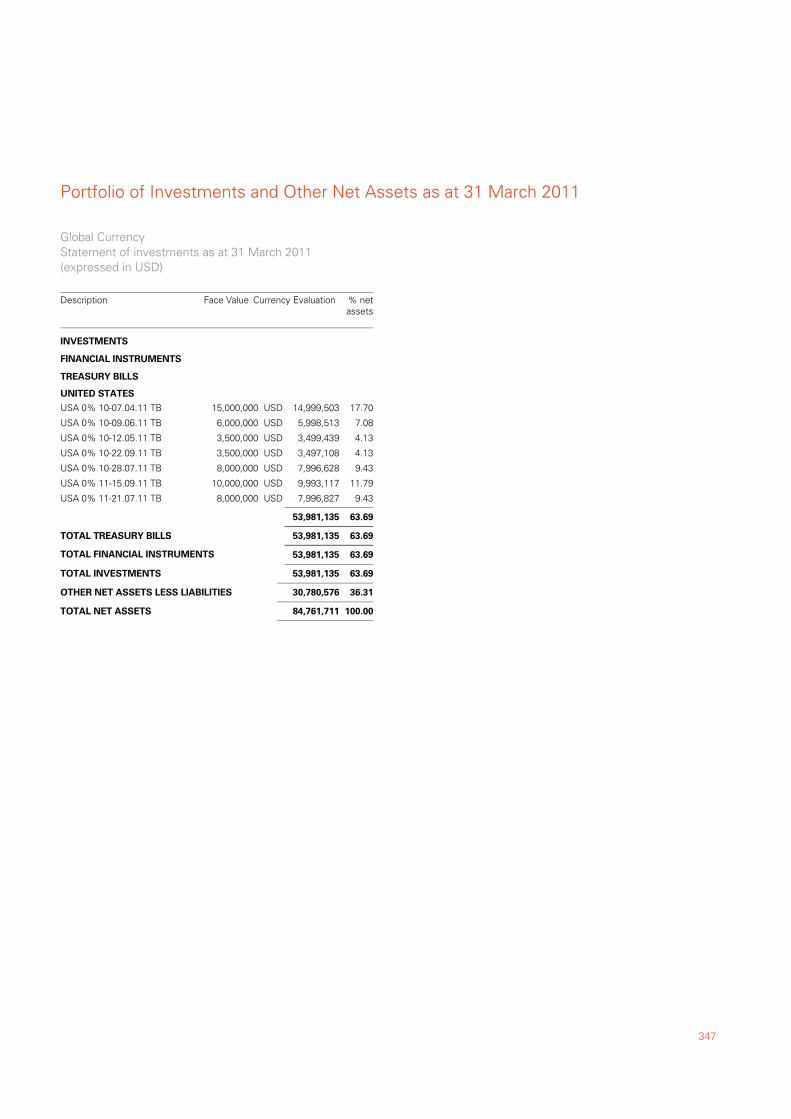
347
Portfolio of Investments and Other Net Assets as at 31 March 2011
USA 0% 10-07.04.11 TB 15,000,000 14,999,503 17.70USD
FINANCIAL INSTRUMENTS
TREASURY BILLS
UNITED STATES
USA 0% 10-09.06.11 TB 6,000,000 5,998,513 7.08USD
USA 0% 10-12.05.11 TB 3,500,000 3,499,439 4.13USD
USA 0% 10-22.09.11 TB 3,500,000 3,497,108 4.13USD
USA 0% 10-28.07.11 TB 8,000,000 7,996,628 9.43USD
USA 0% 11-15.09.11 TB 10,000,000 9,993,117 11.79USD
USA 0% 11-21.07.11 TB 8,000,000 7,996,827 9.43USD
53,981,135 63.69
63.6953,981,135TOTAL TREASURY BILLS
63.69TOTAL FINANCIAL INSTRUMENTS 53,981,135
63.69TOTAL INVESTMENTS 53,981,135
36.31OTHER NET ASSETS LESS LIABILITIES 30,780,576
100.00TOTAL NET ASSETS 84,761,711
INVESTMENTS
Global CurrencyStatement of investments as at 31 March 2011(expressed in USD)
Description Currency Evaluation % netassets
Face Value
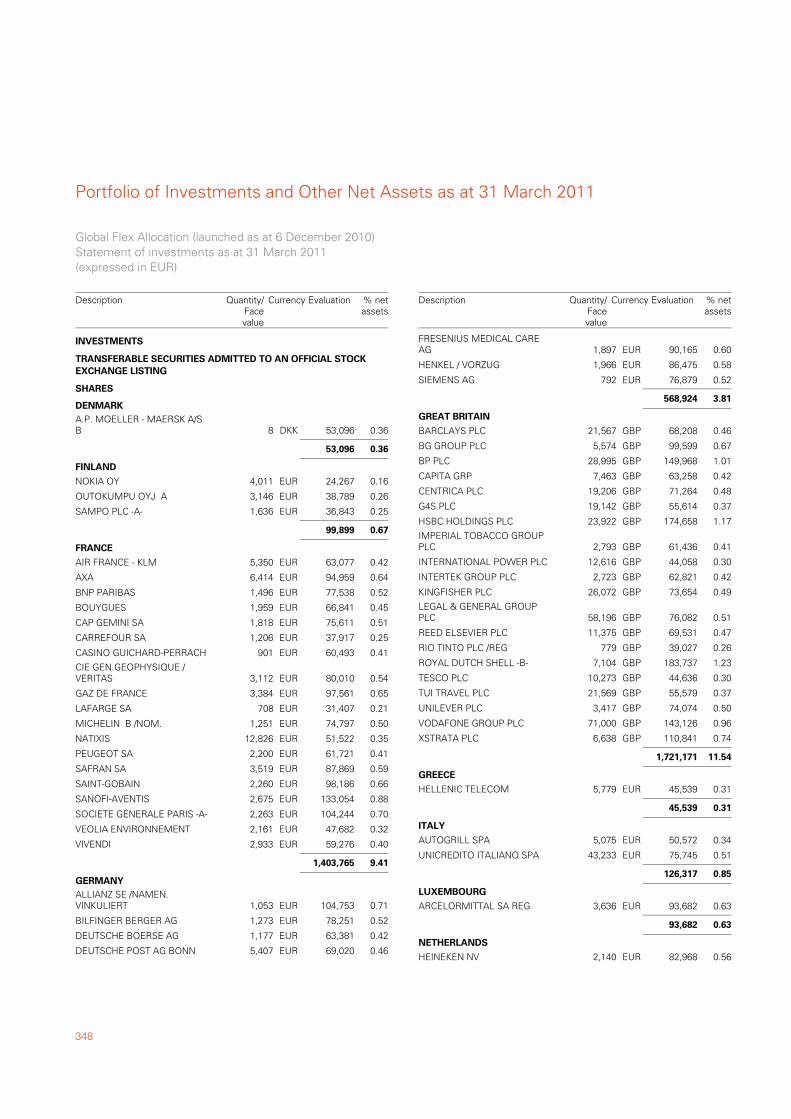
Portfolio of Investments and Other Net Assets as at 31 March 2011
348
A.P. MOELLER - MAERSK A/SB 8 53,096 0.36DKK
TRANSFERABLE SECURITIES ADMITTED TO AN OFFICIAL STOCKEXCHANGE LISTING
SHARES
DENMARK
53,096 0.36
NOKIA OY 4,011 24,267 0.16EUR
FINLAND
OUTOKUMPU OYJ A 3,146 38,789 0.26EUR
SAMPO PLC -A- 1,636 36,843 0.25EUR
99,899 0.67
AIR FRANCE - KLM 5,350 63,077 0.42EUR
FRANCE
AXA 6,414 94,959 0.64EUR
BNP PARIBAS 1,496 77,538 0.52EUR
BOUYGUES 1,959 66,841 0.45EUR
CAP GEMINI SA 1,818 75,611 0.51EUR
CARREFOUR SA 1,206 37,917 0.25EUR
CASINO GUICHARD-PERRACH 901 60,493 0.41EUR
CIE GEN.GEOPHYSIQUE /VERITAS 3,112 80,010 0.54EUR
GAZ DE FRANCE 3,384 97,561 0.65EUR
LAFARGE SA 708 31,407 0.21EUR
MICHELIN B /NOM. 1,251 74,797 0.50EUR
NATIXIS 12,826 51,522 0.35EUR
PEUGEOT SA 2,200 61,721 0.41EUR
SAFRAN SA 3,519 87,869 0.59EUR
SAINT-GOBAIN 2,260 98,186 0.66EUR
SANOFI-AVENTIS 2,675 133,054 0.88EUR
SOCIETE GENERALE PARIS -A- 2,263 104,244 0.70EUR
VEOLIA ENVIRONNEMENT 2,161 47,682 0.32EUR
VIVENDI 2,933 59,276 0.40EUR
1,403,765 9.41
ALLIANZ SE /NAMEN.VINKULIERT 1,053 104,753 0.71EUR
GERMANY
BILFINGER BERGER AG 1,273 78,251 0.52EUR
DEUTSCHE BOERSE AG 1,177 63,381 0.42EUR
DEUTSCHE POST AG BONN 5,407 69,020 0.46EUR
INVESTMENTS
Global Flex Allocation (launched as at 6 December 2010)Statement of investments as at 31 March 2011(expressed in EUR)
Description Currency Evaluation % netassets
Quantity/Facevalue
FRESENIUS MEDICAL CAREAG 1,897 90,165 0.60EUR
HENKEL / VORZUG 1,966 86,475 0.58EUR
SIEMENS AG 792 76,879 0.52EUR
568,924 3.81
BARCLAYS PLC 21,567 68,208 0.46GBP
GREAT BRITAIN
BG GROUP PLC 5,574 99,599 0.67GBP
BP PLC 28,995 149,968 1.01GBP
CAPITA GRP 7,463 63,258 0.42GBP
CENTRICA PLC 19,206 71,264 0.48GBP
G4S PLC 19,142 55,614 0.37GBP
HSBC HOLDINGS PLC 23,922 174,658 1.17GBP
IMPERIAL TOBACCO GROUPPLC 2,793 61,436 0.41GBP
INTERNATIONAL POWER PLC 12,616 44,058 0.30GBP
INTERTEK GROUP PLC 2,723 62,821 0.42GBP
KINGFISHER PLC 26,072 73,654 0.49GBP
LEGAL & GENERAL GROUPPLC 58,196 76,082 0.51GBP
REED ELSEVIER PLC 11,375 69,531 0.47GBP
RIO TINTO PLC /REG 779 39,027 0.26GBP
ROYAL DUTCH SHELL -B- 7,104 183,737 1.23GBP
TESCO PLC 10,273 44,636 0.30GBP
TUI TRAVEL PLC 21,569 55,579 0.37GBP
UNILEVER PLC 3,417 74,074 0.50GBP
VODAFONE GROUP PLC 71,000 143,126 0.96GBP
XSTRATA PLC 6,638 110,841 0.74GBP
1,721,171 11.54
HELLENIC TELECOM 5,779 45,539 0.31EUR
GREECE
45,539 0.31
AUTOGRILL SPA 5,075 50,572 0.34EUR
ITALY
UNICREDITO ITALIANO SPA 43,233 75,745 0.51EUR
126,317 0.85
ARCELORMITTAL SA REG 3,636 93,682 0.63EUR
LUXEMBOURG
93,682 0.63
HEINEKEN NV 2,140 82,968 0.56EUR
NETHERLANDS
Description Currency Evaluation % netassets
Quantity/Facevalue
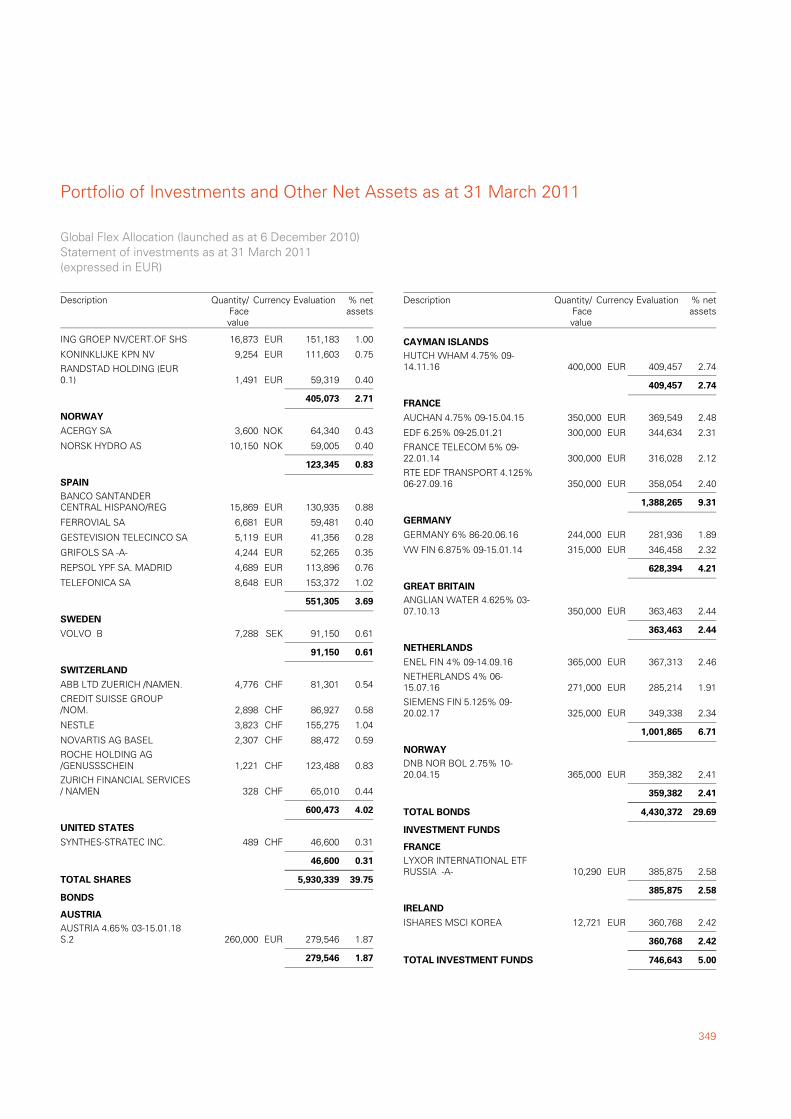
349
Portfolio of Investments and Other Net Assets as at 31 March 2011
ING GROEP NV/CERT.OF SHS 16,873 151,183 1.00EUR
KONINKLIJKE KPN NV 9,254 111,603 0.75EUR
RANDSTAD HOLDING (EUR0.1) 1,491 59,319 0.40EUR
405,073 2.71
ACERGY SA 3,600 64,340 0.43NOK
NORWAY
NORSK HYDRO AS 10,150 59,005 0.40NOK
123,345 0.83
BANCO SANTANDERCENTRAL HISPANO/REG 15,869 130,935 0.88EUR
SPAIN
FERROVIAL SA 6,681 59,481 0.40EUR
GESTEVISION TELECINCO SA 5,119 41,356 0.28EUR
GRIFOLS SA -A- 4,244 52,265 0.35EUR
REPSOL YPF SA. MADRID 4,689 113,896 0.76EUR
TELEFONICA SA 8,648 153,372 1.02EUR
551,305 3.69
VOLVO B 7,288 91,150 0.61SEK
SWEDEN
91,150 0.61
ABB LTD ZUERICH /NAMEN. 4,776 81,301 0.54CHF
SWITZERLAND
CREDIT SUISSE GROUP/NOM. 2,898 86,927 0.58CHF
NESTLE 3,823 155,275 1.04CHF
NOVARTIS AG BASEL 2,307 88,472 0.59CHF
ROCHE HOLDING AG/GENUSSSCHEIN 1,221 123,488 0.83CHF
ZURICH FINANCIAL SERVICES/ NAMEN 328 65,010 0.44CHF
600,473 4.02
SYNTHES-STRATEC INC. 489 46,600 0.31CHF
UNITED STATES
46,600 0.31
39.755,930,339TOTAL SHARES
AUSTRIA 4.65% 03-15.01.18S.2 260,000 279,546 1.87EUR
BONDS
AUSTRIA
279,546 1.87
Global Flex Allocation (launched as at 6 December 2010)Statement of investments as at 31 March 2011(expressed in EUR)
Description Currency Evaluation % netassets
Quantity/Facevalue
HUTCH WHAM 4.75% 09-14.11.16 400,000 409,457 2.74EUR
CAYMAN ISLANDS
409,457 2.74
AUCHAN 4.75% 09-15.04.15 350,000 369,549 2.48EUR
FRANCE
EDF 6.25% 09-25.01.21 300,000 344,634 2.31EUR
FRANCE TELECOM 5% 09-22.01.14 300,000 316,028 2.12EUR
RTE EDF TRANSPORT 4.125%06-27.09.16 350,000 358,054 2.40EUR
1,388,265 9.31
GERMANY 6% 86-20.06.16 244,000 281,936 1.89EUR
GERMANY
VW FIN 6.875% 09-15.01.14 315,000 346,458 2.32EUR
628,394 4.21
ANGLIAN WATER 4.625% 03-07.10.13 350,000 363,463 2.44EUR
GREAT BRITAIN
363,463 2.44
ENEL FIN 4% 09-14.09.16 365,000 367,313 2.46EUR
NETHERLANDS
NETHERLANDS 4% 06-15.07.16 271,000 285,214 1.91EUR
SIEMENS FIN 5.125% 09-20.02.17 325,000 349,338 2.34EUR
1,001,865 6.71
DNB NOR BOL 2.75% 10-20.04.15 365,000 359,382 2.41EUR
NORWAY
359,382 2.41
29.694,430,372TOTAL BONDS
LYXOR INTERNATIONAL ETFRUSSIA -A- 10,290 385,875 2.58EUR
INVESTMENT FUNDS
FRANCE
385,875 2.58
ISHARES MSCI KOREA 12,721 360,768 2.42EUR
IRELAND
360,768 2.42
5.00746,643TOTAL INVESTMENT FUNDS
Description Currency Evaluation % netassets
Quantity/Facevalue
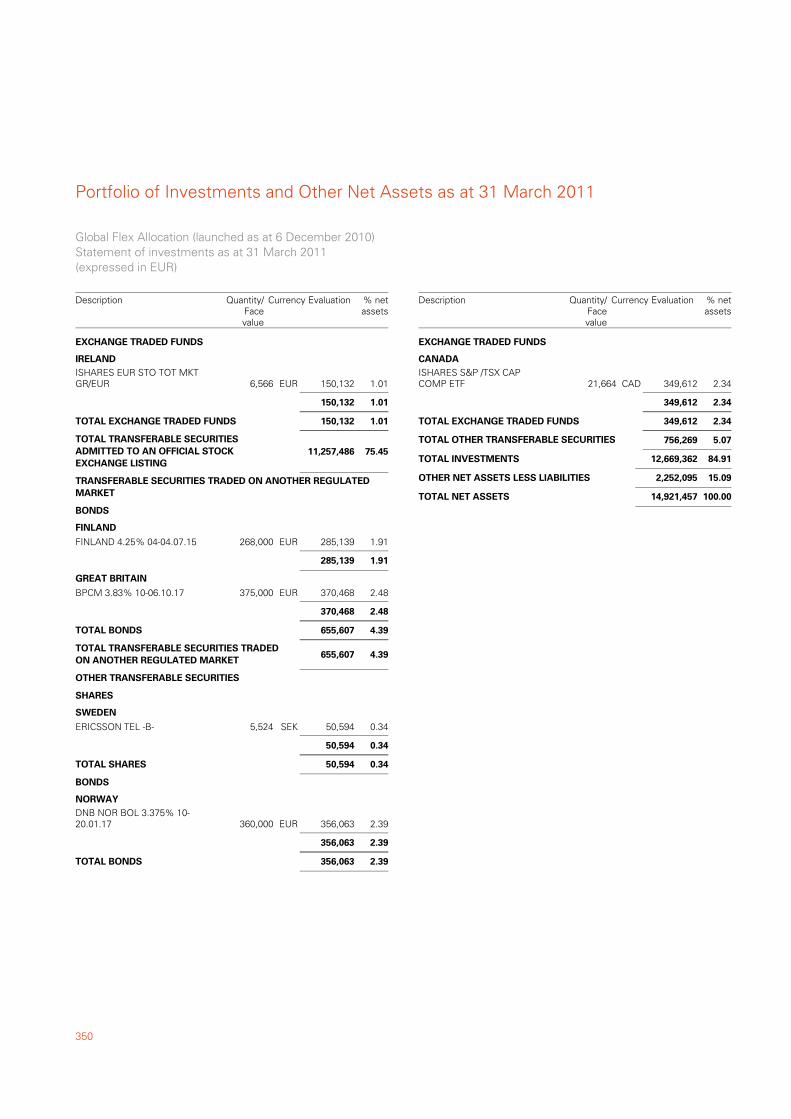
Portfolio of Investments and Other Net Assets as at 31 March 2011
350
ISHARES EUR STO TOT MKTGR/EUR 6,566 150,132 1.01EUR
EXCHANGE TRADED FUNDS
IRELAND
150,132 1.01
1.01150,132TOTAL EXCHANGE TRADED FUNDS
75.45TOTAL TRANSFERABLE SECURITIESADMITTED TO AN OFFICIAL STOCKEXCHANGE LISTING
11,257,486
FINLAND 4.25% 04-04.07.15 268,000 285,139 1.91EUR
TRANSFERABLE SECURITIES TRADED ON ANOTHER REGULATEDMARKET
BONDS
FINLAND
285,139 1.91
BPCM 3.83% 10-06.10.17 375,000 370,468 2.48EUR
GREAT BRITAIN
370,468 2.48
4.39655,607TOTAL BONDS
4.39TOTAL TRANSFERABLE SECURITIES TRADEDON ANOTHER REGULATED MARKET
655,607
ERICSSON TEL -B- 5,524 50,594 0.34SEK
OTHER TRANSFERABLE SECURITIES
SHARES
SWEDEN
50,594 0.34
0.3450,594TOTAL SHARES
DNB NOR BOL 3.375% 10-20.01.17 360,000 356,063 2.39EUR
BONDS
NORWAY
356,063 2.39
2.39356,063TOTAL BONDS
Global Flex Allocation (launched as at 6 December 2010)Statement of investments as at 31 March 2011(expressed in EUR)
Description Currency Evaluation % netassets
Quantity/Facevalue
ISHARES S&P /TSX CAPCOMP ETF 21,664 349,612 2.34CAD
EXCHANGE TRADED FUNDS
CANADA
349,612 2.34
2.34349,612TOTAL EXCHANGE TRADED FUNDS
5.07TOTAL OTHER TRANSFERABLE SECURITIES 756,269
84.91TOTAL INVESTMENTS 12,669,362
15.09OTHER NET ASSETS LESS LIABILITIES 2,252,095
100.00TOTAL NET ASSETS 14,921,457
Description Currency Evaluation % netassets
Quantity/Facevalue
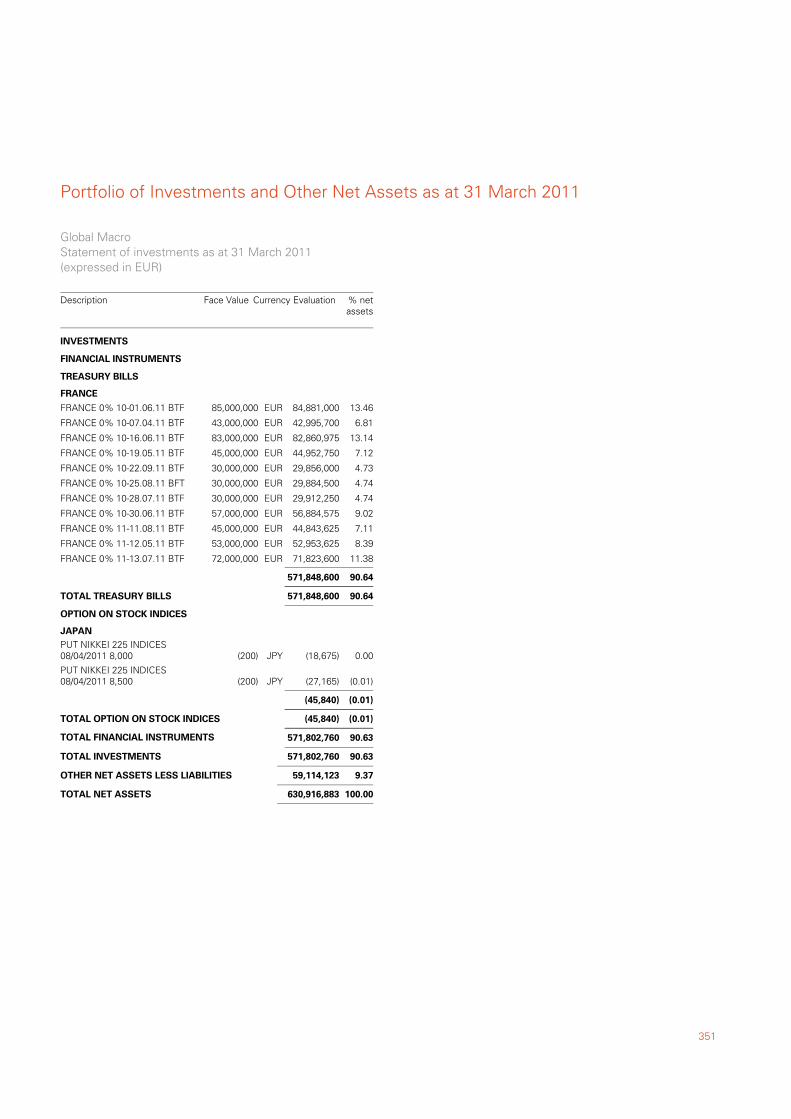
351
Portfolio of Investments and Other Net Assets as at 31 March 2011
FRANCE 0% 10-01.06.11 BTF 85,000,000 84,881,000 13.46EUR
FINANCIAL INSTRUMENTS
TREASURY BILLS
FRANCE
FRANCE 0% 10-07.04.11 BTF 43,000,000 42,995,700 6.81EUR
FRANCE 0% 10-16.06.11 BTF 83,000,000 82,860,975 13.14EUR
FRANCE 0% 10-19.05.11 BTF 45,000,000 44,952,750 7.12EUR
FRANCE 0% 10-22.09.11 BTF 30,000,000 29,856,000 4.73EUR
FRANCE 0% 10-25.08.11 BFT 30,000,000 29,884,500 4.74EUR
FRANCE 0% 10-28.07.11 BTF 30,000,000 29,912,250 4.74EUR
FRANCE 0% 10-30.06.11 BTF 57,000,000 56,884,575 9.02EUR
FRANCE 0% 11-11.08.11 BTF 45,000,000 44,843,625 7.11EUR
FRANCE 0% 11-12.05.11 BTF 53,000,000 52,953,625 8.39EUR
FRANCE 0% 11-13.07.11 BTF 72,000,000 71,823,600 11.38EUR
571,848,600 90.64
90.64571,848,600TOTAL TREASURY BILLS
PUT NIKKEI 225 INDICES08/04/2011 8,000 (200) (18,675) 0.00JPY
OPTION ON STOCK INDICES
JAPAN
PUT NIKKEI 225 INDICES08/04/2011 8,500 (200) (27,165) (0.01)JPY
(45,840) (0.01)
(0.01)(45,840)TOTAL OPTION ON STOCK INDICES
90.63TOTAL FINANCIAL INSTRUMENTS 571,802,760
90.63TOTAL INVESTMENTS 571,802,760
9.37OTHER NET ASSETS LESS LIABILITIES 59,114,123
100.00TOTAL NET ASSETS 630,916,883
INVESTMENTS
Global MacroStatement of investments as at 31 March 2011(expressed in EUR)
Description Currency Evaluation % netassets
Face Value
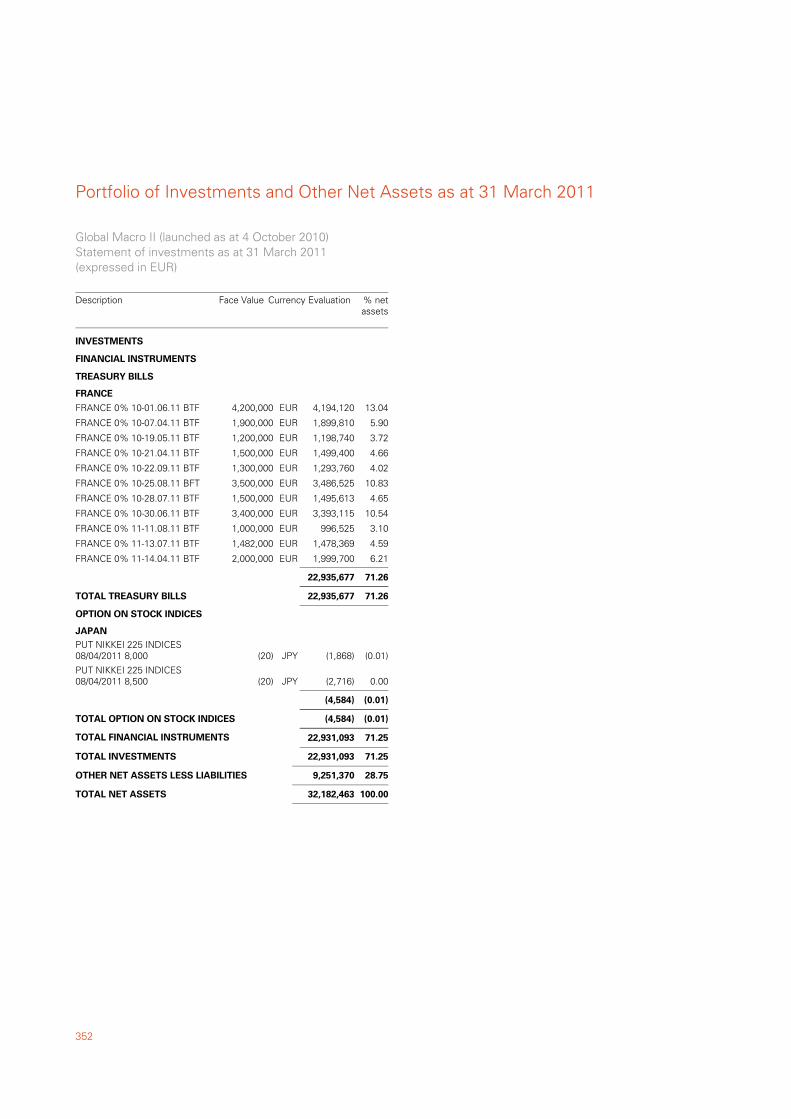
Portfolio of Investments and Other Net Assets as at 31 March 2011
352
FRANCE 0% 10-01.06.11 BTF 4,200,000 4,194,120 13.04EUR
FINANCIAL INSTRUMENTS
TREASURY BILLS
FRANCE
FRANCE 0% 10-07.04.11 BTF 1,900,000 1,899,810 5.90EUR
FRANCE 0% 10-19.05.11 BTF 1,200,000 1,198,740 3.72EUR
FRANCE 0% 10-21.04.11 BTF 1,500,000 1,499,400 4.66EUR
FRANCE 0% 10-22.09.11 BTF 1,300,000 1,293,760 4.02EUR
FRANCE 0% 10-25.08.11 BFT 3,500,000 3,486,525 10.83EUR
FRANCE 0% 10-28.07.11 BTF 1,500,000 1,495,613 4.65EUR
FRANCE 0% 10-30.06.11 BTF 3,400,000 3,393,115 10.54EUR
FRANCE 0% 11-11.08.11 BTF 1,000,000 996,525 3.10EUR
FRANCE 0% 11-13.07.11 BTF 1,482,000 1,478,369 4.59EUR
FRANCE 0% 11-14.04.11 BTF 2,000,000 1,999,700 6.21EUR
22,935,677 71.26
71.2622,935,677TOTAL TREASURY BILLS
PUT NIKKEI 225 INDICES08/04/2011 8,000 (20) (1,868) (0.01)JPY
OPTION ON STOCK INDICES
JAPAN
PUT NIKKEI 225 INDICES08/04/2011 8,500 (20) (2,716) 0.00JPY
(4,584) (0.01)
(0.01)(4,584)TOTAL OPTION ON STOCK INDICES
71.25TOTAL FINANCIAL INSTRUMENTS 22,931,093
71.25TOTAL INVESTMENTS 22,931,093
28.75OTHER NET ASSETS LESS LIABILITIES 9,251,370
100.00TOTAL NET ASSETS 32,182,463
INVESTMENTS
Global Macro II (launched as at 4 October 2010)Statement of investments as at 31 March 2011(expressed in EUR)
Description Currency Evaluation % netassets
Face Value
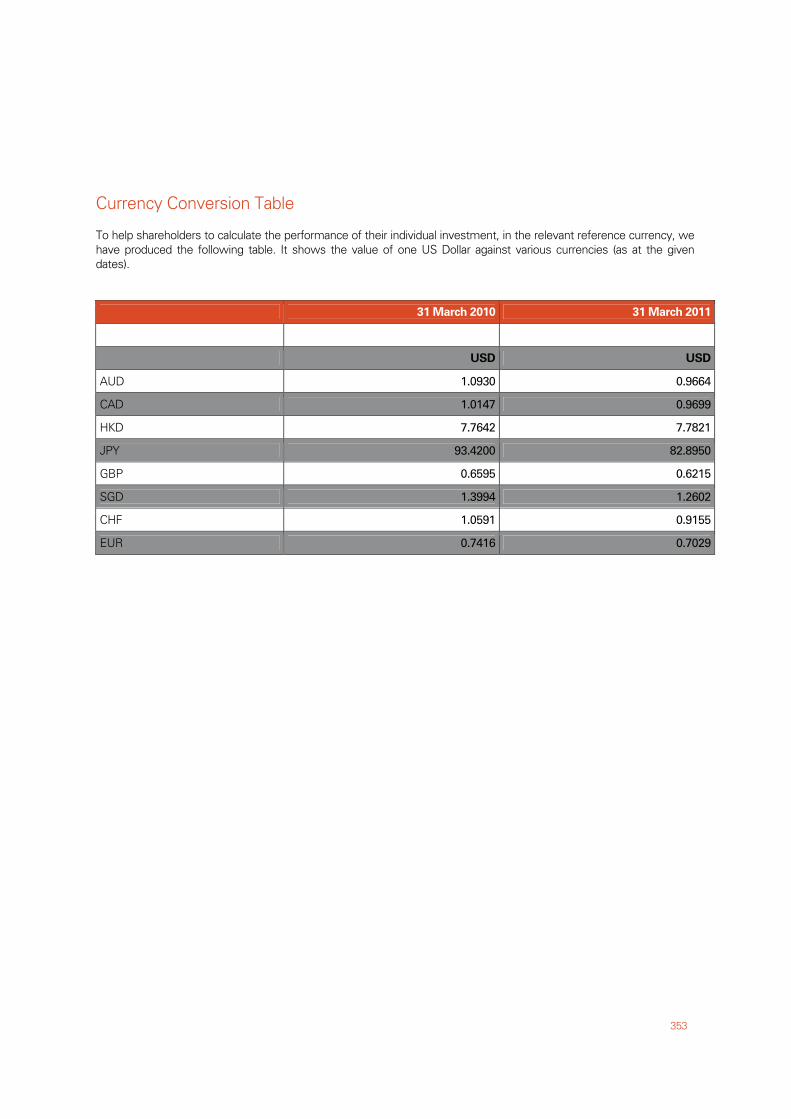
Currency Conversion Table
353
To help shareholders to calculate the performance of their individual investment, in the relevant reference currency, we have produced the following table. It shows the value of one US Dollar against various currencies (as at the given dates).
31 March 2010 31 March 2011
USD USD
AUD 1.0930 0.9664
CAD 1.0147 0.9699
HKD 7.7642 7.7821
JPY 93.4200 82.8950
GBP 0.6595 0.6215
SGD 1.3994 1.2602
CHF 1.0591 0.9155
EUR 0.7416 0.7029
Dealing Days of the Fund
354
Dealing for Shares in the Company will take place on any Business Day (other than days during a period of suspension of dealing in Shares) and which is also for each sub-fund, a day where stock exchanges and regulated markets in countries where the sub-fund is materially invested are open for normal trading. Until 1 February 2010, for sub-funds materially invested in North or South American markets, a Dealing Day means any Business Day (other than days during a period of suspension of dealing in Shares) except a Business Day following the day where stock exchanges and regulated markets in such countries were closed for normal trading. The Business Days which are not Dealing Days will be listed in the annual report and semi-annual reports and available at the registered office of the Company. Any amendments to such lists are also available at the registered office of the Company. Shareholders who deal through the Company's local distributor or representative should note that there will be no dealing for the Shares of the Company in the jurisdiction in which such distributor or representative operates on a day which is not a business day in such jurisdiction. Shareholders in such jurisdictions can however deal via the Transfer Agent in Luxembourg. The Company will determine the dealing/non-dealing calendar according to the latest market information obtained by the Company from time to time. Shareholders can obtain the latest dealing/non-dealing calendar of the Company from the registered office of the Company or from the Company's local distributor or representative.

355
HSBC Global Investment Funds (“HGIF”)
Fund Holiday Calendar for 2011
Updated: 13 JUNE 2011 All HGIF sub-funds will have no NAV calculated on the following days:
all Saturdays and Sundays
and on the following dates :
22-Apr Luxembourg 25-Apr Luxembourg 02-Jun Luxembourg 13-Jun Luxembourg 23-Jun Luxembourg 15-Aug Luxembourg 01-Nov Luxembourg 26-Dec Luxembourg In addition, the following funds will have non-dealing days on the following dates:
Asian Currencies Bond (Korea, Malaysia, Singapore) 02-May Singapore 05-May Korea 10-May Korea 17-May Malaysia, Singapore 06-Jun Korea 09-Aug Singapore 15-Aug Korea 30-Aug Malaysia, Singapore 31-Aug Malaysia 12-Sep Korea 13-Sep Korea 16-Sep Malaysia 03-Oct Korea 26-Oct Malaysia, Singapore 07-Nov Singapore 26-Dec Singapore 30-Dec Korea
Asia ex Japan Equity (Korea)
02-Feb Korea 03-Feb Korea 04-Feb Korea 01-Mar Korea 05-May Korea 10-May Korea 06-Jun Korea 15-Aug Korea 12-Sep Korea 13-Sep Korea 03-Oct Korea 30-Dec Korea
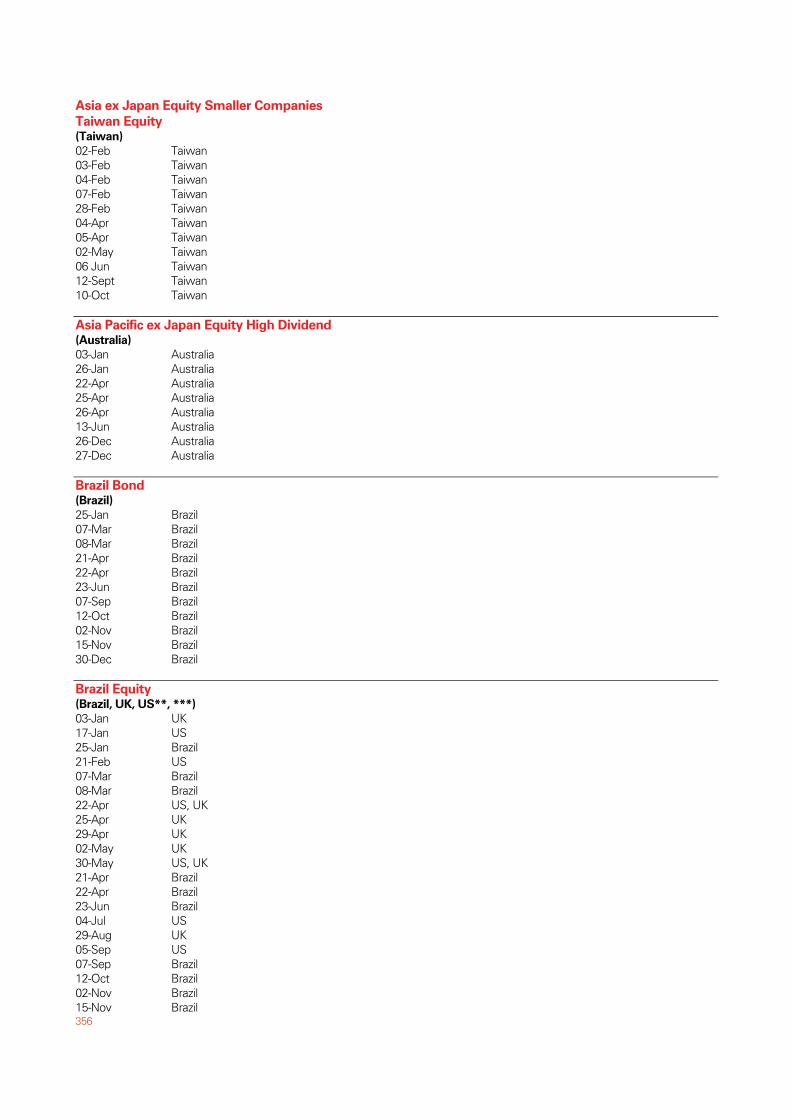
356
Asia ex Japan Equity Smaller Companies
Taiwan Equity (Taiwan)
02-Feb Taiwan 03-Feb Taiwan 04-Feb Taiwan 07-Feb Taiwan 28-Feb Taiwan 04-Apr Taiwan 05-Apr Taiwan 02-May Taiwan 06 Jun Taiwan 12-Sept Taiwan 10-Oct Taiwan
Asia Pacific ex Japan Equity High Dividend (Australia)
03-Jan Australia 26-Jan Australia 22-Apr Australia 25-Apr Australia 26-Apr Australia 13-Jun Australia 26-Dec Australia 27-Dec Australia
Brazil Bond (Brazil)
25-Jan Brazil 07-Mar Brazil 08-Mar Brazil 21-Apr Brazil 22-Apr Brazil 23-Jun Brazil 07-Sep Brazil 12-Oct Brazil 02-Nov Brazil 15-Nov Brazil 30-Dec Brazil
Brazil Equity (Brazil, UK, US**, ***)
03-Jan UK 17-Jan US 25-Jan Brazil 21-Feb US 07-Mar Brazil 08-Mar Brazil 22-Apr US, UK 25-Apr UK 29-Apr UK 02-May UK 30-May US, UK 21-Apr Brazil 22-Apr Brazil 23-Jun Brazil 04-Jul US 29-Aug UK 05-Sep US 07-Sep Brazil 12-Oct Brazil 02-Nov Brazil 15-Nov Brazil
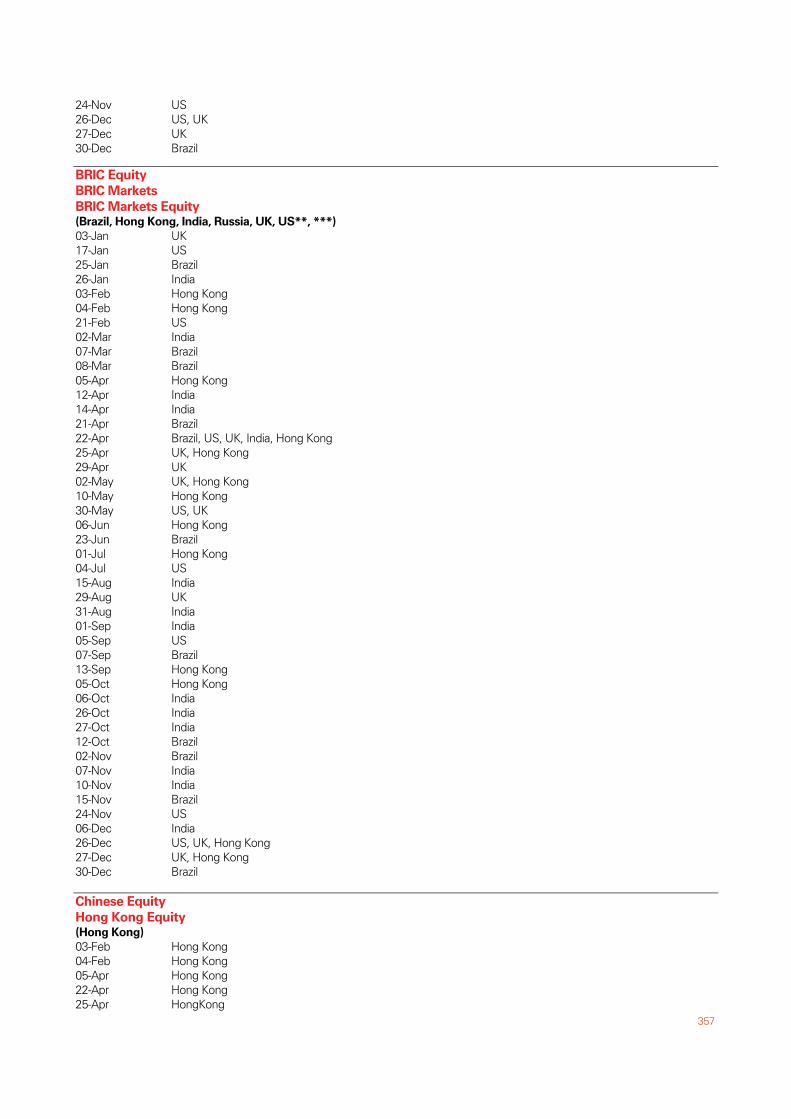
357
24-Nov US 26-Dec US, UK 27-Dec UK 30-Dec Brazil
BRIC Equity
BRIC Markets
BRIC Markets Equity (Brazil, Hong Kong, India, Russia, UK, US**, ***)
03-Jan UK 17-Jan US 25-Jan Brazil 26-Jan India 03-Feb Hong Kong 04-Feb Hong Kong 21-Feb US 02-Mar India 07-Mar Brazil 08-Mar Brazil 05-Apr Hong Kong 12-Apr India 14-Apr India 21-Apr Brazil 22-Apr Brazil, US, UK, India, Hong Kong 25-Apr UK, Hong Kong 29-Apr UK 02-May UK, Hong Kong 10-May Hong Kong 30-May US, UK 06-Jun Hong Kong 23-Jun Brazil 01-Jul Hong Kong 04-Jul US 15-Aug India 29-Aug UK 31-Aug India 01-Sep India 05-Sep US 07-Sep Brazil 13-Sep Hong Kong 05-Oct Hong Kong 06-Oct India 26-Oct India 27-Oct India 12-Oct Brazil 02-Nov Brazil 07-Nov India 10-Nov India 15-Nov Brazil 24-Nov US 06-Dec India 26-Dec US, UK, Hong Kong 27-Dec UK, Hong Kong 30-Dec Brazil
Chinese Equity
Hong Kong Equity (Hong Kong)
03-Feb Hong Kong 04-Feb Hong Kong 05-Apr Hong Kong 22-Apr Hong Kong 25-Apr HongKong
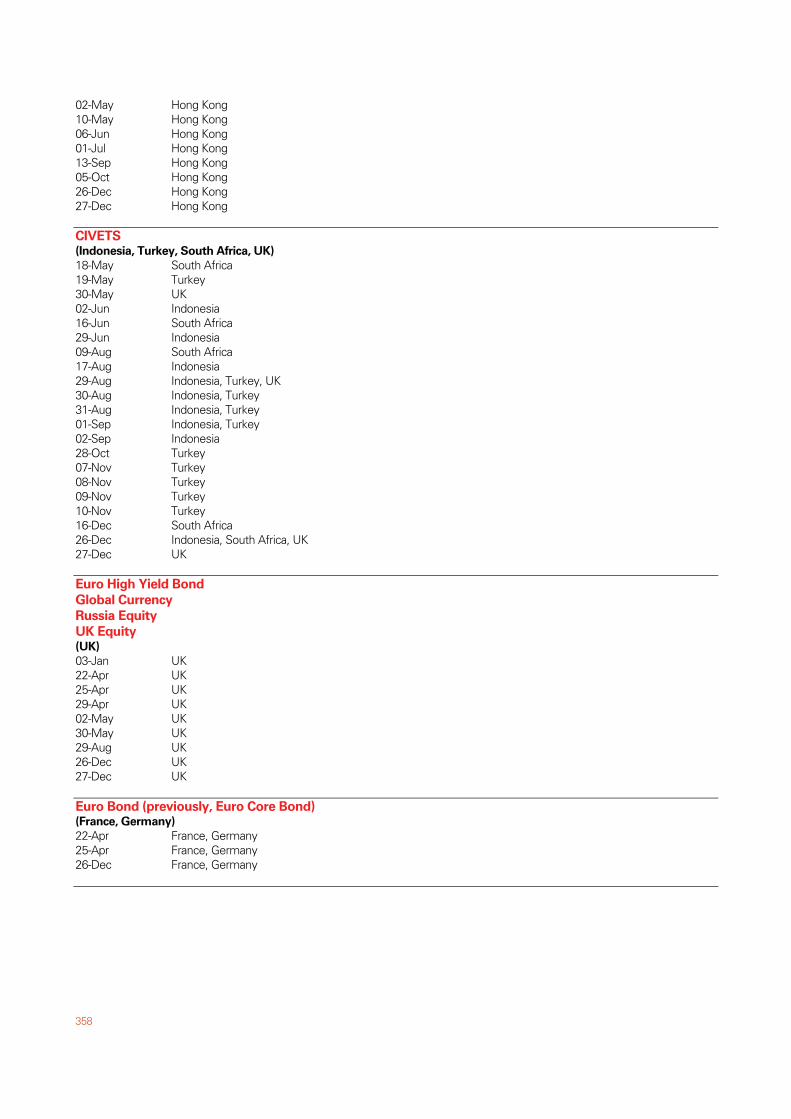
358
02-May Hong Kong 10-May Hong Kong 06-Jun Hong Kong 01-Jul Hong Kong 13-Sep Hong Kong 05-Oct Hong Kong 26-Dec Hong Kong 27-Dec Hong Kong
CIVETS (Indonesia, Turkey, South Africa, UK)
18-May South Africa 19-May Turkey 30-May UK 02-Jun Indonesia 16-Jun South Africa 29-Jun Indonesia 09-Aug South Africa 17-Aug Indonesia 29-Aug Indonesia, Turkey, UK 30-Aug Indonesia, Turkey 31-Aug Indonesia, Turkey 01-Sep Indonesia, Turkey 02-Sep Indonesia 28-Oct Turkey 07-Nov Turkey 08-Nov Turkey 09-Nov Turkey 10-Nov Turkey 16-Dec South Africa 26-Dec Indonesia, South Africa, UK 27-Dec UK
Euro High Yield Bond
Global Currency
Russia Equity
UK Equity (UK)
03-Jan UK 22-Apr UK 25-Apr UK 29-Apr UK 02-May UK 30-May UK 29-Aug UK 26-Dec UK 27-Dec UK
Euro Bond (previously, Euro Core Bond) (France, Germany)
22-Apr France, Germany 25-Apr France, Germany 26-Dec France, Germany
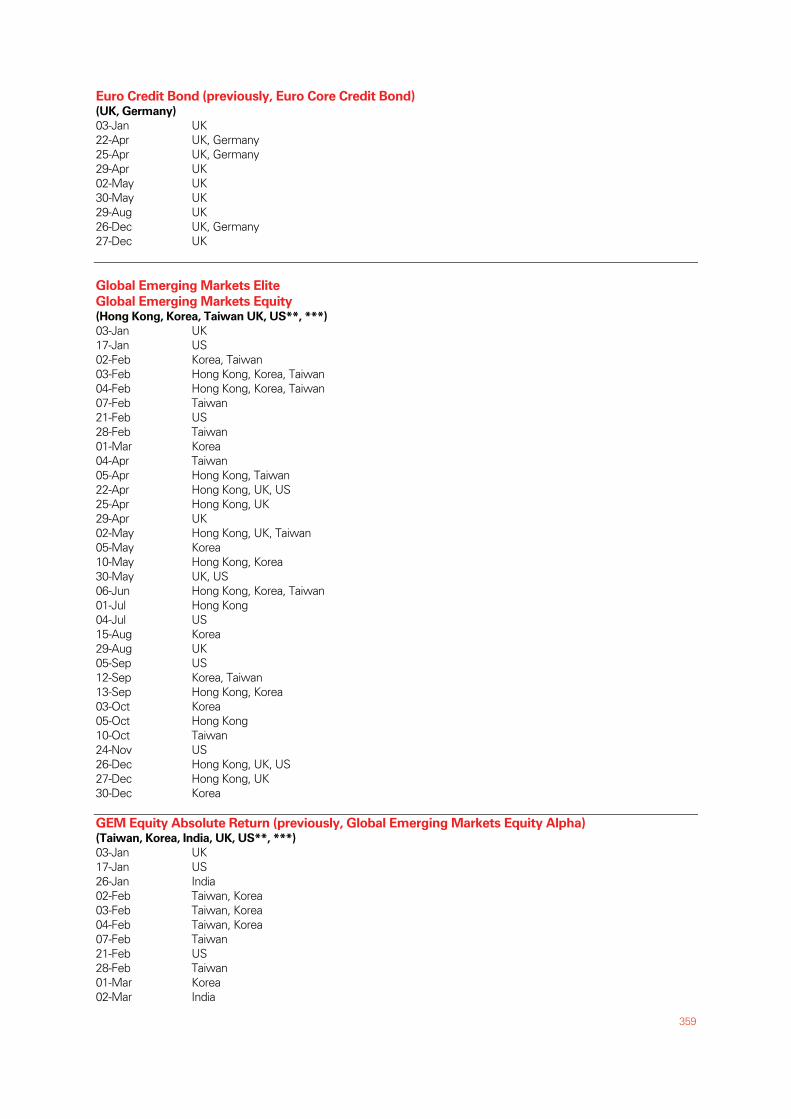
359
Euro Credit Bond (previously, Euro Core Credit Bond) (UK, Germany)
03-Jan UK 22-Apr UK, Germany 25-Apr UK, Germany 29-Apr UK 02-May UK 30-May UK 29-Aug UK 26-Dec UK, Germany 27-Dec UK Global Emerging Markets Elite
Global Emerging Markets Equity (Hong Kong, Korea, Taiwan UK, US**, ***) 03-Jan UK 17-Jan US 02-Feb Korea, Taiwan 03-Feb Hong Kong, Korea, Taiwan 04-Feb Hong Kong, Korea, Taiwan 07-Feb Taiwan 21-Feb US 28-Feb Taiwan 01-Mar Korea 04-Apr Taiwan 05-Apr Hong Kong, Taiwan 22-Apr Hong Kong, UK, US 25-Apr Hong Kong, UK 29-Apr UK 02-May Hong Kong, UK, Taiwan 05-May Korea 10-May Hong Kong, Korea 30-May UK, US 06-Jun Hong Kong, Korea, Taiwan 01-Jul Hong Kong 04-Jul US 15-Aug Korea 29-Aug UK 05-Sep US 12-Sep Korea, Taiwan 13-Sep Hong Kong, Korea 03-Oct Korea 05-Oct Hong Kong 10-Oct Taiwan 24-Nov US 26-Dec Hong Kong, UK, US 27-Dec Hong Kong, UK 30-Dec Korea
GEM Equity Absolute Return (previously, Global Emerging Markets Equity Alpha) (Taiwan, Korea, India, UK, US**, ***)
03-Jan UK 17-Jan US 26-Jan India 02-Feb Taiwan, Korea 03-Feb Taiwan, Korea 04-Feb Taiwan, Korea 07-Feb Taiwan 21-Feb US 28-Feb Taiwan 01-Mar Korea 02-Mar India
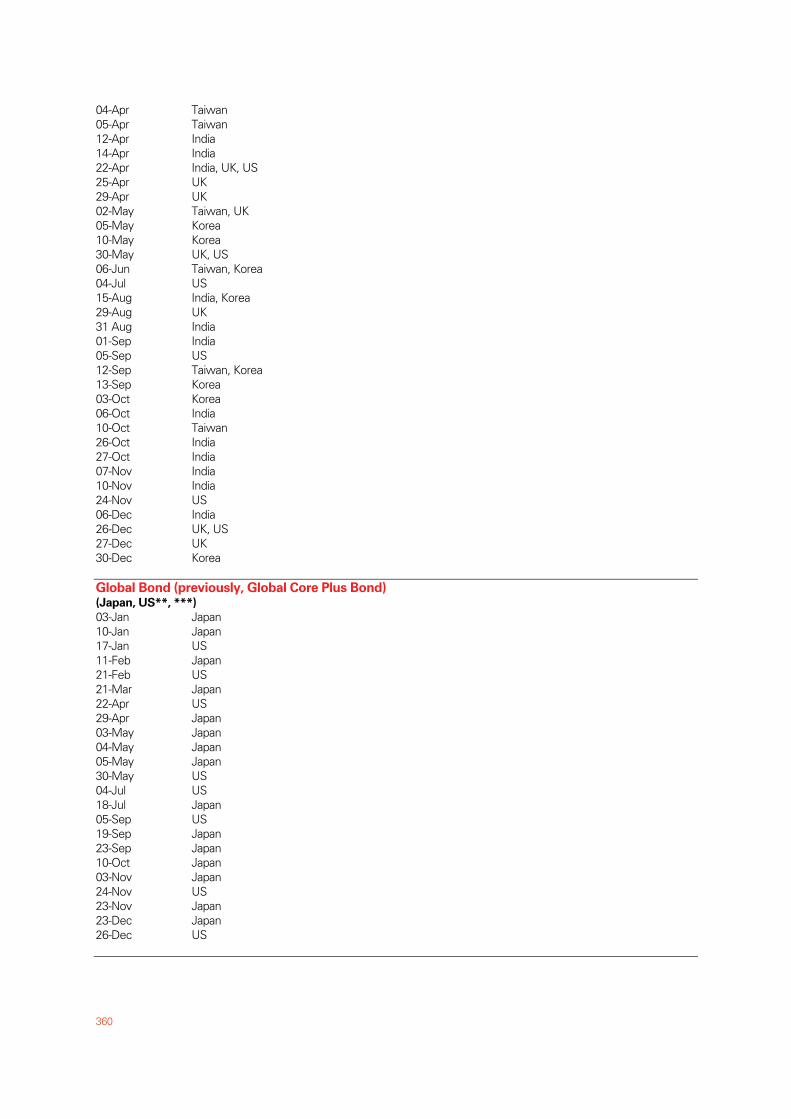
360
04-Apr Taiwan 05-Apr Taiwan 12-Apr India 14-Apr India 22-Apr India, UK, US 25-Apr UK 29-Apr UK 02-May Taiwan, UK 05-May Korea 10-May Korea 30-May UK, US 06-Jun Taiwan, Korea 04-Jul US 15-Aug India, Korea 29-Aug UK 31 Aug India 01-Sep India 05-Sep US 12-Sep Taiwan, Korea 13-Sep Korea 03-Oct Korea 06-Oct India 10-Oct Taiwan 26-Oct India 27-Oct India 07-Nov India 10-Nov India 24-Nov US 06-Dec India 26-Dec UK, US 27-Dec UK 30-Dec Korea
Global Bond (previously, Global Core Plus Bond) (Japan, US**, ***)
03-Jan Japan 10-Jan Japan 17-Jan US 11-Feb Japan 21-Feb US 21-Mar Japan 22-Apr US 29-Apr Japan 03-May Japan 04-May Japan 05-May Japan 30-May US 04-Jul US 18-Jul Japan 05-Sep US 19-Sep Japan 23-Sep Japan 10-Oct Japan 03-Nov Japan 24-Nov US 23-Nov Japan 23-Dec Japan 26-Dec US
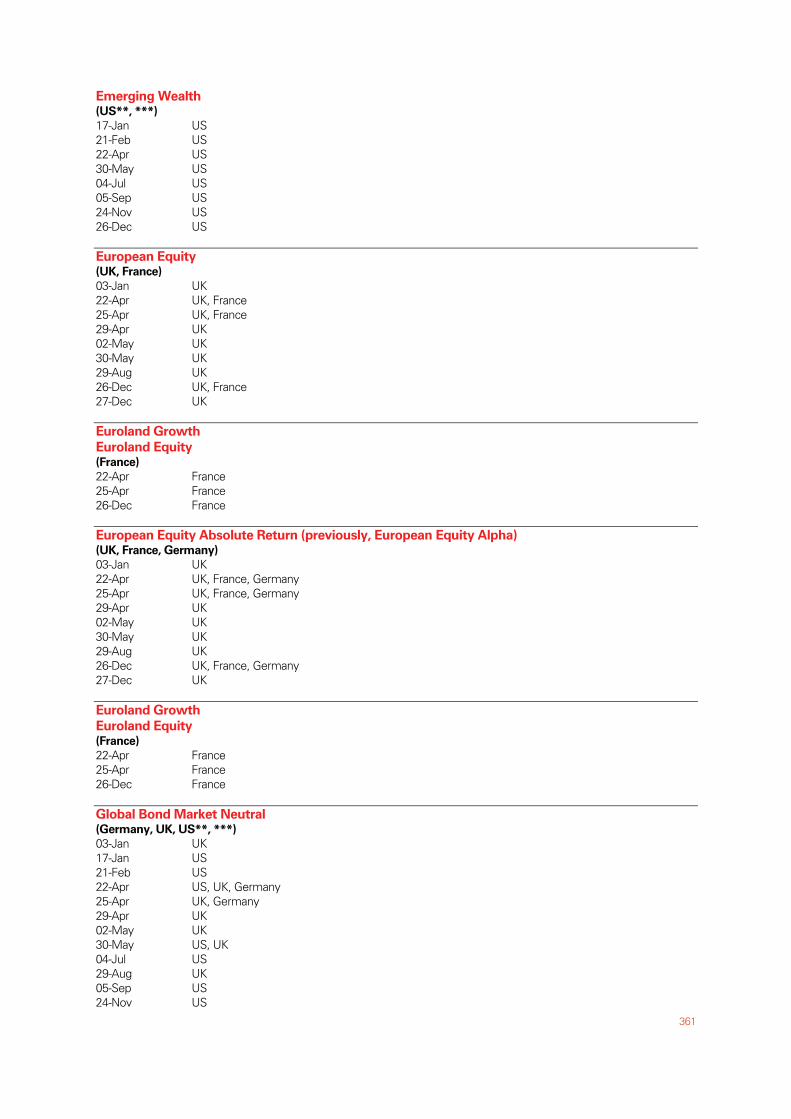
361
Emerging Wealth (US**, ***)
17-Jan US 21-Feb US 22-Apr US 30-May US 04-Jul US 05-Sep US 24-Nov US 26-Dec US
European Equity (UK, France)
03-Jan UK 22-Apr UK, France 25-Apr UK, France 29-Apr UK 02-May UK 30-May UK 29-Aug UK 26-Dec UK, France 27-Dec UK
Euroland Growth
Euroland Equity (France)
22-Apr France 25-Apr France 26-Dec France
European Equity Absolute Return (previously, European Equity Alpha) (UK, France, Germany)
03-Jan UK 22-Apr UK, France, Germany 25-Apr UK, France, Germany 29-Apr UK 02-May UK 30-May UK 29-Aug UK 26-Dec UK, France, Germany 27-Dec UK
Euroland Growth
Euroland Equity (France)
22-Apr France 25-Apr France 26-Dec France
Global Bond Market Neutral (Germany, UK, US**, ***)
03-Jan UK 17-Jan US 21-Feb US 22-Apr US, UK, Germany 25-Apr UK, Germany 29-Apr UK 02-May UK 30-May US, UK 04-Jul US 29-Aug UK 05-Sep US 24-Nov US
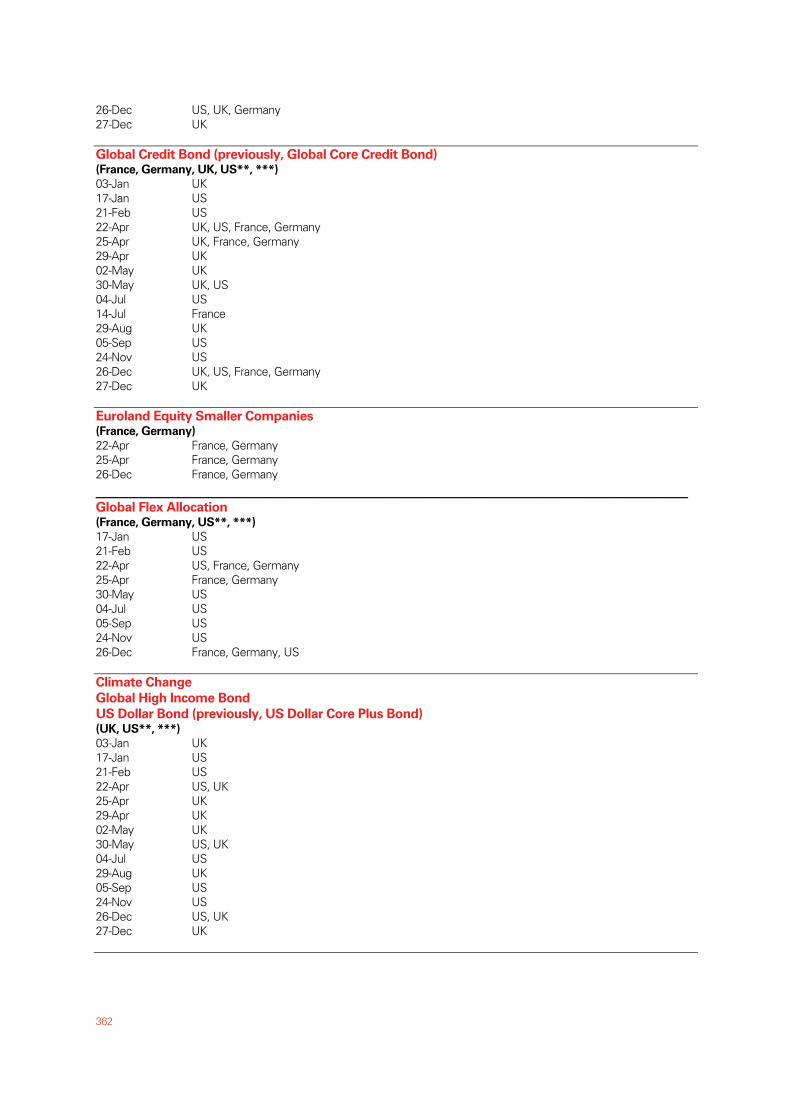
362
26-Dec US, UK, Germany 27-Dec UK
Global Credit Bond (previously, Global Core Credit Bond) (France, Germany, UK, US**, ***)
03-Jan UK 17-Jan US 21-Feb US 22-Apr UK, US, France, Germany 25-Apr UK, France, Germany 29-Apr UK 02-May UK 30-May UK, US 04-Jul US 14-Jul France 29-Aug UK 05-Sep US 24-Nov US 26-Dec UK, US, France, Germany 27-Dec UK
Euroland Equity Smaller Companies (France, Germany)
22-Apr France, Germany 25-Apr France, Germany 26-Dec France, Germany __________________________________________________________________ Global Flex Allocation (France, Germany, US**, ***)
17-Jan US 21-Feb US 22-Apr US, France, Germany 25-Apr France, Germany 30-May US 04-Jul US 05-Sep US 24-Nov US 26-Dec France, Germany, US
Climate Change
Global High Income Bond
US Dollar Bond (previously, US Dollar Core Plus Bond) (UK, US**, ***)
03-Jan UK 17-Jan US 21-Feb US 22-Apr US, UK 25-Apr UK 29-Apr UK 02-May UK 30-May US, UK 04-Jul US 29-Aug UK 05-Sep US 24-Nov US 26-Dec US, UK 27-Dec UK
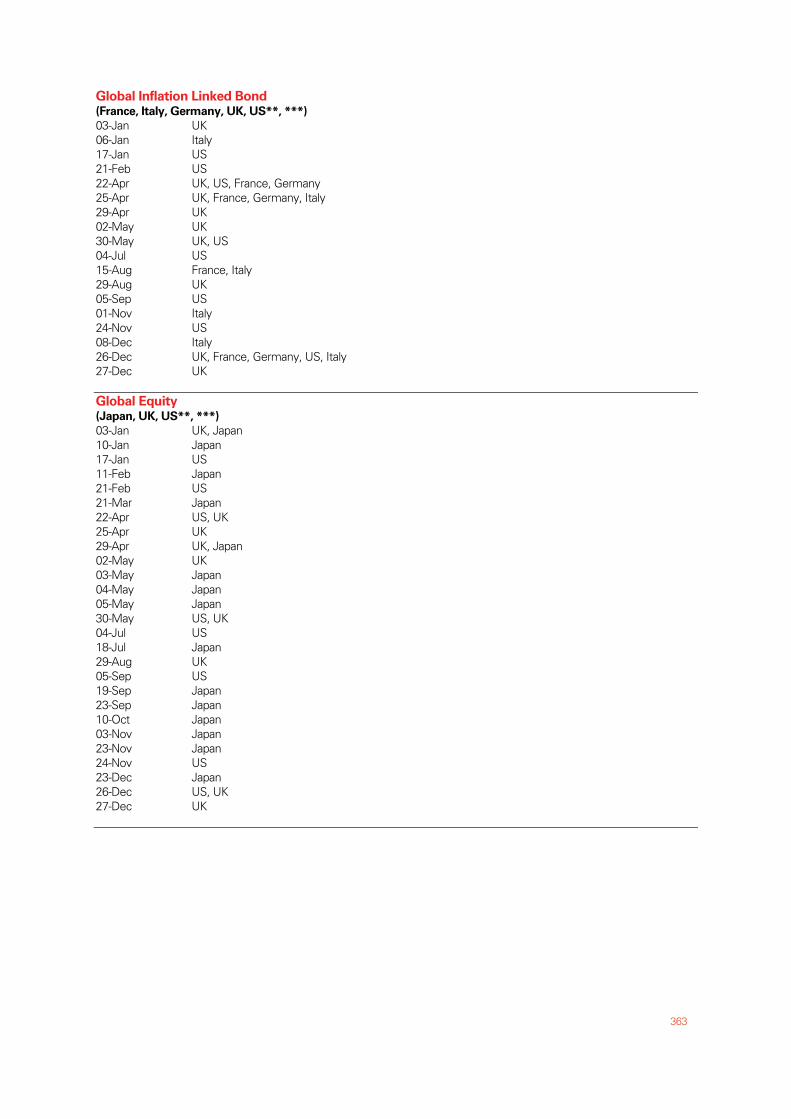
363
Global Inflation Linked Bond (France, Italy, Germany, UK, US**, ***)
03-Jan UK 06-Jan Italy 17-Jan US 21-Feb US 22-Apr UK, US, France, Germany 25-Apr UK, France, Germany, Italy 29-Apr UK 02-May UK 30-May UK, US 04-Jul US 15-Aug France, Italy 29-Aug UK 05-Sep US 01-Nov Italy 24-Nov US 08-Dec Italy 26-Dec UK, France, Germany, US, Italy 27-Dec UK
Global Equity (Japan, UK, US**, ***)
03-Jan UK, Japan 10-Jan Japan 17-Jan US 11-Feb Japan 21-Feb US 21-Mar Japan 22-Apr US, UK 25-Apr UK 29-Apr UK, Japan 02-May UK 03-May Japan 04-May Japan 05-May Japan 30-May US, UK 04-Jul US 18-Jul Japan 29-Aug UK 05-Sep US 19-Sep Japan 23-Sep Japan 10-Oct Japan 03-Nov Japan 23-Nov Japan 24-Nov US 23-Dec Japan 26-Dec US, UK 27-Dec UK
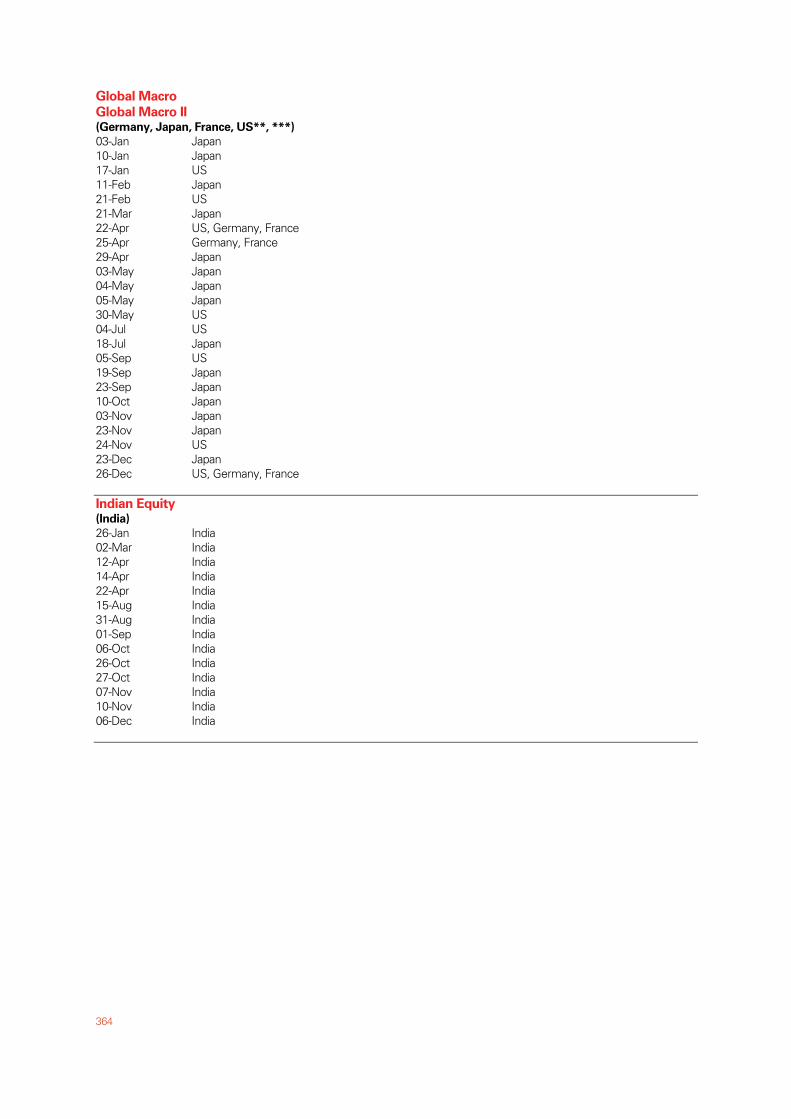
364
Global Macro
Global Macro II (Germany, Japan, France, US**, ***)
03-Jan Japan 10-Jan Japan 17-Jan US 11-Feb Japan 21-Feb US 21-Mar Japan 22-Apr US, Germany, France 25-Apr Germany, France 29-Apr Japan 03-May Japan 04-May Japan 05-May Japan 30-May US 04-Jul US 18-Jul Japan 05-Sep US 19-Sep Japan 23-Sep Japan 10-Oct Japan 03-Nov Japan 23-Nov Japan 24-Nov US 23-Dec Japan 26-Dec US, Germany, France
Indian Equity (India)
26-Jan India 02-Mar India 12-Apr India 14-Apr India 22-Apr India 15-Aug India 31-Aug India 01-Sep India 06-Oct India 26-Oct India 27-Oct India 07-Nov India 10-Nov India 06-Dec India
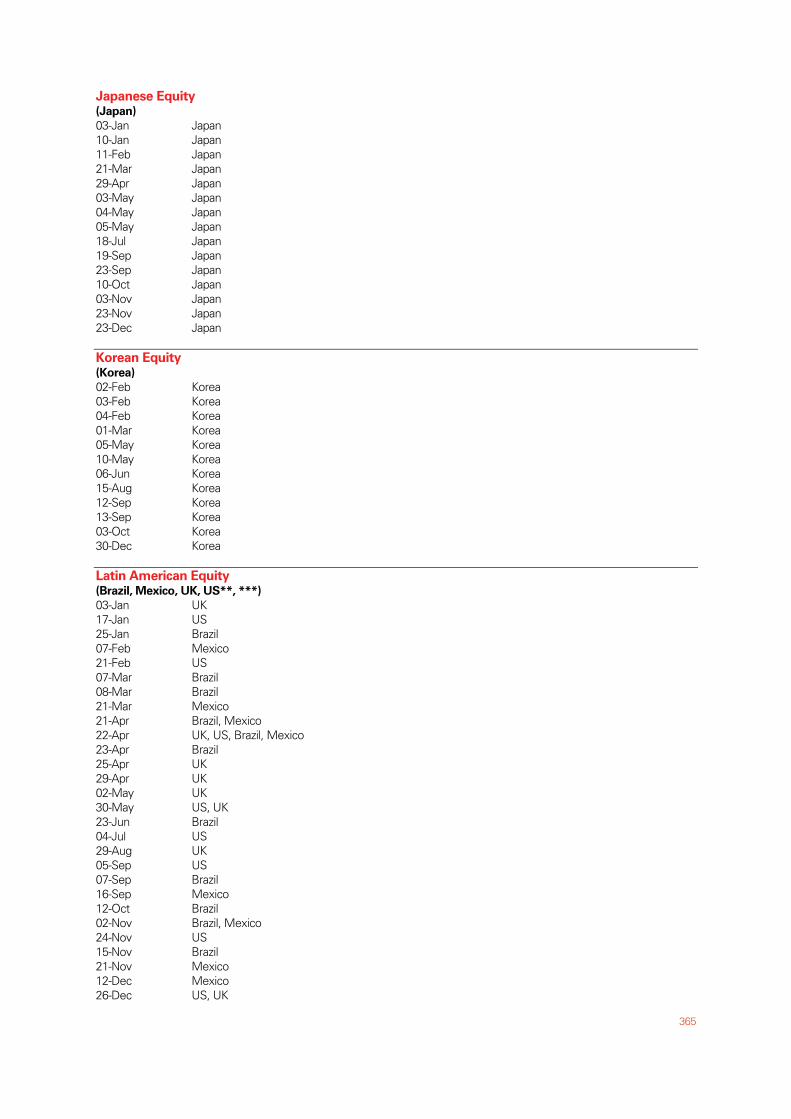
365
Japanese Equity (Japan)
03-Jan Japan 10-Jan Japan 11-Feb Japan 21-Mar Japan 29-Apr Japan 03-May Japan 04-May Japan 05-May Japan 18-Jul Japan 19-Sep Japan 23-Sep Japan 10-Oct Japan 03-Nov Japan 23-Nov Japan 23-Dec Japan
Korean Equity (Korea)
02-Feb Korea 03-Feb Korea 04-Feb Korea 01-Mar Korea 05-May Korea 10-May Korea 06-Jun Korea 15-Aug Korea 12-Sep Korea 13-Sep Korea 03-Oct Korea 30-Dec Korea
Latin American Equity (Brazil, Mexico, UK, US**, ***)
03-Jan UK 17-Jan US 25-Jan Brazil 07-Feb Mexico 21-Feb US 07-Mar Brazil 08-Mar Brazil 21-Mar Mexico 21-Apr Brazil, Mexico 22-Apr UK, US, Brazil, Mexico 23-Apr Brazil 25-Apr UK 29-Apr UK 02-May UK 30-May US, UK 23-Jun Brazil 04-Jul US 29-Aug UK 05-Sep US 07-Sep Brazil 16-Sep Mexico 12-Oct Brazil 02-Nov Brazil, Mexico 24-Nov US 15-Nov Brazil 21-Nov Mexico 12-Dec Mexico 26-Dec US, UK
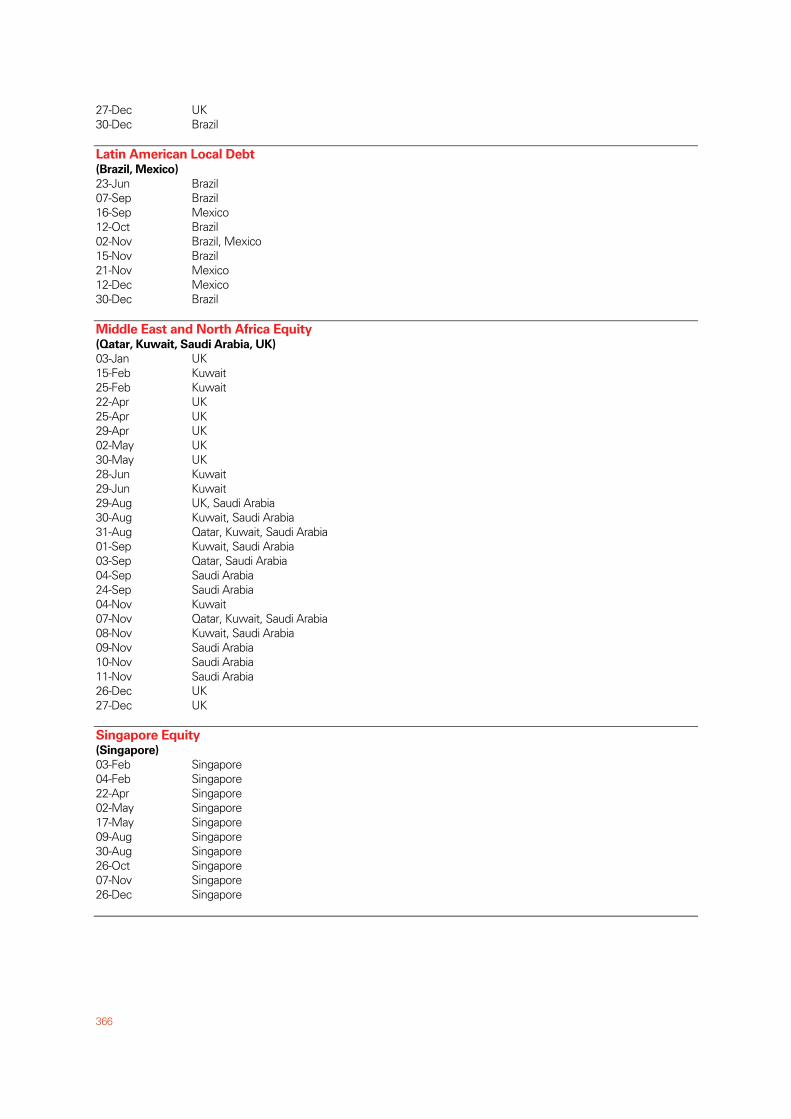
366
27-Dec UK 30-Dec Brazil
Latin American Local Debt (Brazil, Mexico)
23-Jun Brazil 07-Sep Brazil 16-Sep Mexico 12-Oct Brazil 02-Nov Brazil, Mexico 15-Nov Brazil 21-Nov Mexico 12-Dec Mexico 30-Dec Brazil
Middle East and North Africa Equity (Qatar, Kuwait, Saudi Arabia, UK)
03-Jan UK 15-Feb Kuwait 25-Feb Kuwait 22-Apr UK 25-Apr UK 29-Apr UK 02-May UK 30-May UK 28-Jun Kuwait 29-Jun Kuwait 29-Aug UK, Saudi Arabia 30-Aug Kuwait, Saudi Arabia 31-Aug Qatar, Kuwait, Saudi Arabia 01-Sep Kuwait, Saudi Arabia 03-Sep Qatar, Saudi Arabia 04-Sep Saudi Arabia 24-Sep Saudi Arabia 04-Nov Kuwait 07-Nov Qatar, Kuwait, Saudi Arabia 08-Nov Kuwait, Saudi Arabia 09-Nov Saudi Arabia 10-Nov Saudi Arabia 11-Nov Saudi Arabia 26-Dec UK 27-Dec UK
Singapore Equity (Singapore)
03-Feb Singapore 04-Feb Singapore 22-Apr Singapore 02-May Singapore 17-May Singapore 09-Aug Singapore 30-Aug Singapore 26-Oct Singapore 07-Nov Singapore 26-Dec Singapore
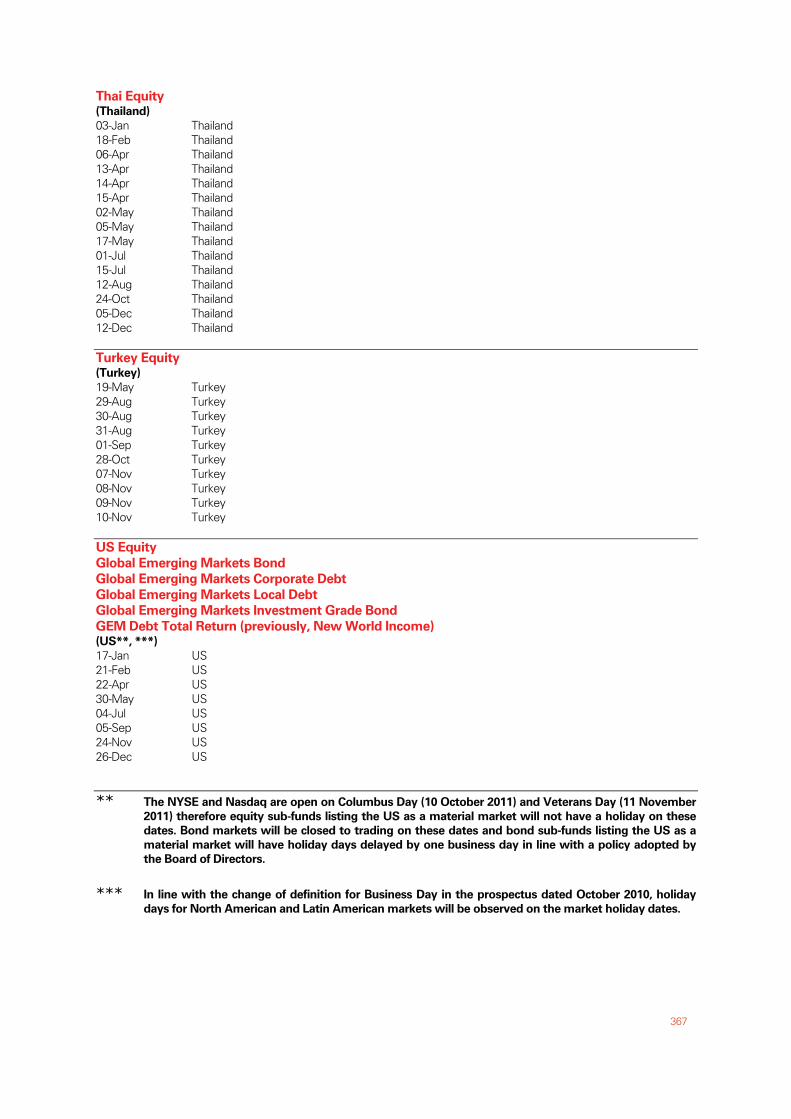
367
Thai Equity (Thailand)
03-Jan Thailand 18-Feb Thailand 06-Apr Thailand 13-Apr Thailand 14-Apr Thailand 15-Apr Thailand 02-May Thailand 05-May Thailand 17-May Thailand 01-Jul Thailand 15-Jul Thailand 12-Aug Thailand 24-Oct Thailand 05-Dec Thailand 12-Dec Thailand
Turkey Equity (Turkey)
19-May Turkey 29-Aug Turkey 30-Aug Turkey 31-Aug Turkey 01-Sep Turkey 28-Oct Turkey 07-Nov Turkey 08-Nov Turkey 09-Nov Turkey 10-Nov Turkey
US Equity
Global Emerging Markets Bond
Global Emerging Markets Corporate Debt
Global Emerging Markets Local Debt
Global Emerging Markets Investment Grade Bond
GEM Debt Total Return (previously, New World Income) (US**, ***)
17-Jan US 21-Feb US 22-Apr US 30-May US 04-Jul US 05-Sep US 24-Nov US 26-Dec US
** The NYSE and Nasdaq are open on Columbus Day (10 October 2011) and Veterans Day (11 November
2011) therefore equity sub-funds listing the US as a material market will not have a holiday on these
dates. Bond markets will be closed to trading on these dates and bond sub-funds listing the US as a
material market will have holiday days delayed by one business day in line with a policy adopted by
the Board of Directors. *** In line with the change of definition for Business Day in the prospectus dated October 2010, holiday
days for North American and Latin American markets will be observed on the market holiday dates.

HSBC Global Asset Management, the sponsor of HSBC Global Investment Funds, is the asset management specialist of the HSBC Group and operates through HSBC Bank plc and its subsidiaries. HSBC Global Asset Management is the trading name of HSBC Global Asset Management Limited. HSBC Global Asset Management is established at 8 Canada Square, London E14 5HQ which is its registered office. © Copyright. HSBC Global Asset Management Limited 2011. All Rights Reserved 14846/0608
Recommended