HSBC Exchange Traded FundsFactsheet BookMay 2014
For UK Professional Clients Only

Content
Developed Markets – Regional Exposure
HSBC MSCI PACIFIC EX JAPAN UCITS ETF 1
HSBC MSCI EUROPE UCITS ETF 3
HSBC EURO STOXX 50 UCITS ETF 5
HSBC MSCI WORLD UCITS ETF 7
Developed Markets – Single Country Exposure
HSBC S&P 500 UCITS ETF 9
HSBC FTSE 100 UCITS ETF 11
HSBC MSCI USA UCITS ETF 13
HSBC MSCI JAPAN UCITS ETF 15
HSBC FTSE 250 UCITS ETF 17
HSBC MSCI CANADA UCITS ETF 19
Developed Markets – Property
HSBC FTSE EPRA/NAREIT DEVELOPED UCITS ETF 21
Emerging Markets – Regional Exposure
HSBC MSCI EMERGING MARKETS UCITS ETF 23
HSBC MSCI EM FAR EAST UCITS ETF 25
HSBC MSCI EM LATIN AMERICA UCITS ETF 27
HSBC S&P BRIC 40 UCITS ETF 29
HSBC MSCI AC FAR EAST ex JAPAN UCITS ETF 31
Emerging Markets – Single Country Exposure
HSBC MSCI RUSSIA CAPPED UCITS ETF 33
HSBC MSCI CHINA UCITS ETF 35
HSBC MSCI TAIWAN UCITS ETF 37
HSBC MSCI MALAYSIA UCITS ETF 39
HSBC MSCI INDONESIA UCITS ETF 41
HSBC MSCI KOREA UCITS ETF 43
HSBC MSCI BRAZIL UCITS ETF 45
HSBC MSCI MEXICO CAPPED UCITS ETF 47
HSBC MSCI SOUTH AFRICA UCITS ETF 49
HSBC MSCI TURKEY UCITS ETF 51
Tax status of HSBC Exchange Traded Funds 53

1
Source: HSBC Global Asset Management (UK) Limited. All data as at 31/05/2014
HSBC MSCI PACIFIC ex JAPAN UCITS ETFPhysical – Full replicationTicker: HMXJ
The HSBC MSCI PACIFIC ex JAPAN UCITS ETF is an open ended UCITS IV compliant exchange-traded fund incorporated in Ireland.
Fund objective
The investment objective of the Fund is to replicate the performance of the MSCI Pacific ex Japan Index (the “Index”), while minimising as far as possible the tracking error between the Fund’s performance and that of the Index. The Index is a market-capitalisation weighted index designed to measure the performance of the largest companies in Australia, Hong Kong, Singapore and New Zealand, as defined by the Index Provider.
In seeking to achieve its investment objective, the Fund will aim to invest in securities included in the Index in generally the same proportions in which they are included in the Index.
Key facts
• Physical replication approach • Listed on London Stock Exchange, Euronext Paris, SIX Swiss
Exchange and Xetra Deutsche Börse • Total Expense Ratio (TER) of 0.40% per annum • Multi currency listing in GBP, EUR and USD • Fund registered in several European countries: UK, France, Germany,
Italy, Ireland, Netherlands, Spain, Sweden, Switzerland, Austria
Sector allocation of the Fund
Financials (52.72%) Materials (11.56%) Industrials (8.78%) Consumer Staples (6.68%) Consumer Discretionary (5.98%) Utilities (3.73%) Energy (3.62%) Telecommunication Services (3.44%) Health Care (2.99%) Information Technology (0.50%)
Country allocation of the Fund
Australia (63.91%)
Hong Kong (23.01%)
Singapore (12.06%)
New Zealand (1.01%)
Fund detailsUCITS IV compliant Yes
Fund domicile Ireland
UK reporting fund status (UKRF) Yes
ISA eligible Yes
SIPP eligible Yes
Issuer HSBC ETFs Plc
Fund manager HSBC Global Asset Management (UK) Limited
Custodian HSBC Institutional Trust Services (Ireland) Limited
Fund administrator HSBC Securities Services (Ireland) Limited
Authorised participant HSBC Bank Plc
Benchmark MSCI Pacific ex Japan Index
Number of holdings 144
Published daily on etf.hsbc.com website
Replication method Physical – Full Replication
Base currency USD
Fund inception date 03/09/2010
Listing date 06/09/2010
Fiscal year end 31 December
Total Expense Ratio (TER) 0.40%
Entry/Exit/Performance fees No
Net asset value (NAV) per share $14.43
Shares outstanding 11,910,000
Assets under management $171,862,546
Dividend treatment Distribution
Dividend frequency Semi-annual
Dividend currency USD
Dividend per share $0.2363
Dividend yield* 3.3486%
Dividend ex date 22/01/2014
*Gross trailing 12 month yield.
ISIN IE00B5SG8Z57
Index informationIndex name MSCI Pacific ex Japan Index
Index currency USD
Benchmark type Total Return (Net)
Index rebalancing frequency Quarterly
TR Index Bloomberg ticker NDDUPXJ
TR Index Reuters RIC .dMIPCJ0000NUS
PR Index Bloomberg Ticker MSDUPXJ
PR Index Reuters RIC .dMIPCJ0000PUS

Further information on HSBC ETFs Tel: 020 7024 0435 E-mail: [email protected] Website: www.etf.hsbc.com
2
Yearly fund performance (%)
31/05/09 - 31/05/10 31/05/10 - 31/05/11 31/05/11 - 31/05/12 31/05/12 - 31/05/13 31/05/13 - 31/05/14
HSBC MSCI PACIFIC ex JAPAN UCITS ETF
N/A N/A -17.14 26.35 11.29
Fund and Index cumulative performance (%)
1 month 3 months 1 year 3 years Since inception
HSBC MSCI PACIFIC ex JAPAN UCITS ETF
1.90 6.69 11.29 16.52 39.71
MSCI Pacific ex Japan Net 1.94 6.77 11.74 17.97 41.87
Tracking difference1 -0.05 -0.08 -0.44 -1.45 -2.16
Tracking error2 N/A N/A 0.054 N/A 0.078
1 The tracking difference Net is the difference between the return of the fund (NAV) and that of the underlying index, after management fees (TER).2 The tracking error also known active risk, is the standard deviation of the tracking difference i.e. how variable is the tracking difference over time. The optimal tracking error would be zero.
Source: HSBC Global Asset Management (UK) Limited. All data as at 31/05/2014
Any performance information shown refers to the past and should not be seen as an indication of future returns.
Performance is shown using the net asset value of the fund, calculated from the closing price of the underlying securities. Performance is shown after fees including re-invested dividends in the base currency of the fund and does not take into account any currency exposure that may exist against the trading currency of the fund, where this is different.
Listing and trading information
Listing date
Trading currency
Trading hours (local time)
Bloomberg ticker
Reuters RIC
iNAV Bloomberg
iNAV Reuters
London Stock Exchange 07/09/2010 GBP 08:00 - 16:30 HMXJ LN HMXJ.L HMXJGBPI HMXJINAVGBP=HSBL
London Stock Exchange 07/09/2010 USD 08:00 - 16:30 HMXD LN HMXD.L HMXJUSDI HMXJINAVUSD=HSBL
Euronext Paris 05/11/2010 EUR 09:00 - 17:30 MXJ FP MXJ.PA HMXJEURI HMXJINAVEUR=HSBL
SIX Swiss Exchange 19/04/2011 USD 09:00 - 17:30 HMXJ SW HMXJ.S HMXJUSDI HMXJINAVUSD=HSBL
SIX Swiss Exchange N/A EUR 09:00 - 17:30 N/A N/A N/A N/A
Xetra Deutsche Börse 13/10/2010 EUR 09:00 - 17:30H4ZH GY & H4ZH GR
H4ZH.DE HMXJEURI HMXJINAVEUR=HSBL
About the Index
The Fund will aim to replicate the performance of the Index as calculated by MSCI Inc.
The Index offers a representation of the Pacific equity markets (Australia, Hong Kong, New Zealand and Singapore) by targeting all companies with a market capitalization within the top 85% of their investable equity universe, subject to a global minimum size requirement. It is based on MSCI’s Global Investable Market Indices methodology.
The composition of the Index is reviewed on a quarterly basis and carried out according to the published rules governing the management of the Index as set out by MSCI Inc.
Top 10 holdings of the Fund
Commonwealth Bank of Australia
7.35% AIA 3.62%
BHP Billiton 6.64% Wesfarmers 2.77%
Westpac Banking 5.98% Woolworths 2.63%
Australia and New Zealand Banking Group
5.13% CSL 1.92%
National Australia Bank 4.40% Hutchison Whampoa 1.72%
3
Source: HSBC Global Asset Management (UK) Limited. All data as at 31/05/2014
HSBC MSCI EUROPE UCITS ETFPhysical – Full replicationTicker: HMEU
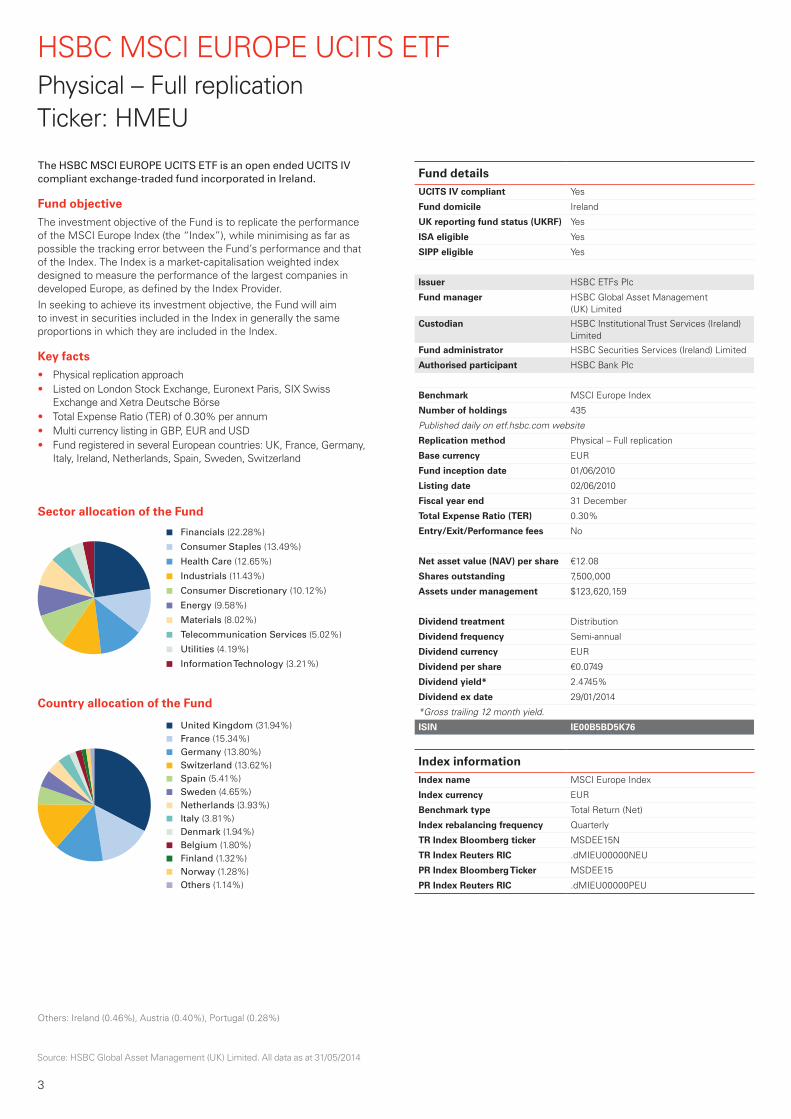
Others: Ireland (0.46%), Austria (0.40%), Portugal (0.28%)
The HSBC MSCI EUROPE UCITS ETF is an open ended UCITS IV compliant exchange-traded fund incorporated in Ireland.
Fund objective
The investment objective of the Fund is to replicate the performance of the MSCI Europe Index (the “Index”), while minimising as far as possible the tracking error between the Fund’s performance and that of the Index. The Index is a market-capitalisation weighted index designed to measure the performance of the largest companies in developed Europe, as defined by the Index Provider.
In seeking to achieve its investment objective, the Fund will aim to invest in securities included in the Index in generally the same proportions in which they are included in the Index.
Key facts
• Physical replication approach • Listed on London Stock Exchange, Euronext Paris, SIX Swiss
Exchange and Xetra Deutsche Börse • Total Expense Ratio (TER) of 0.30% per annum • Multi currency listing in GBP, EUR and USD • Fund registered in several European countries: UK, France, Germany,
Italy, Ireland, Netherlands, Spain, Sweden, Switzerland
Sector allocation of the Fund
Financials (22.28%)
Consumer Staples (13.49%)
Health Care (12.65%)
Industrials (11.43%)
Consumer Discretionary (10.12%)
Energy (9.58%)
Materials (8.02%)
Telecommunication Services (5.02%)
Utilities (4.19%)
Information Technology (3.21%)
Country allocation of the Fund
United Kingdom (31.94%) France (15.34%) Germany (13.80%) Switzerland (13.62%) Spain (5.41%) Sweden (4.65%) Netherlands (3.93%) Italy (3.81%) Denmark (1.94%) Belgium (1.80%) Finland (1.32%) Norway (1.28%) Others (1.14%)
Fund detailsUCITS IV compliant Yes
Fund domicile Ireland
UK reporting fund status (UKRF) Yes
ISA eligible Yes
SIPP eligible Yes
Issuer HSBC ETFs Plc
Fund manager HSBC Global Asset Management (UK) Limited
Custodian HSBC Institutional Trust Services (Ireland) Limited
Fund administrator HSBC Securities Services (Ireland) Limited
Authorised participant HSBC Bank Plc
Benchmark MSCI Europe Index
Number of holdings 435
Published daily on etf.hsbc.com website
Replication method Physical – Full replication
Base currency EUR
Fund inception date 01/06/2010
Listing date 02/06/2010
Fiscal year end 31 December
Total Expense Ratio (TER) 0.30%
Entry/Exit/Performance fees No
Net asset value (NAV) per share €12.08
Shares outstanding 7,500,000
Assets under management $123,620,159
Dividend treatment Distribution
Dividend frequency Semi-annual
Dividend currency EUR
Dividend per share €0.0749
Dividend yield* 2.4745%
Dividend ex date 29/01/2014
*Gross trailing 12 month yield.
ISIN IE00B5BD5K76
Index informationIndex name MSCI Europe Index
Index currency EUR
Benchmark type Total Return (Net)
Index rebalancing frequency Quarterly
TR Index Bloomberg ticker MSDEE15N
TR Index Reuters RIC .dMIEU00000NEU
PR Index Bloomberg Ticker MSDEE15
PR Index Reuters RIC .dMIEU00000PEU

Further information on HSBC ETFs Tel: 020 7024 0435 E-mail: [email protected] Website: www.etf.hsbc.com
4
About the Index
The Fund will aim to replicate the performance of the MSCI Europe Index as calculated by MSCI Inc. The MSCI Europe Index offers a representation of the major European equity markets (Austria, Belgium, Denmark, Finland, France, Germany, Greece, Ireland, Italy, Netherlands, Norway, Portugal, Spain, Sweden, Switzerland and the United Kingdom) by targeting all companies with a market capitalization within the top 85% of their investable equity universe, subject to a global minimum size requirement. It is based on MSCI’s Global Investable Market Indices methodology.
The composition of the Index is reviewed on a quarterly basis and carried out according to the published rules governing the management of the Index as set out by MSCI Inc.
Yearly fund performance (%)
31/05/09 - 31/05/10 31/05/10 - 31/05/11 31/05/11 - 31/05/12 31/05/12 - 31/05/13 31/05/13 - 31/05/14
HSBC MSCI EUROPE UCITS ETF N/A N/A -11.73 28.70 17.05
Fund and Index cumulative performance (%)
1 month 3 months 1 year 3 years Since inception
HSBC MSCI EUROPE UCITS ETF 2.61 3.75 17.05 32.97 56.25
MSCI Europe Net 2.52 3.60 16.98 32.75 55.73
Tracking difference1 0.09 0.15 0.07 0.22 0.51
Tracking error2 N/A N/A 0.067 N/A 0.115
1 The tracking difference Net is the difference between the return of the fund (NAV) and that of the underlying index, after management fees (TER).2 The tracking error also known active risk, is the standard deviation of the tracking difference i.e. how variable is the tracking difference over time. The optimal tracking error would be zero.
Source: HSBC Global Asset Management (UK) Limited. All data as at 31/05/2014
Any performance information shown refers to the past and should not be seen as an indication of future returns.
Performance is shown using the net asset value of the fund, calculated from the closing price of the underlying securities. Performance is shown after fees including re-invested dividends in the base currency of the fund and does not take into account any currency exposure that may exist against the trading currency of the fund, where this is different.
Listing and trading information
Listing date
Trading currency
Trading hours (local time)
Bloomberg ticker
Reuters RIC
iNAV Bloomberg
iNAV Reuters
London Stock Exchange 02/06/2010 GBP 08:00 - 16:30 HMEU LN HMEU.L HMEUGBPI HMEUINAVGBP=HSBL
London Stock Exchange N/A USD 08:00 - 16:30 N/A N/A N/A N/A
Euronext Paris 04/11/2010 EUR 09:00 - 17:30 HEU FP HEU.PA HMEUEURI HMEUINAVEUR=HSBL
SIX Swiss Exchange 06/09/2010 USD 09:00 - 17:30 HMEU SW HMEU.S HMEUUSDI HMEUINAVUSD=HSBL
SIX Swiss Exchange 11/04/2011 EUR 09:00 - 17:30 HMEUEUR SW HMEUS.S HMEUEURI HMEUINAVEUR=HSBL
Xetra Deutsche Börse 12/10/2010 EUR 09:00 - 17:30H4ZE GY & H4ZE GR
H4ZE.DE HMEUEURI HMEUINAVEUR=HSBL
Top 10 holdings of the Fund
Nestle 2.78% Royal Dutch Shell A 1.67%
Roche 2.27% Total 1.65%
Novartis 2.27% GlaxoSmithKline 1.43%
HSBC 2.17% Sanofi 1.40%
BP 1.73% Banco Santander 1.33%

5
Source: HSBC Global Asset Management (UK) Limited. All data as at 31/05/2014
HSBC EURO STOXX 50 UCITS ETFPhysical – Full replicationTicker: H50E
The HSBC EURO STOXX 50 UCITS ETF is an open ended UCITS IV compliant exchange-traded fund incorporated in Ireland.
Fund objective
The investment objective of the Fund is to replicate the performance of the EURO STOXX 50® Index (the “Index”), while minimising as far as possible the tracking error between the Fund’s performance and that of the Index. The Index is a market capitalisation weighted index designed to measure the performance of the 50 largest companies in the European Monetary Union.
In seeking to achieve its investment objective, the Fund will invest in securities included in the Index in the same proportions in which they are included in the Index.
Key facts
• Physical replication approach • Listed on London Stock Exchange, Euronext Paris, SIX Swiss
Exchange and Xetra Deutsche Börse • Total Expense Ratio (TER) of 0.15% per annum • Multi currency listing in GBP, EUR and USD • Fund registered in several European countries: UK, France, Germany,
Italy, Ireland, Netherlands, Spain, Sweden, Switzerland, Austria
Sector allocation of the Fund
Financials (26.37%) Industrials (12.28%) Health Care (9.89%) Consumer Staples (9.47%) Energy (9.43%) Consumer Discretionary (9.33%) Telecommunication Services (6.70%) Utilities (6.44%) Materials (6.26%) Information Technology (3.85%)
Country allocation of the Fund
France (36.20%) Germany (32.05%) Spain (12.89%) Italy (8.33%) Netherlands (6.74%) Belgium (3.06%) Ireland (0.74%)
Fund detailsUCITS IV compliant Yes
Fund domicile Ireland
UK distributor status (UKDS)* Yes
UK reporting fund status (UKRF) Yes
ISA eligible Yes
SIPP eligible Yes
*Distributor status for the period to 30/04/2009
Issuer HSBC ETFs Plc
Fund manager HSBC Global Asset Management (UK) Limited
Custodian HSBC Inwwstitutional Trust Services (Ireland) Limited
Fund administrator HSBC Securities Services (Ireland) Limited
Authorised participant HSBC Bank Plc
Benchmark EURO STOXX 50® Index
Number of holdings 50
Published daily on etf.hsbc.com website
Replication method Physical – Full replication
Base currency EUR
Fund inception date 05/10/2009
Listing date 06/10/2009
Fiscal year end 31 December
Total Expense Ratio (TER) 0.15%
Entry/Exit/Performance fees No
Net asset value (NAV) per share €33.80
Shares outstanding 2,010,000
Assets under management $92,706,601
Dividend treatment Distribution
Dividend frequency Semi-annual
Dividend currency EUR
Dividend per share €0.1611
Dividend yield* 2.5760%
Dividend ex date 29/01/2014
*Gross trailing 12 month yield.
ISIN IE00B4K6B022
Index informationIndex name EURO STOXX 50® Index
Index currency EUR
Benchmark type Net Return
Index rebalancing frequency Quarterly
TR index Bloomberg ticker SX5T
TR Index Reuters RIC .STOXX50ER
PR Index Bloomberg Ticker SX5E
PR Index Reuters RIC .STOXX50E

Further information on HSBC ETFs Tel: 020 7024 0435 E-mail: [email protected] Website: www.etf.hsbc.com
6
About the Index
The Index is an equity index calculated, maintained and published on a real-time basis by STOXX Limited and is denominated in Euro. The Index is composed by the 50 largest companies in terms of capitalisation in the EURO zone market.
The stocks comprising the Index are weighted according to their market capitalisation based on their free float with a 10 per cent. cap factor of each component of the Index.
The composition of the Index is reviewed on a quarterly basis (March, June, September, December).
Top 10 holdings of the Fund
Total 6.08% BASF 3.86%
Sanofi 4.70% Daimler 3.41%
Bayer 4.36% Anheuser-Busch 3.06%
Banco Santander 4.32% Allianz 2.80%
Siemens 4.03% Banco Bilbao 2.70%
Yearly fund performance (%)
31/05/09 - 31/05/10 31/05/10 - 31/05/11 31/05/11 - 31/05/12 31/05/12 - 31/05/13 31/05/13 - 31/05/14
HSBC EURO STOXX 50 UCITS ETF N/A N/A -22.51 35.79 21.16
Fund and Index cumulative performance (%)
1 month 3 months 1 year 3 years Since inception
HSBC EURO STOXX 50 UCITS ETF 2.93 5.13 21.16 27.49 39.70
Euro STOXX 50 Net 2.70 4.78 20.43 24.93 35.99
Tracking difference1 0.23 0.35 0.73 2.56 3.71
Tracking error2 N/A N/A 0.123 N/A 0.132
1 The tracking difference Net is the difference between the return of the fund (NAV) and that of the underlying index, after management fees (TER).2 The tracking error also known active risk, is the standard deviation of the tracking difference i.e. how variable is the tracking difference over time. The optimal tracking error would be zero.
Source: HSBC Global Asset Management (UK) Limited. All data as at 31/05/2014
Any performance information shown refers to the past and should not be seen as an indication of future returns.
Performance is shown using the net asset value of the fund, calculated from the closing price of the underlying securities. Performance is shown after fees including re-invested dividends in the base currency of the fund and does not take into account any currency exposure that may exist against the trading currency of the fund, where this is different.
Listing and trading information
Listing date
Trading currency
Trading hours (local time)
Bloomberg ticker
Reuters RIC
iNAV Bloomberg
iNAV Reuters
London Stock Exchange 06/10/2009 GBP 08:00 - 16:30 H50E LN H50E.L H50EGBPI H50EINAVGBP=HSBL
London Stock Exchange N/A USD 08:00 - 16:30 N/A N/A N/A N/A
Euronext Paris 07/12/2009 EUR 09:00 - 17:30 50E FP 50E.PA H50EEURI H50EINAVEUR=HSBL
SIX Swiss Exchange 03/09/2010 USD 09:00 - 17:30 H50E SW H50E.S H50EUSDI H50EINAVUSD=HSBL
SIX Swiss Exchange 11/04/2011 EUR 09:00 - 17:30 H50EEUR SW H50EE.S H50EEURI H50EINAVEUR=HSBL
XetraDeutsche Börse 11/10/2010 EUR 09:00 - 17:30H4ZA GY & H4ZA GR
H4ZA.DE H50EEURI H50EINAVEUR=HSBL
7
Source: HSBC Global Asset Management (UK) Limited. All data as at 31/05/2014
HSBC MSCI WORLD UCITS ETFPhysical – Optimised replicationTicker: HMWO
The HSBC MSCI WORLD UCITS ETF is an open ended UCITS IV compliant exchange-traded fund incorporated in Ireland.
Fund objectiveThe investment objective of the Fund is to replicate the performance of the MSCI World Index (the “Index”), while minimising as far as possible the tracking error between the Fund’s performance and that of the Index. The Index is a market-capitalisation weighted index designed to measure the performance of the largest companies of the world’s developed equity markets, including Austria, Belgium, Denmark, Finland, France, Germany, Greece, Ireland, Italy, Israel, The Netherlands, Norway, Portugal, Spain, Sweden, Switzerland, United Kingdom, Hong Kong, Japan, Singapore, Australia, New Zealand, Canada and USA, as defined by the Index Provider.In seeking to achieve its investment objective, the Fund will aim to invest in securities included in the Index in generally the same proportions in which they are included in the Index.
Key facts
• Physical replication approach • Listed on London Stock Exchange, Euronext Paris, SIX Swiss
Exchange and Xetra Deutsche Börse • Total Expense Ratio (TER) of 0.35% per annum • Currency listing in GBP, EUR and USD • Fund registered in several European countries: UK, France, Germany,
Italy, Ireland, Netherlands, Spain, Sweden, Switzerland, Austria
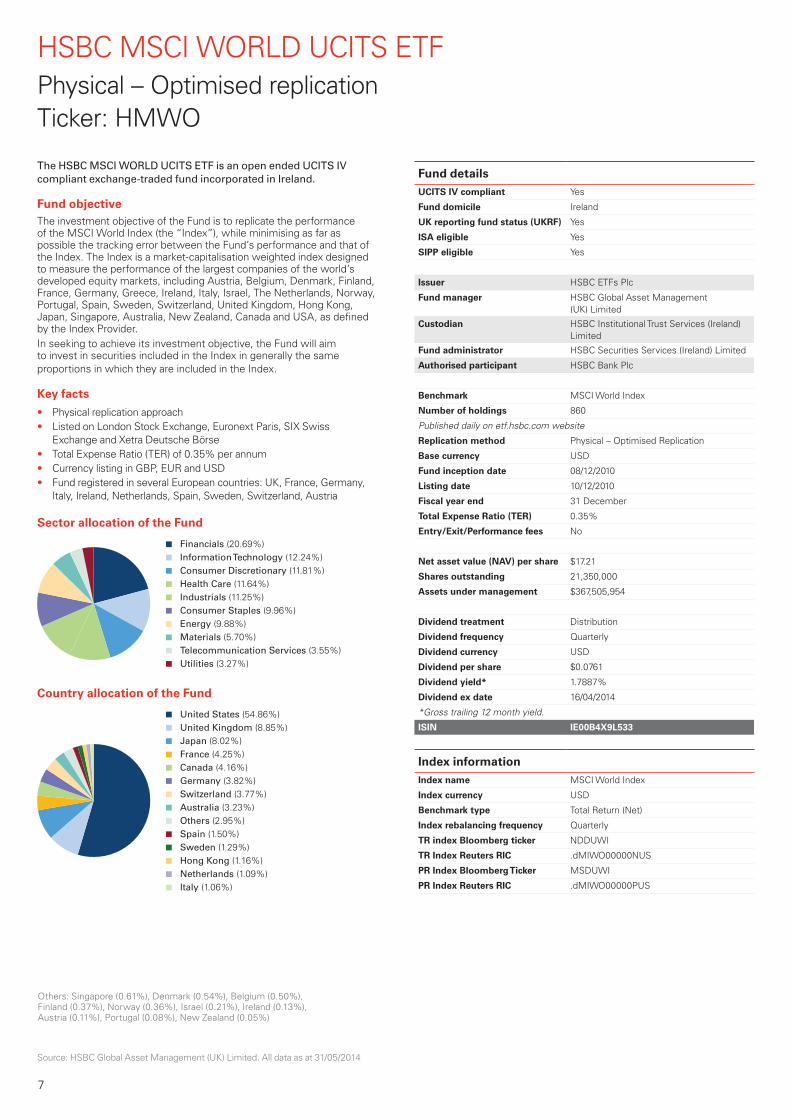
Sector allocation of the Fund
Financials (20.69%) Information Technology (12.24%) Consumer Discretionary (11.81%) Health Care (11.64%) Industrials (11.25%) Consumer Staples (9.96%) Energy (9.88%) Materials (5.70%) Telecommunication Services (3.55%) Utilities (3.27%)
Country allocation of the Fund
United States (54.86%) United Kingdom (8.85%) Japan (8.02%) France (4.25%) Canada (4.16%) Germany (3.82%) Switzerland (3.77%) Australia (3.23%) Others (2.95%) Spain (1.50%) Sweden (1.29%) Hong Kong (1.16%) Netherlands (1.09%) Italy (1.06%)
Fund detailsUCITS IV compliant Yes
Fund domicile Ireland
UK reporting fund status (UKRF) Yes
ISA eligible Yes
SIPP eligible Yes
Issuer HSBC ETFs Plc
Fund manager HSBC Global Asset Management (UK) Limited
Custodian HSBC Institutional Trust Services (Ireland) Limited
Fund administrator HSBC Securities Services (Ireland) Limited
Authorised participant HSBC Bank Plc
Benchmark MSCI World Index
Number of holdings 860
Published daily on etf.hsbc.com website
Replication method Physical – Optimised Replication
Base currency USD
Fund inception date 08/12/2010
Listing date 10/12/2010
Fiscal year end 31 December
Total Expense Ratio (TER) 0.35%
Entry/Exit/Performance fees No
Net asset value (NAV) per share $17.21
Shares outstanding 21,350,000
Assets under management $367,505,954
Dividend treatment Distribution
Dividend frequency Quarterly
Dividend currency USD
Dividend per share $0.0761
Dividend yield* 1.7887%
Dividend ex date 16/04/2014
*Gross trailing 12 month yield.
ISIN IE00B4X9L533
Index informationIndex name MSCI World Index
Index currency USD
Benchmark type Total Return (Net)
Index rebalancing frequency Quarterly
TR index Bloomberg ticker NDDUWI
TR Index Reuters RIC .dMIWO00000NUS
PR Index Bloomberg Ticker MSDUWI
PR Index Reuters RIC .dMIWO00000PUS
Others: Singapore (0.61%), Denmark (0.54%), Belgium (0.50%), Finland (0.37%), Norway (0.36%), Israel (0.21%), Ireland (0.13%), Austria (0.11%), Portugal (0.08%), New Zealand (0.05%)

Further information on HSBC ETFs Tel: 020 7024 0435 E-mail: [email protected] Website: www.etf.hsbc.com
8
About the Index
The Fund will aim to replicate the performance of the Index as calculated by MSCI Inc.
The Index offers a representation of the world’s developed equity markets (Austria, Belgium, Denmark, Finland, France, Germany, Ireland, Israel, Italy, Netherlands, Norway, Portugal, Spain, Sweden, Switzerland, United Kingdom, Hong Kong, Japan, Singapore, Australia, New Zealand, Canada and USA) by targeting all companies with a market capitalization within the top 85% of their investable equity universe, subject to a global minimum size requirement. It is based on MSCI’s Global Investable Market Indices methodology.
Top 10 holdings of the Fund
Apple 1.73% Wells Fargo 0.77%
Exxon Mobil 1.33% Nestle 0.77%
Microsoft 0.99% Chevron 0.72%
Johnson & Johnson 0.87% Procter & Gamble 0.67%
General Electric 0.82% JPMorgan Chase 0.63%
Yearly fund performance (%)
31/05/09 - 31/05/10 31/05/10 - 31/05/11 31/05/11 - 31/05/12 31/05/12 - 31/05/13 31/05/13 - 31/05/14
HSBC MSCI WORLD UCITS ETF N/A N/A -10.99 27.78 18.26
Fund and Index cumulative performance (%)
1 month 3 months 1 year 3 years Since inception
HSBC MSCI WORLD UCITS ETF 1.97 3.32 18.26 34.50 47.12
MSCI World Net 1.97 3.16 18.87 35.14 48.00
Tracking difference1 0.00 0.16 -0.61 -0.64 -0.88
Tracking error2 N/A N/A 0.363 N/A 0.412
1 The tracking difference Net is the difference between the return of the fund (NAV) and that of the underlying index, after management fees (TER).2 The tracking error also known active risk, is the standard deviation of the tracking difference i.e. how variable is the tracking difference over time. The optimal tracking error would be zero.
Source: HSBC Global Asset Management (UK) Limited. All data as at 31/05/2014
Any performance information shown refers to the past and should not be seen as an indication of future returns.
Performance is shown using the net asset value of the fund, calculated from the closing price of the underlying securities. Performance is shown after fees including re-invested dividends in the base currency of the fund and does not take into account any currency exposure that may exist against the trading currency of the fund, where this is different.
Listing and trading information
Listing date
Trading currency
Trading hours (local time)
Bloomberg ticker
Reuters RIC
iNAV Bloomberg
iNAV Reuters
London Stock Exchange 10/12/2010 GBP 08:00 - 16:30 HMWO LN HMWO.L HMWOGBPI HMWOINAVGBP=HSBL
London Stock Exchange 10/12/2010 USD 08:00 - 16:30 HMWD LN HMWD.L HMWOUSDI HMWOINAVUSD=HSBL
Euronext Paris 09/05/2011 EUR 09:00 - 17:30 WRD FP WRD.PA HMWOEURI HMWOINAVEUR=HSBL
SIX Swiss Exchange 27/04/2011 USD 09:00 - 17:30 HMWO SW HMWO.S HMWOUSDI HMWOINAVUSD=HSBL
SIX Swiss Exchange N/A EUR 09:00 - 17:30 N/A N/A N/A N/A
Xetra Deutsche Börse 27/09/2013 EUR 09:00 - 17:30H4ZJ GY & H4ZJ GR
H4ZJ.DE HMWOEURI HMWOINAVEUR=HSBL

9
Source: HSBC Global Asset Management (UK) Limited. All data as at 31/05/2014
HSBC S&P 500 UCITS ETFPhysical – Full replicationTicker: HSPX
The HSBC S&P 500 UCITS ETF is an open ended UCITS IV compliant exchange-traded fund incorporated in Ireland.
Fund objective
The investment objective of the Fund is to replicate the performance of the S&P 500® Index (the “Index”), while minimising as far as possible the tracking error between the Fund’s performance and that of the Index. The Index is a free float adjusted market-capitalisation index designed to measure large cap US equity market performance.
In seeking to achieve its investment objective, the Fund will aim to invest in securities included in the Index in the same proportions in which they are included in the Index.
Key facts
• Physical replication approach • Listed on London Stock Exchange, Euronext Paris, SIX Swiss
Exchange and Xetra Deutsche Börse • Total Expense Ratio (TER) of 0.09% per annum • Multi currency listing in GBP, EUR and USD • Fund registered in several European countries: UK, France, Germany,
Italy, Ireland, Netherlands, Spain, Sweden, Switzerland, Austria • Fund registered in Hong Kong
Sector allocation of the Fund
Information Technology (18.85%) Financials (15.98%) Health Care (13.27%) Consumer Discretionary (11.93%) Industrials (10.67%) Energy (10.49%) Consumer Staples (9.74%) Materials (3.53%) Utilities (3.06%) Telecommunication Services (2.48%)
Country allocation of the Fund
United States (100%)
Fund detailsUCITS IV compliant Yes
Fund domicile Ireland
UK reporting fund status (UKRF) Yes
ISA eligible Yes
SIPP eligible Yes
Issuer HSBC ETFs Plc
Fund manager HSBC Global Asset Management (UK) Limited
Custodian HSBC Institutional Trust Services (Ireland) Limited
Fund administrator HSBC Securities Services (Ireland) Limited
Authorised participant HSBC Bank Plc
Benchmark S&P 500® Index
Number of holdings 500
Published daily on etf.hsbc.com website
Replication method Physical – Full replication
Base currency USD
Fund inception date 14/05/2010
Listing date 17/05/2010
Fiscal year end 31 December
Total Expense Ratio (TER) 0.09%
Entry/Exit/Performance fees No
Net asset value (NAV) per share $19.39
Shares outstanding 78,150,000
Assets under management $1,515,625,636
Dividend treatment Distribution
Dividend frequency Semi-annual
Dividend currency USD
Dividend per share $0.1509
Dividend yield* 1.4835%
Dividend ex date 15/01/2014
*Gross trailing 12 month yield.
ISIN IE00B5KQNG97
Index informationIndex name S&P 500® Index
Index currency USD
Benchmark type Total Return (net)
Index rebalancing frequency Quarterly
TR index Bloomberg ticker SPTR500N
TR Index Reuters RIC .SPXNTR
PR Index Bloomberg Ticker SPX
PR Index Reuters RIC .GSPC

Further information on HSBC ETFs Tel: 020 7024 0435 E-mail: [email protected] Website: www.etf.hsbc.com
10
About the IndexThe Fund tracks the performance of the S&P 500® Index. The Index is an equity index calculated, maintained and published on a real-time basis by Standard & Poor’s and is denominated in US Dollars. The Index is composed of the 500 largest and most liquid US stocks. The Index is designed to provide investors the return of the US large cap equity market.The stocks comprising the Index are weighted according to their free float market capitalization. Changes to the index are made on a quarterly basis. Ad-hoc changes in response to corporate actions and market developments can however be made at any time. Constituent changes are typically announced one to five days before they are scheduled to be implemented. Announcements are available to the public via the website, www.indices.standardandpoors.com, before or at the same time they are available to clients or the affected companies.
Top 10 holdings of the Fund
Apple 3.29% Wells Fargo 1.42%
Exxon Mobil 2.53% Chevron 1.37%
Microsoft 1.80% Berkshire Hathaway 1.35%
Johnson & Johnson 1.67% Procter & Gamble 1.28%
General Electric 1.57% JPMorgan Chase 1.23%
Yearly fund performance (%)
31/05/09 - 31/05/10 31/05/10 - 31/05/11 31/05/11 - 31/05/12 31/05/12 - 31/05/13 31/05/13 - 31/05/14
HSBC S&P 500 UCITS ETF N/A N/A -0.83 26.74 19.97
Fund and Index cumulative performance (%)
1 month 3 months 1 year 3 years Since inception
HSBC S&P 500 UCITS ETF 2.30 3.87 19.97 50.78 81.34
S&P 500 Net 2.27 3.81 19.69 49.70 79.72
Tracking difference1 0.03 0.06 0.27 1.08 1.62
Tracking error2 N/A N/A 0.027 N/A 0.032
1 The tracking difference Net is the difference between the return of the fund (NAV) and that of the underlying index, after management fees (TER).2 The tracking error also known active risk, is the standard deviation of the tracking difference i.e. how variable is the tracking difference over time. The optimal tracking error would be zero.
Source: HSBC Global Asset Management (UK) Limited. All data as at 31/05/2014
Any performance information shown refers to the past and should not be seen as an indication of future returns.
Performance is shown using the net asset value of the fund, calculated from the closing price of the underlying securities. Performance is shown after fees including re-invested dividends in the base currency of the fund and does not take into account any currency exposure that may exist against the trading currency of the fund, where this is different.
Listing and trading information
Listing date
Trading currency
Trading hours (local time)
Bloomberg ticker
Reuters RIC
iNAV Bloomberg
iNAV Reuters
London Stock Exchange 17/05/2010 GBP 08:00 - 16:30 HSPX LN HSPX.L HSPXGBPI HSPXINAVGBP=HSBL
London Stock Exchange 28/06/2010 USD 08:00 - 16:30 HSPD LN HSPD.L HSPXUSDI HSPXINAVUSD=HSBL
Euronext Paris 03/11/2010 EUR 09:00 - 17:30 HHH FP HHH.PA HSPXEURI HSPXINAVEUR=HSBL
SIX Swiss Exchange 08/09/2010 USD 09:00 - 17:30 HSPX SW HSPX.S HSPXUSDI HSPXINAVUSD=HSBL
SIX Swiss Exchange N/A EUR 09:00 - 17:30 N/A N/A N/A N/A
Xetra Deutsche Börse 13/10/2010 EUR 09:00 - 17:30H4ZF GY & H4ZF GR
H4ZF.DE HSPXEURI HSPXINAVEUR=HSBL

11
Source: HSBC Global Asset Management (UK) Limited. All data as at 31/05/2014
HSBC FTSE 100 UCITS ETFPhysical – Full replicationTicker: HUKX
The HSBC FTSE 100 UCITS ETF is an open ended UCITS IV compliant exchange-traded fund incorporated in Ireland.
Fund objective
The investment objective of the Fund is to replicate the performance of the FTSE® 100 Index (the “Index”), while minimising as far as possible the tracking error between the Fund’s performance and that of the Index. The Index is a market-capitalisation weighted index designed to measure the performance of the 100 largest companies in the United Kingdom.
In seeking to achieve its investment objective, the Fund will invest in securities included in the Index in the same proportions in which they are included in the Index.
Key facts
• Physical replication approach • Listed on London Stock Exchange, Euronext Paris, SIX Swiss
Exchange and Xetra Deutsche Börse • Total Expense Ratio (TER) of 0.35% per annum • Multi currency listing in GBP, EUR and USD • Fund registered in several European countries: UK, France, Germany,
Italy, Ireland, Netherlands, Spain, Sweden, Switzerland
Sector allocation of the Fund
Financials (21.32%) Energy (17.22%) Consumer Staples (16.54%) Materials (9.41%) Health Care (9.31%) Consumer Discretionary (8.76%) Industrials (7.02%) Telecommunication Services (5.03%) Utilities (4.39%) Information Technology (1.00%)
Country allocation of the Fund
United Kingdom (100%)
Fund detailsUCITS IV compliant Yes
Fund domicile Ireland
UK distributor status (UKDS)* Yes
UK reporting fund status (UKRF) Yes
ISA eligible Yes
SIPP eligible Yes
*Distributor status for the period to 30/04/2009
Issuer HSBC ETFs Plc
Fund manager HSBC Global Asset Management (UK) Limited
Custodian HSBC Institutional Trust Services (Ireland) Limited
Fund administrator HSBC Securities Services (Ireland) Limited
Authorised participant HSBC Bank Plc
Benchmark FTSE 100® Index
Number of holdings 101
Published daily on etf.hsbc.com website
Replication method Physical – Full replication
Base currency GBP
Fund inception date 24/08/2009
Listing date 25/08/2009
Fiscal year end 31 December
Total Expense Ratio (TER) 0.35%
Entry/Exit/Performance fees No
Net asset value (NAV) per share £69.14
Shares outstanding 4,010,000
Assets under management $465,028,409
Dividend treatment Distribution
Dividend frequency Semi-annual
Dividend currency GBP
Dividend per share £0.9216
Dividend yield* 3.2138%
Dividend ex date 29/01/2014
*Gross trailing 12 month yield.
ISIN IE00B42TW061
Index informationIndex name FTSE 100® Index
Index currency GBP
Benchmark type Gross Total Return
Index rebalancing frequency Annual
TR index Bloomberg ticker TUKXG
TR Index Reuters RIC .TFTSE
PR Index Bloomberg Ticker UKX
PR Index Reuters RIC N/A

Further information on HSBC ETFs Tel: 020 7024 0435 E-mail: [email protected] Website: www.etf.hsbc.com
12
About the Index
The Index is an equity index calculated, maintained and published on a real-time basis by international index supplier FTSE® and is denominated in Sterling. It tracks the movements of the 100 main stocks listed on the London Stock Exchange.
The stocks comprising the Index are weighted according to their market capitalisation based on their free float with a 15 per cent. cap factor of each component of the Index.
The composition of the Index is reviewed on an annual basis according to the FTSE® methodology.
Top 10 holdings of the Fund
HSBC 6.95% Royal Dutch Shell B 3.46%
BP 5.38% Vodafone 3.22%
Royal Dutch Shell A 5.35% AstraZeneca 3.09%
GlaxoSmithKline 4.51% Diageo 2.80%
British American Tobacco
3.94% Lloyds Banking Group 2.44%
Yearly fund performance (%)
31/05/09 - 31/05/10 31/05/10 - 31/05/11 31/05/11 - 31/05/12 31/05/12 - 31/05/13 31/05/13 - 31/05/14
HSBC FTSE 100 UCITS ETF N/A N/A -8.05 27.97 7.36
Fund and Index cumulative performance (%)
1 month 3 months 1 year 3 years Since inception
HSBC FTSE 100 UCITS ETF 1.34 1.66 7.36 26.33 62.46
FTSE 100 Gross 1.37 1.76 7.78 27.73 65.39
Tracking difference1 -0.03 -0.10 -0.42 -1.40 -2.94
Tracking error2 N/A N/A 0.050 N/A 0.043
1 The tracking difference Net is the difference between the return of the fund (NAV) and that of the underlying index, after management fees (TER).2 The tracking error also known active risk, is the standard deviation of the tracking difference i.e. how variable is the tracking difference over time. The optimal tracking error would be zero.
Source: HSBC Global Asset Management (UK) Limited. All data as at 31/05/2014
Any performance information shown refers to the past and should not be seen as an indication of future returns.
Performance is shown using the net asset value of the fund, calculated from the closing price of the underlying securities. Performance is shown after fees including re-invested dividends in the base currency of the fund and does not take into account any currency exposure that may exist against the trading currency of the fund, where this is different.
Listing and trading information
Listing date
Trading currency
Trading hours (local time)
Bloomberg ticker
Reuters RIC
iNAV Bloomberg
iNAV Reuters
London Stock Exchange 25/08/2009 GBP 08:00 - 16:30 HUKX LN HUKX.L HUKXIV HUKXINAVGBP=HSBL
London Stock Exchange N/A USD 08:00 - 16:30 N/A N/A N/A N/A
Euronext Paris 08/12/2009 EUR 09:00 - 17:30 UKX FP UKX.PA HUKXEURI HUKXINAVEUR=HSBL
SIX Swiss Exchange 02/09/2010 USD 09:00 - 17:30 HUKX SW HUKX.S HUKXUSDI HUKXINAVUSD=HSBL
SIX Swiss Exchange N/A EUR 09:00 - 17:30 N/A N/A N/A N/A
Xetra Deutsche Börse 08/10/2010 EUR 09:00 - 17:30H4ZB GY & H4ZB GR
H4ZB.DE HUKXEURI HUKXINAVEUR=HSBL

13
Source: HSBC Global Asset Management (UK) Limited. All data as at 31/05/2014
HSBC MSCI USA UCITS ETFPhysical – Full replicationTicker: HMUS
The HSBC MSCI USA UCITS ETF is an open ended UCITS IV compliant exchange-traded fund incorporated in Ireland.
Fund objective
The investment objective of the Fund is to replicate the performance of the MSCI USA Index (the “Index”), while minimising as far as possible the tracking error between the Fund’s performance and that of the Index. The Index is a free float adjusted market-capitalisation index designed to measure large and mid cap US equity market performance.
In seeking to achieve its investment objective, the Fund will aim to invest in securities included in the Index in the same proportions in which they are included in the Index.
Key facts
• Physical replication approach • Listed on London Stock Exchange, Euronext Paris, SIX Swiss
Exchange and Xetra Deutsche Börse • Total Expense Ratio (TER) of 0.30% per annum • Multi currency listing in GBP, EUR and USD • Fund registered in several European countries: UK, France, Germany,
Italy, Ireland, Netherlands, Spain, Sweden, Switzerland, Austria
Sector allocation of the Fund
Information Technology (18.98%) Financials (15.78%) Health Care (13.13%) Consumer Discretionary (12.40%) Energy (10.58%) Industrials (10.48%) Consumer Staples (9.51%) Materials (3.53%) Utilities (3.05%) Telecommunication Services (2.57%)
Top 10 holdings of the Fund
Apple 3.15% Wells Fargo 1.41%
Exxon Mobil 2.43% Chevron 1.31%
Microsoft 1.80% Procter & Gamble 1.22%
Johnson & Johnson 1.58% JPMorgan Chase 1.16%
General Electric 1.50%Verizon Communications
1.14%
Fund detailsUCITS IV compliant Yes
Fund domicile Ireland
UK reporting fund status (UKRF) Yes
ISA eligible Yes
SIPP eligible Yes
Issuer HSBC ETFs Plc
Fund manager HSBC Global Asset Management (UK) Limited
Custodian HSBC Institutional Trust Services (Ireland) Limited
Fund administrator HSBC Securities Services (Ireland) Limited
Authorised participant HSBC Bank Plc
Benchmark MSCI USA Index
Number of holdings 609
Published daily on etf.hsbc.com website
Replication method Physical – Full replication
Base currency USD
Fund inception date 01/06/2010
Listing date 02/06/2010
Fiscal year end 31 December
Total Expense Ratio (TER) 0.30%
Entry/Exit/Performance fees No
Net asset value (NAV) per share $18.52
Shares outstanding 18,650,000
Assets under management $345,424,634
Dividend treatment Distribution
Dividend frequency Semi-annual
Dividend currency USD
Dividend per share $0.1228
Dividend yield* 1.2828%
Dividend ex date 15/01/2014
*Gross trailing 12 month yield.
ISIN IE00B5WFQ436
Index informationIndex name MSCI USA Index
Index currency USD
Benchmark type Total Return (Net)
Index rebalancing frequency Quarterly
TR index Bloomberg ticker NDDUUS
TR Index Reuters RIC .dMIUS00000NUS
PR Index Bloomberg Ticker MSDUUS
PR Index Reuters RIC .dMIUS00000PUS

Further information on HSBC ETFs Tel: 020 7024 0435 E-mail: [email protected] Website: www.etf.hsbc.com
14
About the Index
The Fund will aim to replicate the performance of the Index as calculated by MSCI Inc.
The Index is a free float adjusted market capitalization index designed to measure large and mid cap US equity market performance. The Index is a member of the MSCI International Equity Index Series and represents the US equity portion of the global benchmark MSCI All Country World Index (“MSCI ACWI”). The Index is calculated in US Dollars each trading day.
The composition of the Index is reviewed on a quarterly basis and carried out according to the published rules governing the management of the Index as set out by MSCI Inc.
Yearly fund performance (%)
31/05/09 - 31/05/10 31/05/10 - 31/05/11 31/05/11 - 31/05/12 31/05/12 - 31/05/13 31/05/13 - 31/05/14
HSBC MSCI USA UCITS ETF N/A N/A -1.23 26.34 20.00
Fund and Index cumulative performance (%)
1 month 3 months 1 year 3 years Since inception
HSBC MSCI USA UCITS ETF 2.32 3.56 20.00 49.74 91.87
MSCI USA Net 2.32 3.56 20.00 49.60 91.73
Tracking difference1 0.01 0.00 0.01 0.14 0.15
Tracking error2 N/A N/A 0.033 N/A 0.043
1 The tracking difference Net is the difference between the return of the fund (NAV) and that of the underlying index, after management fees (TER).2 The tracking error also known active risk, is the standard deviation of the tracking difference i.e. how variable is the tracking difference over time. The optimal tracking error would be zero.
Source: HSBC Global Asset Management (UK) Limited. All data as at 31/05/2014
Any performance information shown refers to the past and should not be seen as an indication of future returns.
Performance is shown using the net asset value of the fund, calculated from the closing price of the underlying securities. Performance is shown after fees including re-invested dividends in the base currency of the fund and does not take into account any currency exposure that may exist against the trading currency of the fund, where this is different.
Listing and trading information
Listing date
Trading currency
Trading hours (local time)
Bloomberg ticker
Reuters RIC
iNAV Bloomberg
iNAV Reuters
London Stock Exchange 02/06/2010 GBP 08:00 - 16:30 HMUS LN HMUS.L HMUSGBPI HMUSINAVGBP=HSBL
London Stock Exchange N/A USD 08:00 - 16:30 HMUD LN HMUD.L HMUSUSDI HMUSINAVUSD=HSBL
Euronext Paris 04/11/2010 EUR 09:00 - 17:30 MUS FP MUS.PA HMUSEURI HMUSINAVEUR=HSBL
SIX Swiss Exchange 06/09/2010 USD 09:00 - 17:30 HMUS SW HMUS.S HMUSUSDI HMUSINAVUSD=HSBL
SIX Swiss Exchange 11/04/2011 EUR 09:00 - 17:30 N/A N/A N/A N/A
Xetra Deutsche Börse 12/10/2010 EUR 09:00 - 17:30 H4ZD GY & H4ZD GR
H4ZD.DE HMUSEURI HMUSINAVEUR=HSBL

15
Source: HSBC Global Asset Management (UK) Limited. All data as at 31/05/2014
HSBC MSCI JAPAN UCITS ETFPhysical – Full replicationTicker: HMJP
The HSBC MSCI Japan UCITS ETF is an open ended UCITS IV compliant exchange-traded fund incorporated in Ireland.
Fund objective
The investment objective of the Fund is to replicate the performance of the MSCI Japan Index (the “Index”), while minimising as far as possible the tracking error between the Fund’s performance and that of the Index. The Index is a free float adjusted market-capitalisation index designed to measure large and mid cap Japanese equity market performance the securities of which are currently listed on Japanese exchanges. It is feasible, however, that additional stocks may be added to the Index in the future which are listed on other Recognised Markets.
In seeking to achieve its investment objective, the Fund will aim to invest in securities included in the Index in the same proportions in which they are included in the Index.
Key facts
• Physical replication approach • Listed on London Stock Exchange, Euronext Paris, SIX Swiss
Exchange and Xetra Deutsche Börse • Total Expense Ratio (TER) of 0.40% per annum • Multi currency listing in GBP, EUR and USD • Fund registered in several European countries: UK, France, Germany,
Italy, Ireland, Netherlands, Spain, Sweden, Switzerland • Fund registered in Hong Kong
Sector allocation of the Fund
Consumer Discretionary (20.97%) Financials (20.04%) Industrials (19.84%) Information Technology (10.78%) Consumer Staples (6.83%) Health Care (6.17%) Materials (6.02%) Telecommunication Services (5.65%) Utilities (2.50%) Energy (1.22%)
Top 10 holdings of the Fund
Toyota Motor 5.92% Mizuho Financial Group 1.70%
Mitsubishi UFJ Financial Group
2.72% Japan Tobacco 1.41%
SoftBank 2.63% Canon 1.41%
Honda Motor 2.16% Takeda Pharmaceutical 1.35%
Sumitomo Mitsui Financial Group
1.95% Fanuc 1.24%
Fund detailsUCITS IV compliant Yes
Fund domicile Ireland
UK reporting fund status (UKRF) Yes
ISA eligible Yes
SIPP eligible Yes
Issuer HSBC ETFs Plc
Fund manager HSBC Global Asset Management (UK) Limited
Custodian HSBC Institutional Trust Services (Ireland) Limited
Fund administrator HSBC Securities Services (Ireland) Limited
Authorised participant HSBC Bank Plc
Benchmark MSCI Japan Index
Number of holdings 311
Published daily on etf.hsbc.com website
Replication method Physical – Full replication
Base currency USD
Fund inception date 23/03/2010
Listing date 24/03/2010
Fiscal year end 31 December
Total Expense Ratio (TER) 0.40%
Entry/Exit/Performance fees No
Net asset value (NAV) per share $26.43
Shares outstanding 7,501,273
Assets under management $198,246,219
Dividend treatment Distribution
Dividend frequency Semi-annual
Dividend currency USD
Dividend per share $0.1578
Dividend yield* 1.3190%
Dividend ex date 22/01/2014
*Gross trailing 12 month yield.
ISIN IE00B5VX7566
Index informationIndex name MSCI Japan Index
Index currency USD
Benchmark type Total Return (Net)
Index rebalancing frequency Quarterly
TR index Bloomberg ticker NDDUJN
TR Index Reuters RIC .dMIJP00000NUS
PR Index Bloomberg Ticker MSDUJN
PR Index Reuters RIC .dMIJP00000PUS
Further information on HSBC ETFs Tel: 020 7024 0435 E-mail: [email protected] Website: www.etf.hsbc.com
16
About the Index
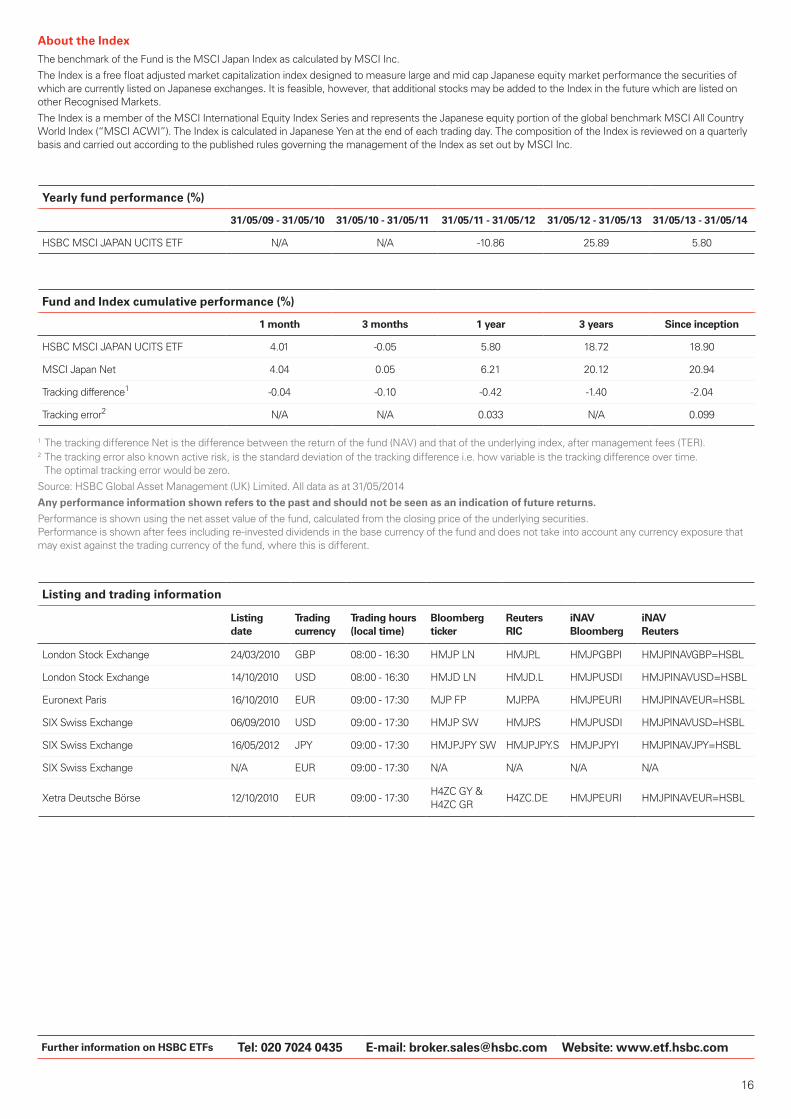
The benchmark of the Fund is the MSCI Japan Index as calculated by MSCI Inc.
The Index is a free float adjusted market capitalization index designed to measure large and mid cap Japanese equity market performance the securities of which are currently listed on Japanese exchanges. It is feasible, however, that additional stocks may be added to the Index in the future which are listed on other Recognised Markets.
The Index is a member of the MSCI International Equity Index Series and represents the Japanese equity portion of the global benchmark MSCI All Country World Index (“MSCI ACWI”). The Index is calculated in Japanese Yen at the end of each trading day. The composition of the Index is reviewed on a quarterly basis and carried out according to the published rules governing the management of the Index as set out by MSCI Inc.
Yearly fund performance (%)
31/05/09 - 31/05/10 31/05/10 - 31/05/11 31/05/11 - 31/05/12 31/05/12 - 31/05/13 31/05/13 - 31/05/14
HSBC MSCI JAPAN UCITS ETF N/A N/A -10.86 25.89 5.80
Fund and Index cumulative performance (%)
1 month 3 months 1 year 3 years Since inception
HSBC MSCI JAPAN UCITS ETF 4.01 -0.05 5.80 18.72 18.90
MSCI Japan Net 4.04 0.05 6.21 20.12 20.94
Tracking difference1 -0.04 -0.10 -0.42 -1.40 -2.04
Tracking error2 N/A N/A 0.033 N/A 0.099
1 The tracking difference Net is the difference between the return of the fund (NAV) and that of the underlying index, after management fees (TER).2 The tracking error also known active risk, is the standard deviation of the tracking difference i.e. how variable is the tracking difference over time. The optimal tracking error would be zero.
Source: HSBC Global Asset Management (UK) Limited. All data as at 31/05/2014
Any performance information shown refers to the past and should not be seen as an indication of future returns.
Performance is shown using the net asset value of the fund, calculated from the closing price of the underlying securities. Performance is shown after fees including re-invested dividends in the base currency of the fund and does not take into account any currency exposure that may exist against the trading currency of the fund, where this is different.
Listing and trading information
Listing date
Trading currency
Trading hours (local time)
Bloomberg ticker
Reuters RIC
iNAV Bloomberg
iNAV Reuters
London Stock Exchange 24/03/2010 GBP 08:00 - 16:30 HMJP LN HMJP.L HMJPGBPI HMJPINAVGBP=HSBL
London Stock Exchange 14/10/2010 USD 08:00 - 16:30 HMJD LN HMJD.L HMJPUSDI HMJPINAVUSD=HSBL
Euronext Paris 16/10/2010 EUR 09:00 - 17:30 MJP FP MJP.PA HMJPEURI HMJPINAVEUR=HSBL
SIX Swiss Exchange 06/09/2010 USD 09:00 - 17:30 HMJP SW HMJP.S HMJPUSDI HMJPINAVUSD=HSBL
SIX Swiss Exchange 16/05/2012 JPY 09:00 - 17:30 HMJPJPY SW HMJPJPY.S HMJPJPYI HMJPINAVJPY=HSBL
SIX Swiss Exchange N/A EUR 09:00 - 17:30 N/A N/A N/A N/A
Xetra Deutsche Börse 12/10/2010 EUR 09:00 - 17:30H4ZC GY & H4ZC GR
H4ZC.DE HMJPEURI HMJPINAVEUR=HSBL
17
Source: HSBC Global Asset Management (UK) Limited. All data as at 31/05/2014
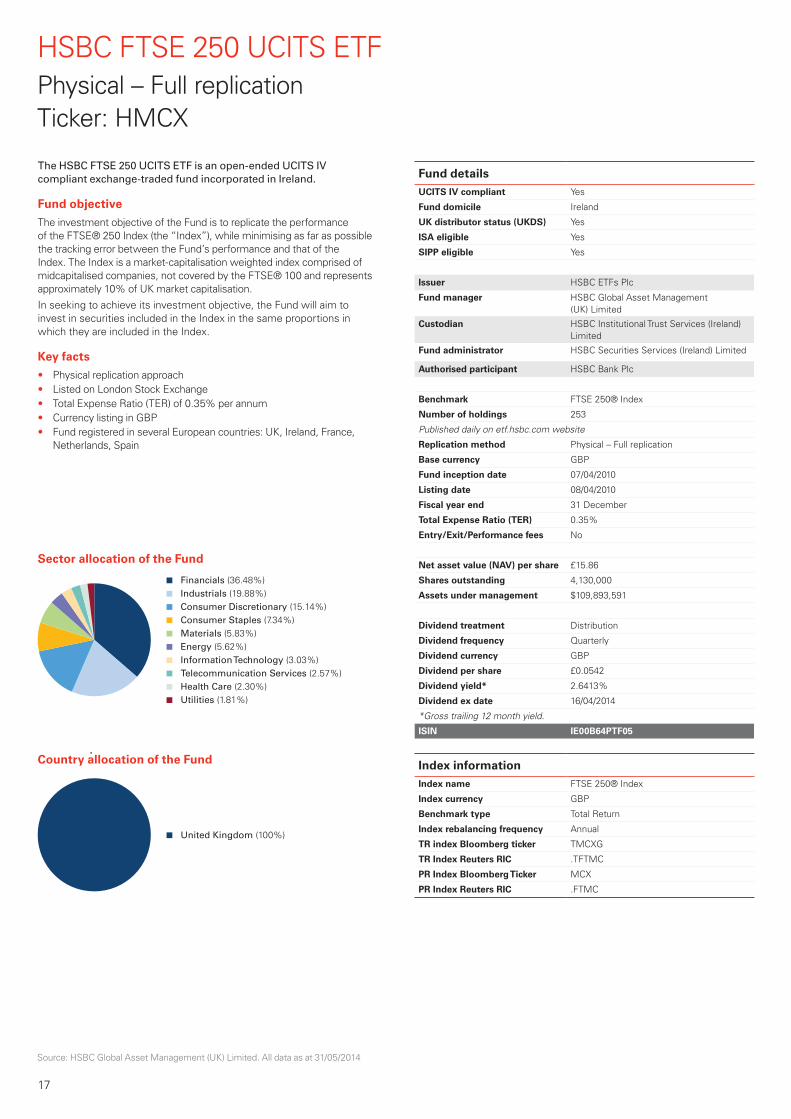
HSBC FTSE 250 UCITS ETFPhysical – Full replicationTicker: HMCX
The HSBC FTSE 250 UCITS ETF is an open-ended UCITS IV compliant exchange-traded fund incorporated in Ireland.
Fund objective
The investment objective of the Fund is to replicate the performance of the FTSE® 250 Index (the “Index”), while minimising as far as possible the tracking error between the Fund’s performance and that of the Index. The Index is a market-capitalisation weighted index comprised of midcapitalised companies, not covered by the FTSE® 100 and represents approximately 10% of UK market capitalisation.
In seeking to achieve its investment objective, the Fund will aim to invest in securities included in the Index in the same proportions in which they are included in the Index.
Key facts
• Physical replication approach • Listed on London Stock Exchange • Total Expense Ratio (TER) of 0.35% per annum • Currency listing in GBP • Fund registered in several European countries: UK, Ireland, France,
Netherlands, Spain
Sector allocation of the Fund
Financials (36.48%) Industrials (19.88%) Consumer Discretionary (15.14%) Consumer Staples (7.34%) Materials (5.83%) Energy (5.62%) Information Technology (3.03%) Telecommunication Services (2.57%) Health Care (2.30%) Utilities (1.81%)
Country allocation of the Fund
United Kingdom (100%)
Fund detailsUCITS IV compliant Yes
Fund domicile Ireland
UK distributor status (UKDS) Yes
ISA eligible Yes
SIPP eligible Yes
Issuer HSBC ETFs Plc
Fund manager HSBC Global Asset Management (UK) Limited
Custodian HSBC Institutional Trust Services (Ireland) Limited
Fund administrator HSBC Securities Services (Ireland) Limited
Authorised participant HSBC Bank Plc
Benchmark FTSE 250® Index
Number of holdings 253
Published daily on etf.hsbc.com website
Replication method Physical – Full replication
Base currency GBP
Fund inception date 07/04/2010
Listing date 08/04/2010
Fiscal year end 31 December
Total Expense Ratio (TER) 0.35%
Entry/Exit/Performance fees No
Net asset value (NAV) per share £15.86
Shares outstanding 4,130,000
Assets under management $109,893,591
Dividend treatment Distribution
Dividend frequency Quarterly
Dividend currency GBP
Dividend per share £0.0542
Dividend yield* 2.6413%
Dividend ex date 16/04/2014
*Gross trailing 12 month yield.
ISIN IE00B64PTF05
Index informationIndex name FTSE 250® Index
Index currency GBP
Benchmark type Total Return
Index rebalancing frequency Annual
TR index Bloomberg ticker TMCXG
TR Index Reuters RIC .TFTMC
PR Index Bloomberg Ticker MCX
PR Index Reuters RIC .FTMC
Further information on HSBC ETFs Tel: 020 7024 0435 E-mail: [email protected] Website: www.etf.hsbc.com
18
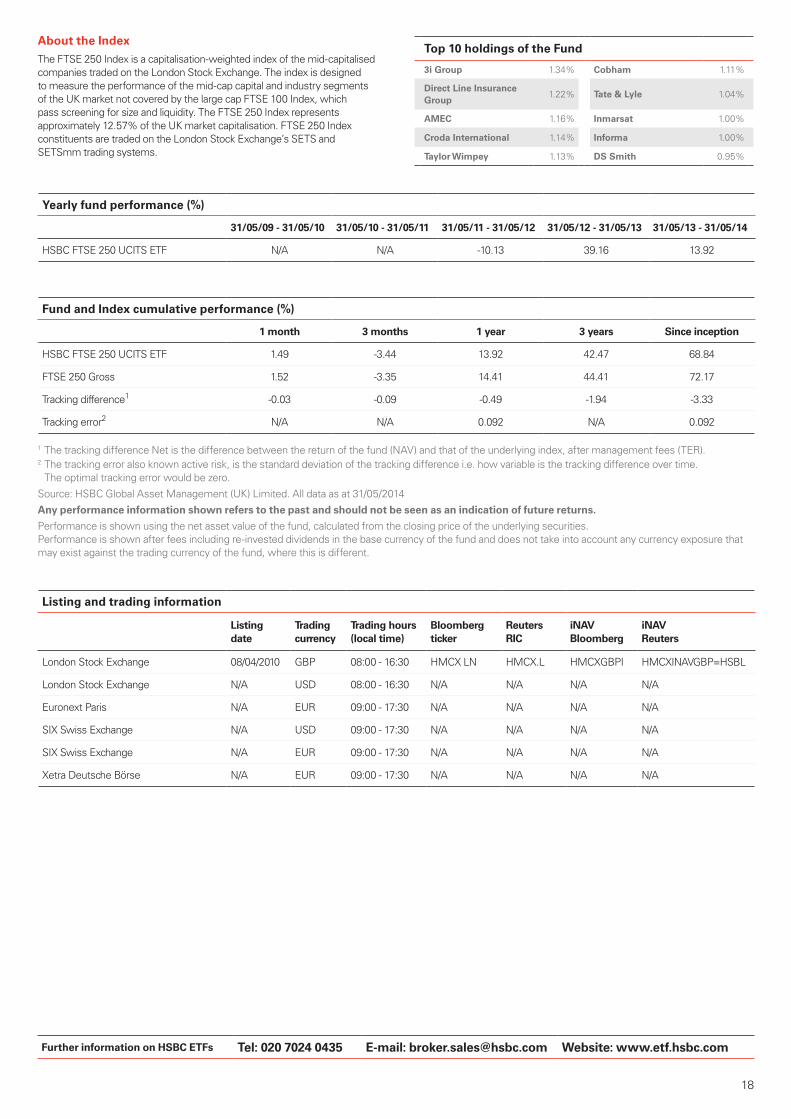
About the Index
The FTSE 250 Index is a capitalisation-weighted index of the mid-capitalised companies traded on the London Stock Exchange. The index is designed to measure the performance of the mid-cap capital and industry segments of the UK market not covered by the large cap FTSE 100 Index, which pass screening for size and liquidity. The FTSE 250 Index represents approximately 12.57% of the UK market capitalisation. FTSE 250 Index constituents are traded on the London Stock Exchange’s SETS and SETSmm trading systems.
Top 10 holdings of the Fund
3i Group 1.34% Cobham 1.11%
Direct Line Insurance Group
1.22% Tate & Lyle 1.04%
AMEC 1.16% Inmarsat 1.00%
Croda International 1.14% Informa 1.00%
Taylor Wimpey 1.13% DS Smith 0.95%
Yearly fund performance (%)
31/05/09 - 31/05/10 31/05/10 - 31/05/11 31/05/11 - 31/05/12 31/05/12 - 31/05/13 31/05/13 - 31/05/14
HSBC FTSE 250 UCITS ETF N/A N/A -10.13 39.16 13.92
Fund and Index cumulative performance (%)
1 month 3 months 1 year 3 years Since inception
HSBC FTSE 250 UCITS ETF 1.49 -3.44 13.92 42.47 68.84
FTSE 250 Gross 1.52 -3.35 14.41 44.41 72.17
Tracking difference1 -0.03 -0.09 -0.49 -1.94 -3.33
Tracking error2 N/A N/A 0.092 N/A 0.092
1 The tracking difference Net is the difference between the return of the fund (NAV) and that of the underlying index, after management fees (TER).2 The tracking error also known active risk, is the standard deviation of the tracking difference i.e. how variable is the tracking difference over time. The optimal tracking error would be zero.
Source: HSBC Global Asset Management (UK) Limited. All data as at 31/05/2014
Any performance information shown refers to the past and should not be seen as an indication of future returns.
Performance is shown using the net asset value of the fund, calculated from the closing price of the underlying securities. Performance is shown after fees including re-invested dividends in the base currency of the fund and does not take into account any currency exposure that may exist against the trading currency of the fund, where this is different.
Listing and trading information
Listing date
Trading currency
Trading hours (local time)
Bloomberg ticker
Reuters RIC
iNAV Bloomberg
iNAV Reuters
London Stock Exchange 08/04/2010 GBP 08:00 - 16:30 HMCX LN HMCX.L HMCXGBPI HMCXINAVGBP=HSBL
London Stock Exchange N/A USD 08:00 - 16:30 N/A N/A N/A N/A
Euronext Paris N/A EUR 09:00 - 17:30 N/A N/A N/A N/A
SIX Swiss Exchange N/A USD 09:00 - 17:30 N/A N/A N/A N/A
SIX Swiss Exchange N/A EUR 09:00 - 17:30 N/A N/A N/A N/A
Xetra Deutsche Börse N/A EUR 09:00 - 17:30 N/A N/A N/A N/A

19
Source: HSBC Global Asset Management (UK) Limited. All data as at 31/05/2014
HSBC MSCI CANADA UCITS ETFPhysical – Full replicationTicker: HCAN
The HSBC MSCI CANADA UCITS ETF is an open ended UCITS IV compliant exchange-traded fund incorporated in Ireland.
Fund objective
The investment objective of the Fund is to replicate the performance of the MSCI Canada Index (the “Index”), while minimising as far as possible the tracking error between the Fund’s performance and that of the Index. The Index is a market-capitalisation weighted index designed to measure the performance of the largest publicly listed companies in Canada, as defined by the Index Provider.
In seeking to achieve its investment objective, the Fund will aim to invest in securities included in the Index in generally the same proportions in which they are included in the Index.
Key facts
• Physical replication approach • Listed on London Stock Exchange, Euronext Paris, SIX Swiss
Exchange and Xetra Deutsche Börse • Total Expense Ratio (TER) of 0.35% per annum • Multi currency listing in GBP, EUR and USD • Fund registered in several European countries: UK, France, Germany,
Italy, Ireland, Netherlands, Spain, Sweden, Switzerland
Sector allocation of the Fund
Financials (37.25%) Energy (27.32%) Materials (11.04%) Industrials (7.35%) Consumer Discretionary (5.31%) Health Care (3.70%) Consumer Staples (2.93%) Telecommunication Services (2.64%) Utilities (1.28%) Information Technology (1.18%)
Top 10 holdings of the Fund
Royal Bank of Canada 7.23% Bank of Montreal 3.30%
Toronto-Dominion Bank 6.66%Canadian Natural Resources
3.22%
Bank of Nova Scotia 5.66%Valeant Pharmaceuticals International
3.04%
Suncor Energy 4.18% Enbridge 2.73%
Canadian National Railway Company
3.72%Canadian Imperial Bank of Commerce
2.57%
Fund detailsUCITS IV compliant Yes
Fund domicile Ireland
UK reporting fund status (UKRF) Yes
ISA eligible Yes
SIPP eligible Yes
Issuer HSBC ETFs Plc
Fund manager HSBC Global Asset Management (UK) Limited
Custodian HSBC Institutional Trust Services (Ireland) Limited
Fund administrator HSBC Securities Services (Ireland) Limited
Authorised participant HSBC Bank Plc
Benchmark MSCI Canada Index
Number of holdings 95
Published daily on etf.hsbc.com website
Replication method Physical – Full replication
Base currency USD
Fund inception date 23/02/2011
Listing date 24/02/2011
Fiscal year end 31 December
Total Expense Ratio (TER) 0.35%
Entry/Exit/Performance fees No
Net asset value (NAV) per share $18.58
Shares outstanding 1,350,000
Assets under management $25,083,930
Dividend treatment Distribution
Dividend frequency Semi-annual
Dividend currency USD
Dividend per share $0.1647
Dividend yield* 1.8256%
Dividend ex date 15/01/2014
*Gross trailing 12 month yield.
ISIN IE00B51B7Z02
Index informationIndex name MSCI Canada Index
Index currency USD
Benchmark type Total Return (Net)
Index rebalancing frequency Quarterly
TR index Bloomberg ticker NDDUCA
TR Index Reuters RIC .dMICA00000NUS
PR Index Bloomberg Ticker MSDUCA
PR Index Reuters RIC .dMICA00000PUS

Further information on HSBC ETFs Tel: 020 7024 0435 E-mail: [email protected] Website: www.etf.hsbc.com
20
About the Index
The Fund will aim to replicate the performance of the Index as calculated by MSCI Inc.
The Index offers a representation of the Canadian equity market by targeting all companies with a market capitalization within the top 85% of their investable equity universe, subject to a global minimum size requirement.
It is based on MSCI’s Global Investable Market Indices methodology.
The composition of the Index is reviewed on a quarterly basis and carried out according to the published rules governing the management of the Index as set out by MSCI Inc.
Yearly fund performance (%)
31/05/09 - 31/05/10 31/05/10 - 31/05/11 31/05/11 - 31/05/12 31/05/12 - 31/05/13 31/05/13 - 31/05/14
HSBC MSCI CANADA UCITS ETF N/A N/A -21.41 12.76 12.80
Fund and Index cumulative performance (%)
1 month 3 months 1 year 3 years Since inception
HSBC MSCI CANADA UCITS ETF 0.76 5.69 12.80 -0.04 1.08
MSCI Canada Net 0.78 5.22 12.54 0.33 1.53
Tracking difference1 -0.03 0.47 0.26 -0.37 -0.44
Tracking error2 N/A N/A 0.032 N/A 0.088
1 The tracking difference Net is the difference between the return of the fund (NAV) and that of the underlying index, after management fees (TER).2 The tracking error also known active risk, is the standard deviation of the tracking difference i.e. how variable is the tracking difference over time. The optimal tracking error would be zero.
Source: HSBC Global Asset Management (UK) Limited. All data as at 31/05/2014
Any performance information shown refers to the past and should not be seen as an indication of future returns.
Performance is shown using the net asset value of the fund, calculated from the closing price of the underlying securities. Performance is shown after fees including re-invested dividends in the base currency of the fund and does not take into account any currency exposure that may exist against the trading currency of the fund, where this is different.
Listing and trading information
Listing date
Trading currency
Trading hours (local time)
Bloomberg ticker
Reuters RIC
iNAV Bloomberg
iNAV Reuters
London Stock Exchange 24/02/2011 GBP 08:00 - 16:30 HCAN LN HCAN.L HCANGBPI HCANINAVGBP=HSBL
London Stock Exchange 24/02/2011 USD 08:00 - 16:30 HCAD LN HCAD.L HCANUSDI HCANINAVUSD=HSBL
Euronext Paris 06/06/2011 EUR 09:00 - 17:30 HCAN FP HCAN.PA HCANEURI HCANINAVEUR=HSBL
SIX Swiss Exchange 07/06/2011 USD 09:00 - 17:30 HCAN SW HCAN.S HCANUSDI HCANINAVUSD=HSBL
SIX Swiss Exchange 16/05/2012 CAD 09:00 - 17:30 HCANCAD SW HCANCAD.S HCANCADI HCANINAVCAD=HSBL
SIX Swiss Exchange N/A EUR 09:00 - 17:30 N/A N/A N/A N/A
Xetra Deutsche Börse 27/09/2013 EUR 09:00 - 17:30H4ZR GY & H4ZR GR
H4ZR.DE HCANEURI HCANINAVEUR=HSBL

21
Source: HSBC Global Asset Management (UK) Limited. All data as at 31/05/2014
HSBC FTSE EPRA/NAREIT DEVELOPED UCITS ETFPhysical – Full replicationTicker: HPRO
The HSBC FTSE EPRA/NAREIT DEVELOPED UCITS ETF is an open ended UCITS IV compliant exchange-traded fund incorporated in Ireland.
Fund objective
The investment objective of the Fund is to replicate the performance of the FTSE EPRA/NAREIT Developed Index (the “Index”), while minimising as far as possible the tracking error between the Fund’s performance and that of the Index. The Index is a market-capitalisation weighted index designed to measure the performance of the largest real estate companies of the world’s developed equity markets, including Canada, US, Australia, Hong Kong, China (via Red Chip shares traded on the Hong Kong Exchange), Japan, New Zealand, Singapore, South Korea, Austria, Belgium, Luxembourg, Denmark, Finland, France, Germany, Greece, Ireland, Israel, Italy, The Netherlands, Norway, Portugal, Spain, Sweden, Switzerland and UK, as defined by the Index Provider.
In seeking to achieve its investment objective, the Fund will aim to invest in securities included in the Index in generally the same proportions in which they are included in the Index.
Key facts
• Physical replication approach • Listed on London Stock Exchange and Xetra Deutsche Börse • Total Expense Ratio (TER) of 0.40% per annum • Multi currency listing in GBP and USD • Fund registered in several European countries: UK, France, Germany,
Italy, Ireland, Netherlands, Spain, Sweden
Sector allocation of the Fund
Real Estate Investment Trusts (77.16%) Real Estate Investment & Services (22.84%)
Country allocation of the Fund United States (49.03%) Japan (12.74%) Hong Kong (7.74%) Australia (6.64%) Britain (5.87%) Singapore (4.08%) France (3.64%) Canada (3.60%) Others (2.40%) Germany (1.49%) Sweden (1.10%) Switzerland (0.91%) Netherlands (0.77%)
Fund detailsUCITS IV compliant Yes
Fund domicile Ireland
UK reporting fund status (UKRF) Yes
ISA eligible Yes
SIPP eligible Yes
Issuer HSBC ETFs Plc
Fund manager HSBC Global Asset Management (UK) Limited
Custodian HSBC Institutional Trust Services (Ireland) Limited
Fund administrator HSBC Securities Services (Ireland) Limited
Authorised participant HSBC Bank Plc
Benchmark FTSE EPRA/NAREIT Developed Index®
Number of holdings 310
Published daily on etf.hsbc.com website
Replication method Physical – Full replication
Base currency USD
Fund inception date 20/06/2011
Listing date 22/06/2011
Fiscal year end 31 December
Total Expense Ratio (TER) 0.40%
Entry/Exit/Performance fees No
Net asset value (NAV) per share $22.14
Shares outstanding 1,000,000
Assets under management $22,140,927
Dividend treatment Distribution
Dividend frequency Quarterly
Dividend currency USD
Dividend per share $0.1346
Dividend yield* 2.5681%
Dividend ex date 16/04/2014
*Gross trailing 12 month yield.
ISIN IE00B5L01S80
Index informationIndex name FTSE EPRA/NAREIT
Index currency Developed Index® USD
Benchmark type Total Return (Net)
Index rebalancing frequency Quarterly
TR index Bloomberg ticker TRNGLU
TR Index Reuters RIC .TFTRNGLU
PR Index Bloomberg Ticker UNGL
PR Index Reuters RIC .FTUNGL
Others: Belgium (0.46%), China (0.42%), Guernsey (0.28%), Austria (0.26%), Finland (0.23%), Luxembourg (0.22%), Spain (0.12%), Israel (0.10%), New Zealand (0.09%), Italy (0.08%), Jersey (0.07%), Norway (0.06%), Greece (0.02%)

Further information on HSBC ETFs Tel: 020 7024 0435 E-mail: [email protected] Website: www.etf.hsbc.com
22
About the Index
The FTSE EPRA/NAREIT Global Real Estate Index Series is designed to represent general trends in eligible real estate equities worldwide. Relevant real estate activities are defined as the ownership, disposure and development of income-producing real estate. The benchmark index for this Fund covers developed equity markets and includes relevant companies from Canada, US, Australia, Hong Kong, China (via Red Chip shares traded on the Hong Kong Exchange), Japan, New Zealand, Singapore, South Korea, Austria, Belgium, Luxembourg, Denmark, Finland, France, Germany, Greece, Ireland, Israel, Italy, The Netherlands, Norway, Portugal, Spain, Sweden, Switzerland and the United Kingdom.
Top 10 holdings of the Fund
Simon Property Group Inc
4.45% Equity Residential 1.87%
Mitsubishi Estate Co Ltd 2.61% Sun Hung Kai Properties 1.79%
Unibail-Rodamco Se 2.31% Prologis Inc 1.76%
Mitsui Fudosan Co Ltd 2.28% Ventas Inc 1.67%
Public Storage 2.10% Westfield Group 1.64%
Yearly fund performance (%)
31/05/09 - 31/05/10 31/05/10 - 31/05/11 31/05/11 - 31/05/12 31/05/12 - 31/05/13 31/05/13 - 31/05/14
HSBC FTSE EPRA/NAREIT DEVELOPED UCITS ETF
N/A N/A N/A 24.03 8.95
Fund and Index cumulative performance (%)
1 month 3 months 1 year 3 years Since inception
HSBC FTSE EPRA/NAREIT DEVELOPED UCITS ETF
3.17 6.40 8.95 N/A 30.62
FTSE EPRA/NAREIT Developed Net 3.15 6.32 9.03 N/A 31.18
Tracking difference1 0.02 0.07 -0.08 - -0.56
Tracking error2 N/A N/A 0.098 N/A 0.109
1 The tracking difference Net is the difference between the return of the fund (NAV) and that of the underlying index, after management fees (TER).2 The tracking error also known active risk, is the standard deviation of the tracking difference i.e. how variable is the tracking difference over time. The optimal tracking error would be zero.
Source: HSBC Global Asset Management (UK) Limited. All data as at 31/05/2014
Any performance information shown refers to the past and should not be seen as an indication of future returns.
Performance is shown using the net asset value of the fund, calculated from the closing price of the underlying securities. Performance is shown after fees including re-invested dividends in the base currency of the fund and does not take into account any currency exposure that may exist against the trading currency of the fund, where this is different.
Listing and trading information
Listing date
Trading currency
Trading hours (local time)
Bloomberg ticker
Reuters RIC
iNAV Bloomberg
iNAV Reuters
London Stock Exchange 22/06/2011 GBP 08:00 - 16:30 HPRO LN HPROP.L HPROGBPI HPROINAVGBP=HSBL
London Stock Exchange 22/06/2011 USD 08:00 - 16:30 HPRD LN HPRD.L HPROUSDI HPROINAVUSD=HSBL
Euronext Paris N/A EUR 09:00 - 17:30 N/A N/A N/A N/A
SIX Swiss Exchange N/A USD 09:00 - 17:30 N/A N/A N/A N/A
SIX Swiss Exchange N/A EUR 09:00 - 17:30 N/A N/A N/A N/A
Xetra Deutsche Börse 27/09/2013 EUR 09:00 - 17:30H4ZL GR &H4ZL GY
H4ZL.DE HPROEURI HPROINAVEUR=HSBL

23
Source: HSBC Global Asset Management (UK) Limited. All data as at 31/05/2014
HSBC MSCI EMERGING MARKETS UCITS ETFPhysical – Optimised replicationTicker: HMEF
The HSBC MSCI EMERGING MARKETS UCITS ETF is an open ended UCITS IV compliant exchange-traded fund incorporated in Ireland.
Fund objective
The investment objective of the Fund is to replicate the performance of the MSCI Emerging Markets Index (the “Index”), while minimising as far as possible the tracking error between the Fund’s performance and that of the Index. The Index is a market-capitalisation weighted index designed to measure the performance of the largest companies in Brazil, Chile, China, Columbia, Czech Republic, Egypt, Hungary, India, Indonesia, Korea, Malaysia, Mexico, Morocco, Peru, Philippines, Poland, Russia, South Africa, Taiwan, Thailand and Turkey, as defined by the Index Provider. The markets in which the issuers are based are considered to be emerging markets and accordingly, are subject to specific risk factors.
In seeking to achieve its investment objective, the Fund will aim to invest in securities included in the Index in generally the same proportions in which they are included in the Index.
Key facts
• Physical replication approach • Listed on London Stock Exchange, SIX Swiss Exchange
and Xetra Deutsche Börse • Total Expense Ratio (TER) of 0.60% per annum • Multi currency listing in GBP and USD • Fund registered in several European countries: UK, France, Germany,
Italy, Ireland, Netherlands, Spain, Sweden, Switzerland, Austria
Sector allocation of the Fund
Financials (26.87%) Information Technology (17.20%) Energy (10.80%) Consumer Discretionary (9.01%) Materials (8.95%) Consumer Staples (8.41%) Telecommunication Services (7.03%) Industrials (6.49%) Utilities (3.52%) Health Care (1.71%)
Country allocation of the Fund
China (18.63%) Korea (16.06%) Taiwan (12.06%) Others (11.02%) Brazil (10.76%) South Africa (7.67%) India (7.01%) Russia (5.31%) Mexico (5.10%) Malaysia (3.82%) Indonesia (2.58%)
Fund detailsUCITS IV compliant Yes
Fund domicile Ireland
UK reporting fund status (UKRF) Yes
ISA eligible Yes
SIPP eligible Yes
Issuer HSBC ETFs Plc
Fund manager HSBC Global Asset Management (UK) Limited
Custodian HSBC Institutional Trust Services (Ireland) Limited
Fund administrator HSBC Securities Services (Ireland) Limited
Authorised participant HSBC Bank Plc
Benchmark MSCI Emerging Markets Index
Number of holdings 502
Published daily on etf.hsbc.com website
Replication method Physical – Optimised Replication
Base currency USD
Fund inception date 05/09/2011
Listing date 07/09/2011
Fiscal year end 31 December
Total Expense Ratio (TER) 0.60%
Entry/Exit/Performance fees No
Net asset value (NAV) per share $10.42
Shares outstanding 21,300,000
Assets under management $221,965,421
Dividend treatment Distribution
Dividend frequency Quarterly
Dividend currency USD
Dividend per share $0.0109
Dividend yield* 1.9183%
Dividend ex date 16/04/2014
*Gross trailing 12 month yield.
ISIN IE00B5SSQT16
Index informationIndex name MSCI Emerging Markets Index
Index currency USD
Benchmark type Total Return (Net)
Index rebalancing frequency Quarterly
TR index Bloomberg ticker NDUEEGF
TR Index Reuters RIC .dMIEF00000NUS
PR Index Bloomberg Ticker MSEUEGF
PR Index Reuters RIC .dMIEF00000PUS
Others: Thailand (2.16%), Turkey (1.78%), Poland (1.70%), Chile (1.55%), Colombia (1.10%), Philippines (0.97%), Greece (0.61%), Peru (0.45%), Czech Republic (0.25%), Hungary (0.25%), Egypt (0.21%)

Further information on HSBC ETFs Tel: 020 7024 0435 E-mail: [email protected] Website: www.etf.hsbc.com
24
About the Index
The Fund will aim to replicate the performance of the Index as calculated by MSCI Inc.
The Index offers a representation of the emerging equity markets of Brazil, Chile, China (accessed via H Shares listed and traded on the Hong Kong Stock Exchange and B Shares listed and traded on the Shanghai and Shenzhen Stock Exchanges), Columbia, Czech Republic, Egypt, Greece Hungary, India, Indonesia, Korea, Malaysia, Mexico, Peru, Philippines, Poland, Russia, South Africa, Taiwan, Thailand and Turkey by targeting all companies with a market capitalization within the top 85% of their investable equity universe, subject to a global minimum size requirement. It is based on MSCI’s Global Investable Market Indices methodology. The composition of the Index is reviewed on a quarterly basis and carried out according to the published rules governing the management of the Index as set out by MSCI Inc.
Top 10 holdings of the Fund
Samsung Electronics 4.56% Gazprom 1.23%
Taiwan Semiconductor Manufacturing
2.51%Industrial and Commercial Bank of China
1.22%
Tencent 1.84% Naspers 1.11%
China Mobile 1.51% Itau Unibanco 1.00%
China Construction Bank 1.35% Bank of China 0.91%
Yearly fund performance (%)
31/05/09 - 31/05/10 31/05/10 - 31/05/11 31/05/11 - 31/05/12 31/05/12 - 31/05/13 31/05/13 - 31/05/14
HSBC MSCI EMERGING MARKETS UCITS ETF
N/A N/A N/A 13.16 3.68
Fund and Index cumulative performance (%)
1 month 3 months 1 year 3 years Since inception
HSBC MSCI EMERGING MARKETS UCITS ETF
3.29 6.89 3.68 N/A 10.59
MSCI Emerging Markets Net 3.49 7.02 4.27 N/A 10.99
Tracking difference1 -0.20 -0.14 -0.58 - -0.39
Tracking error2 N/A N/A 0.774 N/A 0.760
1 The tracking difference Net is the difference between the return of the fund (NAV) and that of the underlying index, after management fees (TER).2 The tracking error also known active risk, is the standard deviation of the tracking difference i.e. how variable is the tracking difference over time. The optimal tracking error would be zero.
Source: HSBC Global Asset Management (UK) Limited. All data as at 31/05/2014
Any performance information shown refers to the past and should not be seen as an indication of future returns.
Performance is shown using the net asset value of the fund, calculated from the closing price of the underlying securities. Performance is shown after fees including re-invested dividends in the base currency of the fund and does not take into account any currency exposure that may exist against the trading currency of the fund, where this is different.
Listing and trading information
Listing date
Trading currency
Trading hours (local time)
Bloomberg ticker
Reuters RIC
iNAV Bloomberg
iNAV Reuters
London Stock Exchange 07/09/2011 GBP 08:00 - 16:30 HMEF LN HMEF.L HMEFGBPI HMEFINAVGBP=HSBL
London Stock Exchange 07/09/2011 USD 08:00 - 16:30 HMEM LN HMEM.L HMEFUSDI HMEFINAVUSD=HSBL
Euronext Paris N/A EUR 09:00 - 17:30 N/A N/A N/A N/A
SIX Swiss Exchange 17/10/2012 USD 09:00 - 17:30 HMEF SW HMEF.S HMEFUSDI HMEFINAVUSD=HSBL
SIX Swiss Exchange N/A EUR 09:00 - 17:30 N/A N/A N/A N/A
Xetra Deutsche Börse 27/09/2013 EUR 09:00 - 17:30H410 GR & H410 GY
H410 .DE HMEFEURI HMEFINAVEUR=HSBL

25
Source: HSBC Global Asset Management (UK) Limited. All data as at 31/05/2014
HSBC MSCI EM FAR EAST UCITS ETFPhysical – Optimised replicationTicker: HMFE
The HSBC MSCI EM FAR EAST UCITS ETF is an open ended UCITS IV compliant exchange-traded fund incorporated in Ireland.
Fund objective
The investment objective of the Fund is to replicate the performance of the MSCI EM Far East Index (the “Index”), while minimising as far as possible the tracking error between the Fund’s performance and that of the Index. The Index is a market-capitalisation weighted index designed to measure the performance of the largest companies in China (as accessible through the Hong Kong market), Indonesia, Korea, Malaysia, Philippines, Taiwan and Thailand, as defined by the Index Provider. The markets in which the issuers are based are considered to be emerging markets and accordingly, are subject to specific risk factors.
In seeking to achieve its investment objective, the Fund will aim to invest in securities included in the Index in generally the same proportions in which they are included in the Index.
Key facts
• Physical replication approach • Listed on London Stock Exchange, Euronext Paris, SIX Swiss
Exchange and Xetra Deutsche Börse • Total Expense Ratio (TER) of 0.60% per annum • Multi currency listing in GBP, EUR and USD • Fund registered in several European countries: UK, France, Germany,
Italy, Ireland, Netherlands, Spain, Sweden, Switzerland
Sector allocation of the Fund
Information Technology (27.51%) Financials (25.46%) Consumer Discretionary (9.28%) Industrials (7.76%) Materials (6.80%) Telecommunication Services (6.69%) Energy (6.59%) Consumer Staples (5.74%) Utilities (3.07%) Health Care (1.10%)
Country allocation of the Fund
China (33.11%) Korea (28.54%) Taiwan (21.43%) Malaysia (6.78%) Indonesia (4.58%) Thailand (3.85%) Philippines (1.72%)
Fund detailsUCITS IV compliant Yes
Fund domicile Ireland
UK reporting fund status (UKRF) Yes
ISA eligible Yes
SIPP eligible Yes
Issuer HSBC ETFs Plc
Fund manager HSBC Global Asset Management (UK) Limited
Custodian HSBC Institutional Trust Services (Ireland) Limited
Fund administrator HSBC Securities Services (Ireland) Limited
Authorised participant HSBC Bank Plc
Benchmark MSCI EM Far East Index
Number of holdings 375
Published daily on etf.hsbc.com website
Replication method Physical – Optimised Replication
Base currency USD
Fund inception date 24/09/2010
Listing date 28/09/2010
Fiscal year end 31 December
Total Expense Ratio (TER) 0.60%
Entry/Exit/Performance fees No
Net asset value (NAV) per share $39.41
Shares outstanding 2,130,000
Assets under management $83,938,945
Dividend treatment Distribution
Dividend frequency Semi-annual
Dividend currency USD
Dividend per share $0.5301
Dividend yield* 2.1706%
Dividend ex date 22/01/2014
*Gross trailing 12 month yield.
ISIN IE00B5LP3W10
Index informationIndex name MSCI EM Far East Index
Index currency USD
Benchmark type Total Return (Net)
Index rebalancing frequency Quarterly
TR index Bloomberg ticker NDUEEGFF
TR Index Reuters RIC .dMIMF00000NUS
PR Index Bloomberg Ticker MSEUEGFF
PR Index Reuters RIC .dMIMF00000PUS
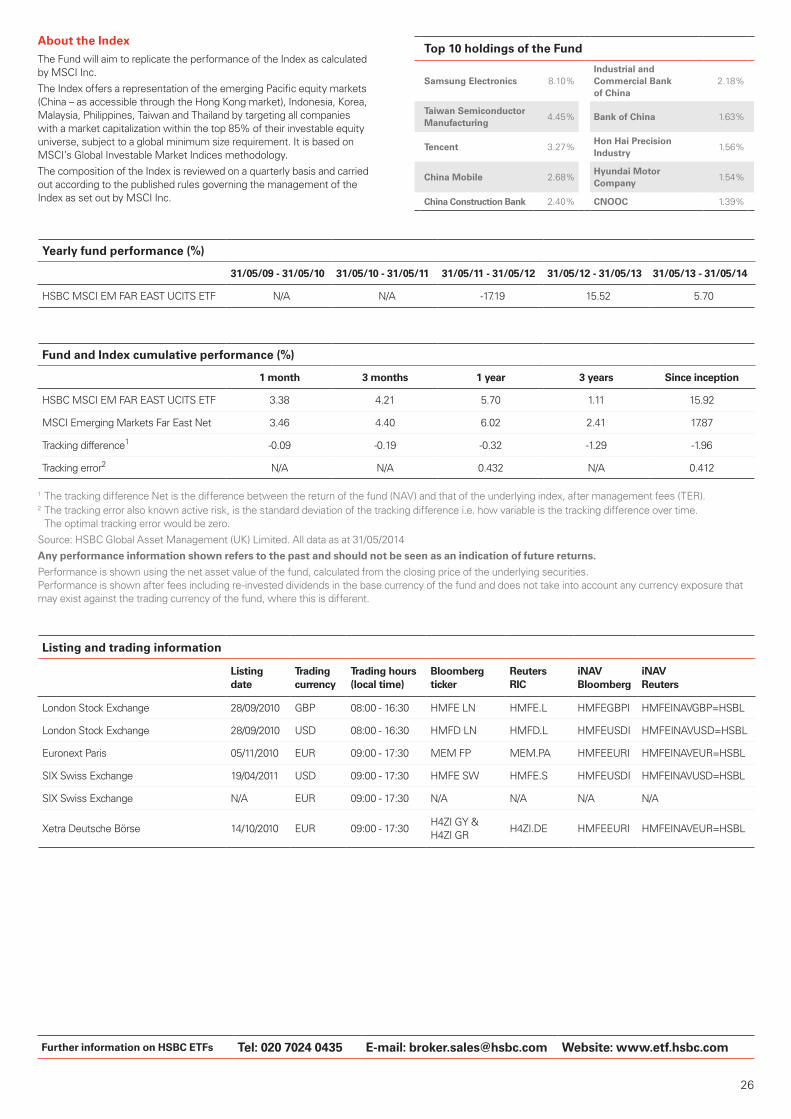
Further information on HSBC ETFs Tel: 020 7024 0435 E-mail: [email protected] Website: www.etf.hsbc.com
26
About the Index
The Fund will aim to replicate the performance of the Index as calculated by MSCI Inc.
The Index offers a representation of the emerging Pacific equity markets (China – as accessible through the Hong Kong market), Indonesia, Korea, Malaysia, Philippines, Taiwan and Thailand by targeting all companies with a market capitalization within the top 85% of their investable equity universe, subject to a global minimum size requirement. It is based on MSCI’s Global Investable Market Indices methodology.
The composition of the Index is reviewed on a quarterly basis and carried out according to the published rules governing the management of the Index as set out by MSCI Inc.
Top 10 holdings of the Fund
Samsung Electronics 8.10%Industrial and Commercial Bank of China
2.18%
Taiwan Semiconductor Manufacturing
4.45% Bank of China 1.63%
Tencent 3.27%Hon Hai Precision Industry
1.56%
China Mobile 2.68%Hyundai Motor Company
1.54%
China Construction Bank 2.40% CNOOC 1.39%
Yearly fund performance (%)
31/05/09 - 31/05/10 31/05/10 - 31/05/11 31/05/11 - 31/05/12 31/05/12 - 31/05/13 31/05/13 - 31/05/14
HSBC MSCI EM FAR EAST UCITS ETF N/A N/A -17.19 15.52 5.70
Fund and Index cumulative performance (%)
1 month 3 months 1 year 3 years Since inception
HSBC MSCI EM FAR EAST UCITS ETF 3.38 4.21 5.70 1.11 15.92
MSCI Emerging Markets Far East Net 3.46 4.40 6.02 2.41 17.87
Tracking difference1 -0.09 -0.19 -0.32 -1.29 -1.96
Tracking error2 N/A N/A 0.432 N/A 0.412
1 The tracking difference Net is the difference between the return of the fund (NAV) and that of the underlying index, after management fees (TER).2 The tracking error also known active risk, is the standard deviation of the tracking difference i.e. how variable is the tracking difference over time. The optimal tracking error would be zero.
Source: HSBC Global Asset Management (UK) Limited. All data as at 31/05/2014
Any performance information shown refers to the past and should not be seen as an indication of future returns.
Performance is shown using the net asset value of the fund, calculated from the closing price of the underlying securities. Performance is shown after fees including re-invested dividends in the base currency of the fund and does not take into account any currency exposure that may exist against the trading currency of the fund, where this is different.
Listing and trading information
Listing date
Trading currency
Trading hours (local time)
Bloomberg ticker
Reuters RIC
iNAV Bloomberg
iNAV Reuters
London Stock Exchange 28/09/2010 GBP 08:00 - 16:30 HMFE LN HMFE.L HMFEGBPI HMFEINAVGBP=HSBL
London Stock Exchange 28/09/2010 USD 08:00 - 16:30 HMFD LN HMFD.L HMFEUSDI HMFEINAVUSD=HSBL
Euronext Paris 05/11/2010 EUR 09:00 - 17:30 MEM FP MEM.PA HMFEEURI HMFEINAVEUR=HSBL
SIX Swiss Exchange 19/04/2011 USD 09:00 - 17:30 HMFE SW HMFE.S HMFEUSDI HMFEINAVUSD=HSBL
SIX Swiss Exchange N/A EUR 09:00 - 17:30 N/A N/A N/A N/A
Xetra Deutsche Börse 14/10/2010 EUR 09:00 - 17:30H4ZI GY & H4ZI GR
H4ZI.DE HMFEEURI HMFEINAVEUR=HSBL
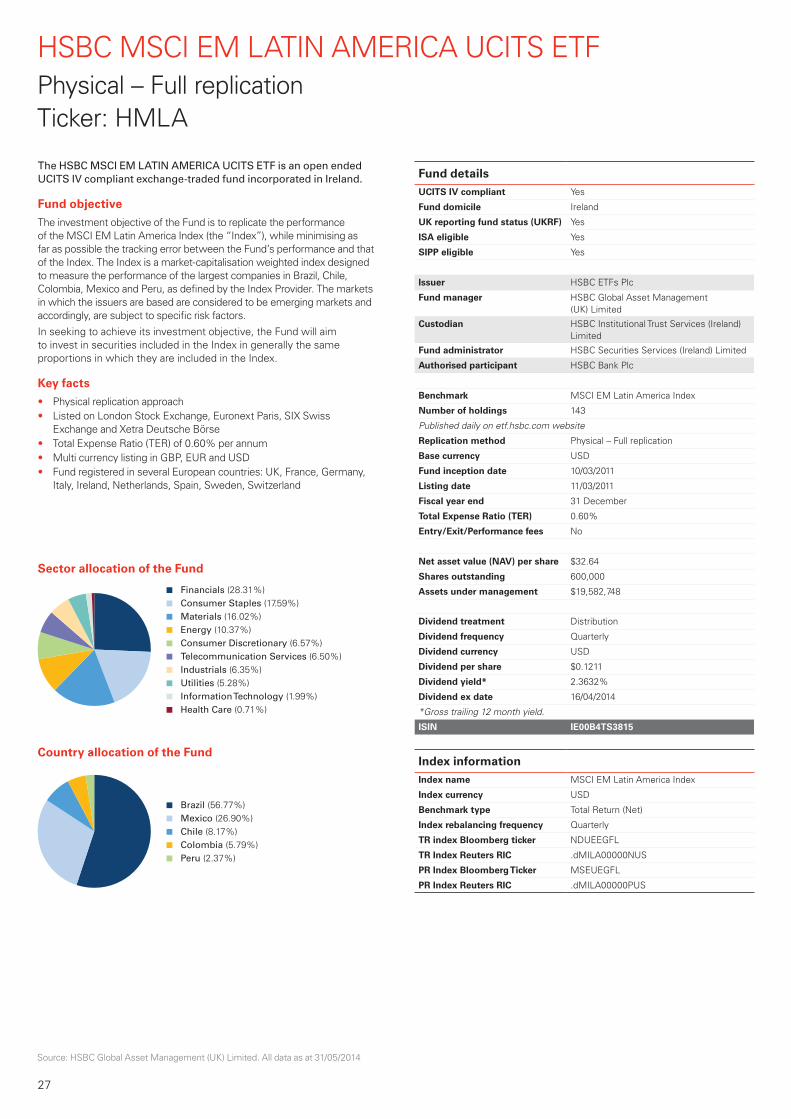
27
Source: HSBC Global Asset Management (UK) Limited. All data as at 31/05/2014
HSBC MSCI EM LATIN AMERICA UCITS ETFPhysical – Full replicationTicker: HMLA
The HSBC MSCI EM LATIN AMERICA UCITS ETF is an open ended UCITS IV compliant exchange-traded fund incorporated in Ireland.
Fund objective
The investment objective of the Fund is to replicate the performance of the MSCI EM Latin America Index (the “Index”), while minimising as far as possible the tracking error between the Fund’s performance and that of the Index. The Index is a market-capitalisation weighted index designed to measure the performance of the largest companies in Brazil, Chile, Colombia, Mexico and Peru, as defined by the Index Provider. The markets in which the issuers are based are considered to be emerging markets and accordingly, are subject to specific risk factors.
In seeking to achieve its investment objective, the Fund will aim to invest in securities included in the Index in generally the same proportions in which they are included in the Index.
Key facts
• Physical replication approach • Listed on London Stock Exchange, Euronext Paris, SIX Swiss
Exchange and Xetra Deutsche Börse • Total Expense Ratio (TER) of 0.60% per annum • Multi currency listing in GBP, EUR and USD • Fund registered in several European countries: UK, France, Germany,
Italy, Ireland, Netherlands, Spain, Sweden, Switzerland
Sector allocation of the Fund
Financials (28.31%) Consumer Staples (17.59%) Materials (16.02%) Energy (10.37%) Consumer Discretionary (6.57%) Telecommunication Services (6.50%) Industrials (6.35%) Utilities (5.28%) Information Technology (1.99%) Health Care (0.71%)
Country allocation of the Fund
Brazil (56.77%) Mexico (26.90%) Chile (8.17%) Colombia (5.79%) Peru (2.37%)
Fund detailsUCITS IV compliant Yes
Fund domicile Ireland
UK reporting fund status (UKRF) Yes
ISA eligible Yes
SIPP eligible Yes
Issuer HSBC ETFs Plc
Fund manager HSBC Global Asset Management (UK) Limited
Custodian HSBC Institutional Trust Services (Ireland) Limited
Fund administrator HSBC Securities Services (Ireland) Limited
Authorised participant HSBC Bank Plc
Benchmark MSCI EM Latin America Index
Number of holdings 143
Published daily on etf.hsbc.com website
Replication method Physical – Full replication
Base currency USD
Fund inception date 10/03/2011
Listing date 11/03/2011
Fiscal year end 31 December
Total Expense Ratio (TER) 0.60%
Entry/Exit/Performance fees No
Net asset value (NAV) per share $32.64
Shares outstanding 600,000
Assets under management $19,582,748
Dividend treatment Distribution
Dividend frequency Quarterly
Dividend currency USD
Dividend per share $0.1211
Dividend yield* 2.3632%
Dividend ex date 16/04/2014
*Gross trailing 12 month yield.
ISIN IE00B4TS3815
Index informationIndex name MSCI EM Latin America Index
Index currency USD
Benchmark type Total Return (Net)
Index rebalancing frequency Quarterly
TR index Bloomberg ticker NDUEEGFL
TR Index Reuters RIC .dMILA00000NUS
PR Index Bloomberg Ticker MSEUEGFL
PR Index Reuters RIC .dMILA00000PUS

28
Further information on HSBC ETFs Tel: 020 7024 0435 E-mail: [email protected] Website: www.etf.hsbc.com
About the Index
The Fund will aim to replicate the performance of the Index as calculated by MSCI Inc.
The Index offers a representation of the Latin American equity markets (Brazil, Chile, Colombia, Mexico and Peru) by targeting all companies with a market capitalization within the top 85% of their investable equity universe, subject to a global minimum size requirement. It is based on MSCI’s Global Investable Market Indices methodology.
The composition of the Index is reviewed on a quarterly basis and carried out according to the published rules governing the management of the Index as set out by MSCI Inc.
Top 10 holdings of the Fund
Petroleo Brasileiro 7.03% Ambev 4.48%
Itau Unibanco 5.26%Fomento Economico Mexicano
2.49%
Banco Bradesco 5.16%Grupo Financiero Banorte
2.43%
Vale 5.15% Grupo Televisa 2.34%
America Movil 4.56% Cemex 2.04%
Yearly fund performance (%)
31/05/09 - 31/05/10 31/05/10 - 31/05/11 31/05/11 - 31/05/12 31/05/12 - 31/05/13 31/05/13 - 31/05/14
HSBC MSCI EM LATIN AMERICA UCITS ETF
N/A N/A -22.26 5.57 -5.27
Fund and Index cumulative performance (%)
1 month 3 months 1 year 3 years Since inception
HSBC MSCI EM LATIN AMERICA UCITS ETF
-0.09 11.53 -5.27 -22.25 -19.35
MSCI Emerging Markets Latin America Net
-0.08 11.64 -4.75 -20.78 -17.76
Tracking difference1 -0.01 -0.11 -0.51 -1.47 -1.58
Tracking error2 N/A N/A 0.068 N/A 0.266
1 The tracking difference Net is the difference between the return of the fund (NAV) and that of the underlying index, after management fees (TER).2 The tracking error also known active risk, is the standard deviation of the tracking difference i.e. how variable is the tracking difference over time. The optimal tracking error would be zero.
Source: HSBC Global Asset Management (UK) Limited. All data as at 31/05/2014
Any performance information shown refers to the past and should not be seen as an indication of future returns.
Performance is shown using the net asset value of the fund, calculated from the closing price of the underlying securities. Performance is shown after fees including re-invested dividends in the base currency of the fund and does not take into account any currency exposure that may exist against the trading currency of the fund, where this is different.
Listing and trading information
Listing date
Trading currency
Trading hours (local time)
Bloomberg ticker
Reuters RIC
iNAV Bloomberg
iNAV Reuters
London Stock Exchange 11/03/2011 GBP 08:00 - 16:30 HMLA LN HMLA.L HMLAGBPI HMLAINAVGBP=HSBL
London Stock Exchange 11/03/2011 USD 08:00 - 16:30 HMLD LN HMLD.L HMLAUSDI HMLAINAVUSD=HSBL
Euronext Paris 08/06/2011 EUR 09:00 - 17:30 HMLA FP HMLA.PA HMLAEURI HMLAINAVEUR=HSBL
SIX Swiss Exchange 07/06/2011 USD 09:00 - 17:30 HMLA SW HMLA.S HMLAUSDI HMLAINAVUSD=HSBL
SIX Swiss Exchange N/A EUR 09:00 - 17:30 N/A N/A N/A N/A
Xetra Deutsche Börse 27/09/2013 EUR 09:00 - 17:30H4ZW GY & H4ZW GR
H4ZW.DE HMLAEURI HMLAINAVEUR=HSBL
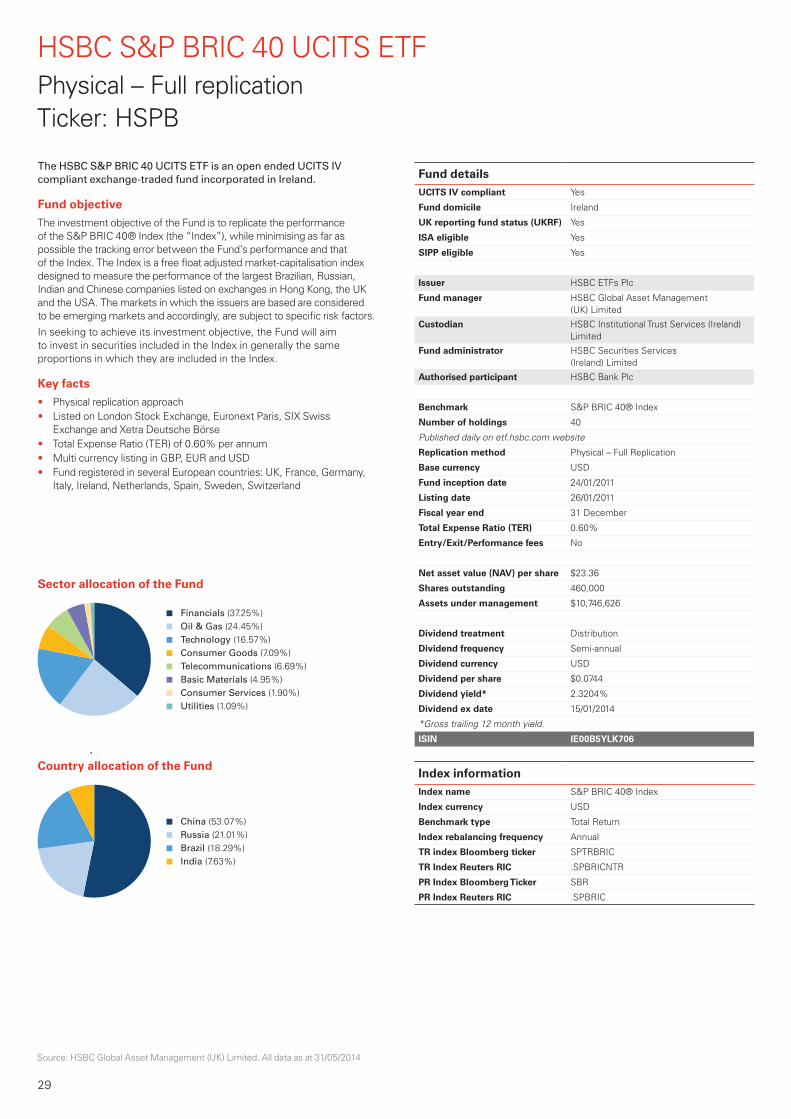
29
Source: HSBC Global Asset Management (UK) Limited. All data as at 31/05/2014
HSBC S&P BRIC 40 UCITS ETFPhysical – Full replicationTicker: HSPB
The HSBC S&P BRIC 40 UCITS ETF is an open ended UCITS IV compliant exchange-traded fund incorporated in Ireland.
Fund objective
The investment objective of the Fund is to replicate the performance of the S&P BRIC 40® Index (the “Index”), while minimising as far as possible the tracking error between the Fund’s performance and that of the Index. The Index is a free float adjusted market-capitalisation index designed to measure the performance of the largest Brazilian, Russian, Indian and Chinese companies listed on exchanges in Hong Kong, the UK and the USA. The markets in which the issuers are based are considered to be emerging markets and accordingly, are subject to specific risk factors.
In seeking to achieve its investment objective, the Fund will aim to invest in securities included in the Index in generally the same proportions in which they are included in the Index.
Key facts
• Physical replication approach • Listed on London Stock Exchange, Euronext Paris, SIX Swiss
Exchange and Xetra Deutsche Börse • Total Expense Ratio (TER) of 0.60% per annum • Multi currency listing in GBP, EUR and USD • Fund registered in several European countries: UK, France, Germany,
Italy, Ireland, Netherlands, Spain, Sweden, Switzerland
Sector allocation of the Fund
Financials (37.25%) Oil & Gas (24.45%) Technology (16.57%) Consumer Goods (7.09%) Telecommunications (6.69%) Basic Materials (4.95%) Consumer Services (1.90%) Utilities (1.09%)
Country allocation of the Fund
China (53.07%) Russia (21.01%) Brazil (18.29%) India (7.63%)
Fund detailsUCITS IV compliant Yes
Fund domicile Ireland
UK reporting fund status (UKRF) Yes
ISA eligible Yes
SIPP eligible Yes
Issuer HSBC ETFs Plc
Fund manager HSBC Global Asset Management (UK) Limited
Custodian HSBC Institutional Trust Services (Ireland) Limited
Fund administrator HSBC Securities Services (Ireland) Limited
Authorised participant HSBC Bank Plc
Benchmark S&P BRIC 40® Index
Number of holdings 40
Published daily on etf.hsbc.com website
Replication method Physical – Full Replication
Base currency USD
Fund inception date 24/01/2011
Listing date 26/01/2011
Fiscal year end 31 December
Total Expense Ratio (TER) 0.60%
Entry/Exit/Performance fees No
Net asset value (NAV) per share $23.36
Shares outstanding 460,000
Assets under management $10,746,626
Dividend treatment Distribution
Dividend frequency Semi-annual
Dividend currency USD
Dividend per share $0.0744
Dividend yield* 2.3204%
Dividend ex date 15/01/2014
*Gross trailing 12 month yield.
ISIN IE00B5YLK706
Index informationIndex name S&P BRIC 40® Index
Index currency USD
Benchmark type Total Return
Index rebalancing frequency Annual
TR index Bloomberg ticker SPTRBRIC
TR Index Reuters RIC .SPBRICNTR
PR Index Bloomberg Ticker SBR
PR Index Reuters RIC .SPBRIC

Further information on HSBC ETFs Tel: 020 7024 0435 E-mail: [email protected] Website: www.etf.hsbc.com
30
About the Index
The Index is designed to provide exposure to 40 leading companies from the emerging markets of Brazil, Russia, India and China through liquid stocks listed on developed market exchanges, specifically the Hong Kong Stock Exchange, the London Stock Exchange, NASDAQ and the NYSE Euronext.
The Index methodology employs a modified market capitalisation weighting scheme, using the divisor methodology used in all Standard & Poor’s equity indices. The methodology stipulates that, at rebalancing, no stock can have a weight of more than 10% in the Index and the minimum initial portfolio size that can be turned over in a single day (based on recent trading volumes) cannot be lower than USD 600 million.
The Index is rebalanced once a year in December. In addition to the annual rebalancing, there is a mid-year review. A semi-annual rebalancing occurs only if three of the 30 largest stocks from the eligible universe are not in the index at the mid-year review. There will not be a semi-annual rebalancing in years when this condition is not satisfied.
Top 10 holdings of the Fund
Tencent 8.11% Baidu 5.03%
China Construction Bank 6.59% Itau Unibanco 4.43%
Industrial and Commercial Bank of China
5.81% Ambev 3.60%
China Mobile 5.65% Bank of China 3.52%
Gazprom 5.43% Banco Bradesco 3.34%
Yearly fund performance (%)
31/05/09 - 31/05/10 31/05/10 - 31/05/11 31/05/11 - 31/05/12 31/05/12 - 31/05/13 31/05/13 - 31/05/14
HSBC S&P BRIC 40 UCITS ETF N/A N/A -24.51 10.17 4.73
Fund and Index cumulative performance (%)
1 month 3 months 1 year 3 years Since inception
HSBC S&P BRIC 40 UCITS ETF 5.64 3.51 4.73 -12.90 -8.69
S&P BRIC 40 Net 5.71 3.68 5.50 -11.12 -6.61
Tracking difference1 -0.06 -0.17 -0.77 -1.79 -2.08
Tracking error2 N/A N/A 0.106 N/A 0.269
1 The tracking difference Net is the difference between the return of the fund (NAV) and that of the underlying index, after management fees (TER).2 The tracking error also known active risk, is the standard deviation of the tracking difference i.e. how variable is the tracking difference over time. The optimal tracking error would be zero.
Source: HSBC Global Asset Management (UK) Limited. All data as at 31/05/2014
Any performance information shown refers to the past and should not be seen as an indication of future returns.
Performance is shown using the net asset value of the fund, calculated from the closing price of the underlying securities. Performance is shown after fees including re-invested dividends in the base currency of the fund and does not take into account any currency exposure that may exist against the trading currency of the fund, where this is different.
Listing and trading information
Listing date
Trading currency
Trading hours (local time)
Bloomberg ticker
Reuters RIC
iNAV Bloomberg
iNAV Reuters
London Stock Exchange 26/01/2011 GBP 08:00 - 16:30 HSPB LN HSPB.L HSPBGBPI HSBRINAVGBP=HSBL
London Stock Exchange 26/01/2011 USD 08:00 - 16:30 HSBR LN HSBR.L HSPBUSDI HSBRINAVUSD=HSBL
Euronext Paris 16/05/2011 EUR 09:00 - 17:30 BRQ FP BRQ.PA HSPBEURI HSBRINAVEUR=HSBL
SIX Swiss Exchange 07/06/2011 USD 09:00 - 17:30 HSBR SW HSBR.S HSPBUSDI HSBRINAVUSD=HSBL
SIX Swiss Exchange N/A EUR 09:00 - 17:30 N/A N/A N/A N/A
Xetra Deutsche Börse 27/09/2013 EUR 09:00 - 17:30H4ZN GY & H4ZN GR
H4ZN.DE HSPBEURI HSBRINAVEUR=HSBL

31
Source: HSBC Global Asset Management (UK) Limited. All data as at 31/05/2014
HSBC MSCI AC FAR EAST ex JAPAN UCITS ETFPhysical – Optimised replicationTicker: HMAD
The HSBC MSCI AC FAR EAST ex JAPAN UCITS ETF is an open ended UCITS IV compliant exchange-traded fund incorporated in Ireland.
Fund objective
The investment objective of the Fund is to replicate the performance of the MSCI AC Far East ex Japan Index (the “Index”), while minimising the tracking error between the Fund’s performance and that of the Index. The Index is a market-capitalisation weighted index designed to measure the performance of large and mid cap companies in China (as accessible through the Hong Kong market), Hong Kong, Indonesia, Korea, Malaysia, Philippines, Singapore, Taiwan and Thailand, as defined by the Index Provider. The markets in which the issuers are based are considered to be emerging markets and accordingly, are subject to specific risk factors.
In seeking to achieve its investment objective, the Fund will aim to invest in securities included in the Index in generally the same proportions in which they are included in the Index.
Key facts
• Physical replication approach • Listed on London Stock Exchange, Xetra Deutsche Börse and
SIX Swiss Exchange • Total Expense Ratio (TER) of 0.60% per annum • Multi currency listing in GBP, EUR and USD • Fund registered in several European countries: UK, France, Germany,
Italy, Ireland, Netherlands, Sweden, Austria, Switzerland
Sector allocation of the Fund
Financials (31.46%) Consumer Discretionary (18.56%) Information Technology (12.35%) Industrials (8.83%) Materials (7.45%) Telecommunication Services (6.42%) Energy (6.07%) Consumer Staples (4.00%) Utilities (3.98%) Health Care (0.85%)
Country allocation of the Fund
South Korea (22.57%) China (20.12%) Hong Kong (18.76%) Taiwan (17.13%) Singapore (6.91%) Malaysia (5.30%) Indonesia (3.71%) Thailand (3.09%) Philippines (1.40%) Macau (0.99%)
Fund detailsUCITS IV compliant Yes
Fund domicile Ireland
UK reporting fund status (UKRF) Yes
ISA eligible Yes
SIPP eligible Yes
Issuer HSBC ETFs Plc
Fund manager HSBC Global Asset Management (UK) Limited
Custodian HSBC Institutional Trust Services (Ireland) Limited
Fund administrator HSBC Securities Services (Ireland) Limited
Authorised participant HSBC Bank Plc
Benchmark MSCI AC Far East ex Japan Index
Number of holdings 387
Published daily on etf.hsbc.com website
Replication method Physical – Optimised Replication
Base currency USD
Fund inception date 25/09/2013
Listing date 27/09/2013
Fiscal year end 31 December
Total Expense Ratio (TER) 0.60%
Entry/Exit/Performance fees No
Net asset value (NAV) per share $36.10
Shares outstanding 3,250,000
Assets under management $117,336,229
Dividend treatment Accumulation
Dividend frequency N/A
Dividend currency N/A
Dividend per share N/A
Dividend yield* N/A
Dividend ex date N/A
*Gross trailing 12 month yield.
ISIN IE00BBQ2W338
Index informationIndex name MSCI AC Far East ex Japan Index
Index currency USD
Benchmark type Total Return (Net)
Index rebalancing frequency Quarterly
TR index Bloomberg ticker NDEUCFEX
TR Index Reuters RIC .dMIFX00000NUS
PR Index Bloomberg Ticker MSEUCFFX
PR Index Reuters RIC .dMIFX00000PUS

Further information on HSBC ETFs Tel: 020 7024 0435 E-mail: [email protected] Website: www.etf.hsbc.com
32
About the Index
The Fund will aim to replicate the performance of the Index as calculated by MSCI Inc.
The Index is a free float-adjusted market capitalization weighted index that is designed to measure the equity market performance of the Far East countries, excluding Japan. The Index consists of the following 9 developed and emerging market country indices: China, Hong Kong, Indonesia, Korea, Malaysia, Philippines, Singapore, Taiwan, and Thailand.
As of the end of March 2013, the Index consisted of 539 constituents.
The composition of the Index is rebalanced on a quarterly basis and carried out according to the published rules governing the management of the Index as set out by MSCI Inc.
Top 10 holdings of the Fund
Samsung Electronics 6.37% China Construction Bank 1.94%
Taiwan Semiconductor Manufactor
3.60%Industrial and Commercial Bank of China
1.74%
Tencent 2.53% Bank of China 1.29%
AIA Group 2.16% Hyundai Motor 1.23%
China Mobile 2.13%Hon Hai Precision Industry
1.21%
Yearly fund performance (%)
31/05/09 - 31/05/10 31/05/10 - 31/05/11 31/05/11 - 31/05/12 31/05/12 - 31/05/13 31/05/13 - 31/05/14
HSBC MSCI AC FAR EAST ex JAPAN UCITS ETF
N/A N/A N/A N/A N/A
Fund and Index cumulative performance (%)
1 month 3 months 1 year 3 years Since inception
HSBC MSCI AC FAR EAST ex JAPAN UCITS ETF
3.51 4.79 N/A N/A 3.97
MSCI AC Far East ex Japan Net 3.53 4.79 N/A N/A 4.36
Tracking difference1 -0.02 0.00 - - -0.39
Tracking error2 N/A N/A N/A N/A 0.314
1 The tracking difference Net is the difference between the return of the fund (NAV) and that of the underlying index, after management fees (TER).2 The tracking error also known active risk, is the standard deviation of the tracking difference i.e. how variable is the tracking difference over time. The optimal tracking error would be zero.
Source: HSBC Global Asset Management (UK) Limited. All data as at 31/05/2014
Any performance information shown refers to the past and should not be seen as an indication of future returns.
Performance is shown using the net asset value of the fund, calculated from the closing price of the underlying securities. Performance is shown after fees including re-invested dividends in the base currency of the fund and does not take into account any currency exposure that may exist against the trading currency of the fund, where this is different.
Listing and trading information
Listing date
Trading currency
Trading hours (local time)
Bloomberg ticker
Reuters RIC
iNAV Bloomberg
iNAV Reuters
London Stock Exchange 27/09/2013 GBP 08:00 - 16:30 HMAF LN HMAF.L HMAFGBPI HMAFINAVGBP=HSBL
London Stock Exchange 27/09/2013 USD 08:00 - 16:30 HMAD LN HMAD.L HMAFUSDI HMAFINAVUSD=HSBL
Xetra Deutsche Börse 27/09/2013 EUR 09:00 - 17:30H411 GR & H411 GY
H411.DE HMAFEURI HMAFINAVEUR=HSBL
SIX Swiss Exchange 05/06/2014 USD 09:00 - 17:30 HMAF SW HMAF.S HMAFUSDI HMAFINAVUSD=HSBL

33
Source: HSBC Global Asset Management (UK) Limited. All data as at 31/05/2014
HSBC MSCI RUSSIA CAPPED UCITS ETFPhysical – Full replicationTicker: HRUB
The HSBC MSCI RUSSIA CAPPED UCITS ETF is an open ended UCITS IV compliant exchange-traded fund incorporated in Ireland.
Fund objective
The investment objective of the Fund is to replicate the performance of the MSCI Russia Capped Index (the “Index”), while minimising as far as possible the tracking error between the Fund’s performance and that of the Index. The Index is a market-capitalisation weighted index designed to measure the performance of the largest publicly listed companies in Russia, as defined by the Index Provider. Russian equity markets are considered to be emerging markets and accordingly, are subject to specific risk factors.
In seeking to achieve its investment objective, the Fund will aim to invest in securities included in the Index in generally the same proportions in which they are included in the Index.
Key facts
• Physical replication approach • Listed on London Stock Exchange, SIX Swiss Exchange
and Xetra Deutsche Börse • Total Expense Ratio (TER) of 0.60% per annum • Multi currency listing in GBP and USD • Fund registered in several European countries: UK, France, Germany,
Italy, Ireland, Netherlands, Spain, Sweden, Switzerland, Austria
Sector allocation of the Fund
Oil & Gas (56.50%) Financials (17.84%) Basic Materials (8.70%) Telecommunications (8.31%) Consumer Services (7.37%) Utilities (1.29%)
Top 10 holdings of the Fund
Gazprom 23.28% MMC Norilsk Nickel 5.00%
Lukoil 13.73% Mobile Telesystems 4.58%
Sberbank 12.58% Tatneft 4.05%
Magnit 7.37% Rosneft 3.65%
Novatek 5.11% VTB Bank 3.39%
Fund detailsUCITS IV compliant Yes
Fund domicile Ireland
UK reporting fund status (UKRF) Yes
ISA eligible Yes
SIPP eligible Yes
Issuer HSBC ETFs Plc
Fund manager HSBC Global Asset Management (UK) Limited
Custodian HSBC Institutional Trust Services (Ireland) Limited
Fund administrator HSBC Securities Services (Ireland) Limited
Authorised participant HSBC Bank Plc
Benchmark MSCI Russia Capped Index
Number of holdings 22
Published daily on etf.hsbc.com website
Replication method Physical – Full Replication
Base currency USD
Fund inception date 05/07/2011
Listing date 06/07/2011
Fiscal year end 31 December
Total Expense Ratio (TER) 0.60%
Entry/Exit/Performance fees No
Net asset value (NAV) per share $12.00
Shares outstanding 4,175,000
Assets under management $50,092,683
Dividend treatment Distribution
Dividend frequency Semi-annual
Dividend currency USD
Dividend per share $0.0326
Dividend yield* 2.8013%
Dividend ex date 15/01/2014
*Gross trailing 12 month yield.
ISIN IE00B5LJZQ16
Index informationIndex name MSCI Russia Capped Index
Index currency USD
Benchmark type Total Return (Net)
Index rebalancing frequency Quarterly
TR index Bloomberg ticker MSEURC$N
TR Index Reuters RIC .dMIRU000P6NUS
PR Index Bloomberg Ticker MSEURC$P
PR Index Reuters RIC .dMIRU000P6PUS
Further information on HSBC ETFs Tel: 020 7024 0435 E-mail: [email protected] Website: www.etf.hsbc.com
34
About the Index
The MSCI Russia Capped Index (“the Index”) is based on the MSCI Russia Index (“Parent Index”), which offers a representation of the Russian market by targeting all companies with a market capitalization within the top 85% of the Russian investable equity universe. At construction and at each rebalancing (quarterly review), if the weight of the largest Group Entity in the MSCI Russia Index is greater than 30 per cent, its weight will be capped at 30 per cent. The weight of the remaining Group Entities will be increased in proportion to their weight prior to such capping.If the resulting weight of any of the remaining Group Entities is greater than 20 per cent of the index, its weight will be capped at 20 per cent, while simultaneously maintaining the weight of the largest Group Entity at 30 per cent. The remaining group entities are weighted according to their free float adjusted market capitalizations applicable to foreign investors as a percentage of the remaining non-capped weight.
On a daily basis, if the weight of the largest Group Entity in the MSCI Russia Capped Index increases above 35 per cent, its weight will be capped at 30 per cent. The weight of the remaining Group Entities will be increased in proportion to their weight in the MSCI Russia Capped Index prior to such capping.
Any changes in the constituent companies of the Parent Index will also be reflected in the Index.
Yearly fund performance (%)
31/05/09 - 31/05/10 31/05/10 - 31/05/11 31/05/11 - 31/05/12 31/05/12 - 31/05/13 31/05/13 - 31/05/14
HSBC MSCI RUSSIA CAPPED UCITS ETF N/A N/A N/A 11.97 -2.69
Fund and Index cumulative performance (%)
1 month 3 months 1 year 3 years Since inception
HSBC MSCI RUSSIA CAPPED UCITS ETF 12.18 2.30 -2.69 N/A -27.39
MSCI Russia Capped Net 12.22 2.44 -1.99 N/A -25.83
Tracking difference1 -0.05 -0.14 -0.70 - -1.56
Tracking error2 N/A N/A 0.134 N/A 0.262
1 The tracking difference Net is the difference between the return of the fund (NAV) and that of the underlying index, after management fees (TER).2 The tracking error also known active risk, is the standard deviation of the tracking difference i.e. how variable is the tracking difference over time. The optimal tracking error would be zero.
Source: HSBC Global Asset Management (UK) Limited. All data as at 31/05/2014
Any performance information shown refers to the past and should not be seen as an indication of future returns.
Performance is shown using the net asset value of the fund, calculated from the closing price of the underlying securities. Performance is shown after fees including re-invested dividends in the base currency of the fund and does not take into account any currency exposure that may exist against the trading currency of the fund, where this is different.
Listing and trading information
Listing date
Trading currency
Trading hours (local time)
Bloomberg ticker
Reuters RIC
iNAV Bloomberg
iNAV Reuters
London Stock Exchange 06/07/2011 GBP 08:00 - 16:30 HRUB LN HRUB.L HRUBGBPI HRUBINAVGBP=HSBL
London Stock Exchange 06/07/2011 USD 08:00 - 16:30 HRUD LN HRUD.L HRUBUSDI HRUBINAVUSD=HSBL
Euronext Paris N/A EUR 09:00 - 17:30 N/A N/A N/A N/A
SIX Swiss Exchange 08/11/2011 USD 09:00 - 17:30 HRUB SW HRUB.S HRUBUSDI HRUBINAVUSD=HSBL
SIX Swiss Exchange N/A EUR 09:00 - 17:30 N/A N/A N/A N/A
Xetra Deutsche Börse 27/09/2013 EUR 09:00 - 17:30H4ZM GR & H4ZM GY
H4ZM .DE HRUBEURI HRUBINAVEUR=HSBL
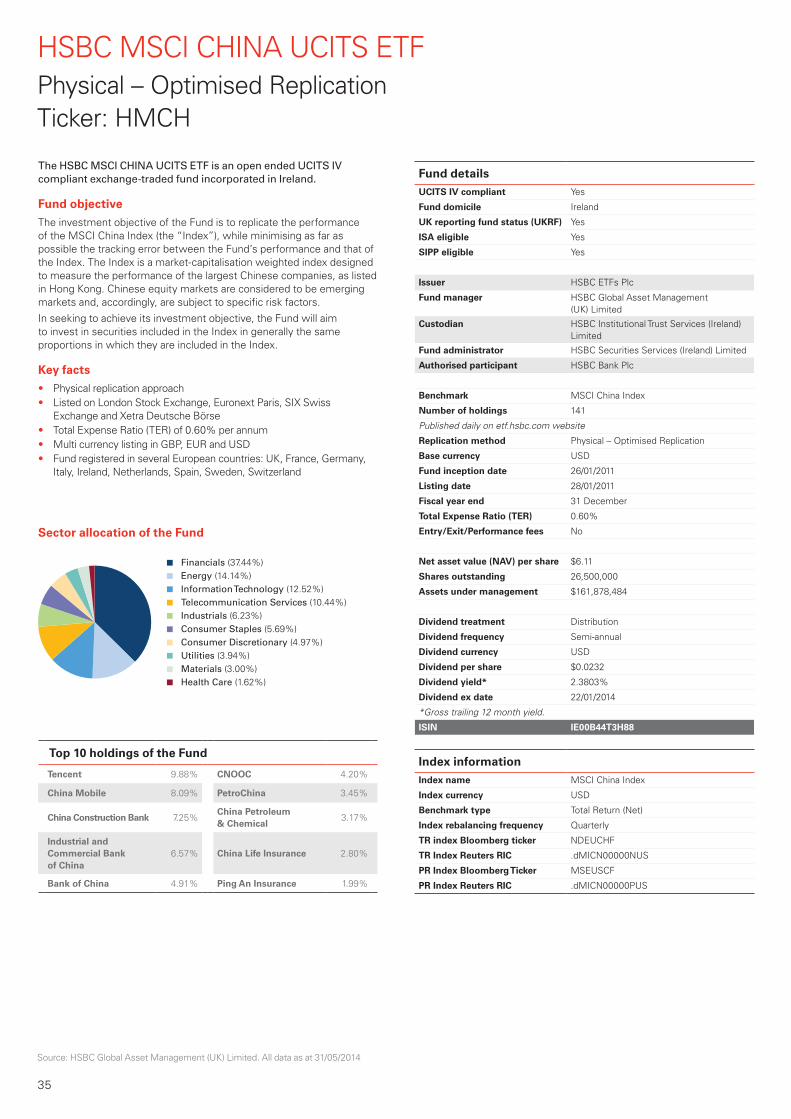
35
Source: HSBC Global Asset Management (UK) Limited. All data as at 31/05/2014
HSBC MSCI CHINA UCITS ETFPhysical – Optimised ReplicationTicker: HMCH
The HSBC MSCI CHINA UCITS ETF is an open ended UCITS IV compliant exchange-traded fund incorporated in Ireland.
Fund objective
The investment objective of the Fund is to replicate the performance of the MSCI China Index (the “Index”), while minimising as far as possible the tracking error between the Fund’s performance and that of the Index. The Index is a market-capitalisation weighted index designed to measure the performance of the largest Chinese companies, as listed in Hong Kong. Chinese equity markets are considered to be emerging markets and, accordingly, are subject to specific risk factors.
In seeking to achieve its investment objective, the Fund will aim to invest in securities included in the Index in generally the same proportions in which they are included in the Index.
Key facts
• Physical replication approach • Listed on London Stock Exchange, Euronext Paris, SIX Swiss
Exchange and Xetra Deutsche Börse • Total Expense Ratio (TER) of 0.60% per annum • Multi currency listing in GBP, EUR and USD • Fund registered in several European countries: UK, France, Germany,
Italy, Ireland, Netherlands, Spain, Sweden, Switzerland
Sector allocation of the Fund
Financials (37.44%) Energy (14.14%) Information Technology (12.52%) Telecommunication Services (10.44%) Industrials (6.23%) Consumer Staples (5.69%) Consumer Discretionary (4.97%) Utilities (3.94%) Materials (3.00%) Health Care (1.62%)
Top 10 holdings of the Fund
Tencent 9.88% CNOOC 4.20%
China Mobile 8.09% PetroChina 3.45%
China Construction Bank 7.25%China Petroleum & Chemical
3.17%
Industrial and Commercial Bank of China
6.57% China Life Insurance 2.80%
Bank of China 4.91% Ping An Insurance 1.99%
Fund detailsUCITS IV compliant Yes
Fund domicile Ireland
UK reporting fund status (UKRF) Yes
ISA eligible Yes
SIPP eligible Yes
Issuer HSBC ETFs Plc
Fund manager HSBC Global Asset Management (UK) Limited
Custodian HSBC Institutional Trust Services (Ireland) Limited
Fund administrator HSBC Securities Services (Ireland) Limited
Authorised participant HSBC Bank Plc
Benchmark MSCI China Index
Number of holdings 141
Published daily on etf.hsbc.com website
Replication method Physical – Optimised Replication
Base currency USD
Fund inception date 26/01/2011
Listing date 28/01/2011
Fiscal year end 31 December
Total Expense Ratio (TER) 0.60%
Entry/Exit/Performance fees No
Net asset value (NAV) per share $6.11
Shares outstanding 26,500,000
Assets under management $161,878,484
Dividend treatment Distribution
Dividend frequency Semi-annual
Dividend currency USD
Dividend per share $0.0232
Dividend yield* 2.3803%
Dividend ex date 22/01/2014
*Gross trailing 12 month yield.
ISIN IE00B44T3H88
Index informationIndex name MSCI China Index
Index currency USD
Benchmark type Total Return (Net)
Index rebalancing frequency Quarterly
TR index Bloomberg ticker NDEUCHF
TR Index Reuters RIC .dMICN00000NUS
PR Index Bloomberg Ticker MSEUSCF
PR Index Reuters RIC .dMICN00000PUS

Further information on HSBC ETFs Tel: 020 7024 0435 E-mail: [email protected] Website: www.etf.hsbc.com
36
About the Index
The Fund will aim to replicate the performance of the Index as calculated by MSCI Inc.
The Index offers a representation of the Chinese equity markets (as accessible through the Hong Kong market) by targeting all companies with a market capitalization within the top 85% of their investable equity universe, subject to a global minimum size requirement. It is based on MSCI’s Global Investable Market Indices methodology.
The composition of the Index is reviewed on a quarterly basis and carried out according to the published rules governing the management of the Index as set out by MSCI Inc.
Yearly fund performance (%)
31/05/09 - 31/05/10 31/05/10 - 31/05/11 31/05/11 - 31/05/12 31/05/12 - 31/05/13 31/05/13 - 31/05/14
HSBC MSCI CHINA UCITS ETF N/A N/A -21.23 14.91 4.04
Fund and Index cumulative performance (%)
1 month 3 months 1 year 3 years Since inception
HSBC MSCI CHINA UCITS ETF 4.62 0.38 4.04 -5.82 -2.00
MSCI China Net 4.66 0.55 4.27 -4.69 -0.75
Tracking difference1 -0.04 -0.17 -0.23 -1.13 -1.25
Tracking error2 N/A N/A 0.207 N/A 0.246
1 The tracking difference Net is the difference between the return of the fund (NAV) and that of the underlying index, after management fees (TER).2 The tracking error also known active risk, is the standard deviation of the tracking difference i.e. how variable is the tracking difference over time. The optimal tracking error would be zero.
Source: HSBC Global Asset Management (UK) Limited. All data as at 31/05/2014
Any performance information shown refers to the past and should not be seen as an indication of future returns.
Performance is shown using the net asset value of the fund, calculated from the closing price of the underlying securities. Performance is shown after fees including re-invested dividends in the base currency of the fund and does not take into account any currency exposure that may exist against the trading currency of the fund, where this is different.
Listing and trading information
Listing date
Trading currency
Trading hours (local time)
Bloomberg ticker
Reuters RIC
iNAV Bloomberg
iNAV Reuters
London Stock Exchange 28/01/2011 GBP 08:00 - 16:30 HMCH LN HMCH.L HMCHGBPI HMCHINAVGBP=HSBL
London Stock Exchange 28/01/2011 USD 08:00 - 16:30 HMCD LN HMCD.L HMCHUSDI HMCHINAVUSD=HSBL
Euronext Paris 23/05/2011 EUR 09:00 - 17:30 CNY FP CNY.PA HMCHEURI HMCHINAVEUR=HSBL
SIX Swiss Exchange 07/06/2011 USD 09:00 - 17:30 HMCH SW HMCH.S HMCHUSDI HMCHINAVUSD=HSBL
SIX Swiss Exchange N/A EUR 09:00 - 17:30 N/A N/A N/A N/A
Xetra Deutsche Börse 27/09/2013 EUR 09:00 - 17:30H4ZP GY & H4ZP GR
H4ZP HMCHEURI HMCHINAVEUR=HSBL

37
Source: HSBC Global Asset Management (UK) Limited. All data as at 31/05/2014
HSBC MSCI TAIWAN UCITS ETFPhysical – Full replicationTicker: HTWN
The HSBC MSCI TAIWAN UCITS ETF is an open ended UCITS IV compliant exchange-traded fund incorporated in Ireland.
Fund objective
The investment objective of the Fund is to replicate the performance of the MSCI Taiwan Index (the “Index”), while minimising as far as possible the tracking error between the Fund’s performance and that of the Index. The Index is a market-capitalisation weighted index designed to measure the performance of the largest publicly listed companies in Taiwan, as defined by the Index Provider. Taiwanese equity markets are considered to be emerging markets and accordingly, are subject to specific risk factors.
In seeking to achieve its investment objective, the Fund will aim to invest in securities included in the Index in generally the same proportions in which they are included in the Index.
Key facts
• Physical replication approach • Listed on London Stock Exchange, SIX Swiss Exchange
and Xetra Deutsche Börse • Total Expense Ratio (TER) of 0.60% per annum • Multi currency listing in GBP and USD • Fund registered in several European countries: UK, France, Germany,
Italy, Ireland, Netherlands, Spain, Sweden, Switzerland
Sector allocation of the Fund
Information Technology (56.96%) Financials (16.71%) Materials (10.68%) Telecommunication Services (4.72%) Consumer Discretionary (4.40%) Industrials (3.04%) Consumer Staples (2.80%) Energy (0.59%) Health Care (0.10%)
Top 10 holdings of the Fund
Taiwan Semiconductor Manufacturing
20.78% Cathay Financial 2.51%
Hon Hai Precision Industry
7.28% Nan Ya Plastics 2.26%
MediaTek 4.86% Formosa Plastics 2.24%
Chunghwa Telecom 2.58% Fubon Financial 2.03%
Delta Electronics 2.51% China Steel 2.01%
Fund detailsUCITS IV compliant Yes
Fund domicile Ireland
UK reporting fund status (UKRF) Yes
ISA eligible Yes
SIPP eligible Yes
Issuer HSBC ETFs Plc
Fund manager HSBC Global Asset Management (UK) Limited
Custodian HSBC Institutional Trust Services (Ireland) Limited
Fund administrator HSBC Securities Services (Ireland) Limited
Authorised participant HSBC Bank Plc
Benchmark MSCI Taiwan Index
Number of holdings 101
Published daily on etf.hsbc.com website
Replication method Physical – Full Replication
Base currency USD
Fund inception date 28/03/2011
Listing date 30/03/2011
Fiscal year end 31 December
Total Expense Ratio (TER) 0.60%
Entry/Exit/Performance fees No
Net asset value (NAV) per share $30.77
Shares outstanding 100,000
Assets under management $3,077,470
Dividend treatment Distribution
Dividend frequency Semi-annual
Dividend currency USD
Dividend per share $0.4075
Dividend yield* 1.3241%
Dividend ex date 22/01/2014
*Gross trailing 12 month yield.
ISIN IE00B3S1J086
Index informationIndex name MSCI Taiwan Index
Index currency USD
Benchmark type Total Return (Net)
Index rebalancing frequency Quarterly
TR index Bloomberg ticker NDEUSTW
TR Index Reuters RIC .dMITW00000NUS
PR Index Bloomberg Ticker MSEUSTW
PR Index Reuters RIC .dMITW00000PUS

Further information on HSBC ETFs Tel: 020 7024 0435 E-mail: [email protected] Website: www.etf.hsbc.com
38
About the Index
The Fund will aim to replicate the performance of the Index as calculated by MSCI Inc.
The Index offers a representation of the Taiwanese equity market by targeting all companies with a market capitalization within the top 85% of their investable equity universe, subject to a global minimum size requirement. It is based on MSCI’s Global Investable Market Indices methodology.
The composition of the Index is reviewed on a quarterly basis and carried out according to the published rules governing the management of the Index as set out by MSCI Inc.
Yearly fund performance (%)
31/05/09 - 31/05/10 31/05/10 - 31/05/11 31/05/11 - 31/05/12 31/05/12 - 31/05/13 31/05/13 - 31/05/14
HSBC MSCI TAIWAN UCITS ETF N/A N/A -19.34 15.45 11.04
Fund and Index cumulative performance (%)
1 month 3 months 1 year 3 years Since inception
HSBC MSCI TAIWAN UCITS ETF 3.88 7.94 11.04 3.42 11.08
MSCI Taiwan Net 3.94 8.11 11.79 5.30 13.22
Tracking difference1 -0.06 -0.17 -0.74 -1.88 -2.14
Tracking error2 N/A N/A 0.084 N/A 0.095
1 The tracking difference Net is the difference between the return of the fund (NAV) and that of the underlying index, after management fees (TER).2 The tracking error also known active risk, is the standard deviation of the tracking difference i.e. how variable is the tracking difference over time. The optimal tracking error would be zero.
Source: HSBC Global Asset Management (UK) Limited. All data as at 31/05/2014
Any performance information shown refers to the past and should not be seen as an indication of future returns.
Performance is shown using the net asset value of the fund, calculated from the closing price of the underlying securities. Performance is shown after fees including re-invested dividends in the base currency of the fund and does not take into account any currency exposure that may exist against the trading currency of the fund, where this is different.
Listing and trading information
Listing date
Trading currency
Trading hours (local time)
Bloomberg ticker
Reuters RIC
iNAV Bloomberg
iNAV Reuters
London Stock Exchange 30/03/2011 GBP 08:00 - 16:30 HTWN LN HTNT.L HTWNGBPI HTWNINAVGBP=HSBL
London Stock Exchange 30/03/2011 USD 08:00 - 16:30 HTWD LN HTWD.L HTWNUSDI HTWNINAVUSD=HSBL
Euronext Paris N/A EUR 09:00 - 17:30 N/A N/A N/A N/A
SIX Swiss Exchange 08/11/2011 USD 09:00 - 17:30 HTWN SW HTWN.S HTWNUSDI HTWNINAVUSD=HSBL
SIX Swiss Exchange N/A EUR 09:00 - 17:30 N/A N/A N/A N/A
Xetra Deutsche Börse 27/09/2013 EUR 09:00 - 17:30H4ZU GY & H4ZU GR
H4ZU.DE HTWNEURI HTWNINAVEUR=HSBL

39
Source: HSBC Global Asset Management (UK) Limited. All data as at 31/05/2014
HSBC MSCI MALAYSIA UCITS ETFPhysical – Full replicationTicker: HMYR
The HSBC MSCI MALAYSIA UCITS ETF is an open ended UCITS IV compliant exchange-traded fund incorporated in Ireland.
Fund objective
The investment objective of the Fund is to replicate the performance of the MSCI Malaysia Index (the “Index”), while minimising as far as possible the tracking error between the Fund’s performance and that of the Index. The Index is a market-capitalisation weighted index designed to measure the performance of the largest publicly listed companies in Malaysia, as defined by the Index Provider. Malaysian equity markets are considered to be emerging markets and accordingly, are subject to specific risk factors.
In seeking to achieve its investment objective, the Fund will aim to invest in securities included in the Index in generally the same proportions in which they are included in the Index.
Key facts
• Physical replication approach • Listed on London Stock Exchange, SIX Swiss Exchange
and Xetra Deutsche Börse • Total Expense Ratio (TER) of 0.60% per annum • Multi currency listing in GBP and USD • Fund registered in several European countries: UK, France, Germany,
Italy, Ireland, Netherlands, Spain, Sweden, Switzerland
Sector allocation of the Fund
Financials (29.89%) Industrials (13.52%) Utilities (12.43%) Telecommunication Services (12.11%) Consumer Staples (10.26%) Consumer Discretionary (9.81%) Energy (5.18%) Materials (4.72%) Health Care (2.09%)
Top 10 holdings of the Fund
Malayan Banking 9.11% Genting 4.15%
CIMB Group 7.55% DiGi.com 3.95%
Tenaga Nasional 7.09% Petronas Chemicals 3.93%
Sime Darby 5.38% Axiata Group 3.70%
Public Bank 4.77%SapuraKencana Petroleum
3.12%
Fund detailsUCITS IV compliant Yes
Fund domicile Ireland
UK reporting fund status (UKRF) Yes
ISA eligible Yes
SIPP eligible Yes
Issuer HSBC ETFs Plc
Fund manager HSBC Global Asset Management (UK) Limited
Custodian HSBC Institutional Trust Services (Ireland) Limited
Fund administrator HSBC Securities Services (Ireland) Limited
Authorised participant HSBC Bank Plc
Benchmark MSCI Malaysia Index
Number of holdings 43
Published daily on etf.hsbc.com website
Replication method Physical – Full Replication
Base currency USD
Fund inception date 28/03/2011
Listing date 30/03/2011
Fiscal year end 31 December
Total Expense Ratio (TER) 0.60%
Entry/Exit/Performance fees No
Net asset value (NAV) per share $51.86
Shares outstanding 90,000
Assets under management $4,667,668
Dividend treatment Distribution
Dividend frequency Semi-annual
Dividend currency USD
Dividend per share $0.6557
Dividend yield* 2.6495%
Dividend ex date 29/01/2014
*Gross trailing 12 month yield.
ISIN IE00B3X3R831
Index informationIndex name MSCI Malaysia Index
Index currency USD
Benchmark type Total Return (Net)
Index rebalancing frequency Quarterly
TR index Bloomberg ticker NDDUMAF
TR Index Reuters RIC .dMIMY00000NUS
PR Index Bloomberg Ticker MSDUMAF
PR Index Reuters RIC .dMIMY00000PUS

Further information on HSBC ETFs Tel: 020 7024 0435 E-mail: [email protected] Website: www.etf.hsbc.com
40
About the Index
The Fund will aim to replicate the performance of the Index as calculated by MSCI Inc.
The Index offers a representation of the Malaysian equity market by targeting all companies with a market capitalization within the top 85% of their investable equity universe, subject to a global minimum size requirement. It is based on MSCI’s Global Investable Market Indices methodology.
The composition of the Index is reviewed on a quarterly basis and carried out according to the published rules governing the management of the Index as set out by MSCI Inc.
Yearly fund performance (%)
31/05/09 - 31/05/10 31/05/10 - 31/05/11 31/05/11 - 31/05/12 31/05/12 - 31/05/13 31/05/13 - 31/05/14
HSBC MSCI MALAYSIA UCITS ETF N/A N/A -2.98 17.61 2.49
Fund and Index cumulative performance (%)
1 month 3 months 1 year 3 years Since inception
HSBC MSCI MALAYSIA UCITS ETF 1.43 3.95 2.49 16.94 20.66
MSCI Malaysia Net 1.48 4.12 3.01 18.98 22.91
Tracking difference1 -0.06 -0.17 -0.52 -2.04 -2.25
Tracking error2 N/A N/A 0.126 N/A 0.103
1 The tracking difference Net is the difference between the return of the fund (NAV) and that of the underlying index, after management fees (TER).2 The tracking error also known active risk, is the standard deviation of the tracking difference i.e. how variable is the tracking difference over time. The optimal tracking error would be zero.
Source: HSBC Global Asset Management (UK) Limited. All data as at 31/05/2014
Any performance information shown refers to the past and should not be seen as an indication of future returns.
Performance is shown using the net asset value of the fund, calculated from the closing price of the underlying securities. Performance is shown after fees including re-invested dividends in the base currency of the fund and does not take into account any currency exposure that may exist against the trading currency of the fund, where this is different.
Listing and trading information
Listing date
Trading currency
Trading hours (local time)
Bloomberg ticker
Reuters RIC
iNAV Bloomberg
iNAV Reuters
London Stock Exchange 30/03/2011 GBP 08:00 - 16:30 HMYR LN HMYRM.L HMYRGBPI HMYRINAVGBP=HSBL
London Stock Exchange 30/03/2011 USD 08:00 - 16:30 HMYD LN HMYD.L HMYRUSDI HMYRINAVUSD=HSBL
Euronext Paris N/A EUR 09:00 - 17:30 N/A N/A N/A N/A
SIX Swiss Exchange 08/11/2011 USD 09:00 - 17:30 HMYR SW HMYR.S HMYRUSDI HMYRINAVUSD=HSBL
SIX Swiss Exchange N/A EUR 09:00 - 17:30 N/A N/A N/A N/A
Xetra Deutsche Börse 27/09/2013 EUR 09:00 - 17:30H4ZV GY & H4ZV GR
H4ZV.DE HMYREURI HMYRINAVEUR=HSBL
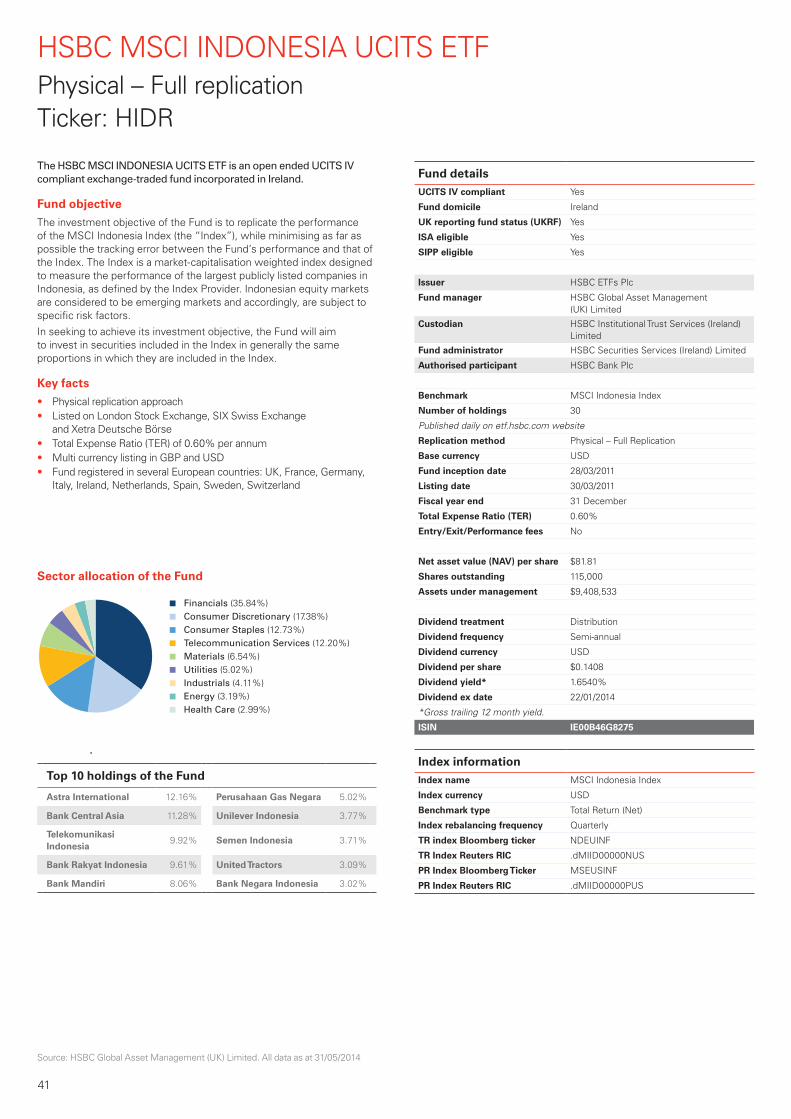
41
Source: HSBC Global Asset Management (UK) Limited. All data as at 31/05/2014
HSBC MSCI INDONESIA UCITS ETFPhysical – Full replicationTicker: HIDR
The HSBC MSCI INDONESIA UCITS ETF is an open ended UCITS IV compliant exchange-traded fund incorporated in Ireland.
Fund objective
The investment objective of the Fund is to replicate the performance of the MSCI Indonesia Index (the “Index”), while minimising as far as possible the tracking error between the Fund’s performance and that of the Index. The Index is a market-capitalisation weighted index designed to measure the performance of the largest publicly listed companies in Indonesia, as defined by the Index Provider. Indonesian equity markets are considered to be emerging markets and accordingly, are subject to specific risk factors.
In seeking to achieve its investment objective, the Fund will aim to invest in securities included in the Index in generally the same proportions in which they are included in the Index.
Key facts
• Physical replication approach • Listed on London Stock Exchange, SIX Swiss Exchange
and Xetra Deutsche Börse • Total Expense Ratio (TER) of 0.60% per annum • Multi currency listing in GBP and USD • Fund registered in several European countries: UK, France, Germany,
Italy, Ireland, Netherlands, Spain, Sweden, Switzerland
Sector allocation of the Fund
Financials (35.84%) Consumer Discretionary (17.38%) Consumer Staples (12.73%) Telecommunication Services (12.20%) Materials (6.54%) Utilities (5.02%) Industrials (4.11%) Energy (3.19%) Health Care (2.99%)
Top 10 holdings of the Fund
Astra International 12.16% Perusahaan Gas Negara 5.02%
Bank Central Asia 11.28% Unilever Indonesia 3.77%
Telekomunikasi Indonesia
9.92% Semen Indonesia 3.71%
Bank Rakyat Indonesia 9.61% United Tractors 3.09%
Bank Mandiri 8.06% Bank Negara Indonesia 3.02%
Fund detailsUCITS IV compliant Yes
Fund domicile Ireland
UK reporting fund status (UKRF) Yes
ISA eligible Yes
SIPP eligible Yes
Issuer HSBC ETFs Plc
Fund manager HSBC Global Asset Management (UK) Limited
Custodian HSBC Institutional Trust Services (Ireland) Limited
Fund administrator HSBC Securities Services (Ireland) Limited
Authorised participant HSBC Bank Plc
Benchmark MSCI Indonesia Index
Number of holdings 30
Published daily on etf.hsbc.com website
Replication method Physical – Full Replication
Base currency USD
Fund inception date 28/03/2011
Listing date 30/03/2011
Fiscal year end 31 December
Total Expense Ratio (TER) 0.60%
Entry/Exit/Performance fees No
Net asset value (NAV) per share $81.81
Shares outstanding 115,000
Assets under management $9,408,533
Dividend treatment Distribution
Dividend frequency Semi-annual
Dividend currency USD
Dividend per share $0.1408
Dividend yield* 1.6540%
Dividend ex date 22/01/2014
*Gross trailing 12 month yield.
ISIN IE00B46G8275
Index informationIndex name MSCI Indonesia Index
Index currency USD
Benchmark type Total Return (Net)
Index rebalancing frequency Quarterly
TR index Bloomberg ticker NDEUINF
TR Index Reuters RIC .dMIID00000NUS
PR Index Bloomberg Ticker MSEUSINF
PR Index Reuters RIC .dMIID00000PUS

Further information on HSBC ETFs Tel: 020 7024 0435 E-mail: [email protected] Website: www.etf.hsbc.com
42
About the Index
The Fund will aim to replicate the performance of the Index as calculated by MSCI Inc.
The Index offers a representation of the Indonesian equity market by targeting all companies with a market capitalization within the top 85% of their investable equity universe, subject to a global minimum size requirement.
It is based on MSCI’s Global Investable Market Indices methodology.
The composition of the Index is reviewed on a quarterly basis and carried out according to the published rules governing the management of the Index as set out by MSCI Inc.
Yearly fund performance (%)
31/05/09 - 31/05/10 31/05/10 - 31/05/11 31/05/11 - 31/05/12 31/05/12 - 31/05/13 31/05/13 - 31/05/14
HSBC MSCI INDONESIA UCITS ETF N/A N/A -12.68 25.81 -15.59
Fund and Index cumulative performance (%)
1 month 3 months 1 year 3 years Since inception
HSBC MSCI INDONESIA UCITS ETF 0.31 6.87 -15.59 -7.28 0.97
MSCI Indonesia Net 0.34 7.01 -15.12 -5.73 2.77
Tracking difference1 -0.03 -0.14 -0.47 -1.55 -1.80
Tracking error2 N/A N/A 0.061 N/A 0.073
1 The tracking difference Net is the difference between the return of the fund (NAV) and that of the underlying index, after management fees (TER).2 The tracking error also known active risk, is the standard deviation of the tracking difference i.e. how variable is the tracking difference over time. The optimal tracking error would be zero.
Source: HSBC Global Asset Management (UK) Limited. All data as at 31/05/2014
Any performance information shown refers to the past and should not be seen as an indication of future returns.
Performance is shown using the net asset value of the fund, calculated from the closing price of the underlying securities. Performance is shown after fees including re-invested dividends in the base currency of the fund and does not take into account any currency exposure that may exist against the trading currency of the fund, where this is different.
Listing and trading information
Listing date
Trading currency
Trading hours (local time)
Bloomberg ticker
Reuters RIC
iNAV Bloomberg
iNAV Reuters
London Stock Exchange 30/03/2011 GBP 08:00 - 16:30 HIDR LN HIDRI.L HIDRGBPI HIDRINAVGBP=HSBL
London Stock Exchange 30/03/2011 USD 08:00 - 16:30 HIDD LN HIDD.L HIDRUSDI HIDRINAVUSD=HSBL
Euronext Paris N/A EUR 09:00 - 17:30 N/A N/A N/A N/A
SIX Swiss Exchange 08/11/2011 USD 09:00 - 17:30 HIDR SW HIDR.S HIDRUSDI HIDRINAVUSD=HSBL
SIX Swiss Exchange N/A EUR 09:00 - 17:30 N/A N/A N/A N/A
Xetra Deutsche Börse 27/09/2013 EUR 09:00 - 17:30H4ZT GY & H4ZT GR
H4ZT.DE HIDREURI HIDRINAVEUR=HSBL

43
Source: HSBC Global Asset Management (UK) Limited. All data as at 31/05/2014
HSBC MSCI KOREA UCITS ETFPhysical – Full replicationTicker: HKOR
The HSBC MSCI KOREA UCITS ETF is an open ended UCITS IV compliant exchange-traded fund incorporated in Ireland.
Fund objective
The investment objective of the Fund is to replicate the performance of the MSCI Korea Index (the “Index”), while minimising as far as possible the tracking error between the Fund’s performance and that of the Index. The Index is a market-capitalisation weighted index designed to measure the performance of the largest publicly listed companies in South Korea, as defined by the Index Provider. South Korean equity markets are considered to be emerging markets and accordingly, are subject to specific risk factors.
In seeking to achieve its investment objective, the Fund will aim to invest in securities included in the Index in generally the same proportions in which they are included in the Index.
Key facts
• Physical replication approach • Listed on London Stock Exchange, SIX Swiss Exchange
and Xetra Deutsche Börse • Total Expense Ratio (TER) of 0.60% per annum • Multi currency listing in GBP and USD • Fund registered in several European countries: UK, France, Germany,
Italy, Ireland, Netherlands, Spain, Sweden, Switzerland
Sector allocation of the Fund
Information Technology (39.10%) Consumer Discretionary (17.47%) Financials (13.22%) Industrials (11.34%) Materials (8.57%) Consumer Staples (5.12%) Utilities (1.82%) Energy (1.73%) Telecommunication Services (0.96%) Health Care (0.69%)
Top 10 holdings of the Fund
Samsung Electronics 28.39%Shinhan Financial Group
2.95%
Hyundai Motor 5.40% POSCO 2.95%
SK Hynix 3.67% KIA Motors 2.41%
NAVER 3.31% KB Financial Group 2.09%
Hyundai Mobis 3.06% LG Chem 1.88%
Fund detailsUCITS IV compliant Yes
Fund domicile Ireland
UK reporting fund status (UKRF) Yes
ISA eligible Yes
SIPP eligible Yes
Issuer HSBC ETFs Plc
Fund manager HSBC Global Asset Management (UK) Limited
Custodian HSBC Institutional Trust Services (Ireland) Limited
Fund administrator HSBC Securities Services (Ireland) Limited
Authorised participant HSBC Bank Plc
Benchmark MSCI Korea Index
Number of holdings 104
Published daily on etf.hsbc.com website
Replication method Physical – Full Replication
Base currency USD
Fund inception date 05/04/2011
Listing date 07/04/2011
Fiscal year end 31 December
Total Expense Ratio (TER) 0.60%
Entry/Exit/Performance fees No
Net asset value (NAV) per share $45.02
Shares outstanding 70,000
Assets under management $3,151,304
Dividend treatment Distribution
Dividend frequency Semi-annual
Dividend currency USD
Dividend per share $0.2271
Dividend yield* 0.5045%
Dividend ex date 23/01/2013
*Gross trailing 12 month yield.
ISIN IE00B3Z0X395
Index informationIndex name MSCI Korea Index
Index currency USD
Benchmark type Total Return (Net)
Index rebalancing frequency Quarterly
TR index Bloomberg ticker NDEUSKO
TR Index Reuters RIC .dMIKR00000NUS
PR Index Bloomberg Ticker MSEUSKO
PR Index Reuters RIC .dMIKR00000PUS

Further information on HSBC ETFs Tel: 020 7024 0435 E-mail: [email protected] Website: www.etf.hsbc.com
44
About the Index
The Fund will aim to replicate the performance of the Index as calculated by MSCI Inc.
The Index offers a representation of the South Korean equity market by targeting all companies with a market capitalization within the top 85% of their investable equity universe, subject to a global minimum size requirement. It is based on MSCI’s Global Investable Market Indices methodology.
The composition of the Index is reviewed on a quarterly basis and carried out according to the published rules governing the management of the Index as set out by MSCI Inc.
Yearly fund performance (%)
31/05/09 - 31/05/10 31/05/10 - 31/05/11 31/05/11 - 31/05/12 31/05/12 - 31/05/13 31/05/13 - 31/05/14
HSBC MSCI KOREA UCITS ETF N/A N/A -19.32 11.47 12.52
Fund and Index cumulative performance (%)
1 month 3 months 1 year 3 years Since inception
HSBC MSCI KOREA UCITS ETF 3.69 5.49 12.52 1.19 2.13
MSCI Korea Net 3.77 5.71 13.26 3.61 4.73
Tracking difference1 -0.08 -0.22 -0.74 -2.41 -2.61
Tracking error2 N/A N/A 0.805 N/A 0.666
1 The tracking difference Net is the difference between the return of the fund (NAV) and that of the underlying index, after management fees (TER).2 The tracking error also known active risk, is the standard deviation of the tracking difference i.e. how variable is the tracking difference over time. The optimal tracking error would be zero.
Source: HSBC Global Asset Management (UK) Limited. All data as at 31/05/2014
Any performance information shown refers to the past and should not be seen as an indication of future returns.
Performance is shown using the net asset value of the fund, calculated from the closing price of the underlying securities. Performance is shown after fees including re-invested dividends in the base currency of the fund and does not take into account any currency exposure that may exist against the trading currency of the fund, where this is different.
Listing and trading information
Listing date
Trading currency
Trading hours (local time)
Bloomberg ticker
Reuters RIC
iNAV Bloomberg
iNAV Reuters
London Stock Exchange 07/04/2011 GBP 08:00 - 16:30 HKOR LN HKOR.L HKORGBPI HKORINAVGBP=HSBL
London Stock Exchange 07/04/2011 USD 08:00 - 16:30 HKOD LN HKOD.L HKORUSDI HKORINAVUSD=HSBL
Euronext Paris N/A EUR 09:00 - 17:30 N/A N/A N/A N/A
SIX Swiss Exchange 08/11/2011 USD 09:00 - 17:30 HKOR SW HKOR.S HKORUSDI HKORINAVUSD=HSBL
SIX Swiss Exchange N/A EUR 09:00 - 17:30 N/A N/A N/A N/A
Xetra Deutsche Börse N/A EUR 09:00 - 17:30 N/A N/A N/A N/A

45
Source: HSBC Global Asset Management (UK) Limited. All data as at 31/05/2014
HSBC MSCI BRAZIL UCITS ETFPhysical – Full replicationTicker: HBRL
The HSBC MSCI BRAZIL UCITS ETF is an open ended UCITS IV compliant exchange-traded fund incorporated in Ireland.
Fund objective
The investment objective of the Fund is to replicate the performance of the MSCI Brazil Index (the “Index”), while minimising as far as possible the tracking error between the Fund’s performance and that of the Index. The Index is a market-capitalisation weighted index designed to measure the performance of the largest companies in Brazil, as defined by the Index Provider. Brazilian equity markets are considered to be emerging markets and accordingly, are subject to specific risk factors.
In seeking to achieve its investment objective, the Fund will aim to invest in securities included in the Index in generally the same proportions in which they are included in the Index.
Key facts
• Physical replication approach • Listed on London Stock Exchange, Euronext Paris, SIX Swiss
Exchange and Xetra Deutsche Börse • Total Expense Ratio (TER) of 0.60% per annum • Multi currency listing in GBP, EUR and USD • Fund registered in several European countries: UK, France, Germany,
Italy, Ireland, Netherlands, Spain, Sweden, Switzerland
Sector allocation of the Fund
Financials (31.84%) Consumer Staples (16.41%) Energy (14.73%) Materials (14.13%) Consumer Discretionary (5.35%) Utilities (5.15%) Industrials (5.06%) Information Technology (3.50%) Telecommunication Services (3.06%) Health Care (0.77%)
Top 10 holdings of the Fund
Petroleo Brasileiro 12.38% BRF 3.34%
Itau Unibanco 9.27% Cielo 3.00%
Banco Bradesco 9.08% Itausa Investimentos 2.89%
Vale 9.06% BM&FBOVESPA 2.19%
Ambev 7.90% Banco do Brasil 2.07%
Fund detailsUCITS IV compliant Yes
Fund domicile Ireland
UK reporting fund status (UKRF) Yes
ISA eligible Yes
SIPP eligible Yes
Issuer HSBC ETFs Plc
Fund manager HSBC Global Asset Management (UK) Limited
Custodian HSBC Institutional Trust Services (Ireland) Limited
Fund administrator HSBC Securities Services (Ireland) Limited
Authorised participant HSBC Bank Plc
Benchmark MSCI Brazil Index
Number of holdings 75
Published daily on etf.hsbc.com website
Replication method Physical – Full Replication
Base currency USD
Fund inception date 12/07/2010
Listing date 13/10/2010
Fiscal year end 31 December
Total Expense Ratio (TER) 0.60%
Entry/Exit/Performance fees No
Net asset value (NAV) per share $23.06
Shares outstanding 447,000
Assets under management $10,308,493
Dividend treatment Distribution
Dividend frequency Semi-annual
Dividend currency USD
Dividend per share $0.2387
Dividend yield* 2.4335%
Dividend ex date 15/01/2014
*Gross trailing 12 month yield.
ISIN IE00B5W34K94
Index informationIndex name MSCI Brazil Index
Index currency USD
Benchmark type Total Return (Net)
Index rebalancing frequency Quarterly
TR index Bloomberg ticker NDUEBRAF
TR Index Reuters RIC .dMIBR00000NUS
PR Index Bloomberg Ticker MSEUSBR
PR Index Reuters RIC .dMIBR00000PUS

Further information on HSBC ETFs Tel: 020 7024 0435 E-mail: [email protected] Website: www.etf.hsbc.com
46
About the Index
The Fund will aim to replicate the performance of the Index as calculated by MSCI Inc.
The Index offers a representation of the Brazilian equity markets by targeting all companies with a market capitalization within the top 85% of their investable equity universe, subject to a global minimum size requirement. It is based on MSCI’s Global Investable Market Indices methodology.
The composition of the Index is reviewed on a quarterly basis and carried out according to the published rules governing the management of the Index as set out by MSCI Inc.
Yearly fund performance (%)
31/05/09 - 31/05/10 31/05/10 - 31/05/11 31/05/11 - 31/05/12 31/05/12 - 31/05/13 31/05/13 - 31/05/14
HSBC MSCI BRAZIL UCITS ETF N/A N/A -28.24 2.08 -6.76
Fund and Index cumulative performance (%)
1 month 3 months 1 year 3 years Since inception
HSBC MSCI BRAZIL UCITS ETF -1.77 12.99 -6.76 -31.70 -20.58
MSCI Brazil Net -1.75 13.15 -6.17 -30.29 -18.58
Tracking difference1 -0.02 -0.16 -0.59 -1.40 -2.00
Tracking error2 N/A N/A 0.087 N/A 0.127
1 The tracking difference Net is the difference between the return of the fund (NAV) and that of the underlying index, after management fees (TER).2 The tracking error also known active risk, is the standard deviation of the tracking difference i.e. how variable is the tracking difference over time. The optimal tracking error would be zero.
Source: HSBC Global Asset Management (UK) Limited. All data as at 31/05/2014
Any performance information shown refers to the past and should not be seen as an indication of future returns.
Performance is shown using the net asset value of the fund, calculated from the closing price of the underlying securities. Performance is shown after fees including re-invested dividends in the base currency of the fund and does not take into account any currency exposure that may exist against the trading currency of the fund, where this is different.
Listing and trading information
Listing date
Trading currency
Trading hours (local time)
Bloomberg ticker
Reuters RIC
iNAV Bloomberg
iNAV Reuters
London Stock Exchange 14/10/2010 GBP 08:00 - 16:30 HBRL LN HBRL.L HMBRGBPI HMBRINAVGBP=HSBL
London Stock Exchange 13/07/2010 USD 08:00 - 16:30 HMBR LN HMBR.L HMBRUSDI HMBRINAVUSD=HSBL
Euronext Paris 03/11/2010 EUR 09:00 - 17:30 HBZ FP HBZ.PA HMBREURI HMBRINAVEUR=HSBL
SIX Swiss Exchange 19/04/2011 USD 09:00 - 17:30 HBRL SW HBRL.S HMBRUSDI HMBRINAVUSD=HSBL
SIX Swiss Exchange N/A EUR 09:00 - 17:30 N/A N/A N/A N/A
Xetra Deutsche Börse 15/10/2010 EUR 09:00 - 17:30H4ZG GY & H4ZG GR
H4ZG.DE HMBREURI HMBRINAVEUR=HSBL
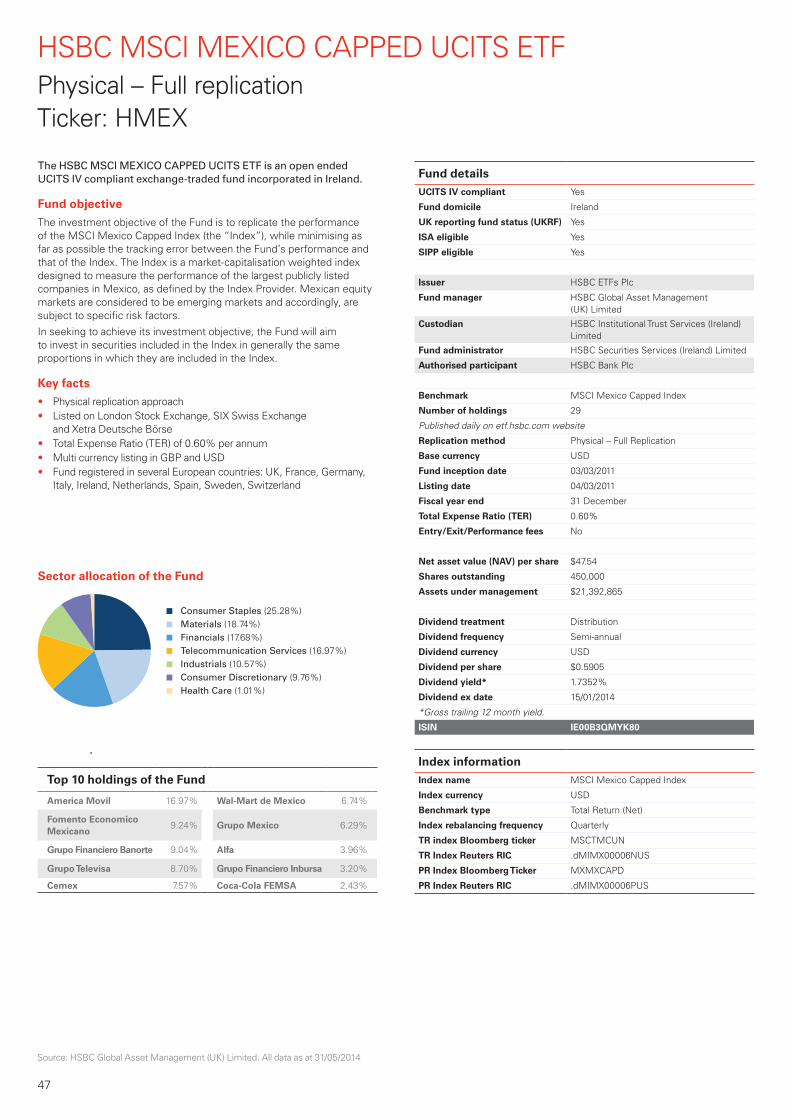
47
Source: HSBC Global Asset Management (UK) Limited. All data as at 31/05/2014
HSBC MSCI MEXICO CAPPED UCITS ETFPhysical – Full replicationTicker: HMEX
The HSBC MSCI MEXICO CAPPED UCITS ETF is an open ended UCITS IV compliant exchange-traded fund incorporated in Ireland.
Fund objective
The investment objective of the Fund is to replicate the performance of the MSCI Mexico Capped Index (the “Index”), while minimising as far as possible the tracking error between the Fund’s performance and that of the Index. The Index is a market-capitalisation weighted index designed to measure the performance of the largest publicly listed companies in Mexico, as defined by the Index Provider. Mexican equity markets are considered to be emerging markets and accordingly, are subject to specific risk factors.
In seeking to achieve its investment objective, the Fund will aim to invest in securities included in the Index in generally the same proportions in which they are included in the Index.
Key facts
• Physical replication approach • Listed on London Stock Exchange, SIX Swiss Exchange
and Xetra Deutsche Börse • Total Expense Ratio (TER) of 0.60% per annum • Multi currency listing in GBP and USD • Fund registered in several European countries: UK, France, Germany,
Italy, Ireland, Netherlands, Spain, Sweden, Switzerland
Sector allocation of the Fund
Consumer Staples (25.28%) Materials (18.74%) Financials (17.68%) Telecommunication Services (16.97%) Industrials (10.57%) Consumer Discretionary (9.76%) Health Care (1.01%)
Top 10 holdings of the Fund
America Movil 16.97% Wal-Mart de Mexico 6.74%
Fomento Economico Mexicano
9.24% Grupo Mexico 6.29%
Grupo Financiero Banorte 9.04% Alfa 3.96%
Grupo Televisa 8.70% Grupo Financiero Inbursa 3.20%
Cemex 7.57% Coca-Cola FEMSA 2.43%
Fund detailsUCITS IV compliant Yes
Fund domicile Ireland
UK reporting fund status (UKRF) Yes
ISA eligible Yes
SIPP eligible Yes
Issuer HSBC ETFs Plc
Fund manager HSBC Global Asset Management (UK) Limited
Custodian HSBC Institutional Trust Services (Ireland) Limited
Fund administrator HSBC Securities Services (Ireland) Limited
Authorised participant HSBC Bank Plc
Benchmark MSCI Mexico Capped Index
Number of holdings 29
Published daily on etf.hsbc.com website
Replication method Physical – Full Replication
Base currency USD
Fund inception date 03/03/2011
Listing date 04/03/2011
Fiscal year end 31 December
Total Expense Ratio (TER) 0.60%
Entry/Exit/Performance fees No
Net asset value (NAV) per share $47.54
Shares outstanding 450,000
Assets under management $21,392,865
Dividend treatment Distribution
Dividend frequency Semi-annual
Dividend currency USD
Dividend per share $0.5905
Dividend yield* 1.7352%
Dividend ex date 15/01/2014
*Gross trailing 12 month yield.
ISIN IE00B3QMYK80
Index informationIndex name MSCI Mexico Capped Index
Index currency USD
Benchmark type Total Return (Net)
Index rebalancing frequency Quarterly
TR index Bloomberg ticker MSCTMCUN
TR Index Reuters RIC .dMIMX00006NUS
PR Index Bloomberg Ticker MXMXCAPD
PR Index Reuters RIC .dMIMX00006PUS

Further information on HSBC ETFs Tel: 020 7024 0435 E-mail: [email protected] Website: www.etf.hsbc.com
48
About the Index
The MSCI Mexico Capped Index (“the Index”) is based on the MSCI Mexico Index (“Parent Index”), which offers a representation of the Mexican market by targeting all companies with a market capitalization within the top 85 per cent of the Mexican investable equity universe.
At construction and at each rebalancing (quarterly review), if the weight of the largest Group Entity in the MSCI Mexico Index is greater than 33 per cent, its weight will be capped to 33 per cent. The weight of the remaining Group Entities will be increased accordingly, in proportion to their weight prior to the capping.
If the resulting weight of any of the remaining Group Entities is greater than 18 per cent of the index, its weight will be capped to 18 per cent, while simultaneously maintaining the weight of the largest Group Entity at 33 per cent. The remaining group entities are weighted according to their free float adjusted market capitalizations applicable to foreign investors as a percentage of the remaining non-capped weight.
On a daily basis, if the weight of the largest Group Entity in the MSCI Mexico Capped Index increases above 35 per cent, its weight will be capped at 33 per cent. If the weight of the remaining Group Entities increases above 20 per cent, its weight will be capped at 18 per cent.
Any changes in the constituent companies of the Parent Index will also be reflected in the Index.
Yearly fund performance (%)
31/05/09 - 31/05/10 31/05/10 - 31/05/11 31/05/11 - 31/05/12 31/05/12 - 31/05/13 31/05/13 - 31/05/14
HSBC MSCI MEXICO CAPPED UCITS ETF
N/A N/A -10.48 23.74 0.16
Fund and Index cumulative performance (%)
1 month 3 months 1 year 3 years Since inception
HSBC MSCI MEXICO CAPPED UCITS ETF
3.03 8.96 0.16 10.94 11.61
MSCI Mexico Capped Net 3.06 9.09 0.69 12.70 13.54
Tracking difference1 -0.03 -0.13 -0.53 -1.76 -1.92
Tracking error2 N/A N/A 0.160 N/A 0.123
1 The tracking difference Net is the difference between the return of the fund (NAV) and that of the underlying index, after management fees (TER).2 The tracking error also known active risk, is the standard deviation of the tracking difference i.e. how variable is the tracking difference over time. The optimal tracking error would be zero.
Source: HSBC Global Asset Management (UK) Limited. All data as at 31/05/2014
Any performance information shown refers to the past and should not be seen as an indication of future returns.
Performance is shown using the net asset value of the fund, calculated from the closing price of the underlying securities. Performance is shown after fees including re-invested dividends in the base currency of the fund and does not take into account any currency exposure that may exist against the trading currency of the fund, where this is different.
Listing and trading information
Listing date
Trading currency
Trading hours (local time)
Bloomberg ticker
Reuters RIC
iNAV Bloomberg
iNAV Reuters
London Stock Exchange 04/03/2011 GBP 08:00 - 16:30 HMEX LN HMEX.L HMEXGBPI HMEXINAVGBP=HSBL
London Stock Exchange 04/03/2011 USD 08:00 - 16:30 HMED LN HMEDC.L HMEXUSDI HMEXINAVUSD=HSBL
Euronext Paris N/A EUR 09:00 - 17:30 N/A N/A N/A N/A
SIX Swiss Exchange 07/06/2011 USD 09:00 - 17:30 HMEX SW HMEX.S HMEXUSDI HMEXINAVUSD=HSBL
SIX Swiss Exchange N/A EUR 09:00 - 17:30 N/A N/A N/A N/A
Xetra Deutsche Börse N/A EUR 09:00 - 17:30 N/A N/A N/A N/A

49
Source: HSBC Global Asset Management (UK) Limited. All data as at 31/05/2014
HSBC MSCI SOUTH AFRICA UCITS ETFPhysical – Full replicationTicker: HZAR
The HSBC MSCI SOUTH AFRICA UCITS ETF is an open ended UCITS IV compliant exchange-traded fund incorporated in Ireland.
Fund objective
The investment objective of the Fund is to replicate the performance of the MSCI South Africa Index (the “Index”), while minimising as far as possible the tracking error between the Fund’s performance and that of the Index. The Index is a market-capitalisation weighted index designed to measure the performance of the largest companies in South Africa, as defined by the Index Provider. South African equity markets are considered to be emerging markets and accordingly, are subject to specific risk factors.
In seeking to achieve its investment objective, the Fund will aim to invest in securities included in the Index in generally the same proportions in which they are included in the Index.
Key facts
• Physical replication approach • Listed on London Stock Exchange, Euronext Paris, SIX Swiss
Exchange and Xetra Deutsche Börse • Total Expense Ratio (TER) of 0.60% per annum • Multi currency listing in GBP, EUR and USD • Fund registered in several European countries: UK, France, Germany,
Italy, Ireland, Netherlands, Spain, Sweden, Switzerland
Sector allocation of the Fund
Financials (26.60%) Consumer Discretionary (23.65%) Telecommunication Services (13.33%) Energy (10.96%) Materials (10.25%) Health Care (6.01%) Consumer Staples (5.35%) Industrials (3.85%)
Top 10 holdings of the Fund
Naspers 14.50% Sanlam 3.32%
MTN Group 11.83% Remgro 3.32%
Sasol 10.34% Steinhoff International 3.11%
Standard Bank 5.41% Aspen Pharmacare 2.94%
FirstRand 3.88% Bidvest 2.78%
Fund detailsUCITS IV compliant Yes
Fund domicile Ireland
UK reporting fund status (UKRF) Yes
ISA eligible Yes
SIPP eligible Yes
Issuer HSBC ETFs Plc
Fund manager HSBC Global Asset Management (UK) Limited
Custodian HSBC Institutional Trust Services (Ireland) Limited
Fund administrator HSBC Securities Services (Ireland) Limited
Authorised participant HSBC Bank Plc
Benchmark MSCI South Africa Index
Number of holdings 50
Published daily on etf.hsbc.com website
Replication method Physical – Full Replication
Base currency USD
Fund inception date 14/02/2011
Listing date 16/02/2011
Fiscal year end 31 December
Total Expense Ratio (TER) 0.60%
Entry/Exit/Performance fees No
Net asset value (NAV) per share $56.16
Shares outstanding 100,000
Assets under management $5,616,446
Dividend treatment Distribution
Dividend frequency Semi-annual
Dividend currency USD
Dividend per share $0.6288
Dividend yield* 2.2235%
Dividend ex date 29/01/2014
*Gross trailing 12 month yield.
ISIN IE00B57S5Q22
Index informationIndex name MSCI South Africa Index
Index currency USD
Benchmark type Total Return (Net)
Index rebalancing frequency Quarterly
TR index Bloomberg ticker NDEUSSA
TR Index Reuters RIC .dMIZA00000NUS
PR Index Bloomberg Ticker MSEUSSA
PR Index Reuters RIC .dMIZA00000PUS
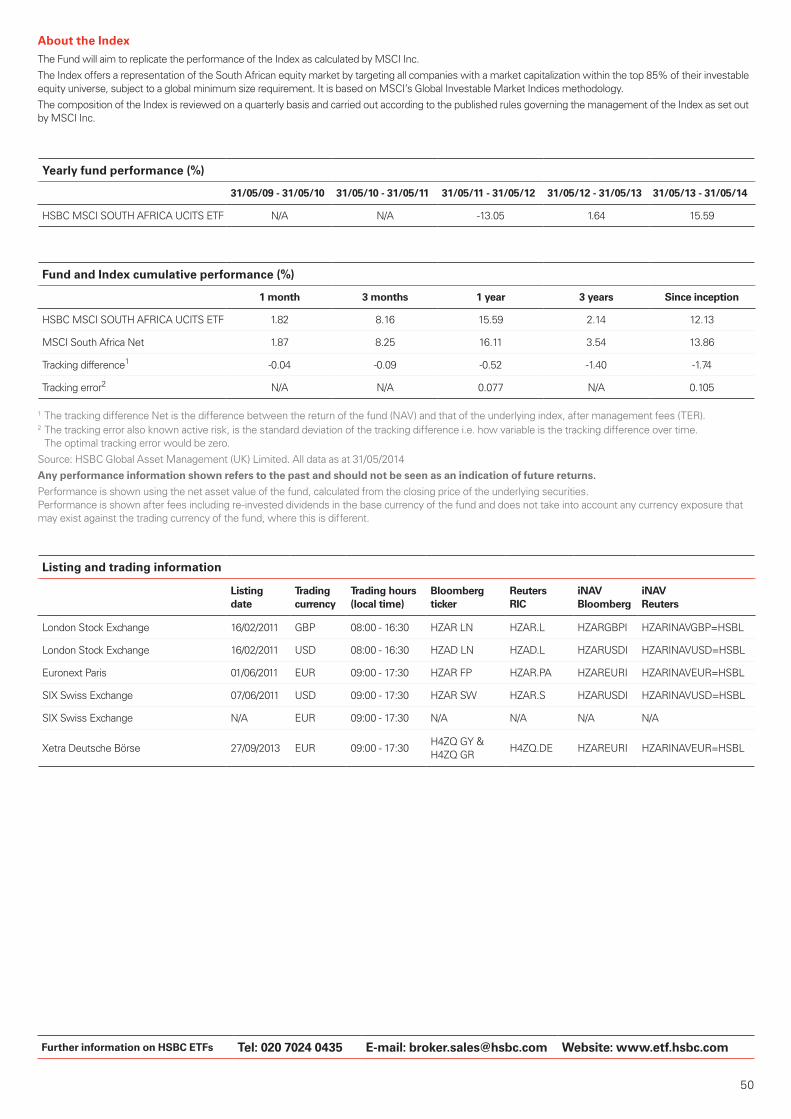
Further information on HSBC ETFs Tel: 020 7024 0435 E-mail: [email protected] Website: www.etf.hsbc.com
50
About the Index
The Fund will aim to replicate the performance of the Index as calculated by MSCI Inc.
The Index offers a representation of the South African equity market by targeting all companies with a market capitalization within the top 85% of their investable equity universe, subject to a global minimum size requirement. It is based on MSCI’s Global Investable Market Indices methodology.
The composition of the Index is reviewed on a quarterly basis and carried out according to the published rules governing the management of the Index as set out by MSCI Inc.
Yearly fund performance (%)
31/05/09 - 31/05/10 31/05/10 - 31/05/11 31/05/11 - 31/05/12 31/05/12 - 31/05/13 31/05/13 - 31/05/14
HSBC MSCI SOUTH AFRICA UCITS ETF N/A N/A -13.05 1.64 15.59
Fund and Index cumulative performance (%)
1 month 3 months 1 year 3 years Since inception
HSBC MSCI SOUTH AFRICA UCITS ETF 1.82 8.16 15.59 2.14 12.13
MSCI South Africa Net 1.87 8.25 16.11 3.54 13.86
Tracking difference1 -0.04 -0.09 -0.52 -1.40 -1.74
Tracking error2 N/A N/A 0.077 N/A 0.105
1 The tracking difference Net is the difference between the return of the fund (NAV) and that of the underlying index, after management fees (TER).2 The tracking error also known active risk, is the standard deviation of the tracking difference i.e. how variable is the tracking difference over time. The optimal tracking error would be zero.
Source: HSBC Global Asset Management (UK) Limited. All data as at 31/05/2014
Any performance information shown refers to the past and should not be seen as an indication of future returns.
Performance is shown using the net asset value of the fund, calculated from the closing price of the underlying securities. Performance is shown after fees including re-invested dividends in the base currency of the fund and does not take into account any currency exposure that may exist against the trading currency of the fund, where this is different.
Listing and trading information
Listing date
Trading currency
Trading hours (local time)
Bloomberg ticker
Reuters RIC
iNAV Bloomberg
iNAV Reuters
London Stock Exchange 16/02/2011 GBP 08:00 - 16:30 HZAR LN HZAR.L HZARGBPI HZARINAVGBP=HSBL
London Stock Exchange 16/02/2011 USD 08:00 - 16:30 HZAD LN HZAD.L HZARUSDI HZARINAVUSD=HSBL
Euronext Paris 01/06/2011 EUR 09:00 - 17:30 HZAR FP HZAR.PA HZAREURI HZARINAVEUR=HSBL
SIX Swiss Exchange 07/06/2011 USD 09:00 - 17:30 HZAR SW HZAR.S HZARUSDI HZARINAVUSD=HSBL
SIX Swiss Exchange N/A EUR 09:00 - 17:30 N/A N/A N/A N/A
Xetra Deutsche Börse 27/09/2013 EUR 09:00 - 17:30H4ZQ GY & H4ZQ GR
H4ZQ.DE HZAREURI HZARINAVEUR=HSBL
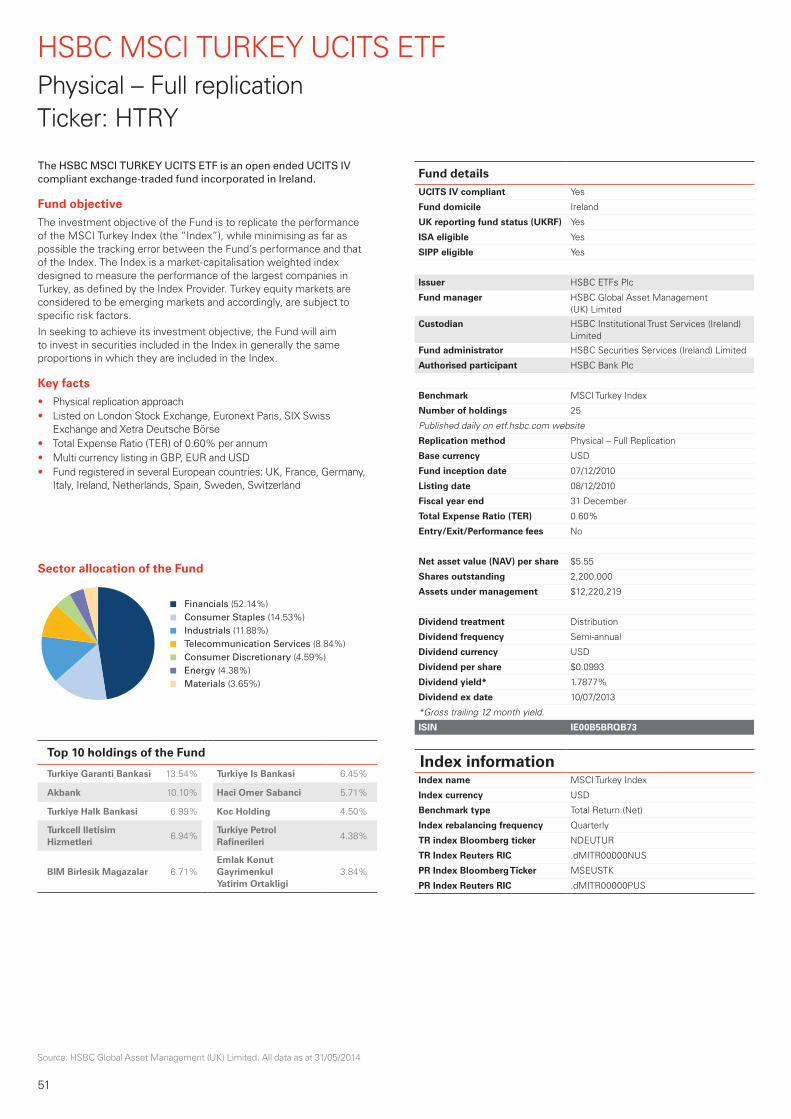
51
Source: HSBC Global Asset Management (UK) Limited. All data as at 31/05/2014
HSBC MSCI TURKEY UCITS ETFPhysical – Full replicationTicker: HTRY
The HSBC MSCI TURKEY UCITS ETF is an open ended UCITS IV compliant exchange-traded fund incorporated in Ireland.
Fund objective
The investment objective of the Fund is to replicate the performance of the MSCI Turkey Index (the “Index”), while minimising as far as possible the tracking error between the Fund’s performance and that of the Index. The Index is a market-capitalisation weighted index designed to measure the performance of the largest companies in Turkey, as defined by the Index Provider. Turkey equity markets are considered to be emerging markets and accordingly, are subject to specific risk factors.
In seeking to achieve its investment objective, the Fund will aim to invest in securities included in the Index in generally the same proportions in which they are included in the Index.
Key facts
• Physical replication approach • Listed on London Stock Exchange, Euronext Paris, SIX Swiss
Exchange and Xetra Deutsche Börse • Total Expense Ratio (TER) of 0.60% per annum • Multi currency listing in GBP, EUR and USD • Fund registered in several European countries: UK, France, Germany,
Italy, Ireland, Netherlands, Spain, Sweden, Switzerland
Sector allocation of the Fund
Financials (52.14%) Consumer Staples (14.53%) Industrials (11.88%) Telecommunication Services (8.84%) Consumer Discretionary (4.59%) Energy (4.38%) Materials (3.65%)
Top 10 holdings of the Fund
Turkiye Garanti Bankasi 13.54% Turkiye Is Bankasi 6.45%
Akbank 10.10% Haci Omer Sabanci 5.71%
Turkiye Halk Bankasi 6.99% Koc Holding 4.50%
Turkcell Iletisim Hizmetleri
6.94%Turkiye Petrol Rafinerileri
4.38%
BIM Birlesik Magazalar 6.71%Emlak Konut Gayrimenkul Yatirim Ortakligi
3.84%
Fund detailsUCITS IV compliant Yes
Fund domicile Ireland
UK reporting fund status (UKRF) Yes
ISA eligible Yes
SIPP eligible Yes
Issuer HSBC ETFs Plc
Fund manager HSBC Global Asset Management (UK) Limited
Custodian HSBC Institutional Trust Services (Ireland) Limited
Fund administrator HSBC Securities Services (Ireland) Limited
Authorised participant HSBC Bank Plc
Benchmark MSCI Turkey Index
Number of holdings 25
Published daily on etf.hsbc.com website
Replication method Physical – Full Replication
Base currency USD
Fund inception date 07/12/2010
Listing date 08/12/2010
Fiscal year end 31 December
Total Expense Ratio (TER) 0.60%
Entry/Exit/Performance fees No
Net asset value (NAV) per share $5.55
Shares outstanding 2,200,000
Assets under management $12,220,219
Dividend treatment Distribution
Dividend frequency Semi-annual
Dividend currency USD
Dividend per share $0.0993
Dividend yield* 1.7877%
Dividend ex date 10/07/2013
*Gross trailing 12 month yield.
ISIN IE00B5BRQB73
Index informationIndex name MSCI Turkey Index
Index currency USD
Benchmark type Total Return (Net)
Index rebalancing frequency Quarterly
TR index Bloomberg ticker NDEUTUR
TR Index Reuters RIC .dMITR00000NUS
PR Index Bloomberg Ticker MSEUSTK
PR Index Reuters RIC .dMITR00000PUS
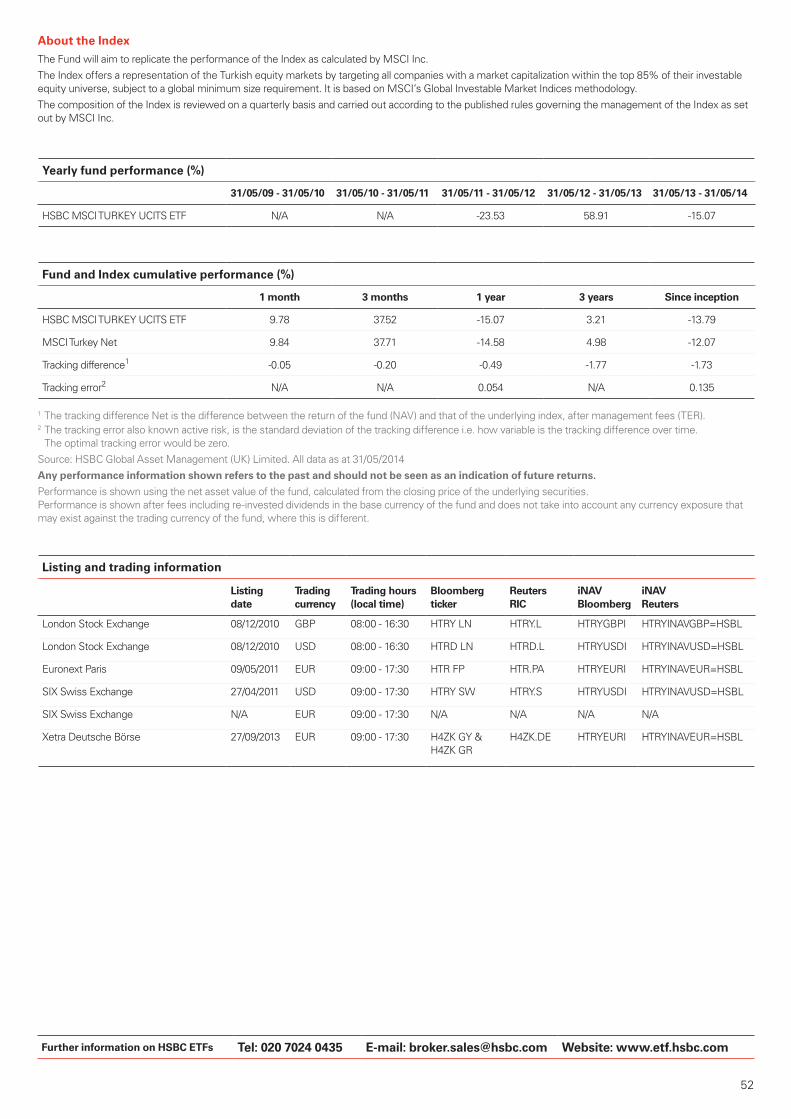
Further information on HSBC ETFs Tel: 020 7024 0435 E-mail: [email protected] Website: www.etf.hsbc.com
52
About the Index
The Fund will aim to replicate the performance of the Index as calculated by MSCI Inc.
The Index offers a representation of the Turkish equity markets by targeting all companies with a market capitalization within the top 85% of their investable equity universe, subject to a global minimum size requirement. It is based on MSCI’s Global Investable Market Indices methodology.
The composition of the Index is reviewed on a quarterly basis and carried out according to the published rules governing the management of the Index as set out by MSCI Inc.
Yearly fund performance (%)
31/05/09 - 31/05/10 31/05/10 - 31/05/11 31/05/11 - 31/05/12 31/05/12 - 31/05/13 31/05/13 - 31/05/14
HSBC MSCI TURKEY UCITS ETF N/A N/A -23.53 58.91 -15.07
Fund and Index cumulative performance (%)
1 month 3 months 1 year 3 years Since inception
HSBC MSCI TURKEY UCITS ETF 9.78 37.52 -15.07 3.21 -13.79
MSCI Turkey Net 9.84 37.71 -14.58 4.98 -12.07
Tracking difference1 -0.05 -0.20 -0.49 -1.77 -1.73
Tracking error2 N/A N/A 0.054 N/A 0.135
1 The tracking difference Net is the difference between the return of the fund (NAV) and that of the underlying index, after management fees (TER).2 The tracking error also known active risk, is the standard deviation of the tracking difference i.e. how variable is the tracking difference over time. The optimal tracking error would be zero.
Source: HSBC Global Asset Management (UK) Limited. All data as at 31/05/2014
Any performance information shown refers to the past and should not be seen as an indication of future returns.
Performance is shown using the net asset value of the fund, calculated from the closing price of the underlying securities. Performance is shown after fees including re-invested dividends in the base currency of the fund and does not take into account any currency exposure that may exist against the trading currency of the fund, where this is different.
Listing and trading information
Listing date
Trading currency
Trading hours (local time)
Bloomberg ticker
Reuters RIC
iNAV Bloomberg
iNAV Reuters
London Stock Exchange 08/12/2010 GBP 08:00 - 16:30 HTRY LN HTRY.L HTRYGBPI HTRYINAVGBP=HSBL
London Stock Exchange 08/12/2010 USD 08:00 - 16:30 HTRD LN HTRD.L HTRYUSDI HTRYINAVUSD=HSBL
Euronext Paris 09/05/2011 EUR 09:00 - 17:30 HTR FP HTR.PA HTRYEURI HTRYINAVEUR=HSBL
SIX Swiss Exchange 27/04/2011 USD 09:00 - 17:30 HTRY SW HTRY.S HTRYUSDI HTRYINAVUSD=HSBL
SIX Swiss Exchange N/A EUR 09:00 - 17:30 N/A N/A N/A N/A
Xetra Deutsche Börse 27/09/2013 EUR 09:00 - 17:30 H4ZK GY & H4ZK GR
H4ZK.DE HTRYEURI HTRYINAVEUR=HSBL

53 54
Fund name Launch date ISINDividend frequency
UCITSUK Reporting Fund Status
SIPP Eligible 1 ISA Eligible 2 German Transparency 3
Swiss Reporting 4
Plan d’Epargne en Actions
(”PEA”) Eligibility 5
In scope of EUSD 6
HSBC EURO STOXX 50 UCITS ETF 06/10/2009 IE00B4K6B022 Semi-annual √ √ √ √ √ √ √ X
HSBC FTSE 100 UCITS ETF 25/08/2009 IE00B42TW061 Semi-annual √ √ √ √ √ √ √ X
HSBC FTSE 250 UCITS ETF 08/04/2010 IE00B64PTF05 Quarterly √ √ √ √ X X √ X
HSBC FTSE EPRA/NAREIT DEVELOPED UCITS ETF 22/06/2011 IE00B5L01S80 Quarterly √ √ √ √ √ X X X
HSBC MSCI BRAZIL UCITS ETF 14/10/2010 IE00B5W34K94 Semi-annual √ √ √ √ √ √ X X
HSBC MSCI CANADA UCITS ETF 24/02/2011 IE00B51B7Z02 Semi-annual √ √ √ √ √ √ X X
HSBC MSCI CHINA UCITS ETF 28/01/2011 IE00B44T3H88 Semi-annual √ √ √ √ √ √ X X
HSBC MSCI EMERGING MARKETS UCITS ETF 07/09/2011 IE00B5SSQT16 Quarterly √ √ √ √ √ √ X X
HSBC MSCI EM FAR EAST UCITS ETF 28/09/2010 IE00B5LP3W10 Semi-annual √ √ √ √ √ √ X X
HSBC MSCI EM LATIN AMERICA UCITS ETF 11/03/2011 IE00B4TS3815 Quarterly √ √ √ √ √ √ X X
HSBC MSCI EUROPE UCITS ETF 02/06/2010 IE00B5BD5K76 Semi-annual √ √ √ √ √ √ √ X
HSBC MSCI INDONESIA UCITS ETF 30/03/2011 IE00B46G8275 Semi-annual √ √ √ √ √ √ X X
HSBC MSCI JAPAN UCITS ETF 24/03/2010 IE00B5VX7566 Semi-annual √ √ √ √ √ √ X X
HSBC MSCI KOREA UCITS ETF 07/04/2011 IE00B3Z0X395 Semi-annual √ √ √ √ √ √ X X
HSBC MSCI MALAYSIA UCITS ETF 30/03/2011 IE00B3X3R831 Semi-annual √ √ √ √ √ √ X X
HSBC MSCI MEXICO CAPPED UCITS ETF 04/03/2011 IE00B3QMYK80 Semi-annual √ √ √ √ √ √ X X
HSBC MSCI PACIFIC ex JAPAN UCITS ETF 07/09/2010 IE00B5SG8Z57 Semi-annual √ √ √ √ √ √ X X
HSBC MSCI RUSSIA CAPPED UCITS ETF 06/07/2011 IE00B5LJZQ16 Semi-annual √ √ √ √ √ √ X X
HSBC MSCI SOUTH AFRICA UCITS ETF 16/02/2011 IE00B57S5Q22 Semi-annual √ √ √ √ √ √ X X
HSBC MSCI TAIWAN UCITS ETF 30/03/2011 IE00B3S1J086 Semi-annual √ √ √ √ √ √ X X
HSBC MSCI TURKEY UCITS ETF 08/12/2010 IE00B5BRQB73 Semi-annual √ √ √ √ √ √ X X
HSBC MSCI USA UCITS ETF 02/06/2010 IE00B5WFQ436 Semi-annual √ √ √ √ √ √ X X
HSBC MSCI WORLD UCITS ETF 10/12/2010 IE00B4X9L533 Quarterly √ √ √ √ √ √ X X
HSBC S&P 500 UCITS ETF 17/05/2010 IE00B5KQNG97 Semi-annual √ √ √ √ √ √ X X
HSBC S&P BRIC 40 UCITS ETF 26/01/2011 IE00B5YLK706 Semi-annual √ √ √ √ √ √ X X
HSBC MSCI AC FAR EAST ex JAPAN UCITS ETF 9/25/2013 IE00BBQ2W338 Accumulation √ √ √ √ √ √ X X
1 This column details whether the fund is an eligible investment for inclusion in a Self Invested Personal Pension plan (‘SIPP’). A SIPP is a UK pension scheme that allows the investor to direct the pension scheme provider to make certain investments of their choice.2 This column details whether the fund is an eligible investment for inclusion in a Stocks and Shares Individual Savings Account (‘ISA’). An ISA is a ‘wrapper’ allowing UK resident individuals to make tax efficient investments. 3 All funds registered for sale in Germany undertake German tax reporting to qualify for German tax transparency. 4 This column details whether a fund is registered for sale in Switzerland. All funds registered for sale in Switzerland will undertake Swiss reporting.5 For the purpose of eligibility requirements of Article L-221-31 of the French Monetary and Financial Code, the relevant Funds must at all times be invested in more than 75% of PEA eligible assets. PEA eligible assets are defined as equity or equity equivalent securities, which have their registered office in a country which is a member of the EU or the European Economic Area.
6 The taxation of Savings Income Directive (EC Directive 2003/48/EC) sets out obligations for paying agents with regard to the payment of interest. HSBC ETF plc sub funds will be out of scope for EUSD purposes to the extent that they have invested less than 15% of their assets directly or indirectly in debt claims (as defined by the EU Savings Directive). If they invest more than 15% but not more than 40% in debt claims then they will be in scope for dividend payments. If they invest more than 40% of their assets in debt claims then they will be in scope for both dividend payments and redemptions. In such circumstances, an Irish paying agent may be required to report income received by HSBC ETF plc shareholders to the relevant tax authority. Shareholders should inform themselves of, and where appropriate take advice on, the impact of the EU Savings Directive on their investment.
Tax status is subject to change. HSBC is not providing tax advice. You should make your own assessment on your tax status and seek professional advice if necessary.
Tax status of HSBC Exchange Traded Funds – UK

This document is intended for Professionals Clients in the UK only and should not be distributed to or relied upon by retail clients.
The material contained herein is for information only and does not constitute investment advice or a recommendation to any reader of this material to buy or sell investments.
Care has been taken to ensure the accuracy of this document but HSBC Global Asset Management (UK) Limited accepts no responsibility for any errors or omissions contained therein.
Fund information:The HSBC ETFs are sub-funds of HSBC ETFs plc (“the Company”), an investment company with variable capital and segregated liability between sub-funds, incorporated in Ireland as a public limited company, and is authorised by the Central Bank of Ireland. The company is constituted as an umbrella fund, with segregated liability between sub-funds. UK based investors in HSBC ETFs plc are advised that they may not be afforded some of the protections conveyed by the Financial Services and Markets Act (2000), (“the Act”). The Company is recognised in the United Kingdom by the Financial Conduct Authority under section 264 of the Act. Shares purchased on the secondary market cannot usually be sold directly back to the Company. Investors must buy and sell shares on the secondary market with the assistance of an intermediary (e.g. a stockbroker) and may incur fees for doing so. In addition, investors may pay more than the current Net Asset Value per share when buying shares and may receive less than the current Net Asset Value per Share when selling them. The shares in HSBC ETFs plc have not been and will not be offered for sale or sold in the United States of America, its territories or possessions and all areas subject to its jurisdiction, or to United States Persons. Affiliated companies of HSBC Global Asset Management (UK) Limited may make markets in HSBC ETFs plc. All applications are made on the basis of the current HSBC ETFs plc Prospectus, relevant Key Investor Information Document (“KIID”), Supplementary Information Document (SID) and Fund supplement, and most recent annual and semi-annual reports, which can be obtained upon request free of charge from HSBC Global Asset Management (UK) Limited, 8 Canada Square, Canary Wharf, London, E14 5HQ. UK, or from a stockbroker or financial adviser. Investors and potential investors should read and note the risk warnings in the prospectus, relevant KIID and Fund supplement (where available) and additionally, in the case of retail clients, the information contained in the supporting SID.
Restrictions:The shares in HSBC ETFs plc have not been and will not be offered for sale or sold in the United States of America, its territories or possessions and all areas subject to its jurisdiction, or to United States Persons. Affiliated companies of HSBC Global Asset Management (UK) Limited may make markets in HSBC ETFs plc.
Risk warning:The value of investments and any income from them can go down as well as up and investors may not get back the amount originally invested. Stockmarket investments should be viewed as a medium to long term investment and should be held for at least five years.
Currency Exchange Risk: Where overseas investments are held the rate of currency exchange may also cause the value of such investments to fluctuate.
Emerging market risk: Investments in emerging markets are by their nature higher risk and potentially more volatile than those inherent in some established markets.
Geographic risk: Some of the ETFs invest predominantly in one geographic area; therefore any decline in the economy of this area may affect the prices and value of the underlying assets.
Russian Risk: There are significant risks inherent in investing in Russia, which could affect the value of investment. These include a lack of clarity in laws and regulations in the following areas: investor protection, banks and other financial services, the Russian economic system, taxation, transaction settlement and fiduciary duty and responsibilities of company management. Please see the supplement for full information.
Property Risk: The value of interests in real estate companies may be affected by changes in interest rates, tax laws and environmental laws and regulations. While the value of interests in REITs may be affected by the value of the property owned or the quality of the mortgages held by the trust.
Tax: The information in this document is based on HSBC’s interpretation of current legislation and HM Revenue & Customs practice. While we believe that this interpretation is correct, cannot guarantee it. Legislation and tax practice may change in the future. Tax treatment is based upon individual client circumstances.
Index disclaimer:The EURO STOXX 50 is the intellectual property (including registered trademarks) of Stoxx Limited, Zurich, Switzerland and/or Dow Jones & Company, Inc., a Delaware corporation, New York, USA, (the “Licensors”), which is used under license. The securities based on the Index are in no way sponsored, endorsed, sold or promoted by the Licensors and neither of the Licensors shall have any liability with respect thereto.
All rights in the FTSE 100 and the FTSE 250 (the “Indices”) vest in FTSE International Limited (“FTSE”). “FTSE®” is a trademark of London Stock Exchange Group companies and is used by FTSE under licence. The HSBC FTSE 100 UCITS ETF and the HSBC FTSE 250 UCITS ETF (the “Products”) have been developed solely by HSBC Global Asset Management (UK) Limited. The Indices are calculated by FTSE or its agent. FTSE and its licensors are not connected to and do not sponsor, advise, recommend, endorse or promote the Products and do not accept any liability whatsoever to any person arising out of (a) the use of, reliance on or any error in the Indices or (b) investment in or operation of the Products. FTSE makes no claim, prediction, warranty or representation either as to the results to be obtained from the Products or the suitability of the Indices for the purpose to which they are being put by HSBC Global Asset Management (UK) Limited.
“FTSE®” is a trade mark of the London Stock Exchange Group companies, “NAREIT®” is a trade mark of the National Association of Real Estate Investment Trusts (“NAREIT”) and “EPRA®” is a trade mark of the European Public Real Estate Association (“EPRA”) and all are used by FTSE International Limited (“FTSE”) under licence). The FTSE EPRA/NAREIT Developed® Index is calculated by FTSE. Neither FTSE, Euronext N.V., NAREIT nor EPRA sponsor, endorse or promote this product and are not in any way connected to it and do not accept any liability.
The FTSE EPRA/NAREIT Developed® Index is calculated by FTSE. Neither FTSE, Euronext N.V., NAREIT nor EPRA sponsor, endorse or promote this product and are not in any way connected to it and do not accept any liability. All intellectual property rights within the index values and constituent list vest in FTSE, Euronext N.V., NAREIT and EPRA. HSBC Global Asset Management (UK) Limited has obtained full licence from FTSE to use such intellectual property rights in the creation of this product.
The funds or securities referred to herein are not sponsored, endorsed, or promoted by MSCI, and MSCI bears no liability with respect to any such funds or securities or any index on which such funds or securities are based. The Supplement to the Prospectus contains a more detailed description of the limited relationship MSCI has with HSBC ETFs plc and any related funds.
Standard & Poor’s and S&P are registered trademarks of Standard & Poor’s Financial Services LLC (“S&P”) and Dow Jones is a registered trademark of Dow Jones Trademark Holdings LLC (“Dow Jones”) and have been licensed for use by S&P Dow Jones Indices LLC and sublicensed for certain purposes by HSBC Global Asset Management (UK) Limited. The S&P 500 and the S&P BRIC 40 are products of S&P Dow Jones Indices LLC, and have been licensed for use by HSBC Global Asset Management (UK) Limited. HSBC Global Asset Management (UK) Limited‘s HSBC S&P 500 UCITS ETF and HSBC S&P BRIC 40 UCITS ETF are not sponsored, endorsed, sold or promoted by S&P Dow Jones Indices LLC, Dow Jones, S&P, their respective affiliates, and neither S&P Dow Jones Indices LLC, Dow Jones, S&P, their respective affiliates make any representation regarding the advisability of investing in such product(s).
HSBC Global Asset Management (UK) Limited provides information to Institutions, Professional Advisers and their clients on the investment products and services of the HSBC Group.
This document is approved for issue in the UK by HSBC Global Asset Management (UK) Limited, who are authorised and regulated by the Financial Conduct Authority.
Copyright © HSBC Global Asset Management (UK) Limited 2014.All rights reserved. www.assetmanagement.hsbc.com/uk
To help improve our service and in the interests of security we may record and/or monitor your communication with us.
Important Information


Designed and produced by HSBC Global Publishing Services 140626_50623 FP13-0926
Further information on HSBC ETFsTel: +44 (0) 20 7024 [email protected]: MSG ETF HSBC <GO>
Recommended