To be published in
“International Journal for Global Energy Issues”
How much can nuclear energy do about global warming?
Authors
André Berger1, Tom Blees
2, Francois-Marie Breon
3, Barry W. Brook
4, Philippe Hansen
5, Ravi.B.Grover
6,
Claude Guet7, Weiping Liu
8, Frederic Livet
9 , Herve Nifenecker
10, Michel Petit
11, Gérard Pierre
12, Henri
Prévot13
, Sébastien Richet14
,Henri Safa15
, Massimo Salvatores16
,Michael Schneeberger17
, Suyan Zhou18
Save the Climate (Sauvons Le Climat)
1André Berger, Professor Université catholique de Louvain
Earth and Life Institute Georges Lemaître, Center for Earth and Climate Research
[email protected] 2Tom Blees President of The Science Council for Global Initiatives. Author and energy consultant
[email protected] 3 François-Marie Breon, Save The Climate (Sauvons Le Climat), "Lead author of IPCC-2013"
[email protected] 4 Barry W. Brook, Private Bag 55, School of Biological Sciences, University of Tasmania, 7001, Australia [email protected] 5
Philippe Hansen, dipl. Ecole Normale Supérieure de Lyon, editor of www.energie-crise.fr,
Save The Climate (Sauvons Le Climat) [email protected]
6 Ravi Grover, Homi Bhabha Chair, Homi Bhabha National Institute
7
Claude Guet; Visiting Professor, Programme Director, Students/Research,
Energy Research Institute Nanyang Technological University, Singapore
Weiping Liu, Head of CARIF project at CIAE
Frederic Livet, Research Director at Univ. Grenoble-Alpes, SIMAP, Grenoble, France
et: CNRS, SIMAP, F-3800 Grenoble, France CNRS, Save The Climate
(Sauvons Le Climat)
10 Herve Nifenecker, Professor UIAD (Universite Interage du Dauphine),
Founder chairman of Save The Climate (Sauvons Le Climat)
[email protected] 11 Michel Petit, Chairman of the Scientific Council of “Save the Climate”,
former member of the IPCC governing body, former chairman of the French Meteorological Society.
12 Gérard Pierre, Honorary Physics Professor at Bourgogne University, Dijon
France, Save The Climate (Sauvons Le Climat)
Henri Prévot, Save The Climate (Sauvons Le Climat) [email protected] 14
Sebastien Richet Save The Climate (Sauvons Le Climat) [email protected] 15 Henri Safa, Deputy Director of the International Institute of Nuclear Energy, Scientific Direction of the
Nuclear Energy Division at CEA, member of ANCRE, France.
Massimo Salvatores, Consultant in Reactor and Fuel Cycle Physics and Senior Scientific Advisor at
the Idaho National Laboratory.
Former Head of the Reactor and Fuel Cycle Physics Division at CEA-Cadarache (France) 17
Michael Schneeberger, Dipl.Ing. Dr.Tech., Austrian Nuclear Society Honorary Member, Save The
Climate (Sauvons Le Climat)
[email protected] 18 Mrs.Suyan Zhou, Director of Institutional Delegation of EDF to Chine; [email protected]
Abstract
The reference framework MESSAGE devised by the « International Institute for Applied
Systems Analysis (IIASA), Austria » is one of the two frameworks reported by the
Intergovernmental Panel on Climate Change (IPCC) as potentially able to limit the global
surface temperature increase to 2 degrees Celsius (RCPi 2.6). To achieve this, it proposes the
use of massive deployment of carbon dioxide capture and storage (CCS), dealing with tens of
billion tons of CO2. However, present knowledge of this process rests on a few experiments at
the annual million tons level, with global storage capacity not yet established as being
adequate.
The use of CCS is limited to 24 billion tons/y, based on the assumption of either a large-scale
development of nuclear energy between 2060 and 2100 or else a severe contraction of energy
supply. It includes three potential scenarios: « Supply » with a high energy consumption,
« Efficiency » which implies the end of nuclear energy, paid for by a decrease in energy
consumption of 45% with respect to the “Supply scenario”, and the intermediary « MIX »
scenario. All three scenarios propose a high contribution of solar energy and biomass. In the
“Supply” scenario 7000 GWeii nuclear power start operation between 2060 and 2100.
i Representative Concentration Pathways
ii GWe : Giga Watt electric
Since technical requisites for nuclear energy exist today (which is the case neither for massive
CCS nor for extensive use of intermittent renewable electricity production), here we propose,
as a variant of the MESSAGE framework, to initiate a sustained deployment of nuclear
production in 2020, rather than 2060, reaching a total nuclear power around 20,000 GWe by
the year 2100. We study in detail how such a deployment is physically possible with the
generalization of breeder reactors. It appears that such a large-scale deployment needs
significant improvement in the throughput of reprocessing or a switch from a PWRi
dominated nuclear fleet to a fleet equilibrated between PWR and PHWRii reactors.
Our « nuclearized » « Supply » and « MIX » scenarios reduce considerably the interest in or
necessity for CCS, making it even possible to achieve stabilization of atmospheric CO2
concentration before 2100 without using this technology. It is also possible to limit the
contribution of intermittent renewable electricity production to a more feasible level.
It is to be stressed that renouncing nuclear power (« Efficiency» scenarios) requires an energy
consumption reduction of more than 40% compared to the “Supply” scenario, without
escaping the need to store more than 15 billion tons of CO2, and without stabilization of its
atmospheric concentration before 2100.
A strong nuclear development, by comparison, allows for a reasonable level of energy
consumption, as well as a stabilization of atmospheric CO2 concentration as soon as 2060,
reducing considerably the needs of CO2 storage, and permitting total suppression of fossil
fuels several decades before the end of the century.
i PWR : Pressurized Water Reactor
ii PHWR: Pressurized Heavy Water also called CANDU (Canadian Deuterium Uranium)
Corpus
1. Introduction ..................................................................................................................................... 5
1.1 The Carbon Capture and Storage (CCS) bet .................................................................................. 6
1.2 CCS in China ............................................................................................................................. 6
1.3 Main features of MESSAGE framework ......................................................................................... 7
2. The MESSAGE scenarios .................................................................................................................. 8
2.1 The Message “Supply” scenario .............................................................................................. 8
2.2 The Supply-N scenario ........................................................................................................... 10
2.2.1 Uranium reserves and breeding ...................................................................................... 10
2.2.2 Available technologies ...................................................................................................... 11
2.2.3 Implementation of nuclear development ....................................................................... 12
2.2.4 Fossil evolution in Supply and Supply-N ........................................................................... 14
2.2.5 CO2 emissions in Supply and Supply-N ............................................................................ 15
2.3 The “Mix-N” scenario ............................................................................................................ 17
2.4 The Efficiency scenario .......................................................................................................... 18
3. CO2 emissions. ............................................................................................................................... 19
4. Comparison between scenarios with and without nuclear. ......................................................... 20
4.1 Climatic ranking of the scenarios .......................................................................................... 22
5. Costs. ............................................................................................................................................. 22
6. Workforce and industrial resources .............................................................................................. 23
7. Environmental burden................................................................................................................... 24
7.1 Mining .................................................................................................................................... 24
7.2 Surface footprint and biodiversity......................................................................................... 24
7.3 Raw material needs ............................................................................................................... 24
8. Incentive ........................................................................................................................................ 25
9. Safety issues .................................................................................................................................. 25
9.1 Reactor accidents .................................................................................................................. 25
9.2 Nuclear fear ........................................................................................................................... 26
9.3 Nuclear wastes ...................................................................................................................... 26
9.4 Proliferation issues ................................................................................................................ 27
9.5 Terrorist attacks .................................................................................................................... 27
10. Conclusion ................................................................................................................................. 28
Appendix 1 ............................................................................................................................................. 29
Appendix 2 ............................................................................................................................................. 30
A.2.1 Definition of the 11 regions used by IIASA ......................................................................... 30
A.2.2 Regional development of nuclear energy following the MESSAGE Supply scenario. .......... 31
A.2.3 Regional evolution of the final energies per million capita in the Supply scenario ............. 32
A.2.4 Regional evolution of the final energies per million capita in the Efficiency scenario ........ 33
Appendix 3 ............................................................................................................................................. 33
A.3.1 Annual energy production per GWe nuclear power ............................................................ 33
A.3.2 Annual Uranium needs ........................................................................................................ 34
A.3.3 PHWR reactors ..................................................................................................................... 34
A.3.4 Plutonium inventory of Fast Breeder Reactors .................................................................... 34
A.3.5 Details of the calculation of Figure 3 ................................................................................... 36
1. Introduction The recent IPCC (AR5)1 report stresses, once more, the seriousness of global warming. In order to
make the climate models’ results comparable and to give the same objectives to the various
emissions scenarios, IPCC has selected 4 RCPs “Representative Concentration Pathways”,
encapsulating the full range of likely greenhouse gases (GHG) concentrations evolution. Each of the 4
RCPs is labeled according to the value of radiative forcing obtained in 2100 by the specific integrated
modeli emissions profile. RCP 2.6 (W/m2 radiative forcing) scenarios are the only ones which could
limit the increase of global temperature to less than 2 °C. The IAMC (Integrated Assessment Modeling
iModels selected by the IPCC originate from the work of the groups IMAGE led by the « Netherlands
Environmental Assessment Agency », MiniCAM led by the « Pacific Northwest National Laboratory's
Joint Global Change Research Institute (JGCRI) », AIM led by the « National Institute for
Environmental Studies (NIES), Japan », and MESSAGE led by the « International Institute for Applied
Systems Analysis (IIASA), Austria ».
Consortium) has stressed two scenario frameworks, IMAGE and MESSAGE. Both are described in
detail on the IIASA WEB site (IIASA WEB site)2. These frameworks are subdivided into three scenarios
« Supply », « Mix » and « Efficiency » which refer to decreasing energy consumption levels.
1.1 The Carbon Capture and Storage (CCS) bet
All of these scenarios rely upon capture and storage of large quantities of CO2, as can be seen in
Table 1i. Rates of CCS reach yearly values of as much as 50 Gt/yr in 2100. By comparison, present
experience with this technique are of order of a few million tons.
Table 1 compares the CO2 masses yearly stored, in 2100, for the MESSAGE and IMAGE scenarios.
SUPPLY MIX EFFICIENCY MESSAGE 23900 15200 15200 IMAGE 50000 43200 26500
Table 1
CO2 mass yearly stored in 2100 (million tons) for the scenarios of IMAGE and MESSAGE frameworks (IIASA WEB site). In 2010, annual CO2 world emissions value was 31 billion tons (14 related to coal, 11 to oil and 6 to gas). Present CCS
experiments deal with only a few million tons.
Storage needs of the IMAGE framework are much larger than those of the MESSAGE ones. Indeed,
the IMAGE framework relies much more on a persistent use of fossil fuels. Since our primary goal is
to decrease the need of yet unproved CCS, we focus on the MESSAGE framework and its three
scenarios.
1.2 CCS in China Since China is, by far, the world’s largest user of coal, the prospects of CCS in China are of utmost
importance. In China, coal consumption is proportionally high, representing 66% of the primary
energy supply. The level of coal use severely impacts China's greenhouse gas emissions and air
pollution, in particular smog.
CCS has been considered by many research institutions as the only possible and available solution for
mitigating carbon emissions from coal-fired power production. However, over many years there has
been very little investment in CCS worldwide. For emerging economies, the high costs of CCS R&D
have been a barrier for achieving significant progress. China has been involved in a couple of small
CCU (Carbon Capture Utilization) experimental projects, but no project has been extended to
storage. Several factors will likely limit China’s further efforts in coming years:
Heavy investment costs for individual plant investors R&D
Concerns related to unreliable safety measures for storage; plants are too close to the power
load center
China has not mastered IGCC (integrated gasification combined cycle) technology
i Here we simply report the results from the Excel tables available on the IIASA site:
http://www.iiasa.ac.at/web-apps/ene/geadb/dsd?Action=htmlpage&page=regions
CCS application will reduce power plant efficiency and add to production costs
In addition, it is difficult to foresee any further CCS technological breakthroughs that would realistically lead to commercialization, at least in the absence of a very strong and sustained carbon price. Therefore, for China, nuclear power is the only reliable, practical, and mature energy source which could reduce China's massive coal-fired reliance while maintaining grid stability.
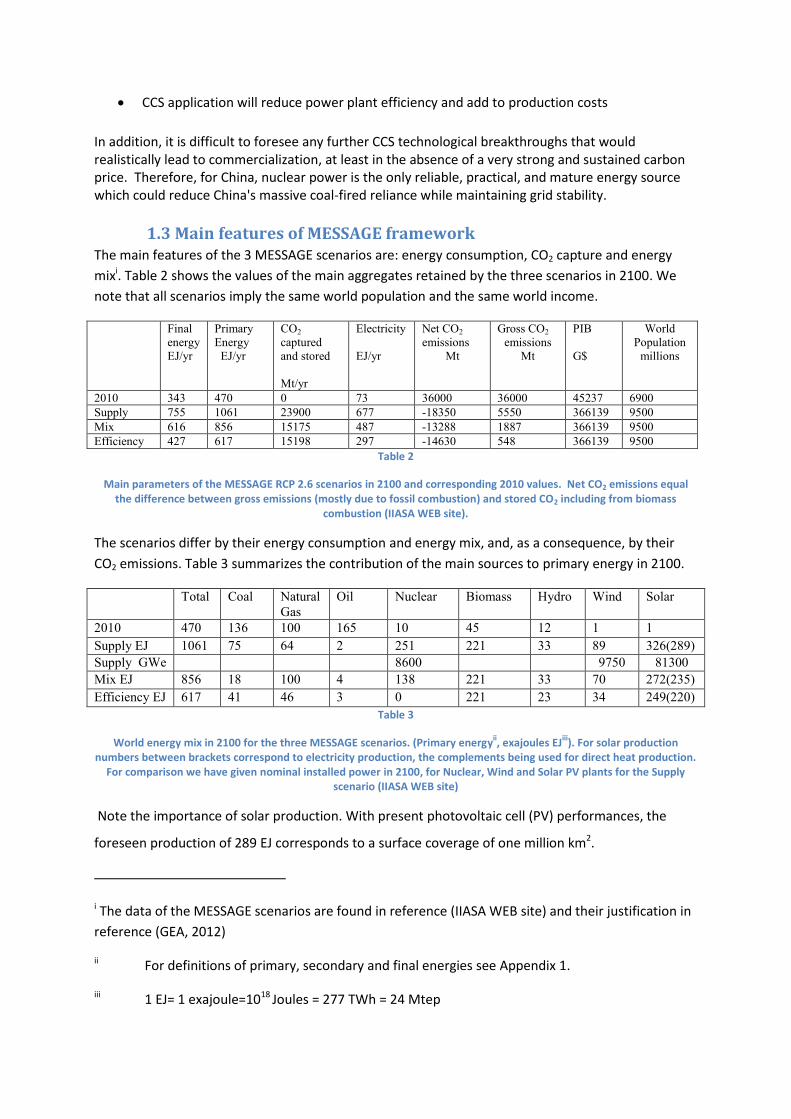
1.3 Main features of MESSAGE framework The main features of the 3 MESSAGE scenarios are: energy consumption, CO2 capture and energy
mixi. Table 2 shows the values of the main aggregates retained by the three scenarios in 2100. We
note that all scenarios imply the same world population and the same world income.
Final
energy
EJ/yr
Primary Energy EJ/yr
CO2
captured
and stored
Mt/yr
Electricity
EJ/yr
Net CO2 emissions
Mt
Gross CO2 emissions
Mt
PIB
G$
World
Population millions
2010 343 470 0 73 36000 36000 45237 6900 Supply 755 1061 23900 677 -18350 5550 366139 9500 Mix 616 856 15175 487 -13288 1887 366139 9500 Efficiency 427 617 15198 297 -14630 548 366139 9500
Table 2
Main parameters of the MESSAGE RCP 2.6 scenarios in 2100 and corresponding 2010 values. Net CO2 emissions equal the difference between gross emissions (mostly due to fossil combustion) and stored CO2 including from biomass
combustion (IIASA WEB site).
The scenarios differ by their energy consumption and energy mix, and, as a consequence, by their
CO2 emissions. Table 3 summarizes the contribution of the main sources to primary energy in 2100.
Total Coal Natural
Gas
Oil Nuclear Biomass Hydro Wind Solar
2010 470 136 100 165 10 45 12 1 1
Supply EJ 1061 75 64 2 251 221 33 89 326(289)
Supply GWe 8600 9750 81300
Mix EJ 856 18 100 4 138 221 33 70 272(235)
Efficiency EJ 617 41 46 3 0 221 23 34 249(220)
Table 3
World energy mix in 2100 for the three MESSAGE scenarios. (Primary energyii, exajoules EJ
iii). For solar production
numbers between brackets correspond to electricity production, the complements being used for direct heat production. For comparison we have given nominal installed power in 2100, for Nuclear, Wind and Solar PV plants for the Supply
scenario (IIASA WEB site)
Note the importance of solar production. With present photovoltaic cell (PV) performances, the
foreseen production of 289 EJ corresponds to a surface coverage of one million km2.
i The data of the MESSAGE scenarios are found in reference (IIASA WEB site) and their justification in
reference (GEA, 2012)
ii For definitions of primary, secondary and final energies see Appendix 1.
iii 1 EJ= 1 exajoule=1018 Joules = 277 TWh = 24 Mtep
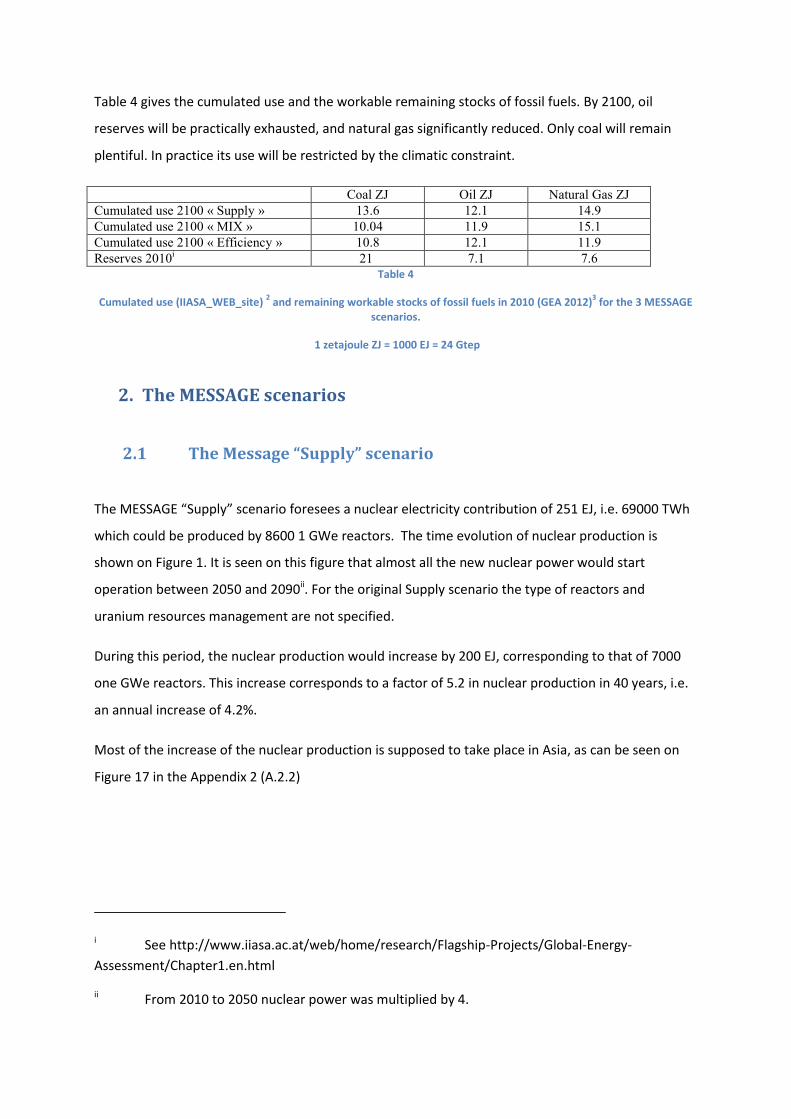
Table 4 gives the cumulated use and the workable remaining stocks of fossil fuels. By 2100, oil
reserves will be practically exhausted, and natural gas significantly reduced. Only coal will remain
plentiful. In practice its use will be restricted by the climatic constraint.
Coal ZJ Oil ZJ Natural Gas ZJ Cumulated use 2100 « Supply » 13.6 12.1 14.9 Cumulated use 2100 « MIX » 10.04 11.9 15.1 Cumulated use 2100 « Efficiency » 10.8 12.1 11.9 Reserves 2010
i 21 7.1 7.6 Table 4
Cumulated use (IIASA_WEB_site) 2 and remaining workable stocks of fossil fuels in 2010 (GEA 2012)
3 for the 3 MESSAGE
scenarios.
1 zetajoule ZJ = 1000 EJ = 24 Gtep
2. The MESSAGE scenarios
2.1 The Message “Supply” scenario
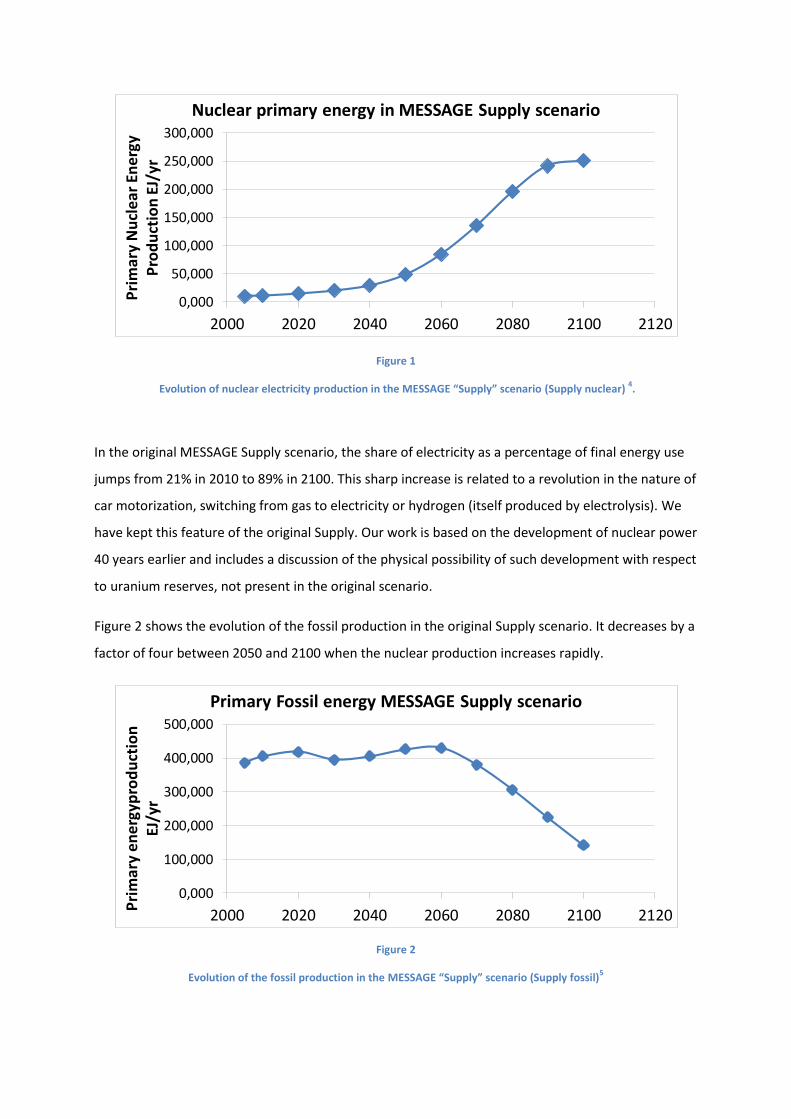
The MESSAGE “Supply” scenario foresees a nuclear electricity contribution of 251 EJ, i.e. 69000 TWh
which could be produced by 8600 1 GWe reactors. The time evolution of nuclear production is
shown on Figure 1. It is seen on this figure that almost all the new nuclear power would start
operation between 2050 and 2090ii. For the original Supply scenario the type of reactors and
uranium resources management are not specified.
During this period, the nuclear production would increase by 200 EJ, corresponding to that of 7000
one GWe reactors. This increase corresponds to a factor of 5.2 in nuclear production in 40 years, i.e.
an annual increase of 4.2%.
Most of the increase of the nuclear production is supposed to take place in Asia, as can be seen on
Figure 17 in the Appendix 2 (A.2.2)
i See http://www.iiasa.ac.at/web/home/research/Flagship-Projects/Global-Energy-
Assessment/Chapter1.en.html
ii From 2010 to 2050 nuclear power was multiplied by 4.
0,000
50,000
100,000
150,000
200,000
250,000
300,000
2000 2020 2040 2060 2080 2100 2120
Pri
mar
y N
ucl
ear
En
erg
y P
rod
uct
ion
EJ/
yr
Nuclear primary energy in MESSAGE Supply scenario
Figure 1
Evolution of nuclear electricity production in the MESSAGE “Supply” scenario (Supply nuclear) 4.
In the original MESSAGE Supply scenario, the share of electricity as a percentage of final energy use
jumps from 21% in 2010 to 89% in 2100. This sharp increase is related to a revolution in the nature of
car motorization, switching from gas to electricity or hydrogen (itself produced by electrolysis). We
have kept this feature of the original Supply. Our work is based on the development of nuclear power
40 years earlier and includes a discussion of the physical possibility of such development with respect
to uranium reserves, not present in the original scenario.
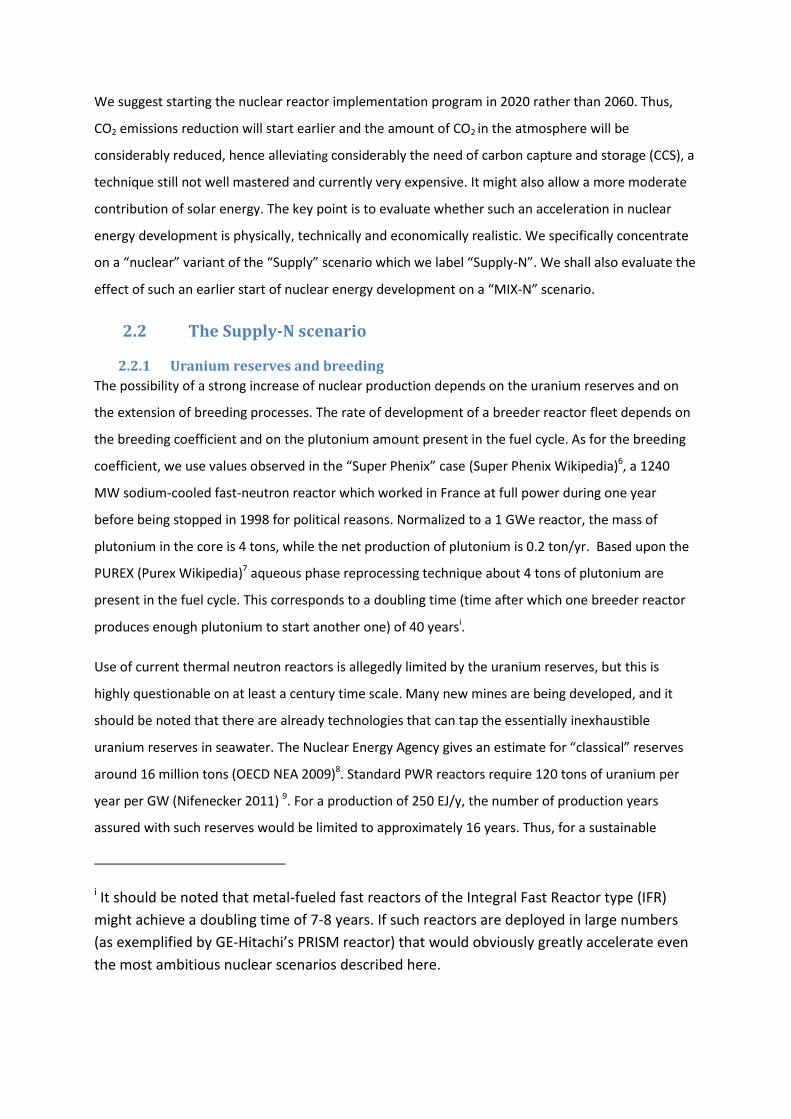
Figure 2 shows the evolution of the fossil production in the original Supply scenario. It decreases by a
factor of four between 2050 and 2100 when the nuclear production increases rapidly.
0,000
100,000
200,000
300,000
400,000
500,000
2000 2020 2040 2060 2080 2100 2120
Pri
mar
y e
ne
rgyp
rod
uct
ion
EJ
/yr
Primary Fossil energy MESSAGE Supply scenario
Figure 2
Evolution of the fossil production in the MESSAGE “Supply” scenario (Supply fossil)5
We suggest starting the nuclear reactor implementation program in 2020 rather than 2060. Thus,
CO2 emissions reduction will start earlier and the amount of CO2 in the atmosphere will be
considerably reduced, hence alleviating considerably the need of carbon capture and storage (CCS), a
technique still not well mastered and currently very expensive. It might also allow a more moderate
contribution of solar energy. The key point is to evaluate whether such an acceleration in nuclear
energy development is physically, technically and economically realistic. We specifically concentrate
on a “nuclear” variant of the “Supply” scenario which we label “Supply-N”. We shall also evaluate the
effect of such an earlier start of nuclear energy development on a “MIX-N” scenario.
2.2 The Supply-N scenario
2.2.1 Uranium reserves and breeding
The possibility of a strong increase of nuclear production depends on the uranium reserves and on
the extension of breeding processes. The rate of development of a breeder reactor fleet depends on
the breeding coefficient and on the plutonium amount present in the fuel cycle. As for the breeding
coefficient, we use values observed in the “Super Phenix” case (Super Phenix Wikipedia)6, a 1240
MW sodium-cooled fast-neutron reactor which worked in France at full power during one year
before being stopped in 1998 for political reasons. Normalized to a 1 GWe reactor, the mass of
plutonium in the core is 4 tons, while the net production of plutonium is 0.2 ton/yr. Based upon the
PUREX (Purex Wikipedia)7 aqueous phase reprocessing technique about 4 tons of plutonium are
present in the fuel cycle. This corresponds to a doubling time (time after which one breeder reactor
produces enough plutonium to start another one) of 40 yearsi.
Use of current thermal neutron reactors is allegedly limited by the uranium reserves, but this is
highly questionable on at least a century time scale. Many new mines are being developed, and it
should be noted that there are already technologies that can tap the essentially inexhaustible
uranium reserves in seawater. The Nuclear Energy Agency gives an estimate for “classical” reserves
around 16 million tons (OECD NEA 2009)8. Standard PWR reactors require 120 tons of uranium per
year per GW (Nifenecker 2011) 9. For a production of 250 EJ/y, the number of production years
assured with such reserves would be limited to approximately 16 years. Thus, for a sustainable
i It should be noted that metal-fueled fast reactors of the Integral Fast Reactor type (IFR)
might achieve a doubling time of 7-8 years. If such reactors are deployed in large numbers
(as exemplified by GE-Hitachi’s PRISM reactor) that would obviously greatly accelerate even
the most ambitious nuclear scenarios described here.
development of nuclear energy, the standard reactors should, essentially, build the plutonium stock
necessary for developing the breeder fleet. Full fuel recycling using fast neutron reactors can
increase energy utilization from uranium by more than a factor of 100, providing many millennia of
potential electricity production.
2.2.2 Available technologies
Reactors supposed to be used in our proposal are PWR, PHWR and Liquid Sodium Fast Breeder
Reactors (FBR or SFR). Experience is quite large with PWRs and PHWRs with 278 PWRs and 42 PHWRs
active in the world.
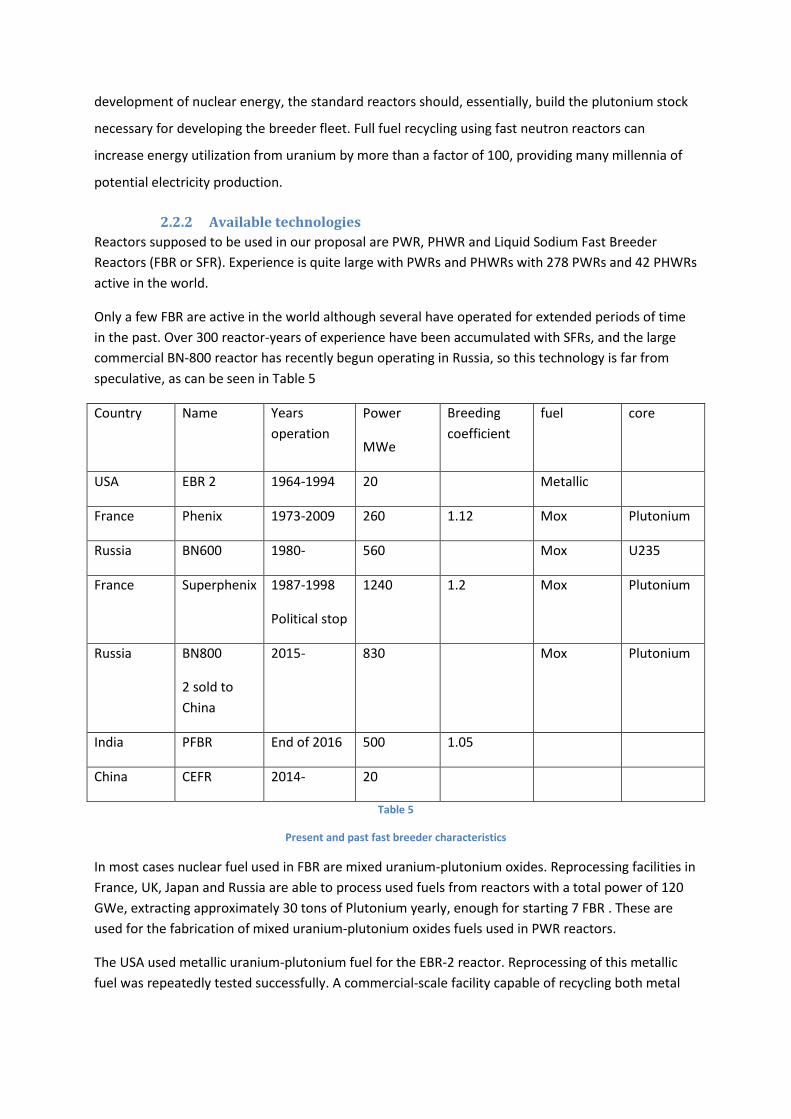
Only a few FBR are active in the world although several have operated for extended periods of time
in the past. Over 300 reactor-years of experience have been accumulated with SFRs, and the large
commercial BN-800 reactor has recently begun operating in Russia, so this technology is far from
speculative, as can be seen in Table 5
Country Name Years
operation
Power
MWe
Breeding
coefficient
fuel core
USA EBR 2 1964-1994 20 Metallic
France Phenix 1973-2009 260 1.12 Mox Plutonium
Russia BN600 1980- 560 Mox U235
France Superphenix 1987-1998
Political stop
1240 1.2 Mox Plutonium
Russia BN800
2 sold to
China
2015- 830 Mox Plutonium
India PFBR End of 2016 500 1.05
China CEFR 2014- 20
Table 5
Present and past fast breeder characteristics
In most cases nuclear fuel used in FBR are mixed uranium-plutonium oxides. Reprocessing facilities in
France, UK, Japan and Russia are able to process used fuels from reactors with a total power of 120
GWe, extracting approximately 30 tons of Plutonium yearly, enough for starting 7 FBR . These are
used for the fabrication of mixed uranium-plutonium oxides fuels used in PWR reactors.
The USA used metallic uranium-plutonium fuel for the EBR-2 reactor. Reprocessing of this metallic
fuel was repeatedly tested successfully. A commercial-scale facility capable of recycling both metal
and oxide spent fuel, based on the pyroprocessing technology demonstrated at the EBR-2, is
currently being designed at Argonne National Laboratory in the USA.
2.2.3 Implementation of nuclear development
Our proposal, which shifts forward in time the accelerated development of nuclear production by
approximately 40 years, foresees nuclear production of around 500 EJ/y in 2100, allowing a complete
renouncement of fossil energies. Thus, in 2100, the totality of energy needs will be provided by
renewable and nuclear sources. An energy production of 500 EJ, corresponding to 140000 TWh
would require 17000 1 GWe reactors. If these reactors were PWR Uranium reserves would be
exhausted after 8 yearsi! Therefore, before 2100 all nuclear reactors should be breeders. A similar
approach was previously followed by H.Nifenecker et al. (Nifenecker 2003)10 (Nifenecker 2011)11 and
by a Karlsruhe Institute of Technology (KIT) researchers group (as documented in “Sustainable
Nuclear Fuel Cycles and World Regional Issues” Sustainability 2012, 4(6), 1214-1238, and in the
Nuclear Energy Agency Report “TRANSITION TOWARDS A SUSTAINABLE NUCLEAR FUEL CYCLE”, NEA
No. 7133, © OECD 2013). In Appendix 3 (A.3.4), it is shown that the required number of FBR could be
obtained by varying two parameters, the plutonium inventory and doubling time of the FBR and the
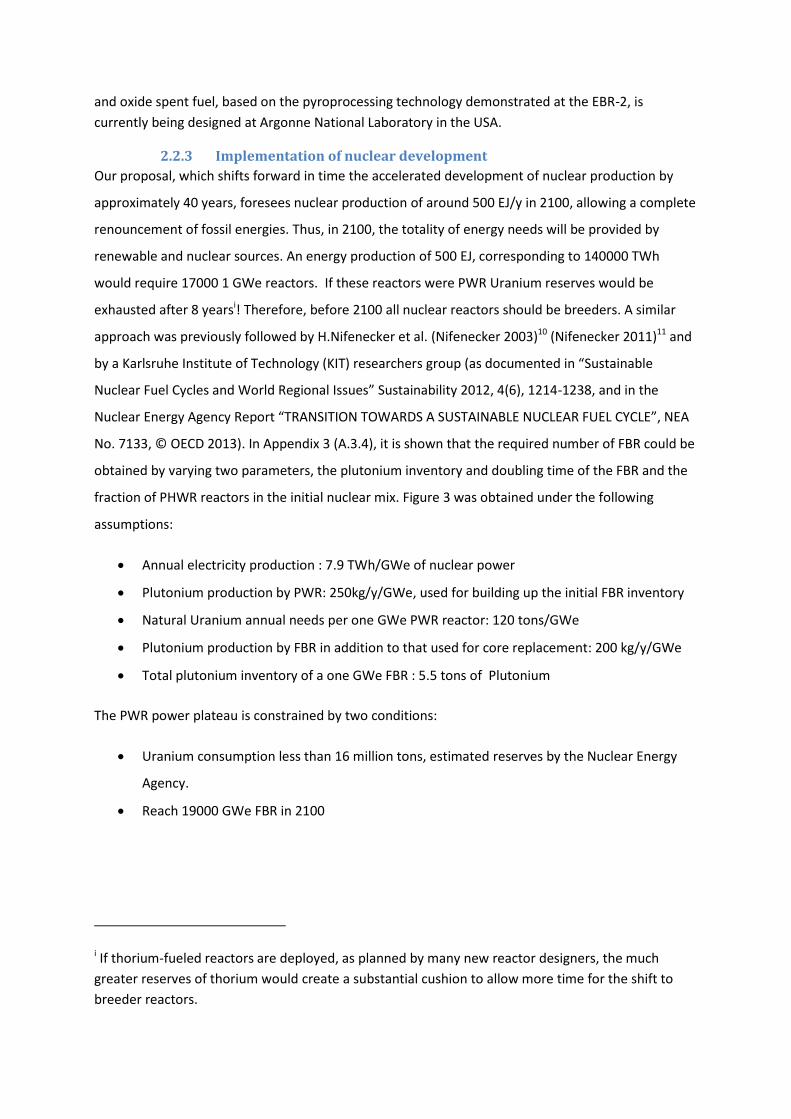
fraction of PHWR reactors in the initial nuclear mix. Figure 3 was obtained under the following
assumptions:
Annual electricity production : 7.9 TWh/GWe of nuclear power
Plutonium production by PWR: 250kg/y/GWe, used for building up the initial FBR inventory
Natural Uranium annual needs per one GWe PWR reactor: 120 tons/GWe
Plutonium production by FBR in addition to that used for core replacement: 200 kg/y/GWe
Total plutonium inventory of a one GWe FBR : 5.5 tons of Plutonium
The PWR power plateau is constrained by two conditions:
Uranium consumption less than 16 million tons, estimated reserves by the Nuclear Energy
Agency.
Reach 19000 GWe FBR in 2100
i If thorium-fueled reactors are deployed, as planned by many new reactor designers, the much
greater reserves of thorium would create a substantial cushion to allow more time for the shift to
breeder reactors.
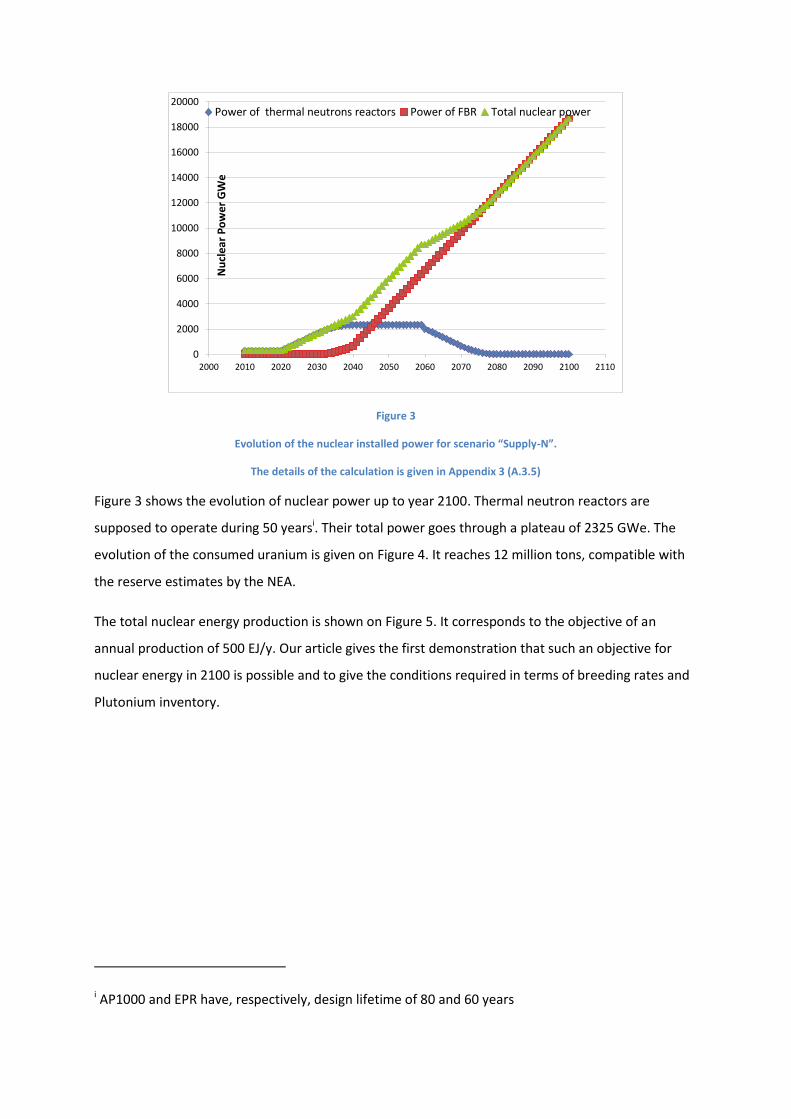
Figure 3
Evolution of the nuclear installed power for scenario “Supply-N”.
The details of the calculation is given in Appendix 3 (A.3.5)
Figure 3 shows the evolution of nuclear power up to year 2100. Thermal neutron reactors are
supposed to operate during 50 yearsi. Their total power goes through a plateau of 2325 GWe. The
evolution of the consumed uranium is given on Figure 4. It reaches 12 million tons, compatible with
the reserve estimates by the NEA.
The total nuclear energy production is shown on Figure 5. It corresponds to the objective of an
annual production of 500 EJ/y. Our article gives the first demonstration that such an objective for
nuclear energy in 2100 is possible and to give the conditions required in terms of breeding rates and
Plutonium inventory.
i AP1000 and EPR have, respectively, design lifetime of 80 and 60 years
0
2000
4000
6000
8000
10000
12000
14000
16000
18000
20000
2000 2010 2020 2030 2040 2050 2060 2070 2080 2090 2100 2110
Nu
clea
r P
ow
er G
We
Power of thermal neutrons reactors Power of FBR Total nuclear power
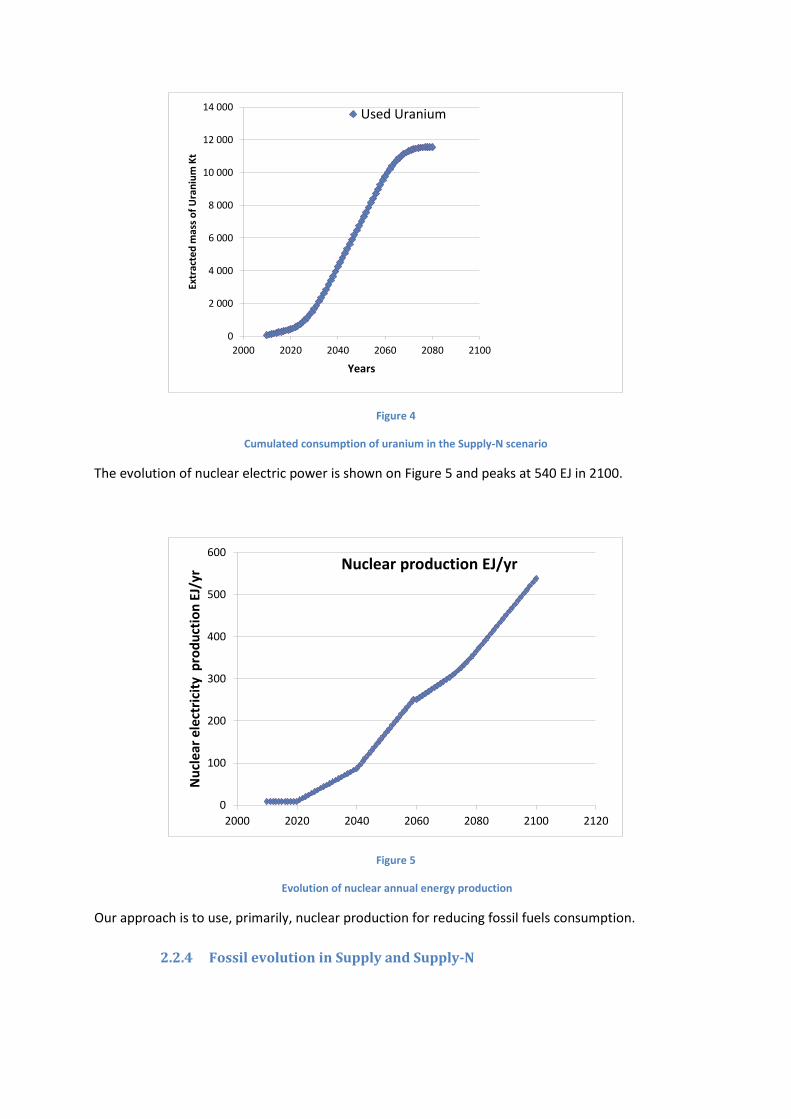
Figure 4
Cumulated consumption of uranium in the Supply-N scenario
The evolution of nuclear electric power is shown on Figure 5 and peaks at 540 EJ in 2100.
Figure 5
Evolution of nuclear annual energy production
Our approach is to use, primarily, nuclear production for reducing fossil fuels consumption.
2.2.4 Fossil evolution in Supply and Supply-N
0
2 000
4 000
6 000
8 000
10 000
12 000
14 000
2000 2020 2040 2060 2080 2100
Extr
acte
d m
ass
of
Ura
niu
m K
t
Years
Used Uranium
0
100
200
300
400
500
600
2000 2020 2040 2060 2080 2100 2120
Nu
clea
r el
ectr
icit
y p
rod
uct
ion
EJ/
yr Nuclear production EJ/yr
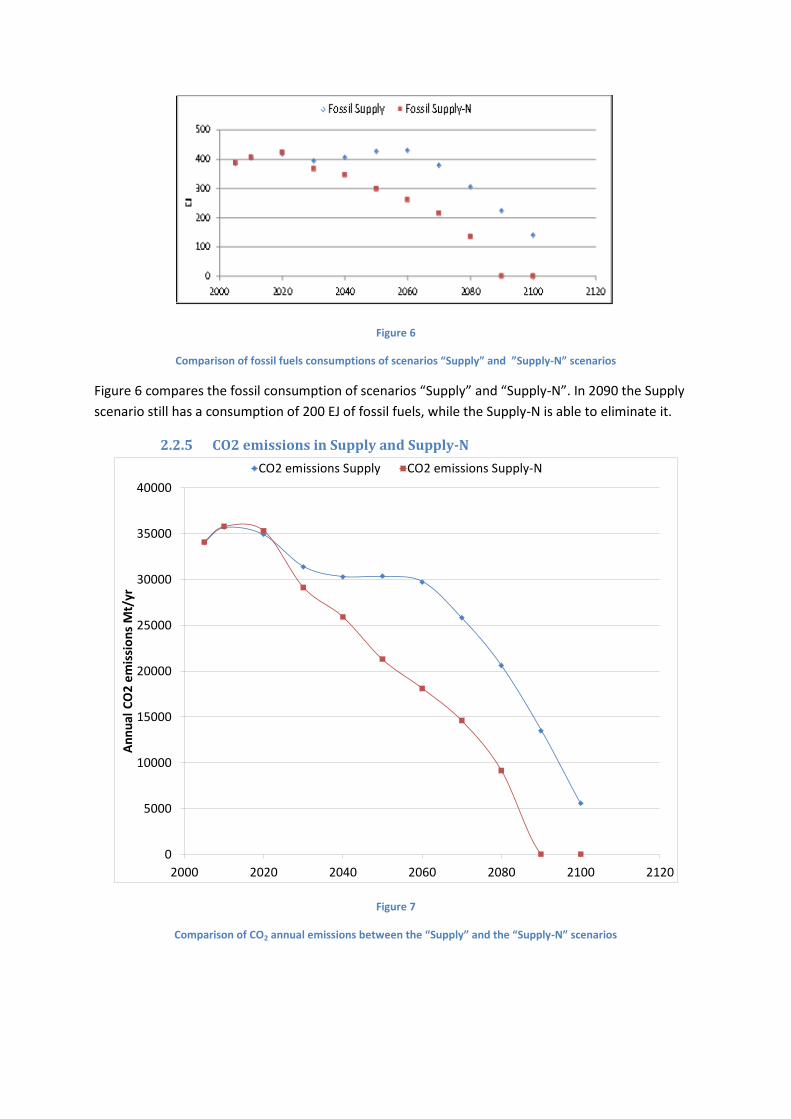
Figure 6
Comparison of fossil fuels consumptions of scenarios “Supply” and ”Supply-N” scenarios
Figure 6 compares the fossil consumption of scenarios “Supply” and “Supply-N”. In 2090 the Supply
scenario still has a consumption of 200 EJ of fossil fuels, while the Supply-N is able to eliminate it.
2.2.5 CO2 emissions in Supply and Supply-N
0
5000
10000
15000
20000
25000
30000
35000
40000
2000 2020 2040 2060 2080 2100 2120
An
nu
al C
O2
em
issi
on
s M
t/yr
CO2 emissions Supply CO2 emissions Supply-N
Figure 7
Comparison of CO2 annual emissions between the “Supply” and the “Supply-N” scenarios
As a consequence of the reduced fossil consumption of the “Supply-N” scenario, this scenario has
lower annual CO2 emissions, as can be seen on Figure 7, to the point that they vanish in 2090. The
integrated emissions are clearly much smaller in the Supply-N scenario.
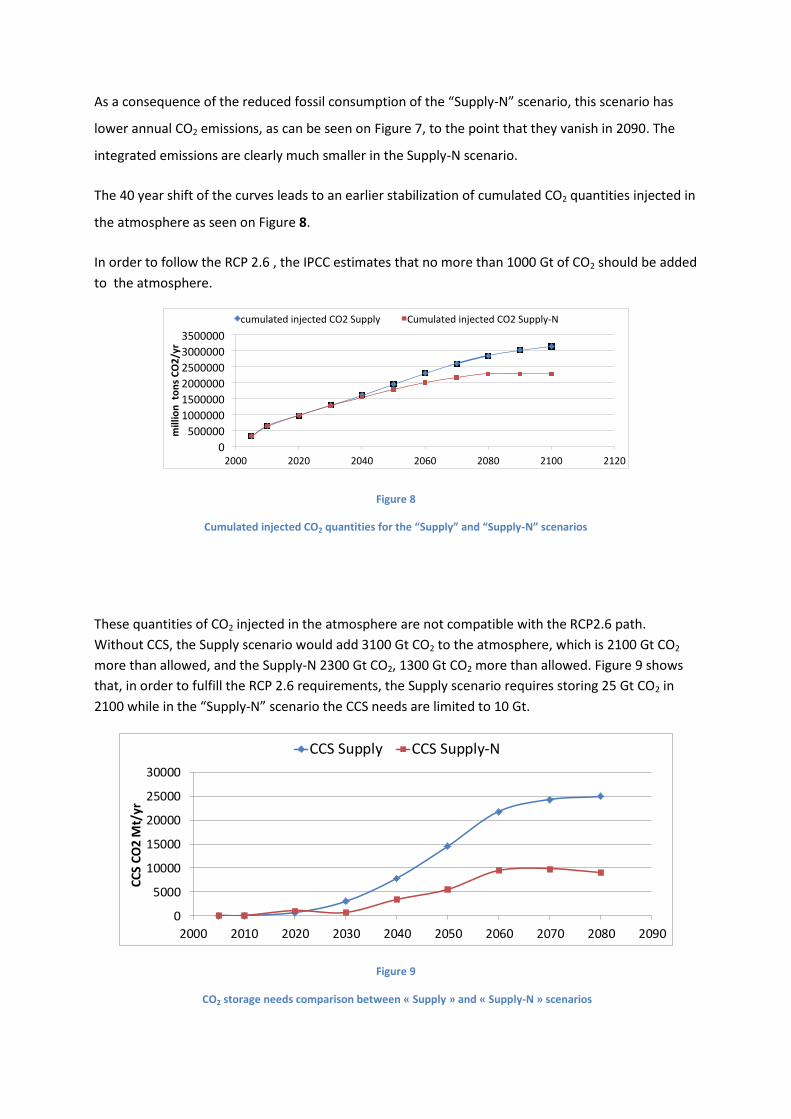
The 40 year shift of the curves leads to an earlier stabilization of cumulated CO2 quantities injected in
the atmosphere as seen on Figure 8.
In order to follow the RCP 2.6 , the IPCC estimates that no more than 1000 Gt of CO2 should be added
to the atmosphere.
0
500000
1000000
1500000
2000000
2500000
3000000
3500000
2000 2020 2040 2060 2080 2100 2120
milliontonsCO2/yr
cumulatedinjectedCO2Supply CumulatedinjectedCO2Supply-N
Figure 8
Cumulated injected CO2 quantities for the “Supply” and “Supply-N” scenarios
These quantities of CO2 injected in the atmosphere are not compatible with the RCP2.6 path.
Without CCS, the Supply scenario would add 3100 Gt CO2 to the atmosphere, which is 2100 Gt CO2
more than allowed, and the Supply-N 2300 Gt CO2, 1300 Gt CO2 more than allowed. Figure 9 shows
that, in order to fulfill the RCP 2.6 requirements, the Supply scenario requires storing 25 Gt CO2 in
2100 while in the “Supply-N” scenario the CCS needs are limited to 10 Gt.
0
5000
10000
15000
20000
25000
30000
2000 2010 2020 2030 2040 2050 2060 2070 2080 2090
CC
S C
O2
Mt/
yr
CCS Supply CCS Supply-N
Figure 9
CO2 storage needs comparison between « Supply » and « Supply-N » scenarios
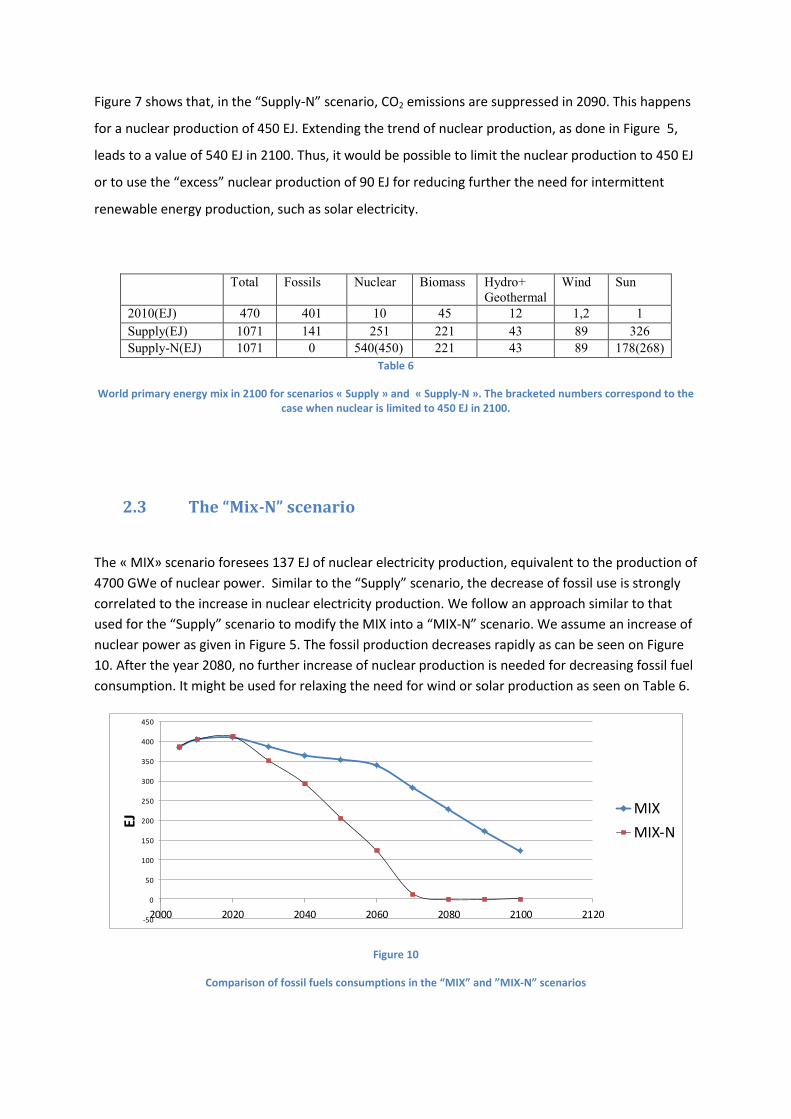
Figure 7 shows that, in the “Supply-N” scenario, CO2 emissions are suppressed in 2090. This happens
for a nuclear production of 450 EJ. Extending the trend of nuclear production, as done in Figure 5,
leads to a value of 540 EJ in 2100. Thus, it would be possible to limit the nuclear production to 450 EJ
or to use the “excess” nuclear production of 90 EJ for reducing further the need for intermittent
renewable energy production, such as solar electricity.
Total Fossils Nuclear Biomass Hydro+
Geothermal
Wind Sun
2010(EJ) 470 401 10 45 12 1,2 1
Supply(EJ) 1071 141 251 221 43 89 326
Supply-N(EJ) 1071 0 540(450) 221 43 89 178(268)
Table 6
World primary energy mix in 2100 for scenarios « Supply » and « Supply-N ». The bracketed numbers correspond to the case when nuclear is limited to 450 EJ in 2100.
2.3 The “Mix-N” scenario
The « MIX» scenario foresees 137 EJ of nuclear electricity production, equivalent to the production of
4700 GWe of nuclear power. Similar to the “Supply” scenario, the decrease of fossil use is strongly
correlated to the increase in nuclear electricity production. We follow an approach similar to that
used for the “Supply” scenario to modify the MIX into a “MIX-N” scenario. We assume an increase of
nuclear power as given in Figure 5. The fossil production decreases rapidly as can be seen on Figure
10. After the year 2080, no further increase of nuclear production is needed for decreasing fossil fuel
consumption. It might be used for relaxing the need for wind or solar production as seen on Table 6.
-50
0
50
100
150
200
250
300
350
400
450
2000 2020 2040 2060 2080 2100 2120
EJ
MIX
MIX-N
Figure 10
Comparison of fossil fuels consumptions in the “MIX” and ”MIX-N” scenarios
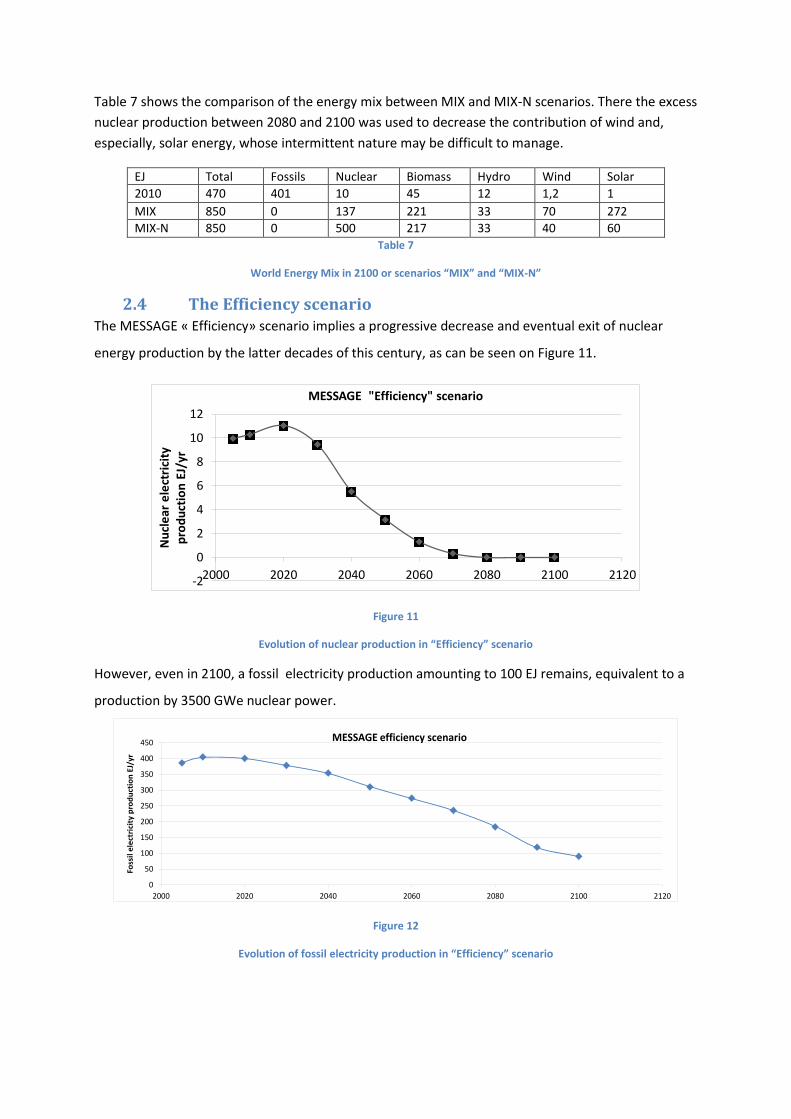
Table 7 shows the comparison of the energy mix between MIX and MIX-N scenarios. There the excess
nuclear production between 2080 and 2100 was used to decrease the contribution of wind and,
especially, solar energy, whose intermittent nature may be difficult to manage.
EJ Total Fossils Nuclear Biomass Hydro Wind Solar
2010 470 401 10 45 12 1,2 1
MIX 850 0 137 221 33 70 272
MIX-N 850 0 500 217 33 40 60
Table 7
World Energy Mix in 2100 or scenarios “MIX” and “MIX-N”
2.4 The Efficiency scenario The MESSAGE « Efficiency» scenario implies a progressive decrease and eventual exit of nuclear
energy production by the latter decades of this century, as can be seen on Figure 11.
-2
0
2
4
6
8
10
12
2000 2020 2040 2060 2080 2100 2120
Nu
cle
ar e
lect
rici
ty
pro
du
ctio
n E
J/yr
MESSAGE "Efficiency" scenario
Figure 11
Evolution of nuclear production in “Efficiency” scenario
However, even in 2100, a fossil electricity production amounting to 100 EJ remains, equivalent to a
production by 3500 GWe nuclear power.
0
50
100
150
200
250
300
350
400
450
2000 2020 2040 2060 2080 2100 2120
Foss
il e
lect
rici
ty p
rod
uct
ion
EJ/
yr
MESSAGE efficiency scenario
Figure 12
Evolution of fossil electricity production in “Efficiency” scenario
The simultaneous decrease of nuclear and fossil consumption is made possible by a serious cut back
in final energy consumption and a high proportion of renewable energies in the energy mix (86%).
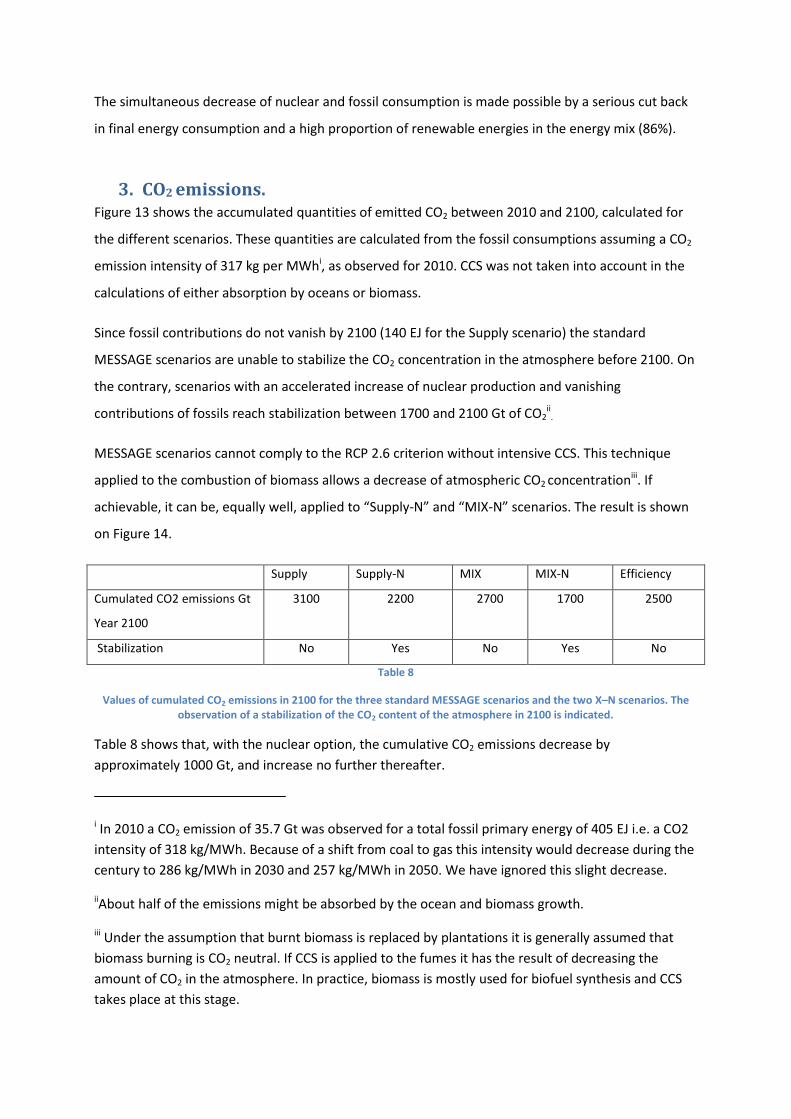
3. CO2 emissions. Figure 13 shows the accumulated quantities of emitted CO2 between 2010 and 2100, calculated for
the different scenarios. These quantities are calculated from the fossil consumptions assuming a CO2
emission intensity of 317 kg per MWhi, as observed for 2010. CCS was not taken into account in the
calculations of either absorption by oceans or biomass.
Since fossil contributions do not vanish by 2100 (140 EJ for the Supply scenario) the standard
MESSAGE scenarios are unable to stabilize the CO2 concentration in the atmosphere before 2100. On
the contrary, scenarios with an accelerated increase of nuclear production and vanishing
contributions of fossils reach stabilization between 1700 and 2100 Gt of CO2ii.
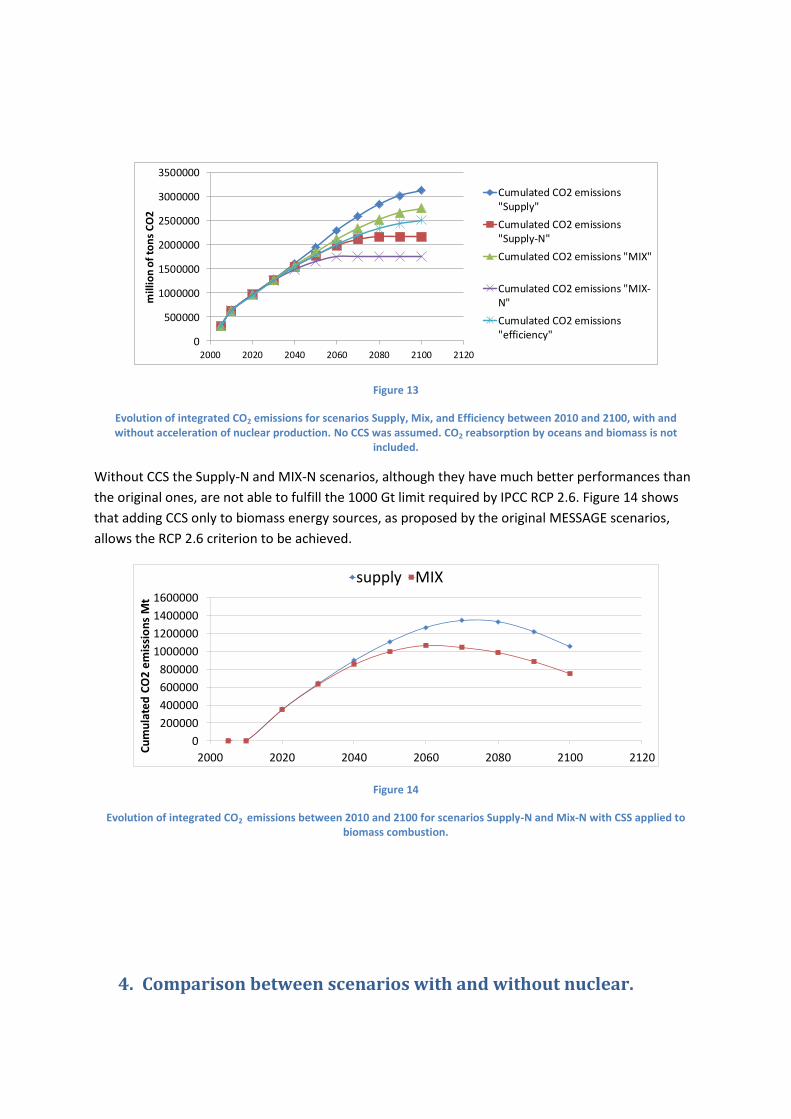
MESSAGE scenarios cannot comply to the RCP 2.6 criterion without intensive CCS. This technique
applied to the combustion of biomass allows a decrease of atmospheric CO2 concentrationiii. If
achievable, it can be, equally well, applied to “Supply-N” and “MIX-N” scenarios. The result is shown
on Figure 14.
Supply Supply-N MIX MIX-N Efficiency
Cumulated CO2 emissions Gt
Year 2100
3100 2200 2700 1700 2500
Stabilization No Yes No Yes No
Table 8
Values of cumulated CO2 emissions in 2100 for the three standard MESSAGE scenarios and the two X–N scenarios. The observation of a stabilization of the CO2 content of the atmosphere in 2100 is indicated.
Table 8 shows that, with the nuclear option, the cumulative CO2 emissions decrease by
approximately 1000 Gt, and increase no further thereafter.
i In 2010 a CO2 emission of 35.7 Gt was observed for a total fossil primary energy of 405 EJ i.e. a CO2
intensity of 318 kg/MWh. Because of a shift from coal to gas this intensity would decrease during the
century to 286 kg/MWh in 2030 and 257 kg/MWh in 2050. We have ignored this slight decrease.
iiAbout half of the emissions might be absorbed by the ocean and biomass growth.
iii Under the assumption that burnt biomass is replaced by plantations it is generally assumed that
biomass burning is CO2 neutral. If CCS is applied to the fumes it has the result of decreasing the
amount of CO2 in the atmosphere. In practice, biomass is mostly used for biofuel synthesis and CCS
takes place at this stage.
0
500000
1000000
1500000
2000000
2500000
3000000
3500000
2000 2020 2040 2060 2080 2100 2120
mill
ion
of
ton
s C
O2
Cumulated CO2 emissions"Supply"
Cumulated CO2 emissions"Supply-N"
Cumulated CO2 emissions "MIX"
Cumulated CO2 emissions "MIX-N"
Cumulated CO2 emissions"efficiency"
Figure 13
Evolution of integrated CO2 emissions for scenarios Supply, Mix, and Efficiency between 2010 and 2100, with and without acceleration of nuclear production. No CCS was assumed. CO2 reabsorption by oceans and biomass is not
included.
Without CCS the Supply-N and MIX-N scenarios, although they have much better performances than
the original ones, are not able to fulfill the 1000 Gt limit required by IPCC RCP 2.6. Figure 14 shows
that adding CCS only to biomass energy sources, as proposed by the original MESSAGE scenarios,
allows the RCP 2.6 criterion to be achieved.
0
200000
400000
600000
800000
1000000
1200000
1400000
1600000
2000 2020 2040 2060 2080 2100 2120
Cu
mu
late
d C
O2
em
issi
on
s M
t
supply MIX
Figure 14
Evolution of integrated CO2 emissions between 2010 and 2100 for scenarios Supply-N and Mix-N with CSS applied to biomass combustion.
4. Comparison between scenarios with and without nuclear.
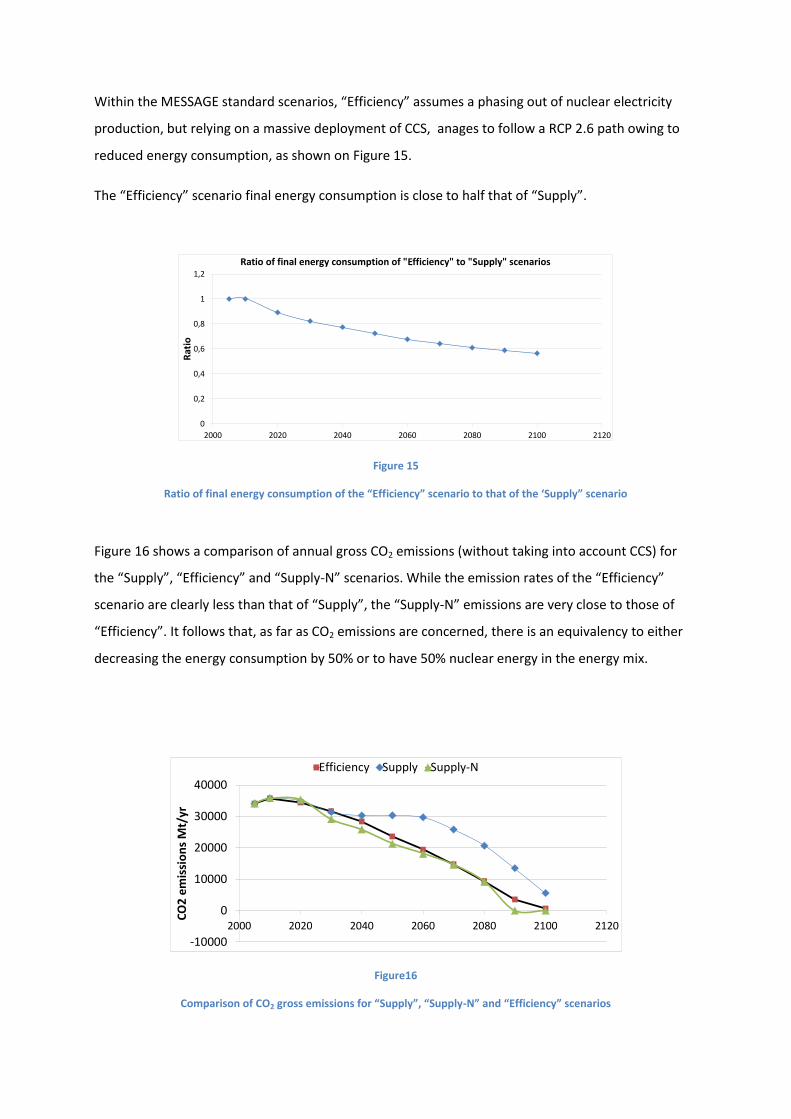
Within the MESSAGE standard scenarios, “Efficiency” assumes a phasing out of nuclear electricity
production, but relying on a massive deployment of CCS, anages to follow a RCP 2.6 path owing to
reduced energy consumption, as shown on Figure 15.
The “Efficiency” scenario final energy consumption is close to half that of “Supply”.
0
0,2
0,4
0,6
0,8
1
1,2
2000 2020 2040 2060 2080 2100 2120
Rat
io
Ratio of final energy consumption of "Efficiency" to "Supply" scenarios
Figure 15
Ratio of final energy consumption of the “Efficiency” scenario to that of the ‘Supply” scenario
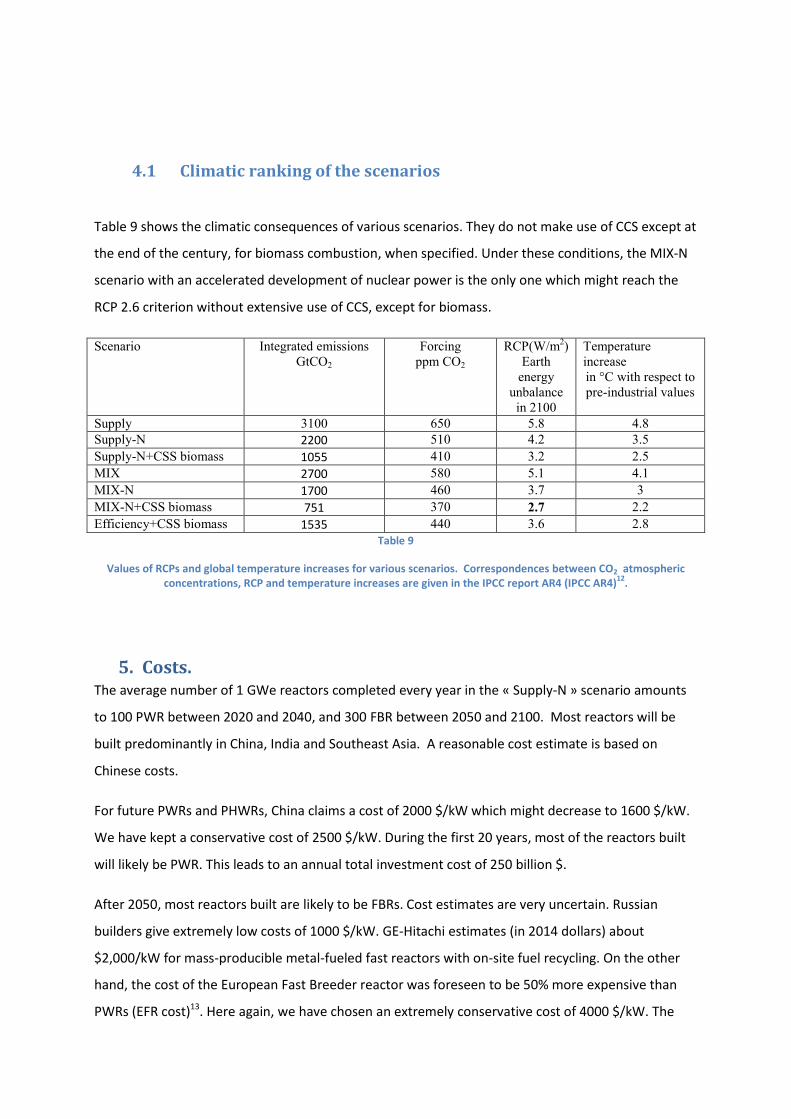
Figure 16 shows a comparison of annual gross CO2 emissions (without taking into account CCS) for
the “Supply”, “Efficiency” and “Supply-N” scenarios. While the emission rates of the “Efficiency”
scenario are clearly less than that of “Supply”, the “Supply-N” emissions are very close to those of
“Efficiency”. It follows that, as far as CO2 emissions are concerned, there is an equivalency to either
decreasing the energy consumption by 50% or to have 50% nuclear energy in the energy mix.
-10000
0
10000
20000
30000
40000
2000 2020 2040 2060 2080 2100 2120
CO
2 e
mis
sio
ns
Mt/
yr
Efficiency Supply Supply-N
Figure16
Comparison of CO2 gross emissions for “Supply”, “Supply-N” and “Efficiency” scenarios
4.1 Climatic ranking of the scenarios
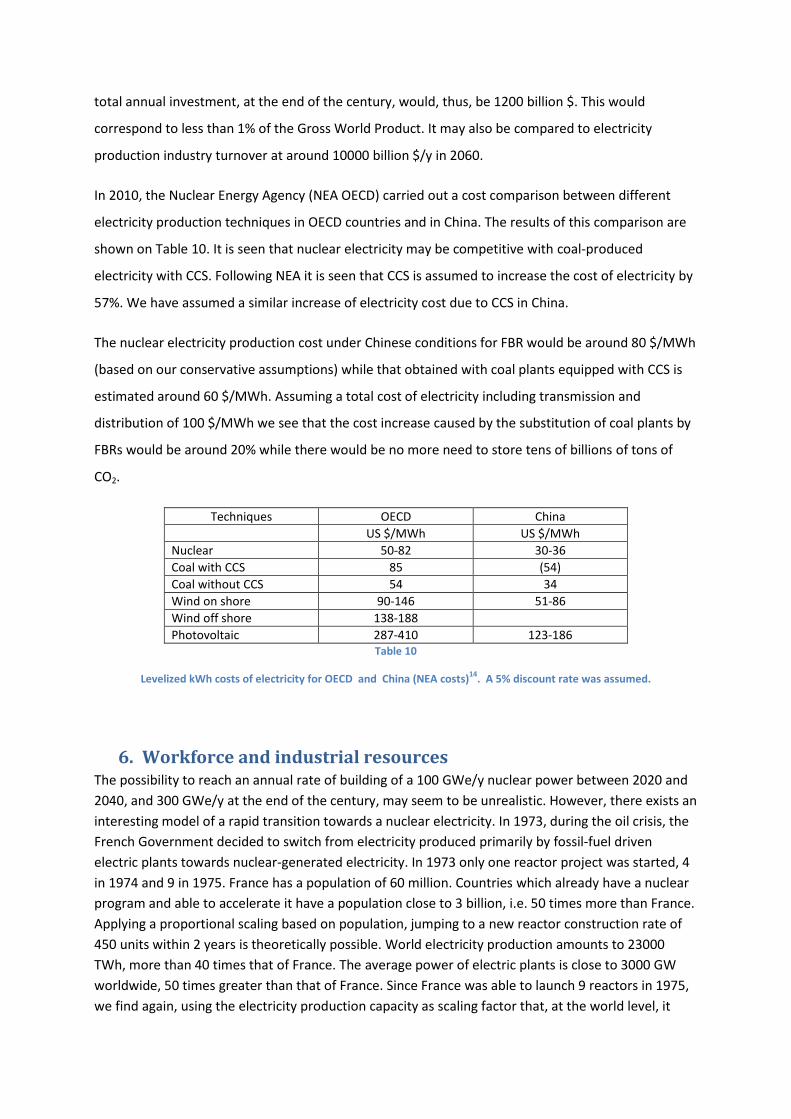
Table 9 shows the climatic consequences of various scenarios. They do not make use of CCS except at
the end of the century, for biomass combustion, when specified. Under these conditions, the MIX-N
scenario with an accelerated development of nuclear power is the only one which might reach the
RCP 2.6 criterion without extensive use of CCS, except for biomass.
Scenario Integrated emissions
GtCO2 Forcing
ppm CO2
RCP(W/m2)
Earth
energy
unbalance
in 2100
Temperature
increase in °C with respect to
pre-industrial values
Supply 3100 650 5.8 4.8
Supply-N 2200 510 4.2 3.5
Supply-N+CSS biomass 1055 410 3.2 2.5
MIX 2700 580 5.1 4.1
MIX-N 1700 460 3.7 3
MIX-N+CSS biomass 751 370 2.7 2.2
Efficiency+CSS biomass 1535 440 3.6 2.8
Table 9
Values of RCPs and global temperature increases for various scenarios. Correspondences between CO2 atmospheric concentrations, RCP and temperature increases are given in the IPCC report AR4 (IPCC AR4)
12.
5. Costs. The average number of 1 GWe reactors completed every year in the « Supply-N » scenario amounts
to 100 PWR between 2020 and 2040, and 300 FBR between 2050 and 2100. Most reactors will be
built predominantly in China, India and Southeast Asia. A reasonable cost estimate is based on
Chinese costs.
For future PWRs and PHWRs, China claims a cost of 2000 $/kW which might decrease to 1600 $/kW.
We have kept a conservative cost of 2500 $/kW. During the first 20 years, most of the reactors built
will likely be PWR. This leads to an annual total investment cost of 250 billion $.
After 2050, most reactors built are likely to be FBRs. Cost estimates are very uncertain. Russian
builders give extremely low costs of 1000 $/kW. GE-Hitachi estimates (in 2014 dollars) about
$2,000/kW for mass-producible metal-fueled fast reactors with on-site fuel recycling. On the other
hand, the cost of the European Fast Breeder reactor was foreseen to be 50% more expensive than
PWRs (EFR cost)13. Here again, we have chosen an extremely conservative cost of 4000 $/kW. The
total annual investment, at the end of the century, would, thus, be 1200 billion $. This would
correspond to less than 1% of the Gross World Product. It may also be compared to electricity
production industry turnover at around 10000 billion $/y in 2060.
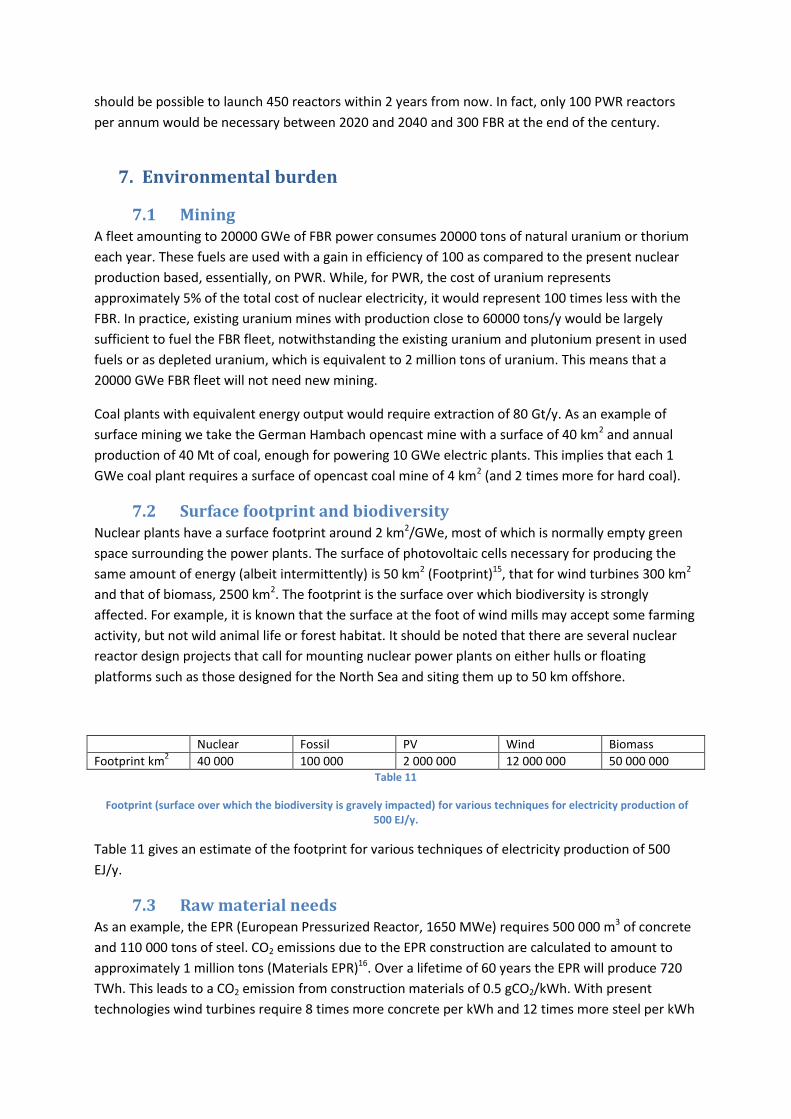
In 2010, the Nuclear Energy Agency (NEA OECD) carried out a cost comparison between different
electricity production techniques in OECD countries and in China. The results of this comparison are
shown on Table 10. It is seen that nuclear electricity may be competitive with coal-produced
electricity with CCS. Following NEA it is seen that CCS is assumed to increase the cost of electricity by
57%. We have assumed a similar increase of electricity cost due to CCS in China.
The nuclear electricity production cost under Chinese conditions for FBR would be around 80 $/MWh
(based on our conservative assumptions) while that obtained with coal plants equipped with CCS is
estimated around 60 $/MWh. Assuming a total cost of electricity including transmission and
distribution of 100 $/MWh we see that the cost increase caused by the substitution of coal plants by
FBRs would be around 20% while there would be no more need to store tens of billions of tons of
CO2.
Techniques OECD China
US $/MWh US $/MWh
Nuclear 50-82 30-36
Coal with CCS 85 (54)
Coal without CCS 54 34
Wind on shore 90-146 51-86
Wind off shore 138-188
Photovoltaic 287-410 123-186 Table 10
Levelized kWh costs of electricity for OECD and China (NEA costs)14
. A 5% discount rate was assumed.
6. Workforce and industrial resources The possibility to reach an annual rate of building of a 100 GWe/y nuclear power between 2020 and
2040, and 300 GWe/y at the end of the century, may seem to be unrealistic. However, there exists an
interesting model of a rapid transition towards a nuclear electricity. In 1973, during the oil crisis, the
French Government decided to switch from electricity produced primarily by fossil-fuel driven
electric plants towards nuclear-generated electricity. In 1973 only one reactor project was started, 4
in 1974 and 9 in 1975. France has a population of 60 million. Countries which already have a nuclear
program and able to accelerate it have a population close to 3 billion, i.e. 50 times more than France.
Applying a proportional scaling based on population, jumping to a new reactor construction rate of
450 units within 2 years is theoretically possible. World electricity production amounts to 23000
TWh, more than 40 times that of France. The average power of electric plants is close to 3000 GW
worldwide, 50 times greater than that of France. Since France was able to launch 9 reactors in 1975,
we find again, using the electricity production capacity as scaling factor that, at the world level, it
should be possible to launch 450 reactors within 2 years from now. In fact, only 100 PWR reactors
per annum would be necessary between 2020 and 2040 and 300 FBR at the end of the century.
7. Environmental burden
7.1 Mining A fleet amounting to 20000 GWe of FBR power consumes 20000 tons of natural uranium or thorium
each year. These fuels are used with a gain in efficiency of 100 as compared to the present nuclear
production based, essentially, on PWR. While, for PWR, the cost of uranium represents
approximately 5% of the total cost of nuclear electricity, it would represent 100 times less with the
FBR. In practice, existing uranium mines with production close to 60000 tons/y would be largely
sufficient to fuel the FBR fleet, notwithstanding the existing uranium and plutonium present in used
fuels or as depleted uranium, which is equivalent to 2 million tons of uranium. This means that a
20000 GWe FBR fleet will not need new mining.
Coal plants with equivalent energy output would require extraction of 80 Gt/y. As an example of
surface mining we take the German Hambach opencast mine with a surface of 40 km2 and annual
production of 40 Mt of coal, enough for powering 10 GWe electric plants. This implies that each 1
GWe coal plant requires a surface of opencast coal mine of 4 km2 (and 2 times more for hard coal).
7.2 Surface footprint and biodiversity Nuclear plants have a surface footprint around 2 km2/GWe, most of which is normally empty green
space surrounding the power plants. The surface of photovoltaic cells necessary for producing the
same amount of energy (albeit intermittently) is 50 km2 (Footprint)15, that for wind turbines 300 km2
and that of biomass, 2500 km2. The footprint is the surface over which biodiversity is strongly
affected. For example, it is known that the surface at the foot of wind mills may accept some farming
activity, but not wild animal life or forest habitat. It should be noted that there are several nuclear
reactor design projects that call for mounting nuclear power plants on either hulls or floating
platforms such as those designed for the North Sea and siting them up to 50 km offshore.
Nuclear Fossil PV Wind Biomass
Footprint km2 40 000 100 000 2 000 000 12 000 000 50 000 000
Table 11
Footprint (surface over which the biodiversity is gravely impacted) for various techniques for electricity production of 500 EJ/y.
Table 11 gives an estimate of the footprint for various techniques of electricity production of 500
EJ/y.
7.3 Raw material needs As an example, the EPR (European Pressurized Reactor, 1650 MWe) requires 500 000 m3 of concrete
and 110 000 tons of steel. CO2 emissions due to the EPR construction are calculated to amount to
approximately 1 million tons (Materials EPR)16. Over a lifetime of 60 years the EPR will produce 720
TWh. This leads to a CO2 emission from construction materials of 0.5 gCO2/kWh. With present
technologies wind turbines require 8 times more concrete per kWh and 12 times more steel per kWh
than EPR. This is telling, because the EPR is the worst of the new reactor designs when it comes to
raw material needs. Other designs are considerably more frugal in that respect.
8. Incentive Without special incentives, coal- and gas-fired electric plants are more profitable than nuclear plants.
Those are, also, more investment intensive and very sensitive to financial costs. Therefore, some kind
of incentive is necessary for the transition away from fossil fuels. It is not the object of this paper to
give an in-depth discussion of this matter. We only cite two methods widely advocated by specialists:
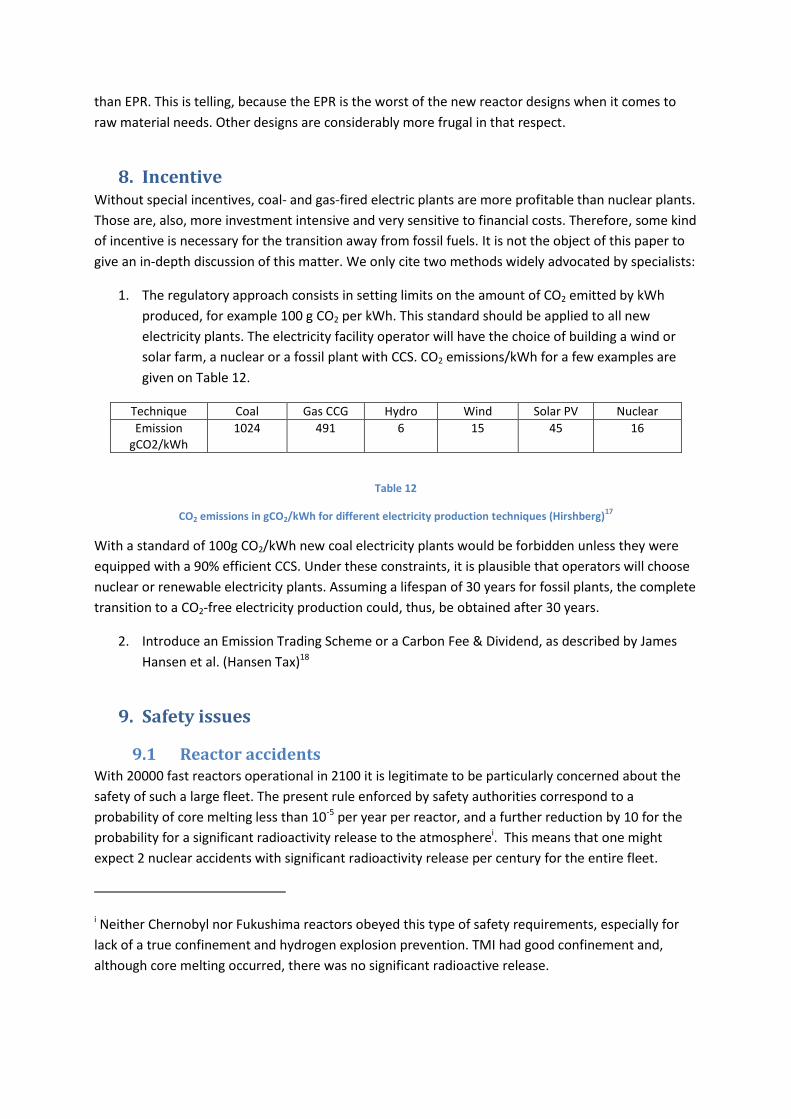
1. The regulatory approach consists in setting limits on the amount of CO2 emitted by kWh
produced, for example 100 g CO2 per kWh. This standard should be applied to all new
electricity plants. The electricity facility operator will have the choice of building a wind or
solar farm, a nuclear or a fossil plant with CCS. CO2 emissions/kWh for a few examples are
given on Table 12.
Technique Coal Gas CCG Hydro Wind Solar PV Nuclear
Emission gCO2/kWh
1024 491 6 15 45 16
Table 12
CO2 emissions in gCO2/kWh for different electricity production techniques (Hirshberg)17
With a standard of 100g CO2/kWh new coal electricity plants would be forbidden unless they were
equipped with a 90% efficient CCS. Under these constraints, it is plausible that operators will choose
nuclear or renewable electricity plants. Assuming a lifespan of 30 years for fossil plants, the complete
transition to a CO2-free electricity production could, thus, be obtained after 30 years.
2. Introduce an Emission Trading Scheme or a Carbon Fee & Dividend, as described by James
Hansen et al. (Hansen Tax)18
9. Safety issues
9.1 Reactor accidents With 20000 fast reactors operational in 2100 it is legitimate to be particularly concerned about the
safety of such a large fleet. The present rule enforced by safety authorities correspond to a
probability of core melting less than 10-5 per year per reactor, and a further reduction by 10 for the
probability for a significant radioactivity release to the atmospherei. This means that one might
expect 2 nuclear accidents with significant radioactivity release per century for the entire fleet.
i Neither Chernobyl nor Fukushima reactors obeyed this type of safety requirements, especially for
lack of a true confinement and hydrogen explosion prevention. TMI had good confinement and,
although core melting occurred, there was no significant radioactive release.
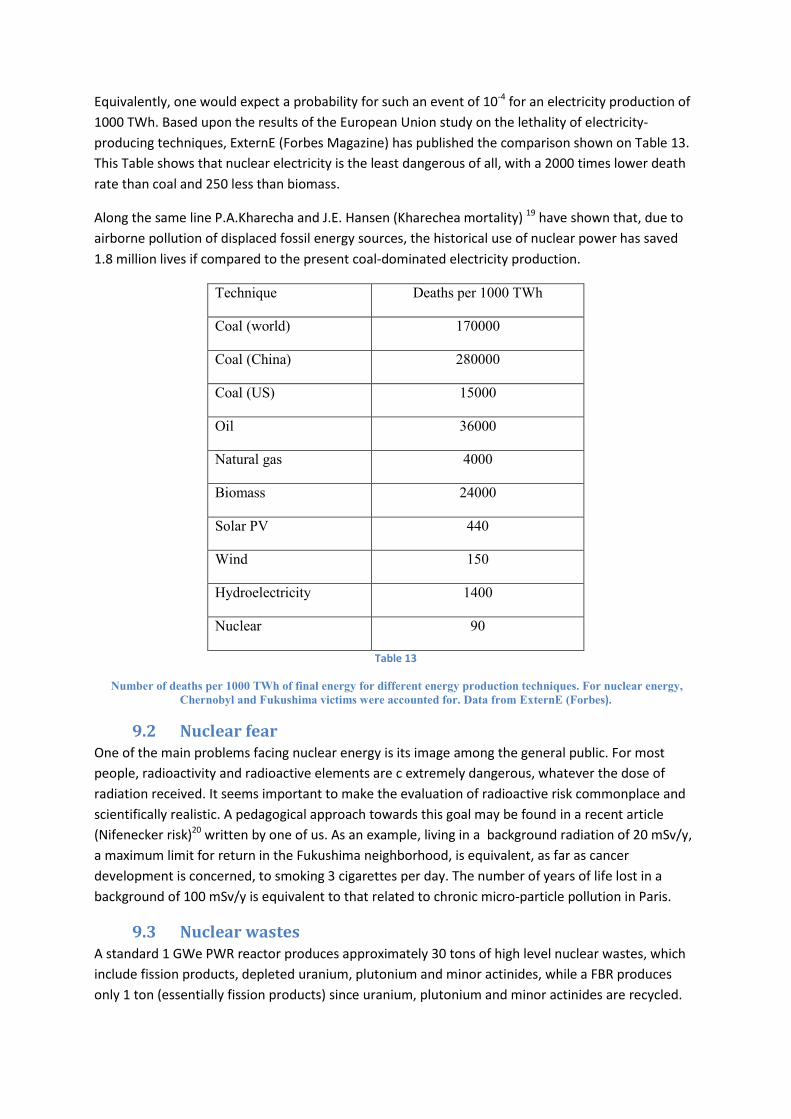
Equivalently, one would expect a probability for such an event of 10-4 for an electricity production of
1000 TWh. Based upon the results of the European Union study on the lethality of electricity-
producing techniques, ExternE (Forbes Magazine) has published the comparison shown on Table 13.
This Table shows that nuclear electricity is the least dangerous of all, with a 2000 times lower death
rate than coal and 250 less than biomass.
Along the same line P.A.Kharecha and J.E. Hansen (Kharechea mortality) 19 have shown that, due to
airborne pollution of displaced fossil energy sources, the historical use of nuclear power has saved
1.8 million lives if compared to the present coal-dominated electricity production.
Technique Deaths per 1000 TWh
Coal (world) 170000
Coal (China) 280000
Coal (US) 15000
Oil 36000
Natural gas 4000
Biomass 24000
Solar PV 440
Wind 150
Hydroelectricity 1400
Nuclear 90
Table 13
Number of deaths per 1000 TWh of final energy for different energy production techniques. For nuclear energy,
Chernobyl and Fukushima victims were accounted for. Data from ExternE (Forbes).
9.2 Nuclear fear One of the main problems facing nuclear energy is its image among the general public. For most
people, radioactivity and radioactive elements are c extremely dangerous, whatever the dose of
radiation received. It seems important to make the evaluation of radioactive risk commonplace and
scientifically realistic. A pedagogical approach towards this goal may be found in a recent article
(Nifenecker risk)20 written by one of us. As an example, living in a background radiation of 20 mSv/y,
a maximum limit for return in the Fukushima neighborhood, is equivalent, as far as cancer
development is concerned, to smoking 3 cigarettes per day. The number of years of life lost in a
background of 100 mSv/y is equivalent to that related to chronic micro-particle pollution in Paris.
9.3 Nuclear wastes A standard 1 GWe PWR reactor produces approximately 30 tons of high level nuclear wastes, which
include fission products, depleted uranium, plutonium and minor actinides, while a FBR produces
only 1 ton (essentially fission products) since uranium, plutonium and minor actinides are recycled.
Therefore, 20000 FBR would produce a nuclear waste mass equivalent to that produced by 700 PWR,
not far from the present value. And that nuclear waste would have a radiotoxicity level that would
diminish below that of natural uranium ore within a few hundred years. FBRs with recycling, in effect,
will solve the so-called “million-year waste problem.”
9.4 Proliferation issues Might the very important development of nuclear power lead to a corresponding increase of
proliferation of nuclear armaments?
A first remark is that proliferation (defined as the spread of nuclear weapons to new states) is,
obviously, not a problem with countries which already have a nuclear arsenal: USA, Russia, China,
India, Pakistan, Israel, North Korea, France, UK which represent 3.8 billion people, more than half the
total world population. These countries are also those where most of the development of nuclear
power will need to take place.
Setting up a nuclear armaments program does not imply a link with nuclear electricity production. Nuclear armament requires either highly enriched uranium of good quality or plutonium with an extremely high proportion of the 239 plutonium isotope. Uranium highly enriched in isotope 235 is obtained with gas centrifuges which are difficult to detect by the inspectors of the IAEAi, contrary to the massive gas diffusion plants previously used. Furthermore, 235U explosive devices are rather straightforward to build, while, due to the presence of the non-fissile 240Pu isotope, plutonium devices require the delicate use of timed chemical implosion before the atomic explosion can take place. In order to minimize the presence of 240Pu isotope the irradiation of 238U necessary for production of 239Pu should be as short as possible. On the contrary, PWR and FBR, when used in commercial electricity generation settings, require long irradiation times and are not suitable for “military” plutonium production. PHWRs are equipped with continuous fuel discharge mechanisms and, theoretically, can be used to produce very good “military” grade plutonium. However, it would involve discharging fuel at a low burn-up and would involve high frequency of fuel loading and unloading. Fueling machines of PHWRs are not designed for that kind of duty and producing weapon grade plutonium from PHWRs is not a practical proposition. Moreover, whenever a proliferation risk in a specific country exists, it is clear that inspectors of the IAEA will be especially watchful concerning PHWRs operating in that country. At present one can say that a country can obtain the material necessary for building nuclear
explosive devices if it has competent physicists and engineers. However, the example of Iran shows
that it will have to pay a high price due to the international sanctions that might result. The
development of nuclear electric power would not have a significant effect here.
9.5 Terrorist attacks A kamikaze-style attack against a reactor cannot be completely excluded. In order to cause
significant radioactive emissions, the terrorist group has to ruin the confinement, a concrete barrier
several meters thick. Chernobyl, which had no confinement, is the worst example of what might be
achieved in a true war action. Such an attack would be quite ineffective as far as lethality is
concerned: at most a few dozen dead, essentially among the operators and rescuers. Only after
several years would the true scale of the catastrophe appear, notwithstanding never-ending
i International Atomic Energy Agency
controversies on its true extent. By that time the motivation of the attack will be forgotten. We just
recently saw, in Paris, that with two determined terrorists it is possible to kill more than hundred
people in a few seconds. And still, one cannot exclude an attack on a nuclear reactor. This is because
terrorists know that such an attack would cause an immense panic. This is an illustration that the
main risk of nuclear is not that associated to the reality of radiation, but that associated to the fear
we have of it. Development of nuclear power has to be accompanied by truthful information on the
nature and magnitude of its risks. As a rule, people living close to nuclear reactors are less afraid of
nuclear energy than the general public. Despite the Chernobyl catastrophe, the Ukraine did not
renounce nuclear power, but Germany did. Paradoxically, the very highly demanding safety rules
increase the fear of the public. Following the rule set by most safety authorities, the acceptable
“human-made” dose delivered to the public is limited to 1 mSv/y. Most people believe that being
irradiated at a dose 100 times that much would be deadly in the short term. They find it hard to
believe that, as far as cancer probability is concerned, the risk of an irradiation of 100 mSv/yr is
equivalent to smoking a little less than one pack of cigarettes per day.
10. Conclusion An accelerated development of nuclear electricity production, starting as soon as in 2020, would
significantly alleviate the constraints required to stabilize global temperatures before 2100. The CO2
volume to be stored would be divided by at least by a factor 2.5 and might even prove unnecessary.
The constraints on the development of expansive and intermittent renewable electricity techniques
might also be lessened.
Achieving a global nuclear power deployment of 20000 GWe in 2100 is possible if the world relies on
breeding with improved reprocessing techniques, deploying thorium-fueled reactors, and/or
increasing the contribution of PHWR reactors. Nuclear production would then reach close to 60% of
final energy consumption, the complement being met by renewable energy sources.
It seems physically and economically possible to multiply by 50 the production of nuclear energy by
2100, leading to a complete elimination of fossil fuels. Together with the use of renewable energy,
this would both answer the climate challenge and give a perennial solution to humanity’s energy
needs for thousands of years. Furthermore, in its breeding form, nuclear energy is probably the most
benign way to produce energy as far as the protection of biodiversity is concerned (Brook)21.
Following a study published in Forbes Magazine (Forbes)22, when compared to those related to global
warming, the risks associated with nuclear electricity production are small. Including Chernobyl and
Fukushima death tolls (nobody died at Fukushima due to radioactivity, nor is anyone expected to
have negative health effects from the radioactivity released by this accident), lethality of electricity
production by nuclear energy is less than 1/1000 that of coal and 1/20 that of biomass.
Appendix 1
Energy Conventions
Final energy : Energy bought by the final user. For example: natural gas or electricity.
Secondary energy : energy output from the production plant. For example: electricity, hydrogen,
gasoline... Electricity sources are specified (coal, nuclear, wind etc.)
Primary energy : energy necessary for producing secondary or final energies.
Two conventions are used by IIASA:
“Primary energy by substitution” corresponds to the quantity of fossil fuels necessary to
produce the same quantity of final or secondary energies. For electricity production with
thermal plants, the ratio between secondary and primary energies is about 33%. The same
ratio is chosen for nuclear and renewable energies.
“Direct primary energy” is the same as above for fossil fuels but, for nuclear and renewable
energies, primary and secondary energies are equal. IIASA generally uses this definition of
primary energy and we follow the same convention.
Appendix 2
Regional developments in the MESSAGE scenarios
A.2.1 Definition of the 11 regions used by IIASA
AFR: Sub-Saharan Africa: Angola, Benin, Botswana, British Indian Ocean Territory,
Burkina Faso, Burundi, Cameroon, Cape Verde, Central African Republic, Chad, Comoros,
Cote d'Ivoire, Congo, Djibouti, Equatorial Guinea, Eritrea, Ethiopia, Gabon, Gambia, Ghana,
Guinea, Guinea-Bissau, Kenya, Lesotho, Liberia, Madagascar, Malawi, Mali, Mauritania,
Mauritius, Mozambique, Namibia, Niger, Nigeria, Reunion, Rwanda, Sao Tome and Principe,
Senegal, Seychelles, Sierra Leone, Somalia, South Africa, Saint Helena, Swaziland, Tanzania,
Togo, Uganda, Zaire, Zambia, Zimbabwe
CPA: Centrally planned Asia and China: Cambodia, China (incl. Hong Kong), Korea
(DPR), Laos (PDR), Mongolia, Vietnam
EEU: Central and Eastern Europe: Albania, Bosnia and Herzegovina, Bulgaria, Croatia,
Czech Republic, Estonia, The former Yugoslav Rep. of Macedonia, Latvia, Lithuania,
Hungary, Poland, Romania, Slovak Republic, Slovenia, Yugoslavia
FSU: Former Soviet Union: Armenia, Azerbaijan, Belarus, Georgia, Kazakhstan,
Kyrgyzstan, Republic of Moldova, Russian Federation, Tajikistan, Turkmenistan, Ukraine,
Uzbekistan (the Baltic republics are in the Central and Eastern Europe region)
LAC: Latin America and the Caribbean: Antigua and Barbuda, Argentina, Bahamas,
Barbados, Belize, Bermuda, Bolivia, Brazil, Chile, Colombia, Costa Rica, Cuba, Dominica,
Dominican Republic, Ecuador, El Salvador, French Guyana, Grenada, Guadeloupe,
Guatemala, Guyana, Haiti, Honduras, Jamaica, Martinique, Mexico, Netherlands Antilles,
Nicaragua, Panama, Paraguay, Peru, Saint Kitts and Nevis, Santa Lucia, Saint Vincent and the
Grenadines, Suriname, Trinidad and Tobago, Uruguay, Venezuela)
MEA: Middle East and North Africa: Algeria, Bahrain, Egypt (Arab Republic), Iraq, Iran
(Islamic Republic), Israel, Jordan, Kuwait, Lebanon, Libya/SPLAJ, Morocco, Oman, Qatar,
Saudi Arabia, Sudan, Syria (Arab Republic), Tunisia, United Arab Emirates, Yemen
NAM: North America: Canada, Guam, Puerto Rico, United States of America, Virgin
Islands
PAO: Pacific OECD: Australia, Japan, New Zealand
PAS: Other Pacific Asia: American Samoa, Brunei Darussalam, Fiji, French Polynesia,
Gilbert-Kiribati, Indonesia, Malaysia, Myanmar, New Caledonia, Papua, New Guinea,
Philippines, Republic of Korea, Singapore, Solomon Islands, Taiwan (China), Thailand,
Tonga, Vanuatu, Western Samoa
SAS: South Asia: Afghanistan, Bangladesh, Bhutan, India, Maldives, Nepal, Pakistan, Sri
Lanka
WEU: Western Europe: Andorra, Austria, Azores, Belgium, Canary Islands, Channel
Islands, Cyprus, Denmark, Faeroe Islands, Finland, France, Germany, Gibraltar, Greece,
Greenland, Iceland, Ireland, Isle of Man, Italy, Liechtenstein, Luxembourg, Madeira, Malta,
Monaco, Netherlands, Norway, Portugal, Spain, Sweden, Switzerland, Turkey, United
Kingdom
A.2.2 Regional development of nuclear energy following the MESSAGE
Supply scenario.
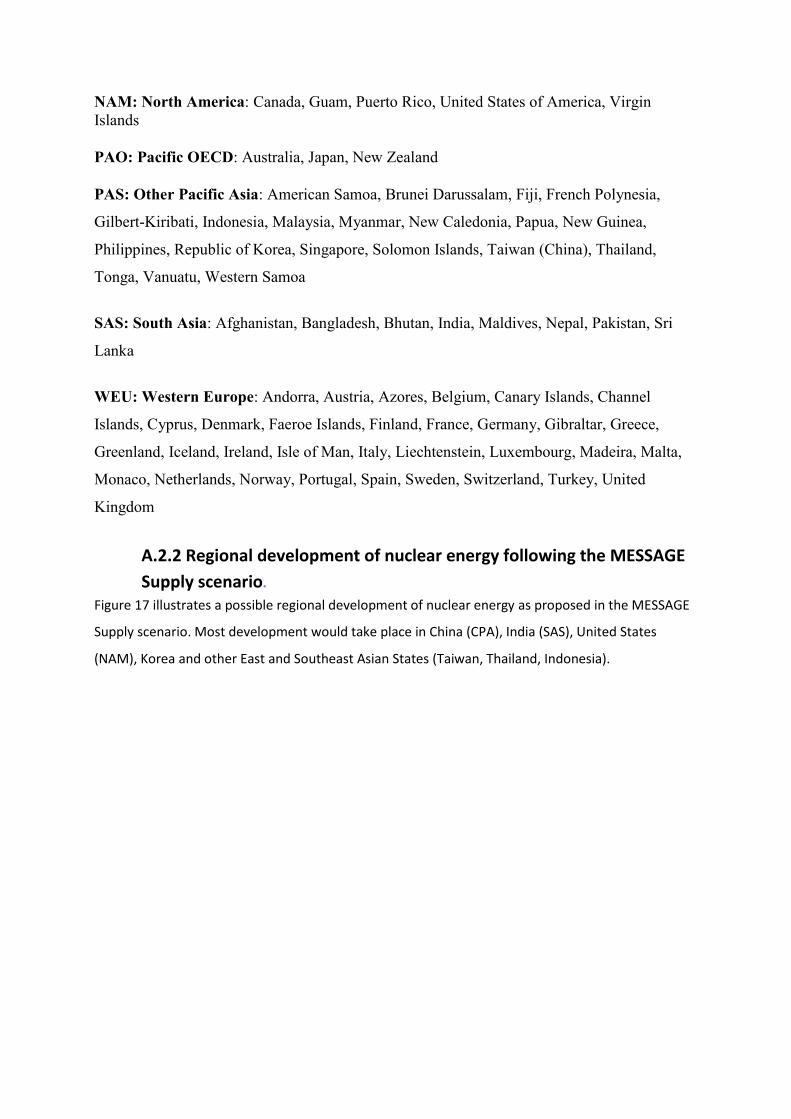
Figure 17 illustrates a possible regional development of nuclear energy as proposed in the MESSAGE
Supply scenario. Most development would take place in China (CPA), India (SAS), United States
(NAM), Korea and other East and Southeast Asian States (Taiwan, Thailand, Indonesia).
-10,000
0,000
10,000
20,000
30,000
40,000
50,000
60,000
70,000
2000 2020 2040 2060 2080 2100 2120Nu
cle
ar e
ne
rgy
pro
du
ctio
n E
J/yr
Regional Nuclear energy production for MESSAGE Supply scenario
AFR
CPA
LAM
MEA
NAM
PAO
PAS
SAS
WEU
EEU
FSU
Figure 17
Evolution of nuclear electricity production in various geographic regions according to the MESSAGE « Supply » scenario. The definition of regions is given in A.2.1
A.2.3 Regional evolution of the final energies per million capita in the
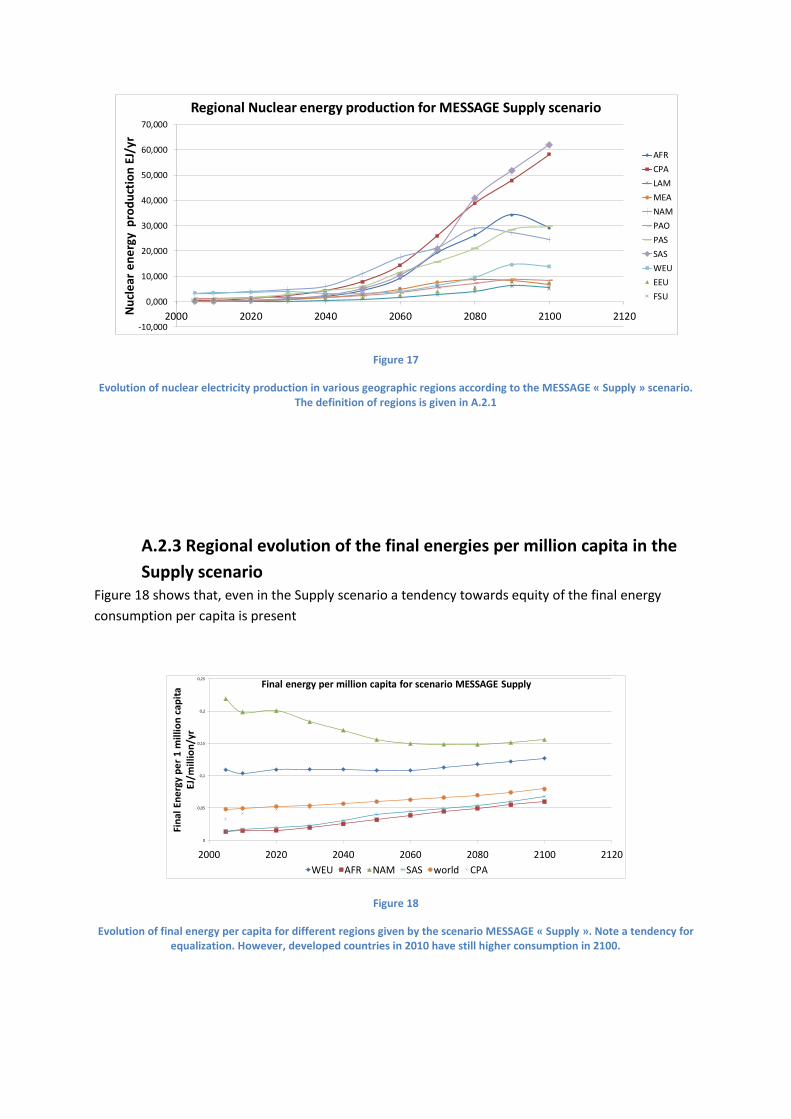
Supply scenario Figure 18 shows that, even in the Supply scenario a tendency towards equity of the final energy
consumption per capita is present
0
0,05
0,1
0,15
0,2
0,25
2000 2020 2040 2060 2080 2100 2120
Fin
al E
ne
rgy
pe
r 1
mill
ion
cap
ita
EJ/m
illio
n/y
r
Final energy per million capita for scenario MESSAGE Supply
WEU AFR NAM SAS world CPA
Figure 18
Evolution of final energy per capita for different regions given by the scenario MESSAGE « Supply ». Note a tendency for equalization. However, developed countries in 2010 have still higher consumption in 2100.
A.2.4 Regional evolution of the final energies per million capita in the
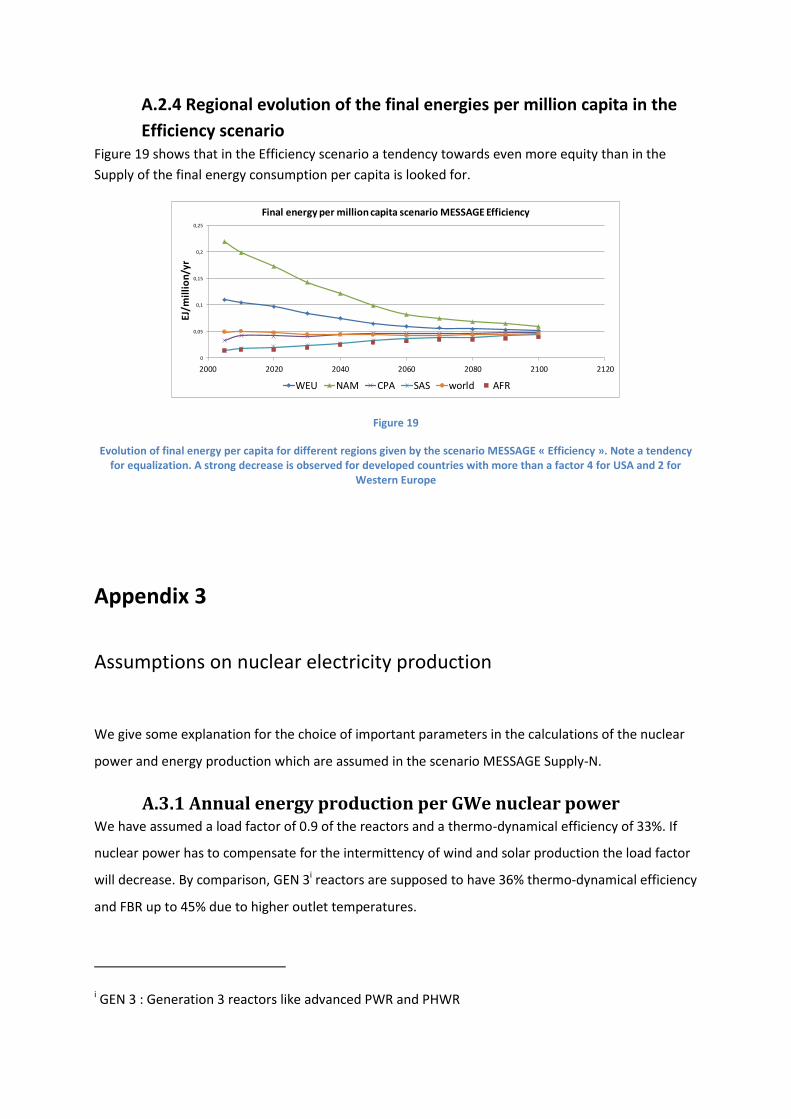
Efficiency scenario Figure 19 shows that in the Efficiency scenario a tendency towards even more equity than in the
Supply of the final energy consumption per capita is looked for.
0
0,05
0,1
0,15
0,2
0,25
2000 2020 2040 2060 2080 2100 2120
EJ/m
illi
on
/yr
Final energy per million capita scenario MESSAGE Efficiency
WEU NAM CPA SAS world AFR
Figure 19
Evolution of final energy per capita for different regions given by the scenario MESSAGE « Efficiency ». Note a tendency for equalization. A strong decrease is observed for developed countries with more than a factor 4 for USA and 2 for
Western Europe
Appendix 3
Assumptions on nuclear electricity production
We give some explanation for the choice of important parameters in the calculations of the nuclear
power and energy production which are assumed in the scenario MESSAGE Supply-N.
A.3.1 Annual energy production per GWe nuclear power We have assumed a load factor of 0.9 of the reactors and a thermo-dynamical efficiency of 33%. If
nuclear power has to compensate for the intermittency of wind and solar production the load factor
will decrease. By comparison, GEN 3i reactors are supposed to have 36% thermo-dynamical efficiency
and FBR up to 45% due to higher outlet temperatures.
i GEN 3 : Generation 3 reactors like advanced PWR and PHWR
A.3.2 Annual Uranium needs A typical 1 GWe PWR reactor produces 950 kg of fission products corresponding to fission of 1 ton of
heavy metal (actinides). About 2/3 correspond to fission of 235U and the remaining to fast fission of
238U and fission of 239,241Pu produced from neutron capture on 238U. The annual consumption of a 1
GWe reactor is about 27 tons of Uranium enriched to 3%, which corresponds to 115 tons of natural
Uranium. Thus, we have chosen an annual Uranium need of 120 tons per GWe PWR. This has to be
compounded by enrichment tails on one hand, re-enrichment of these tails and of reprocessed
depleted Uranium, on the other hand. We assume the same uranium consumption for PHWR
reactors where 30% of the fissions are produced by plutonium. Uranium needs of FBRs with
recycling, on the other hand, would require merely about one ton of depleted uranium per gigawatt
per year, and the amount of depleted uranium currently in inventory around the world assures that a
world powered solely by FBRs would have enough fuel for several centuries before any mining would
be required.
A.3.3 PHWR reactors
As compared to PWR, in PHWR, light water is replaced by heavy water for slowing down neutrons
and heat extraction. The capture cross-section of heavy water (deuterium, D2O) is 600 times smaller
than that of light water. Due to their superior neutron utilization PHWR reactors produce 2.4 times
more plutonium than PWR (Guillemin)23.
A.3.4 Plutonium inventory of Fast Breeder Reactors
Typical Plutonium core inventory is 4 tons/GWe. However, fuel elements are extracted periodically
from the reactor and need to be processed in order to separate Plutonium and Uranium (and other
actinides) for further fabrication of new fuel elements. At present, this process lasts about 4 years.
This leads to a total inventory of FBR of 8 tons. However, shorter durations seem to be possible. For
example, US nuclear engineers proposed the concept of the Integral Fast Reactor (IFR)24 where
reprocessing is carried out at the reactor site and uses a hot, dry electro-refining method called
pyroprocessing. Metallic fuels rather than oxide are used in this concept and allow shorter
reprocessing of higher activity fuels, with no possibility for isolation of specific fissile isotopes. It is
possible to obtain a duration of the processing as short as 1.3 year.
In case a significant decrease of the plutonium inventory of FBR appears not feasible, an alternative
would be to include more PHWRs in the thermal neutron reactor fleet. Indeed, while a 1 GWe PWR
needs to operate 40 years before producing the plutonium inventory of a FBR, only 13 years are
necessary for a 1 GWe PHWR. Thus, after 40 years, 2000 PWR reactors will allow starting 2000 FBR,
which, themselves will give rise to 4000 FBR after another 40 years. In contrast, after 40 years, 2000
PHWR allow starting 5700 FBR, i.e. 11400 FBR after 40 more years.
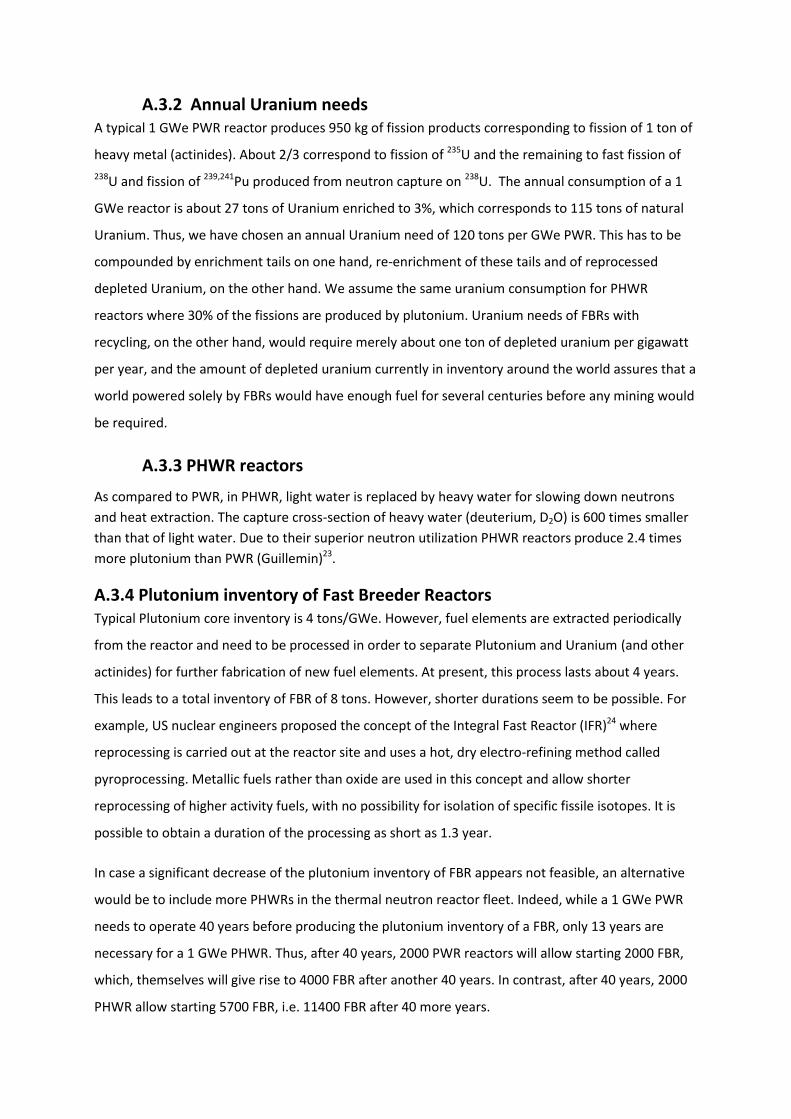
Figure 20 compares the plutonium production of a 2325 GWe PWR fleet to that of the same PHWR
power. Life time of the reactors was assumed to be 50 years.
Figure 20
Comparison of cumulated plutonium productions of a 2325 fleet of PWRs or PHWRs. The PWR production is equivalent
to the inventory of 3000 FBR, that of the PHWRs to that of 7100 FBR.
With the standard values of 8 tons of plutonium for the inventory of a 1 GWe FBR and an exclusively
PWR reactor fleet (2325 PWR consuming more than 11.5 million tons of uranium) for building the
initial inventories we find it impossible to exceed 3800 FBR by 2100 producing 177 EJ, much below
our 500 EJ objective. This objective can only be obtained by optimizing the initial inventory and the
proportion of PHWRs in the thermal reactor fleet. Table 14 shows how, introducing a proportion of
PHWRs, would allow for keeping of present reprocessing methods.
Total Pu inventory /GWe tons Proportion of PHWR in the thermal fleet %
8 50 7 37 6 14
5,5 0 Table 14
Equivalence between the total plutonium inventory (core + fuel cycle) for a 1 GWe FBR and the proportion of PHWRs reactors in the thermal reactors fleet (PHWRs + PWRs) necessary in order to reach the objective power of FBR in 2100
0,00
10000,00
20000,00
30000,00
40000,00
50000,00
60000,00
2000 2010 2020 2030 2040 2050 2060 2070 2080 2090 2100 2110
To
ns
Cumulated Pu Production
CANDU PWR
A.3.5 Details of the calculation of Figure 3 The calculations were done using an EXCEL program. We assume all reactors to deliver a power of 1
GWe and an energy production of 7,9 TWh/y. The Pu production of PWR is chosen to be 0,25
tons/y, that of PHWRs to be 0,59 tons/y and the net production of Pu by FBR to be 0,2 tons/y.
The core inventory of FBR is assumed to be 4 tons of Plutonium. The fuel is supposed to stay 4 years
in reactor. Concerning the out-of-reactor Plutonium inventory we made two calculations, one with 4
tons and the other with 1,5 tons. Thus, in one case the total Plutonium inventory is 8 tons, and, in
the other 5,5 tons.
Starting at year 0 we assume a constant building rate of 135/y until 20 years after the starting year ;
at that time the building rate increases to 300/y. The number of thermal reactors (PWR or PHWRs)
being built is 135/y at the beginning and starts leveling off 10 years after year 0 to vanish in year 20.
The complement to 135/y before year 40 and to 300 after is made of FBR. After 80 years the number
of FBR (the only ones left) reaches 15000 for an energy production of 430 EJ, as seen on Figure 5, to
be compared to the total primary energy of 1060 EJ in the Supply scenario.
The amount of natural Uranium needed for running PWR is around 120 tons/GWe/y, that of PHWRs
around 80 tons/GWe/y. In our calculation we have used an average value of 100 tons/GWe/y.
Using the evolution of the number of thermal neutrons of Figure 3 one gets the natural Uranium
consumption of Figure 4.
The possibility to produce enough Plutonium for a fleet of 19000 FBR in 2100 is, of course, crucial
and not easy. It depends on the initial stock of Plutonium built up by thermal neutron reactors and
on the doubling time of the reactors. The Plutonium production of existing FBR is 0,2 tons/y. For an
inventory of 8 ton/GWe, the total inventory for 19000 FBR amounts to 150000 tons. With a 0,2
ton/y production and an inventory of 8 tons, the doubling time of the FBR fleet is 40 years. This
means that by 2050 the Plutonium stock should be close to 27000 tons. For PWR the cumulated
Plutonium production is only 12000 tons. For PHWRs it reaches 34000 tons.
If the inventory is reduced to 5,5 tons/GWe the total inventory for 19000 FBR amounts to 105000
tons with a need of 19000 tons in 2050.
Figure 21 is an example of the evolution of the available Plutonium stock for various choices of the
percentage of PHWRs in the thermal neutrons reactors fleet with two different values of the
Plutonium inventory of the FBRs. We note that the combination of a 100% PWR fleet and a FBR
Plutonium inventory of 8 tons/y leads to a negative stock, which means an impossibility to reach the
objective of 19000 FBR reactors.
An important part of the stock rests in the used fuels since, after the rate of FBR construction is
stabilized at 300/y the yearly processing rates are 2400 tons of Plutonium with a 8 tons inventory
and 1650 tons for a 5.5 tons inventory. The rise of the Plutonium inventory after 2080 can easily be
controlled by limiting the breeding coefficient. By 2100 the annual Plutonium production of the
19000 reactors would be 3800 t/y, allowing the construction of 475 reactors with 8 t/GWe inventory
and of 690 FBR with 5,5 t/GWe inventory. This means that the FBR fleet will be easily at equilibrium.
Some natural Uranium will still be necessary at a rate of 19000 tons per year.
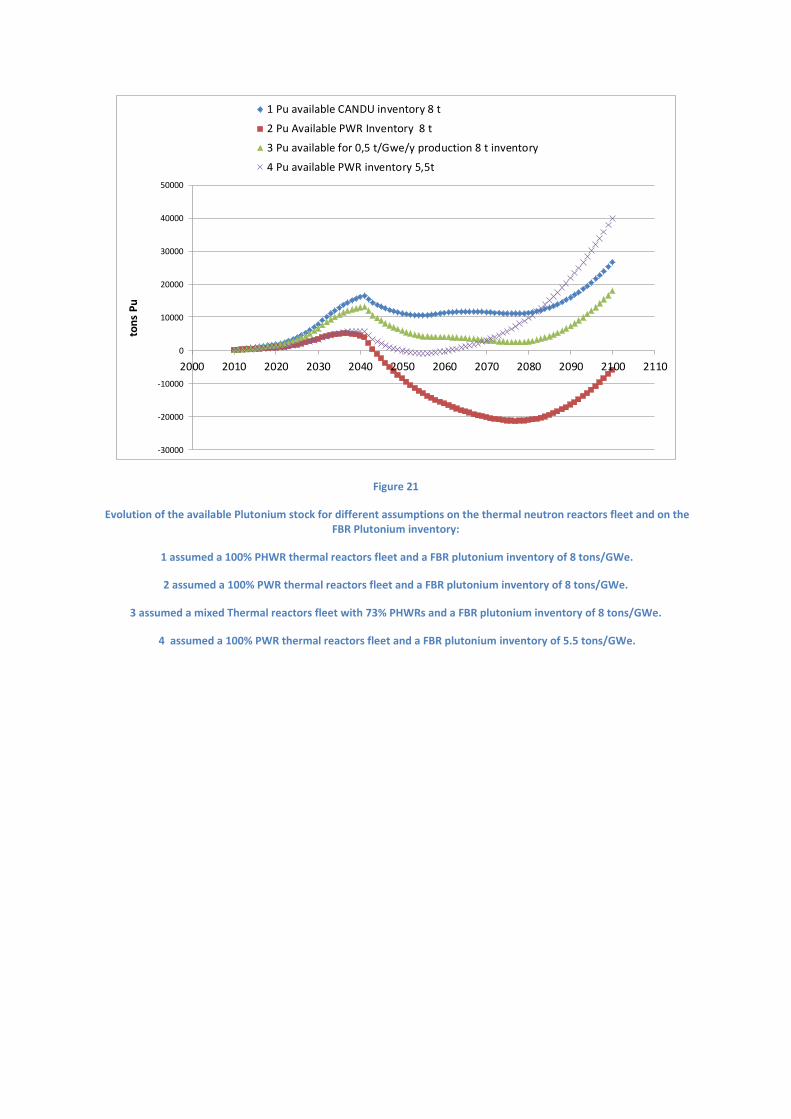
-30000
-20000
-10000
0
10000
20000
30000
40000
50000
2000 2010 2020 2030 2040 2050 2060 2070 2080 2090 2100 2110
ton
s P
u
1 Pu available CANDU inventory 8 t
2 Pu Available PWR Inventory 8 t
3 Pu available for 0,5 t/Gwe/y production 8 t inventory
4 Pu available PWR inventory 5,5t
Figure 21
Evolution of the available Plutonium stock for different assumptions on the thermal neutron reactors fleet and on the FBR Plutonium inventory:
1 assumed a 100% PHWR thermal reactors fleet and a FBR plutonium inventory of 8 tons/GWe.
2 assumed a 100% PWR thermal reactors fleet and a FBR plutonium inventory of 8 tons/GWe.
3 assumed a mixed Thermal reactors fleet with 73% PHWRs and a FBR plutonium inventory of 8 tons/GWe.
4 assumed a 100% PWR thermal reactors fleet and a FBR plutonium inventory of 5.5 tons/GWe.
References
1 (IPCC AR5 2014) https://www.ipcc.ch/report/ar5/
2 (IIASA_WEB_site) http://www.iiasa.ac.at/webapps/ene/geadb/dsd?Action=htmlpage&page=regions
GEA Scenario database (Version 2.0.2)
3 (GEA, 2012): Global Energy Assessment - Toward a Sustainable Future, Cambridge University Press, Cambridge, UK and New York, NY, USA and the International Institute for Applied Systems Analysis, Laxenburg, Austria. Chapter 7, Table 7.1
4 (Supply nuclear) http://www.iiasa.ac.at/web-apps/ene/geadb/dsd?Action=htmlpage&page=regions
5 (Supply fossil) http://www.iiasa.ac.at/web-apps/ene/geadb/dsd?Action=htmlpage&page=regions
6 (Super Phenix Wikipedia)
https://fr.wikipedia.org/wiki/Superph%C3%A9nix#Bilan_neutronique_de_Superph.C3.A9nix
7 (Purex Wikipedia)
https://fr.wikipedia.org/wiki/PUREX
8 (OECD NEA 2009) http://www.oecd-nea.org/ndd/pubs/2010/6891-uranium-2009.pdf
Identified resources at a cost <260$/kg: 6,3 million tons.
Reasonable Assured resources <260$/kg: 4 million tons
Infered resources <260$/kg: 2,3 million tons
Prognosticated resources <260$/kg: 3 million tons
Speculative resources : 7,5 million tons.
9 (Nifenecker 2011) Future electricity production methods. Part 1: Nuclear energy Hervé Nifenecker Published 14 January 2011, IOP Publishing Ltd , Reports on Progress in Physics, Volume 74, Number 2
10 (Nifenecker 2003) Scenarios with an intensive contribution of nuclear energy to the world energy supply H.Nifenecker, D. Heuer, J.M. Loiseaux, O. Meplan, A. Nuttin, S. David, J.M. Martin
Int. J. of Global Energy Issues > 2003 Vol.19, No.1 > pp.63-77
http://www.inderscience.com/info/inarticletoc.php?jcode=ijgei&year=2003&vol=19&issue=1
11 (Nifenecker 2011)Future electricity production methods. Part 1: Nuclear energy Hervé Nifenecker
Published 14 January 2011, IOP Publishing Ltd , Reports on Progress in Physics, Volume 74, Number 2
12 (IPCC AR4) https://www.ipcc.ch/publications_and_data/ar4/wg3/en/contents.html
https://www.ipcc.ch/publications_and_data/ar4/wg3/en/spmsspm-d.html#table-spm-5
13 (EFR cost) http://bibliothek.fzk.de/zb/kfk-berichte/KFK5255.pdf
14 (NEA costs) OECD/IEA-NEA 2010, Projected costs of Generating Electricity, Table 3.7
15 (Footprint) http://www.nei.org/News-Media/News/News-Archives/Nuclear-Power-Plants-Are-Compact,-Efficient-and-Re
16 (Materials EPR) http://quille-industrie.com/metiers/nucleaire/centrale-electronucleaire-epr-flamanville
17 ((Hirshberg) http://www.sfen.org/fr/nuclear-for-climate and http://www.sauvonsleclimat.org/images/articles/pdf_files/ec_2008/Hirschberg.pdf slide 12
18 (Hansen Tax) See, for example http://www.worldwatch.org/node/5962
19 (Kharecha mortality) Pushker A. Kharecha* and James E. Hansen, Prevented Mortality and
Greenhouse Gas Emissions from Historical and Projected Nuclear Power,Environ. Sci. Technol., 2013,
47 (9), pp 4889–4895
20(Nifenecker risk)Hervé Nifenecker , A review of post-nuclear-catastrophe management , Reports on
Progress in Physics, Volume 78, Number 7
21(Brook)Brook, B.W. & Bradshaw, C.J.A. (2015) Key role for nuclear energy in global
biodiversity conservation. Conservation Biology, 29, 702-712. doi: 10.1111/cobi.12433

22 (Forbes) http://www.forbes.com/sites/jamesconca/2012/06/10/energys-deathprint-a-price-always-paid/
23 (Guillemin) Thesis Perrine Guillemin : Recherche de la haute conversion en cycle Thorium dans les
réacteurs PHWR et REP, Tab.2.7
24 (IFR) https://en.wikipedia.org/wiki/Integral_fast_reactor
Recommended