How extreme was the October 2015
precipitation event in South Carolina?
Peng Gao, Greg Carbone, Junyu LuDepartment of Geography
University of South Carolina
How extreme?
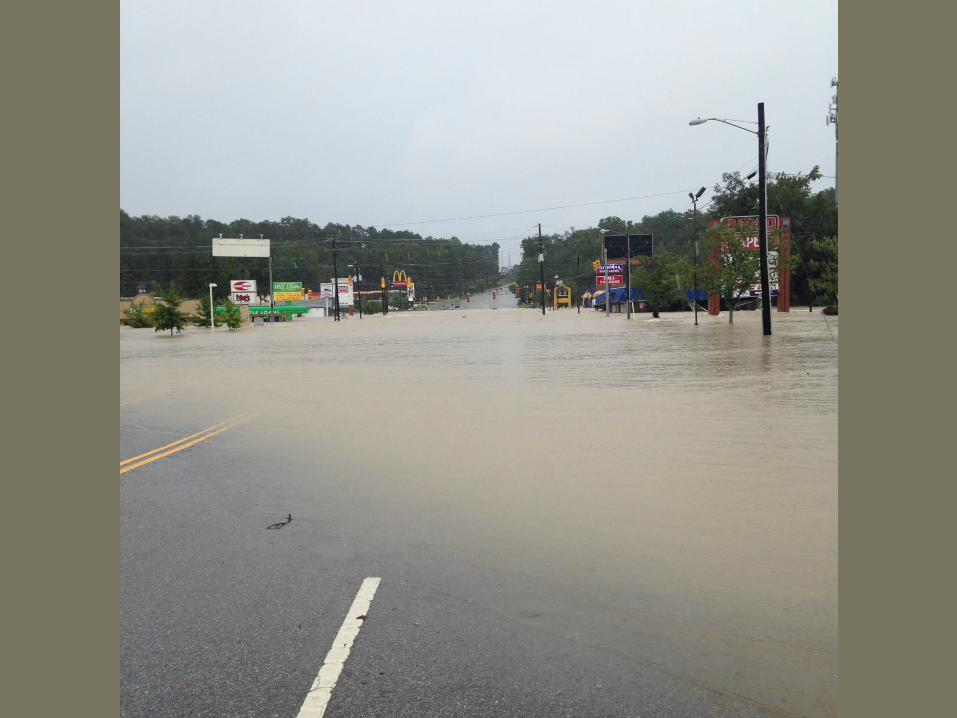
• Intensity-Duration-Frequency (IDF) Curves
0
5
10
15
20
25
30
35
2 5
10 20 25 30 40 50 60 70 80 90
100
200
400
500
600
800
1000
De
pth
(in
)
Return Period (Years)
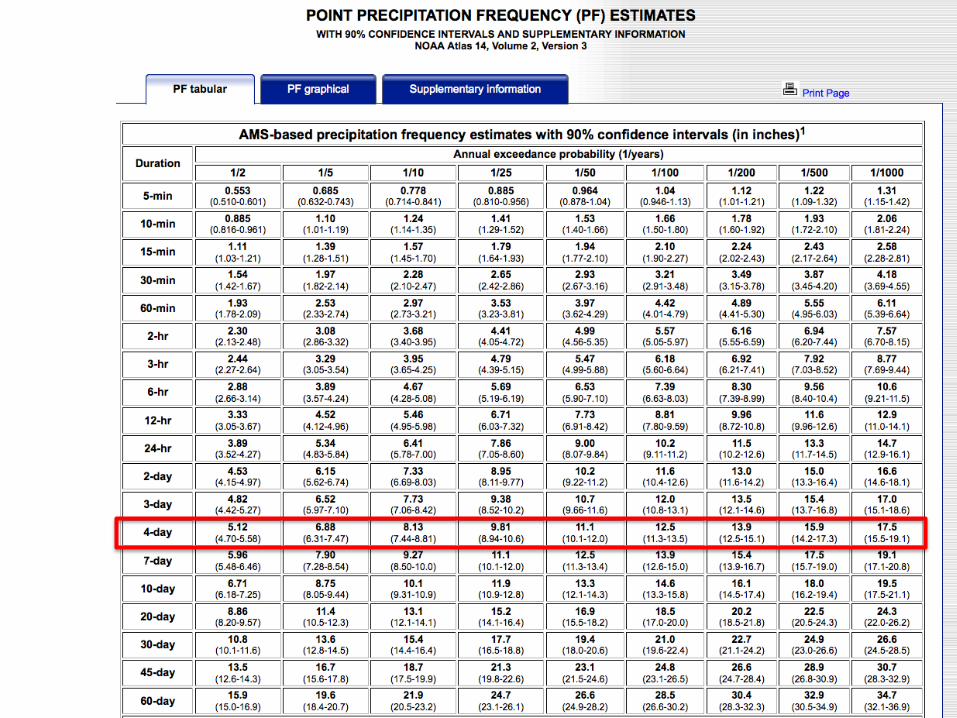
Four Day Total• A station received
18 inch rainfall in four consecutive days
• Duration: 4 days
• Probability: 1/400 –1/200
How extreme?
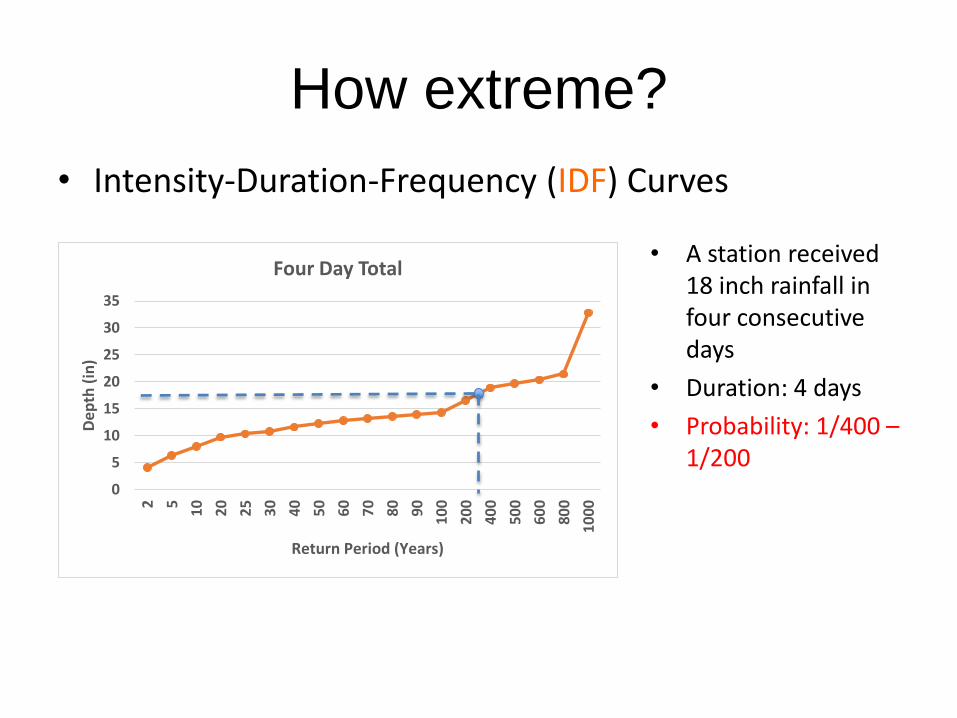
Atlas 14:
• NOAA’s precipitation frequency estimates
• Engineering standard
2-5 Oct 2015
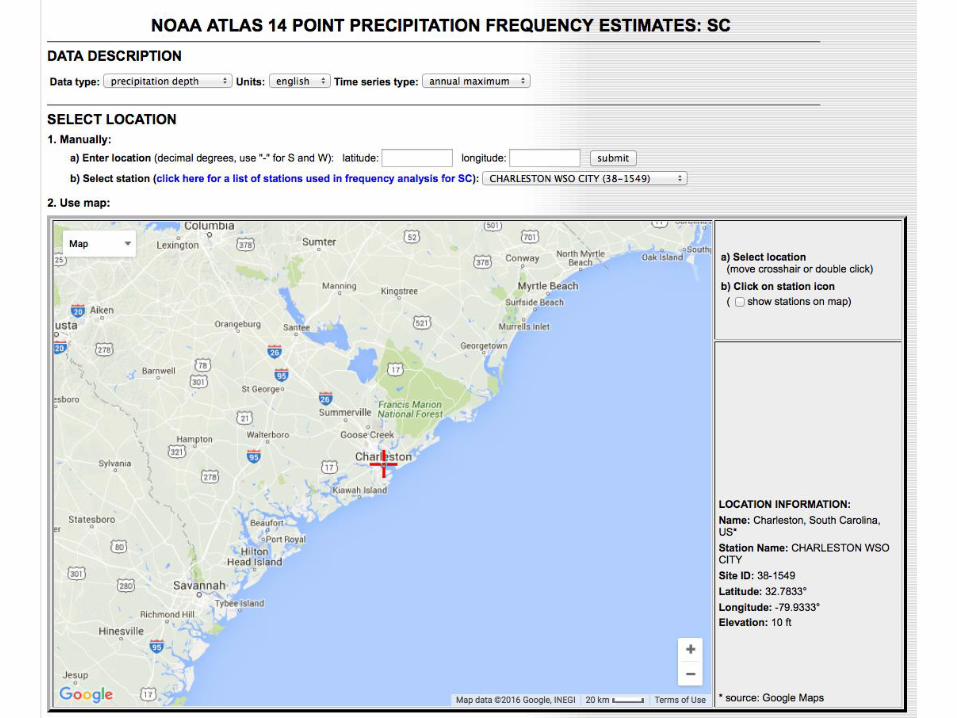

NOAA Atlas 14
• Engineering standard
• Point based
• Interpolation: smoothing effect
• Spatial resolution: 0.5 mile
• Volume in a basin matters

Do individual stations tell us enough?
KCHS (16.2)
Cooper (mean: 19.1)
Lower Santee/ Lower Pee
Dee (mean: 18.5)
Daily PRISM data: 4*4 km grids (Parameter-
elevation Relationships on Independent Slopes Model)

Historic extreme precipitation events in Cooper Basin
2-5 October 201510-13 October 1990
1265 sq. mi179 grids (4*4 km)
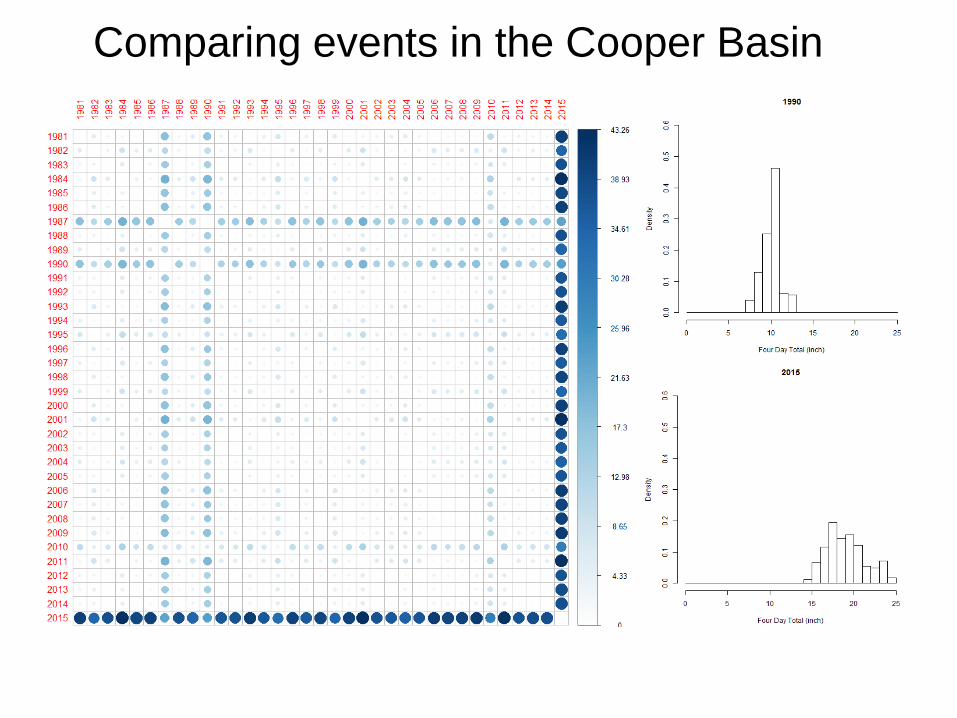
Comparing events in the Cooper Basin
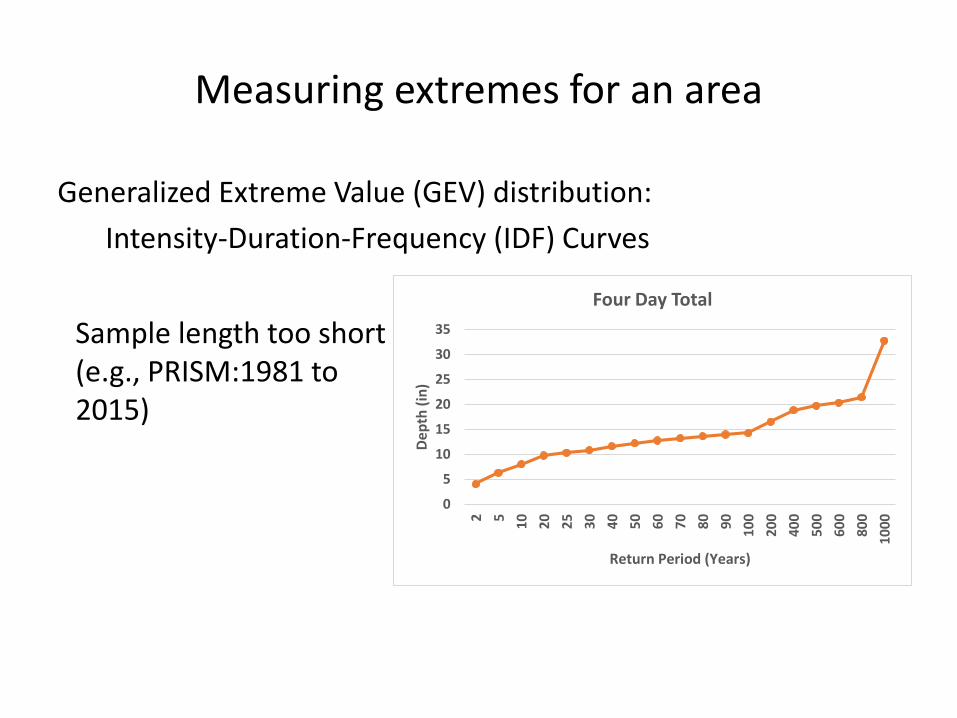
Measuring extremes for an area
Generalized Extreme Value (GEV) distribution:
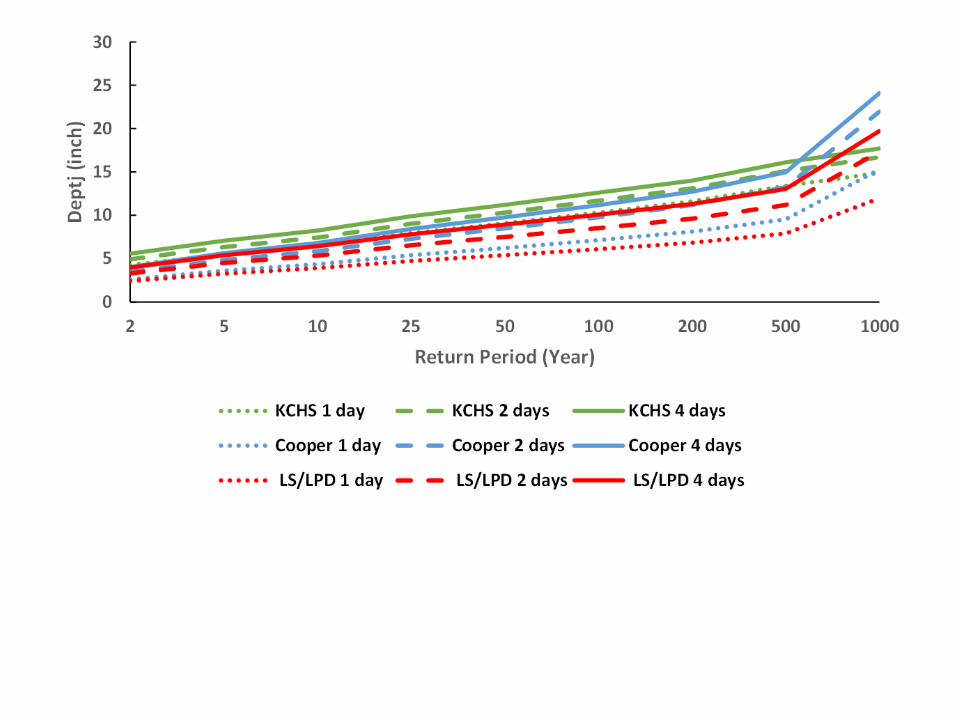
Intensity-Duration-Frequency (IDF) Curves
0
5
10
15
20
25
30
35
2 5
10 20 25 30 40 50 60 70 80 90
100
200
400
500
600
800
1000
De
pth
(in
)
Return Period (Years)
Four Day Total
Sample length too short (e.g., PRISM:1981 to 2015)
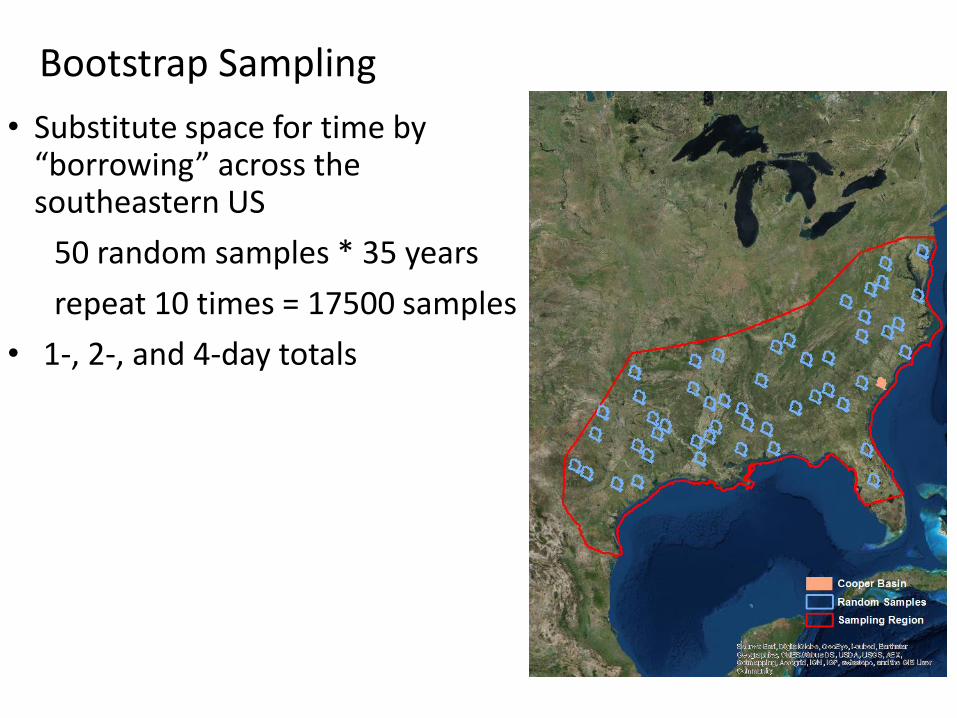
Bootstrap Sampling
• Substitute space for time by “borrowing” across the southeastern US
50 random samples * 35 years
repeat 10 times = 17500 samples
• 1-, 2-, and 4-day totals
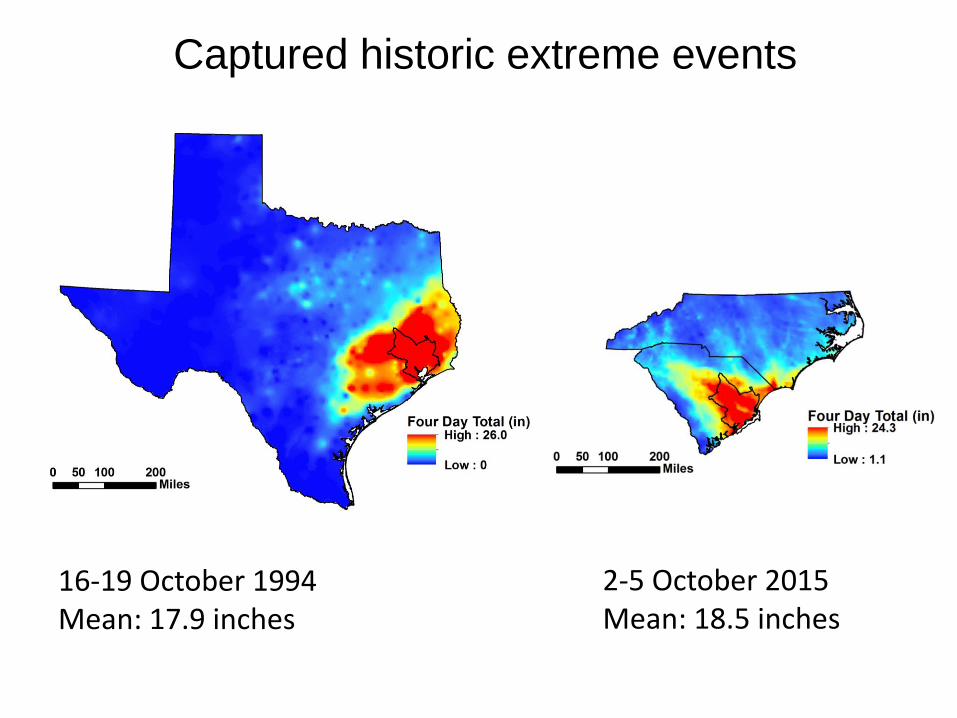
16-19 October 1994Mean: 17.9 inches
2-5 October 2015Mean: 18.5 inches
Captured historic extreme events

How extreme: a station vs. an area?
KCHS (16.2)
Cooper (mean: 19.1)
Lower Santee/ Lower Pee
Dee (mean: 18.5)
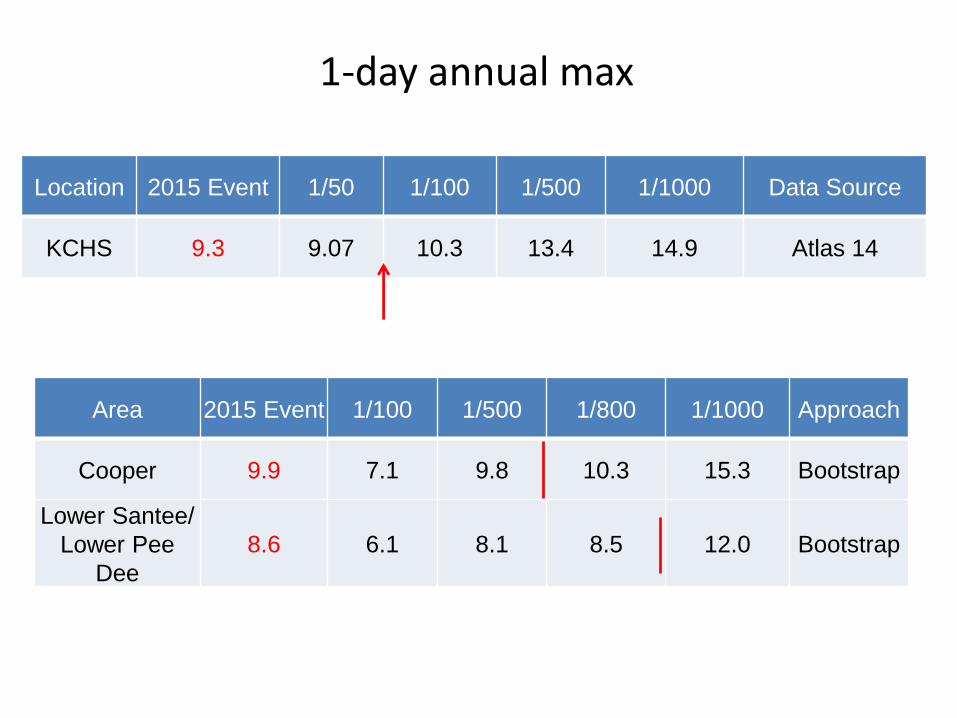
1-day annual max
Location 2015 Event 1/50 1/100 1/500 1/1000 Data Source
KCHS 9.3 9.07 10.3 13.4 14.9 Atlas 14
Area 2015 Event 1/100 1/500 1/800 1/1000 Approach
Cooper 9.9 7.1 9.8 10.3 15.3 Bootstrap
Lower Santee/
Lower Pee
Dee
8.6 6.1 8.1 8.5 12.0 Bootstrap
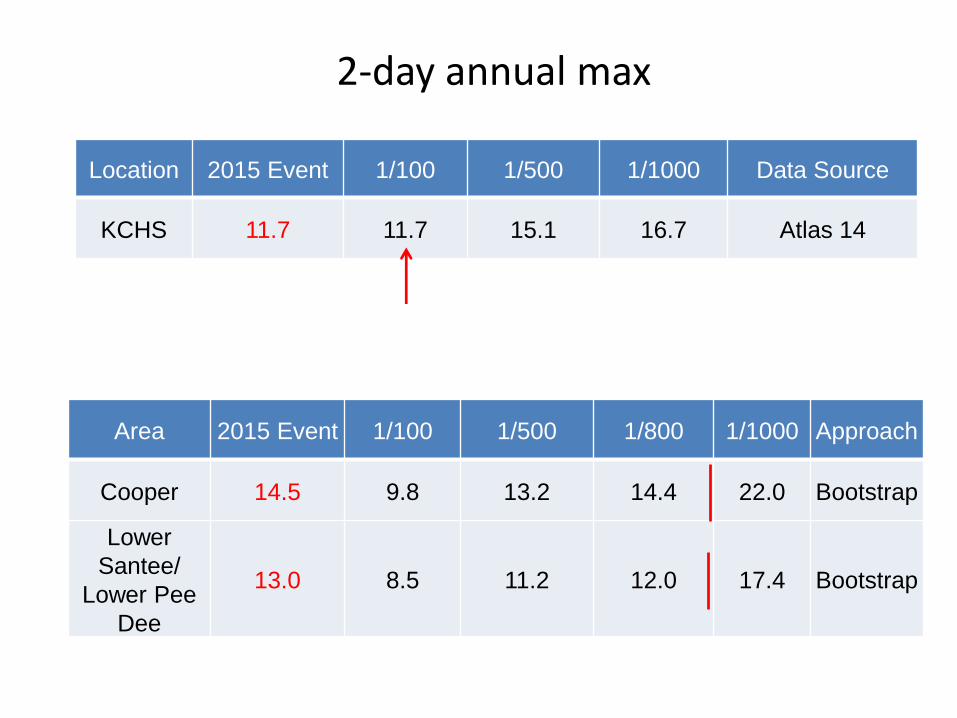
Location 2015 Event 1/100 1/500 1/1000 Data Source
KCHS 11.7 11.7 15.1 16.7 Atlas 14
Area 2015 Event 1/100 1/500 1/800 1/1000 Approach
Cooper 14.5 9.8 13.2 14.4 22.0 Bootstrap
Lower
Santee/
Lower Pee
Dee
13.0 8.5 11.2 12.0 17.4 Bootstrap
2-day annual max
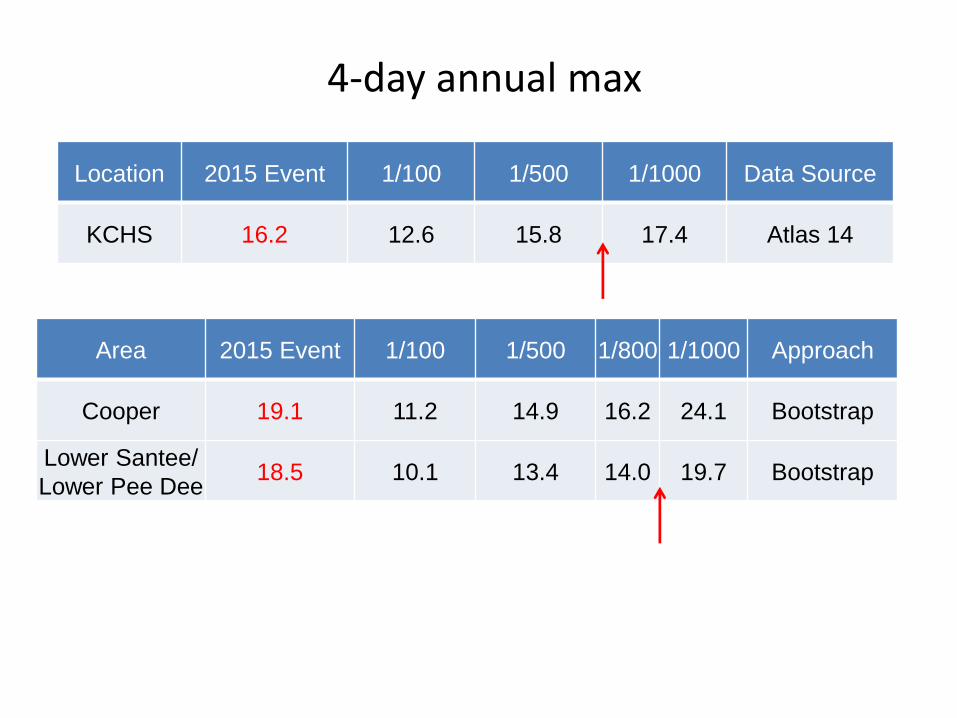
Area 2015 Event 1/100 1/500 1/800 1/1000 Approach
Cooper 19.1 11.2 14.9 16.2 24.1 Bootstrap
Lower Santee/
Lower Pee Dee18.5 10.1 13.4 14.0 19.7 Bootstrap
4-day annual max
Location 2015 Event 1/100 1/500 1/1000 Data Source
KCHS 16.2 12.6 15.8 17.4 Atlas 14
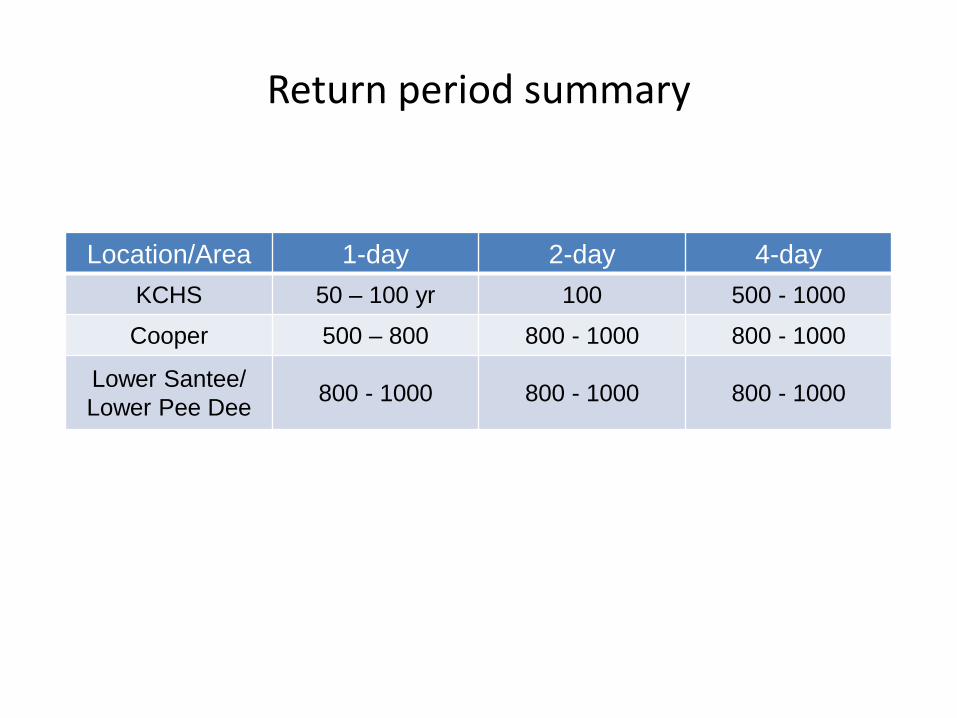
Return period summary
Location/Area 1-day 2-day 4-day
KCHS 50 – 100 yr 100 500 - 1000
Cooper 500 – 800 800 - 1000 800 - 1000
Lower Santee/
Lower Pee Dee800 - 1000 800 - 1000 800 - 1000
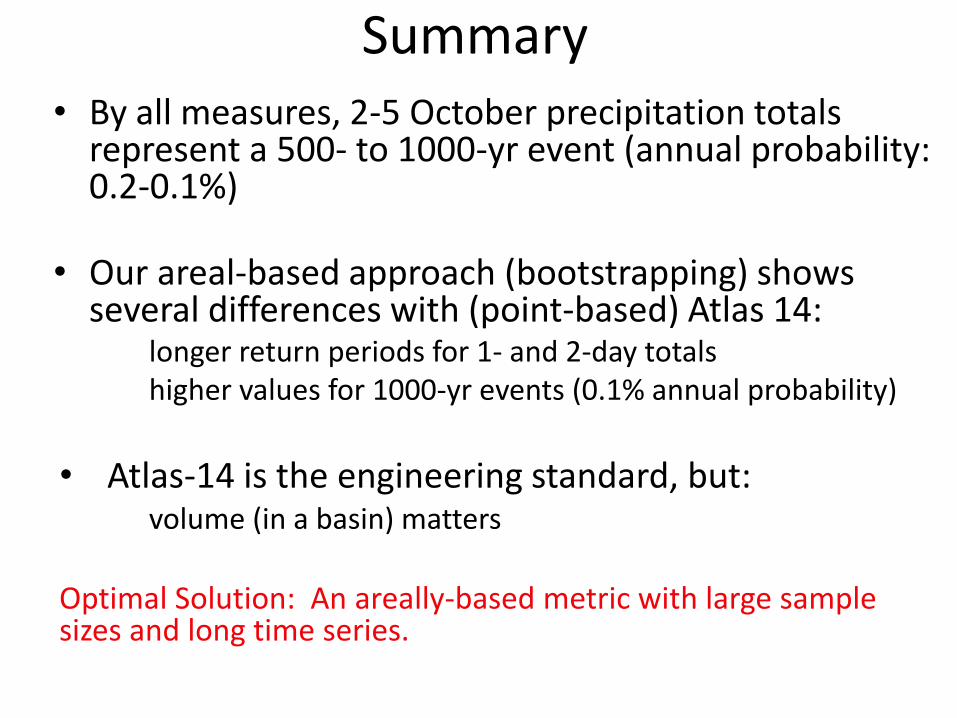
Summary• By all measures, 2-5 October precipitation totals
represent a 500- to 1000-yr event (annual probability: 0.2-0.1%)
• Our areal-based approach (bootstrapping) shows several differences with (point-based) Atlas 14:
longer return periods for 1- and 2-day totalshigher values for 1000-yr events (0.1% annual probability)
• Atlas-14 is the engineering standard, but:volume (in a basin) matters
Optimal Solution: An areally-based metric with large sample sizes and long time series.

100 year 500 year 1000 year total number of samples for 10 sets
Cooper 1 day 160 17 0 17500Cooper 2 days 159 22 0Cooper 4 days 150 28 0
LS/LPD 1 day 93 11 0 10500LS/LPD 2 days 111 10 0LS/LPD 4 days 94 21 0
Recommended