Household Consumer Perceptions of the energy market
Wave 4: July 2019
Contents
Background and method
Sample profile
Satisfaction with supplier
Complaints
Tariffs and information provision
Switching
1
2
3
4
5
6
The price cap7
Smart Meters8

Background and method
4
Background
This report presents findings from a tracking survey commissioned jointly by Ofgem and Citizens Advice.
The Gas and Electricity Markets Authority (GEMA) is the regulator of Britain’s gas and electricity markets, and its principal
objective is to protect the interests of both current and future consumers. Ofgem carries out the day to day functions of GEMA.
Citizens Advice helps millions of people every year to find a way forward, across all sectors, whatever their problems. This
informs its role as the statutory energy consumer advocate, fighting for the best outcomes for current and future consumers.
The tracker is a representative survey of domestic energy bill-payers and provides Ofgem and Citizens Advice
with ongoing measures of consumer engagement in and experiences of the energy market.
5
Methodology
Data was collected using a mixed-mode survey of 3,206 domestic energy bill-payers in Great Britain (GB). Fieldwork was
carried out using:
An Online survey via a commercial online panel (n = 2,906)
A Face-to-face in-home survey with the digitally excluded population (n = 300). Participants were considered to be digitally excluded if
they did not have access to the internet or had not used the internet in the previous six months.
All participants were responsible (solely or jointly) for the energy bills in their household or for choosing their energy
supplier.
The survey used quotas to achieve a sample representative of the GB bill-payer population. Quotas were set on age,
gender, social grade and region. Data were weighted to the known profile of the GB population. Quotas (other than
gender) were based on census Household Reference Person (HRP)*, as a proxy for bill-payer.
* Link to explanation of the Household Reference Person

6
Fieldwork Dates
Fieldwork dates for each of the four waves of the survey completed are indicated
below:
Fieldwork Wave 1 (‘Q4 2018’)
Wave 2 (‘Q1 2019’)
Wave 3 (‘Q2 2019’)
Wave 4 (‘Q3 2019’)
Online 24th October –11th November
29th January –6th February
26th March -15th April 2019
3rd July - 17th
July 2019
Face-to-Face 24th October –13th November
31st January –17th February
1st – 16th April 2019
1st July – 23rd
July 2019
7
Comparisons between survey waves
This report presents results for the fourth tracking wave (Q3 2019)
As the survey involved sampling a selection, rather than the whole population, of energy consumers, confidence
intervals apply to the results. These confidence intervals indicate, for a given sample size and a given survey result, the
degree of confidence we can have that the survey result is real and not due to random chance. For the total sample on
which these results are based (n=3,206), there is a confidence interval of +/-2% (i.e. a survey result of 50% could lie
between 48% and 52%).
Confidence intervals also apply when comparing results between waves. Where there are statistically significant
differences in findings to previous waves (i.e. we have statistical confidence that a real change has occurred), these are
indicated. Where only wave three results are shown, there are no statistically significant differences in findings from
previous waves.
All measures of statistical significance have been tested at the 95% confidence level.

Sample profile
9
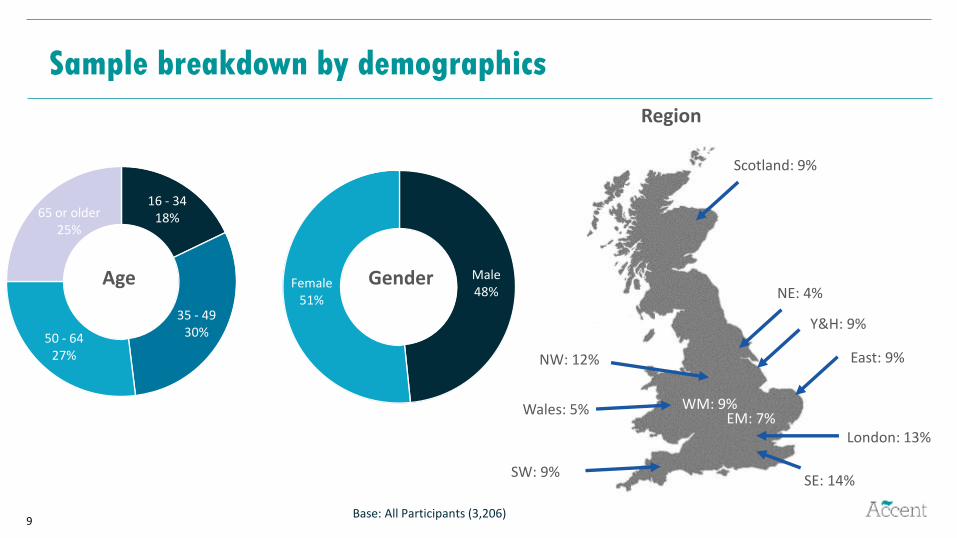
Male48%
Female51%
16 - 3418%
35 - 4930%50 - 64
27%
65 or older25%
Sample breakdown by demographics
Base: All Participants (3,206)
SW: 9%
Wales: 5%
NW: 12%
NE: 4%
East: 9%
London: 13%
SE: 14%
Scotland: 9%
Y&H: 9%
EM: 7%WM: 9%
GenderAge
Region

Satisfaction with supplier

Very dissatisfied3%
Dissatisfied4%
Neither satisfied nor dissatisfied
17%
Satisfied40%
Very satisfied
35%
Unsure1%
As with previous quarters, the following
groups have higher satisfaction:
Pay by direct debit (76%) vs PPM*
(68%)
On fixed tariff (79%) vs 71% SVT
Aged 65+ (82%) vs aged 16-64 (72%)
Medium tier (78%) vs 73% largest six
Haven't contacted supplier in the last 3
months (78%) vs made contact (70%)
Switched tariff or supplier before
(76%) vs never switched (69%)
Overall satisfaction with supplier
Overall, how satisfied or dissatisfied are you with (...) as your supplier of (gas/electricity/gas and electricity)?Base: All Participants (3,206)
74% are satisfied with supplier
* PPM = Pre-payment meter
A net of 74% are very satisfied or
satisfied

Key service quality measures over time
Most service measures have been consistent over the past year, although ratings of the quality of telephone service have marginally declined and there is inconsistency in the quality of the complaints handling process. This quarter satisfaction with the outcomes of complaints is at a tracker low.
74
%
72
%
73
%
78
%
76
%
75
%
75
%
38
%
72
%
73
%
75
%
75
%
65
% 76
%
72
%
74
%
73
%
27
%
71
%
72
%
71
%
73
%
67
%
73
%
72
%
72
%
72
%
37
%
72
%
72
%
73
%
74
%
67
% 76
%
73
%
72
%
76
%
35
%
63
%
Cu
sto
mer
serv
ice
Un
der
stan
din
go
f b
ills
Acc
ura
cy o
fb
ills
Smar
t m
ete
r
Ease
of
fin
din
gco
nta
ct d
etai
ls
Ease
of
mak
ing
con
tact
Tele
ph
on
ese
rvic
e
Emai
l ser
vice
Co
mp
lain
tsh
and
ling
pro
cess
es
The
ou
tco
me
of
you
r co
mp
lain
t
Service quality over time
Q4 2018 Q1 2019 Q2 2019 Q3 2019
Bases: Customer service (all Participants); understanding of bill and accuracy of bill (those who pay for their energy with a regular direct debit or standing order); smart meter (those with a smart meter); ease of finding contact details and ease of making contact (those who contacted or tried to contact their supplier);telephone service (those who contacted or tried to contact their supplier by phone); email service (those who contacted or tried to contact their supplier by email); complaints handling process (those who contacted or tried to contact their supplier about a complaint); outcome of the complaint (those who have reached the end of a complaints process)

There is higher satisfaction among:
Direct debit (75%) vs standard credit (64%) and PPM (65%)
The digitally excluded (85%) vs online (71%)
Those on a fixed tariff (77% vs 68% among those on an SVT)
Aged 65+ (81%) vs aged 16-64 (70%)
People who don’t have a disability (74%) vs people who do (70%)
Of these groups, the following have most consistently shown higher
satisfaction
Aged 65+ (all 4 quarters)
Pay by direct debit (Q1, Q2, Q3 2019)
Satisfaction with customer service
Overall, how dissatisfied or satisfied are you with the customer service you have received from your energy supplier?Base: All Participants (3,206)
72% are satisfied with customer service
Very dissatisfied
3%
Dissatisfied4%
Neither satisfied nor dissatisfied
19%
Satisfied38%
Very satisfied34%
Unsure1%
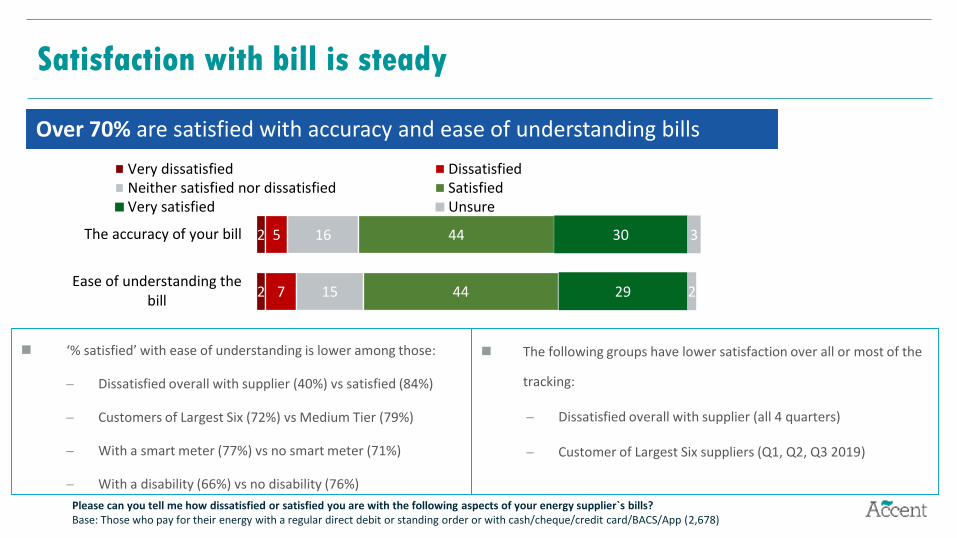
2
2
7
5
15
16
44
44
29
30
2
3
Ease of understanding thebill
The accuracy of your bill
Very dissatisfied DissatisfiedNeither satisfied nor dissatisfied SatisfiedVery satisfied Unsure
‘% satisfied’ with ease of understanding is lower among those:
Dissatisfied overall with supplier (40%) vs satisfied (84%)
Customers of Largest Six (72%) vs Medium Tier (79%)
With a smart meter (77%) vs no smart meter (71%)
With a disability (66%) vs no disability (76%)
Satisfaction with bill is steady
Please can you tell me how dissatisfied or satisfied you are with the following aspects of your energy supplier`s bills? Base: Those who pay for their energy with a regular direct debit or standing order or with cash/cheque/credit card/BACS/App (2,678)
Over 70% are satisfied with accuracy and ease of understanding bills
The following groups have lower satisfaction over all or most of the
tracking:
Dissatisfied overall with supplier (all 4 quarters)
Customer of Largest Six suppliers (Q1, Q2, Q3 2019)
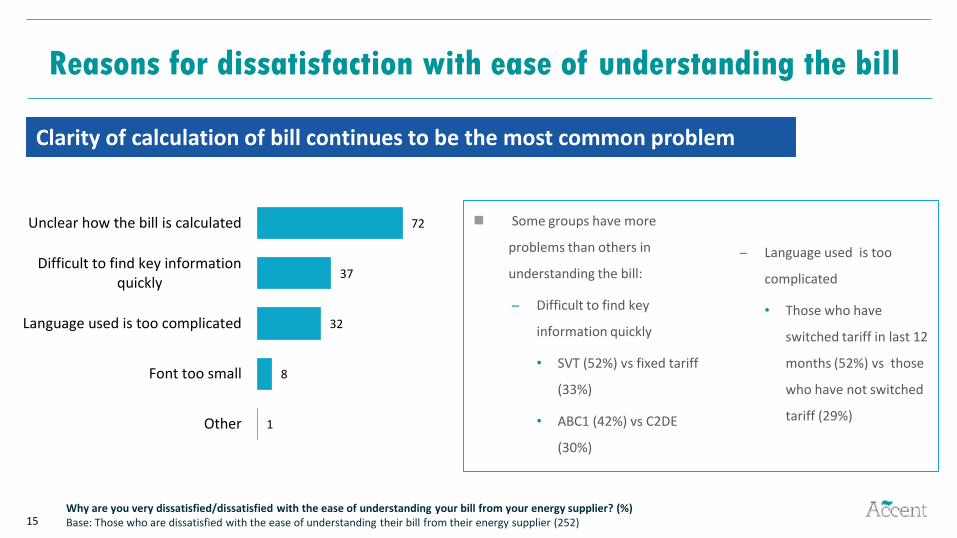
15
Some groups have more
problems than others in
understanding the bill:
Difficult to find key
information quickly
• SVT (52%) vs fixed tariff
(33%)
• ABC1 (42%) vs C2DE
(30%)
Language used is too
complicated
• Those who have
switched tariff in last 12
months (52%) vs those
who have not switched
tariff (29%)1
8
32
37
72
Other
Font too small
Language used is too complicated
Difficult to find key informationquickly
Unclear how the bill is calculated
Reasons for dissatisfaction with ease of understanding the bill
Why are you very dissatisfied/dissatisfied with the ease of understanding your bill from your energy supplier? (%)Base: Those who are dissatisfied with the ease of understanding their bill from their energy supplier (252)
Clarity of calculation of bill continues to be the most common problem
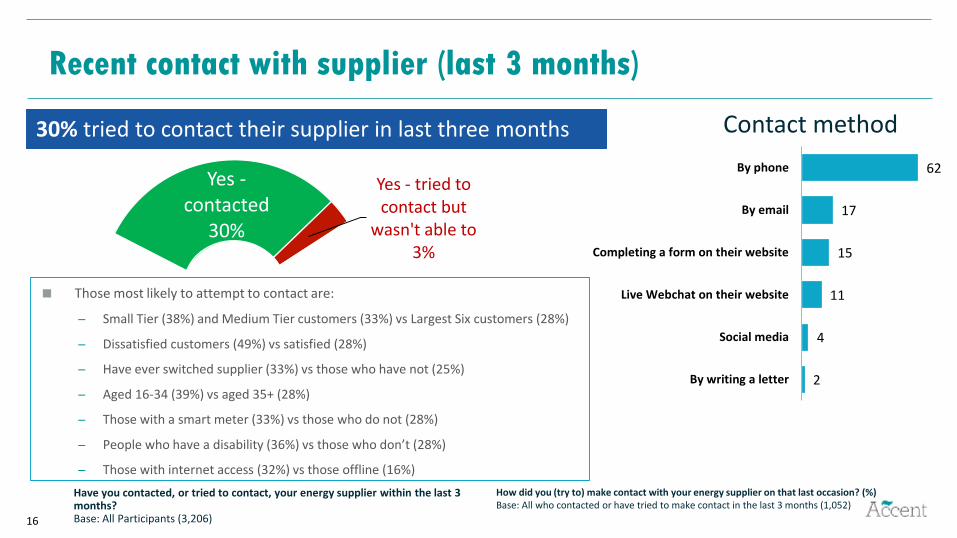
16
Yes -contacted
30%
Yes - tried to contact but
wasn't able to3%
30% tried to contact their supplier in last three months
Recent contact with supplier (last 3 months)
Those most likely to attempt to contact are:
Small Tier (38%) and Medium Tier customers (33%) vs Largest Six customers (28%)
Dissatisfied customers (49%) vs satisfied (28%)
Have ever switched supplier (33%) vs those who have not (25%)
Aged 16-34 (39%) vs aged 35+ (28%)
Those with a smart meter (33%) vs those who do not (28%)
People who have a disability (36%) vs those who don’t (28%)
Those with internet access (32%) vs those offline (16%)
Have you contacted, or tried to contact, your energy supplier within the last 3 months?Base: All Participants (3,206)
Contact method
How did you (try to) make contact with your energy supplier on that last occasion? (%)Base: All who contacted or have tried to make contact in the last 3 months (1,052)
2
4
11
15
17
62
By writing a letter
Social media
Live Webchat on their website
Completing a form on their website
By email
By phone

17
24
25
13
22
5
Ease of making last contact with supplier (among those who prefer each contact method)
Social media found to be the easiest contact method
In contrast to Q2 2019, there are no differences by supplier size
Have not tried to contact in this way
Thinking about the last time you tried to contact your energy supplier how easy or difficult did you find it to contact them in this way? Base: All Participants (3,206)
N.B. Neutral and ‘Don’t know’ responses are not shown
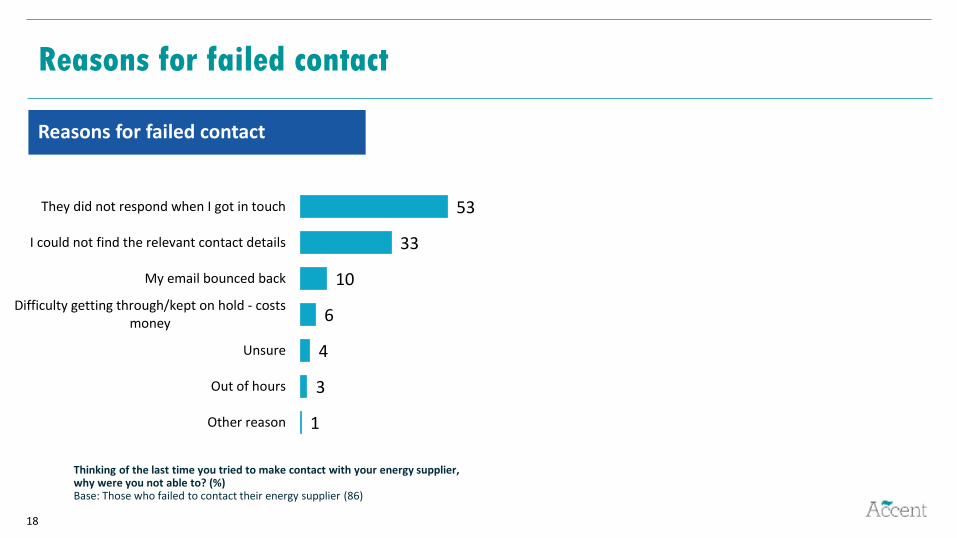
18
Reasons for failed contact
Reasons for failed contact
Thinking of the last time you tried to make contact with your energy supplier, why were you not able to? (%)Base: Those who failed to contact their energy supplier (86)
1
3
4
6
10
33
53
Other reason
Out of hours
Unsure
Difficulty getting through/kept on hold - costsmoney
My email bounced back
I could not find the relevant contact details
They did not respond when I got in touch
19
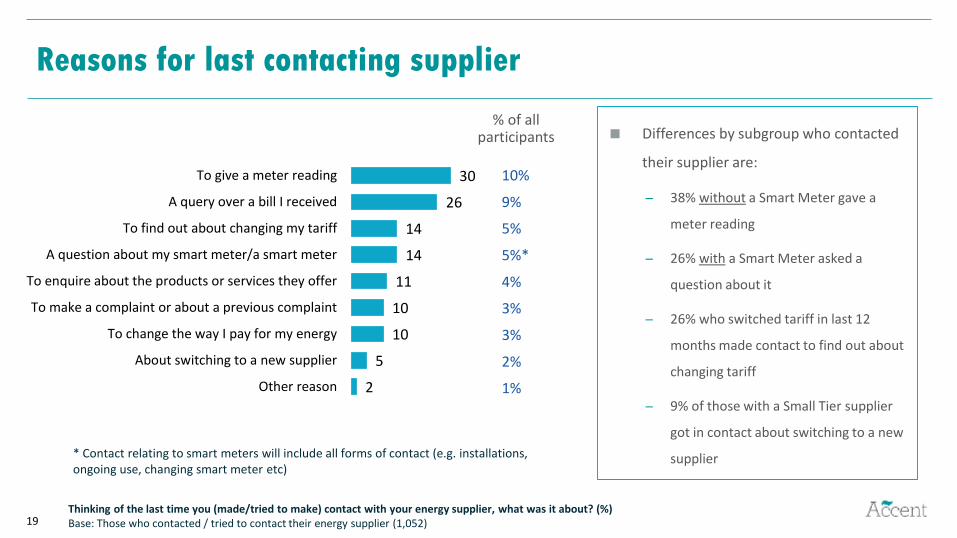
Reasons for last contacting supplier
% of all participants
Thinking of the last time you (made/tried to make) contact with your energy supplier, what was it about? (%)Base: Those who contacted / tried to contact their energy supplier (1,052)
10%
9%
5%
5%*
4%
3%
3%
2%
1%
* Contact relating to smart meters will include all forms of contact (e.g. installations, ongoing use, changing smart meter etc)
Differences by subgroup who contacted
their supplier are:
38% without a Smart Meter gave a
meter reading
26% with a Smart Meter asked a
question about it
26% who switched tariff in last 12
months made contact to find out about
changing tariff
9% of those with a Small Tier supplier
got in contact about switching to a new
supplier
2
5
10
10
11
14
14
26
30
Other reason
About switching to a new supplier
To change the way I pay for my energy
To make a complaint or about a previous complaint
To enquire about the products or services they offer
A question about my smart meter/a smart meter
To find out about changing my tariff
A query over a bill I received
To give a meter reading

Complaints
21
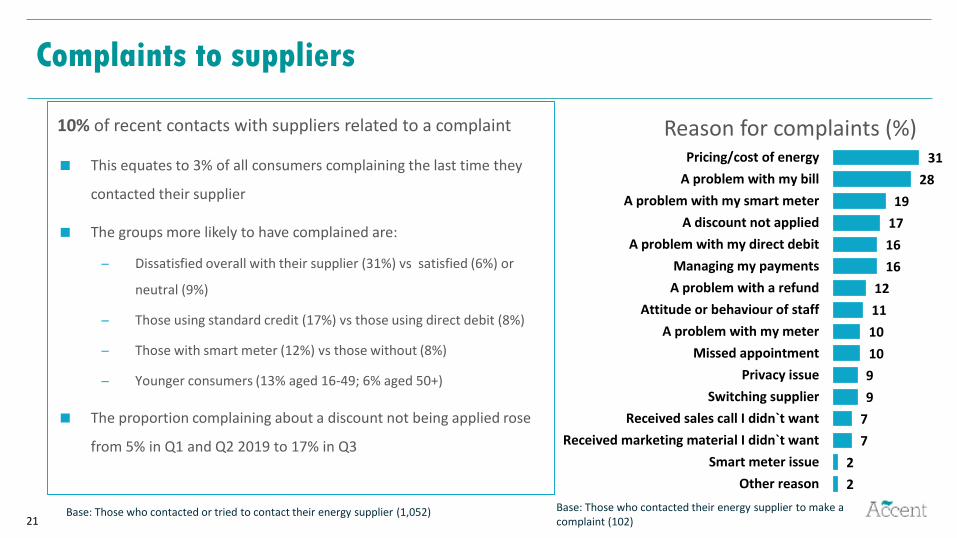
Complaints to suppliers
Reason for complaints (%)
Base: Those who contacted their energy supplier to make a complaint (102)
Base: Those who contacted or tried to contact their energy supplier (1,052)
10% of recent contacts with suppliers related to a complaint
This equates to 3% of all consumers complaining the last time they
contacted their supplier
The groups more likely to have complained are:
Dissatisfied overall with their supplier (31%) vs satisfied (6%) or
neutral (9%)
Those using standard credit (17%) vs those using direct debit (8%)
Those with smart meter (12%) vs those without (8%)
Younger consumers (13% aged 16-49; 6% aged 50+)
The proportion complaining about a discount not being applied rose
from 5% in Q1 and Q2 2019 to 17% in Q3
2
2
7
7
9
9
10
10
11
12
16
16
17
19
28
31
Other reason
Smart meter issue
Received marketing material I didn`t want
Received sales call I didn`t want
Switching supplier
Privacy issue
Missed appointment
A problem with my meter
Attitude or behaviour of staff
A problem with a refund
Managing my payments
A problem with my direct debit
A discount not applied
A problem with my smart meter
A problem with my bill
Pricing/cost of energy
22
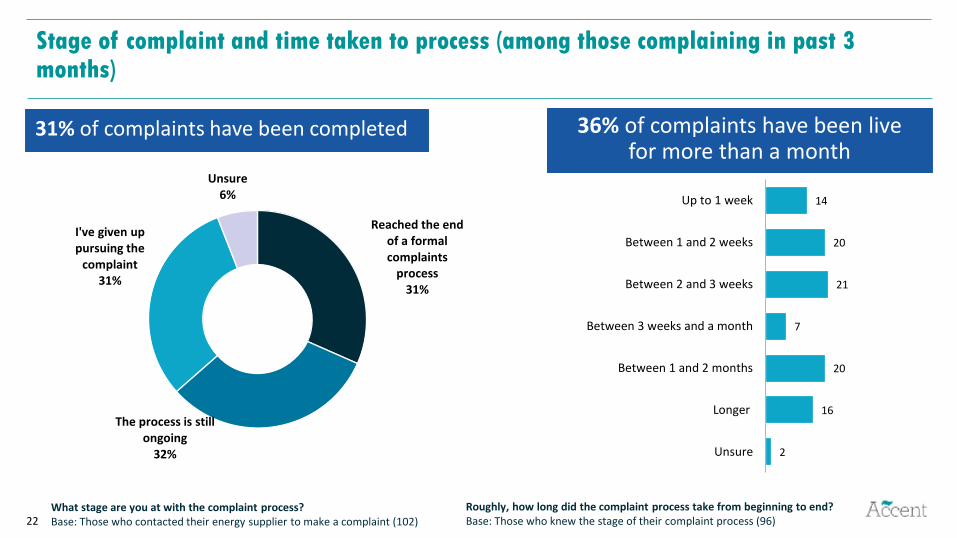
Stage of complaint and time taken to process (among those complaining in past 3 months)
What stage are you at with the complaint process?Base: Those who contacted their energy supplier to make a complaint (102)
31% of complaints have been completed
Roughly, how long did the complaint process take from beginning to end?Base: Those who knew the stage of their complaint process (96)
36% of complaints have been live for more than a month
Reached the end of a formal complaints
process31%
The process is still ongoing
32%
I've given up pursuing the
complaint31%
Unsure6%
2
16
20
7
21
20
14
Unsure
Longer
Between 1 and 2 months
Between 3 weeks and a month
Between 2 and 3 weeks
Between 1 and 2 weeks
Up to 1 week
23
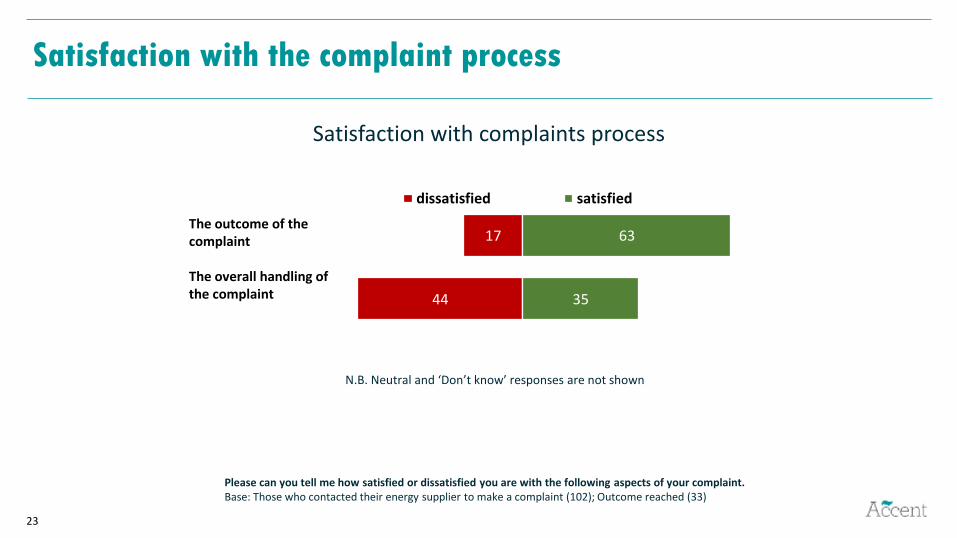
Satisfaction with the complaint process
Satisfaction with complaints process
Please can you tell me how satisfied or dissatisfied you are with the following aspects of your complaint. Base: Those who contacted their energy supplier to make a complaint (102); Outcome reached (33)
N.B. Neutral and ‘Don’t know’ responses are not shown
44
17
35
63
dissatisfied satisfied
The outcome of the complaint
The overall handling of the complaint
Tariffs and information provision
25
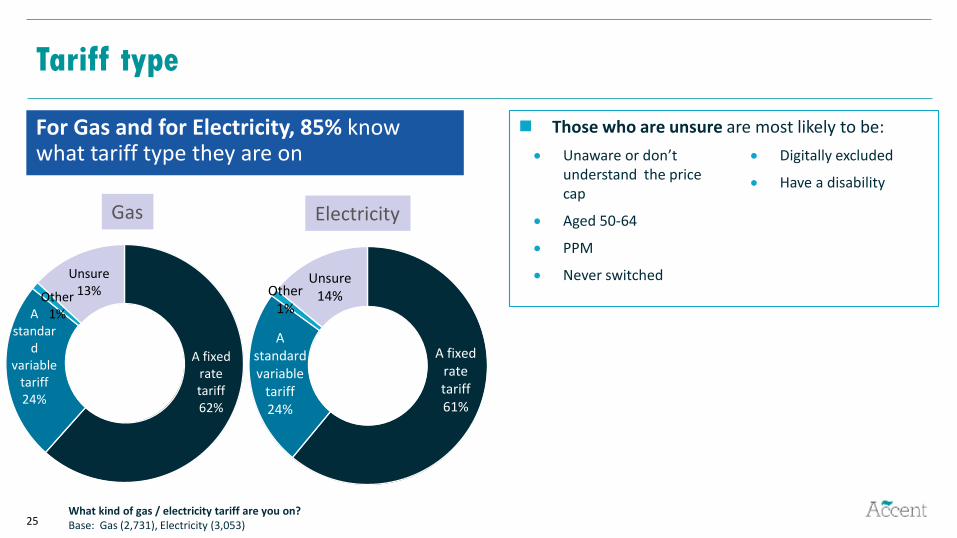
Tariff type
For Gas and for Electricity, 85% know what tariff type they are on
What kind of gas / electricity tariff are you on?Base: Gas (2,731), Electricity (3,053)
Gas Electricity
Unaware or don’t understand the price cap
Aged 50-64
PPM
Never switched
Digitally excluded
Have a disability
A fixed rate tariff62%
A standar
d variable
tariff24%
Other1%
Unsure13%
A fixed rate tariff61%
A standard variable
tariff24%
Other1%
Unsure14%
Those who are unsure are most likely to be:
26
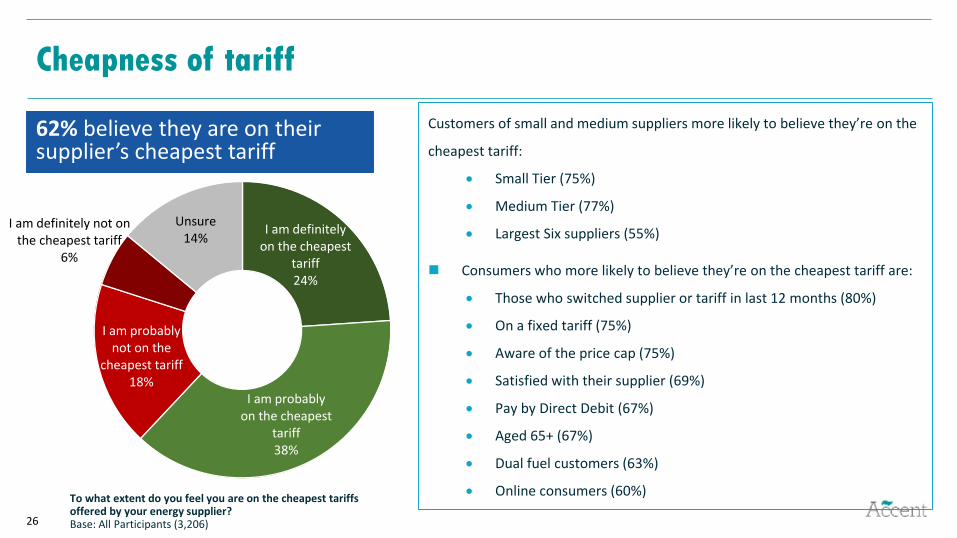
Cheapness of tariff
62% believe they are on their supplier’s cheapest tariff
Customers of small and medium suppliers more likely to believe they’re on the
cheapest tariff:
Small Tier (75%)
Medium Tier (77%)
Largest Six suppliers (55%)
Consumers who more likely to believe they’re on the cheapest tariff are:
Those who switched supplier or tariff in last 12 months (80%)
On a fixed tariff (75%)
Aware of the price cap (75%)
Satisfied with their supplier (69%)
Pay by Direct Debit (67%)
Aged 65+ (67%)
Dual fuel customers (63%)
Online consumers (60%) To what extent do you feel you are on the cheapest tariffs offered by your energy supplier?Base: All Participants (3,206)
I am definitely on the cheapest
tariff24%
I am probably on the cheapest
tariff38%
I am probably not on the
cheapest tariff18%
I am definitely not on the cheapest tariff
6%
Unsure14%
27
6
5
3
4
4
7
18
40
40
43
43
38
43
41
52
50
50
50
56
47
38
What information you…
What to do if you need…
What to do if you want to…
How to make a complaint
What to do in an…
The choice of energy tariffs…
Notification of a price…
Not well Fairly well Very well
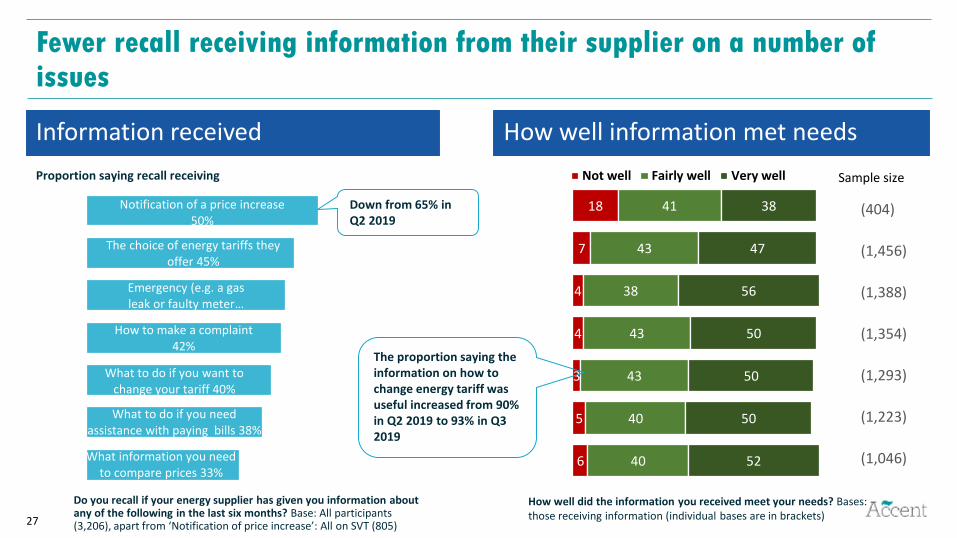
What information you need to compare prices 33%
What to do if you need assistance with paying bills 38%
What to do if you want to change your tariff 40%
How to make a complaint 42%
Emergency (e.g. a gas leak or faulty meter …
The choice of energy tariffs they offer 45%
Notification of a price increase 50%
Fewer recall receiving information from their supplier on a number of issues
Information received How well information met needs
Do you recall if your energy supplier has given you information about any of the following in the last six months? Base: All participants (3,206), apart from ‘Notification of price increase’: All on SVT (805)
How well did the information you received meet your needs? Bases: those receiving information (individual bases are in brackets)
(404)
(1,046)
(1,223)
(1,293)
(1,354)
(1,388)
(1,456)
Proportion saying recall receiving
The proportion saying the information on how to change energy tariff was useful increased from 90% in Q2 2019 to 93% in Q3 2019
Down from 65% in Q2 2019
Sample size
Switching
29
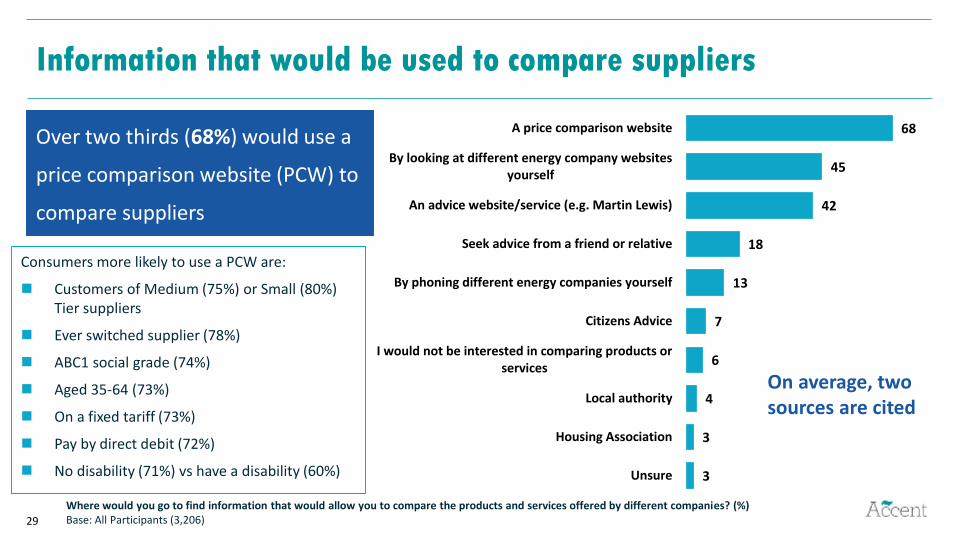
3
3
4
6
7
13
18
42
45
68
Unsure
Housing Association
Local authority
I would not be interested in comparing products orservices
Citizens Advice
By phoning different energy companies yourself
Seek advice from a friend or relative
An advice website/service (e.g. Martin Lewis)
By looking at different energy company websitesyourself
A price comparison website
Where would you go to find information that would allow you to compare the products and services offered by different companies? (%) Base: All Participants (3,206)
Information that would be used to compare suppliers
Over two thirds (68%) would use a
price comparison website (PCW) to
compare suppliers
Consumers more likely to use a PCW are:
Customers of Medium (75%) or Small (80%) Tier suppliers
Ever switched supplier (78%)
ABC1 social grade (74%)
Aged 35-64 (73%)
On a fixed tariff (73%)
Pay by direct debit (72%)
No disability (71%) vs have a disability (60%)
On average, two sources are cited
30
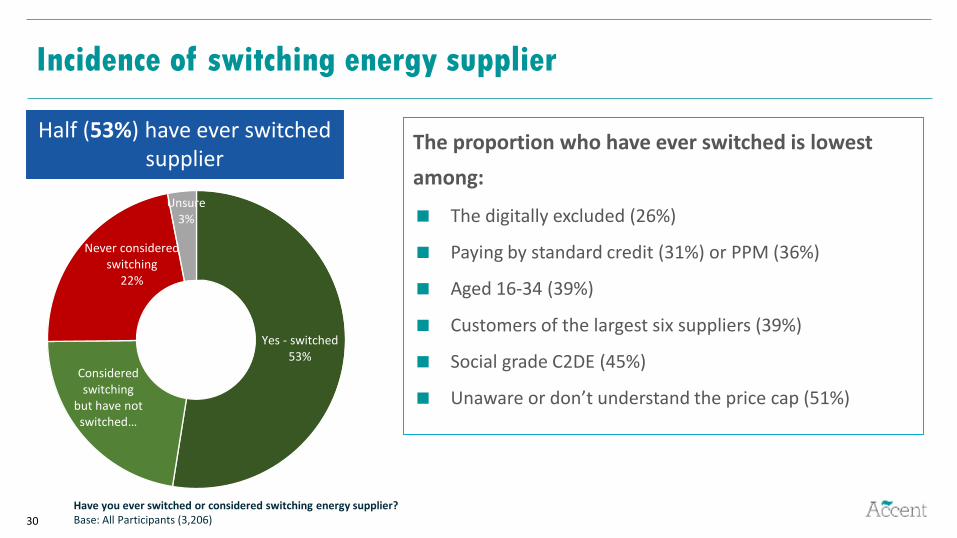
Incidence of switching energy supplier
The proportion who have ever switched is lowest
among:
The digitally excluded (26%)
Paying by standard credit (31%) or PPM (36%)
Aged 16-34 (39%)
Customers of the largest six suppliers (39%)
Social grade C2DE (45%)
Unaware or don’t understand the price cap (51%)
Have you ever switched or considered switching energy supplier?Base: All Participants (3,206)
Half (53%) have ever switched supplier
Yes - switched53%
Considered switching
but have not switched…
Never considered switching
22%
Unsure3%

31
35
23
14
8
6
13
1
Within the last year
Between 1 and 2 years ago
Between 2 and 3 years ago
Between 3 and 4 years ago
Between 4 and 5 years ago
More than 5 years ago
Unsure
19
12
7
4
3
7
Within the last year
Betwe en 1 and 2 years ago
Betwe en 2 and 3 years ago
Betwe en 3 and 4 years ago
Betwe en 4 and 5 years ago
More than 5 years ago
Last occasion switched supplier
When was the last time you switched energy supplier? (%)Base: Those who have ever switched (1,695); all Participants (3,206)
35% of those who have ever switched supplier did so in the last year
This equates to 19% of all consumers switching in the last year
Those who have ever switched
All participants

32
Reasons for choosing supplier
Once you had made the decision to switch to another energy supplier, what were the main reasons you chose the company you went with? Were there any other reasons for selecting them apart from the tariff?Base: Those who have ever switched (1,695)
2
7
1
4
6
14
14
14
14
16
30
47
57
4
2
0
1
1
2
3
3
3
5
Unsure
Other reasons
I had no particular reason for switching to them
They offered additional services beyond energy
To get a smart meter
They offered green energy
They have good customer service
They gave me an incentive for switching to them
They are a well known brand
They have a good reputation
To get a fixed term /fixed price deal
They had a good/the best tariff
They had a better tariff than my old supplier
Primary reasons Additional reasons
The key reasons for selecting a supplier are cost related.
Even when prompted with non-cost reasons, service, reputation, incentives and green tariffs are secondary considerations.

33
Use of Price Comparison Websites
67% who switched used a Price Comparison Website
The proportion using PCWs is lowest for:
The digitally excluded (8%)
PPM (43%) and standard credit (50%)
Aged 65+ (55%)
Social grade C2DE (57%)
Have a disability (59%)
Largest Six suppliers (63%)
Those with Smart Meter (64%)
On an SVT (65%)
Did you use a price comparison website to help you switch energy supplier?Base: Those who have ever switched supplier (1,695) * PCW = Price Comparison Website
Yes67%
No28%
Unsure5%
34
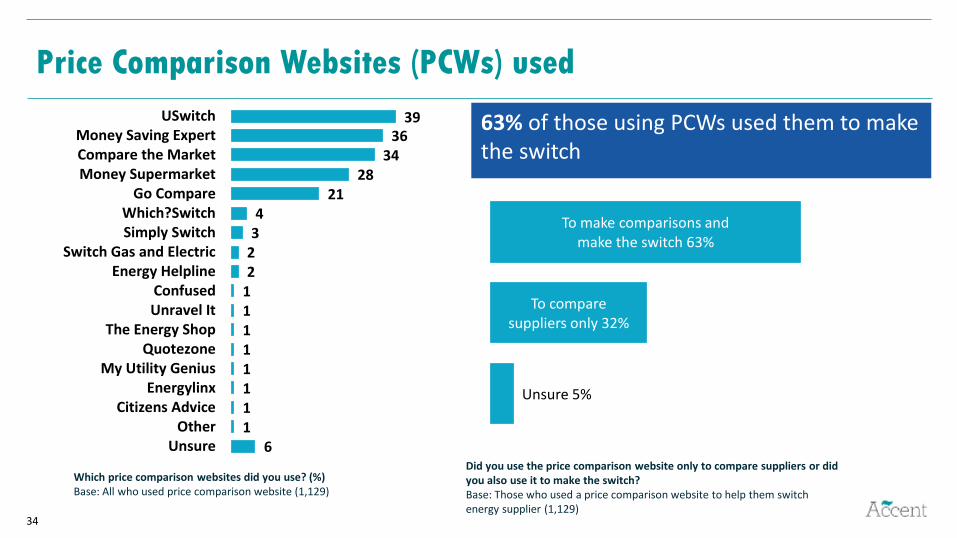
Which price comparison websites did you use? (%)Base: All who used price comparison website (1,129)
Price Comparison Websites (PCWs) used
Did you use the price comparison website only to compare suppliers or did you also use it to make the switch?Base: Those who used a price comparison website to help them switch energy supplier (1,129)
63% of those using PCWs used them to make the switch
6111111112234
2128
3436
39
UnsureOther
Citizens AdviceEnergylinx
My Utility GeniusQuotezone
The Energy ShopUnravel ItConfused
Energy HelplineSwitch Gas and Electric
Simply SwitchWhich?Switch
Go CompareMoney SupermarketCompare the MarketMoney Saving Expert
USwitch
Unsure 5%
To compare suppliers only 32%
To make comparisons and make the switch 63%
35
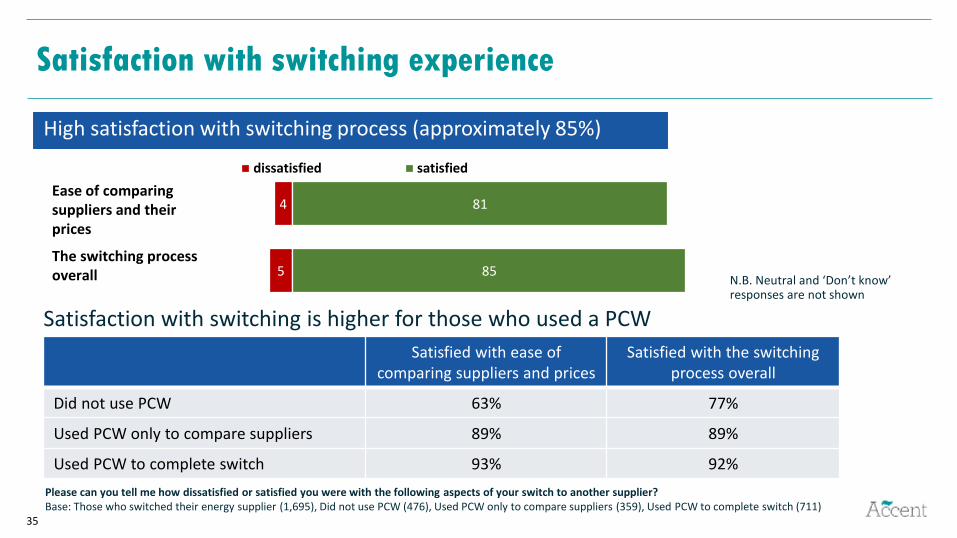
Satisfaction with switching experience
High satisfaction with switching process (approximately 85%)
Satisfaction with switching is higher for those who used a PCW
Please can you tell me how dissatisfied or satisfied you were with the following aspects of your switch to another supplier?Base: Those who switched their energy supplier (1,695), Did not use PCW (476), Used PCW only to compare suppliers (359), Used PCW to complete switch (711)
Satisfied with ease of comparing suppliers and prices
Satisfied with the switching process overall
Did not use PCW 63% 77%
Used PCW only to compare suppliers 89% 89%
Used PCW to complete switch 93% 92%
N.B. Neutral and ‘Don’t know’ responses are not shown
5
4
85
81
dissatisfied satisfied
Ease of comparing suppliers and their prices
The switching process overall

36
Consumers currently considering switching
The proportion considering switching is highest for:
Dissatisfied customers (63%)
On a mixed tariff (39%)
Aged 16-34 (27%)
Customers of Small Tier suppliers (24%)
ABC1 (23%)
Online (22%) vs digitally excluded (5%)
Little difference by whether switched before (22%
switched v 19% never switched)
Are you currently considering changing your energy supplier?Base: All Participants (3,206)
20% currently thinking of switching supplier
Yes20%
No64%
Unsure16%
The energy price cap
38
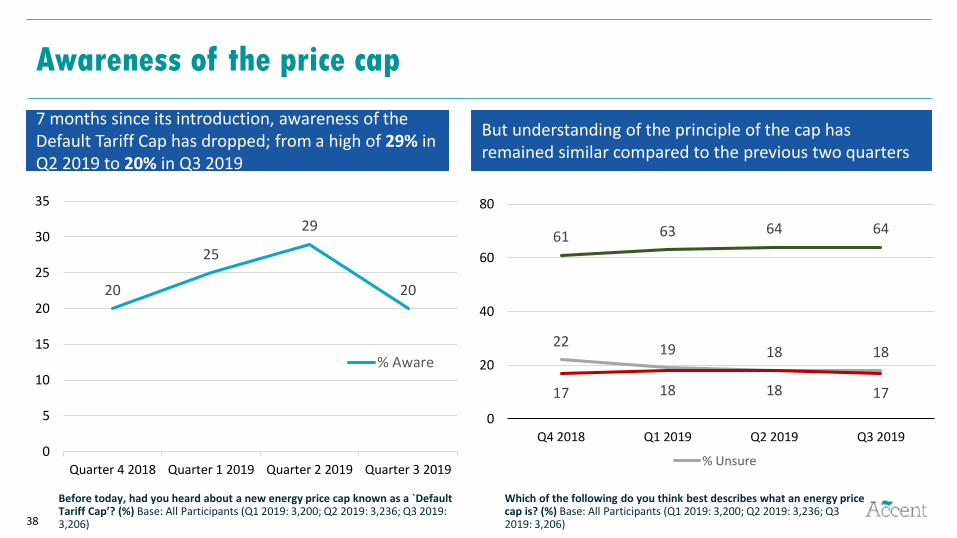
Awareness of the price cap
7 months since its introduction, awareness of the Default Tariff Cap has dropped; from a high of 29% in Q2 2019 to 20% in Q3 2019
But understanding of the principle of the cap has remained similar compared to the previous two quarters
Before today, had you heard about a new energy price cap known as a `Default Tariff Cap’? (%) Base: All Participants (Q1 2019: 3,200; Q2 2019: 3,236; Q3 2019: 3,206)
Which of the following do you think best describes what an energy price cap is? (%) Base: All Participants (Q1 2019: 3,200; Q2 2019: 3,236; Q3 2019: 3,206)
20
25
29
20
0
5
10
15
20
25
30
35
Quarter 4 2018 Quarter 1 2019 Quarter 2 2019 Quarter 3 2019
% Aware
2219 18 18
61 63 64 64
17 18 18 17
0
20
40
60
80
Q4 2018 Q1 2019 Q2 2019 Q3 2019
% Unsure
39
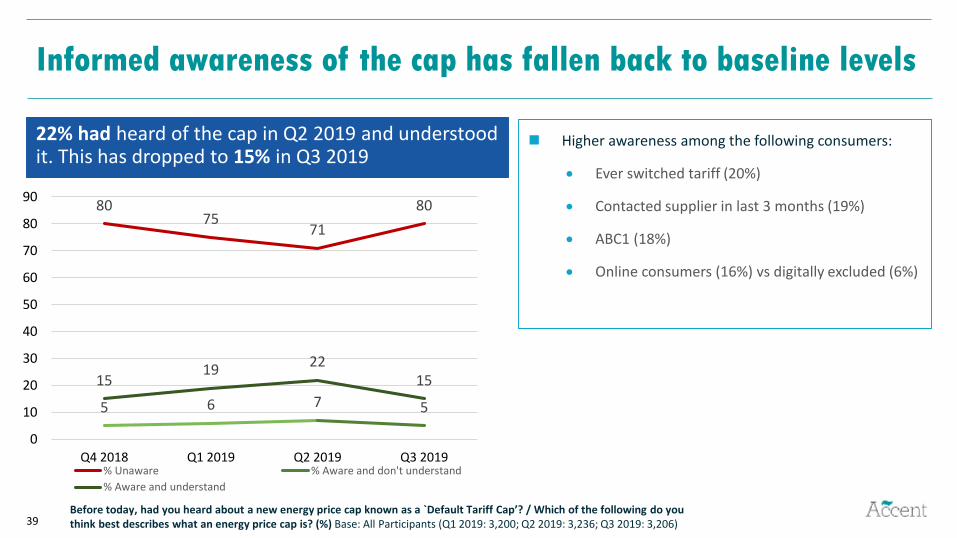
Informed awareness of the cap has fallen back to baseline levels
22% had heard of the cap in Q2 2019 and understood it. This has dropped to 15% in Q3 2019
Before today, had you heard about a new energy price cap known as a `Default Tariff Cap’? / Which of the following do you think best describes what an energy price cap is? (%) Base: All Participants (Q1 2019: 3,200; Q2 2019: 3,236; Q3 2019: 3,206)
Higher awareness among the following consumers:
Ever switched tariff (20%)
Contacted supplier in last 3 months (19%)
ABC1 (18%)
Online consumers (16%) vs digitally excluded (6%)
8075
71
80
5 6 7 5
1519
2215
0
10
20
30
40
50
60
70
80
90
Q4 2018 Q1 2019 Q2 2019 Q3 2019% Unaware % Aware and don't understand
% Aware and understand
40
25
33
22
63
33
28
39
22
42
39
39
14
SVT
Fixed
Mixed tariff
Tota
lTa
riff
typ
e
Yes No Unsure
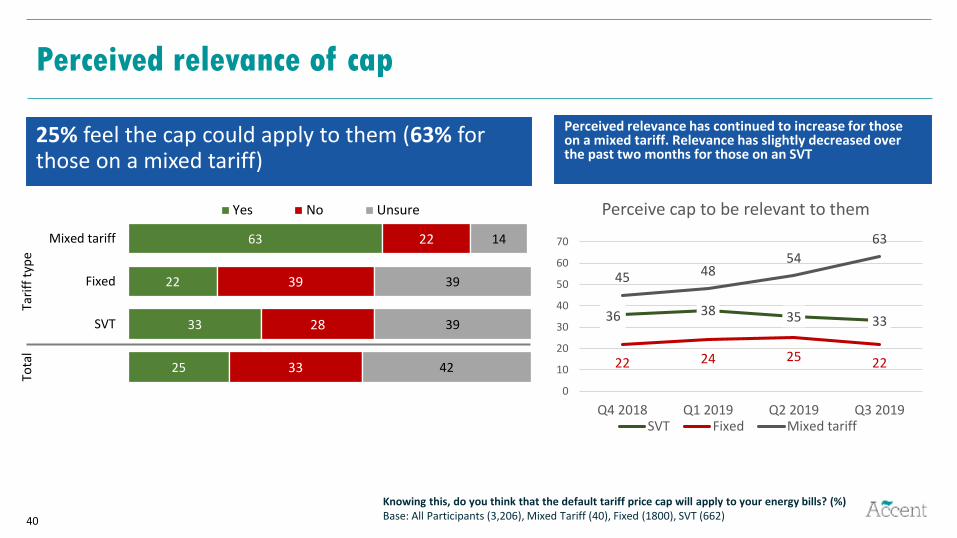
Perceived relevance of cap
25% feel the cap could apply to them (63% for those on a mixed tariff)
Knowing this, do you think that the default tariff price cap will apply to your energy bills? (%)Base: All Participants (3,206), Mixed Tariff (40), Fixed (1800), SVT (662)
Perceived relevance has continued to increase for those on a mixed tariff. Relevance has slightly decreased over the past two months for those on an SVT
36 38 35 33
22 24 25 22
45 4854
63
0
10
20
30
40
50
60
70
Q4 2018 Q1 2019 Q2 2019 Q3 2019
Perceive cap to be relevant to them
SVT Fixed Mixed tariff
Smart meters
42
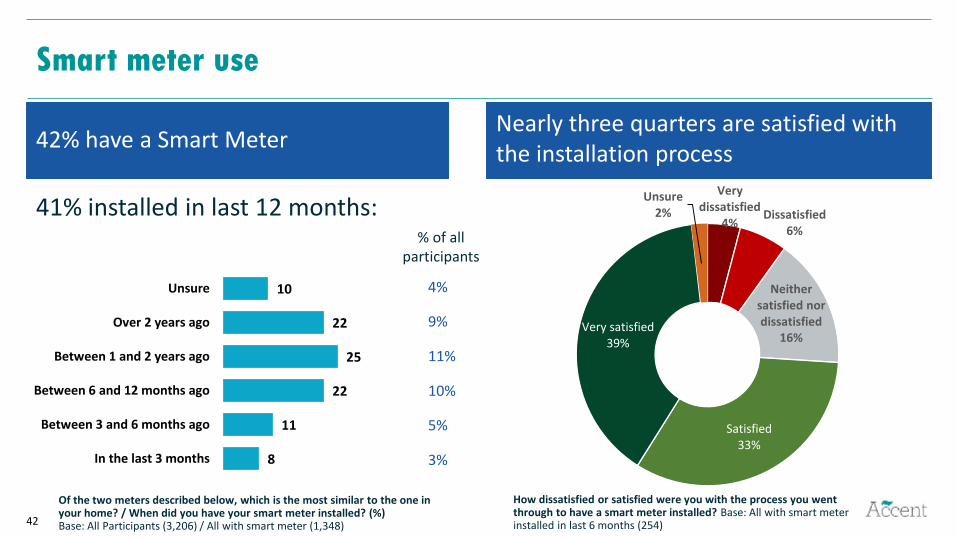
Smart meter use
42% have a Smart MeterNearly three quarters are satisfied with the installation process
Of the two meters described below, which is the most similar to the one in your home? / When did you have your smart meter installed? (%)Base: All Participants (3,206) / All with smart meter (1,348)
41% installed in last 12 months:
How dissatisfied or satisfied were you with the process you went through to have a smart meter installed? Base: All with smart meter installed in last 6 months (254)
4%
9%
11%
10%
5%
3%
% of all participants
8
11
22
25
22
10
In the last 3 months
Between 3 and 6 months ago
Between 6 and 12 months ago
Between 1 and 2 years ago
Over 2 years ago
Unsure
Very dissatisfied
4%Dissatisfied
6%
Neither satisfied nor dissatisfied
16%
Satisfied33%
Very satisfied39%
Unsure2%
43
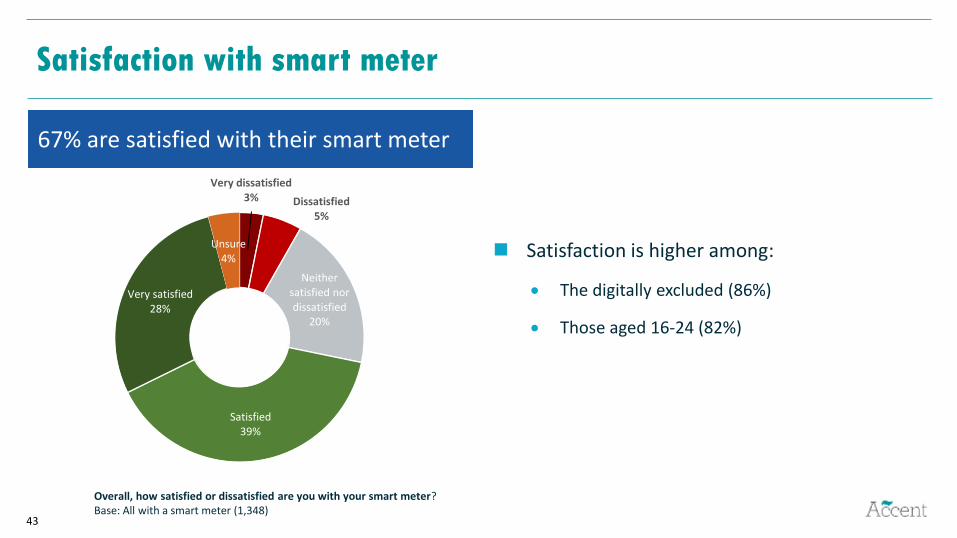
Satisfaction with smart meter
67% are satisfied with their smart meter
Overall, how satisfied or dissatisfied are you with your smart meter? Base: All with a smart meter (1,348)
Satisfaction is higher among:
The digitally excluded (86%)
Those aged 16-24 (82%)
Very dissatisfied3% Dissatisfied
5%
Neither satisfied nor dissatisfied
20%
Satisfied39%
Very satisfied28%
Unsure4%

44
Willingness to share smart meter data
Consumers with smart meters are willing to share their smart meter data with their supplier for a number of reasons, particularly if it means a bill discount
How willing would you be to share this data with your supplier for each of the following purposes? Base: All with a smart meter (1,348)
Willingness to share smart meter data is
high across most types of smart meter
user.
Willingness is higher among SEG ABC1:
65% very likely for bill discount
49% for tailored tariffs
41% for energy efficiency
suggestions
44% to deliver more efficient
network8
4
5
2
17
14
14
8
35
37
34
24
37
41
44
62
3
3
3
3
To receive suggestions on how to be more energyefficient
To help deliver a more efficient electricity networkwhich may help reduce carbon emissions and
result in cheaper bills for all consumers
To receive information about tariffs that aretailored to your energy use and that could save
you money
To get a discount on your bill
Not very/at all willing Neither willing nor unwilling Quite willing Very willing Don't know

Annexes

46
Abbreviations/terms used in this report
Suppliers:
Largest Six suppliers = British Gas, EDF, E.On, nPower, SSE and Scottish Power
Medium Tier suppliers = Bulb, Co-operative Energy, First Utility, Green Star,
Octopus Energy, Ovo, Utilita, Utility Warehouse
Small Tier suppliers = all other suppliers
Tariffs / Payment:
Fixed = Consumer is on a fixed tariff for their electricity and gas
SVT = Consumer is on a Standard Variable Tariff for their electricity and gas
Mixed tariff = on different types of tariff for gas and electricity
Dual Fuel = Consumer uses the same supplier for electricity and gas
PPM = Pre-payment Meter
Demographics:
SEG = Socio-Economic grade
ABC1 = Consumers falling into the top three socio-economic bands
C2DE = Consumers falling into the bottom three socio-economic bands
Online = Survey sample sourced from an online consumer panel
Digitally excluded = Sample sourced from face-to-face in-home interviews. All
selected on the basis they have no or limited access to the internet
Other:
PCW = Price Comparison Website
PPS = Percentage points

47
Measuring smart meter use
Meter A Meter BMonitors energy use Monitors energy useAutomatically sends readings of how much energy has been used in your home to your supplier
You or someone else in your household personally send readings of how much energy has been used in your home to your supplier OR someone from your supplier visits your home to take meter readings
Shows how much energy has been used in pounds and pence on a display or an app or online account
Does not show how much energy has been used in pounds and pence on a display or an app or online account
Has been installed in the last 5 years Has been installed more than 5 years agoSHOW IF HAVE A PRE-PAYMENT METER Allow those who pre-pay for energy to top up via their mobile or online
SHOW IF HAVE A PRE-PAYMENT METER Those who pre-pay for energy must top up at a pay point, post office or other shop
Use of smart meters was measured by asking participants to indicate which of the following best described the energy meters they
have in their home.
The question was asked separately of gas and electricity. The order of the meter descriptions was randomised across the survey
sample.
Those selecting the description for Meter A (the titles remained static) for either gas or electricity were deemed to have a smart meter.
48
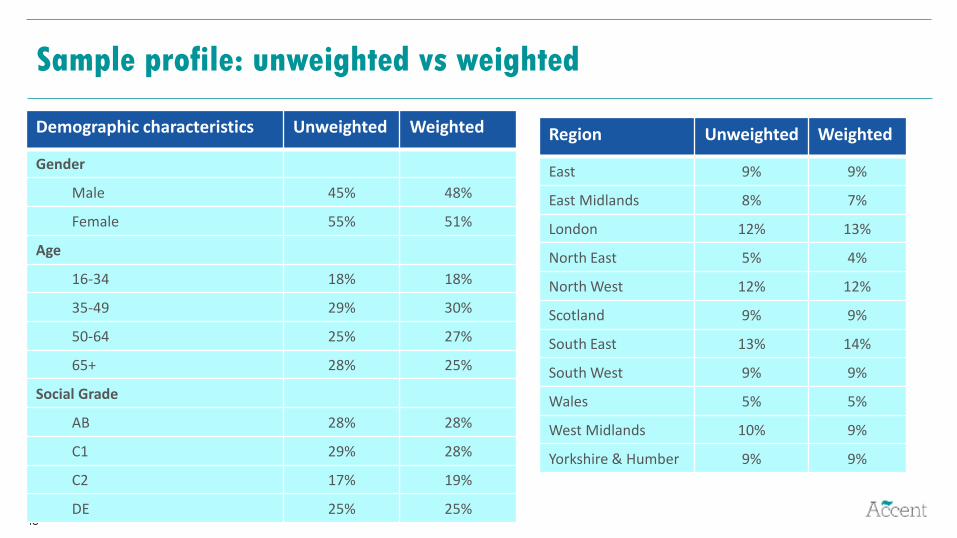
Sample profile: unweighted vs weighted
Demographic characteristics Unweighted Weighted
Gender
Male 45% 48%
Female 55% 51%
Age
16-34 18% 18%
35-49 29% 30%
50-64 25% 27%
65+ 28% 25%
Social Grade
AB 28% 28%
C1 29% 28%
C2 17% 19%
DE 25% 25%
Region Unweighted Weighted
East 9% 9%
East Midlands 8% 7%
London 12% 13%
North East 5% 4%
North West 12% 12%
Scotland 9% 9%
South East 13% 14%
South West 9% 9%
Wales 5% 5%
West Midlands 10% 9%
Yorkshire & Humber 9% 9%
Recommended