Hong Kong 2030+
Hong Kong 2030+
Table of Contents
Preface
1 People 1
Population Growth
Household Growth
Composition of Projected Population Growth Population Structure
Labour Force
Population Mobility
Non-Hong Kong Resident Population
Key Issues Pertinent to Strategic Spatial Planning Endnote
2 Housing 19
Existing Stock
Dwindling New Completion
Vacancy
Affordability
Flat Size
Ageing Building Stock
Housing for Elderly
Key Issues Pertinent to Strategic Planning Endnote
3 Economy 33
Economic Growth
Employment
Economic Structure
Four Key Industries
Two Emerging Industries
Manufacturing and Construction Industries
Key Issues Pertinent to Strategic Spatial Planning Endnote
4 Spatial Development Pattern 63
Reclamation and Topography
Land Utilisation
Spatial Changes in Population Distribution
Job Distribution
Spatial Distribution of Accommodation for Economic Uses
Compact, High Density and Transit-oriented City Form
Key Issues Pertinent to Strategic Spatial Planning Endnote
5 Conclusion 82
Hong Kong 2030+
List of Figures and Tables Figure 1-1 2014-based Population Projections Figure 1-2 Domestic Household Projections Figure 1-3 Percentages of Domestic Household by Size Figure 1-4 Actual (2014-2015) and Projected (2016-2064) Number
of Births and Deaths Figure 1-5 Five Components for Movement of Hong Kong
Resident Population Figure 1-6 Actual (2004-2014) and Projected (2019-2044) Five
Components for Movement of Hong Kong Resident Population
Figure 1-7 Actual (2004-2014) and Projected (2019-2044) Total Fertility Rate for Hong Kong
Figure 1-8 Hong Kong and Other Asian Economies’ Total Fertility Rate
Figure 1-9 Actual (2004-2014) and Projected (2019-2044) Expectation of Life for Hong Kong
Figure 1-10 Actual (2014) and Projected (2019-2064) Percentage of Population by Age
Figure 1-11 Projected Labour Force (Excluding Foreign Domestic Helpers) (2014-2044)
Figure 1-12 Average Daily Passenger Trips between Hong Kong and the Mainland by Passenger Type
Figure 1-13 Shares of Passenger Trips between Hong Kong and the Mainland in 2013/14 by Passenger Type and Trip Purpose
Figure 1-14 Frequent Trip Makers between Hong Kong and the Mainland (2013/14)
Figure 2-1 Percentage of Population by Type of Housing in New
Towns Figure 2-2
Newly Completed Residential Flats vs. New Domestic Households Formed (2000-2015)
Figure 2-3 Year-on-year Change of Stock of Permanent Living
Quarters (2000-2015) Figure 2-4 Permanent Living Quarters in Hong Kong (2000-2014) Figure 2-5 Vacancy Rate of Private Domestic Units (2000-2015) Figure 2-6 Private Domestic Price Index (1994-2015) Figure 2-7 Affordability Ratio (1996-2015) Figure 2-8 Private Domestic Rental Index (1996-2015) Figure 2-9 Shares of Stock of Private Domestic by Classes
(1985-2015) Figure 2-10 Shares of Newly Completed Private Domestic Flats by
Classes (1985-2015) Figure 2-11 Private Housing Units Aged 70 or Above by 2046 (by
District Councils) Figure 3-1 Labour Force and Labour Force Participation Rate
(2014-2064) Figure 3-2 Projected Deceleration of Economic Growth in Long
Term Figure 3-3 Total Employment, Unemployment and
Under-employment Rates (2000-2015) Figure 3-4 Value Added in Respect of Four Key Industries in 2000,
2007 and 2014 Figure 3-5 Employment in Respect of Four Key Industries in 2000,
2007 and 2014 Figure 3-6 Value Added in Respect of Six Emerging Industries
(2008-2014) Figure 3-7 Employment in Respect of Six Emerging Industries
(2008-2014) Figure 3-8 Value Added in Respect of Trading and Logistics
Sub-sectors in 2000, 2007 and 2014 Figure 3-9
Employment in Respect of Trading and Logistics Sub-sectors in 2000, 2007 and 2014
Hong Kong 2030+
Figure 3-10 External Merchandise Trade by Mode of Transport (2000-2015)
Figure 3-11 Aggregate Cargo Throughput by Mode of Transport (2000-2015)
Figure 3-12 Percentage of Share of Seaborne and River Cargo in Total Port Cargo Throughput (2000-2015)
Figure 3-13 Number of Visitor Arrivals in Hong Kong by Origins (2000, 2003 and 2015)
Figure 3-14 Visitor Arrivals (2000-2015) Figure 3-15 Overnight MICE Arrivals by Origins (2008-2015) Figure 3-16 Shares of Cultural and Creative Industries in Value
Added and Total Employment (2005-2014) Figure 3-17 Gross Domestic Expenditure on and Employment in
R&D (2005-2014) Figure 3-18 Shares of Value Added by Manufacturing Sub-sector
(2014) Figure 3-19 Shares of No. of Persons Engaged by Manufacturing
Sub-sector (2014) Figure 3-20 Changes in Value Added and No. of Persons Engaged
by Manufacturing Sub-sector between 2005 and 2014
Figure 4-1 Land Utilisation in Hong Kong Figure 4-2 Population Distribution of Hong Kong (1961–2014) Figure 4-3 Population Distribution in New Towns (2014) Figure 4-4 Distribution of Population and Jobs in Hong Kong in
2014 Figure 4-5 Proportion of Working Population with Place of Work in
Same District in 2011 Figure 4-6 Spatial Distribution of Accommodation for Economic
Uses by Districts in 2015 Figure 4-7 Overall Stock and Vacancy Rate of Private Offices
(2003-2015) Figure 4-8 Stock of Private Offices by CBD and Rest of the Metro
Area (2003 and 2015)
Figure 4-9 Stock of Private Offices by Districts (2003-2015) Figure 4-10 Stock of Private Offices by Major Office Nodes
(2003-2015) Figure 4-11 New Completions of Private Offices (2003–2015) Figure 4-12 Stock of Private Commercial by Districts (2003-2015) Figure 4-13 New Completions of Private Commercial by Districts
(2003-2015) Figure 4-14 Distribution of Total Industrial Stock by Districts in 2015 Figure 4-15 Stock of Private Flatted Factories by Districts
(2003-2015) Figure 4-16 Stock of Private Storage by Districts (2003-2015) Figure 4-17 Stock of Private Specialised Factories by Districts
(2003-2015) Figure 4-18 Number of Hotel Rooms in Hong Kong in 2015 Table 2-1 Public Rental Housing Estates with Building Blocks over
40 Years by End 2015 Table 2-2 Dwelling Space and Average Dwelling Space Per Person
in Hong Kong and Other Selected Cities Table 4-1 Accommodation for Economic Uses in 2015
Hong Kong 2030+
PREFACE
The purpose of this paper is to present a baseline review on (i) the demographic changes, (ii) the housing development, (iii) the economic development, and (iv) the spatial development patterns in Hong Kong. Key issues in these four aspects pertinent to strategic spatial planning will also be consolidated and analysed. Aspects of environment and transport are covered in the papers “Environmental Protection and Nature Conservation for Sustainable Growth” and Transport Infrastructure and Traffic Review” respectively.
This topical paper constitutes part of the research series under
“Hong Kong 2030+: Towards a Planning Vision and Strategy
Transcending 2030” (Hong Kong 2030+). The findings and
proposals of the paper form the basis of the draft updated
territorial development strategy which is set out in the Public
Engagement Booklet of Hong Kong 2030+.
Hong Kong 2030+ 1
The population of Hong Kong is projected to grow, albeit at a more modest pace, in the years to come. Hong Kong is facing the challenges of an ageing population, a shrinking workforce and the need of
enhancing productivity. To tackle these demographic challenges, the Government released a report entitled “Population Policy – Strategies and Initiatives” in January 2015i, which put forward some 50 initiatives mainly under seven aspects:
(a) promoting sustainable growth; (b) unleashing the potential of local labour force; (c) enhancing the quality of home-grown talent; (d) attracting talent from outside; (e) importing labour; (f) fostering a supportive environment for forming and
raising families; and (g) embracing opportunities in an ageing society.
Population Growth
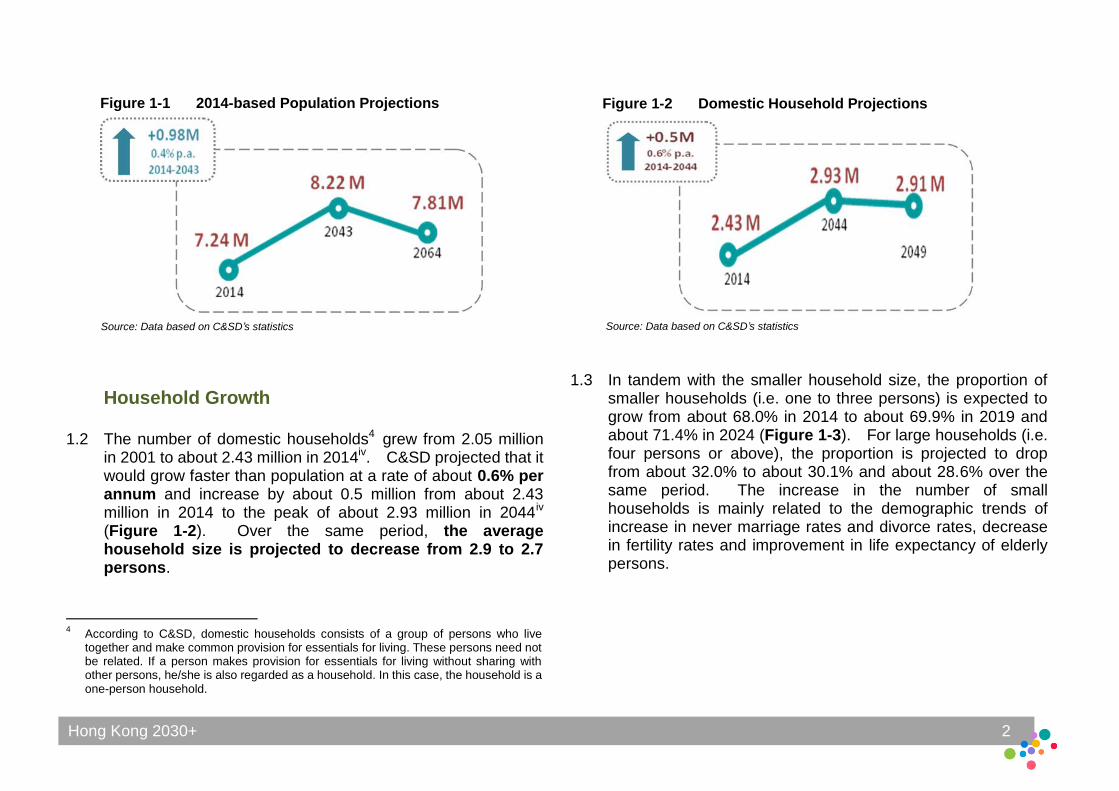
1.1 The population of Hong Kong (i.e. Resident Population
including Usual Resident1 and Mobile Residents2) has grown by about 0.53 million since 2001 and reached about 7.24 million in 2014ii and about 7.32 million in 2015iii. According to Census and Statistics Department (C&SD)’s latest baseline projections, the population would grow by about 0.98 million until reaching the peak of about 8.22 million in 2043 (Figure 1-1), equivalent to a growth rate of approximately 0.4% per annum3.
1 “Usual Residents” refer to two categories of people: (a) Hong Kong Permanent
Residents who have stayed in Hong Kong for at least 3 months during the 6 months before or for at least 3 months during the 6 months after the reference time-point, regardless of whether they are in Hong Kong or not at the reference time-point; and (b) Hong Kong Non-permanent Residents who are in Hong Kong at the reference time-point.
2 “Mobile Residents” refer to the Hong Kong Permanent Residents who have stayed in
Hong Kong for at least 1 month but less than 3 months during the 6 months before or for at least 1 month but less than 3 months during the 6 months after the reference time-point, regardless of whether they are in Hong Kong or not at the reference time-point.
3 C&SD also provided high and low projections in addition to baseline projections.
Population under the high projections would grow continuously within the whole projection horizon up to about 9.12 million in 2064, while that under the low projections would reach the peak of about 7.87 million in 2038.
Introduction 1 People
Hong Kong 2030+ 2
Household Growth
1.2 The number of domestic households4 grew from 2.05 million in 2001 to about 2.43 million in 2014iv. C&SD projected that it would grow faster than population at a rate of about 0.6% per annum and increase by about 0.5 million from about 2.43 million in 2014 to the peak of about 2.93 million in 2044iv (Figure 1-2). Over the same period, the average household size is projected to decrease from 2.9 to 2.7 persons.
4 According to C&SD, domestic households consists of a group of persons who live
together and make common provision for essentials for living. These persons need not be related. If a person makes provision for essentials for living without sharing with other persons, he/she is also regarded as a household. In this case, the household is a one-person household.
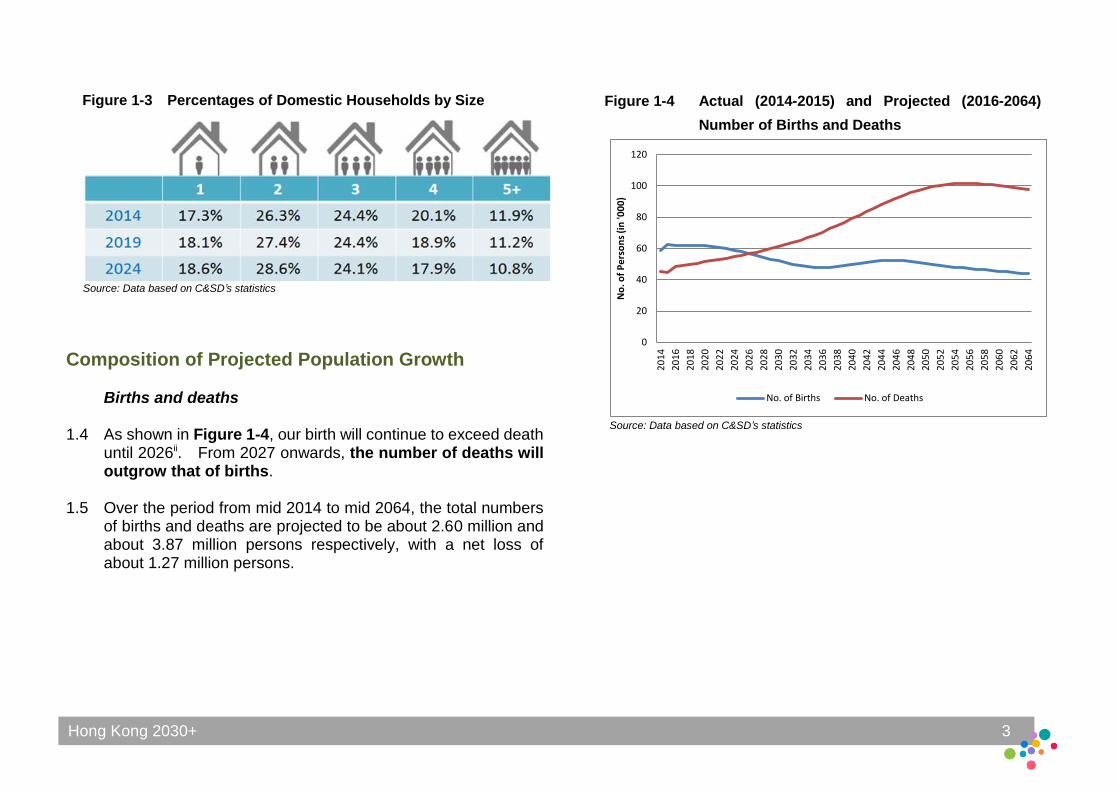
1.3 In tandem with the smaller household size, the proportion of smaller households (i.e. one to three persons) is expected to grow from about 68.0% in 2014 to about 69.9% in 2019 and about 71.4% in 2024 (Figure 1-3). For large households (i.e. four persons or above), the proportion is projected to drop from about 32.0% to about 30.1% and about 28.6% over the same period. The increase in the number of small households is mainly related to the demographic trends of increase in never marriage rates and divorce rates, decrease in fertility rates and improvement in life expectancy of elderly persons.
Source: Data based on C&SD’s statistics
Figure 1-1 2014-based Population Projections Figure 1-2 Domestic Household Projections
Source: Data based on C&SD’s statistics
Hong Kong 2030+ 3
0
20
40
60
80
100
120
20
14
20
16
20
18
20
20
20
22
20
24
20
26
20
28
20
30
20
32
20
34
20
36
20
38
20
40
20
42
20
44
20
46
20
48
20
50
20
52
20
54
20
56
20
58
20
60
20
62
20
64
No
. of
Pe
rso
ns
(in
'00
0)
No. of Births No. of Deaths
Composition of Projected Population Growth
Births and deaths
1.4 As shown in Figure 1-4, our birth will continue to exceed death until 2026ii. From 2027 onwards, the number of deaths will outgrow that of births.
1.5 Over the period from mid 2014 to mid 2064, the total numbers of births and deaths are projected to be about 2.60 million and about 3.87 million persons respectively, with a net loss of about 1.27 million persons.
Figure 1-4 Actual (2014-2015) and Projected (2016-2064)
Number of Births and Deaths
Figure 1-3 Percentages of Domestic Households by Size
Source: Data based on C&SD’s statistics
Source: Data based on C&SD’s statistics
Hong Kong 2030+ 4
1.6 For the number of births, since the implementation of zero-quota policy on obstetric services for Mainland women whose spouses are not Hong Kong residents after 2012, the number of Type II Babies5 during the whole projection period is assumed to be zero. As regards Type I Babies6, the number projected by C&SD according to past trend is 5,500 per year. Net movement (inflow less outflow)
1.7 Based on the concept explained in Section 1.1 that Hong Kong
Resident Population includes Usual Residents and Mobile Residents, Figure 1-5 shows the components adopted by C&SD in determining the movement of Hong Kong Resident Population.
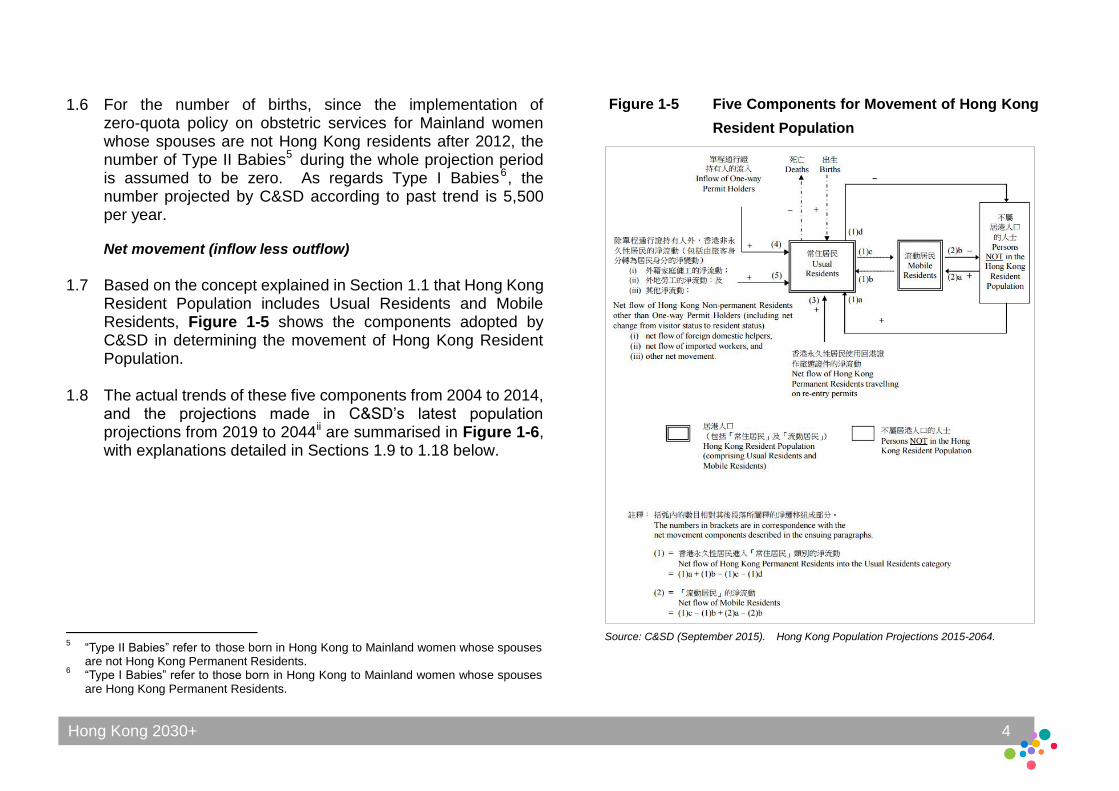
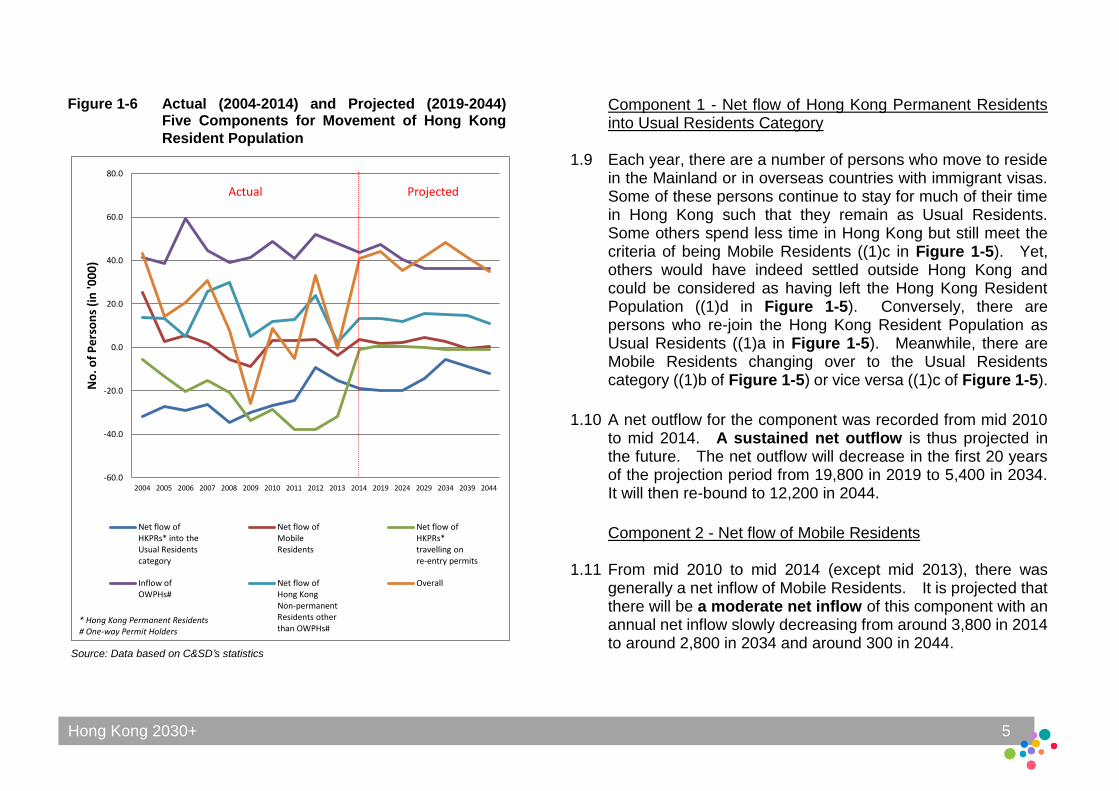
1.8 The actual trends of these five components from 2004 to 2014, and the projections made in C&SD’s latest population projections from 2019 to 2044ii are summarised in Figure 1-6, with explanations detailed in Sections 1.9 to 1.18 below.
5 “Type II Babies” refer to those born in Hong Kong to Mainland women whose spouses
are not Hong Kong Permanent Residents. 6 “Type I Babies” refer to those born in Hong Kong to Mainland women whose spouses
are Hong Kong Permanent Residents.
Figure 1-5 Five Components for Movement of Hong Kong
Resident Population
Source: C&SD (September 2015). Hong Kong Population Projections 2015-2064.
Hong Kong 2030+ 5
-60.0
-40.0
-20.0
0.0
20.0
40.0
60.0
80.0
2004 2005 2006 2007 2008 2009 2010 2011 2012 2013 2014 2019 2024 2029 2034 2039 2044
No
. of
Pe
rso
ns
(in
'00
0)
Net flow of HKPRs* into the Usual Residents category
Net flow of Mobile Residents
Net flow of HKPRs* travelling on re-entry permits
Inflow of OWPHs#
Net flow of Hong Kong Non-permanent Residents other than OWPHs#
Overall
Component 1 - Net flow of Hong Kong Permanent Residents into Usual Residents Category
1.9 Each year, there are a number of persons who move to reside in the Mainland or in overseas countries with immigrant visas. Some of these persons continue to stay for much of their time in Hong Kong such that they remain as Usual Residents. Some others spend less time in Hong Kong but still meet the criteria of being Mobile Residents ((1)c in Figure 1-5). Yet, others would have indeed settled outside Hong Kong and could be considered as having left the Hong Kong Resident Population ((1)d in Figure 1-5). Conversely, there are persons who re-join the Hong Kong Resident Population as Usual Residents ((1)a in Figure 1-5). Meanwhile, there are Mobile Residents changing over to the Usual Residents category ((1)b of Figure 1-5) or vice versa ((1)c of Figure 1-5).
1.10 A net outflow for the component was recorded from mid 2010
to mid 2014. A sustained net outflow is thus projected in the future. The net outflow will decrease in the first 20 years of the projection period from 19,800 in 2019 to 5,400 in 2034. It will then re-bound to 12,200 in 2044.
Component 2 - Net flow of Mobile Residents
1.11 From mid 2010 to mid 2014 (except mid 2013), there was generally a net inflow of Mobile Residents. It is projected that there will be a moderate net inflow of this component with an annual net inflow slowly decreasing from around 3,800 in 2014 to around 2,800 in 2034 and around 300 in 2044.
Figure 1-6 Actual (2004-2014) and Projected (2019-2044) Five Components for Movement of Hong Kong
Resident Population
Source: Data based on C&SD’s statistics
Actual Projected
* Hong Kong Permanent Residents # One-way Permit Holders
Hong Kong 2030+ 6
Component 3 – Net flow of Hong Kong Permanent Residents travelling on re-entry permits
1.12 Since children aged under 11 cannot travel to the Mainland or Macao solely using Hong Kong Identity Card, most will travel on re-entry permits. As the number of babies born in Hong Kong to Mainland women had increased significantly in a few years earlier, there was a large net outflow of persons aged 0 as many of these women take their babies back to the Mainland for living immediately. However, there is a net inflow of persons aged over 0 when some of these babies return to Hong Kong subsequently at older ages. As no Type II Babies are assumed during the entire projection period, the annual net outflow for most of the years in the projection period will be much smaller than in the previous years.
1.13 The required parameters of the return rates of Type I and Type
II Babies are mainly determined based on the actual movement record travelling on re-entry permit and Hong Kong Identity Card for Type I and Type II Babies born during 2003 to 2013. Some of these babies will leave Hong Kong in subsequent years. It is projected that all Type I Babies and around 30% of Type II Babies will settle in Hong Kong before the age of 21.
1.14 Taking into account the above assumptions on net movement
(and the numbers) of Type I and Type II Babies, as well as a small net outflow of local children based on historical trends, the net movement travelling on re-entry permits can be projected. Except for the net inflow during the initial period due to return of Type II Babies born in or before 2012, it is projected that the annual net outflow arising from this
component will decrease slightly from 1,000 in mid 2014 to 900 in mid 2034, and remain at this level till 2044.
Component 4 – Inflow of OWPHs
1.15 According to the Basic Law, the quota of OWPHs “shall be determined by the competent authorities of the Central People’s Government after consulting the government of the Region”. Since 1 July 1995, the quota has been 150 per day. The inflow of OWPHs is projected based on recent trends of the number of OWPHs coming to Hong Kong. It is projected that the number of OWPHs will increase from 119 per day in mid 2014 to 130 per day in mid 2019, and gradually decline to around 100 per day as from mid 2027. The number during the early projection period is expected to be higher due to the inflow of overage children 7 and their spouses and minor children. Component 5 – Net flow of Hong Kong Non-permanent Residents other than OWPHs (including net change from visitor status to resident status)
1.16 This component includes Hong Kong Non-permanent Residents who have entered Hong Kong for employment, study or family reasons as well as foreign domestic helpers and imported workers. It is expected the net inflow would be sustained, along with the continued development of Hong
7 “Overage children” are Mainland residents who were below age of 14 when their
natural fathers or mothers, on or before 1 November 2001, obtained their Hong Kong Identity Card and whose natural fathers or mothers still resided in Hong Kong on 1 April 2011.
Hong Kong 2030+ 7
Kong as an international city. It is anticipated that the annual net inflow would range from 2,900 to 16,100.
1.17 It should be noted that some persons in this component may later on change their status from Hong Kong Non-permanent Residents to Hong Kong Permanent Residents during their stay in Hong Kong. If these persons subsequently cease to be Usual Residents of Hong Kong, such movement will be treated as an outflow in the component “net flow of Hong Kong Permanent Residents into the Usual Residents category”.
1.18 Separate projections are made on the number of foreign
domestic helpers in view of their special employment nature. C&SD has in the latest population projectionsii enhanced the methodology for projecting the number of foreign domestic helpers by taking into account the future structural changes in the population, especially the increasing demand for foreign domestic helpers for taking care of the elderly. Projection results show that the number of foreign domestic helpers will rise from 328,300 in 2014 to 584,300 in 2044.
Population Structure
Sex ratio
1.19 According to C&SD’s latest population projectionsii, the sex
ratio (i.e. the number of males per 1,000 females) of the
population is projected to fall noticeably, from 935 in 2014 to
862 in 2034 and 825 in 2044 (excluding foreign domestic
helpers). There will be variations in the sex ratio by age
group. For the population aged under 25, the sex ratio will be
higher, i.e. more males than females in relative terms. For the
age groups from 25 to 44, the sex ratio will be lower i.e. less
males than females. This is mainly because among
cross-boundary marriages in recent years, around 70% were
between Hong Kong males and Mainland females, and 30%
between Hong Kong females and Mainland males. This has
led to more females among spouses coming to Hong Kong for
family reunion via OWP.
Ageing Population
1.20 Population ageing is expected to continue in Hong Kong.
Our fertility showed a declining trend over the past three
decades. Despite a moderate re-bounce in recent years, the
total fertility rate8 in Hong Kong has been consistently
below the replacement level9 of 2,100v. In 2003, the total
fertility rate has dropped to a record low of 901. It has
re-bounded to about 1,000 to 1,300 since 2007 (Figure 1-7).
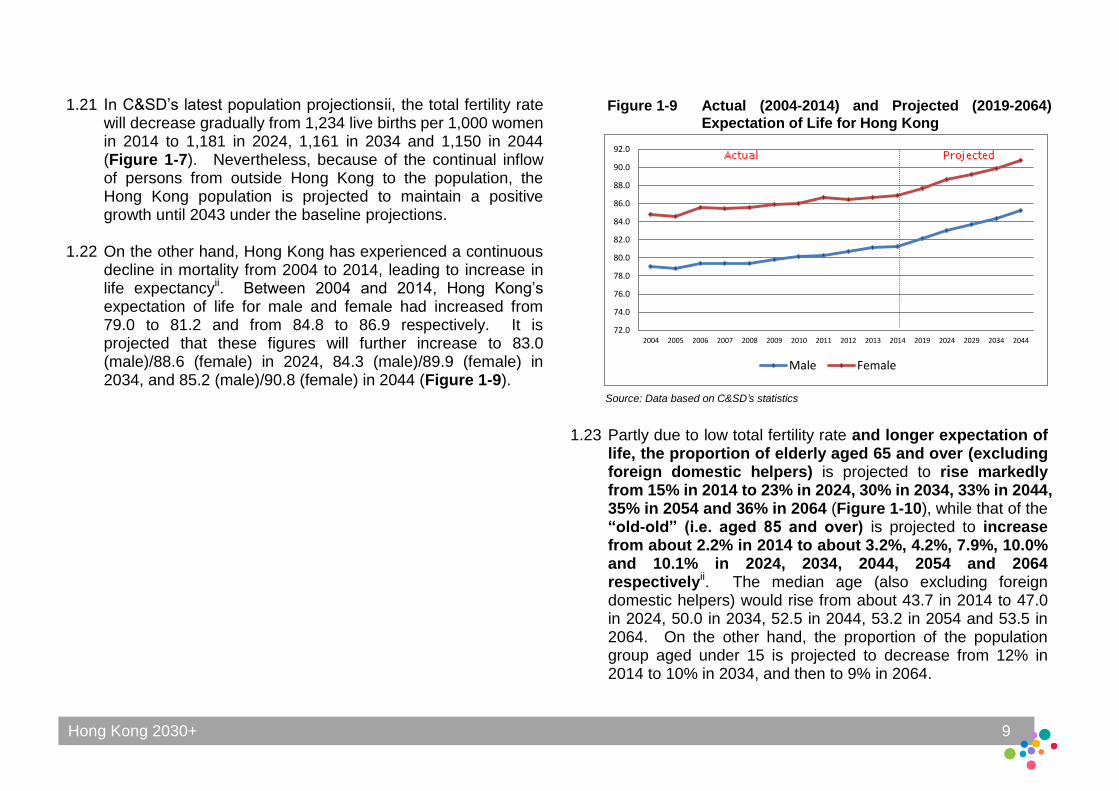
Hong Kong’s recent total fertility rate has been similar to that of
other Asian economies (e.g. South Korea, Singapore and
8 “Total fertility rate” refers to the average number of children that would be born alive to
1,000 women during their lifetime if they were to pass through their childbearing ages 15-49 experiencing the age specific fertility rates prevailing in a given year.
9 “Replacement level” refers to the number of children 1,000 women needs to produce
for a population to replace itself. Each woman would produce on average of one daughter, who may be said to “replace” her mother in the population. A total fertility rate of 2,100 per 1,000 women is considered to correspond to the replacement level, allowing for such factors as sex differential at birth and infant and childhood mortality.
Hong Kong 2030+ 8
0
200
400
600
800
1,000
1,200
1,400
2004 2005 2006 2007 2008 2009 2010 2011 2012 2013 2014 2019 2024 2029 2034 2039 2044
No
. of
Ch
ildre
n B
orn
Aliv
e p
er 1
,00
0 W
om
en
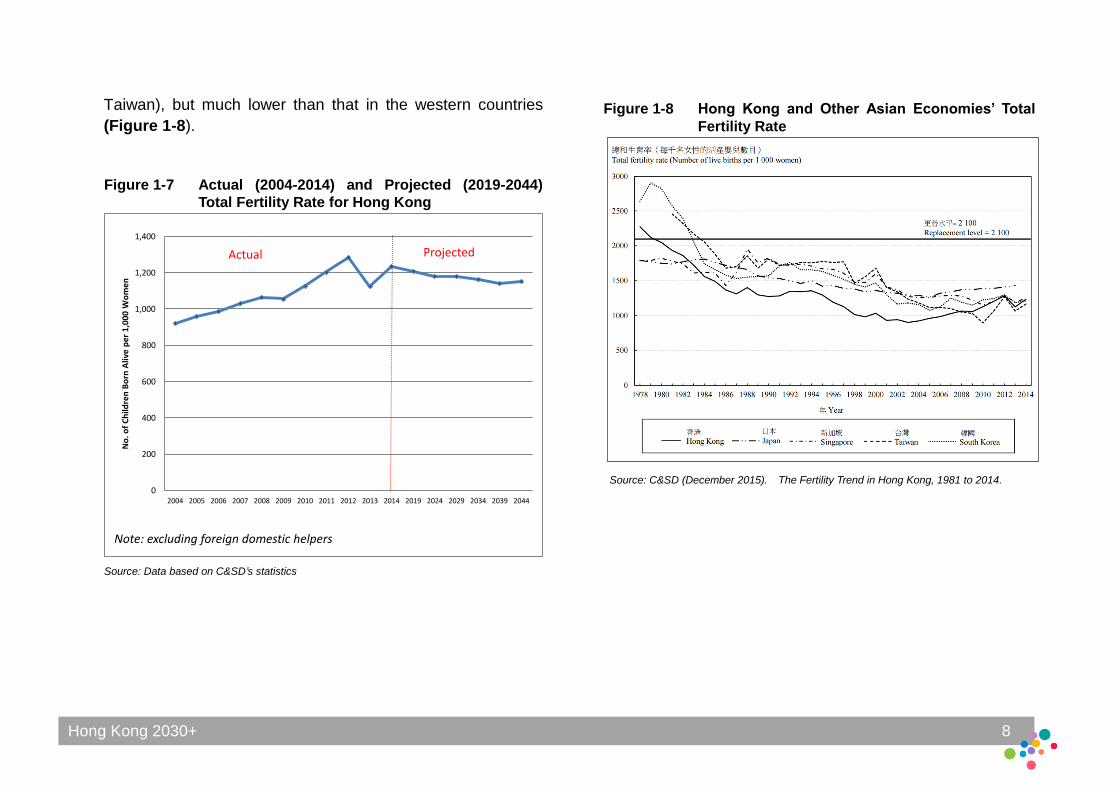
Taiwan), but much lower than that in the western countries
(Figure 1-8).
Source: Data based on C&SD’s statistics
Note: excluding foreign domestic helpers
Figure 1-7 Actual (2004-2014) and Projected (2019-2044)
Total Fertility Rate for Hong Kong
Source: C&SD (December 2015). The Fertility Trend in Hong Kong, 1981 to 2014.
Actual Projected
Figure 1-8 Hong Kong and Other Asian Economies’ Total
Fertility Rate
Hong Kong 2030+ 9
72.0
74.0
76.0
78.0
80.0
82.0
84.0
86.0
88.0
90.0
92.0
2004 2005 2006 2007 2008 2009 2010 2011 2012 2013 2014 2019 2024 2029 2034 2044
Male Female
1.21 In C&SD’s latest population projectionsii, the total fertility rate will decrease gradually from 1,234 live births per 1,000 women in 2014 to 1,181 in 2024, 1,161 in 2034 and 1,150 in 2044 (Figure 1-7). Nevertheless, because of the continual inflow of persons from outside Hong Kong to the population, the Hong Kong population is projected to maintain a positive growth until 2043 under the baseline projections.
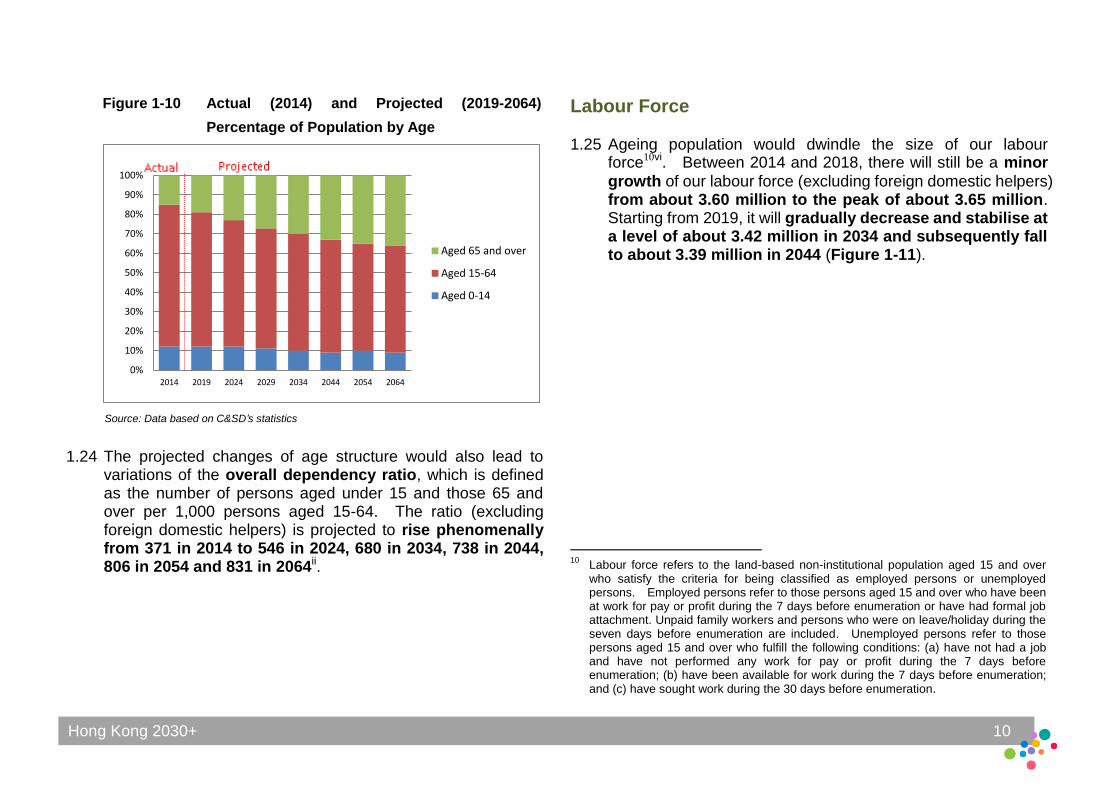
1.22 On the other hand, Hong Kong has experienced a continuous
decline in mortality from 2004 to 2014, leading to increase in life expectancyii. Between 2004 and 2014, Hong Kong’s expectation of life for male and female had increased from 79.0 to 81.2 and from 84.8 to 86.9 respectively. It is projected that these figures will further increase to 83.0 (male)/88.6 (female) in 2024, 84.3 (male)/89.9 (female) in 2034, and 85.2 (male)/90.8 (female) in 2044 (Figure 1-9).
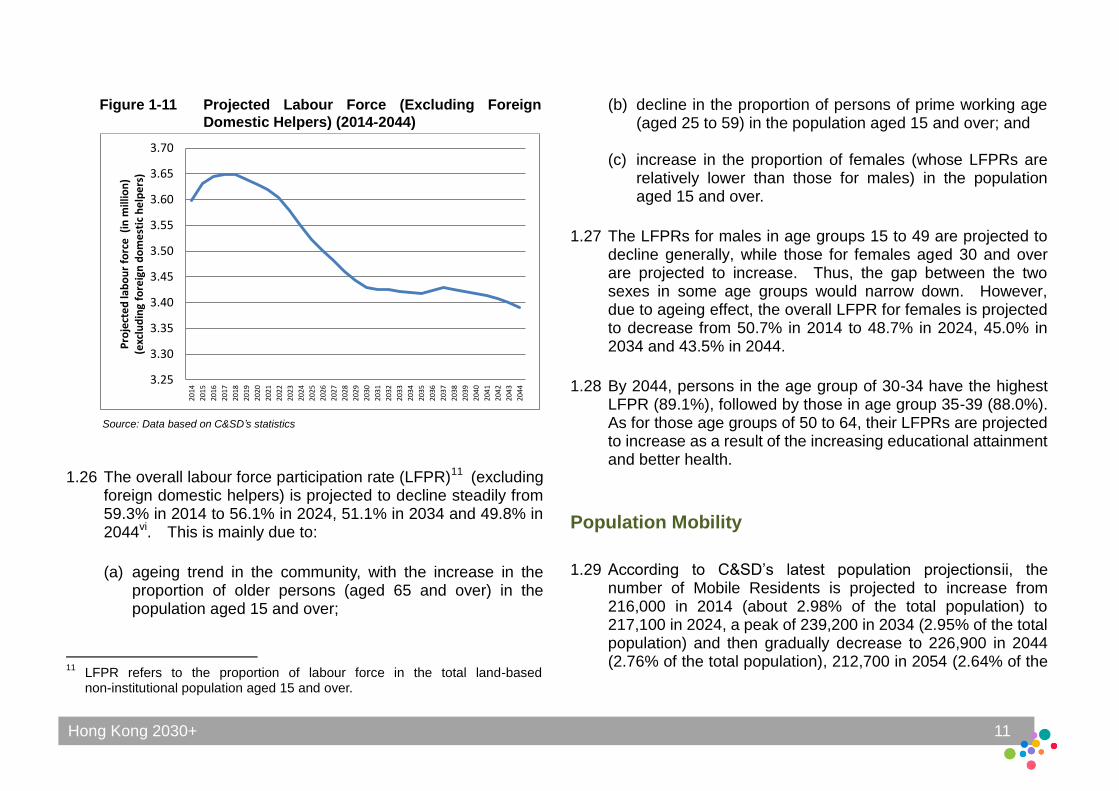
1.23 Partly due to low total fertility rate and longer expectation of life, the proportion of elderly aged 65 and over (excluding foreign domestic helpers) is projected to rise markedly from 15% in 2014 to 23% in 2024, 30% in 2034, 33% in 2044, 35% in 2054 and 36% in 2064 (Figure 1-10), while that of the “old-old” (i.e. aged 85 and over) is projected to increase from about 2.2% in 2014 to about 3.2%, 4.2%, 7.9%, 10.0% and 10.1% in 2024, 2034, 2044, 2054 and 2064 respectivelyii. The median age (also excluding foreign domestic helpers) would rise from about 43.7 in 2014 to 47.0 in 2024, 50.0 in 2034, 52.5 in 2044, 53.2 in 2054 and 53.5 in 2064. On the other hand, the proportion of the population group aged under 15 is projected to decrease from 12% in 2014 to 10% in 2034, and then to 9% in 2064.
Figure 1-9 Actual (2004-2014) and Projected (2019-2064)
Expectation of Life for Hong Kong
Source: Data based on C&SD’s statistics
Hong Kong 2030+ 10
0%
10%
20%
30%
40%
50%
60%
70%
80%
90%
100%
2014 2019 2024 2029 2034 2044 2054 2064
Aged 65 and over
Aged 15-64
Aged 0-14
1.24 The projected changes of age structure would also lead to variations of the overall dependency ratio, which is defined as the number of persons aged under 15 and those 65 and over per 1,000 persons aged 15-64. The ratio (excluding foreign domestic helpers) is projected to rise phenomenally from 371 in 2014 to 546 in 2024, 680 in 2034, 738 in 2044, 806 in 2054 and 831 in 2064ii.
Labour Force
1.25 Ageing population would dwindle the size of our labour force10vi. Between 2014 and 2018, there will still be a minor
growth of our labour force (excluding foreign domestic helpers) from about 3.60 million to the peak of about 3.65 million. Starting from 2019, it will gradually decrease and stabilise at a level of about 3.42 million in 2034 and subsequently fall to about 3.39 million in 2044 (Figure 1-11).
10
Labour force refers to the land-based non-institutional population aged 15 and over who satisfy the criteria for being classified as employed persons or unemployed persons. Employed persons refer to those persons aged 15 and over who have been at work for pay or profit during the 7 days before enumeration or have had formal job attachment. Unpaid family workers and persons who were on leave/holiday during the seven days before enumeration are included. Unemployed persons refer to those persons aged 15 and over who fulfill the following conditions: (a) have not had a job and have not performed any work for pay or profit during the 7 days before enumeration; (b) have been available for work during the 7 days before enumeration; and (c) have sought work during the 30 days before enumeration.
Figure 1-10 Actual (2014) and Projected (2019-2064)
Percentage of Population by Age
Source: Data based on C&SD’s statistics
Hong Kong 2030+ 11
3.25
3.30
3.35
3.40
3.45
3.50
3.55
3.60
3.65
3.70
2014
2015
2016
2017
2018
2019
2020
2021
2022
2023
2024
2025
2026
2027
2028
2029
2030
2031
2032
2033
2034
2035
2036
2037
2038
2039
2040
2041
2042
2043
2044
Pro
ject
ed
lab
ou
r fo
rce
(in
mill
ion
)
(e
xclu
din
g fo
reig
n d
om
est
ic h
elp
ers
)
Figure 1-11 Projected Labour Force (Excluding Foreign
Domestic Helpers) (2014-2044)
Source: Data based on C&SD’s statistics
1.26 The overall labour force participation rate (LFPR)11 (excluding foreign domestic helpers) is projected to decline steadily from 59.3% in 2014 to 56.1% in 2024, 51.1% in 2034 and 49.8% in 2044vi. This is mainly due to: (a) ageing trend in the community, with the increase in the
proportion of older persons (aged 65 and over) in the population aged 15 and over;
11
LFPR refers to the proportion of labour force in the total land-based non-institutional population aged 15 and over.
(b) decline in the proportion of persons of prime working age (aged 25 to 59) in the population aged 15 and over; and
(c) increase in the proportion of females (whose LFPRs are
relatively lower than those for males) in the population aged 15 and over.
1.27 The LFPRs for males in age groups 15 to 49 are projected to
decline generally, while those for females aged 30 and over are projected to increase. Thus, the gap between the two sexes in some age groups would narrow down. However, due to ageing effect, the overall LFPR for females is projected to decrease from 50.7% in 2014 to 48.7% in 2024, 45.0% in 2034 and 43.5% in 2044.
1.28 By 2044, persons in the age group of 30-34 have the highest
LFPR (89.1%), followed by those in age group 35-39 (88.0%). As for those age groups of 50 to 64, their LFPRs are projected to increase as a result of the increasing educational attainment and better health.
Population Mobility
1.29 According to C&SD’s latest population projectionsii, the number of Mobile Residents is projected to increase from 216,000 in 2014 (about 2.98% of the total population) to 217,100 in 2024, a peak of 239,200 in 2034 (2.95% of the total population) and then gradually decrease to 226,900 in 2044 (2.76% of the total population), 212,700 in 2054 (2.64% of the
Hong Kong 2030+ 12
total population), and 202,300 in 2064 (2.59% of the total population).
Cross-boundary passenger trips
1.30 While the number of Mobile Residents only contributed to
about 3% of the total population, increasing mobility is
reflected by the increase in cross-boundary trips. In recent
years, cross-boundary travel activities have increased
significantly due to intensifying social and economic ties
among Hong Kong, the Mainland and Macao, in particular the
Pearl River Delta. According to the Cross-boundary Travel
Survey 2013/14 (the Survey) commissioned by the Planning
Department (PlanD) vii , the average daily number of
cross-boundary passenger trips made was about 0.66
million in 2014, representing a growth of more than
double as compared with 0.30 million in 1999 and 61% as
compared with 0.41 million in 2003. Among these trips,
about 92% were passengers trips between Hong Kong and the
Mainland and the other 8% were between Hong Kong and
Macao.
1.31 Among trips between Hong Kong and the Mainland, about
52% were made by people living in Hong Kong; about 32%
were made by visitors from the Mainland; about 14% by Hong
Kong residents living in the Mainland and about 2% by people
living in other places (Figure 1-12).
1.32 For passenger trips made by people living in Hong Kong,
some 42% were for leisure, followed by visiting relatives and
friends (27%) and for business (19%) (Figure 1-13).
Shenzhen remained the most common trip destination (74% of
the trips). For trips made by visitors from the Mainland, about
73% came under the Individual Visit Scheme (including the
General Individual Visit Scheme and One-year Multiple entry
Individual Visit Scheme). Regarding trip purpose, 69% of the
Mainland visitors came to Hong Kong for leisure, 15% visiting
relatives and friends and 9% for business. For trips made by
Hong Kong residents living in the Mainland, 90% started from
Shenzhen and mainly travelled back to Hong Kong for
schooling (35%), work (26%) and leisure (15%).
Hong Kong 2030+ 13
78% 73% 71% 68% 61%
52%
10%
15% 16% 19%
24% 32%
9%
9%
10% 11%
13%
14%
2%
3%
3% 3%
2%
2``%
0
100,000
200,000
300,000
400,000
500,000
600,000
700,000
2003 2006 2007 2009 2011 2013/14
People living in other places
Hong Kong residents living in Mainland
Visitors from the Mainland
People living in Hong Kong
Average Daily Passenger Trips
Figure 1-12 Average Daily Passenger Trips between Hong Kong and the Mainland by Passenger Type
Source: Data based on PlanD’s statistics
Figure 1-13 Shares of Passenger Trips between Hong Kong and the Mainland in 2013/14 by
Passenger Type and Trip Purpose
Source: Data based on PlanD’s statistics
35% 42%
15%
69%
27% 11%
15% 19%
5%
9% 7%
26%
1% 5% 8% 6%
0%
20%
40%
60%
80%
100%
People living in Hong Kong
Hong Kong residents living in the Mainland
Visitors from the Mainland
Schooling Leisure Visiting relatives and friends Business Work Other purposes
Hong Kong 2030+ 14
Figure 1-14 Frequent Trip Makers between Hong Kong
and the Mainland (2013/14)
Source: Data based on PlanD’s statistics
1.33 In terms of the number of frequent cross-boundary trip makers, the Survey found that there were 737,700 frequent cross-boundary travellers who usually travelled at least once a week between Hong Kong and the Mainland in 2014 (a 5% increase as compared with 2011). They included frequent leisure trip makers12 (40.5%), frequent business trip makers 13 (20.6%), extended home-leavers 14 (12.5%), cross-boundary workers15 (5.6%), cross-boundary students16 (2.8%) and other frequent trip makers 17 (18.0%) (Figure 1-14).
1.34 There was a significant increase in the number of cross-boundary students (by about 60% as compared with 2011), especially those aged 6-11, probably related to the upsurge of Type II babies before adopting the zero-quota policy on obstetric services for Mainland women whose spouses are not Hong Kong residents after 2012. Besides, as compared with 2011, the number of extended home-leavers and frequent business trip makers also increased significantly by about 32.1% and 10.5% respectively,
12
“Frequent leisure trip makers” refers to the people frequently travelled across the boundary mainly for leisure purpose at least once a week.
13 “Frequent business trip makers” refers to the people aged 15 and over who travelled
across the boundary for business purposes at least once a week. 14
“Extended home-leavers” refers to the people travelled at least once a week to visit their family members on either side of the boundary.
15 “Cross-boundary workers” refers to the people aged 15 and over who travelled at
least four times a week from home to the place of work on either side of the boundary.
16 “Cross-boundary students” refers Hong Kong Residents aged 18 and below who
were living in the Mainland but travelled across the boundary at least four times a week to go to schools in Hong Kong.
17 “Other frequent trip makers” refers to people frequently travelled across the boundary
at least once a week for a variety of purposes.
whereas the number of cross-boundary workers dropped by 15.8%.
Hong Kong 2030+ 15
Non-Hong Kong Resident Population
1.35 Other than the projected Hong Kong Resident Population, the following five categories of people, not necessarily mutually exclusive, have implications on land use and infrastructure planning:
(a) Short-stay Hong Kong Permanent Residents
According to the 2011 Population Census, short-stay Hong Kong Permanent Residents (who have stayed in Hong Kong for less than one month in the six months both before and after the Census) amounted to 10,996.
(b) Hong Kong people living in the Mainland
Based on the passenger movement records, C&SD estimated that a total of 514,800 Hong Kong Permanent Residents usually stayed in the Guangdong Province in end 2015, which was slightly more than the figure of 509,700 in end 2013viii. About 42% (215,900) of these residents were aged under 15, while 15% (74,700) were aged 65 and above. Nearly 76% (389,100) of these residents were non-Hong Kong Resident Population.
(c) Hong Kong overseas emigrants and their second
generations It is estimated that since 1980, some 800,000 Hong Kong residents had emigrated, with almost 90% to the United States, Australia, New Zealand, Canada and the United Kingdomi. Some of their second generation are already in employment. Many of them are well-educated professionals, forming a large pool of highly-skilled talents. Given their knowledge and ties with Hong Kong, it was
recommended in the Population Policy - Strategies and Initiatives to attract these people to return to Hong Kong for making contribution to our future.
(d) Remaining proportion of Type I and Type II Babies From 2001 to 2014, some 98,877 Type I Babies and 203,927 Type II Babies were born in Hong Kong. Mainly based on the actual movement records travelling on re-entry permit and Hong Kong Identity Cards for Type I and Type II Babies born during 2003 to 2013, it was assumed in C&SD’s latest population projections that all Type I Babies and around 30% of Type II Babies would settle in Hong Kong before the age of 21ii. Some of the remaining portion of Type II Babies (70%) may also eventually choose to return and reside in Hong Kong.
(e) Visitors
According to the Hong Kong Tourism Board (HKTB), there was a surge in the number of visitor arrivals (both overnight and same day) over the past ten years from about 15.5 million in 2003 to 59.3 million in 2015ix. Of these, the number of same day visitor arrivals recorded phenomenal growth from about 5.9 million (37.7% of the total annual visitor arrivals) in 2003 to 32.6 million (55.0% of the total annual visitor arrivals) in 2015. The total tourist arrival figure in 2015 stood at 59 million. According to an assessment of Hong Kong’s capacity to receive tourists undertaken in 2013, the number of tourist was projected to rise to above 70 million by 2017x.
1.36 It is uncertain if people under categories (a) to (c) above have a regular residence in Hong Kong, and whether these people
Hong Kong 2030+ 16
and those under category (d) may eventually return to Hong Kong for long-stay. In any case, their returns will increase the demand for housing, education, medical and social facilities. On the other hand, the planning for commercial land uses, boundary control points, transport and other infrastructural facilities also need to take into account the increasing number of visitors.
Key Issues Pertinent to Strategic Spatial Planning Sustaining population growth and rejuvenating our population
1.37 Our fertility is well below the population replacement level,
which has resulted in ageing population, high dependence ratio, and shrinking labour force. To address the problem, we should adopt a more proactive approach and plan to reverse these trends. For example, our planning for the built environment should be more supportive to families so as to encourage more women to come out to work. In order to help increase labour supply in the long term, we should enhance the liveability of our city and provide more affordable housing so as to encourage the formation of families and child births.
1.38 More importantly, a continued population growth is essential for sustaining social and economic developments, as well as maintaining a productive workforce for an economy. To contribute to our population policy objective to develop and nurture a population that will continuously support and drive our social and economic development as Asia’s World City, we should plan to grow over and above the projected trends.
Projected population, labour force and economy per se should not be taken as constraints or limiting factors for strategic planning, and they should be overcome through adopting a visionary approach of creating capacity.
1.39 In any case, there will be a population growth and an even faster household growth under C&SD’s latest baseline projections. We have to cater for the social and also economic needs arising from such growths, as well as the aspirations for better living quality.
1.40 In the light of the above, future housing requirements and land requirements for different economic uses, major special facilities as well as government, institution and community facilities (e.g. tertiary and vocational training institutes, international schools, hospitals, childcare facilities, and facilities for elderly and persons with disabilities, etc.) would be assessed. Correspondingly, the solution spaces and the necessary strategic directions on transport and infrastructure developments and environmental management would be identified.
1.41 On housing demand, the continued growth in number of households would generate immense demand, while the changes in characteristics of the households would have implications on the types of housing accommodation. Our planning for housing land will also take into account the impact of the decrease in household size and increase in small households on the choice of living location and the demand for different housing types and sizes. Flexibility will be provided to cater for unforeseen circumstances.
Hong Kong 2030+ 17
Planning for robustness and land reserve
1.42 Apart from the projected population of 8.22 million by 2043, we need to cater for the actual and potential demand for housing, commercial and community facilities, boundary control points, transport and other infrastructure facilities from the non-Hong Kong Resident. Admittedly, there is high uncertainty over the potential return of these people for long-stay.
1.43 Since we are planning in a volatile context, the planning of our city needs to be sensitive to the changing and diverse needs and aspirations of different constituents of the population and non-Hong Kong Resident Population. As such, it is imperative that our territorial spatial development strategy is robust enough to cater for uncertainties. Scenario planning and planning for buffer and reserve would allow us to better deal with possible contingencies. Catering for Need of Ageing Population
1.44 While we have to provide space and capacity to avert the impact of the ageing population and shrinking labour force, we shall at the same time plan to cater for the need of our ageing population, to create an elderly friendly environment, and to promote “aging in place” as well as “active ageing”. A fast ageing population will entail the provision of more facilities and services for the elderly in the years ahead, in particular facilities that provide community support, community care, medical care and residential care services. There would also be a need to make adjustments to the general urban and building design, such as incorporating universal design in urban infrastructure and housing accommodation, providing
suitably designed/equipped housing for the elderly, providing more leisure pursuits (e.g. well-designed neighbourhood local space), etc. We shall facilitate the development of inclusive and integrated communities to cater for the need of different age groups. All these would also contribute to promoting active ageing, which is also one of the strategic dimensions recommended by the Steering Committee on Population Policy18. Boosting labour force
1.45 Noting that adequate and quality manpower resources are the key to our sustainable social and economic development, the Government has introduced some policy initiatives in relation to labour force, namely, unleashing the potential of the local labour force, enhancing the quality of our home-grown talent, attracting talent from outside and importation of labour.
1.46 We need to enable the provision of facilities which help unleash the potential of our local labour force (e.g. child care facilities to support working women and elderly-friendly working environment for elderly), nurture local manpower (e.g. diversify job opportunities, and tertiary and vocational training institutes for younger generation) and retain and attract local
18
One of the strategies deployed by the Steering Committee on Population Policy is to promote active ageing by helping the elderly enjoy their retirement life and creating an elderly-friendly environment.
Hong Kong 2030+ 18
and overseas talents19 (e.g. liveable environment, affordable housing and international schools). Planning for increasing population mobility
1.47 Increasing population mobility also warrants our special attention. Although the proportion of mobile residents is projected to remain around 3% of our total population, there is a significant increase in the number of cross-boundary passenger trips and frequent cross-boundary travellers for leisure, business and study purpose due to intensifying social and economic ties between Hong Kong and the Mainland. Together with the Mainland visitors (around 77% of our total annual visitor arrivals in 2015ix), we need to consider their impact on the demand for cross-boundary infrastructure and land for associated activities, as well as the impact on the capacity of railway and highway networks adjoining the boundary crossing points within Hong Kong.
ENDNOTES i Chief Secretary for Administration’s Office (January 2015).
Population Policy - Strategies and Initiatives. Retrieved from http://www.hkpopulation.gov.hk/public_engagement/pdf/PPbooklet2015_ENG.pdf
19
According to a survey mentioned in the “Though of Hong Kong – Public Engagement Exercise on Population Policy” published by the Secretariat of the Steering Committee on Population Policy in October 2013, housing prices, air quality and provision of international school places are the top three areas that need improvement according to Mainland and overseas talent living in Hong Kong.
ii C&SD (September 2015). Hong Kong Population Projections
2015-2064. Retrieved from http://www.statistics.gov.hk/pub/B1120015062015XXXXB0100.pdf
iii C&SD. Table 001: Population by Sex. Retrieved from
http://www.censtatd.gov.hk/hkstat/sub/sp150.jsp?tableID=001&ID=0&productType=8
iv C&SD (October 2015). Hong Kong Domestic Household Projections up to 2049. Retrieved from http://www.statistics.gov.hk/pub/B71510FC2015XXXXB0100.pdf
v C&SD (December 2015). The Fertility Trend in Hong Kong, 1981 to 2014. Retrieved from http://www.statistics.gov.hk/pub/B71512FB2015XXXXB0100.pdf
vi C&SD (October 2015). Hong Kong Labour Force Projections for 2015 to 2064. Retrieved from http://www.statistics.gov.hk/pub/B71510FB2015XXXXB0100.pdf
vii PlanD (2014). Survey Report on Cross-boundary Travel Survey 2013/14. Retrieved from http://www.pland.gov.hk/pland_en/p_study/comp_s/nbsb2013-2014/NBSB2013-14.pdf
viii C&SD (September 2016). Table E488: Statistics on Hong Kong Residents Usually Staying in Guangdong Retrieved from
http://www.censtatd.gov.hk/hkstat/sub/sp150.jsp?productCode=D5320188
ix HKTB (2015). A Statistical Review of Hong Kong Tourism 2015. x Commerce and Economic Development Bureau (December 2013).
Assessment Report on Hong Kong’s Capacity to Receive Tourist. Retrieved from http://www.tourism.gov.hk/resources/english/paperreport_doc/misc/2014-01-17/Assessment_Report_eng.pdf
Hong Kong 2030+ 19
Housing is an important livelihood issue
and foundation for a stable society.
However, Hong Kong saw a severe
supply-demand imbalance in housing in the
past decade. Limited supply and surging demand have been
criticised as reasons for the housing problems, such as
unaffordable housing prices, long waiting time for public rental
housing (PRH), emergence of sub-divided units (SDUs)20, etc.
To meet the needs of the growing population and number of
households, we need to ensure timely provision of adequate
land and infrastructure for housing development.
20
A Thematic Household Survey was conducted by C&SD during May to September 2015 to collect information on the housing conditions of SDUs in private domestic/composite buildings (excluding village houses) aged 25 and above (i.e. built on or before 31 December 1990) in Hong Kong. According to the survey results released in the Thematic Household Survey Report No. 60 “Housing Conditions of SDUs in Hong Kong”, 61.6% of households living in SDUs cited “more affordable rent as compared with that of a whole unit of private quarters” as the reason for living in the units at the time of enumeration. 36.3% cited “convenient to go to work/school” as the reason. This was followed by “financial difficulties” (22.6%), “lacking space to live with parents/relatives” (5.7%), and “family problems” (5.1%). 6.6% citied other reasons, e.g. more living space/better living environment than the previous unit.
This Chapter presents an overview of our housing
development and analyses of some key issues relevant to the
formulation of our spatial strategy.
2
Housing
Hong Kong 2030+ 20
Existing Stock
2.1 According to C&SD, there were about 2.70 million permanent
living quarters 21 in Hong Kong as at end March 2015 xi ,
comprising:
(a) about 1.18 million (43.7%) public housing units, including about 0.78 million (PRH) units and about 0.40 million subsidised sale flats; and
(b) about 1.52 million (56.3%) private housing units, including
about 1.24 million private residential flats, and a total of about 0.28 million quarters of villas/bungalows/modern village houses, simple stone structures/traditional village houses, staff quarters and non-domestic quarters.
21
“Permanent living quarters” is a term used by C&SD. The stock is compiled based on the information of the “Frame of Quarters”, and includes all quarters used for residential purpose as well as quarters known to be used for residential purpose in non-residential buildings (such as commercial buildings and industrial buildings). Quarters known to be used for non-residential purpose and those in hotels and accommodation used for inmates of institutions are excluded.
It should be emphasized “domestic households” and “permanent living quarters” are two different concepts using different compilation methods, and hence their figures could not be used for direct comparison. On the one hand, “domestic households” do not include four types of households which also entail housing demand. They include (i) households with mobile residents only, (ii) households of short-stay Hong Kong Permanent Resident with less than one month stay at the reference time, (iii) Hong Kong Non-permanent Resident households not present in Hong Kong at the reference time, and (iv) non-local households who bought or leased flats in Hong Kong. On the other hand, “permanent living quarters” include (i) vacant quarters (which must exist in any housing market*), and (ii) second homes for some households.
* the vacancy rate of private domestic units in Hong Kong was as low as 3.7% in 2015, reflecting a tight demand-supply balance in the private housing market (see paragraph 2.6 below).
2.2 About 45.6%, 53.9% and 0.5% of our population was
accommodated in public permanent housing 22 , private permanent housing23 and temporary housing24 respectively in 2015xii. The situation was however different in most new towns (except Tsuen Wan and Yuen Long). According to the 2011 Population Census, a larger proportion of the population in new towns (about 57.7%) was accommodated in public housing (against about 40.9% in private housing). This is especially the case in Tin Shui Wai, Kwai Chung, Tsing Yi, Tung Chung, Tseung Kwan O, Fanling/Sheung Shui and Ma On Shan, each had more than 60% population living in public housing (Figure 2-1).
22
“Public permanent housing” covers the following: (a) rental housing which includes (i) PRH flats and interim housing of HKHA; and (ii)
rental flats and Senior Citizen Residences Scheme flats of the Hong Kong Housing Society (HKHS); and
(b) subsidized sale flats which include (i) flats under the Tenant Purchase Scheme of HKHA; (ii) flats under the Home Ownership Scheme (HOS), Private Sector Participation Scheme (PSPS), Middle Income Housing Scheme (MIHS), Buy or Rent Housing Option Scheme (BRO) and Mortgage Subsidy Scheme (MSS) of HKHA; and flats under Flat-for-Sale Scheme (FFSS) and Sandwich Class Housing Scheme (SCHS) of HKHS.
HOS/PSPS/MIHS/BRO/MSS/TPS/FFSS/SCHS flats can be traded in the open market (i.e. flats sold prior to HOS Phase 3B or flats with premium paid) are classified as private permanent housing and are excluded from subsidized sale flats.
23 “Private permanent housing” covers the following:
(a) private housing blocks; (b) flats built under Urban Improvement Scheme of HKHS; (c) villas/bungalows/modern village houses; (d) simple stone structures; and (e) HOS/PSPS/MIHS/BRO/MSS/TPS/FFSS/SCHS flats that can be traded in the open
market. 24
“Temporary housing” includes such temporary structures as roof-top structures, huts and places not intended for residential purposes (e.g. staircases, corridors).
Hong Kong 2030+ 21
0%
10%
20%
30%
40%
50%
60%
70%
80%
90%
Private Permanent Housing Public Permanent Housing* Others^
2.3 From planning point of view, we should promote a balanced
community mix by providing different types of housing and having wider housing choices to meet the changing demographics, different community aspirations and social needs.
Dwindling New Completion
2.4 Newly completed residential units between 2000 and 2015 added up to about 0.62 million (about 57.2% public housing and about 42.8% private housing). Overall, the completion figures of both public and private housing was in a declining trend, with such figures down from the highest of about 96,230 flats in 2001 to the lowest of about 17,280 flats in 2007. Since 2006, the annual total completion figure has been lower than 30,000 flats, except for 2008. The annual increases in new flats for the periods 2005-2007, 2010-2012 and 2014-2015 were smaller than the number of new domestic households formed in respective years, resulting in a tighter housing demand-supply balance (Figure 2-2).
2.5 Contracting completion also brought down the growth rate of
the stock of permanent living quarters. From 2000 to 2014, the highest growth rate appeared in 2001 (about 4.8%). Since then, the annual growth rate started decreasing and maintained at a low level of around 1% (Figures 2-3 and 2-4).
Note: The population excludes persons living on board vessels. * including public rental housing and subsidized sale flats. ^ including non-domestic housing and temporary housing.
Figure 2-1 Percentage of Population by Type of Housing in
New Towns
Source: Data based on C&SD’s statistics
Hong Kong 2030+ 22
1.5%
4.8%
2.6%
2.9%
1.4%
1.6% 1.9%
1.0% 0.6%
1.2%
0.6%
1.3% 1.4%
0.7%
0.9%
0.0%
1.0%
2.0%
3.0%
4.0%
5.0%
2000 2001 2002 2003 2004 2005 2006 2007 2008 2009 2010 2011 2012 2013 2014
26,274 23,986 32,746
26,397 26,036 17,321 16,579
10,471 8,776 7,157 13,405
9,449 10,149 8,254 15,719
11,280
59,014 72,248
21,226
14,268 20,947
24,691
4,430
6,805
24,959 19,391 7,495 17,787
9,778 20,898 5,634 11,473
0
20,000
40,000
60,000
80,000
100,000
120,000
-
20,000
40,000
60,000
80,000
100,000
120,000
2000 2001 2002 2003 2004 2005 2006 2007 2008 2009 2010 2011 2012 2013 2014 2015
Ne
wly
Co
mp
lete
d R
esi
de
nti
al F
lats
Public Housing *
Private Housing ̂
Domestic Households
Ne
w D
om
est
ic H
ou
seh
old
s Fo
rme
d
1,119 1,171 1,238 1,279 1,308 1,333 1,369 1,386 1,399 1,409 1,423 1,455 1,471 1,484 1,497 1,516
1,016 1,066 1,058 1,082 1,085 1,098 1,109 1,115 1,119 1,137 1,138 1,138 1,159 1,164 1,175 1,179
0
500
1000
1500
2000
2500
3000
No
. o
f F
lats
(000's
)
Private Housing Public Housing
Figure 2-2 Newly Completed Residential Flats vs. New
Domestic Households Formed (2000-2015)
Sources: Data based on C&SD’s statistics
Figure 2-3 Year-on-year Change of Stock of Permanent Living Quarters (2000-2014)
Source: Data based on C&SD’s statistics
Figure 2-4 Permanent Living Quarters (2000-2015)
Source: Data based on C&SD’s statistics
Vacancy 2.6 According to the Rating and Valuation Department (R&VD), the
vacancy rate of private domestic units25 decreased from its peak of about 6.8% in 2003 to about 3.7% in 2015 (Figure 2-5), reflecting a tight demand-supply balance in the private housing market.
25
According to R&VD, private domestic units are defined as independent dwellings with separate cooking facilities and bathroom (and/or lavatory). Public sector developments (including domestic units built under the Private Sector Participation Scheme for subsidised sale, and all units built under HOS, BRO, MSS, SCHS, UIS and FFSS) are not included. Besides, rental estates built by HKHA and HKHS, units sold under TPS, and government-owned quarters are also excluded.
Notes: * including public rental housing and subsidised sale flats ^ village houses have been excluded from private housing since 2003 .
Hong Kong 2030+ 23
116.9
163.1
117.1
100.0
89.6 78.7
69.9 61.6
78.0
92.0
92.7
103.5
120.5
121.3
150.9
182.1
206.2
242.4
256.9
296.8
0.0
50.0
100.0
150.0
200.0
250.0
300.0
350.0
19
96
19
97
19
98
19
99
20
00
20
01
20
02
20
03
20
04
20
05
20
06
20
07
20
08
20
09
20
10
20
11
20
12
20
13
20
14
20
15
Ind
ex
(19
99
= 1
00
)
5.4%
5.7%
6.8% 6.8% 6.2% 6.0%
5.9%
4.9% 4.9%
4.3%
4.7%
4.3%
4.3% 4.1%
3.8%
3.7%
0.0%
1.0%
2.0%
3.0%
4.0%
5.0%
6.0%
7.0%
8.0%
2.7 The vacancy rate of PRH as at end 2014 stood at a very low level, being about 0.4% for those under the Hong Kong Housing Authority (HKHA) and about 0.3% for those under the Hong Kong Housing Society (HKHS).
Figure 2-5 Vacancy Rate of Private Domestic Units
(2000-2015)
Source: Data based on R&VD’s statistics
Affordability 2.8 Housing in Hong Kong is getting less and less affordable in recent
years. Hong Kong has been regarded as the world’s least affordable market for the sixth year, according to the 12th Annual Demographia International Housing Affordability Survey xiii . As shown in Figure 2-6, the private domestic price index increased from the lowest of about 61.6 in 2003 to about 296.8 in 2015.
Figure 2-6 Private Domestic Price Index (1996-2015)
Source: Data based on R&VD’s statistics
2.9 Since the increase in household income was not commensurate with the surge in property prices, affordability ratio deteriorated from 20.5% at the trough in 2003 to 63.1% in 2015 (Figure 2-7). Affordability ratio refers to the ratio of mortgage payment for a 45m2 flat (assuming 70% loan-to-value ratio and tenor of 20 years) to median income of households (excluding those living in public housing). In parallel, rents in the private housing market have also been driven up as shown in Figure 2-8, though at a less alarming rate.
Hong Kong 2030+ 24
119.0
134.5
112.6
100.0 98.1
95.4 83.4
73.6 77.7
86.5 91.6
101.8
115.7
100.4
119.7
134.0
142.6 154.5
159.5
172.8
0.0
20.0
40.0
60.0
80.0
100.0
120.0
140.0
160.0
180.0
200.0
19
96
19
97
19
98
19
99
20
00
20
01
20
02
20
03
20
04
20
05
20
06
20
07
20
08
20
09
20
10
20
11
20
12
20
13
20
14
20
15
Ind
ex
(19
99
= 1
00
)
67.3%
87.2%
72.3%
53.2%
43.7%
30.3%
23.5% 20.5%
25.9%
33.5%
36.8% 37.5%
35.3% 35.7%
42.6% 46.8%
49.1% 54.1%
56.4%
63.1%
0%
10%
20%
30%
40%
50%
60%
70%
80%
90%
100%
19
96
19
97
19
98
19
99
20
00
20
01
20
02
20
03
20
04
20
05
20
06
20
07
20
08
20
09
20
10
20
11
20
12
20
13
20
14
20
15
Figure 2-7 Affordability Ratio (1996-2015)
Source: Data from R&VD’s statistics
Figure 2-8 Private Domestic Rental Index (1996-2015)
Source: Data based on R&VD’s statistics
Flat Size Private housing 2.10 According to R&VD, there were about 1.13 million private
domestic units as at 2015 in the territory with a total saleable area of about 64.54 million m2, implying an average saleable area of about 57m2 per unit. Based on the average household size of 2.9 persons, it could be derived that the average saleable area per person was about 20m2.
2.11 R&VD subdivides private domestic units into five classes,
namely Class A with saleable area less than 40m2, Class B with saleable area of 40m2 to 69.9m2, Class C with saleable area of 70m2 to 99.9m2, Class D with saleable area of 100m2 to 159.9m2, and Class E with saleable area of 160m2 or above. Figure 2-9 shows that Class B stock has taken up the largest share since 1989. From 1985 to 2015, the share of Class A stock dropped from 41.7% to 31.1% whereas that of Class B increased from 40.9% to 48.9%. There was also a slight increase in the share of Class C stock from 9.4% to 12.2%, whereas the share of Classes D and E stocks remained relatively steady.
Hong Kong 2030+ 25
0%
10%
20%
30%
40%
50%
60%
70%
80%
19
85
19
86
19
87
19
88
19
89
19
90
19
91
19
92
19
93
19
94
19
95
19
96
19
97
19
98
19
99
20
00
20
01
20
02
20
03
20
04
20
05
20
06
20
07
20
08
20
09
20
10
20
11
20
12
20
13
20
14
20
15
Class A Class B Class C Class D Class E
Figure 2-9 Shares of Stock of Private Domestic by Classes (1985-2015)
Note: village houses have been excluded from private domestic since 2003 Source: Data based on R&VD’s statistics
2.12 Although the proportion of newly completed flats in different classes of private domestic flats had fluctuated between 1985 and 2015, the general trend of decreasing share of Class A flats and increasing shares of flats of other classes could be observed: Class A down substantially from 66.7% to 18.9%, Class B up from 21.2% to 44.6%, Class C up from 5.6% to 19.4%, Class D up from 4.8% to 13.0%, and Class E up from 1.7% to 4.0% (Figure 2-10).
Figure 2-10 Shares of Newly Completed Private Domestic Flats by Classes (1985-2015)
Source: Data based on R&VD’s statistics
Public housing
2.13 According to the Housing Department, the average internal floor area (IFA) of the HKHA’s PRH units as at March 2015 was about 32m2, with an average IFA per person of about 13m2.
2.14 According to the LTHS published by the Transport and Housing Bureau (THB) in December 2014xiv, the allocation standard of PRH under the HKHA’s existing policy is no less than 7m2 of IFA per person as far as resources permit, while in practice, the actual IFA per person of PRH tenants has been gradually increased to 13m2 over the years. Besides, PRH households are regarded as overcrowded if the IFA of their flats are less than 5.5m2 per person. Such overcrowded families may apply
0
10
20
30
40
50
60
1985 1987 1989 1991 1993 1995 1997 1999 2001 2003 2005 2007 2009 2011 2013 2015
Share of private domestic stock (%)
Class A Class B Class C Class D Class E
Hong Kong 2030+ 26
through the Territory-wide Overcrowding Relief Transfer Exercise for relocation to larger flats. On the other hand, those families with IFA below 7m2 per person may apply for the Living Space Improvement Transfer Scheme to improve their living condition. Subject to the availability of resources, HKHA arranges one Territory-wide Overcrowding Relief exercise and one Living Space Improvement Transfer Scheme exercise each year.
Sub-divided units
2.15 According to a Thematic Household Survey on the housing
condition of SDUs undertaken by C&SD in 2015xv, there were a total of 88,000 SDUs in private domestic/composite buildings (excluding village houses) aged 25 and above, accommodating 87,600 households . Of these, 65.2% of the households were living in units with area of 7m2 to less than 13m2, followed by units with area of 13m2 to less than 20m2 (16.9%), below 7m2 (13.4%), and 20m2 or above (4.4%)26. The median area of the units was 10.3m2.
Ageing Building Stock 2.16 Hong Kong’s building stock continues to grow old. The
ageing problem is expected to intensify in the coming decades due to the building boom in the 1970-80s. Assuming no demolition from now on, a total of about 326,000 private housing units will be aged 70 years or above (with buildings
26
Provided by respondents to the best of their knowledge and excluding area shared with other households.
completed in 1976 or before) by 2046, which is nearly 300 times of the building stock of about 1,100 units of the same age in 2015. Spatially, such old private units are concentrated in the old urban areas, with over 60,000 in Yau Tsim Mong District by 2046 (Figure 2-11).
2.17 Regarding PRH, a total of 24 estates had building blocks over 40 years by end 2015 as listed in Table 2-1 below. Table 2-1 PRH Estates with Building Blocks over 40 Years by
End 2015 District Estates
Kowloon City HKHA - Ma Tau Wai Estate and Oi Man Estate HKHS - Chun Seen Mei Chuen and Lok Man Sun Chuen
Eastern HKHA - Model Housing Estate HKHS - Healthy Village and Ming Wah Da Ha
Sothern HKHA - Wah Fu (I) Estate and Wah Fu (II) Estate HKHS - Yue Kwong Chuen
Kwun Tong HKHA - Ping Shek Estate and Wo Lok Estate HKHS - Kwun Tong Garden Estate
Tsuen Wan HKHA - Fuk Loi Estate and Lei Muk Shue (II) Estate HKHS - Moon Lok Dai Ha
Central and Western
HKHA - Sai Wan Estate HKHS - Kwun Lung Lau
Wong Tai Sin HKHA - Choi Hung Estate and Mei Tung Estate
Kwai Tsing HKHA - Lai King Estate and Kwai Shing West Estate
Wan Chai HKHS - Lai Tak Tsuen
Sham Shui Po HKHA - Pak Tin Estate
Sha Tin HKHA – Lek Yuen Estate Source: Based on the “Completion Year” or “Year of Intake” in 1975 or before of individual estates avialable in HKHA’s and HKHA’s websites
Hong Kong 2030+ 27
Figure 2-11 Private Housing Units Aged 70 or above by 2046 (by District Councils)
Note: assuming no demolition from now on Source: Data based on PlanD’s statistics
Hong Kong 2030+ 28
Housing for Elderly 2.18 By end 2014, about 555,100 people aged 60 or above lived in
public rental flats of HKHA and HKHS. The Government will continue to give elderly people in need priority access to public housing through various schemes. As at September 2015, the average waiting time27 of elderly one-person applicants for PRH was about 2.0 years.
2.19 The HKHS is operating the Senior Citizen Residence Scheme that provides purpose-built housing (namely, Cheerful Court in Ngau Tau Kok and Jolly Place in Tseung Kwan O) with integrated health care facilities on a “lease-for-life” basis to eligible senior citizens in the middle income group. The HKHS also provides purpose-built elderly housing (The Tanner Hill in North Point) under market-driven and renting only approach under its Joyous Living Scheme.
27
Waiting time refers to the time taken between registration for PRH and first
flat offer, excluding any frozen period during the application period (e.g. when the applicant has not yet fulfilled the residence requirement; the applicant has requested to put his/her application on hold pending arrival of family members for family reunion; the applicant is imprisoned, etc.). The average waiting time for general applicants refers to the average of the waiting time of those general applicants who were housed to PRH in the past 12 months.
Key Issues pertinent to Strategic Spatial Planning
Adequate and timely provision of housing land supply
2.20 Affordable and adequate supply of housing can help promote well-being of our citizens. However, housing supply has dropped considerably since 2003. Vacancy rates of both private and public housing remain low. The price and rental indices for private residential properties have been increasing, whereas the number of applicants for PRH keeps increasing. To address this severe supply-demand imbalance, while strenuous efforts are needed to make up the housing shortage in the short term, our territorial spatial development strategy is required to ensure a suitable, adequate and timely land supply for our housing development.
2.21 In planning for housing land supply, there is also a need to promote a balanced community mix by providing wider housing choices so as to meet the changing demographics, different community aspirations and social needs.
2.22 Delivering the LTHS’s housing supply target requires adequate and timely supply of land. Noting that the entire land and housing development process (including planning and engineering study, detailed design study, site formation, building construction and infrastructure works) will usually require a total of 11 years or longer to completexiv, there is a need to plan ahead and to create a land reserve to increase the robustness of our development strategy in catering for unforeseeable circumstances including changes in the projection assumptions (such as projected number of domestic
Hong Kong 2030+ 29
households, vacancy rate, demolition and redevelopment, etc). Changing demographic trends
2.23 Smaller household size has resulted in a faster household
growth than population. As explained in Chapter 1, the
number of domestic households is projected to grow from 2.43
million in 2014 to the peak of 2.93 million in 2044. Meanwhile,
the population continues to age. It is projected that the
proportion of old aged population (aged 65 or above) will rise
markedly from 15% in mid 2014 to 33% in 2044 (i.e. about one
in three Hong Kong’s population). These two demographic
trends would exert continuous pressure on housing demand.
It is necessary to explore how to address the housing needs of
the elderly and to facilitate“ageing in place” noting that this
will also reduce the pressure on social welfare facilities
including the Home for the Aged. Besides, it is important to
provide a living environment suitable for all age groups and
different household types (e.g. singletons, retirees, families
with children, etc.) and to meet their housing needs by
providing a variety of housing choices.
2.24 In parallel, ageing population dwindles the size of our labour
force which will gradually decrease after 2018 (as explained in Chapters 1 and 3). To replenish our shrinking working population, it is the policy objective under the Population Policy to attract overseas talents which will take up housing units.
2.25 Besides, the drop in average domestic household size (from 2.9 persons in 2014 to 2.7 persons starting from 2034) and the growth of small households (one to three persons) from about 66.6% in 2011 to about 71.4% in 2024) also have impacts on the demand for more housing units and different types and sizes, thus affecting housing requirements.
2.26 HKHA adopts universal design in the planning and development of its new subsidised housing. For private residential development, there is however no provision for elderly-friendly design, except the requirements for barrier free access in common areas. Consideration may be given to exploring means to facilitate, encourage or even mandate the adoption of different age-friendly aspect of universal design in private residential flats to facilitate safe and independent “ageing in place”. Community need/aspirations for more spacious living space
2.27 The size of our home space is not commensurate with our level of social and economic development. According to a research undertaken by Professor Rebecca Chiu of the University of Hong Kongxvi, the average dwelling floor space per person in Hong Kong was estimated to be the lowest among developed major cities in East Asia as shown in Table 2-2 below.
Hong Kong 2030+ 30
Table 2-2 Dwelling Space and Average Dwelling Space Per Person in Hong Kong and Other Selected Cities
Hong Kong
Singapore Seoul Tokyo Shanghai Taipei
Average floor area per dwelling (m
2)
43.5 86.8 63 64 102 102
Average number of persons per dwelling
2.9 3.5 2.5 1.99 2.97 2.59
Average floor area per person (m
2)
15 24.8 25.2 32 34.5*/ 17.5
#
39
* refers to floor area which includes public areas such as staircases and common corridor, etc.
# refers to residential area which includes bedroom only, excluding areas of living room, kitchen, lavatory, corridors, etc).
Source: Data based on Ming Pao (3 December 2014)
2.28 The community generally aspires for more spacious home space. An increase in home space per capita would inevitably intensify the housing land requirement. We need to consider whether a buffer should be built into the development capacity to cater for home space enhancement in long term planning. High cost of accommodation
2.29 The high property prices and rental value have increased the cost of living in Hong Kong, which not only affects Hong Kong people’s quality of life, but also undermines our competitiveness to attract foreign business and overseas talents. According to C&SD’s 2016 Annual Survey of Companies in Hong Kong Representing Parent Companies
Located outside Hong Kong, about 40% of company respondents expressed that “availability and cost of residential accommodation” was an unfavourable factor for setting up regional headquarters/regional offices/local offices in Hong Kongxvii. The corresponding findings for the same series of survey undertaken from 2011 to 2014 were of similar levels, ranging between 39% and 43%. As such, it is important for Hong Kong to ensure sufficient housing supply at reasonable prices to attract and retain talents from worldwide.
Ageing building stock
2.30 Noting that buildings in Hong Kong are mainly reinforced
concrete structures designed to have a serviceable life of
round 50 years only and that a large number of large private
and public housing estates will be aged over 70 by 2046,
redevelopment of such large stock of housing would be very
challenging, bearing in mind that just about 1,900 private
residential units were demolished per year from 2010 and
2014 and that redevelopment of PRH has been considered
cautiously on an estate-by-estate basis taking into account
various factors including the structural conditions of buildings,
cost-effectiveness of repair works, availability of suitable
rehousing resources and build-back potential. With the
pressing demand for PRH, it is not advisable to carry out any
massive redevelopment programme since this will result in
freezing a large number of PRH units which may otherwise be
allocated to those waiting for PRH. More importantly,
redevelopment of residential buildings usually takes a long
Hong Kong 2030+ 31
lead-time due to the need for amalgamating the fragmented
ownership, re-housing/decanting and compensation, plus
going through development process including planning
procedures, land transaction and building works.
2.31 In view of the huge volume of ageing building stock vis-à-vis
current modest scale of redevelopment, there is a need for the
Government to step up urban regeneration efforts and policies
to rejuvenate the extensive old urban fabric and improve the
living environment. In parallel, we also need to advocate
boosting the building management and maintenance initiatives
with a view to extending the life span of buildings.
Comprehensive development vs infill development
2.32 Infill developments within the urban areas are currently used
as one of the means to address housing shortage especially in
the short term. While some people tend to prefer staying in
the urban areas, there is a limit to infill developments in the
light of the current congestion and the possible adverse impact
of infill developments on natural light penetration, air
ventilation, traffic and infrastructure, etc.. The high
development intensity also tends to constrain good urban
design and overtax the existing facilities and infrastructure of
individual neighbourhood and on a cumulative basis. To
address the long-term housing demand and meet the
community aspirations for a better living environment under a
forecasted population growth of about 0.98 million from about
7.24 million in 2014 to about 8.22 million in 2043 in C&SD’s
baseline projections (see Figure 1-1 in Chapter 1), there is a
need to identify sizable strategic growth areas to allow for
comprehensive developments with due consideration to urban
design, provision of government, institution and community
facilities and development intensity.
ENDNOTES xi C&SD (October 2016). Hong Kong Annual Digest of Statistics
(2016 Edition). Retrieved from http://www.statistics.gov.hk/pub/B10100032016AN16B0100.pdf
xii Hong Kong Housing Authority (2016). Housing in Figures 2016. Retrieved from https://www.housingauthority.gov.hk/en/common/pdf/about-us/publications-and-statistics/HIF.pdf
xiii Demographia (3rd Quarter 2015). 12th Annual Demographia
International Housing Affordability Survey. Retrieved from http://www.demographia.com/dhi.pdf
xiv Transport and Housing Bureau (2014). Long Term Housing Strategy (December 2014). Retrieved from http://www.thb.gov.hk/eng/policy/housing/policy/lths/LTHS201412.pdf
xv C&SD (March 2016). Thematic Household Survey Report No. 60 - Housing Conditions of Sub-divided Units in Hong Kong. Retrieved from http://www.statistics.gov.hk/pub/B11302602016XXXXB0100.pdf
xvi Ming Pao (3 December 2014) 「港人均居住面積落後亞洲大城
市」 pp. A10 and A11

Hong Kong 2030+ 32
xvii C&SD (October 2015). Report on 2016 Annual Survey of
Companies in Hong Kong Representing Parent Companies Located outside Hong Kong. Retrieved from http://www.statistics.gov.hk/pub/B11100042016AN16B0100.pdf
Hong Kong 2030+ 33
In the past few decades, both the global and Hong Kong economies have undergone waves of changes and transformation. Our economy has transformed from a manufacturing based economy to a vibrant services economy, with our
services sector accounting for 93% of the Gross Domestic Product (GDP). Over half of the total GDP and almost half of the total employment are contributed by the four key industries, namely trading and logistics services, financial services, tourism, and professional and other producer services. While the four key industries are expected to continue to underpin our economy, there are a few emerging industries where Hong Kong has comparative advantages and could be developed further with a view to diversifying our economic base. This Chapter gives an overview of our economy and highlights the key economic issues pertaining to our strategic planning.
Economic Growth 3.1 According to the Report of the Working Group on Long-term
Fiscal Planning released in March 2014 xviii , Hong Kong’s economic growth has steadily decelerated over time, reflecting the evolution from a developing economy marked by high growth to a mature economy with lower growth. Real gross domestic product (GDP) growth was 8.9% per annum in the 1970s, 7.4% per annum in the 1980s, 3.6% per annum in the 1990s and 4.2% per annum in the 2000s. As indicated in the 2016-17 Budgetxix, GDP increased by 2.4% for 2015 in real terms over 2014, and is forecasted to grow in real terms at 1% to 2% in 2016. For the medium term, the average GDP growth rate is forecasted to be 3% per annum in real terms from 2017 to 2020.
3.2 According to the Report of the Working Group on Long-term Fiscal Planning (Phase One), for the past 30 years, the trend of GDP growth was about 4.6% per annum. This was achieved with the support of about 1.3% per annum growth in labour force, and around 3% labour productivity growth per annum, the latter being driven by an ongoing process of structural transformation towards a knowledge-based and high value-added service economy.
Economy 3
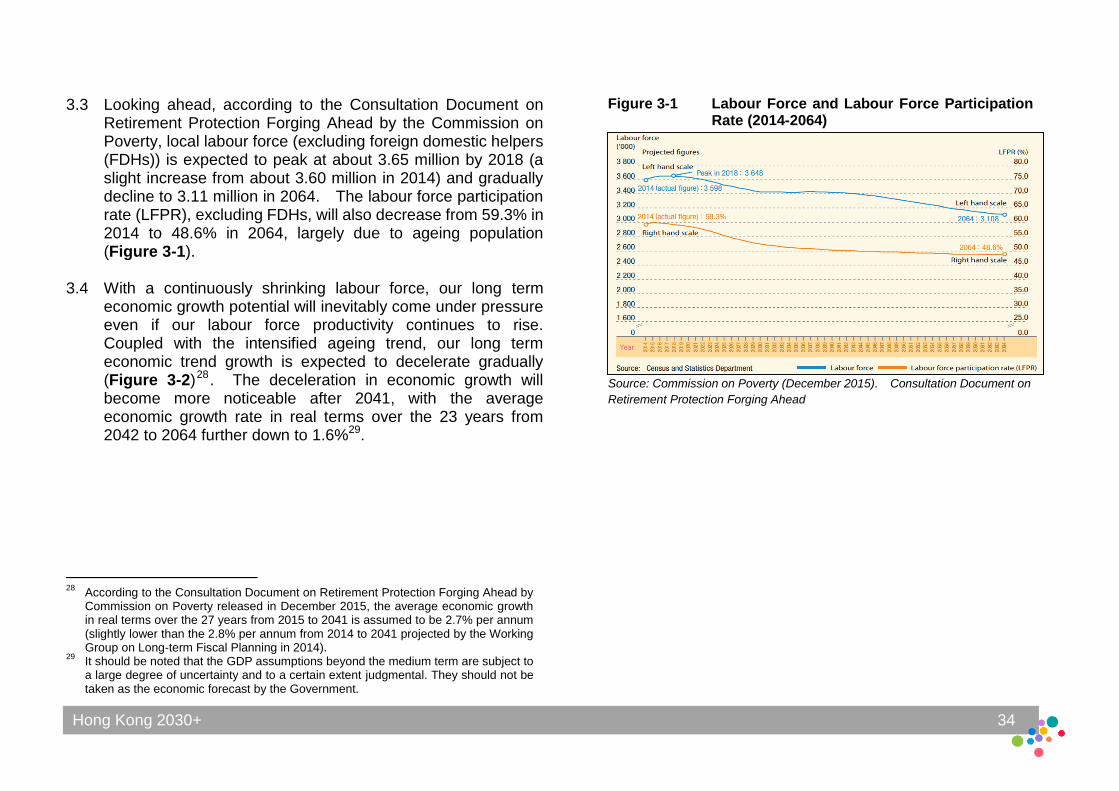
Hong Kong 2030+ 34
3.3 Looking ahead, according to the Consultation Document on Retirement Protection Forging Ahead by the Commission on Poverty, local labour force (excluding foreign domestic helpers (FDHs)) is expected to peak at about 3.65 million by 2018 (a slight increase from about 3.60 million in 2014) and gradually decline to 3.11 million in 2064. The labour force participation rate (LFPR), excluding FDHs, will also decrease from 59.3% in 2014 to 48.6% in 2064, largely due to ageing population (Figure 3-1).
3.4 With a continuously shrinking labour force, our long term economic growth potential will inevitably come under pressure even if our labour force productivity continues to rise. Coupled with the intensified ageing trend, our long term economic trend growth is expected to decelerate gradually (Figure 3-2)28. The deceleration in economic growth will become more noticeable after 2041, with the average economic growth rate in real terms over the 23 years from 2042 to 2064 further down to 1.6%29.
28
According to the Consultation Document on Retirement Protection Forging Ahead by Commission on Poverty released in December 2015, the average economic growth in real terms over the 27 years from 2015 to 2041 is assumed to be 2.7% per annum (slightly lower than the 2.8% per annum from 2014 to 2041 projected by the Working Group on Long-term Fiscal Planning in 2014).
29 It should be noted that the GDP assumptions beyond the medium term are subject to
a large degree of uncertainty and to a certain extent judgmental. They should not be taken as the economic forecast by the Government.
Figure 3-1 Labour Force and Labour Force Participation Rate (2014-2064)
Source: Commission on Poverty (December 2015). Consultation Document on
Retirement Protection Forging Ahead
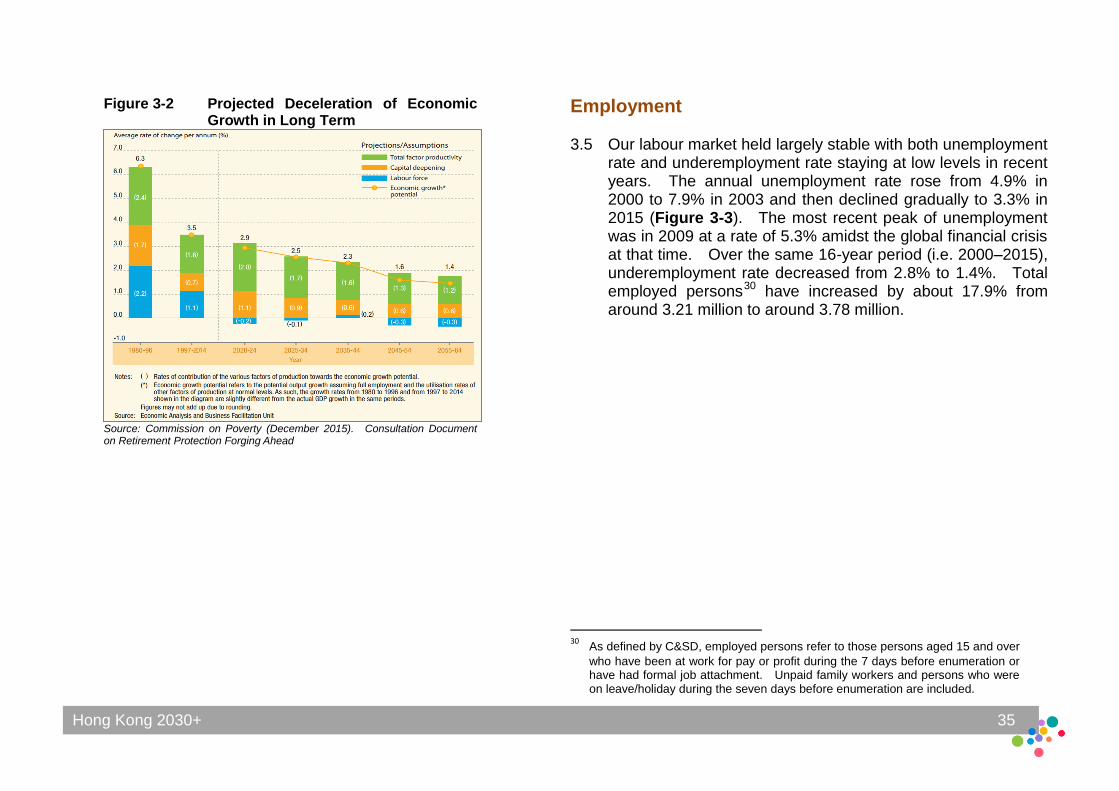
Hong Kong 2030+ 35
Figure 3-2 Projected Deceleration of Economic Growth in Long Term
Source: Commission on Poverty (December 2015). Consultation Document on Retirement Protection Forging Ahead
Employment
3.5 Our labour market held largely stable with both unemployment rate and underemployment rate staying at low levels in recent years. The annual unemployment rate rose from 4.9% in 2000 to 7.9% in 2003 and then declined gradually to 3.3% in 2015 (Figure 3-3). The most recent peak of unemployment was in 2009 at a rate of 5.3% amidst the global financial crisis at that time. Over the same 16-year period (i.e. 2000–2015), underemployment rate decreased from 2.8% to 1.4%. Total employed persons30 have increased by about 17.9% from around 3.21 million to around 3.78 million.
30
As defined by C&SD, employed persons refer to those persons aged 15 and over
who have been at work for pay or profit during the 7 days before enumeration or have had formal job attachment. Unpaid family workers and persons who were on leave/holiday during the seven days before enumeration are included.
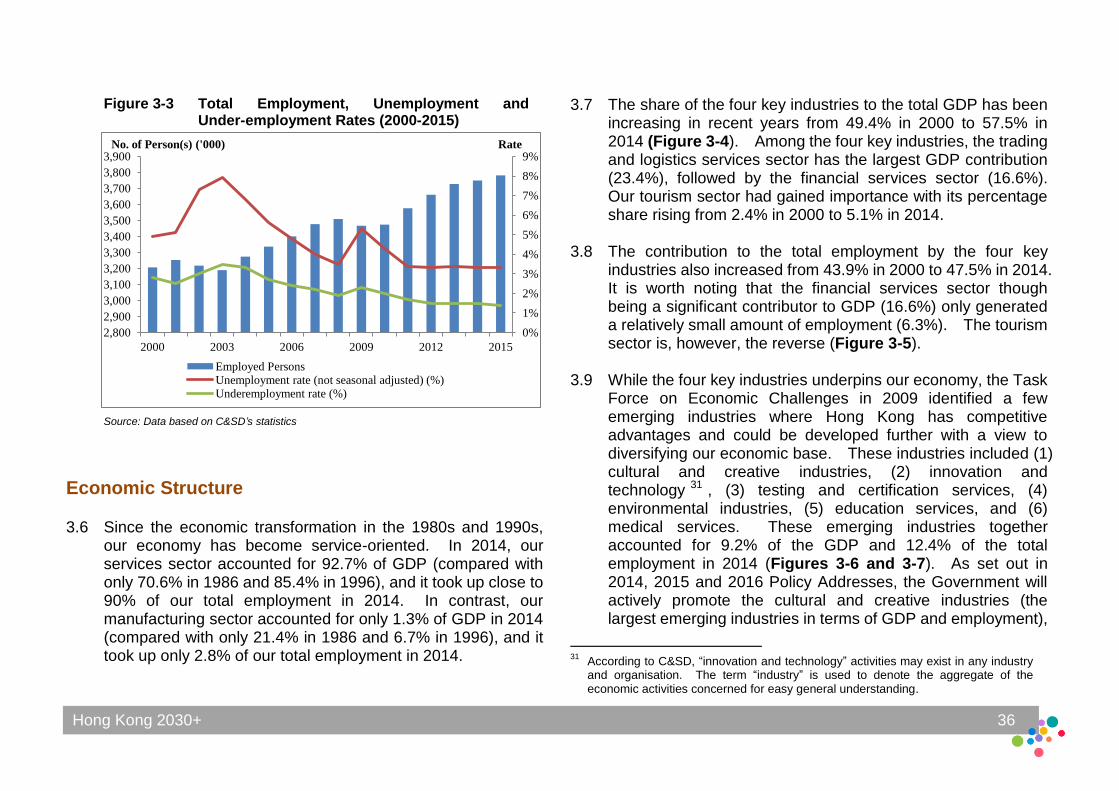
Hong Kong 2030+ 36
0%
1%
2%
3%
4%
5%
6%
7%
8%
9%
2,800
2,900
3,000
3,100
3,200
3,300
3,400
3,500
3,600
3,700
3,800
3,900
2000 2003 2006 2009 2012 2015
Employed Persons Unemployment rate (not seasonal adjusted) (%) Underemployment rate (%)
No. of Person(s) ('000) Rate
Figure 3-3 Total Employment, Unemployment and Under-employment Rates (2000-2015)
Source: Data based on C&SD’s statistics
Economic Structure
3.6 Since the economic transformation in the 1980s and 1990s, our economy has become service-oriented. In 2014, our services sector accounted for 92.7% of GDP (compared with only 70.6% in 1986 and 85.4% in 1996), and it took up close to 90% of our total employment in 2014. In contrast, our manufacturing sector accounted for only 1.3% of GDP in 2014 (compared with only 21.4% in 1986 and 6.7% in 1996), and it took up only 2.8% of our total employment in 2014.
3.7 The share of the four key industries to the total GDP has been increasing in recent years from 49.4% in 2000 to 57.5% in 2014 (Figure 3-4). Among the four key industries, the trading and logistics services sector has the largest GDP contribution (23.4%), followed by the financial services sector (16.6%). Our tourism sector had gained importance with its percentage share rising from 2.4% in 2000 to 5.1% in 2014.
3.8 The contribution to the total employment by the four key industries also increased from 43.9% in 2000 to 47.5% in 2014. It is worth noting that the financial services sector though being a significant contributor to GDP (16.6%) only generated a relatively small amount of employment (6.3%). The tourism sector is, however, the reverse (Figure 3-5).
3.9 While the four key industries underpins our economy, the Task
Force on Economic Challenges in 2009 identified a few emerging industries where Hong Kong has competitive advantages and could be developed further with a view to diversifying our economic base. These industries included (1) cultural and creative industries, (2) innovation and technology 31 , (3) testing and certification services, (4) environmental industries, (5) education services, and (6) medical services. These emerging industries together accounted for 9.2% of the GDP and 12.4% of the total employment in 2014 (Figures 3-6 and 3-7). As set out in 2014, 2015 and 2016 Policy Addresses, the Government will actively promote the cultural and creative industries (the largest emerging industries in terms of GDP and employment),
31
According to C&SD, “innovation and technology” activities may exist in any industry and organisation. The term “industry” is used to denote the aggregate of the economic activities concerned for easy general understanding.
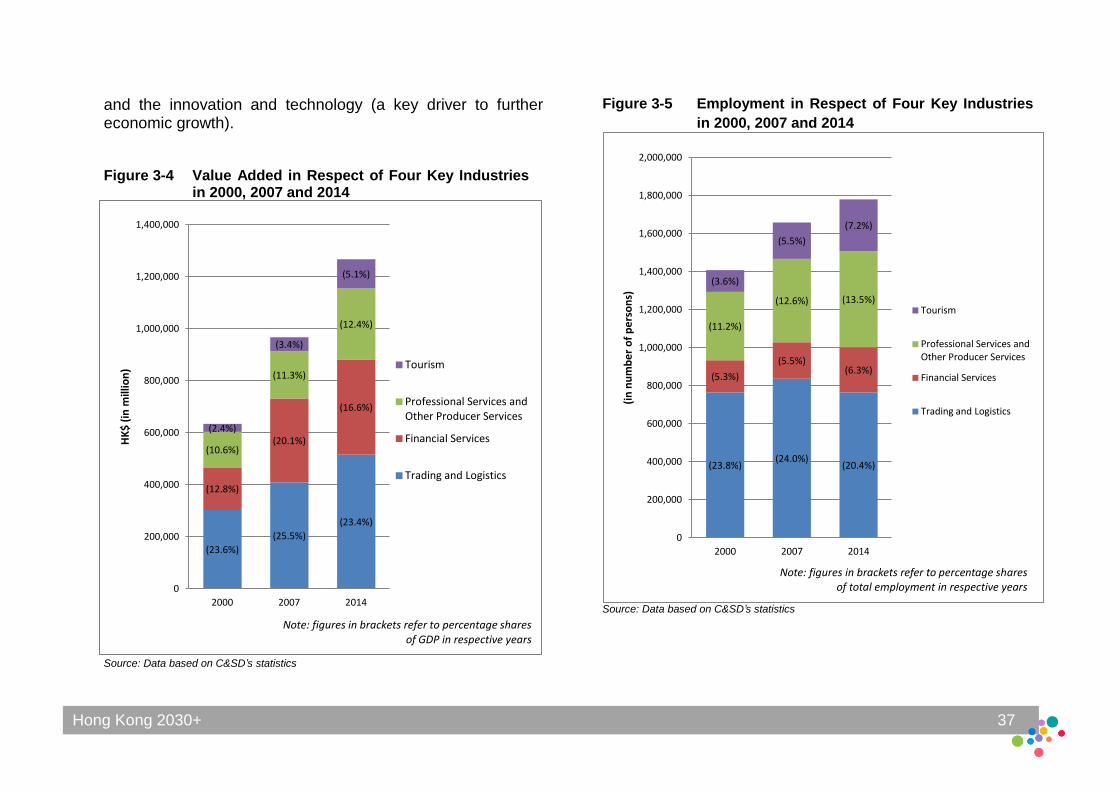
Hong Kong 2030+ 37
(23.8%) (24.0%)
(20.4%)
(5.3%)
(5.5%) (6.3%)
(11.2%)
(12.6%) (13.5%)
(3.6%)
(5.5%)
(7.2%)
0
200,000
400,000
600,000
800,000
1,000,000
1,200,000
1,400,000
1,600,000
1,800,000
2,000,000
2000 2007 2014
(in
nu
mb
er
of
pe
rso
ns)
Tourism
Professional Services and Other Producer Services
Financial Services
Trading and Logistics
and the innovation and technology (a key driver to further economic growth).
Figure 3-4 Value Added in Respect of Four Key Industries
in 2000, 2007 and 2014
Source: Data based on C&SD’s statistics
Figure 3-5 Employment in Respect of Four Key Industries
in 2000, 2007 and 2014
Source: Data based on C&SD’s statistics
(23.6%)
(25.5%)
(23.4%)
(12.8%)
(20.1%)
(16.6%)
(10.6%)
(11.3%)
(12.4%)
(2.4%)
(3.4%)
(5.1%)
0
200,000
400,000
600,000
800,000
1,000,000
1,200,000
1,400,000
2000 2007 2014
HK
$ (
in m
illio
n) Tourism
Professional Services and Other Producer Services
Financial Services
Trading and Logistics
Note: figures in brackets refer to percentage shares of GDP in respective years
Note: figures in brackets refer to percentage shares of total employment in respective years
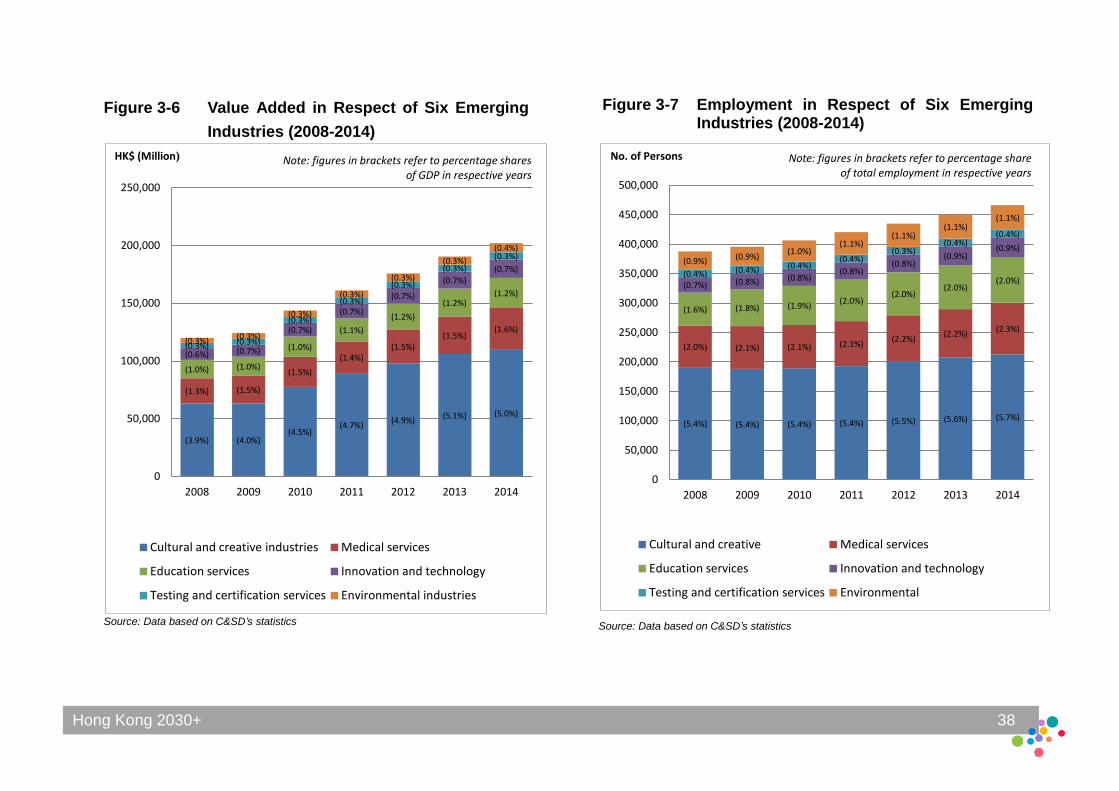
Hong Kong 2030+ 38
(5.4%) (5.4%) (5.4%) (5.4%) (5.5%) (5.6%) (5.7%)
(2.0%) (2.1%) (2.1%) (2.1%) (2.2%)
(2.2%) (2.3%)
(1.6%) (1.8%) (1.9%) (2.0%)
(2.0%) (2.0%)
(2.0%) (0.7%) (0.8%) (0.8%) (0.8%)
(0.8%) (0.9%)
(0.9%)
(0.4%) (0.4%) (0.4%) (0.4%)
(0.3%) (0.4%)
(0.4%)
(0.9%) (0.9%) (1.0%)
(1.1%) (1.1%)
(1.1%) (1.1%)
0
50,000
100,000
150,000
200,000
250,000
300,000
350,000
400,000
450,000
500,000
2008 2009 2010 2011 2012 2013 2014
Cultural and creative Medical services
Education services Innovation and technology
Testing and certification services Environmental
No. of Persons
(3.9%) (4.0%) (4.5%)
(4.7%) (4.9%)
(5.1%) (5.0%)
(1.3%) (1.5%)
(1.5%)
(1.4%) (1.5%)
(1.5%) (1.6%)
(1.0%) (1.0%)
(1.0%)
(1.1%)
(1.2%)
(1.2%) (1.2%)
(0.6%) (0.7%)
(0.7%)
(0.7%)
(0.7%)
(0.7%) (0.7%)
(0.3%) (0.3%)
(0.3%)
(0.3%)
(0.3%)
(0.3%)
(0.3%)
(0.3%) (0.3%)
(0.3%)
(0.3%)
(0.3%)
(0.3%)
(0.4%)
0
50,000
100,000
150,000
200,000
250,000
2008 2009 2010 2011 2012 2013 2014
Cultural and creative industries Medical services
Education services Innovation and technology
Testing and certification services Environmental industries
HK$ (Million) Note: figures in brackets refer to percentage shares of GDP in respective years
Figure 3-6 Value Added in Respect of Six Emerging
Industries (2008-2014)
Source: Data based on C&SD’s statistics
Figure 3-7 Employment in Respect of Six Emerging Industries (2008-2014)
Source: Data based on C&SD’s statistics
Note: figures in brackets refer to percentage share of total employment in respective years
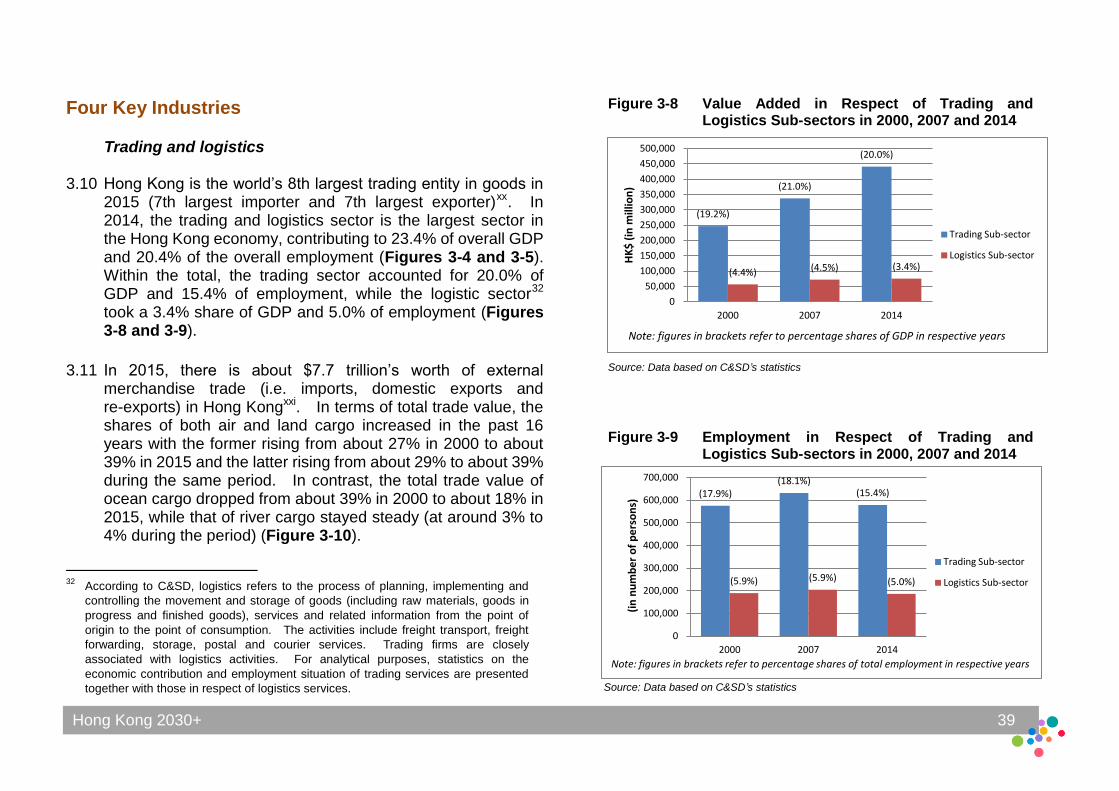
Hong Kong 2030+ 39
(17.9%) (18.1%)
(15.4%)
(5.9%) (5.9%) (5.0%)
0
100,000
200,000
300,000
400,000
500,000
600,000
700,000
2000 2007 2014
(in
nu
mb
er
of
pe
rso
ns)
Trading Sub-sector
Logistics Sub-sector
Note: figures in brackets refer to percentage shares of total employment in respective years
Source: Data based on C&SD’s statistics
(19.2%)
(21.0%)
(20.0%)
(4.4%) (4.5%) (3.4%)
0
50,000
100,000
150,000
200,000
250,000
300,000
350,000
400,000
450,000
500,000
2000 2007 2014
HK
$ (
in m
illio
n)
Trading Sub-sector
Logistics Sub-sector
Note: figures in brackets refer to percentage shares of GDP in respective years
Four Key Industries Trading and logistics
3.10 Hong Kong is the world’s 8th largest trading entity in goods in
2015 (7th largest importer and 7th largest exporter)xx. In 2014, the trading and logistics sector is the largest sector in the Hong Kong economy, contributing to 23.4% of overall GDP and 20.4% of the overall employment (Figures 3-4 and 3-5). Within the total, the trading sector accounted for 20.0% of GDP and 15.4% of employment, while the logistic sector32 took a 3.4% share of GDP and 5.0% of employment (Figures 3-8 and 3-9).
3.11 In 2015, there is about $7.7 trillion’s worth of external
merchandise trade (i.e. imports, domestic exports and re-exports) in Hong Kongxxi. In terms of total trade value, the shares of both air and land cargo increased in the past 16 years with the former rising from about 27% in 2000 to about 39% in 2015 and the latter rising from about 29% to about 39% during the same period. In contrast, the total trade value of ocean cargo dropped from about 39% in 2000 to about 18% in 2015, while that of river cargo stayed steady (at around 3% to 4% during the period) (Figure 3-10).
32
According to C&SD, logistics refers to the process of planning, implementing and
controlling the movement and storage of goods (including raw materials, goods in
progress and finished goods), services and related information from the point of
origin to the point of consumption. The activities include freight transport, freight
forwarding, storage, postal and courier services. Trading firms are closely
associated with logistics activities. For analytical purposes, statistics on the
economic contribution and employment situation of trading services are presented
together with those in respect of logistics services.
Figure 3-8 Value Added in Respect of Trading and Logistics Sub-sectors in 2000, 2007 and 2014
Source: Data based on C&SD’s statistics
Figure 3-9 Employment in Respect of Trading and Logistics Sub-sectors in 2000, 2007 and 2014
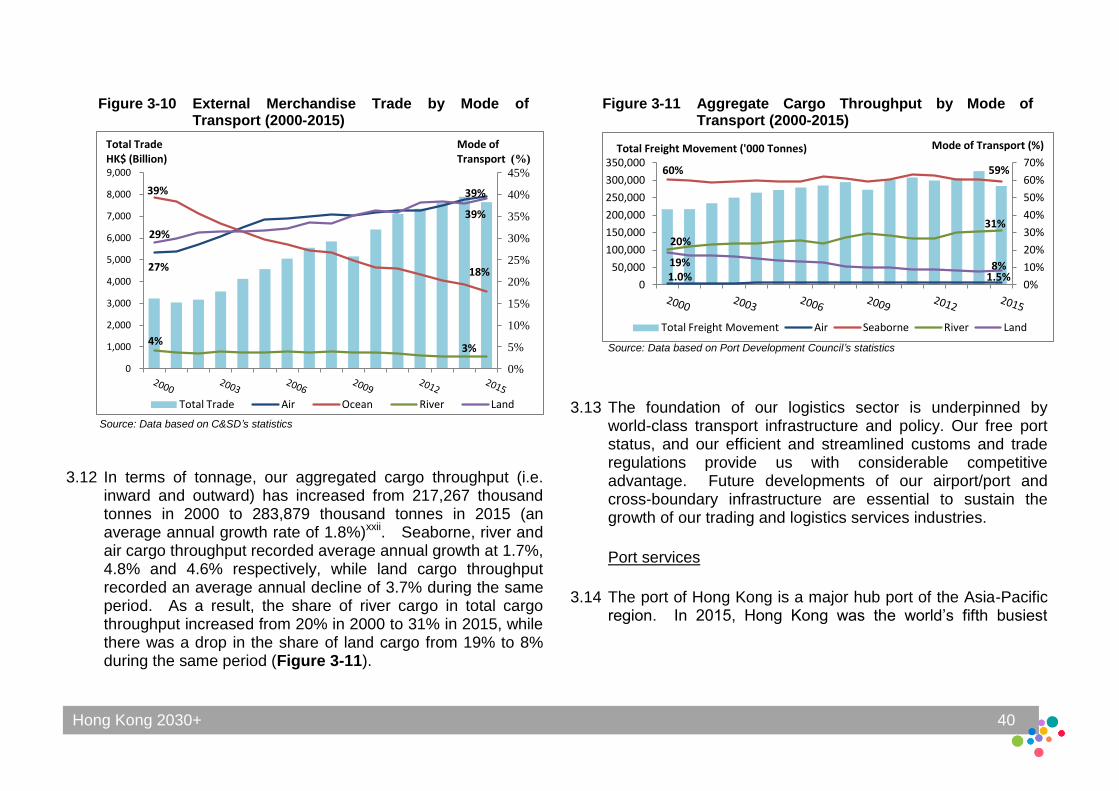
Hong Kong 2030+ 40
0%
5%
10%
15%
20%
25%
30%
35%
40%
45%
0
1,000
2,000
3,000
4,000
5,000
6,000
7,000
8,000
9,000
Total Trade Air Ocean River Land
Total Trade HK$ (Billion)
Mode of Transport (%)
39%
29%
27%
4%
39%
39%
18%
3%
0%
10%
20%
30%
40%
50%
60%
70%
0
50,000
100,000
150,000
200,000
250,000
300,000
350,000
Total Freight Movement Air Seaborne River Land
Total Freight Movement ('000 Tonnes) Mode of Transport (%)
60%
20%
19% 1.0%
59%
31%
8% 1.5%
Source: Data based on C&SD’s statistics
Figure 3-10 External Merchandise Trade by Mode of Transport (2000-2015)
3.12 In terms of tonnage, our aggregated cargo throughput (i.e.
inward and outward) has increased from 217,267 thousand tonnes in 2000 to 283,879 thousand tonnes in 2015 (an average annual growth rate of 1.8%)xxii. Seaborne, river and air cargo throughput recorded average annual growth at 1.7%, 4.8% and 4.6% respectively, while land cargo throughput recorded an average annual decline of 3.7% during the same period. As a result, the share of river cargo in total cargo throughput increased from 20% in 2000 to 31% in 2015, while there was a drop in the share of land cargo from 19% to 8% during the same period (Figure 3-11).
Figure 3-11 Aggregate Cargo Throughput by Mode of Transport (2000-2015)
Source: Data based on Port Development Council’s statistics
3.13 The foundation of our logistics sector is underpinned by world-class transport infrastructure and policy. Our free port status, and our efficient and streamlined customs and trade regulations provide us with considerable competitive advantage. Future developments of our airport/port and cross-boundary infrastructure are essential to sustain the growth of our trading and logistics services industries.
Port services
3.14 The port of Hong Kong is a major hub port of the Asia-Pacific
region. In 2015, Hong Kong was the world’s fifth busiest
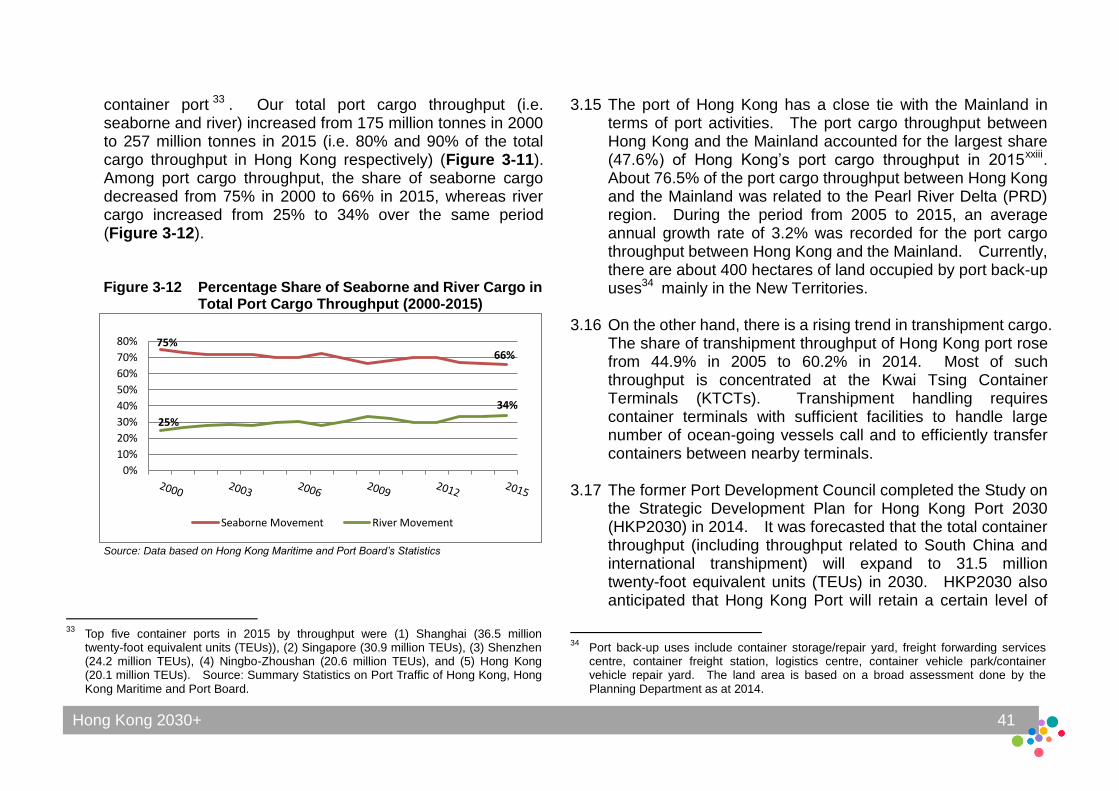
Hong Kong 2030+ 41
0%
10%
20%
30%
40%
50%
60%
70%
80%
Seaborne Movement River Movement
75%
25%
66%
34%
container port 33 . Our total port cargo throughput (i.e. seaborne and river) increased from 175 million tonnes in 2000 to 257 million tonnes in 2015 (i.e. 80% and 90% of the total cargo throughput in Hong Kong respectively) (Figure 3-11). Among port cargo throughput, the share of seaborne cargo decreased from 75% in 2000 to 66% in 2015, whereas river cargo increased from 25% to 34% over the same period (Figure 3-12).
Figure 3-12 Percentage Share of Seaborne and River Cargo in Total Port Cargo Throughput (2000-2015)
Source: Data based on Hong Kong Maritime and Port Board’s Statistics
33
Top five container ports in 2015 by throughput were (1) Shanghai (36.5 million twenty-foot equivalent units (TEUs)), (2) Singapore (30.9 million TEUs), (3) Shenzhen (24.2 million TEUs), (4) Ningbo-Zhoushan (20.6 million TEUs), and (5) Hong Kong (20.1 million TEUs). Source: Summary Statistics on Port Traffic of Hong Kong, Hong Kong Maritime and Port Board.
3.15 The port of Hong Kong has a close tie with the Mainland in terms of port activities. The port cargo throughput between Hong Kong and the Mainland accounted for the largest share (47.6%) of Hong Kong’s port cargo throughput in 2015xxiii. About 76.5% of the port cargo throughput between Hong Kong and the Mainland was related to the Pearl River Delta (PRD) region. During the period from 2005 to 2015, an average annual growth rate of 3.2% was recorded for the port cargo throughput between Hong Kong and the Mainland. Currently, there are about 400 hectares of land occupied by port back-up uses34 mainly in the New Territories.
3.16 On the other hand, there is a rising trend in transhipment cargo. The share of transhipment throughput of Hong Kong port rose from 44.9% in 2005 to 60.2% in 2014. Most of such throughput is concentrated at the Kwai Tsing Container Terminals (KTCTs). Transhipment handling requires container terminals with sufficient facilities to handle large number of ocean-going vessels call and to efficiently transfer containers between nearby terminals.
3.17 The former Port Development Council completed the Study on the Strategic Development Plan for Hong Kong Port 2030 (HKP2030) in 2014. It was forecasted that the total container throughput (including throughput related to South China and international transhipment) will expand to 31.5 million twenty-foot equivalent units (TEUs) in 2030. HKP2030 also anticipated that Hong Kong Port will retain a certain level of
34
Port back-up uses include container storage/repair yard, freight forwarding services centre, container freight station, logistics centre, container vehicle park/container vehicle repair yard. The land area is based on a broad assessment done by the Planning Department as at 2014.
Hong Kong 2030+ 42
market share of the South China cargo base due to increasing labour costs in the Mainland, and thus enhancing the cost competitiveness of Hong Kong Port. It was forecasted that container throughput demand for port facilities will continue to grow at Hong Kong Port up to 2030 but at a slow rate, with international transhipment forecasted to contribute the major growth in throughput35 , while throughput related to South China is forecasted to have a slight negative growth. At KTCTs, increasing throughput by barge is expected to take up the space serving ocean vessels, entailing a compromise of handling efficiency.
3.18 A series of development measures are identified under
HKP2030 to improve and maximise the capacity of the existing facilities. These include a better use of existing facilities (especially the River Trade Terminal and the Stonecutters Island Public Cargo Working Area), additional barge berths at KTCTs, improved land use around KTCTs, more co-ordinated development and marketing activities, and expediting development of logistics facilities in the New Territories. With these measures, it is forecasted that the existing infrastructure can be augmented to meet future demand forecasts up to 2030 without the need for creation of new terminal (i.e. Container Terminal 10). Also, HKP2030 suggests to review the Port Cargo Forecast in five years or so to monitor the development of Hong Kong’s port sector and ensure timely provision of port facilities and port related infrastructure.
35
The increasing trend of the share of transhipment throughput is expected to continue. It is expected to reach 75% by 2030, representing a throughput of about 24 million TEUs.
3.19 On the other hand, the total gross tonnage of vessels on the Hong Kong Shipping Register is the fourth-largest in the world. There are about 700 shipping-related companies in the city, offering comprehensive maritime services, including ship management, broking and chartering, finance, marine insurance, maritime law and arbitration and support services. With the continuous expansion of Mainland’s maritime and shipbuilding industries, Hong Kong’s maritime services sector has enormous potential for growth. On this basis, there was an initiative in the 2015 Policy Address to foster the development of high value-added maritime services in Hong Kong. Following another initiative in the 2016 Policy Address, the Hong Kong Maritime and Port Board was set up in April 2016 to provide strategic steer on the vision, direction and policy matters pertaining to the development of Hong Kong’s maritime industry and Hong Kong Port. Air services
3.20 In 2015, the Hong Kong International Airport (HKIA) handled
68.5 million passengers and 4.38 million tonnes of air cargo. It is connected to over 190 destinations, including 47 in the Mainland, through around 1,100 daily flights by more than 100 airlines xxiv . HKIA consolidates and anchors Hong Kong’s position as a hub of commerce and plays a very important role in the development of Hong Kong as a logistics centre. Between 2000 and 2015, the share of air cargo throughput remained steady at about 1% to 1.5% per annum while the trade value of air cargo increased from 27% of the total trade value to 39% over the same period (Figures 3-10 and 3-11), making Hong Kong the busiest air cargo hub in the world in 2014xxv.
Hong Kong 2030+ 43
3.21 Following the full operation of a new air cargo terminal in 2013, the overall cargo handling capacity of the HKIA has increased by 2.6 million tonnesxxvi, further strengthening Hong Kong’s position as an international and regional logistics centre.
3.22 In March 2015, the Government affirmed the need for the Three-Runway System (3RS) project in maintaining Hong Kong’s competitiveness as a global and regional aviation hub, and for sustaining our long-term economic and development needs. Subsequent to the completion of relevant statutory procedures in end April 2016, the Airport Authority Hong Kong (AAHK) commenced the 3RS construction works on 1 August 2016. According to the AAHK, construction works for the project will take around eight years to complete. Upon full commissioning of 3Rs, HKIA will have the capacity to handle around 100 million passengers and 9 million tonnes of cargo annually by 2030. In order to plan for further growth beyond 2030, AAHK has already begun working on the HKIA Master Plan 2035 with a view to mapping out the further long-term development needs of HKIA.
Modern logistics services
3.23 Apart from physical cargo movement, the logistics sector includes transport services, warehousing and distribution, logistics supporting services, etc, which closely link with each other within the logistics cluster. With highly qualified logistics professionals and robust legal system coupled with our strategic location at the heart of Asia and the gateway to the Mainland, Hong Kong has competitive advantages to provide reliable, fast and convenient logistics services to attract customers from overseas and the Mainland.
3.24 In the face of increasing competition from neighbouring regions, Hong Kong’s trading and logistics services industry has been developing towards the provision of high value-added modern logistics services in recent years (e.g. inventory management, regional distribution and global supply chain management). This results in an increasing demand for the international and regional distribution services in Hong Kong.
3.25 Besides, the fast growing trend for e-commerce, on-line shopping, in both business to business and business to consumer modes, and the emergence of smart production as well as smart products and services under a new business model of supply chain have boosted the demand for facilities for logistics and related industries. Financial services36
3.26 Hong Kong is one of the leading global financial centres and
ranked fourth in the Global Financial Centres Index in 201637. It was also the world’s seventh largest and Asia’s second largest banking centre in terms of external positions38xxvii and the fifth largest foreign exchange market in terms of turnoverxxviii. With our strategic location in PRD and the wider Chinese economy, we also act as the world’s largest offshore RMB business hubxix. Besides, we perform as a global asset
36
According to C&SD, financial services cover a wide range of services including banking, insurance, stock brokerage, asset management, and other financial services.
37 Hong Kong was ranked third in 2015 and surpassed by Singapore in 2016
(http://www.longfinance.net/global-financial-centre-index-19/992-gfci-19.html). 38
Sum of liabilities to banks and non-bank customers outside Hong Kong and claims on banks and non-bank customers outside Hong Kong, such as equities, securities and capital instruments.
Hong Kong 2030+ 44
management hub and an international initial public offering (IPO) centre. In 2014, the financial services sector employed about 6.3% of Hong Kong’s total employment, and its activities accounted for around 16.6% of GDP (Figures 3-4 and 3-5).
3.27 In January 2013, the Government established the Financial Services Development Council (FSDC) to support the sustained development of the financial services industry within Hong Kong, promote the further development of Hong Kong’s financial services industry and map out the strategic direction for the development of Hong Kong as an international financial centre. Besides, the Government actively works with the Mainland authorities to promote Hong Kong’s role as a global hub for offshore RMB business providing new opportunities for the financial sectors both in the Mainland and Hong Kongxxix. In 2014, the Government launched the Shanghai-Hong Kong Stock Connect pilot programme establishing mutual stock market access between Hong Kong and the Mainland. The launch of Shenzhen-Hong Kong Stock Connect will also be launched in early December 2016. These new investment channels promote and strengthen the connection between Hong Kong and the Mainland capital markets.
3.28 With the Mainland’s economic policy initiatives and the latest development in the region (including the 13th Five-Year Plan, China (Guangdong) Pilot Free Trade Zone (Guangdong FTZ)39 and “Belt and Road Initiative”), Hong Kong has strong potentials in positioning itself as the financial and business hub of the Greater PRD Region and Asia, and to perform the role of a “super-connector” between the Mainland and the world in
39
Covering Qianhai-Shekou, Nansha and Henqin.
the flow of capital investment and services. The launch of the Asian Infrastructure Investment Bank in January 2016 further offers opportunities to leverage our expertise in capital market financing, asset management and dispute resolution. Besides, the ongoing initiatives made under the “Mainland and Hong Kong Closer Economic Partnership Arrangement” (CEPA) also permit wider access of our service suppliers to the Mainland market fostering closer economic cooperation and a conducive environment for Hong Kong’s financial and economic development. Tourism40
3.29 Tourism contributed to about 5.1% of the GDP and about 7.2%
of the total employment in 2014 (Figures 3-4 and 3-5), compared with about 2.4% of the GDP and about 3.6% of total employment in 2000. Hong Kong was ranked as the top destination in Euromonitor International’s Top 100 City Destinations Ranking released in January 2016. In 2015, the total visitor arrivals to Hong Kong increased to 59.3 millionxxx, with an average annual growth rate of about 10.6% from 200041. With the abolition of the quota system for Hong Kong Group Tour Scheme in 2002, the introduction of the Individual
40
According to C&SD, tourism covers inbound tourism and outbound tourism.
Inbound tourism covers retail trade, accommodation services (covering hotels,
guesthouses, boarding houses and other establishments providing short term
accommodation), food and beverage services, transport and personal services etc.,
yet pertaining only to the part provided to visitors. Outbound tourism covers
cross-boundary passenger transport services and travel agency, reservation service
and related activities, yet pertaining only to the part provided to Hong Kong residents
travelling abroad. 41
Figures of visitor arrivals from 2000 to 2014 are from A Statistical Review of Hong Kong Tourism published by HKTB.
Hong Kong 2030+ 45
29.0% 54.5%
77.3%
0
10,000
20,000
30,000
40,000
50,000
60,000
70,000
2000 2003 2015
The Americas Europe, Africa & the Middle East
Australia, NZ & South Pacific North Asia
South & Southeast Asia Taiwan
Macau SAR / Not Identified Mainland China
No. of Person(s) ('000)
Visit Scheme (IVS) in 2003 and the implementation of multiple-entry Individual Visit Endorsements for permanent residents of Shenzhen from April 2009 to April 2015, the percentage of Mainland visitors increased from 54.5% in 2003 to 77.3% in 2015 (Figure 3-13). Besides, the Mainland visitors had made substantial spending. Despite the “one trip per week” Individual Visit Endorsement Policy 42 was implemented in April 2015, Mainland visitors still accounted for 67.4% of overnight visitor arrivals and 85.4% of same day visitor arrivals in Hong Kong in 2015.
3.30 On the other hand, there has been a structural change in the
overall travelling pattern, in which the same day visitor arrivals grew faster than the overnight visitor arrivals. In 2000, the same day visitor arrivals only made up of 32.5% of total visitor arrivals but the figure rose to 55.0% in 2015 (Figure 3-14). This was mainly due to the marked rise in IVS visitor arrivals (including visitors travelling to Hong Kong on multiple-entry Individual Visit Endorsements). With the implementation of the “one trip per week” Individual Visit Endorsements policy in April 2015 as well as other negative factors (including slow global economic growth, unfavourable currency factor, keen competitions as a result of relaxation of visa requirements for Mainland tourists by neighbouring destinations, and some unfriendly incidents initiated by a small number of people that were directed against Mainland visitors), the total visitor arrivals from the Mainland recorded a year-on-year decrease of about 3% from 2014 to 2015. On the other hand, the
42
On 13 April 2015, the Mainland announced that the issuance of multiple-entry
Individual Visit Endorsements for permanent residents of Shenzhen was stopped and replaced with “one trip per week” Individual Visit Endorsements with immediate effect.
visitors from other places, including Southeast Asia and long-haul destinations, showed signs of a pick-up with a year-on-year increase of about 6% in the fourth quarter of 2015.
Figure 3-13 Number of Visitor Arrivals in Hong Kong by
Origins (2000, 2003 and 2015)
Source: Data based on HKTB’s statistics
Hong Kong 2030+ 46
0
10,000
20,000
30,000
40,000
50,000
60,000
70,000
2000 2003 2006 2009 2012 2015
Same day Visitor Arrivals Overnight Visitor Arrivals
No. of Person(s) ('000)
0
300
600
900
1,200
1,500
1,800
2,100
2008 2009 2010 2011 2012 2013 2014 2015
The Americas Europe, Africa and the Middle East
Australia, N.Z. and S. Pacific North Asia
South and Southeast Asia Taiwan
Macau SAR Mainland China
No. of Person(s) ('000)
Figure 3-14 Visitor Arrivals (2000-2015)
Source: Data based on HKTB’s statistics
3.31 While overnight visitor arrivals grew more slowly than the same day visitor arrivals, its number tripled between 2000 and 2015 (Figure 3-14). Promotion of and supporting to Meetings, Incentives, Conventions, and Exhibitions (MICE) events by the Government was one of the reasons. In late 2008, HKTB established the Meetings and Exhibitions Hong Kong (MEHK) to strengthen Hong Kong’s appeal as the premier MICE destination in the region. The overnight MICE arrivals rose from 1.17 million in 2008 to 1.72 million in 2015 (Figure 3-15). They mainly come from the Mainland, South and Southeast Asia, followed by Europe, Africa, the Middle East and North Asia. In the 2014-15 Budget, the Financial Secretary announced to allocate additional funding to the HKTB to increase Hong Kong’s competitiveness in bidding for
MICE events, with an aim to attracting more overnight MICE visitors whose average spending per capita is around 20% higher than other overnight visitors. Promotion of MICE tourism continued to be one of the medium term measures to support tourism in the 2016-17 Budget.
Figure 3-15 Overnight MICE Arrivals by Origins
(2008-2015)
Source: Data based on HKTB’s statistics
3.32 It is also proposed in the 2016 Policy Address that our tourism industry should be moved up the value chain. The Government will highlight the unique and diversified experiences Hong Kong offers and showcase our gourmet culture. It will also promote cultural and creative tourism,
Hong Kong 2030+ 47
organise mega events, and draw more conventions and exhibitions to Hong Kong. Apart from the ongoing expansion of Ocean Park and undertaking planning studies on the Tourism Node at Kai Tak and Lantau, the Government announced in November 2016 that it had reached an in-principle agreement with the Walt Disney Company on the expansion and development plan of the Hong Kong Disneyland Resort.
Professional43 and other producer services44
3.33 The professional and other producer services industry
includes legal, accounting, architecture, engineering, information technology, management services, etc. In 2014, this sector contributed 12.4% of overall GDP and 13.5% of total employment (Figures 3-4 and 3-5). This sector ties closely with the growth of the economic development in both Hong Kong and the Mainland. In particular, with rapid growth of China’s economy after joining the World Trade Organisation in 2001, Hong Kong has played an important and active role in China's external trade and investment to provide professional and producer services with comprehensive operating platform for linking local markets and overseas.
43
According to C&SD, professional services cover legal, accounting, auditing,
architecture and engineering activities, technical testing and analysis, scientific
research and development, management and management consultancy activities,
information technology related services, advertising, specialised design and related
services, etc. 44
According to C&SD, producer services refer to services for use by other companies (i.e.
intermediate consumption) in the local economy, as well as exports of services to
companies and individuals. "Other producer services" refer to producer services
other than financial services, trading and logistics, tourism and professional services.
3.34 In the 2015-16 Budget, it was stated that the Government
would continue to strengthen the cooperation with Mainland authorities to provide more liberalisation measures and further facilitate trade and investment through the CEPA. Many professional services in Hong Kong can therefore enjoy preferential access to the Mainland market.
Two Emerging Industries
Cultural and creative industries45
3.35 The cultural and creative industries comprise a set of knowledge-based activities that deploy creativity and intellectual capital as primary inputs and deliver goods and services with cultural, artistic and creative content and are among the most dynamic sectors in Hong Kong, contributing to economic growth and job creation.
3.36 The trend of the economic contribution of the cultural and creative industries was growing steadily from 2005 to 2014. During this period, the value-added of the industries increased from $52 billion (about 3.8% of GDP) in 2005 to $110 billion (about 5.0% of GDP) in 2014, with an average annual growth rate of 8.6% (Figure 3-16). Over the same period, the employment in the industries grew from 171,990 (about 5.1%
45
According to C&SD, cultural and creative industries comprise different component
domains, which mainly include advertising; amusement services; architecture; art,
antiques and crafts; cultural education and library, archive and museum services;
design; film, video and music; performing arts; publishing; software, computer games
and interactive media; and television and radio.
Hong Kong 2030+ 48
0%
1%
2%
3%
4%
5%
6%
2005 2006 2007 2008 2009 2010 2011 2012 2013 2014
% of GDP % of Total Employment
of total employment) in 2005 to 213,060 (about 5.7% of total employment) in 2014, with an average annual growth rate of 2.4%. Figure 3-16 Shares of Cultural and Creative Industries in
Value added and Total Employment (2005-2014)
Source: Data based on C&SD’s statistics
3.37 In 2009, the Commerce and Economic Development Bureau, through Create Hong Kong, put forward seven strategic directions to develop the creative industry. They include: (a) nurturing a pool of creative human capital which forms the
backbone of Hong Kong’s creative economy; (b) facilitating start-ups and developing creative
establishments; (c) generating demand for innovation and creativity and
expanding local market size for creative industries;
(d) promoting creative industries on the Mainland and overseas to help explore outside markets;
(e) fostering a creative atmosphere within the community; (f) developing creative clusters in the territory to generate
synergy and facilitate exchanges; and (g) promoting Hong Kong as Asia’s creative capital.
3.38 The Government is committed to encouraging, supporting and
promoting the development of the industries. For example, it was announced in the 2016 Policy Address that additional funding would be injected into the CreateSmart Initiative to develop creative industries and in particular, nurturing start-ups and talent. Besides, initiatives have been introduced to promote and encourage the development of film and fashion industries. The 2016-17 Budget further announced a series of measures46 to support healthy growth of the industries in line with market principles.
46
Including (i) strengthening the promotion of local fashion designers and emerging fashion brands in Hong Kong and overseas; establishing an incubation programme for fashion designers; and setting up a resource centre to provide technical training and support for young designers, (ii) injecting $20 million into Film Development Fund to subsidise the expenses of locally-produced Cantonese films for distribution and publicity in the Mainland, and (iii) launching Art Development Matching Grants Pilot Scheme and developing potential of sports industry by nurturing athletes and hosting international sports events for Arts and Sports.
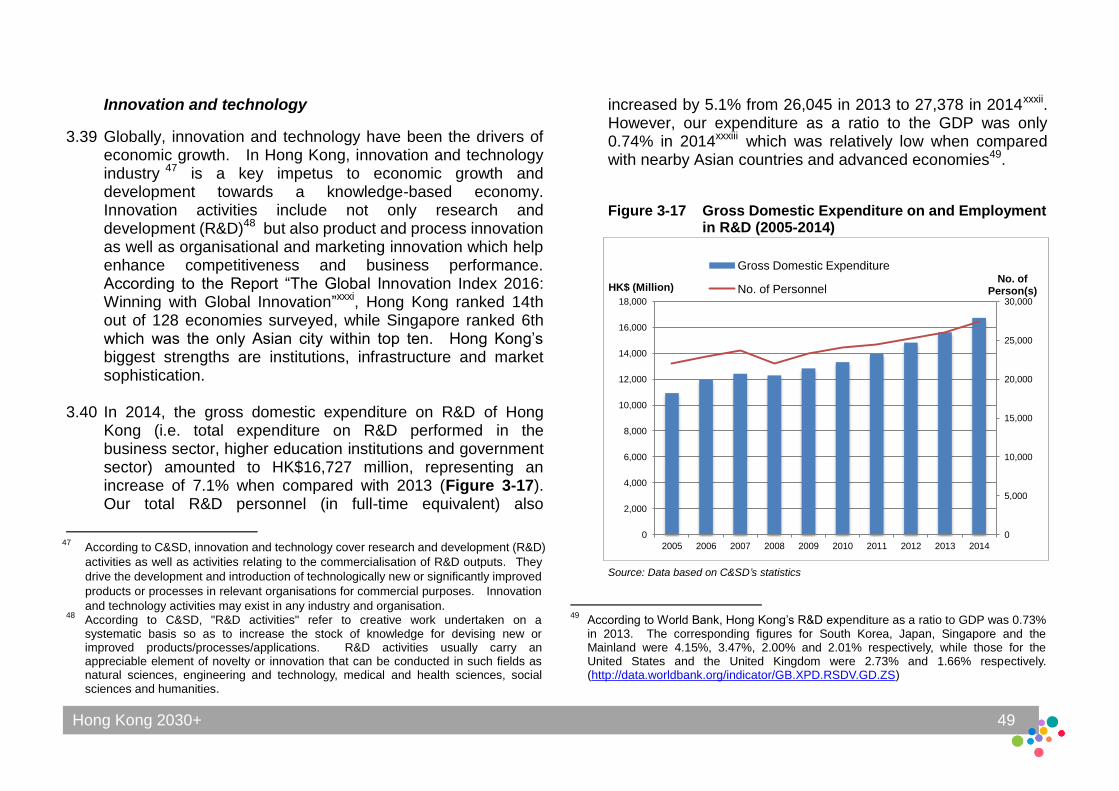
Hong Kong 2030+ 49
0
5,000
10,000
15,000
20,000
25,000
30,000
0
2,000
4,000
6,000
8,000
10,000
12,000
14,000
16,000
18,000
2005 2006 2007 2008 2009 2010 2011 2012 2013 2014
No. of Person(s) HK$ (Million)
Gross Domestic Expenditure
No. of Personnel
Innovation and technology
3.39 Globally, innovation and technology have been the drivers of economic growth. In Hong Kong, innovation and technology industry 47 is a key impetus to economic growth and development towards a knowledge-based economy. Innovation activities include not only research and development (R&D)48 but also product and process innovation as well as organisational and marketing innovation which help enhance competitiveness and business performance. According to the Report “The Global Innovation Index 2016: Winning with Global Innovation”xxxi, Hong Kong ranked 14th out of 128 economies surveyed, while Singapore ranked 6th which was the only Asian city within top ten. Hong Kong’s biggest strengths are institutions, infrastructure and market sophistication.
3.40 In 2014, the gross domestic expenditure on R&D of Hong Kong (i.e. total expenditure on R&D performed in the business sector, higher education institutions and government sector) amounted to HK$16,727 million, representing an increase of 7.1% when compared with 2013 (Figure 3-17). Our total R&D personnel (in full-time equivalent) also
47
According to C&SD, innovation and technology cover research and development (R&D)
activities as well as activities relating to the commercialisation of R&D outputs. They
drive the development and introduction of technologically new or significantly improved
products or processes in relevant organisations for commercial purposes. Innovation
and technology activities may exist in any industry and organisation. 48
According to C&SD, "R&D activities" refer to creative work undertaken on a systematic basis so as to increase the stock of knowledge for devising new or improved products/processes/applications. R&D activities usually carry an appreciable element of novelty or innovation that can be conducted in such fields as natural sciences, engineering and technology, medical and health sciences, social sciences and humanities.
increased by 5.1% from 26,045 in 2013 to 27,378 in 2014xxxii. However, our expenditure as a ratio to the GDP was only 0.74% in 2014xxxiii which was relatively low when compared with nearby Asian countries and advanced economies49. Figure 3-17 Gross Domestic Expenditure on and Employment
in R&D (2005-2014)
Source: Data based on C&SD’s statistics
49
According to World Bank, Hong Kong’s R&D expenditure as a ratio to GDP was 0.73% in 2013. The corresponding figures for South Korea, Japan, Singapore and the Mainland were 4.15%, 3.47%, 2.00% and 2.01% respectively, while those for the United States and the United Kingdom were 2.73% and 1.66% respectively. (http://data.worldbank.org/indicator/GB.XPD.RSDV.GD.ZS)
Hong Kong 2030+ 50
3.41 Apart from monetary investment, land provision is vital to incubate further development of innovation and technology. To turn Hong Kong into a regional hub for innovation and technology, the 22-ha Hong Kong Science Park (HKSP) provides a conducive environment to nurture world-class clusters, through making available suitable buildings for lease to technology-based enterprises to carry out R&D work. The HKSP contains a total of 330,000m2 of R&D office, laboratories and ancillary space, with development of Phase 3 fully put into place in 2016.
3.42 Besides, there have been breakthroughs in the support for start-ups in recent years. Apart from HKSP and the Cyberport 50 which support start-ups in research and development and assist them to open up markets, the number of accelerator, incubation and co-work locations funded and operated by the business sector has increased from just a few in 2010 to about 40 in 2015. There are around 1600 start-ups occupying these locations and most are innovation and technology start-ups. According to an international study undertaken in 2015, Hong Kong was the 5th fastest growing start-up ecosystem and ranked the 25th in the worldxxxiv.
50
According to 2016 Policy Address, the Cyberport had endeavoured to groom information and communication technology talent and successfully nurtured more than 160 start-ups in the past decade.
3.43 Institutionally, the Innovation and Technology Bureau (ITB)51 and Academy of Sciences of Hong Kong52 were set up in 2015. The former will make strenuous efforts to co-ordinate, support and complement the development of Hong Kong’s innovation and technology industry. It will, among other things, proactively co-ordinate the work of universities, HKSP, industrial estates, the Cyberport, the Hong Kong Productivity Council (HKPC), the Applied Science and Technology Research Institute and other research and development centres, and set up a robust system for scientific research, development and production. In addition, the world-renowned Karolinska Institutet of Sweden had decided to open its first overseas research facility at HKSP, while the Massachusetts Institute of Technology had also announced the establishment of its first overseas Innovation Node in Hong Kong.
51
ITB is responsible for policy matters on the development of innovation and technology and information technology which are the key drivers in this endeavour. It aims to create a vibrant ecosystem for the government, industry, academia and research sector to interact under a favourable environment with excellent software and hardware support for developing and applying innovation and technology.
52 The Academy of Sciences of Hong Kong is to promote the development and
advancement of science and technology in Hong Kong, and to raise the city's profile as a centre of scientific excellence. Detailed background and purpose of the Academy are available in the website at http://www.ashk.org.hk/en_index.php.
Hong Kong 2030+ 51
3.44 In order to further nurture innovation, the 2016-17 Budget announced a series of measures to promote application of R&D results 53 and financial technologies (Fintech) 54 , and support innovation and technology start-ups55.
3.45 In the 2016 Policy Address, “re-industrialisation” is identified
as a potential new area of economic growth for Hong Kong. The Government and the Hong Kong Science and Technology Parks Corporation (HKSTP) have revised the industrial estate policy. Apart from constructing multi-storey buildings in the remaining space of the industrial estates for lease to innovation and technology industries, idle factory premises will be recovered to promote smart production and attract high value-added technology industries as well as high value-added manufacturing processes. Also, HKPC will facilitate industrial upgrading and transformation, enabling enterprises to embrace “re-industrialisation” and move towards high value-added production.
53
Including (i) allocating $8.2 billion to HKSP to promote smart production and research, (ii) earmarking $500 million to set up Innovation and Technology Fund for Better Living, (iii) developing smart city, (iv) injecting $2 billion to launch a Midstream Research Programme for universities, and (v) increasing cash rebate for enterprises’ R&D activities.
54 Including (i) implementing the suggestions of the Steering Group on Financial
Technologies promote Fintech, (ii) setting up a dedicated team by InvestHK to help startups, investor and research and development institutions to establish their presence in Hong Kong, (iii) providing 3,000m
2 dedicated space and launching
designated programme by the Cyberport, and (iv) setting up dedicated Fintech platforms by the Hong Kong Monetary Authority, the Securities and Futures Commission and the Office of the Commissioner of Insurance.
55 Including (i) setting up a $2 billion Innovation and Technology Venture Fund, (ii)
spending $4.4 billion to expand HKSP in stages, and (iii) earmarking $200 million by the Cyberport to invest in start-ups.
3.46 In view of an anticipated increase in the demand for sites for scientific research and new industrial use, it was also announced in the 2016 Policy Address that the Government will identify sites near the Liantang/Heung Yuen Wai Boundary Control Point for the development of the Science Park and industrial estates.
Manufacturing and Construction Industries Manufacturing industry
3.47 With rapid rise in production and labour cost in Hong Kong in
the past two decades, most of the productions were relocated to other lower cost locations in the Mainland and the Southeast Asia. Our manufacturing sector has been dwindling over the years, with the percentage share of manufacturing sector to the GDP dropped from 4.8% in 2000 to 1.3% in 2014. The percentage of the total employment also reduced from 6.4% in 2000 to 2.8% in 2014.
3.48 In 2014, the three most important manufacturing sub-sectors in Hong Kong were “food, beverages and tobacco” (30.3% of the value added and 31.7% of the number of persons engaged), “metal products, machinery & equipment” (24.5% of the value added and 19.8% of the number of person engaged) and “chemical, rubber, plastics and non-metallic mineral products” (15.3% of the value added and 10.8% of the number of persons engaged) (Figures 3-18 and 3-19). Between 2005 and 2014, two sub-sectors, i.e. “textiles” and “wearing apparel”, experienced the largest contraction (with 81% and 80% decrease in value added respectively). The decline was
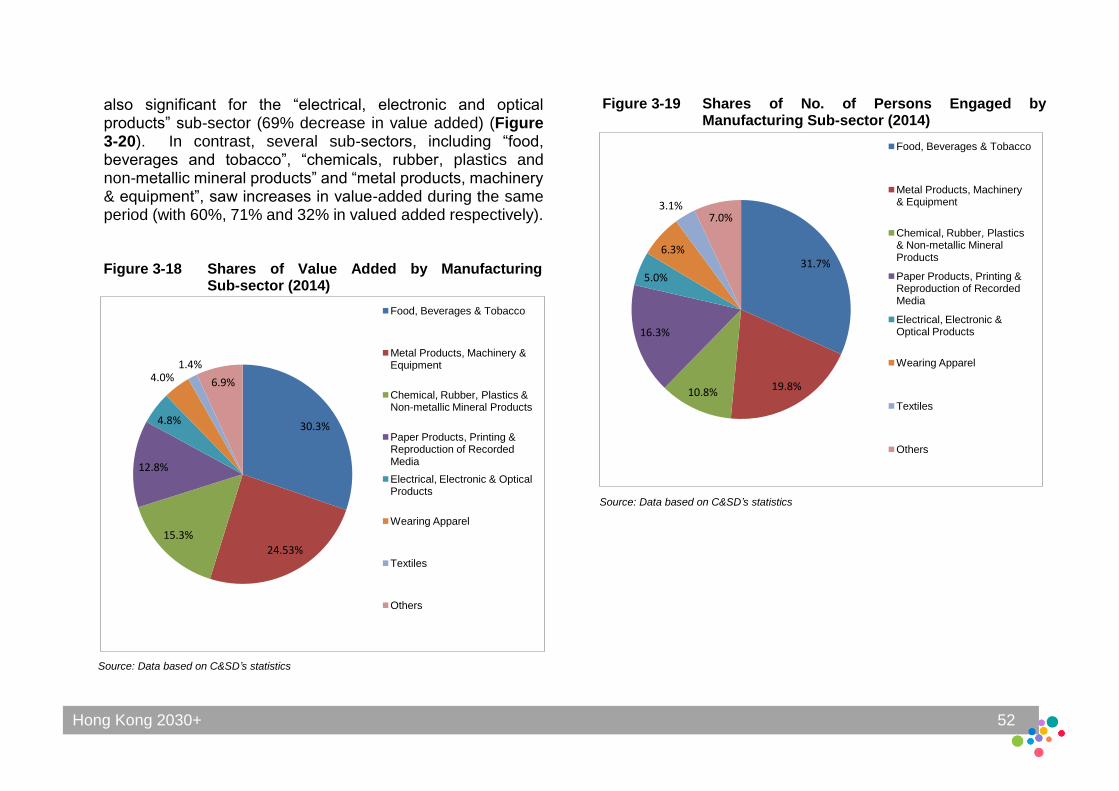
Hong Kong 2030+ 52
30.3%
24.53% 15.3%
12.8%
4.8%
4.0% 1.4%
6.9%
Food, Beverages & Tobacco
Metal Products, Machinery & Equipment
Chemical, Rubber, Plastics & Non-metallic Mineral Products
Paper Products, Printing & Reproduction of Recorded Media
Electrical, Electronic & Optical Products
Wearing Apparel
Textiles
Others
31.7%
19.8% 10.8%
16.3%
5.0%
6.3%
3.1% 7.0%
Food, Beverages & Tobacco
Metal Products, Machinery & Equipment
Chemical, Rubber, Plastics & Non-metallic Mineral Products
Paper Products, Printing & Reproduction of Recorded Media
Electrical, Electronic & Optical Products
Wearing Apparel
Textiles
Others
also significant for the “electrical, electronic and optical products” sub-sector (69% decrease in value added) (Figure 3-20). In contrast, several sub-sectors, including “food, beverages and tobacco”, “chemicals, rubber, plastics and non-metallic mineral products” and “metal products, machinery & equipment”, saw increases in value-added during the same period (with 60%, 71% and 32% in valued added respectively). Figure 3-18 Shares of Value Added by Manufacturing
Sub-sector (2014)
Source: Data based on C&SD’s statistics
Figure 3-19 Shares of No. of Persons Engaged by Manufacturing Sub-sector (2014)
Source: Data based on C&SD’s statistics
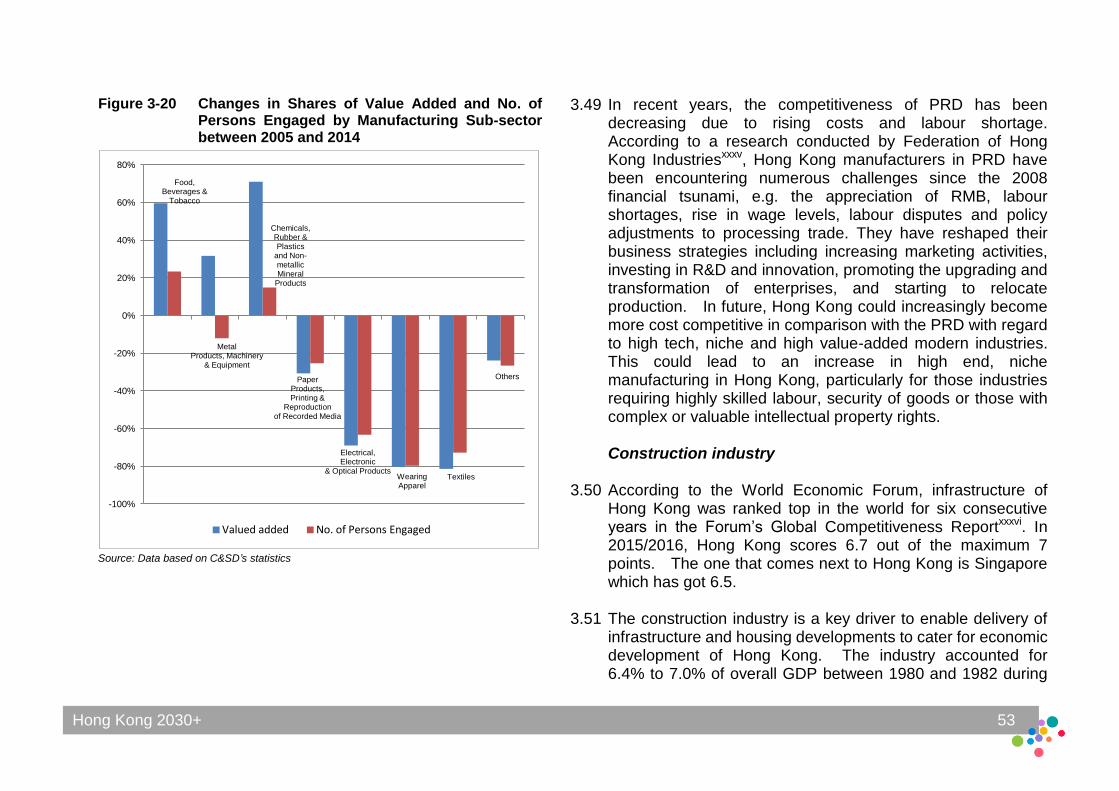
Hong Kong 2030+ 53
Food, Beverages &
Tobacco
Metal Products, Machinery
& Equipment
Chemicals, Rubber & Plastics
and Non- metallic Mineral
Products
Paper Products, Printing &
Reproduction of Recorded Media
Electrical, Electronic
& Optical Products Wearing Apparel
Textiles
Others
-100%
-80%
-60%
-40%
-20%
0%
20%
40%
60%
80%
Valued added No. of Persons Engaged
Figure 3-20 Changes in Shares of Value Added and No. of Persons Engaged by Manufacturing Sub-sector between 2005 and 2014
Source: Data based on C&SD’s statistics
3.49 In recent years, the competitiveness of PRD has been decreasing due to rising costs and labour shortage. According to a research conducted by Federation of Hong Kong Industriesxxxv, Hong Kong manufacturers in PRD have been encountering numerous challenges since the 2008 financial tsunami, e.g. the appreciation of RMB, labour shortages, rise in wage levels, labour disputes and policy adjustments to processing trade. They have reshaped their business strategies including increasing marketing activities, investing in R&D and innovation, promoting the upgrading and transformation of enterprises, and starting to relocate production. In future, Hong Kong could increasingly become more cost competitive in comparison with the PRD with regard to high tech, niche and high value-added modern industries. This could lead to an increase in high end, niche manufacturing in Hong Kong, particularly for those industries requiring highly skilled labour, security of goods or those with complex or valuable intellectual property rights. Construction industry
3.50 According to the World Economic Forum, infrastructure of Hong Kong was ranked top in the world for six consecutive years in the Forum’s Global Competitiveness Reportxxxvi. In 2015/2016, Hong Kong scores 6.7 out of the maximum 7 points. The one that comes next to Hong Kong is Singapore which has got 6.5.
3.51 The construction industry is a key driver to enable delivery of infrastructure and housing developments to cater for economic development of Hong Kong. The industry accounted for 6.4% to 7.0% of overall GDP between 1980 and 1982 during
Hong Kong 2030+ 54
the construction bloom for developing new towns over the territory. With the commencement of the Airport Core Projects in the 1990s, the sector contributed to about 5% of the GDPxxxvii. Following the economic recession in the late 1990s and early 2000s, GDP share of the construction sector has dropped to 2.5% in 2007xxxviii until the commencement of the ten major infrastructure projects announced in the 2007-08 Policy Address. The industry accounted for 4.4% of the GDP contributionxxxix and 8.3% of total employmentxl in 2014. It should be noted that architecture and engineering activities serving the construction sector are classified under the professional and other producer services and therefore their value added is not counted towards this industry.
3.52 With the commencement of the major infrastructure projects and housing projects in full swing in coming years, the construction industry will continue to contribute to our economic development.
Key Issues Pertinent to Strategic Spatial Planning Diversifying economic base and choices of premises
3.53 Economic transformation has resulted in substantial changes
in land requirements for economic uses, in terms of both nature and scale. The shift from manufacturing to a service economy since 1980s has led to a significant decrease in the demand for industrial spaces and a corresponding increase in demand for office spaces. There has also been an increasing demand for land for special economic uses to cater for increased logistics, trade storage and processing activities.
3.54 As a mature economy, the momentum of our economic growth has been slowing down and there is a projected shrinking labour force after 2018 (as mentioned in Chapter 1). To rise to the challenge, we need to move up the value chain and diversify our economic base. With further policy steer and advice from policy bureaux on the future directions of our industries, we shall explore where, how and when to provide what type of strategic land supply to meet economic development needs so as to cater for contingency in an optimum, robust, sustainable and cost-effective way, and also to enhance our economic resilience. Apart from meeting the existing shortfalls in space development for various economic uses and their projected future requirements, the creation of a land reserve would help increase the robustness of our development strategy in catering for unforeseen economic changes. Strengthening our role as an Asia’s World City, premier gateway to China and international/regional hub
3.55 Our strategic geographic location, well-established business environment, coupled with our role as the premier gateway to China and various preferential policies (e.g. offshore RMB trading centre, Shanghai-Hong Kong Stock Connect pilot programme, CEPA, etc.), has attracted a number of Multinational Corporations (MNCs) from the Mainland and overseas to set up their offices here. Hong Kong is used as a springboard by the Mainland companies to enter into the global market and perceived by overseas investors as a gateway between the Mainland and the rest of the world. Such gateway and “super-connector” functions of Hong Kong will be further enhanced by new infrastructure development
Hong Kong 2030+ 55
such as the Hong Kong-Zhuhai-Macao Bridge, Tuen Mun-Chek Lap Kok Link, Guangzhou-Shenzhen-Hong Kong Express Rail Link and the HKIA 3RS, and hence reinforcing our position as an international and regional hub. Under the “Go Global initiatives”, Hong Kong shall seize the opportunities for greater cooperation with the Mainland within the financial, business and trading sectors, thereby stimulating demand for financial and other professional services (e.g. legal and arbitration) from Hong Kong.
3.56 Indeed, Hong Kong is highly regarded for its rule of law and independent judiciary, free flow of information, business freedom, open markets and attractive tax regime. It ranked the fifth place in the world to do business in 2016 (third place in terms of regulatory environment)xli. In 2016, more than 7,900 overseas and Mainland enterprises with parents companies outside Hong Kong have their regional headquarters/regional offices/local offices set up in Hong Kong and created 435,000 employment opportunitiesxlii. Many of them are located in Grade A commercial office buildings. However, the same survey shows that 38% of these companies regard the factor of “availability and cost of business accommodation” unfavourable to Hong Kong. In anticipation of the sustained growth of the high value-added financial, business and professional services sectors, demand for Grade A office space will continue to increase.
3.57 Given the above, our spatial planning shall cater for the incessant demand for office space at accessible locations, so as to help sustain Hong Kong as a global financial centre, regional business hub and choice location for corporate headquarters. At the same time, we need to address the
various concerns and needs of the Mainland and overseas personnel, e.g. air pollution, lack of international schools, costly living accommodation, etc. in order to attract companies to establish here. Nurturing entrepreneurship
3.58 Small and medium enterprises (SMEs)56 play a significant role in Hong Kong’s economy. As at March 2016, there were about 320,000 SMEs in Hong Kong, accounting for over 98% of the total business units and providing job opportunities to nearly 1.3 million persons, about 46% of total employment (excluding civil services)xliii. A new wave of entrepreneurship, in form of start-ups, is emerging around the world. Many start-ups boldly apply new technologies and open up new markets. To further enhance our economic growth and to bolster Hong Kong as a leading global hub for start-ups, we shall plan for appropriate and affordable accommodations to attract innovative start-ups.
56
According to the Trade and Industry Department, manufacturing enterprises with
fewer than 100 employees and non-manufacturing enterprises with fewer than 50
employees are regarded as small and medium enterprises in Hong Kong.
Hong Kong 2030+ 56
Planning for logistics facilities
3.59 Our logistics sector is subject to increasing global and regional competition from both the Mainland (Shanghai and Shenzhen) and Singapore57. We have to move up the value chain and provide specialised logistics centres in order to stay competitive. Yet, there is shortage of land for modern logistics facilities as well as international and regional distribution centres in Hong Kong. Many logistics facilities currently located in flatted factories in traditional industrial area, which are barely suitable for the effective and efficient performance of the value-added functions, due to limitations
57
According to the “Sustainable Development Study for the Hong Kong Logistics Industry” undertaken by the Chinese University of Hong Kong in collaboration with SD Advocates Ltd, BMT Asia Pacific, the logistics cluster in Hong Kong faces the following challenges:
a) capacity bottleneck due to the pause of major infrastructure investments in the last decade;
b) increasing cost pressure as the price of real estate continues to surge and lack of dedicated land for logistics use;
c) labour shortage of both low-skilled workers and high-skilled professionals; d) insufficient policy support for the logistics cluster; and e) increasingly sophisticated competitors such as Singapore, Shenzhen and
Shanghai. The study recommends the Government:
a) to re-define the policy responsibility in the Government structure to reflect the strategic position of the logistics industry as the key economic driver of Hong Kong;
b) to develop policies for the sustainable development and competitive growth of the logistics industries, relating to issues including dedicated land, manpower development and collaborations with the PRD;
c) to revive the Logistics Park Plan and to establish a management authority/corporation making reference to the business model of the HKSTP;
d) to investigate the feasibility of relocation of the KTCT in the long-term to improve efficiencies; and
e) to construct the third runway at Hong Kong International Airport to maintain its leading position as the aviation hub of the region.
such as no direct ramp access for efficient/effective operations, low ceiling height, road access unable to accommodate the large amount of container vehicles traffic, security problem for high value goods, etc. On the other hand, stakeholders in the sector have experienced difficulties in locating suitable premises at affordable cost.
3.60 To meet our modern logistics demand, we need to identify suitable sites capable for the development of modern purpose-built warehouse/logistics facilities (e.g. with direct vehicle or ramp access, ample parking space, high ceiling height, large floor plates and heavy floor loading) up to standard and strategically located close to major existing and future transport infrastructure with easy access to the port, airport and boundary control points (including the future Hong Kong-Zhuhai-Macao Bridge and Liantang/Heung Yuen Wai Boundary Control Point) which allows inter-modal operations. Moreover, sufficient amount of land should also be reserved to cater for the expansion need of the logistics sector and maintain the competitiveness of Hong Kong as a regional logistics hub. Enhancement of the existing transport infrastructure, port and air cargo facilities would also be critical.
3.61 To better utilise the land resources, opportunities should be explored to accommodate the open-air port back-up uses such as container storage, container and heavy/medium goods vehicles parking in multi-storey compounds, and at locations near to the port to ensure transport efficiency.
Hong Kong 2030+ 57
Planning for brownfield operations
3.62 Brownfield operations usually occupy flat land at relatively accessible locations in the New Territories near the existing built-up areas and transport infrastructure. However, they always create land use compatibility, environmental and traffic problems. From development perspective, decanting brownfield operations to make way for development through comprehensive planning and infrastructure upgrading is important not only as a major future source of land supply for housing and economic development, but also for significantly enhancing the utilisation of our limited land resource.
3.63 However, we cannot ignore the need for certain brownfield operations. Some services, such as vehicle parking, lower-end logistics, recycling and car repairs, are part and parcel of certain sectors of Hong Kong’s overall economy, and they cannot be located outside Hong Kong. More importantly, brownfield operations also offer local business and job opportunities for certain SMEs and low-skilled labour.
3.64 Given the overall lack of land resources and the need of certain industrial operations, we need to take a more proactive role in considering suitable forms of intervention or assistance in addressing brownfield operations, for instance, exploring the possibility of accommodating some brownfield operations in suitable purpose-built multi-storey buildings. Planning for tourism-related facilities
3.65 The continued growth in visitor arrivals will generate demands for different tourism-related facilities, such as hotels,
recreational, retail and transport facilities. It has also affected the livelihood of the community in certain districts in Hong Kong. The proactive way out is to enhance our receiving capacity, including diversifying our tourist attractions and increasing the supply of hotel rooms, and focusing on attracting more overnight visitors so as to ensure the long-term and healthy development of Hong Kong's tourism industry. On these, along the recommendations made in the Assessment Report on Hong Kong’s Capacity to Receive Tourists published by the Commerce and Economic Bureau in January 2014, the Government has been taking forward several initiatives, such as to expand and redevelop the two theme parks, continuing to adopt a multi-pronged approach to increase the supply of hotel rooms, etc.
3.66 In the long term, we should continue to provide sufficient land and spaces to allow the industry to pursue a balanced, healthy and long term development, and move towards diversified and quality driven-high value-added services, with a view to attracting more high spending-overnight visitors. Specifically, new tourist attractions, more high grade hotels and MICE facilities, and more spaces/venues for diversified travel experiences should be provided for visitors, capitalising on the future strategic transport infrastructure (such as HKIA 3RS, HZMB and Guangzhou-Shenzhen-Hong Kong Express Rail Link) and the global trend of increasing free independent travellers and visitors who generally look for unique experience and living culture. On the software, regional co-operations of tourism development should be encouraged taking into account the possible long term changes of visitor structures and characteristics. Public transport services for tourist attractions and related facilities should be strengthened,
Hong Kong 2030+ 58
while information and communications technology (e.g. free WiFi services) should be better utilised to help tourist to obtain useful information. Also, more tourism-related training and education should be tailored for the industry. Planning for construction-related facilities
3.67 The uses of land for the construction industry generally involve a wide range of construction-related facilities. Common types of these facilities include production or storage of construction materials (e.g. ready-mixed concrete, asphalt, cement, formwork, etc.), manufacture or storage of construction plant or machinery, prefabrication or precasting yards, testing of construction plant, machinery or materials, quarrying, maintenance depots, and public fill banks for temporary storage of construction and demolition materials before they are put into beneficial reuse.
3.68 Strategic spatial planning for construction-related facilities is required to accommodate the core activities of the construction industry so that housing and infrastructure projects could be timely delivered to meet the requirements of social and economic developments. With obvious demand for certain specific land uses in the construction industry, the Government has kicked off a study to conduct a holistic review and analysis on the requirements of land, and recommend the future land requirements in short, medium and long term. This will be taken into account in Hong Kong 2030+ where appropriate.
Resurgence of manufacturing industries and transformation of existing industrial premises
3.69 While our manufacturing sector has been experiencing a structural decline in the last thirty years, there are suggestions that this might reverse in the future driven by new establishments or the relocation of high value, skilled or high-tech production back from the PRD to Hong Kong58. However, most of our existing industrial buildings are relatively old and may not be fit for the purpose. The newer buildings are however often occupied by other uses, e.g. offices, which outbid the manufacturing uses. Suitable and appropriate industrial premises are required to support the “re-industrialisation” initiative proposed in the 2016 Policy Address. In order to promote smart production and to attract high value-added technology industries as well as high value-added manufacturing processes, there is a need to consider the provision of dedicated, modern and new industrial accommodations in the New Development Areas and to examine the scope of accommodating those technology and
58
According to the Report on “Made in PRD Study, Hong Kong Industry: the Way Forward” published by the Federation of Hong Kong Industries in February 2015, Hong Kong manufacturers often relocated their production to Guangdong Province and other places on the Mainland before 2008. However, since 2010, their relocation destinations have shifted to Southeast Asian countries and even back to Hong Kong e.g. electronic products, chemicals and pharmaceutical products, printing and paper products. However, manpower shortage and high labour costs are the still biggest challenges to production relocation to Hong Kong, followed by insufficient land supply, regulations and rules, lack of industrial policies, energy issues, a lack of industrial facilities and volatile business environment. The top five policies and measures that manufacturers deem important for the Hong Kong Government to promote industrial development are: strengthening industrial talent training, tax concessions for R&D activities, assisting enterprises in the development of domestic sales on the Mainland, supporting the financing of SMEs and improving the support for industries.
Hong Kong 2030+ 59
service-oriented industries in the industrial estates or science park including the new one(s) proposed near the Liantang/Heung Yuen Wai Boundary Control Point.
3.70 Apart from meeting the need of the manufacturing sector, we shall consider and examine the scope of transforming and revitalising the existing industrial premises no longer suitable for industrial use to other alternative uses in light of different land requirements. As suggested in the 2014 Area Assessments of Industrial Land in the Territory, from planning point of view, consideration would be given to providing more flexibility in land use zoning by allowing more non-industrial uses in industrial buildings provided that such uses would not cause nuisances to other users of the industrial buildings and would not compromise building safety and fire riskxliv. Planning for new/emerging industries
3.71 The objective of promoting new/emerging industries is not merely to crave for better GDP’s return, but more importantly, to catch up with global megatrends of economies, broaden our economic base and provide a range of quality jobs which would add resilience to our economy.
3.72 Creative industries are typically characterised by small business with a persistent demand for affordable workspace. Creative establishments are mostly SMEs or operated on a self-employed basis. With the exception of a small number of enterprises such as television stations, film studios, etc. which require larger parcels of land, some creative establishments tend to cluster in industrial buildings which satisfy various functional requirements on workspace, such as high ceilings,
large indoor spaces and strong floor loading for performing arts, visual arts, printing and publishing activities, or be accommodated in commercial buildings. There are also purposely converted historic and industrial buildings to accommodate such uses (e.g. PMQ in Central (i.e. former Police Married Quarters at Hollywood Road)), Comix Home Base in Wan Chai and Jockey Club Creative Arts Centre in ex-Shek Kip Mei Factory Estate). Further such opportunities should continue to be explored to support the creative industries.
3.73 Similarly, the emerging importance of innovative and high technology industries has called for an increased demand for special land uses such as Science Park59 , IEs and data centres. There is also a need to optimise the utilisation of existing industrial premises and to identify new solution spaces strategically for such uses. Planning for education facilities to nurture talents
3.74 We shall endeavour to develop more education facilities so as to nurture talents to support our future economic development. To tie in with our diversified economic base, we need to further encourage the development of a wider range of education
59
In November 2014, the Government had, in conjunction with HKSTP, completed a
review on the utilisation and long-term development direction of Science Park and
IEs. It was concluded that, having regard to changes in the economic structure of
and shortage of land supply in Hong Kong, the land in the three IEs should be used
more efficiently to support the growth of the science, innovation and technology (SIT)
based industries in Hong Kong. In future, HKSTP will mainly build and manage
specialised multi-storey industrial buildings, designed to meet the needs of selected
SIT based industries, for rent to multi-users, instead of granting the sites to single
users for building their own factories.
Hong Kong 2030+ 60
facilities, such as design, business, cooking, aviation, tourism etc. Currently, some world class education institutes are provided in Hong Kong, for instance, the University of Chicago Booth School of Business (Hong Kong Campus) and the Savannah College of Art and Design. Such facilities not only foster a pool of talents to sustain our economic development, but also attract overseas investors to establish world class education facilities. Planning for supporting infrastructure to attract talents
3.75 In view of shrinking labour force in the long run, we should strive to attract overseas talents to fuel our economic momentum on top of nurturing local talents. Competition for talents is fierce amongst world cities. This is particularly true for the highly mobile financial and professional services, and the cultural and creative industries. To attract talents, Hong Kong needs to upkeep its competitiveness by providing a conducive environment to retain and nurture local talents and to attract overseas talents in support of our advantaged sectors as well as emerging industries.
3.76 According to the Global Report on Expat Explorerxlv, Hong Kong ranked the thirteen out of 45 popular destinations, while Singapore and Taiwan ranked the top and fourteenth respectively. Amongst the ranks of specific aspects, Hong Kong is relatively weak in terms of family and experience. In order to attract and maintain valuable human resources and talents, there is need to improve liveability of Hong Kong in a holistic and comprehensive manner (such as improving environmental qualities, accommodation affordability and
international school places) which could be achieved through visionary planning and land reservation. An ecosystem-like approach to induce synergy through sectoral collaboration
3.77 There is growing specialisation of functions and labour in a sophisticated supply chain system. We shall adopt a holistic approach in reserving land, not merely for different economic activities, but also institutions that could have contribution to economic activities to achieve greater synergy. In so doing, this land reservation system will reflect the synergy and intricate connectivity between various components of today’s economy, thus resembling the intricate relationships within an ecosystem. For instance, we need to cater for the development needs of universities, higher education and training institutions, science and technology parks, incubation and start-up spaces, and innovation and technology companies. It is vitally important to establish a close collaboration among the Government, relevant sectors/industries, academia and research institutes to ensure collaboration across the sectors. We also need to help create the necessary tech-ecosystem and establish the business linkages of start-ups, the vertical integration of industries and supply chain of particular industries to ensure that we have the right platform to sustain their growth and maximising economic potential.
Hong Kong 2030+ 61
Future Challenges
3.78 Hong Kong is an externally oriented economy affected by both international and regional development trends. The policy initiatives in the Mainland and the latest development in Asia including the National 13th Five Year Plan, the “going-out policy”, the “Belt and Road” initiative and the setting up of the Asian Infrastructure Investment Bank as well as the emergence of the Association of Southeast Asian Nations all would have impact on our role and in turn our land requirement for economic uses. In view of the fast growing momentum of the Mainland and Asian region, we need to re-examine our future role in the international and regional arena and plan to complement our changing role.
3.79 In addition, the world is highly dynamic and so is Hong Kong. Even though we can make informed assumptions, it is extremely difficult, if not impossible, to gauge the exact pace, extent and nature of changes. In particular, innovation and technological advancement may have significant impacts on the ways that we do business in the long term. The crux is to formulate a robust and flexible strategy for us to embrace changes and capture new opportunities.
ENDNOTES xviii Financial Service and the Treasury Bureau (March 2015).
Report of the Working Group on Long-Term Fiscal Planning (Phase One). Retrieved from http://www.fstb.gov.hk/tb/en/report-of-the-working-group-on-longterm-fiscal-planning-phase1.htm
xix Financial Secretary (February 2016). The 2016-17 Budget.
Retrieved from http://www.budget.gov.hk/2016/eng/pdf/e_budgetspeech2016-17.pdf
xx Trade and Industry Department (August 2016). Hong Kong and Mainland of China: Some Important Facts. Retrieved from https://www.tid.gov.hk/english/aboutus/publications/factsheet/china.html
xxi C&SD. Table 55: External Merchandise Trade Aggregate Figures. Retrieved from http://www.censtatd.gov.hk/hkstat/sub/sp230.jsp?tableID=055&ID=0&productType=8
xxii Transport and Housing Bureau (2016). Summary Statistics on Port Traffic of Hong Kong (October 2016). Retrieved from http://www.hkmpb.gov.hk/docs/summary_statistics.pdf
xxiii C&SD (November 2015). Port Cargo Statistics, 2004 to 2014. Retrieved from http://www.statistics.gov.hk/pub/B71511FA2015XXXXB0100.pdf
xxiv Airport Authority Hong Kong. Retrieved from http://www.hongkongairport.com/eng/business/about-the-airport/welcome.html
xxv C&SD (January 2016). Air Cargo Statistics. Retrieved from http://www.statistics.gov.hk/pub/B71601FA2016XXXXB0100.pdf
xxvi Airport Authority Hong Kong. Annual Report 2013/14. Retrieved from https://www.hongkongairport.com/eng/pdf/media/publication/report/13_14/E_Annual_Report_Full.pdf
xxvii HKSAR Government. Chapter 4: Financial and Monetary Affairs in Hong Kong Yearbook 2015. Retrieved from http://www.yearbook.gov.hk/2015/en/pdf/E04.pdf
xxviii HKSAR Government. Hong Kong Fact Sheet: Financial Services (June 2015). Retrieved from http://www.gov.hk/en/about/abouthk/factsheets/docs/financial_services.pdf
Hong Kong 2030+ 62
xxix Financial Secretary (February 2015). The 2015-16 Budget.
Retrieved from http://www.budget.gov.hk/2015/eng/pdf/e_budgetspeech2015-16.pdf
xxx HKTB (January 2016). Monthly Report - Visitor Arrivals Statistics: Dec 2015. Retrieved from http://partnernet.hktb.com/filemanager/intranet/ViS_Stat/ViS_Stat_E/ViS_E_2015/Tourism_Statistics_12_2015_0.pdf
xxxi Cornell University, INSEAD, and WIPO (2016). The Global Innovation Index 2016: Winning With Global Innovation. Retrieved from https://www.globalinnovationindex.org/gii-2016-report#
xxxii C&SD. Table 208: Number of R&D Personnel. Retrieved from http://www.censtatd.gov.hk/hkstat/sub/sp120.jsp?tableID=208&ID=0&productType=8
xxxiii C&SD. Table 207: R&D Expenditure by Performing Sector. Retrieved from http://www.censtatd.gov.hk/hkstat/sub/sp120.jsp?tableID=207&ID=0&productType=8
xxxiv Compass (2016). The Global Startup Ecosystem Ranking 2015.
xxxv Federation of Hong Kong Industries (February 2015). Made in PRD Study, Hong Kong Industry: The Way Forward. Retrieved from https://www.industryhk.org/upload/news/attachment/14df7bb52ef8d9c4dfc69781acdfa73f.pdf
xxxvi World Economic Forum (2015). The Global Competitiveness Report 2015–2016. Retrieved from http://www3.weforum.org/docs/gcr/2015-2016/Global_Competitiveness_Report_2015-2016.pdf
xxxvii C&SD (October 1999). Hong Kong Annual Digest of Statistics (1999 Edition). Retrieved from http://www.statistics.gov.hk/pub/hist/1991_2000/B10100031999
AN99B0100.pdf
xxxviii C&SD (November 2009). Hong Kong Annual Digest of Statistics (2009 Edition). Retrieved from http://www.statistics.gov.hk/pub/B10100032009AN09B0700.pdf
xxxix C&SD (May 2016). Gross Domestic Product (First Quarter 2016). Retrieved from http://www.statistics.gov.hk/pub/B10300012016QQ01B0100.pdf
xl C&SD (September 2015). Composite Employment Estimates 2014. Retrieved from http://www.statistics.gov.hk/pub/B71509FA2015XXXXB0100.pdf
xli World Bank Group (2016). Doing Business 2016: Measuring Regulatory Quality and Efficiency. Retrieved from
http://www.doingbusiness.org/~/media/WBG/DoingBusiness/Documents/Annual-Reports/English/DB16-Full-Report.pdf
xlii C&SD (October 2016). Report on 2016 Annual Survey of Companies in Hong Kong Representing Parent Companies Located outside Hong Kong. Retrieved from http://www.statistics.gov.hk/pub/B11100042016AN16B0100.pdf
xliii Trade and Industry Department. SMEs in Hong Kong. Retrieved from https://www.success.tid.gov.hk/english/aboutus/sme/service_detail_6863.html
xliv PlanD (2015). 2014 Area Assessments of Industrial Land in the Territory. Retrieved from http://www.pland.gov.hk/pland_en/p_study/comp_s/industrial_report_2014/index.htm
xlv HSBC (2016). Global Report on Expat Explorer 2016: Achieving Ambitions Abroad. Retrieved from
https://www.expatexplorer.hsbc.com/survey/files/pdfs/overall-reports/2016/HSBC_Expat_Explorer_2016_report.pdf
Hong Kong 2030+ 63
Given the hilly topography, readily developable land is a scarce resource in Hong Kong. Over the years, new developable land has mainly been created through cutting slopes and reclaiming land from the sea to meet development needs. A
major part of our Central Business District (CBD), the airport and port, and parts of several new towns in the New Territories were developed primarily on reclaimed land. As at 2015, Hong Kong with a total land area of 1,106 km2 60 is home to about 7.32 million people and about 3.8 million employments. We have risen to the development challenges by adopting a compact and high-density development pattern, resulting in a built-up area of just 268 km2 or about 24% of our territory. This Chapter analyses the spatial development trends and pattern of our city as well as the key issues pertinent to our strategic spatial planning.
60
Excludes about 4 km2 of mangrove and swamp below of the High Water Mark, which is
not counted in the land area of the Territory.
Reclamation and Topography 4.1 The jigsaw of the current land utilisation pattern evolves from
the interplay of a number of factors, including natural topography as well as changing social, economic, political and environmental needs through the development history of Hong Kong. Urban morphology is always much dictated by natural topography and Hong Kong is no exception.
4.2 Hong Kong has resorted to reclamation as early as 1887 to produce developable land. According to the Lands Department, about 6,954 ha of land (about 6% of the total land area) was obtained from reclamation xlvi . In addition to reclamation along the Victoria Harbour, seven out of the nine existing new towns61, namely Tsuen Wan, Tuen Mun, Sha Tin, Tai Po, Tseung Kwan O, Tung Chung and Tin Shui Wai62, involved various extent of reclamation. Also, the Container
61
Include three first generation new towns (i.e. Tsuen Wan, Sha Tin and Tuen Mun),
three second generation new towns (i.e. Tai Po, Fanling/Sheung Shui and Yuen
Long), and three third generation new towns (i.e. Tseung Kwan O, Tin Shui Wai and
Tung Chung). 62
Tin Shui Wai New Town involved filling of fish ponds.
Spatial Development Pattern 4
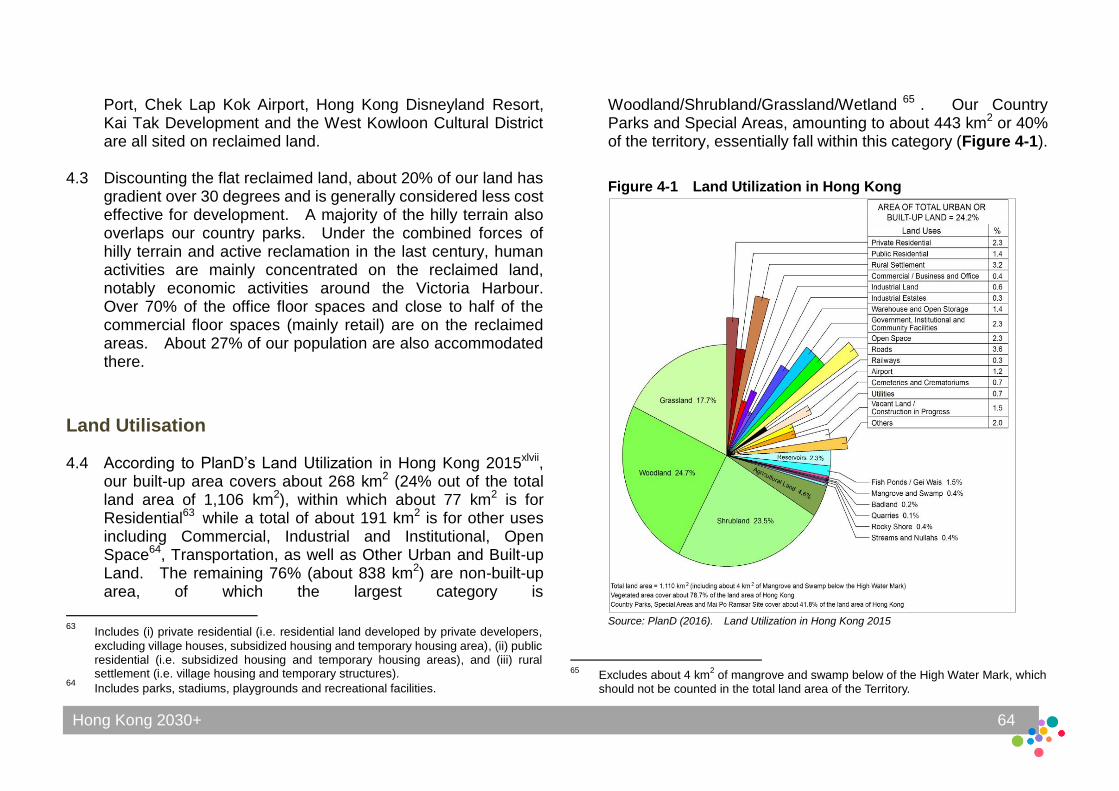
Hong Kong 2030+ 64
Port, Chek Lap Kok Airport, Hong Kong Disneyland Resort, Kai Tak Development and the West Kowloon Cultural District are all sited on reclaimed land.
4.3 Discounting the flat reclaimed land, about 20% of our land has
gradient over 30 degrees and is generally considered less cost effective for development. A majority of the hilly terrain also overlaps our country parks. Under the combined forces of hilly terrain and active reclamation in the last century, human activities are mainly concentrated on the reclaimed land, notably economic activities around the Victoria Harbour. Over 70% of the office floor spaces and close to half of the commercial floor spaces (mainly retail) are on the reclaimed areas. About 27% of our population are also accommodated there.
Land Utilisation
4.4 According to PlanD’s Land Utilization in Hong Kong 2015xlvii, our built-up area covers about 268 km2 (24% out of the total land area of 1,106 km2), within which about 77 km2 is for Residential63 while a total of about 191 km2 is for other uses including Commercial, Industrial and Institutional, Open Space64, Transportation, as well as Other Urban and Built-up Land. The remaining 76% (about 838 km2) are non-built-up area, of which the largest category is
63
Includes (i) private residential (i.e. residential land developed by private developers,
excluding village houses, subsidized housing and temporary housing area), (ii) public residential (i.e. subsidized housing and temporary housing areas), and (iii) rural settlement (i.e. village housing and temporary structures).
64 Includes parks, stadiums, playgrounds and recreational facilities.
Woodland/Shrubland/Grassland/Wetland 65 . Our Country Parks and Special Areas, amounting to about 443 km2 or 40% of the territory, essentially fall within this category (Figure 4-1).
Figure 4-1 Land Utilization in Hong Kong
Source: PlanD (2016). Land Utilization in Hong Kong 2015
65
Excludes about 4 km2 of mangrove and swamp below of the High Water Mark, which
should not be counted in the total land area of the Territory.
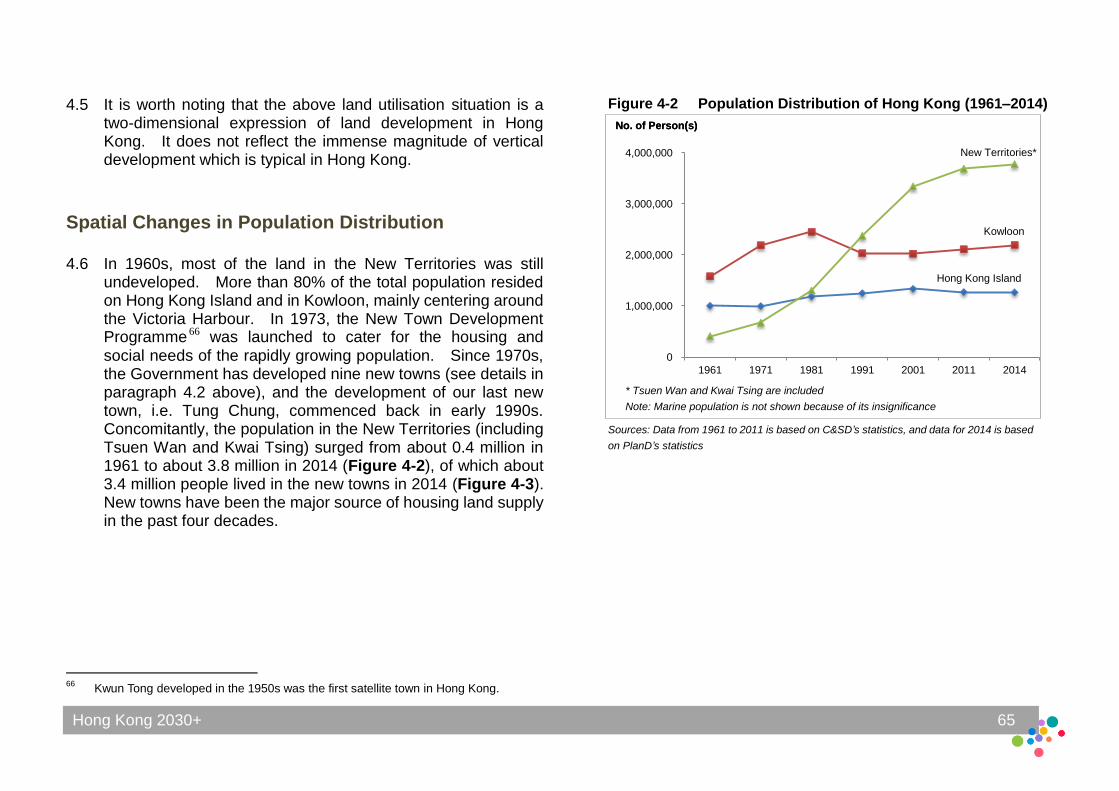
Hong Kong 2030+ 65
New Territories*
0
1,000,000
2,000,000
3,000,000
4,000,000
1961 1971 1981 1991 2001 2011 2014
No. of Person(s) No. of Person(s)
Hong Kong Island
Kowloon
4.5 It is worth noting that the above land utilisation situation is a two-dimensional expression of land development in Hong Kong. It does not reflect the immense magnitude of vertical development which is typical in Hong Kong.
Spatial Changes in Population Distribution 4.6 In 1960s, most of the land in the New Territories was still
undeveloped. More than 80% of the total population resided on Hong Kong Island and in Kowloon, mainly centering around the Victoria Harbour. In 1973, the New Town Development Programme 66 was launched to cater for the housing and social needs of the rapidly growing population. Since 1970s, the Government has developed nine new towns (see details in paragraph 4.2 above), and the development of our last new town, i.e. Tung Chung, commenced back in early 1990s. Concomitantly, the population in the New Territories (including Tsuen Wan and Kwai Tsing) surged from about 0.4 million in 1961 to about 3.8 million in 2014 (Figure 4-2), of which about 3.4 million people lived in the new towns in 2014 (Figure 4-3). New towns have been the major source of housing land supply in the past four decades.
66
Kwun Tong developed in the 1950s was the first satellite town in Hong Kong.
Figure 4-2 Population Distribution of Hong Kong (1961–2014)
Sources: Data from 1961 to 2011 is based on C&SD’s statistics, and data for 2014 is based
on PlanD’s statistics
* Tsuen Wan and Kwai Tsing are included
Note: Marine population is not shown because of its insignificance
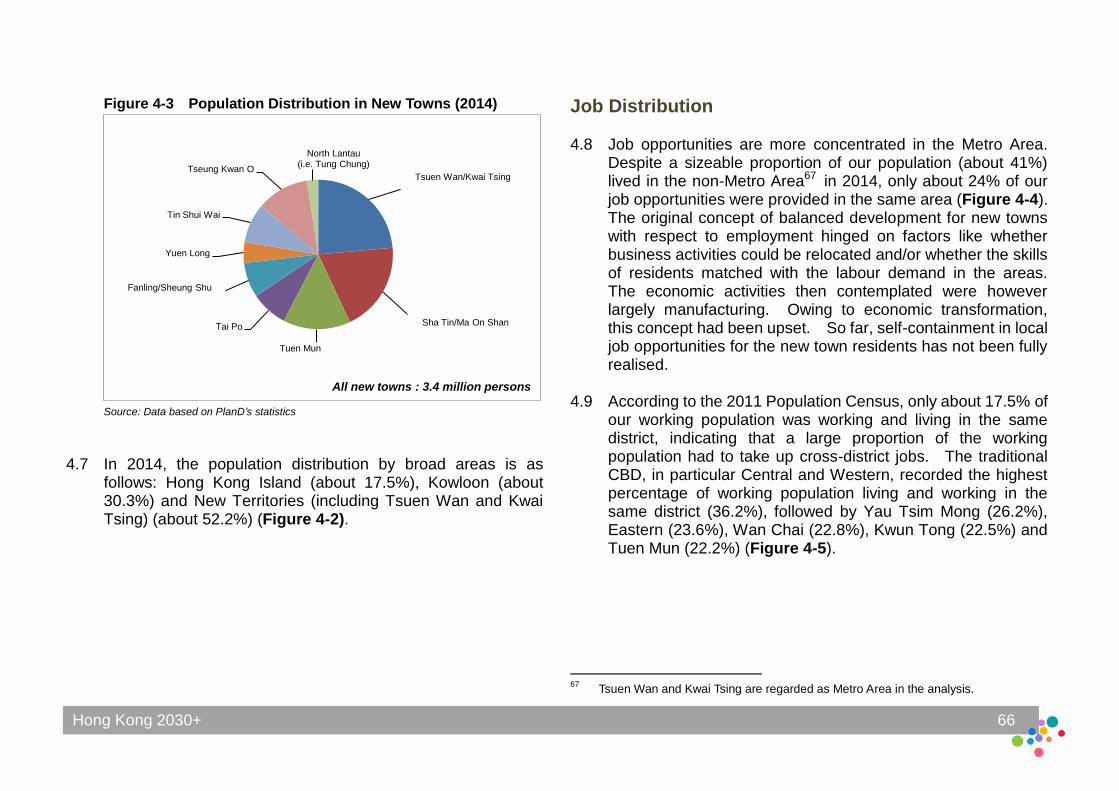
Hong Kong 2030+ 66
Tsuen Wan/Kwai Tsing 24%
Sha Tin/Ma on Shan
Tuen Mun
Tai Po
Fanling/Sheung Shui 8%
Yuen Long
Tin Shui Wai
Tseung Kwan O
North Lantau (i.e. Tung Chung)
Fanling/Sheung Shu
All new towns : 3.4 million persons
Sha Tin/Ma On Shan
Tsuen Wan/Kwai Tsing
Figure 4-3 Population Distribution in New Towns (2014)
Source: Data based on PlanD’s statistics
4.7 In 2014, the population distribution by broad areas is as follows: Hong Kong Island (about 17.5%), Kowloon (about 30.3%) and New Territories (including Tsuen Wan and Kwai Tsing) (about 52.2%) (Figure 4-2).
Job Distribution
4.8 Job opportunities are more concentrated in the Metro Area. Despite a sizeable proportion of our population (about 41%) lived in the non-Metro Area67 in 2014, only about 24% of our job opportunities were provided in the same area (Figure 4-4). The original concept of balanced development for new towns with respect to employment hinged on factors like whether business activities could be relocated and/or whether the skills of residents matched with the labour demand in the areas. The economic activities then contemplated were however largely manufacturing. Owing to economic transformation, this concept had been upset. So far, self-containment in local job opportunities for the new town residents has not been fully realised.
4.9 According to the 2011 Population Census, only about 17.5% of our working population was working and living in the same district, indicating that a large proportion of the working population had to take up cross-district jobs. The traditional CBD, in particular Central and Western, recorded the highest percentage of working population living and working in the same district (36.2%), followed by Yau Tsim Mong (26.2%), Eastern (23.6%), Wan Chai (22.8%), Kwun Tong (22.5%) and Tuen Mun (22.2%) (Figure 4-5).
67
Tsuen Wan and Kwai Tsing are regarded as Metro Area in the analysis.
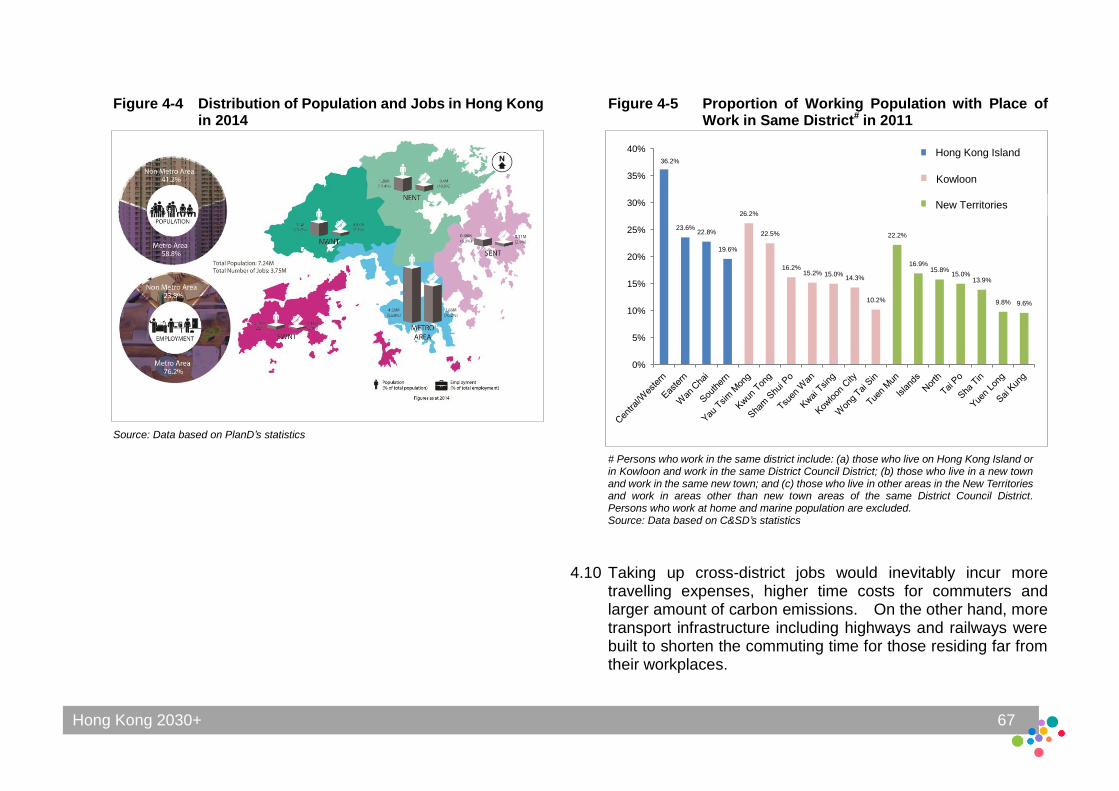
Hong Kong 2030+ 67
36.2%
23.6% 22.8%
19.6%
26.2%
22.5%
16.2% 15.2% 15.0%
14.3%
10.2%
22.2%
16.9% 15.8%
15.0% 13.9%
9.8% 9.6%
0%
5%
10%
15%
20%
25%
30%
35%
40% Central/Western
Yau Tsim Mong
Tuen Mun
Hong Kong Island
Kowloon
New Territories
Figure 4-4 Distribution of Population and Jobs in Hong Kong in 2014
Source: Data based on PlanD’s statistics
Figure 4-5 Proportion of Working Population with Place of Work in Same District# in 2011
# Persons who work in the same district include: (a) those who live on Hong Kong Island or in Kowloon and work in the same District Council District; (b) those who live in a new town and work in the same new town; and (c) those who live in other areas in the New Territories and work in areas other than new town areas of the same District Council District. Persons who work at home and marine population are excluded. Source: Data based on C&SD’s statistics
4.10 Taking up cross-district jobs would inevitably incur more travelling expenses, higher time costs for commuters and larger amount of carbon emissions. On the other hand, more transport infrastructure including highways and railways were built to shorten the commuting time for those residing far from their workplaces.
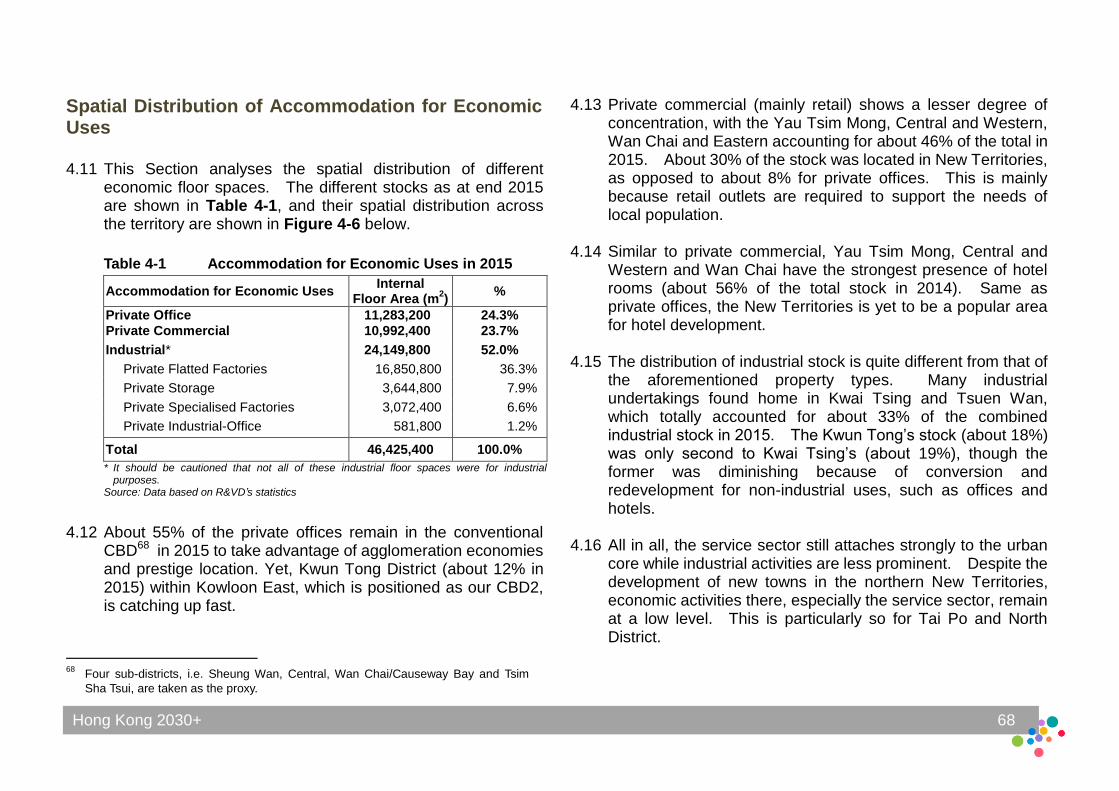
Hong Kong 2030+ 68
Spatial Distribution of Accommodation for Economic Uses 4.11 This Section analyses the spatial distribution of different
economic floor spaces. The different stocks as at end 2015 are shown in Table 4-1, and their spatial distribution across the territory are shown in Figure 4-6 below.
Table 4-1 Accommodation for Economic Uses in 2015
Accommodation for Economic Uses Internal
Floor Area (m2)
%
Private Office 11,283,200 24.3%
Private Commercial 10,992,400 23.7%
Industrial* 24,149,800 52.0%
Private Flatted Factories 16,850,800 36.3%
Private Storage 3,644,800 7.9%
Private Specialised Factories 3,072,400 6.6%
Private Industrial-Office 581,800 1.2%
Total 46,425,400 100.0%
* It should be cautioned that not all of these industrial floor spaces were for industrial purposes.
Source: Data based on R&VD’s statistics
4.12 About 55% of the private offices remain in the conventional CBD68 in 2015 to take advantage of agglomeration economies and prestige location. Yet, Kwun Tong District (about 12% in 2015) within Kowloon East, which is positioned as our CBD2, is catching up fast.
68
Four sub-districts, i.e. Sheung Wan, Central, Wan Chai/Causeway Bay and Tsim
Sha Tsui, are taken as the proxy.
4.13 Private commercial (mainly retail) shows a lesser degree of concentration, with the Yau Tsim Mong, Central and Western, Wan Chai and Eastern accounting for about 46% of the total in 2015. About 30% of the stock was located in New Territories, as opposed to about 8% for private offices. This is mainly because retail outlets are required to support the needs of local population.
4.14 Similar to private commercial, Yau Tsim Mong, Central and Western and Wan Chai have the strongest presence of hotel rooms (about 56% of the total stock in 2014). Same as private offices, the New Territories is yet to be a popular area for hotel development.
4.15 The distribution of industrial stock is quite different from that of the aforementioned property types. Many industrial undertakings found home in Kwai Tsing and Tsuen Wan, which totally accounted for about 33% of the combined industrial stock in 2015. The Kwun Tong’s stock (about 18%) was only second to Kwai Tsing’s (about 19%), though the former was diminishing because of conversion and redevelopment for non-industrial uses, such as offices and hotels.
4.16 All in all, the service sector still attaches strongly to the urban core while industrial activities are less prominent. Despite the development of new towns in the northern New Territories, economic activities there, especially the service sector, remain at a low level. This is particularly so for Tai Po and North District.
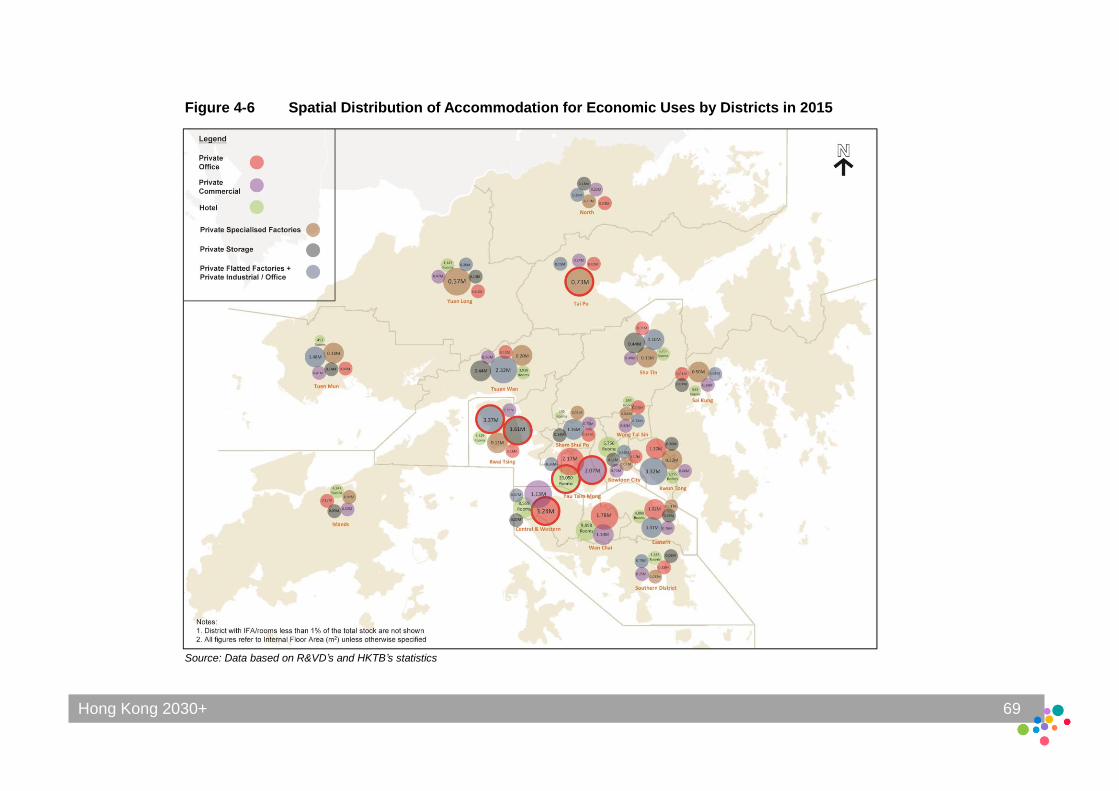
Hong Kong 2030+ 69
Figure 4-6 Spatial Distribution of Accommodation for Economic Uses by Districts in 2015
Source: Data based on R&VD’s and HKTB’s statistics
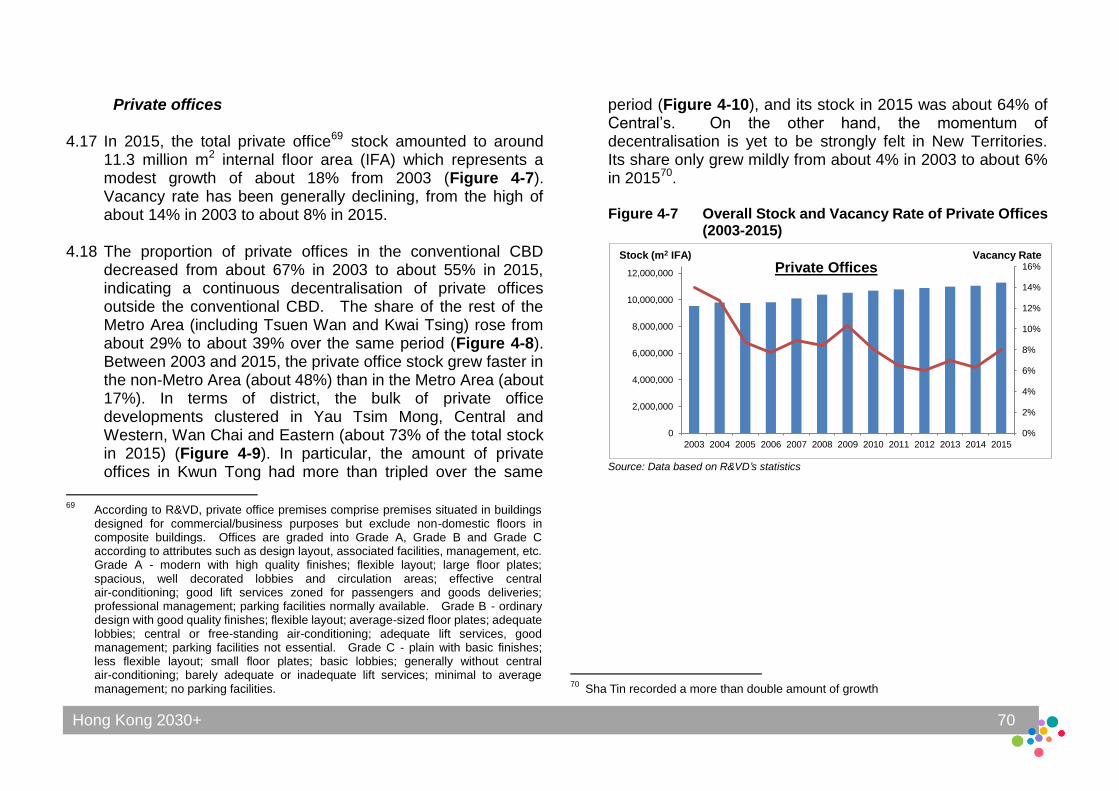
Hong Kong 2030+ 70
0%
2%
4%
6%
8%
10%
12%
14%
16%
0
2,000,000
4,000,000
6,000,000
8,000,000
10,000,000
12,000,000
2003 2004 2005 2006 2007 2008 2009 2010 2011 2012 2013 2014 2015
Stock (m2 IFA) Vacancy Rate
Private offices
4.17 In 2015, the total private office69 stock amounted to around 11.3 million m2 internal floor area (IFA) which represents a modest growth of about 18% from 2003 (Figure 4-7). Vacancy rate has been generally declining, from the high of about 14% in 2003 to about 8% in 2015.
4.18 The proportion of private offices in the conventional CBD decreased from about 67% in 2003 to about 55% in 2015, indicating a continuous decentralisation of private offices outside the conventional CBD. The share of the rest of the Metro Area (including Tsuen Wan and Kwai Tsing) rose from about 29% to about 39% over the same period (Figure 4-8). Between 2003 and 2015, the private office stock grew faster in the non-Metro Area (about 48%) than in the Metro Area (about 17%). In terms of district, the bulk of private office developments clustered in Yau Tsim Mong, Central and Western, Wan Chai and Eastern (about 73% of the total stock in 2015) (Figure 4-9). In particular, the amount of private offices in Kwun Tong had more than tripled over the same
69
According to R&VD, private office premises comprise premises situated in buildings designed for commercial/business purposes but exclude non-domestic floors in composite buildings. Offices are graded into Grade A, Grade B and Grade C according to attributes such as design layout, associated facilities, management, etc. Grade A - modern with high quality finishes; flexible layout; large floor plates; spacious, well decorated lobbies and circulation areas; effective central air-conditioning; good lift services zoned for passengers and goods deliveries; professional management; parking facilities normally available. Grade B - ordinary design with good quality finishes; flexible layout; average-sized floor plates; adequate lobbies; central or free-standing air-conditioning; adequate lift services, good management; parking facilities not essential. Grade C - plain with basic finishes; less flexible layout; small floor plates; basic lobbies; generally without central air-conditioning; barely adequate or inadequate lift services; minimal to average management; no parking facilities.
period (Figure 4-10), and its stock in 2015 was about 64% of Central’s. On the other hand, the momentum of decentralisation is yet to be strongly felt in New Territories. Its share only grew mildly from about 4% in 2003 to about 6% in 201570. Figure 4-7 Overall Stock and Vacancy Rate of Private Offices
(2003-2015)
Source: Data based on R&VD’s statistics
70
Sha Tin recorded a more than double amount of growth
Private Offices
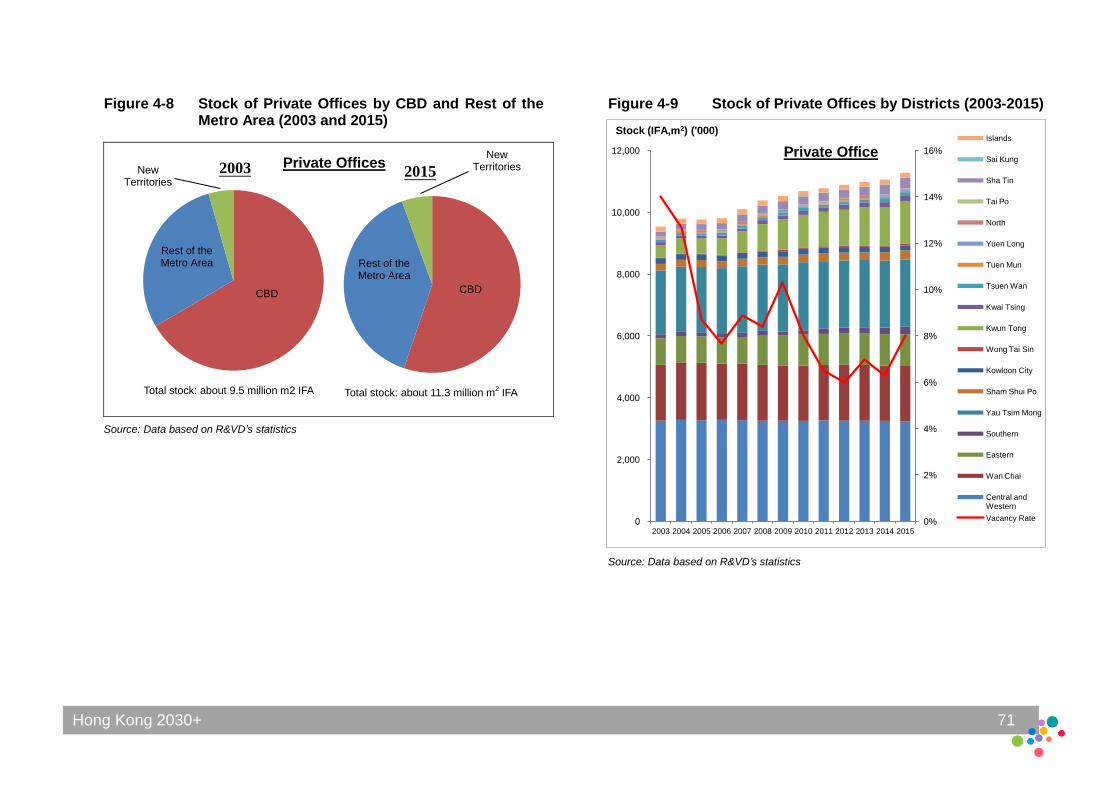
Hong Kong 2030+ 71
0%
2%
4%
6%
8%
10%
12%
14%
16%
0
2,000
4,000
6,000
8,000
10,000
12,000
2003 2004 2005 2006 2007 2008 2009 2010 2011 2012 2013 2014 2015
Islands
Sai Kung
Sha Tin
Tai Po
North
Yuen Long
Tuen Mun
Tsuen Wan
Kwai Tsing
Kwun Tong
Wong Tai Sin
Kowloon City
Sham Shui Po
Yau Tsim Mong
Southern
Eastern
Wan Chai
Central and Western
Vacancy Rate
Stock (IFA,m2) ('000)
Figure 4-8 Stock of Private Offices by CBD and Rest of the Metro Area (2003 and 2015)
Source: Data based on R&VD’s statistics
Figure 4-9 Stock of Private Offices by Districts (2003-2015)
Source: Data based on R&VD’s statistics
2003
CBD
Rest of the Metro Area
New Territories
2015
CBD
Rest of the Metro Area
New Territories
Private Offices
Total stock: about 9.5 million m2 IFA Total stock: about 11.3 million m2 IFA
Private Office
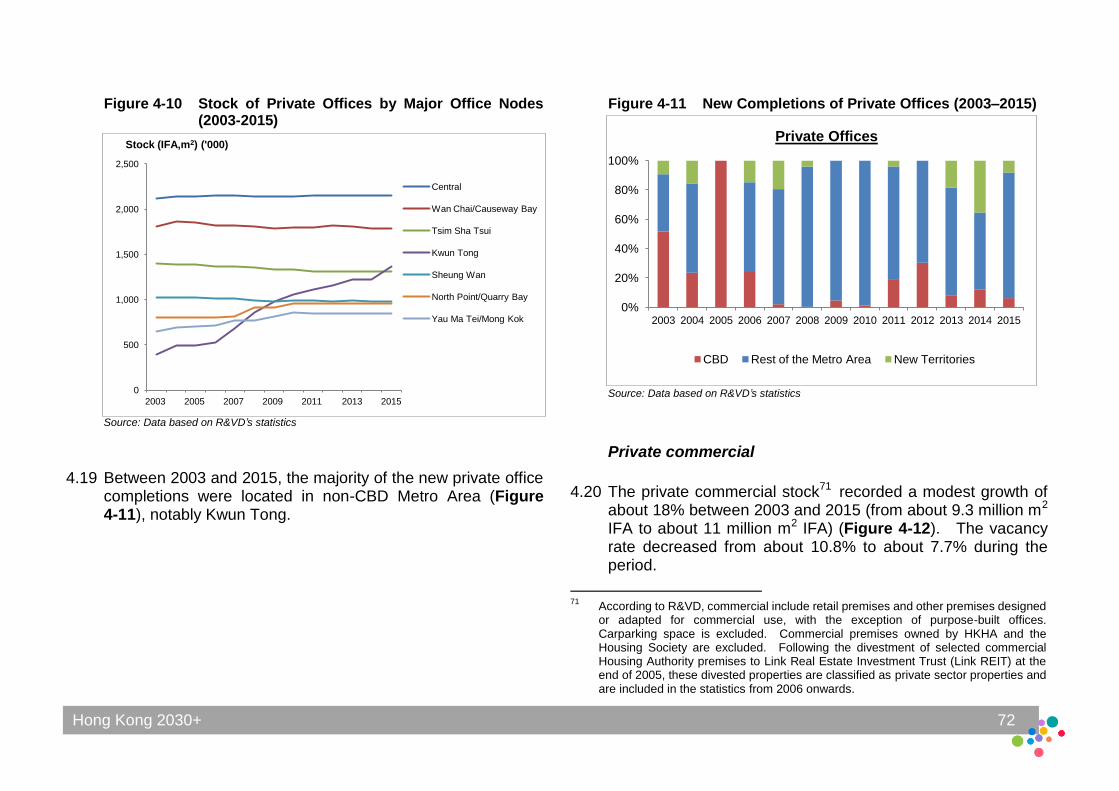
Hong Kong 2030+ 72
0
500
1,000
1,500
2,000
2,500
2003 2005 2007 2009 2011 2013 2015
Central
Wan Chai/Causeway Bay
Tsim Sha Tsui
Kwun Tong
Sheung Wan
North Point/Quarry Bay
Yau Ma Tei/Mong Kok
Stock (IFA,m2) ('000)
0%
20%
40%
60%
80%
100%
2003 2004 2005 2006 2007 2008 2009 2010 2011 2012 2013 2014 2015
CBD Rest of the Metro Area New Territories
Figure 4-10 Stock of Private Offices by Major Office Nodes (2003-2015)
Source: Data based on R&VD’s statistics
4.19 Between 2003 and 2015, the majority of the new private office completions were located in non-CBD Metro Area (Figure 4-11), notably Kwun Tong.
Figure 4-11 New Completions of Private Offices (2003–2015)
Source: Data based on R&VD’s statistics
Private commercial
4.20 The private commercial stock71 recorded a modest growth of
about 18% between 2003 and 2015 (from about 9.3 million m2 IFA to about 11 million m2 IFA) (Figure 4-12). The vacancy rate decreased from about 10.8% to about 7.7% during the period.
71
According to R&VD, commercial include retail premises and other premises designed or adapted for commercial use, with the exception of purpose-built offices. Carparking space is excluded. Commercial premises owned by HKHA and the Housing Society are excluded. Following the divestment of selected commercial Housing Authority premises to Link Real Estate Investment Trust (Link REIT) at the end of 2005, these divested properties are classified as private sector properties and are included in the statistics from 2006 onwards.
Private Offices
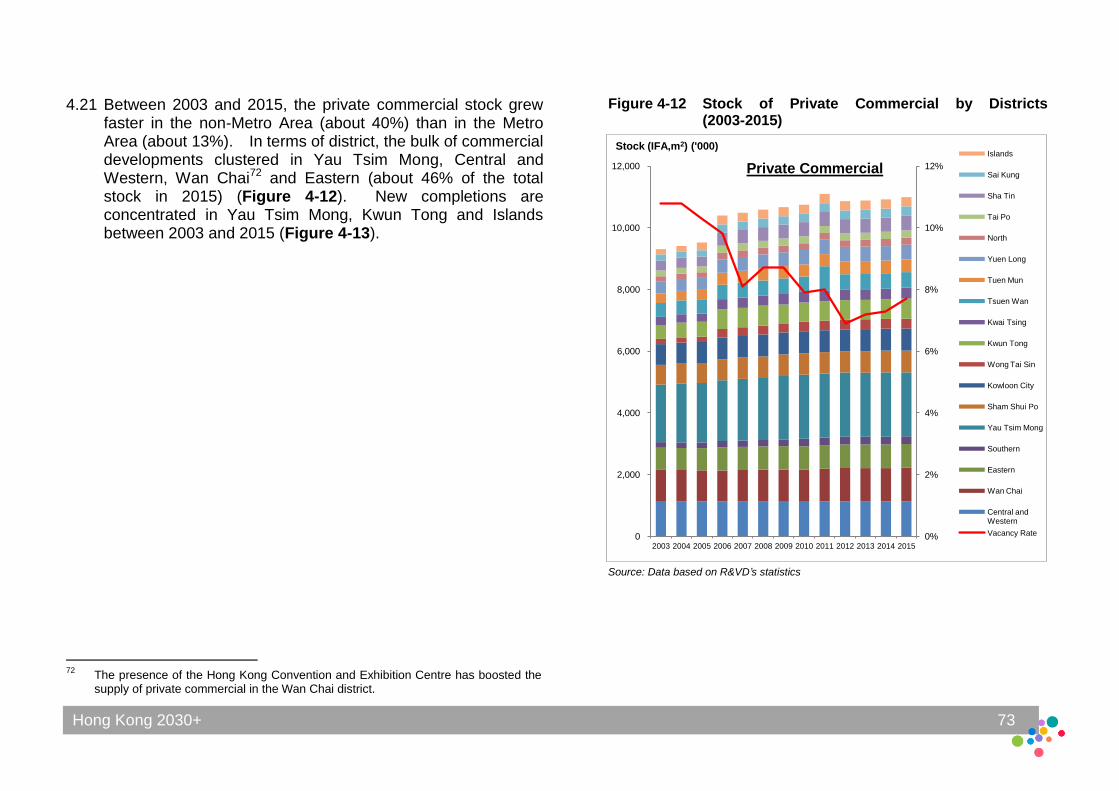
Hong Kong 2030+ 73
0%
2%
4%
6%
8%
10%
12%
0
2,000
4,000
6,000
8,000
10,000
12,000
2003 2004 2005 2006 2007 2008 2009 2010 2011 2012 2013 2014 2015
Islands
Sai Kung
Sha Tin
Tai Po
North
Yuen Long
Tuen Mun
Tsuen Wan
Kwai Tsing
Kwun Tong
Wong Tai Sin
Kowloon City
Sham Shui Po
Yau Tsim Mong
Southern
Eastern
Wan Chai
Central and Western
Vacancy Rate
Stock (IFA,m2) ('000)
4.21 Between 2003 and 2015, the private commercial stock grew faster in the non-Metro Area (about 40%) than in the Metro Area (about 13%). In terms of district, the bulk of commercial developments clustered in Yau Tsim Mong, Central and Western, Wan Chai72 and Eastern (about 46% of the total stock in 2015) (Figure 4-12). New completions are concentrated in Yau Tsim Mong, Kwun Tong and Islands between 2003 and 2015 (Figure 4-13).
72
The presence of the Hong Kong Convention and Exhibition Centre has boosted the supply of private commercial in the Wan Chai district.
Figure 4-12 Stock of Private Commercial by Districts (2003-2015)
Source: Data based on R&VD’s statistics
Private Commercial
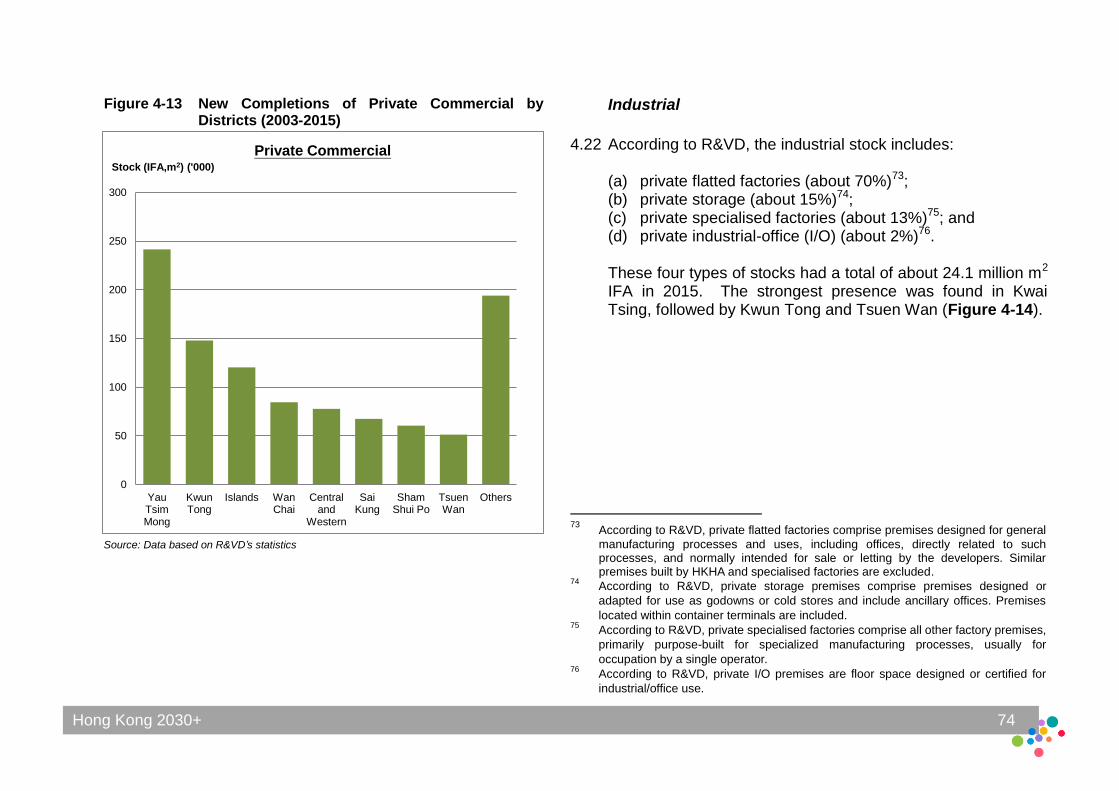
Hong Kong 2030+ 74
0
50
100
150
200
250
300
Yau Tsim Mong
Kwun Tong
Islands Wan Chai
Central and
Western
Sai Kung
Sham Shui Po
Tsuen Wan
Others
Private Commercial Stock (IFA,m2) ('000)
Figure 4-13 New Completions of Private Commercial by Districts (2003-2015)
Source: Data based on R&VD’s statistics
Industrial
4.22 According to R&VD, the industrial stock includes:
(a) private flatted factories (about 70%)73; (b) private storage (about 15%)74; (c) private specialised factories (about 13%)75; and (d) private industrial-office (I/O) (about 2%)76. These four types of stocks had a total of about 24.1 million m2 IFA in 2015. The strongest presence was found in Kwai Tsing, followed by Kwun Tong and Tsuen Wan (Figure 4-14).
73
According to R&VD, private flatted factories comprise premises designed for general
manufacturing processes and uses, including offices, directly related to such processes, and normally intended for sale or letting by the developers. Similar premises built by HKHA and specialised factories are excluded.
74 According to R&VD, private storage premises comprise premises designed or
adapted for use as godowns or cold stores and include ancillary offices. Premises
located within container terminals are included. 75
According to R&VD, private specialised factories comprise all other factory premises,
primarily purpose-built for specialized manufacturing processes, usually for
occupation by a single operator. 76
According to R&VD, private I/O premises are floor space designed or certified for
industrial/office use.
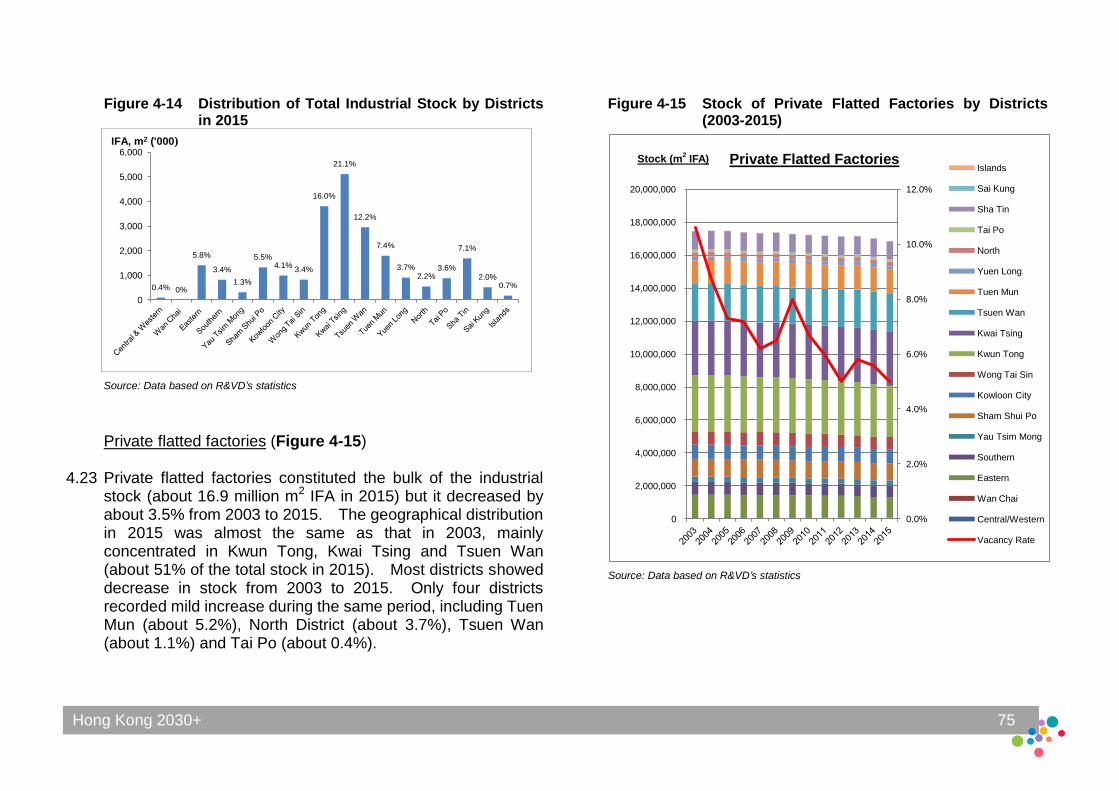
Hong Kong 2030+ 75
0.4% 0%
5.8%
3.4%
1.3%
5.5% 4.1%
3.4%
16.0%
21.1%
12.2%
7.4%
3.7% 2.2%
3.6%
7.1%
2.0% 0.7%
0
1,000
2,000
3,000
4,000
5,000
6,000 IFA, m2 ('000)
0.0%
2.0%
4.0%
6.0%
8.0%
10.0%
12.0%
0
2,000,000
4,000,000
6,000,000
8,000,000
10,000,000
12,000,000
14,000,000
16,000,000
18,000,000
20,000,000
Islands
Sai Kung
Sha Tin
Tai Po
North
Yuen Long
Tuen Mun
Tsuen Wan
Kwai Tsing
Kwun Tong
Wong Tai Sin
Kowloon City
Sham Shui Po
Yau Tsim Mong
Southern
Eastern
Wan Chai
Central/Western
Vacancy Rate
Figure 4-14 Distribution of Total Industrial Stock by Districts in 2015
Source: Data based on R&VD’s statistics
Private flatted factories (Figure 4-15)
4.23 Private flatted factories constituted the bulk of the industrial stock (about 16.9 million m2 IFA in 2015) but it decreased by about 3.5% from 2003 to 2015. The geographical distribution in 2015 was almost the same as that in 2003, mainly concentrated in Kwun Tong, Kwai Tsing and Tsuen Wan (about 51% of the total stock in 2015). Most districts showed decrease in stock from 2003 to 2015. Only four districts recorded mild increase during the same period, including Tuen Mun (about 5.2%), North District (about 3.7%), Tsuen Wan (about 1.1%) and Tai Po (about 0.4%).
Figure 4-15 Stock of Private Flatted Factories by Districts (2003-2015)
Source: Data based on R&VD’s statistics
Stock (m2 IFA) Private Flatted Factories
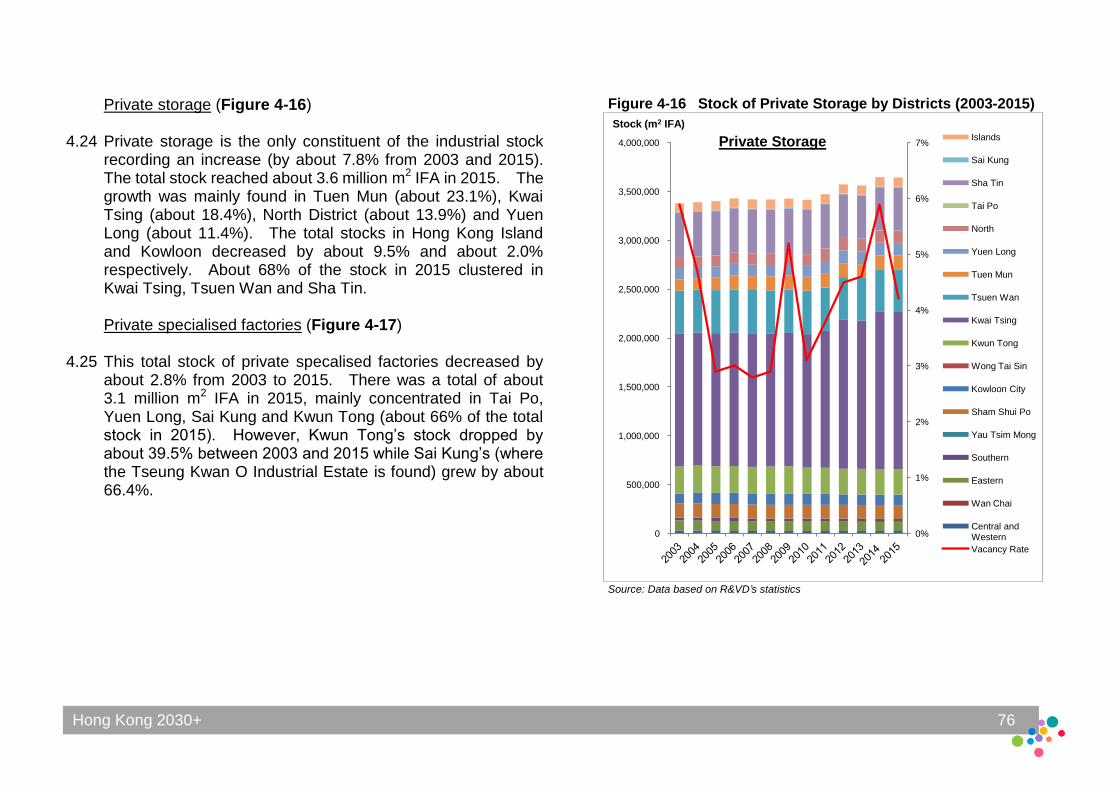
Hong Kong 2030+ 76
0%
1%
2%
3%
4%
5%
6%
7%
0
500,000
1,000,000
1,500,000
2,000,000
2,500,000
3,000,000
3,500,000
4,000,000 Islands
Sai Kung
Sha Tin
Tai Po
North
Yuen Long
Tuen Mun
Tsuen Wan
Kwai Tsing
Kwun Tong
Wong Tai Sin
Kowloon City
Sham Shui Po
Yau Tsim Mong
Southern
Eastern
Wan Chai
Central and Western
Vacancy Rate
Stock (m2 IFA)
Private storage (Figure 4-16)
4.24 Private storage is the only constituent of the industrial stock recording an increase (by about 7.8% from 2003 and 2015). The total stock reached about 3.6 million m2 IFA in 2015. The growth was mainly found in Tuen Mun (about 23.1%), Kwai Tsing (about 18.4%), North District (about 13.9%) and Yuen Long (about 11.4%). The total stocks in Hong Kong Island and Kowloon decreased by about 9.5% and about 2.0% respectively. About 68% of the stock in 2015 clustered in Kwai Tsing, Tsuen Wan and Sha Tin. Private specialised factories (Figure 4-17)
4.25 This total stock of private specalised factories decreased by about 2.8% from 2003 to 2015. There was a total of about 3.1 million m2 IFA in 2015, mainly concentrated in Tai Po, Yuen Long, Sai Kung and Kwun Tong (about 66% of the total stock in 2015). However, Kwun Tong’s stock dropped by about 39.5% between 2003 and 2015 while Sai Kung’s (where the Tseung Kwan O Industrial Estate is found) grew by about 66.4%.
Figure 4-16 Stock of Private Storage by Districts (2003-2015)
Source: Data based on R&VD’s statistics
Private Storage
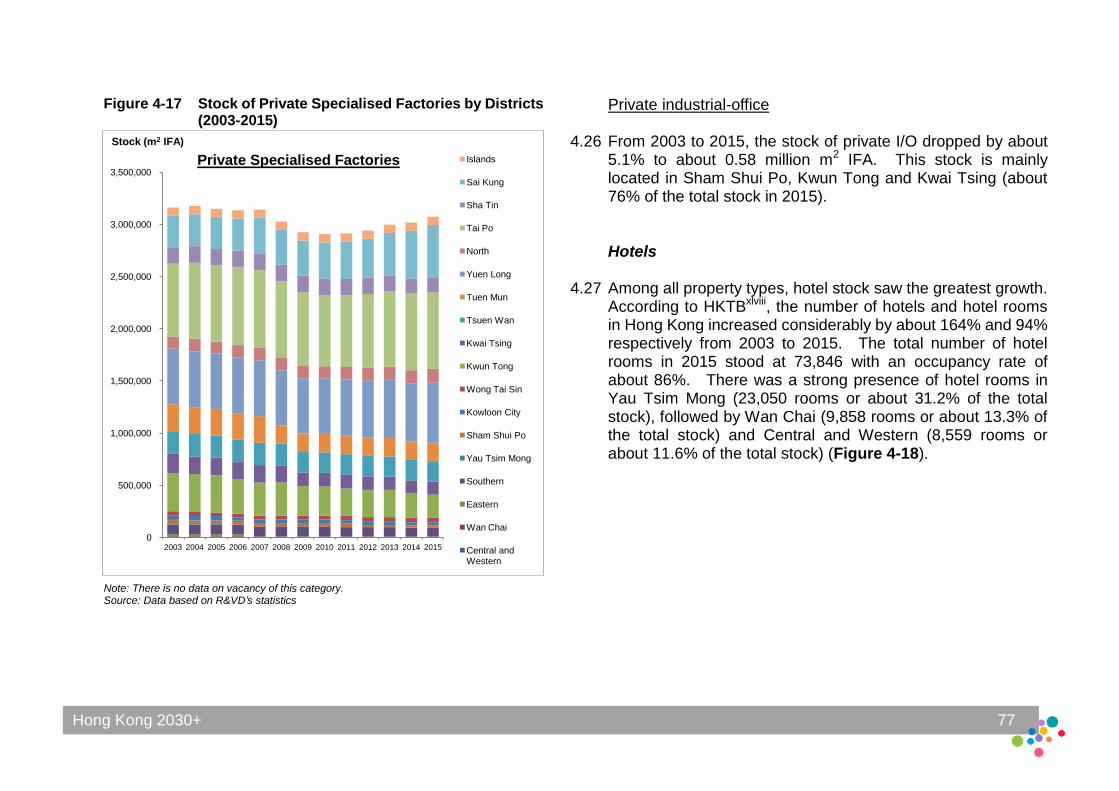
Hong Kong 2030+ 77
0
500,000
1,000,000
1,500,000
2,000,000
2,500,000
3,000,000
3,500,000
2003 2004 2005 2006 2007 2008 2009 2010 2011 2012 2013 2014 2015
Islands
Sai Kung
Sha Tin
Tai Po
North
Yuen Long
Tuen Mun
Tsuen Wan
Kwai Tsing
Kwun Tong
Wong Tai Sin
Kowloon City
Sham Shui Po
Yau Tsim Mong
Southern
Eastern
Wan Chai
Central and Western
Stock (m2 IFA)
Figure 4-17 Stock of Private Specialised Factories by Districts (2003-2015)
Note: There is no data on vacancy of this category. Source: Data based on R&VD’s statistics
Private industrial-office
4.26 From 2003 to 2015, the stock of private I/O dropped by about 5.1% to about 0.58 million m2 IFA. This stock is mainly located in Sham Shui Po, Kwun Tong and Kwai Tsing (about 76% of the total stock in 2015). Hotels
4.27 Among all property types, hotel stock saw the greatest growth. According to HKTBxlviii, the number of hotels and hotel rooms in Hong Kong increased considerably by about 164% and 94% respectively from 2003 to 2015. The total number of hotel rooms in 2015 stood at 73,846 with an occupancy rate of about 86%. There was a strong presence of hotel rooms in Yau Tsim Mong (23,050 rooms or about 31.2% of the total stock), followed by Wan Chai (9,858 rooms or about 13.3% of the total stock) and Central and Western (8,559 rooms or about 11.6% of the total stock) (Figure 4-18).
Private Specialised Factories
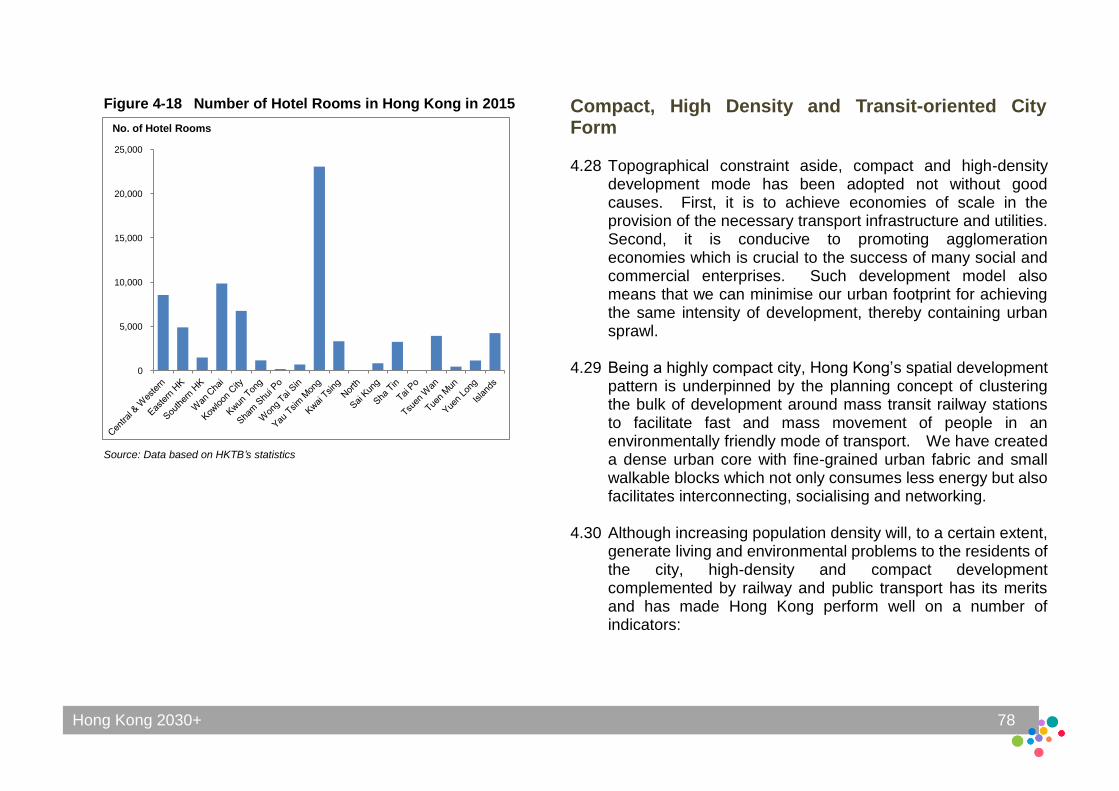
Hong Kong 2030+ 78
0
5,000
10,000
15,000
20,000
25,000
No. of Hotel Rooms
Figure 4-18 Number of Hotel Rooms in Hong Kong in 2015
Source: Data based on HKTB’s statistics
Compact, High Density and Transit-oriented City Form 4.28 Topographical constraint aside, compact and high-density
development mode has been adopted not without good causes. First, it is to achieve economies of scale in the provision of the necessary transport infrastructure and utilities. Second, it is conducive to promoting agglomeration economies which is crucial to the success of many social and commercial enterprises. Such development model also means that we can minimise our urban footprint for achieving the same intensity of development, thereby containing urban sprawl.
4.29 Being a highly compact city, Hong Kong’s spatial development pattern is underpinned by the planning concept of clustering the bulk of development around mass transit railway stations to facilitate fast and mass movement of people in an environmentally friendly mode of transport. We have created a dense urban core with fine-grained urban fabric and small walkable blocks which not only consumes less energy but also facilitates interconnecting, socialising and networking.
4.30 Although increasing population density will, to a certain extent, generate living and environmental problems to the residents of the city, high-density and compact development complemented by railway and public transport has its merits and has made Hong Kong perform well on a number of indicators:
Hong Kong 2030+ 79
(a) a sizeable proportion of living quarters and commercial/office floor space are within the 500m-walkable catchment of railway stations;
(b) about 90% of average daily passenger trips are taken by public transport;
(c) only about 4% of the total land area is used for roads and railways;
(d) a majority of the population live within 400m of district parks/public open space;
(e) a majority of the population live within 3km of country parks; and
(f) about 123m2 green spaces per capita77.
4.31 Hong Kong has evolved into a compact high-density city,
partly by necessity due to limited developable land and partly by integrated land use-transport-environment planning. We have accumulated several decades of experience in planning and designing for a liveable, compact high-density city, which we will continue to build upon into the future. The relevant strategic planning directions include (1) managing density; (2) promoting compatible land use mix; (3) fostering efficient use of urban spaces; (4) adopting responsive three-dimensional urban design concepts; and (5) underscoring compact development.
77
The figure is calculated based on PlanD’s “Land Utilization in Hong Kong 2015".
The green spaces include "Open Space" (comprising parks, stadiums,
playgrounds and recreational facilities), "Woodland/Shrubland/Grassland/
Wetland" and "Water Bodies". The figure is comparable to the green spaces per
capita of 105.3 m2/person for Hong Kong in the Asian Green City Index compiled
by the Economic Intelligence Unit for year 2009.
4.32 More discussions on compact high-density city can be found in another topical paper, namely “Planning and Urban Design
for a Liveable High-density City”.
Key Issues Pertinent to Strategic Spatial Planning
Responding to new development opportunities
4.33 Development in Hong Kong has decentralised from areas around the Victoria Harbour to the New Territories. We see further development opportunities in the New Territories, particularly the western side, in light of enhanced connectivity.
4.34 Hong Kong is an externally oriented economy with intensifying economic interaction with the Mainland, especially the Pearl River Delta (PRD). The Hong Kong-Zhuhai-Macao Bridge, Tuen Mun-Chek Lap Kok Link and Guangzhou-Shenzhen-Hong Kong Express Rail Link under construction will greatly enhance the connectivity of Hong Kong West internally and also externally with PRD. Coupled with the presence of the airport and a number of major development projects under planning in the west including the Tung Chung New Town Extension, Hung Shui Kiu New Development Area and various development initiatives in North Lantau, Hong Kong West will be the growth pole for both housing and strategic economic infrastructure in the future. We shall plan to achieve greater synergy among developments on this side and to capitalise on the rapid development in PRD.
Hong Kong 2030+ 80
4.35 For the eastern part, there is opportunity to build on and expand, where possible, the existing industrial estates, science park and tertiary institutes to reinforce our knowledge and technology clusters for greater synergy.
4.36 The boundary areas in the north command a strategic location with boundary control points and the flat land there offers development opportunities. Particularly, if more employment opportunities could be created in the northern territories, this would bring more jobs close to the population in the New Territories. However, the areas are lack of transport and other supporting infrastructure. The development potential and optimal use of these areas warrant holistic consideration. Balancing development and conservation
4.37 Our efficient land utilisation is also conducive to conservation. For example, the scenic countryside with natural coastlines in the east and the south, endowed with precious natural assets, are well preserved. To promote a spatial pattern balancing development and conservation, we shall continue to preserve areas of conservation importance. We shall explore opportunities to conserve our natural assets for maintaining essential ecosystem services78.
78
Ecosystem services are the direct and indirect contributions of ecosystems to human
well-being. With reference to Millennium Ecosystem Assessment (2005) Ecosystems
and Human Well-being: Synthesis, ecosystem services could be grouped into 4
categories, including provisioning services (e.g. food supply, water supply), regulating
services (e.g. climate regulation, flood regulation, disease regulation), cultural services
(e.g. spiritual fulfillment, recreation, education) and supporting services (e.g. soil
formation, nutrient recycling).
Unbalanced spatial distribution of population and employment
4.38 Shortage of developable land aside, we are facing the problem of unbalanced spatial development. While population continues to increase in the New Territories, employment is still overwhelmingly concentrated in the Metro Area to take advantage of agglomeration economy. Such unbalanced distribution has resulted in congestion of key commuting corridors, more and longer home to work journeys, hence more carbon emission, less family/leisure time, lower productivity, etc. The problem will be aggravated with the gradual completion of the New Development Areas under advance planning and other land supply initiatives unless we could successfully draw in substantial economic activities to the New Territories. A more balanced approach in terms of spatial distribution of population and employment places should be adopted to help reduce the number and distance of commuting trips.
4.39 Addressing this imbalance will be one of the key tasks in Hong Kong 2030+. We should create strategic economic nodes outside the Metro Area to bring about high-impact solutions. On the other hand, due consideration should be given to retaining and pulling more economic activities to those existing developed areas with limited economic activities. Connecting the population and employment centres by new strategic transport link(s) is another possible option to tackle the imbalance.
Hong Kong 2030+ 81
Planning for compact and rail based development
4.40 Promoting compact and rail-based development, complemented by road-based public transport, will continue to be our fundamental planning principle. Yet, strategic transport links have to be planned wisely, considering the substantial financial investment to be incurred, as well as the possible environmental impacts. Optimisation of population and employment distribution can help proactively and beneficially manage the scope and nature of travel demand and minimise the need for new strategic transport links.
4.41 On the other hand, there will be new development potential arising from the committed railway and road projects. These should be suitably capitalised upon through a good spatial development strategy. Planning for a more liveable high-density city
4.42 Many cities are re-engineering their urban fabric for a more compact form in the hope of reducing energy consumption. Hong Kong has always been cited as a showcase in this regard. The diversity, vibrancy and versatility of the dense urban core are integral to the success of Hong Kong. Admittedly, there are also problems with a compact and dense development pattern such as “walled effect” of buildings, urban heat island effect, hot and humid micro-climates, and air, noise and light pollutions. We shall explore to what extent the territorial spatial development strategy could tackle these issues, especially in improving the liveability of the dense urban core.
ENDNOTES xlvi Lands Department (July 2016). Reclamation Area (Since 1887).
Retrieved from http://www.landsd.gov.hk/mapping/en/publications/reclamation.htm
xlvii PlanD (September 2016). Land Utilization in Hong Kong 2015. Retrieved from http://www.pland.gov.hk/pland_en/info_serv/statistic/landu.html
xlviii HKTB (various years). Hotel Room Occupancy Report.
Hong Kong 2030+ 82
5.1 We should robustly plan for our housing, economic and other
social needs of the new population as well as the uncertainties hovering population dynamics in the longer term. We should also plan for sustaining our economic growth in the changing global and regional contexts. Developable land is necessary for growth but it is becoming limited. There is no single measure that could provide sufficient land to meet all the development needs. While the multi-pronged approach to increase land supply would need to continue vigorously, it is prudent to prioritise land supply sources according to the principles of sustainability.
5.2 To strengthen Hong Kong’s position as a top-notch competitive,
liveable and sustainable city in Asia, a holistic and integrated approach would be adopted under Hong Kong 2030+ to identify new solution space and create capacity for future growth that could help to achieve sustainable development that meet our present and future social, environmental and economic needs and aspirations.
5 Conclusion
Recommended